Drying out: Investigating the economic effects of drought in New Zealand
|
|
|
- Aubrey Edwards
- 6 years ago
- Views:
Transcription


1 Drying out: Investigating the economic effects of drought in New Zealand AN2013/02 Gunes Kamber, Chris McDonald and Gael Price June 2013 Reserve Bank of New Zealand Analytical Note series ISSN Reserve Bank of New Zealand PO Box 2498 Wellington NEW ZEALAND The Analytical Note series encompasses a range of types of background papers prepared by Reserve Bank staff. Unless otherwise stated, views expressed are those of the authors, and do not necessarily represent the views of the Reserve Bank.
2 Reserve Bank of New Zealand Analytical Note Series NON-TECHNICAL SUMMARY In early 2013 New Zealand suffered its worst drought in decades. A drought zone was declared over the entire North Island and parts of the South Island. Measures of soil moisture deficit were at their highest levels since the 1970s. We estimate the impact of this drought using a macroeconomic model, based on past relationships. We use the model to outline the transmission channels through which the drought is likely to affect the economy. Our analysis starts by constructing three new climate indicators, based on soil moisture and rainfall data from 363 weather stations. We use data from summer only, as this is when the most damaging droughts occur. The resultant indicators are separately included in a fairly standard model. As with all models, if there are any idiosyncratic factors this year that were not present in earlier drought years, the model cannot capture these. Thus, estimates of this sort provide a robust starting point for assessing the actual economic impact of this year s drought. This starting point can be supplemented with specific information about this particular episode to gain a more complete picture. Given the experience with past droughts, our baseline model suggests that this year s drought could lower annual real GDP by 0.3 percent. However, when we allow for this drought being worse in the North Island (where the impact on GDP is larger, possibly due to the importance of rain-fed dairy in the North Island), we find that annual real GDP could fall by around 0.6 percent. This is within the range of other analysts estimates (from 0.2 to 0.7 percent). 1 Agriculture and primary manufacturing are the sectors that are most affected by the drought. While production falls initially, the economic impact of the drought would be worse if not for a rise in global dairy prices. The average response to a drought of this size would be for world dairy prices to be around 10 percent higher than otherwise. As it happens, world dairy prices actually rose by around 40 percent between January and April We find that not all prices are equally affected by droughts. Food prices, for instance, increase as a result of higher milk prices. However, goods and services that respond mostly to domestic factors (non-tradables), rather than being exposed to international competition, are expected to become cheaper. The model predicts that the exchange rate will be 3 percent lower by early next year than it would have been without the drought. On past relationships, 90-day interest rates would also be a little lower than they would otherwise have been. 1 This range includes publicly available estimates from ASB, the Treasury and Westpac.
3 Reserve Bank of New Zealand Analytical Note Series INTRODUCTION 2 The 2013 drought has been severe. Because New Zealand relies extensively on rainfall to support its large agricultural sector, droughts can have substantial shortterm macroeconomic impacts probably more than in most developed countries. The drought has clearly had a considerable direct impact on the agricultural industry. The uncertainty, however, is how much it will feed through to other parts of the economy. For example, it is likely to impact those that provide services to the agricultural sector. It could also affect some prices, particularly those relating to agricultural outputs. In this note, we take an in-depth look at the impact of drought using an empirical macroeconomic model. Our model is based on the vector autoregression (VAR) framework. 3 VARs are flexible time series models used to describe the interaction between economic and financial variables. They have been the workhorse of empirical macroeconomic modelling and are widely used to measure the transmission channels of various shocks on the economy. This approach is suited to our analysis as droughts are easily identifiable within the framework. Droughts are mostly unexpected and unlikely to be themselves affected by macroeconomic conditions. Therefore, when we separate the impact of droughts, reverse causation is unlikely to be an issue. This enables us to extract more clearly from the data the effects of the drought itself on different facets of the economy. An important feature of this paper is the climate data we use. Indicators used in previous studies are not always consistent with one another and are often at odds with anecdotal evidence. We construct alternative climate measures and show that they are consistent with the timing of widely recognised droughts. Further, the impact of seasonal variation can be hugely influential, and simply seasonally adjusting the indicators is insufficient to account for this. For instance, a drier-than-usual July is likely to have a different impact than a drier-than-usual March due to, for example, the different phases of the growing season. We estimate the impact of drier-than-usual March quarters, as this is when the most damaging droughts usually occur. We also use several different indicators, including North Island and South Island indicators, to avoid idiosyncrasies from a single measure. OTHER LITERATURE Focusing only on the impact of droughts means that we can analyse their effects in more detail and check the robustness of our findings. Previous empirical papers focusing on the New Zealand business cycle have tended to consider the impact of drought shocks amongst many others. For example, Buckle et al. (2007) and Bloor and Matheson (2010) both consider the impact of climate shocks from large VAR 2 We wish to thank Phillip Liu and Yuong Ha for their input into preliminary versions of this note. 3 Other VAR studies using New Zealand data include Haug and Smith (2011), Karagedikli and Price (2012), and McDonald (2012).
4 Reserve Bank of New Zealand Analytical Note Series models. Because they were not focusing exclusively on the climate shock, their discussion of the impact of this type of shock was somewhat limited. Fomby et al. (2013) use a similar VAR approach with panel data to estimate the impact of natural disasters across many countries. As part of this, they estimate the impact of droughts. The droughts that they focus on, however, are extreme compared to the 2013 drought in New Zealand. For example, for a drought to be declared a natural disaster it must either: kill 10 or more people, affect 100 or more people, result in a declaration of a state of emergency, or result in a call for international assistance. They find a significant negative impact on GDP in developing countries in the year of a drought. However, their results suggest that droughts do not have a significant macroeconomic effect in developed countries. 4 CLIMATE INDICATORS FOR NEW ZEALAND Clark, Mullan and Porteous (2011) review drought indicators for New Zealand. They show that drought does not have a universal definition. That is, not all measures suggest drought has occurred at the same time. They suggest climate indicators should capture the duration, intensity and timing of drought, among other things. We consider four indicators: Days of soil moisture deficit (SMDD) This indicator measures the number of days in a month that have a soil moisture deficit. We standardise the data across months by subtracting the median days of deficit in each month. This measure provides a good proxy for both the existence and severity of drought. Buckle et al. (2007) use this measure in investigating the importance of climate for New Zealand business cycles. Cumulative soil moisture deficit index (SMDI) This index is based on mean soil moisture deficit data. Following the method of Narasimhan and Srinivasan (2005), we first convert observed soil moisture into its percent deviation from the historical average for that specific month, then calculate a weighted cumulative sum of that series. The cumulative sum means that persistent episodes of dryness receive more weight in the index than transitory ones, making the SMDI a useful indicator for drought severity. 4 In more general terms, Noy (2009) finds that developing countries and smaller economies experience larger negative impacts on their GDP following natural disasters. See also Cavallo and Noy (2011) for a review of the literature on the economic impact of natural disasters.
5 Reserve Bank of New Zealand Analytical Note Series Cumulative rainfall index (CRFI) This indicator measures the severity of drought based solely on rainfall. We calculate it in the same way as the SMDI above, but using rainfall data. As a result, the CRFI is inverted relative to the two SMD indicators low levels of the CRFI are associated with droughts, whereas high levels of the SMDD and the SMDI are consistent with droughts. The limitation of this approach is that rainfall may not translate directly into soil moisture. To measure the true effect on soil moisture, the index would need to account for factors such as runoff and evaporation. Southern oscillation index (SOI) The SOI is used to identify El Niño and La Niña climate patterns. Persistent positive (La Niña) or negative (El Niño) values of the SOI are indicative of shifts in certain ocean currents, which are often (but not always) associated with changes in rainfall patterns in New Zealand. However, it is difficult to interpret the SOI directly in terms of New Zealand s weather. Bloor and Matheson (2010) use the absolute value of the SOI as an indicator for climate and struggle to obtain statistically significant results. The first three indices are constructed using data from the National Climate Database made available by the National Institute of Water and Atmospheric Research (NIWA). 5 These data are available monthly at the station level. We restricted our dataset to include 363 stations based on data availability. In figure 1 we plot the longitude and latitude for each station. These 363 stations cover much of New Zealand. Figure 1: Station coverage 5 This data is available at


 Cumulative soil moisture deficit index Soil moisture deficit days Cumulative rainfall index Southern oscillation")
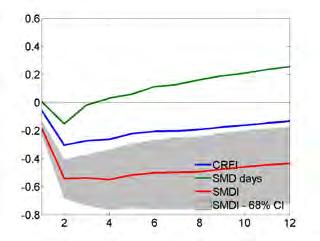
6 Reserve Bank of New Zealand Analytical Note Series To construct our aggregate indicators, we: 1. Calculate the indices for every station; 2. Find the mean for each of nine regions; 3. Create national livestock indices based on the number of dairy cattle, beef cattle and sheep in each region. Regional livestock numbers are available annually for the last 25 years from the Ministry of Primary Industries (MPI); 4. Combine these livestock indices according to the value added by industries in the SNA input/output tables (50 percent weight on dairy cattle and 25 percent weight on both beef cattle and sheep); 5. Convert each index to quarterly frequency using a simple average. We plot these indicators in figure 2 and show widely recognised droughts as grey shaded areas. Then, in table 1 we show the correlations between these measures. Figure 2: Climate indicators (standardised) Cumulative soil moisture deficit index Soil moisture deficit days Cumulative rainfall index Southern oscillation index Table 1: Correlations between climate indicators 6 SMD index SMD days CRFI SOI SMDI 1 SMD days CRFI SOI Bold indicates the correlation is significantly different from zero at the 95 percent confidence level.

7 Reserve Bank of New Zealand Analytical Note Series Of these four indicators, the SOI stands out as being the least like the others and the least related to recognised droughts. Having said this, it does capture the El Niño weather pattern in early 1998 that resulted in a drought. Other than this, the SOI shows little or no correlation with other droughts in the sample. In 2013Q1 the SOI was neutral and, thus, did not predict the recent drought. For this reason, we exclude the results using this indicator from the main part of this note (see appendix B). Excluding the SOI, the other indicators are quite similar to one another. The correlation between the cumulative soil moisture deficit index and the cumulative rain fall index is very tight (-0.81). A feature of these indicators is that they reach extreme values during droughts. This suggests these indicators are indeed capturing what we are trying to measure. An issue with most climate indicators is their seasonal pattern. In figure 3, we show the mean soil moisture deficit by month across all stations. Higher values imply drier months and vice versa. It shows that February is on average the driest month followed by January and March. The wettest months are July and August. Figure 3: Mean soil moisture deficit by month (mm) To adjust for this seasonal pattern, we use indicators that are measures of moisture relative to normal for that month. However, even after accounting for this, it might be the case that drier than normal weather has a different effect depending on the time of the year due, for example, to the different phases of the growing season. A drier July might leave pastures less boggy going into spring grazing providing a boost to activity, whereas a drier February might result in insufficient moisture for grass growth.
8 Reserve Bank of New Zealand Analytical Note Series To account for this seasonality, we split each indicator into four separate time series one for each quarter of the year, with zeros in the other quarters. To demonstrate this, figure 4 shows the cumulative soil moisture deficit index for Q1 only. This indicator highlights the most damaging droughts, which usually occur in Q1, better than using the indicator for all four quarters. As we want to estimate the likely impact of the 2013Q1 drought, it is more appropriate to use only Q1 data in our baseline model. In Appendix C, we show the impact of seasonally dry June, September and December quarters. Figure 4: Cumulative soil moisture deficit index (Q1 only) THE MODEL The model we use for our analysis is a structural vector autoregression (VAR) model. This means that each variable is modelled as a function of its own lags and lags of the other variables. We also allow for contemporaneous impacts between some variables depending on our identification technique (discussed below). We include the following variables: the log of the ANZ dairy price index (foreign currency terms), the log of real gross domestic production (GDP), the log of the consumer price index (CPI), the 90-day interest rate and the log of the exchange rate (Trade Weighted Index, TWI). These variables are typical of a small open economy model, except for the dairy price index. We include dairy prices because we want to test whether a New Zealand drought has any impact on global dairy prices. We also include three exogenous variables in the model. These variables are unresponsive to, but contribute to, domestic conditions. These include world GDP, the
9 Reserve Bank of New Zealand Analytical Note Series VIX (both accounting for global events) and a climate indicator. 7 We estimate the model with each of the climate indicators included separately. Estimation and identification We estimate the VAR on quarterly data from the first quarter of 1992 to the fourth quarter of This year s drought is not included in the sample. We include four lags of each variable in each equation. We estimate the model s parameters using Bayesian estimation. 8 To identify the drought shocks in our VAR, we use a combination of short run and exogeneity restrictions. Our restrictions ensure that the climate indicator is not affected by any other variables in the model. We also assume that a drought shock can have a contemporaneous impact on the domestic variables. Because we are only interested in climate shocks and we are not attempting to identify any other structural shocks, the ordering of the domestic or foreign variables has no impact on our results. HOW EXTREME WAS THE 2013 DROUGHT? Before presenting our results, we must determine how extreme 2013Q1 was relative to normal. According to our indicators, this year s drought is the most significant since the 1970s (figure 5). Figure 5: Average of the Q1 indicators (long run) 9 7 The VIX index measures the implied volatility of options on the S&P500 index commonly used as a proxy for risk aversion. 8 Our priors are set around a random walk mean, except for the climate indicator which has a white noise mean. We implement the prior using dummy observations, as done by Bloor and Matheson (2010). We iterate the Gibbs sampler ten thousand times and burn the first nine thousand. For further details on the model see appendix D. 9 This figure shows the average of the cumulative soil moisture deficit index, soil moisture deficit days, and the inverted cumulative rainfall index. Each index is standardised so that its post-1992 mean and standard deviation are 0 and 1 respectively. For a plot of the number of stations used to construct this index, see appendix E.
10 Reserve Bank of New Zealand Analytical Note Series The average of our three indicators suggests 2013Q1 was around 1.6 standard deviations drier than normal (table 2). On average, a drought this size or larger seems to have occurred about once every 20 years. Table 2: Drought indicators for 2013Q1 (standardised) Indicator 2013Q1 (standard deviations) Cumulative soil moisture deficit index 1.6 Days of soil moisture deficit 1.8 Cumulative rainfall index -1.5 From here on, using our three primary indicators, we calculate and compare the impact of a 1.6 standard deviation drought. ESTIMATED IMPACT OF THE 2013 DROUGHT The following results show the predicted impact of the 2013 drought, based on the impacts from previous droughts scaled to match this one. Each plot shows the path for a given variable relative to what it would have been without any drought. The drought impacts at period 1 on the x-axis, which for this event is 2013Q1. This section includes many results, presented in the following order: Baseline model Agricultural production components Production GDP components Expenditure GDP components Prices Nominal effects Baseline model 10 The likely impact of the 2013 drought is substantial (figure 6). For real GDP, the largest effect is predicted to be in 2013Q2, where it is expected to be 0.4 percent below where it would have been without the drought. Annual GDP in 2013 (the average response across the first four quarters) is 0.3 percent lower. Beyond this, GDP is expected to recover to its original level over the following few years, though the speed of this recovery is uncertain. World dairy prices are often thought of as exogenous to New Zealand. However, our model suggests quite a powerful short-run effect from unexpected disruptions to New Zealand supply. A typical drought of the size of this year s is estimated to raise world 10 Regarding the general importance of droughts, our model suggests that up to 6 percent of the variance in the modelled variables is driven by summer weather. We find that it matters most for the TWI and dairy prices, a little for GDP, and is not important for the CPI. Weather is probably not that important in normal years, but in drought years its contribution is likely to be notable.


11 Reserve Bank of New Zealand Analytical Note Series dairy prices by 10 percent above what they would have been without the drought, with a discernible effect lasting for over a year. The 40 percent rise in world dairy prices seen between January and April 2013 probably reflects a combination of the New Zealand drought and other factors. Figure 6: Baseline effects following the 2013Q1 drought Climate indicator Real GDP (%) Dairy prices (%) CPI (%) 90-day interest rate (%) NZD TWI (%) Note: See pages 4-5 for a full definition of these abbreviations. The predicted impact of the drought on aggregate CPI is not statistically significant. This is largely because non-tradable and tradable prices are estimated to move in opposite directions, with a lower exchange rate and higher dairy prices tending to raise tradable prices, while weaker economic activity dampens non-tradable prices. Historically, interest rates have initially increased following droughts, but have then tended to quickly fall to below where they would have been. The predicted trough in


12 Reserve Bank of New Zealand Analytical Note Series the 90-day rate response is a couple of years after the drought and is basis points below where it would have been otherwise, although the uncertainty around this point estimate is large. The New Zealand dollar TWI is estimated to have remained effectively unchanged due to the drought over the first half of However, by early next year we estimate that it might be as much as 3 percent lower than it would have been under normal weather conditions. Initially, the TWI might be supported by higher dairy prices, but when these start returning to normal, predicted weaker domestic activity and lower interest rates seem consistent with a depreciation of the dollar. Agricultural production components To clarify the channels through which droughts affect the economy, we estimate our baseline model with some additional variables. We add these variables to the model one at a time, to avoid making the VAR too big. Other than this, we have kept the model the same unless stated otherwise. Milk production suffers a lot when droughts occur (figure 7). When we add milk production directly to our model, we find that it falls by 6 percent in the quarter of a drought. Then in the following quarter it falls by a further 4 percent. Beyond this, milk production gradually recovers back to normal over the following two years. To clarify the impact over the six months following a drought, we estimate a two variable VAR using our climate indicators and milk production in monthly terms (figure 7). We estimate this VAR using the data back to 1992 and include 12 lags. We find that milk production is most affected towards the end of the dairy season. That is, production in April and May is down by around 10 percent following a March drought. Figure 7: Milk production Quarterly (%) Monthly (%) Note: See pages 4-5 for a full definition of these abbreviations. Like milk production, slaughter volumes are heavily influenced by droughts. We find that slaughter increases by around 2 percent at the time of the drought (figure 8). This is consistent with farmers reducing stock numbers so that they have enough feed to

13 Reserve Bank of New Zealand Analytical Note Series keep the remaining stock in good condition. Beyond the immediate rise in slaughter, there tends to be slightly less slaughter for several following years, as stock levels are rebuilt. This decline is not statistically significant in the year following the drought. Figure 8: Slaughter rates and sheep population Slaughter (%) Sheep population (Annual, %) Note: See pages 4-5 for a full definition of these abbreviations. To add flavour to this analysis, we also obtained annual sheep population data back to 1960 from Statistics New Zealand. With this data, we estimated an annual VAR with two variables: a climate indicator and the sheep population. 11 We find that droughts like the one in 2013 typically result in a 1.5 percent reduction in the sheep population. It then takes at least 3 years for the population to return to its pre-drought level. Production GDP components The predicted fall in GDP over the first half of 2013 is, of course, largely due to a fall in agricultural production and in primary manufacturing (figure 9). Agricultural production falls by 3 percent in the quarter of the drought (2013Q1). Then, it appears to fall about another one percent in the following quarter (2013Q2). It takes some time for these losses to be fully recovered. Primary manufacturing falls by around 5 percent in the quarter of the drought. Like agricultural production, this component remains depressed for a while as the sector recovers from the drought. 12 The flow-on effects from the weak primary sector can be seen in some of the other GDP components. For instance, professional services decline by as much as one percent during the drought. Also, ex-primary manufacturing falls by a little more than half a percent after the drought. The only persistently positive response in the production GDP components is that of wholesale trade. This component increases by a statistically significant amount in the 11 The annual climate indicator was set to its Q1 value. 12 Primary manufacturing production measures the value added in processing of primary food products, for example in producing milk powder from milk.
, as wholesale trade includes the distribution of imported goods.")
.")

14 Reserve Bank of New Zealand Analytical Note Series year following the drought. It ends up about 1.5 percent higher than it would have been otherwise. This response seems consistent with the rise in import volumes following the drought (figure 10), as wholesale trade includes the distribution of imported goods. Figure 9: Production GDP components Agriculture (%) Primary manufacturing (%) Professional services (%) Ex-primary manufacturing (%) Electricity (%) Wholesale trade (%) Note: See pages 4-5 for a full definition of these abbreviations. Expenditure GDP components In line with the drop in milk production, export volumes decline in the second quarter following the drought (figure 10). We estimate that exports will be around 2 percent lower in 2013Q2 and that they will remain lower for at least a year. Imports tend to rise slightly following droughts, although this is not statistically significant beyond the first year. The model suggests that residential investment (and to a lesser degree consumption) is weakened by the drought. Residential investment could fall by 3 percent after a year or so, consistent with weaker domestic activity in general.
15 Reserve Bank of New Zealand Analytical Note Series Figure 10: Expenditure GDP components Exports (%) Imports (%) Consumption (%) Residential investment (%) Market investment ex-residential (%) Government consumption (%) Note: See pages 4-5 for a full definition of these abbreviations. Prices We also estimate our model with alternative price variables, other than the CPI. Initially we include both tradable and non-tradable price indices (figure 11). We find that, while in aggregate the CPI is not substantially affected by the drought, the makeup changes considerably. Tradable prices tend to rise after droughts. We find that after two years tradable prices are more than 0.5 percent higher than without the drought. On the other hand, non-tradable prices are lower by as much as 0.3 percent after the drought. This is broadly consistent with the similar-sized drop in GDP over the first half of 2013, though the speed of this non-tradable response is a little surprising.
. We find that food prices are between 1.0 and 1.5 percent higher than they would have been without the drought.")


16 Reserve Bank of New Zealand Analytical Note Series Figure 11: Composition of the CPI Tradable (%) Non-tradable (%) Note: See pages 4-5 for a full definition of these abbreviations. Food prices are the major contributor to higher tradable prices (figure 12). We find that food prices are between 1.0 and 1.5 percent higher than they would have been without the drought. Breaking this down even further, the upward pressure on food prices seems to be largely driven by milk prices. Milk, cheese and eggs in the CPI rise by nearly 3 percent. Clearly, the decline in milk production has a large impact on retail dairy prices as well as international dairy prices. Food (%) Figure 12: CPI food prices Milk, cheese and eggs (%) Note: See pages 4-5 for a full definition of these abbreviations. We noted in an earlier section that slaughter spikes up when the drought occurs. This is likely to cause an increase in the supply of meat, at least initially, followed by slightly less slaughter for a while. As such, we estimate any corresponding price response to this change in slaughter (figure 13). However, we find that international meat prices appear higher following the drought. The initial impact on domestic consumer prices from the extra supply seems to be very small or non-existent in our model.
 and PPI (wholesale).")

17 Reserve Bank of New Zealand Analytical Note Series Figure 13: Meat prices CPI Meat and poultry (%) ANZ meat and wool prices (foreign terms, %) Note: See pages 4-5 for a full definition of these abbreviations. Given New Zealand s reliance on hydro electricity production, we estimate the impact of drought on electricity prices in the CPI (retail) and PPI (wholesale). We find that PPI electricity prices could respond significantly, rising as much as 8 percent, with an effect lasting for up to two years (figure 14). This is consistent with less rain lowering lake levels, thus increasing the cost of production. It seems that historically there has been no pass through of these higher costs to retail prices. Figure 14: Electricity prices CPI electricity (%) PPI electricity (%) Note: See pages 4-5 for a full definition of these abbreviations. Nominal effects Our results have shown that droughts reduce real economic activity in the New Zealand economy and raise dairy prices. To assess the impact on farmers incomes, we need to consider both of these effects. As such, we consider the response of export values following the drought (figure 15). We find that the drop in export volumes initially dominates the rise in export prices. However, after a couple of quarters the price response is larger. As such, export values are predicted to be higher by around 2 percent a year after the drought, though this is not statistically significant. In the quarter following the drought, the trade balance appears to be slightly lower, perhaps due to a mix of lower export values and high import volumes. Beyond this,


18 Reserve Bank of New Zealand Analytical Note Series higher export values contribute to a slightly positive balance. Only the initial fall is statistically significant. Figure 15: Export values and the trade balance Export values (%) Trade balance (%) Note: See pages 4-5 for a full definition of these abbreviations. Nominal GDP rises following the drought. The rise in the GDP deflator is larger and more persistent than the decline in production volumes. After three years we find that nominal GDP rises by nearly 1 percent, albeit with very wide confidence bands around the point estimate. Figure 16: Nominal GDP GDP deflator (%) Nominal GDP (%) Note: See pages 4-5 for a full definition of these abbreviations. HOW ROBUST ARE THESE RESULTS? Here we test the robustness of our results by considering three questions: 1. What if we estimate drought effects over a longer sample? 2. What if we exclude the 1998 and 2008 droughts from our sample (given these coincided with global downturns)? 3. How different are the impacts of North Island and South Island droughts?


 dairy price (transformed")

 Note: See pages 4-5 for a full definition of these abbreviations.")
19 Reserve Bank of New Zealand Analytical Note Series What if we estimate drought effects over a longer sample? To answer this question, we estimate the impact of this year s drought using a VAR estimated on data starting in 1970, thus including several quite large droughts. As not all the variables in our baseline model are available back this far, we have adjusted some of the data in our estimation. For instance, we replace world GDP with US GDP and remove the VIX. In the domestic block, we replace the ANZ dairy price index with the Overseas Trade Indices (OTI) dairy price (transformed into world terms using the TWI) and change the 90-day interest rate to the floating mortgage rate. We display the estimated impact of the drought according to this model in figure Figure 17: Drought effects in a long run VAR Real GDP (%) OTI dairy price (%) Floating mortgage rate (%) NZD TWI (%) CPI (%) Note: See pages 4-5 for a full definition of these abbreviations. We find that, even with the longer sample, the impact of the drought on GDP is basically the same. That is, we find that the trough in GDP is about 0.5 percent lower 13 The quarterly real GDP series was back dated using the series constructed by Hall and McDermott (2011).
20 Reserve Bank of New Zealand Analytical Note Series in 2013Q2, only a little more than the 0.4 percent that we estimate in the baseline model. Again, the response is largest in the first two quarters. This model also suggests that dairy prices increase after droughts, supporting the baseline model. OTI dairy prices respond a little less to the drought than the ANZ dairy price index. The peak response is around 5 percent higher and in the third quarter following the drought (i.e. 2013Q3). This might reflect that OTI dairy prices (which capture actual export transactions) are often based on fixed-term contracts and, as such, can be less volatile. In this model, the floating mortgage rate is affected by the drought more than the 90-day interest rate was in the baseline model. That is, it falls after a year by around 50 basis points. Likewise, the CPI falls (by around 2 percent) in the years following the drought. These differences probably reflect the much greater volatility in inflation and interest rates in the 1970s and 80s. The NZD TWI, however, responds very little to droughts in this model. This difference might reflect the fixed exchange rate regime of the 1970s and early 80s. In all, estimating a model over a longer sample produces some similar results, particularly for the impact on GDP and dairy prices. This is reassuring as, for example, the relative importance of the dairy sector has materially increased over time and production processes have changed (such as the increasing reliance on irrigation). Are our results driven by the 1998 and 2008 droughts? The two largest droughts in our baseline sample are in 1998 and For our purposes, this is unfortunate timing, because these two events coincided with the Asian financial crisis and the global financial crisis respectively. While we have tried to account for this by including world GDP and the VIX, we want to make sure these two episodes are not driving our results. To do this we set the drought indicators to 0 (their mean) in 1998Q1 and 2008Q1. Then we estimate the model and construct the responses to a drought shock (figure 18). We find that the drought effects are very similar to those in the baseline. A difference to note, however, is that GDP falls by slightly less in the first two quarters after a drought. This is not surprising given we have excluded the two droughts that would have caused the largest impacts on GDP.

21 Reserve Bank of New Zealand Analytical Note Series Figure 18: Drought effects when we exclude the 1998 and 2008 droughts Dairy prices (%) Real GDP (%) NZD TWI (%) CPI (%) Note: See pages 4-5 for a full definition of these abbreviations. How different are the impacts of North Island and South Island droughts? Here we compare the impact of a drought in the North Island to a drought in the South Island. The agricultural industries in each island are quite different so we might expect different impacts. For instance, the dairy sector in the North Island relies less on irrigation so might be more affected by droughts. Generally speaking, the indices for each island are quite similar (figure 19). 14 However, there have been significant differences at times. Droughts have tended to be more severe in the North Island, and this is particularly evident this year. 14 There are 199 stations in the North Island and 164 in the South Island. These stations are equally weighted for each index.

22 Reserve Bank of New Zealand Analytical Note Series Figure 19: North and South Island Q1 cumulative soil moisture deficit indices To estimate the impacts of droughts in each island, we add these indicators into the baseline model one at a time, in much the same way as we added different climate indicators. Given the 2013Q1 drought was 2.1 standard deviations drier than normal in the North Island, we show the impact of a drought of this size in both islands (figure 20). 15 While this larger shock makes these results less comparable to the baseline model (which used a 1.6 standard deviation shock), it highlights that the 2013 drought affected the North Island most of all. Separating the impact from North Island and South Island droughts suggests the 2013 drought could have larger effects than the baseline model predicts. This is because North Island droughts tend to have larger effects than similar South Island droughts. Historically, a drought of this magnitude in the North Island reduces GDP by 0.7 percent at its trough, whereas a similar South Island drought only reduces GDP by 0.2 percent. This North Island drought is predicted to lower annual GDP by 0.6 percent over the whole of Agricultural production falls by 6 percent given this North Island drought, but falls by 4 percent given a similar South Island drought. Further, the TWI falls by nearly twice as much given North Island droughts. 15 The South Island indicators suggest the 2013Q1 drought was one standard deviation drier than normal.
 South Island")


23 Reserve Bank of New Zealand Analytical Note Series Figure 20: North Island and South Island drought effects North Island Real GDP (%) South Island Agriculture production (%) NZD TWI (%) Note: See pages 4-5 for a full definition of these abbreviations. With North Island droughts having larger effects, our results suggest there might be better weighting schemes than what we used to construct our baseline indices. We account for the number of livestock in each region, but not for the regional differences in each livestock s value added. Accordingly, a weighting scheme that accounts better for the regional value added could be an improvement.
24 Reserve Bank of New Zealand Analytical Note Series CONCLUSION We have identified and systematically examined the economic impacts of droughts using a macroeconomic model. Our results show clear transmission channels through which the drought affects the economy. Our baseline results suggest the 2013 drought could lower annual GDP for the full 2013 year by around 0.3 percent. However, given this drought was materially worse in the North Island (where dry weather has a larger impact on GDP), we find that annual GDP could be as much as 0.6 percent lower. While agricultural production falls initially, the overall economic impact of the drought would be worse if not for a predicted 10 percent rise in world dairy prices. A considerable proportion of the 40 percent rise in dairy prices seen between January and April 2013 is likely to be due to the drought. This suggests New Zealand climatic conditions can materially affect world dairy prices, even though New Zealand produced only 4.4 percent of the world s milk in In saying this, New Zealand dominates world exports of whole milk powder (61 percent of total export volumes) and butter (63 percent of total export volumes). 16 The dairy price rise means that incomes are not as badly affected as the fall in production might suggest. Nominal GDP, for example, is predicted to increase slightly following a drought. Higher dairy prices are also likely to increase tradable consumer prices, particularly food prices, although this could initially be offset by lower non-tradable prices. As noted, droughts lower real activity while raising prices, which is typical of a negative supply shock. As such, interest rates have not tended to respond much to droughts. At most, the model predicts the 90-day rate could be basis points lower beyond 2013, although the uncertainty around this point estimate is large. Lastly, the model predicts that the NZD TWI will be at least 3 percent lower at the end of 2013 than it would have been without the drought. This depreciation might seem at odds with the rise in dairy prices, as these variables usually respond to other shocks by moving in the same direction. The divergence might relate to the considerable focus that foreign exchange markets often put on real GDP releases. While these results are fairly robust, there have been some large changes in New Zealand s rural industries over time which could change the impact of future droughts. Also, future research might consider alternative weighting strategies for the climate indices, including, for example, putting more weight on the North Island. 16 Source: USDA,
25 Reserve Bank of New Zealand Analytical Note Series REFERENCES ASB (2013) Quarterly Economic Forecast May F13April.pdf Bloor, C. and Matheson, T. (2010) Analysing shock transmission in a data rich environment: A large BVAR for New Zealand Empirical Economics, Springer, vol. 39(2), pages Buckle, R. Kim, K. Kirkham, H. McLellan, N. and Sharma, J. (2007) A structural VAR business cycle model for a volatile small open economy Economic Modelling Cavallo, E. & Noy, I. (2011) The Economics of Natural Disasters A Survey International Review of Environmental and Resource Economics, 5(1), Clark, A. Mullan, B. and Porteous, A. (2011) Scenarios of Regional Drought under Climate Change NIWA Client Report WLG prepared for Ministry of Agriculture and Forestry, June Del Negro, M. and Schorfheide, F. (2011) Bayesian Macroeconometrics in J. Geweke, G. Koop, and H. van Dijk (eds.) "The Oxford Handbook of Bayesian Econometrics," Oxford University Press, Fomby, T. Ikeda, Y. and Loayza, N. (2013) The growth aftermath of natural disasters Journal of Applied Econometrics 28: Hall, V. and McDermott J. (2011) A Quarterly Post-World War II Real GDP Series for New Zealand New Zealand Economic Papers, 45, 3, Haug, G. and Smith, C. (2011) Local linear impulse responses for a small open economy. Oxford Bulletin of Economics and Statistics, vol. 74(3), , 06. Karagedikli, O. and Price, G. (2012) Identifying Terms of Trade Shocks and Their Transmission to the New Zealand Economy NZAE conference paper Kim, S. and Roubini, N. (2000) Exchange rate anomalies in the industrial countries: A solution with a structural VAR approach Journal of Monetary Economics, Elsevier, vol. 45(3), pages McDonald, C. (2012) Kiwi drivers - the New Zealand dollar experience Reserve Bank of New Zealand, Analytical Note series, AN 2012/02. Narasimhan, B. and Srinivasan, R. (2005) Development and evaluation of Soil Moisture Deficit Index (SMDI) and Evapotranspiration Deficit Index (ETDI) for agricultural drought monitoring Agricultural and Forest Meteorology 133 (2005) Noy, I. (2009) The macroeconomic consequences of disasters Journal of Development Economics, Elsevier, vol. 88(2), pages The Treasury (2013) Monthly economic indicators March Westpac (2013) Economic Overview May /Westpac-QEO-May-2013.pdf
26 Reserve Bank of New Zealand Analytical Note Series APPENDIX A - MODEL VARIABLES World GDP (16 countries, log*100) ANZ world dairy price index (log*100) Real GDP (log*100) CPI (log*100) 90-day interest rate (%) NZD TWI (5 countries, weights, log*100) VIX (index)
 event is more consistent with the impacts of a drought in New Zealand.")

27 Reserve Bank of New Zealand Analytical Note Series APPENDIX B - SOUTHERN OSCILLATION INDEX RESPONSES Figure B1 below shows the responses of GDP and dairy prices when the Southern Oscillation index is very positive and very negative in the first quarter of the year. Of these, the negative SOI (El Niño) event is more consistent with the impacts of a drought in New Zealand. This result is largely driven by the 1998 drought that coincided with a very negative SOI value. The asymmetries in these responses demonstrate the importance of treating the SOI with caution. In this case, we split it into two separate series with only positive values in one and only negative values in the other, in order to better account for the very different impacts of El Niño and La Niña events. Studies using the SOI as an indicator without such treatment, such as Bloor and Matheson (2010), have struggled to find any significant role for climate shocks in New Zealand. Nevertheless, we do not believe that a shock to the SOI in either a positive or negative direction is necessarily consistent with a drought in NZ, so we place little weight on this indicator. Thus, we exclude these results from the main part of the paper. Figure B1: Responses to SOI shocks (1.6 standard deviation) GDP (%) Dairy prices (%)


28 Reserve Bank of New Zealand Analytical Note Series APPENDIX C - DRY WEATHER BY QUARTER The implications of drier than normal weather are different depending on the time of the year. For instance, dry weather in the first 3 months of the year is usually recognised as a drought. The dry weather in 2013Q1 is a good example of this. On the other hand, dry weather in Q2 or Q3 do not have the same effects on the economy. Previous studies on the impact of droughts in New Zealand have not accounted for these differences. We present the results from dry shocks that are 1.6 standard deviations above the mean for each indicator for that given quarter. It is of a size equivalent of the 2013Q1 event, but occurring in a different quarter. Remember, however, that this may not necessarily be perceived by many as a drought, but only a drier than normal period. We present the responses from dry shocks in Q2, Q3 and Q4 (figure C1). We can compare these to the Q1 responses from the main part of this paper. Some key results are: Real GDP falls after a dry Q1 or Q4, but rises after a dry Q3. Non-tradable prices temporarily rise after a dry Q4, despite GDP falling. Dairy prices mostly rise after dry quarters, except a dry Q3 lowers them. Tradable prices rise when dairy prices rise. Agricultural production falls after dry quarters, except for Q3. NZD TWI generally falls after a dry quarter. The impact of a dry Q3 stands out from the impacts of dry weather in other quarters. This quarter includes July, August and September which are 3 of the wettest months (figure 3). As such, sunny weather in these months might benefit grass growth, given there is plenty of moisture available. Figure C1: Responses to dry shocks Q2 Q3 Q4 GDP


29 Reserve Bank of New Zealand Analytical Note Series Q2 Q3 Q4 Dairy prices 90-day interest rate NZD TWI Tradable prices Nontradable prices Agriculture
30 Reserve Bank of New Zealand Analytical Note Series APPENDIX D - TECHNICAL APPENDIX The starting point of our analysis is to estimate the following reduced form VAR. Y t = A Y t 1 + u t where Y t is a vector of variables. Although we use several specifications in the main text, Y t can generally be represented as: C t Y t = W t D t where C t is a measure of climate and W t and D t represent world and New Zealand specific variables, respectively. The structural VAR representation is given by: BY t = C Y t 1 + ε t where ε t represents structural shocks. The mapping between reduced form errors and structural shocks is given by: B 1 ε t = u t The model has several variables and four lags, which implies that a large number of parameters are estimated in each specification. For this reason, we use Bayesian inference, in which data is combined with prior information. Our priors are based on the widely used Minnesota prior which shrinks the VAR model towards independent random walks for each of the components of Y t (Del Negro and Schorfheide (2011)).The exception is the climate indicator, for which we use a white noise prior. Our block exogeneity assumption implies that world variables are not affected by New Zealand variables. We also assume that our climate indicator is a fully exogenous variable. We impose these restrictions by setting the appropriate elements of the reduced form coefficients, A to 0. Therefore, the A matrix has the following form: A A = 0 A 21 0 A 31 A 32 A 33 Our identification of the climate shock is based on short run restrictions. These are implemented using non-recursive contemporaneous restrictions, as in Kim and Roubini (2000). The restrictions are set in order to preserve the exogeneity structure we have described above. In addition, we assume that domestic variables respond contemporaneously to a drought or world shock. We also impose that the climate indicator does not have an impact on world variables and vice versa.
31 Reserve Bank of New Zealand Analytical Note Series APPENDIX E - DATA AVAILABILITY When constructing the long run drought indicators, we were limited by the number of stations that had data available. For instance, prior to 1990 fewer than 200 of our stations had soil moisture data available. As such, in the earlier part of the sample our indices might be more volatile because idiosyncratic factors would have received more weight. Figure E1: Number of stations used to construct indices
Reserve Bank of New Zealand Analytical Note Series 1. Analytical Notes. In search of greener pastures: improving the REINZ farm price index
 Reserve Bank of New Zealand Analytical Note Series 1 Reserve Bank of New Zealand Analytical Notes In search of greener pastures: improving the REINZ farm price index AN 2012/04 Ashley Dunstan and Chris
Executive summary. Butter prices at record levels
 June 2017 Executive summary Butter prices at record levels South African milk production growth disappointed in the first five months of 2017. Total production during this period is marginally lower than
European Commission Directorate-General for Agriculture and Rural Development PROSPECTS FOR AGRICULTURAL MARKETS AND INCOME IN THE EU
 European Commission Directorate-General for Agriculture and Rural Development PROSPECTS FOR AGRICULTURAL MARKETS AND INCOME IN THE EU 2010 2020 December 2010 NOTE TO THE READERS The outlook presented in
Market Outlook For 2002 And Beyond
 Market Outlook For 2002 And Beyond J.W. Prevatt Department of Agricultural Economics & Rural Sociology Auburn University Auburn, Alabama Highlights < As of July 1, 2001, the U.S. cattle and calves inventory
Stock Number Survey as at 30 June 2017
 Contents Stock as at 30 June 017 Executive Summary Breeding ewes -1.9% Hoggets +1.7% sheep -0.9% Ewe condition Scanning Lamb crop +1.1% Beef cattle +.8% Introduction Livestock numbers as at 30 June 017
Forecasting Natural Gas Demand in the Short-term
 Forecasting Natural Gas Demand in the Short-term Kamran Niki Oskoui, Ph.D. 1 Mahdjouba Belaifa 2 Abstract Understanding the driving factors of global gas demand is of great importance for gas exporting
Chapter 8.B. Food and Agricultural Data Base: Local Modifications. Robert A. McDougall
 Chapter 8.B Food and Agricultural Data Base: Local Modifications Robert A. McDougall 8.B.1 Overview Some local modifications were made to the agricultural and food products (AFP) dataset described in chapter
Consumer Confidence Surveys: Can They Help Us Forecast Consumer Spending in Real Time?
 University of Richmond UR Scholarship Repository Economics Faculty Publications Economics 7-2006 Consumer Confidence Surveys: Can They Help Us Forecast Consumer Spending in Real Time? Dean D. Croushore
Seasonality in Revisions of Macroeconomic Data
 Journal of Official Statistics, Vol. 26, No. 2, 2010, pp. 361 369 Seasonality in Revisions of Macroeconomic Data Philip Hans Franses 1 and Rene Segers 1 We analyze the revision history of quarterly and
Differences Between High-, Medium-, and Low-Profit Cow-Calf Producers: An Analysis of Kansas Farm Management Association Cow-Calf Enterprise
 Differences Between High-, Medium-, and Low-Profit Cow-Calf Producers: An Analysis of 2012-2016 Kansas Farm Management Association Cow-Calf Enterprise Dustin L. Pendell (dpendell@ksu.edu) and Kevin L.
Food Price Outlook,
 Provided By: Food Price Outlook, 2017-18 This page provides the following information for August 2017: Consumer Price Index (CPI) for Food (not seasonally adjusted) Producer Price Index (PPI) for Food
Technological Diffusion News
 Technological Diffusion News A comment on Whither News Shocks? by Barsky, Basu & Lee Franck Portier September Version Abstract Barsky, Basu, and Lee [] are proposing to identify a technological news shock
Hog:Corn Ratio What can we learn from the old school?
 October 16, 2006 Ames, Iowa Econ. Info. 1944 Hog:Corn Ratio What can we learn from the old school? Economists have studied the hog to corn ratio for over 100 years. This ratio is simply the live hog price
Differences Between High-, Medium-, and Low-Profit Cow-Calf Producers: An Analysis of Kansas Farm Management Association Cow-Calf Enterprise
 Differences Between High-, Medium-, and Low-Profit Cow-Calf Producers: An Analysis of 2010-2014 Kansas Farm Management Association Cow-Calf Enterprise Dustin L. Pendell (dpendell@ksu.edu), Youngjune Kim
Oil Price Rise and the Great Recession of 2008
 Expert Journal of Economics. Volume 5, Issue 1, pp. 14-19, 2017 2017 The Author. Published by Sprint Investify. ISSN 2359-7704 Economics.ExpertJournals.com Oil Price Rise and the Great Recession of 2008
Market Outlook for 2003 and Beyond
 Market Outlook for 2003 and Beyond Walter Prevatt Department of Agricultural Economics & Rural Sociology Auburn University Auburn, Alabama U.S. cattle producers begin 2003 with a much brighter outlook.
Estimating the drivers of regional rural land use change in New Zealand
 Estimating the drivers of regional rural land use change in New Zealand Suzi Kerr, Jo Hendy, Kelly Lock and Yun Liang Motu Economic and Public Policy Research, PO Box 24390, Manners Street, 6142, Wellington
QUARTERLY REVIEW OF THE PERFORMANCE OF THE DAIRY INDUSTRY 1
 QUARTERLY REVIEW OF THE PERFORMANCE OF THE DAIRY INDUSTRY 1 The information in this document is from sources deemed to be correct. Milk SA, the MPO and SAMPRO are not responsible for the results of any
An Assessment of the ISM Manufacturing Price Index for Inflation Forecasting
 ECONOMIC COMMENTARY Number 2018-05 May 24, 2018 An Assessment of the ISM Manufacturing Price Index for Inflation Forecasting Mark Bognanni and Tristan Young* The Institute for Supply Management produces
TIMELY INFORMATION. Agriculture & Natural Resources AGRICULTURAL ECONOMICS AND RURAL SOCIOLOGY, AUBURN UNIVERSITY, AL
 AG ECONOMIC SERIES TIMELY INFORMATION Agriculture & Natural Resources AGRICULTURAL ECONOMICS AND RURAL SOCIOLOGY, AUBURN UNIVERSITY, AL 36849-5639 DAERS 08-5 September 2008 U. S. Beef Cattle Situation
Iowa Farm Outlook. May 2015 Ames, Iowa Econ. Info Several Factors Supporting, Pressuring Fed Cattle Prices
 Iowa Farm Outlook 0BDepartment of Economics May 2015 Ames, Iowa Econ. Info. 2061 Several Factors Supporting, Pressuring Fed Cattle Prices All market classes of beef cattle are at record high levels for
CATTLE MAY HAVE A DECENT, BUT VOLATILE YEAR
 CATTLE MAY HAVE A DECENT, BUT VOLATILE YEAR FEBRUARY 2004 Chris Hurt 2004 NO. 2 Summary Early indications are that 2004 will not be as difficult for the cattle industry as many producers had feared in
Export performance after depreciation
 Export performance after depreciation By Leo Bonato, Sean Comber and John McDermott, Economics Department Many commentators have been disappointed by the recent performance of the export sector. The New
U.S. milk production up 0.6 percent over NY milk production up 3.5 percent. Income over feed costs projected to fall 6 percent
 Farm Credit East May 2016 Knowledge Exchange Industry Outlook - Dairy Overview The Northeast dairy industry had a challenging 2015 with falling milk prices. Margins have declined and are expected to continue
Economic Returns from the Beef Checkoff
 Economic Returns from the Beef Checkoff Ronald W. Ward 1 Food and Resource Economics Department University of Florida, Gainesville Generic advertising is the cooperative effort among producers to promote
Key Statistics: Monthly Update January 2014
 A briefing for members on the latest agricultural statistics and economic indicators from NFU Economics. In this issue Farm Business Income Pigs Cost of Production Milk Production Beef and Veal Production
New Zealand Drought Index and Drought Monitor Framework
 New Zealand Drought Index and Drought Monitor Framework Contents Executive summary... 2 1 Introduction... 3 2 Elements of International Drought Monitors... 3 3 The water balance model... 3 3.1 Potential
Barbro Wickman-Parak: The Riksbank and monetary policy perspectives on interest rate forecasts
 Barbro Wickman-Parak: The Riksbank and monetary policy perspectives on interest rate forecasts Speech by Ms Barbro Wickman-Parak, Deputy Governor of the Sveriges Riksbank, at a Statistics Sweden seminar,
Differences Between High-, Medium-, and Low-Profit Cow-Calf Producers: An Analysis of Kansas Farm Management Association Cow-Calf Enterprise
 Differences Between High-, Medium-, and Low-Profit Cow-Calf Producers: An Analysis of 2011-2015 Kansas Farm Management Association Cow-Calf Enterprise Dustin L. Pendell (dpendell@ksu.edu) and Kevin L.
Beef and Milk Price Links in Turkey
 Beef and Milk Price Links in Turkey Sayed Saghaian, University of Kentucky, USA Gökhan Özertan, Boğaziçi University, Turkey Hasan Tekgüç, Mardin Artuklu University, Turkey Overview Retail beef and sheep
THE ROLE OF NESTED DATA ON GDP FORECASTING ACCURACY USING FACTOR MODELS *
 Andrejs Bessonovs University of Latvia, Latvia THE ROLE OF NESTED DATA ON GDP FORECASTING ACCURACY USING FACTOR MODELS * Abstract The paper studies an impact of nested macroeconomic data on Latvian GDP
Financing Constraints and Firm Inventory Investment: A Reexamination
 Financing Constraints and Firm Inventory Investment: A Reexamination John D. Tsoukalas* Structural Economic Analysis Division Monetary Analysis Bank of England December 2004 Abstract This paper shows that
Economics Bulletin, 2013, Vol. 33 No. 4 pp Introduction
 1. Introduction Red meat prices have shown considerable increases since 2005 in Turkey. Overall food inflation rose 93 percent, retail beef prices rose 106 percent, and retail sheep prices rose 138 percent
Pork Industry Makes Turn for the Better
 Pork Industry Makes Turn for the Better July 2004 Chris Hurt After a period of grave concern regarding depressed hog prices and rising feed prices in the spring, markets have turned positive for hog producers.
Emissions Intensity CHAPTER 5 EMISSIONS INTENSITY 25
 C H A P T E R 5 Emissions Intensity Emissions intensity is the level of GHG emissions per unit of economic activity, usually measured at the national level as GDP. 25 Intensities vary widely across countries,
TIMELY INFORMATION Agriculture & Natural Resources
 AG ECONOMIC SERIES TIMELY INFORMATION Agriculture & Natural Resources DAERS 2010 4 September 2010 U. S. Beef Cattle Situation and Price Outlook Walt Prevatt, Ph.D. Extension Economist and Professor Auburn
Variability in weather: what are the consequences for grazing enterprises? Libby Salmon and John Donnelly
 74 Variability in weather: what are the consequences for grazing enterprises? Libby Salmon and John Donnelly CSIRO Plant Industry, GPO Box 1600, Canberra, ACT 2601 Email: libby.salmon@csiro.au Abstract
Overview of the manufacturing sector
 Overview of the manufacturing sector Jane Turner, Economics Department This article examines recent trends in New Zealand s manufacturing sector. It finds that sales to the domestic market have been reasonably
1979 Food and Agricultural Outlook
 1979 Food and Agricultural Outlook NEIL A. STEVENS and CLIFTON B, LUTTRELL ~HE 1979 forecast of U.S. food and agricultural developments by the U.S. Department of Agriculture (USDA) points to larger food
Australian Beef Financial performance of beef farms, to
 Australian Beef Financial performance of beef farms, 2014 15 to 2016 17 Jeremy van Dijk, James Frilay and Dale Ashton Research by the Australian Bureau of Agricultural and Resource Economics and Sciences
Analyzing the Impact of Chinese Wheat Support Policies on U.S. and Global Wheat Production, Trade and Prices
 Analyzing the Impact of Chinese Wheat Support Policies on U.S. and Global Wheat Production, Trade and Prices A Study Prepared for the U.S. Wheat Associates Miguel Carriquiry and Amani Elobeid Global Agricultural
HOG INDUSTRY NEEDS MORE DOWNSIZING IN 2004
 HOG INDUSTRY NEEDS MORE DOWNSIZING IN 2004 JANUARY 2004 Chris Hurt 2004 NO. 1 Summary Rising costs of production and continued nearrecord pork production will keep producer margins near breakeven in 2004.
Until the start of 2007, the volume series of the quarterly
 From constant prices to chain-linked prices: what consequences? Franck Arnaud Guillaume Mordant Bertrand Lhommeau Christelle Minodier Franck Cachia Frédéric Tallet Divisions - Quarterly National Accounts
Food price pass-through in the euro area: the role of asymmetries and non-linearities
 Food price pass-through in the euro area: the role of asymmetries and non-linearities (*) Gianluigi Ferrucci, European Central Bank Rebeca Jiménez-Rodrigues, University of Salamanca Luca Onorante, European
Global Price and Production Forecast
 Global Price and Production Forecast Ron Plain Professor of Ag Economics, University of Missouri-Columbia, 220 Mumford Hall, Columbia, MO 65211 USA; Email: plainr@missouri.edu Introduction Last year, 2008,
Oral Capps, Jr. Gary W. Williams* TAMRC Commodity Market Research Report No. CM November 2007
 HAS THE AMERICAN LAMB BOARD INCREASED THE DEMAND FOR LAMB? Oral Capps, Jr. Gary W. Williams* TAMRC Commodity Market Research Report No. CM-01-07 November 2007 * Capps is Professor of Agricultural Economics
CONSTRUCTING AN ECONOMIC COMPOSITE INDICATOR FOR THE UAE 1
 CONSTRUCTING AN ECONOMIC COMPOSITE INDICATOR FOR THE UAE 1 ASSIL EL MAHMAH Research and Statistics Department June 2017 1 The views expressed in this paper are those of the author and should not be interpreted
An Analysis of Cointegration: Investigation of the Cost-Price Squeeze in Agriculture
 An Analysis of Cointegration: Investigation of the Cost-Price Squeeze in Agriculture Jody L. Campiche Henry L. Bryant Agricultural and Food Policy Center Agricultural and Food Policy Center Department
China's Imports of Milk Powder Forecast to Continue Growing in 2013 (1,000 Metric Tons)
") United States Department of Agriculture Foreign Agricultural Service December 2012 China s phenomenal growth as an importer of dry milk products is expected to continue as imports of whole milk powder
United States Department of Agriculture Foreign Agricultural Service December 2012 China s phenomenal growth as an importer of dry milk products is expected to continue as imports of whole milk powder
A Preliminary Assessment of the Economic Benefits of Project Aqua
 A Preliminary Assessment of the Economic Benefits of Project Aqua Appendix AM to Project Aqua: Assessment of Effects on the Environment Final - Cleared for Public Release Date of Report: 31 March 2003
OECD-FAO Agricultural Outlook Methodology
 OECD-FAO AGRICULTURAL OUTLOOK 2018-2027: METHODOLOGY 1 OECD-FAO Agricultural Outlook 2018-2027 Methodology This document provides information on how the projections in the Agricultural Outlook are generated.
International Food Commodity Prices and Missing Dis(Inflation) in the Euro Area
 in the Euro Area") International Food Commodity Prices and Missing Dis(Inflation) in the Euro Area Gert Peersman UGent Motivation Food related items have very large share in Harmonized Index of Consumer Prices HICP Food
International Food Commodity Prices and Missing Dis(Inflation) in the Euro Area Gert Peersman UGent Motivation Food related items have very large share in Harmonized Index of Consumer Prices HICP Food
ECONOMIC ANALYSIS OF THE VALUE OF PASTURE TO THE NEW ZEALAND ECONOMY
 Report to: ECONOMIC ANALYSIS OF THE VALUE OF PASTURE TO THE NEW ZEALAND ECONOMY Prepared by Kel Sanderson Michael Webster Copyright BERL Economic Analysis of the Value of Pasture to the New Zealand Economy
THE RESPONSE OF FINANCIAL AND GOODS MARKETS TO VELOCITY INNOVATIONS: AN EMPIRICAL INVESTIGATION FOR THE US*
 THE RESPONSE OF FINANCIAL AND GOODS MARKETS TO VELOCITY INNOVATIONS: AN EMPIRICAL INVESTIGATION FOR THE US* by Flavio Padrini Ministry of the Treasury, Italy ABSTRACT It is commonly thought that interest
SOYBEANS: LARGE U.S. CROP, WHAT ABOUT SOUTH AMERICA?
 SOYBEANS: LARGE U.S. CROP, WHAT ABOUT SOUTH AMERICA? OCTOBER 2004 Darrel Good 2004 B NO. 8 Summary The USDA now forecasts the 2004 U.S. soybean crop at 3.107 billion bushels, 271 million larger than the
Department of Agricultural and Resource Economics, Fort Collins, CO
 October 2011 EDR 11-01 Department of Agricultural and Resource Economics, Fort Collins, CO 80523-1172 http://dare.colostate.edu/pubs AGRICULTURE ECONOMIC IMPACT OF ENERGY ALTERNATIVES AND CLIMATE CHANGE
Implications of Credit Market Problems for Crop Prices. Darrel Good and Scott Irwin. October 15, 2008 IFEU 08-03
 Implications of Credit Market Problems for Crop Prices Darrel Good and Scott Irwin October 15, 2008 IFEU 08-03 The price of many agricultural commodities has declined markedly from the highs reached in
Alan Bollard: Agriculture, monetary policy and the economy
 Alan Bollard: Agriculture, monetary policy and the economy Speech by Dr Alan Bollard, Governor of the Reserve Bank of New Zealand, to Federated Farmers, Nelson, 18 July 2006. * * * The experience of the
Price and cost indicators for the euro area: an overview
 Price and cost indicators for the euro area: an overview The two pillars of the Eurosystem s monetary policy strategy represent, on the one hand, a prominent role for money, signalled by the announcement
8. Consumption, uncertainty, and the current account
 8. Consumption, uncertainty, and the current account Index: 8. Consumption, uncertainty, and the current account... 8. Introduction... 8. The deterministic case...3 8.3 Optimal consumption under uncertainty...4
FACTOR-AUGMENTED VAR MODEL FOR IMPULSE RESPONSE ANALYSIS
 Nicolae DĂNILĂ, PhD The Bucharest Academy of Economic Studies E-mail: nicolae.danila@fin.ase.ro Andreea ROŞOIU, PhD Student The Bucharest Academy of Economic Studies E-mail: andreea.rosoiu@yahoo.com FACTOR-AUGMENTED
C. Emre Alper Orhan Torul. Abstract
 Oil Prices, aggregate economic activity and global liquidity conditions: evidence from Turkey C. Emre Alper Orhan Torul Bogazici University Bogazici University Abstract When compared to the previous literature
Comments on Oil and Global Adjustment, by Brad Setser
 Comments on Oil and Global Adjustment, by Brad Setser Trevor Reeve February 8, 27 The author is to be commended for pulling together a great many interesting facts and observations. The paper discusses
The U.S. and World Milk Price Outlook: An Improving Prospect?
 The U.S. and World Milk Price Outlook: An Improving Prospect? Mark Stephenson, Ph.D. Director of Dairy Policy Analysis University of Wisconsin, Madison Email: mark.stephenson@wisc.edu Phone: 608-890-3755
No Bernd Hayo and Matthias Neuenkirch. Bank of Canada Communication, Media Coverage, and Financial Market Reactions
 MAGKS Aachen Siegen Marburg Gießen Göttingen Kassel Joint Discussion Paper Series in Economics by the Universities of Aachen Gießen Göttingen Kassel Marburg Siegen ISSN 1867-3678 No. 20-2010 Bernd Hayo
Chapter 3. Introduction to Quantitative Macroeconomics. Measuring Business Cycles. Yann Algan Master EPP M1, 2010
 Chapter 3 Introduction to Quantitative Macroeconomics Measuring Business Cycles Yann Algan Master EPP M1, 2010 1. Traditional framework for Fluctuations Undergraduate textbook model Divide markets into
Corn, Hay, Wheat & Cattle Outlook
 Corn, Hay, Wheat & Cattle Outlook Stephen R. Koontz Associate professor & extension economist Department of Agricultural & Resource Economics Colorado State University Stephen.Koontz@ColoState.Edu http://dare.agsci.colostate.edu/skoontz
Iowa Farm Outlook. July 31, 2006 Ames, Iowa Econ. Info Midyear Cattle Inventory Report
 Iowa Farm Outlook July 31, 2006 Ames, Iowa Econ. Info. 1939 Overview Midyear Cattle Inventory Report USDA released two reports estimating July 1, 2006 cattle inventories; the midyear Cattle report and
Analysis & Comments. Livestock Marketing Information Center State Extension Services in Cooperation with USDA. National Hay Situation and Outlook
 Analysis & Comments Livestock Marketing Information Center State Extension Services in Cooperation with USDA April 2, 2015 Letter #12 www.lmic.info National Hay Situation and Outlook The 2014 calendar
Oral Statement before the United States Senate Committee on Agriculture, Nutrition, and Forestry. Hearing on the trade section of the farm bill
 Oral Statement before the United States Senate Committee on Agriculture, Nutrition, and Forestry Hearing on the trade section of the farm bill April 25, 2001 Bruce A. Babcock Center for Agricultural and
Industry projections 2018 Australian sheep May update
 Industry projections Australian sheep May update KEY POINTS Lamb and mutton slaughter outlook revised higher due to dry conditions Strong international demand is helping to support prices despite increased
Agricultural Price Change
 Agricultural Price Change www.brandonu.ca/rdi/ July 2014 Highlights Farm-gate prices in Manitoba have generally been increasing. However, after an adjustment for inflation, the prices show a general declining
OPINION SURVEYS ON ACTIVITY, PRICES AND LABOUR MARKET DEVELOPMENTS IN THE EURO AREA: FEATURES AND USES
 OPINION SURVEYS ON ACTIVITY, PRICES AND LABOUR MARKET DEVELOPMENTS IN THE EURO AREA: FEATURES AND USES Opinion surveys are an important element in the analysis of the conjunctural situation because of
IN FOCUS: BEEF NOVEMBER Author Phin Ziebell, Agribusiness Economist Photo Carl Davies, CSIRO
 IN FOCUS: BEEF NOVEMBER 217 Author Phin Ziebell, Agribusiness Economist Photo Carl Davies, CSIRO @PhinZiebell Photo Mai Thai KEY POINTS The Australian beef cattle industry has enjoyed a great run over
Energy Efficiency Impact Study
 Energy Efficiency Impact Study for the Preferred Resources Pilot February, 2016 For further information, contact PreferredResources@sce.com 2 1. Executive Summary Southern California Edison (SCE) is interested
April 2013 Livestock Market Update Public Policy Department Budget & Economic Analysis Team
 April 2013 Livestock Market Update Public Policy Department Budget & Economic Analysis Team In this edition: Livestock Update: John Anderson, Deputy Chief Economist Dairy Outlook: Bob Young, Chief Economist
How Much and How Quick? Pass-through of Commodity and Input Cost Changes to U.S. Retail Food Prices by Ephraim Leibtag
 How Much and How Quick? Pass-through of Commodity and Input Cost Changes to U.S. Retail Food Prices by Ephraim Leibtag Power Point Presentation for the International Agricultural Trade Research Consortium
Policy Note August 2015
 Unit Labour Costs, Wages and Productivity in Malta: A Sectoral and Cross-Country Analysis Brian Micallef 1 Policy Note August 2015 1 The author is a Senior Research Economist in the Bank s Modelling and
A risk management framework for assessing climate change impacts, adaptation and vulnerability
 A risk management framework for assessing climate change impacts, adaptation and vulnerability David Cobon, Grant Stone, David McRae and colleagues Queensland Climate Change Centre of Excellence Outline
Slaughter Cow Market and Wholesale Values
 Louisiana Cattle Market Update Friday, July 19 th, 2013 Ross Pruitt, Dep a rtment of Agric ultura l Ec onomic s a nd Agrib usiness LSU Ag Center Slaughter Cow Market and Wholesale Values While there may
Version: 1.0:07/08. abc. General Certificate of Education. Economics ECN2: The National Economy. Mark Scheme examination - June series
 Version: 1.0:07/08 abc General Certificate of Education Economics 5141 ECN2: The National Economy Mark Scheme 2008 examination - June series Mark schemes are prepared by the Principal Examiner and considered,
HOGS VS. ETHANOL: ETHANOL WINS!
 HOGS VS. ETHANOL: ETHANOL WINS! OCTOBER 2006 Chris Hurt 2006 NO. 6 The pork industry s concerns about higher corn prices from the extraordinary growth in corn demand for ethanol appears to be moving from
Was the Deflation of the Depression Anticipated? An Inference Using Real-time Data. Gabriel Mathy, American University 1
 Was the Deflation of the Depression Anticipated? An Inference Using Real-time Data Gabriel Mathy, American University 1 Herman Stekler, George Washington University 2 Abstract Theories that explain the
HOG PROFITS NARROW AS CORN PRICE RISKS RISE
 HOG PROFITS NARROW AS CORN PRICE RISKS RISE APRIL 2006 Chris Hurt 2006 NO. 3 After two years of notable profits, hog producers have started to worry about eroding hog prices and rising risk of higher corn
Vector Space Modeling for Aggregate and Industry Sectors in Kuwait
 Vector Space Modeling for Aggregate and Industry Sectors in Kuwait Kevin Lawler 1 1 Central Statistical Bureau: State of Kuwait/ U.N.D.P Abstract. Trend growth in total factor productivity (TFP) is unobserved;
Dairy Outlook. June By Jim Dunn Professor of Agricultural Economics, Penn State University. Market Psychology
 Dairy Outlook June 2015 By Jim Dunn Professor of Agricultural Economics, Penn State University Market Psychology Cheese prices have been rising this past month, rising 16 cents/lb. in a fairly steady climb.
Economic outcomes of the Kyoto Protocol for New Zealand
 Economic outcomes of the Kyoto Protocol for New Zealand ABARE Report to New Zealand Ministry of Agriculture and Forestry November 2001 1 Introduction In August 2001 the New Zealand Ministry of Agriculture
Agriculture: expansions highlighted developments
 Agriculture: expansions highlighted developments A broad-based expansion in livestock production and another bumper grain harvest highlighted agricultural developments in 1976. Meat production rose 9 percent
SITUATION AND OUTLOOK FOR PRIMARY INDUSTRIES UPDATE JANUARY 2014
 SITUATION AND OUTLOOK FOR PRIMARY INDUSTRIES UPDATE JANUARY 2014 2 SITUATION AND OUTLOOK FOR PRIMARY INDUSTRIES UPDATE JANUARY 2014 HIGHLIGHTS The current year (July 2013 to June 2014) has a revised forecast
CHAPTER II: A Review of the Literature, Historical Retail Meat Price Data, and Some Associated Concepts
 CHAPTER II: A Review of the Literature, Historical Retail Meat Price Data, and Some Associated Concepts 2.1. A Review of the Literature As a myriad of uses and applications of retail meat price data exist,
Veal Price Forecast. October 2015
 Veal Price Forecast October 2015 VEAL PRICE FORECAST OCTOBER 2015 Veal Light Production Veal prices in 2015 have been stronger than anticipated and are expected to continue to show year-over-year increases
PRODUCTION AND INCOME OUTLOOK FOR SLOVENE AGRICULTURE Mateja Kovač 1, Emil Erjavec 2, Stane Kavčič
 PRODUCTION AND INCOME OUTLOOK FOR SLOVENE AGRICULTURE Mateja Kovač 1, Emil Erjavec 2, Stane Kavčič 1. INTRODUCTION Expert analyses and forecasts of economic conditions are a compulsory basis of any appropriate
Weak Oil Prices and the Global Economy
 Journal of Economics and Public Finance ISSN 2377-1038 (Print) ISSN 2377-1046 (Online) Vol. 2, No. 2, 2016 www.scholink.org/ojs/index.php/jepf Weak Oil Prices and the Global Economy Mehdi S. Monadjemi
SYSTEM OF COMPOSITE INDICATORS OF THE ECONOMIC ACTIVITY OF SERBIA (VIPAS) IN SHORT TERM FORECASTING OF GDP
 IN SHORT TERM FORECASTING OF GDP") Statistical Office of the Republic of Serbia SYSTEM OF COMPOSITE INDICATORS OF THE ECONOMIC ACTIVITY OF SERBIA (VIPAS) IN SHORT TERM FORECASTING OF GDP Mr. Goran Katic, professional analyst Statistical
Statistical Office of the Republic of Serbia SYSTEM OF COMPOSITE INDICATORS OF THE ECONOMIC ACTIVITY OF SERBIA (VIPAS) IN SHORT TERM FORECASTING OF GDP Mr. Goran Katic, professional analyst Statistical
Less Obvious Market Impacts of the Zilmax Situation
 Louisiana Cattle Market Update Friday, August 23 rd, 2013 Ross Pruitt, Department of Agricultural Economics and Agribusiness LSU AgCenter Less Obvious Market Impacts of the Zilmax Situation What can be
The next release is scheduled for Friday, August 15, 2014 at 10:00 A.M. (KST) In the U.S Thursday, August 14, 2014 at 9:00 P.M.
 In the U.S Thursday, August 14, 2014 at 9:00 P.M.") FOR RELEASE: 10:00 A.M. KST, FRIDAY, JULY 11, 2014 The Conference Board Korea Business Cycle Indicators SM THE CONFERENCE BOARD LEADING ECONOMIC INDEX (LEI) FOR KOREA AND RELATED COMPOSITE ECONOMIC INDEXES
FOR RELEASE: 10:00 A.M. KST, FRIDAY, JULY 11, 2014 The Conference Board Korea Business Cycle Indicators SM THE CONFERENCE BOARD LEADING ECONOMIC INDEX (LEI) FOR KOREA AND RELATED COMPOSITE ECONOMIC INDEXES
Hog Industry Ask Where All the Pigs Came From?
 Hog Industry Ask Where All the Pigs Came From? January 2002 Chris Hurt The year of 2001 resulted in pork supplies being up 1.1% with prices averaging $45.78 per live hundredweight. Increasing supplies
Price Monitoring for Food Security in the Kyrgyz Republic
 Issue 16 January-February 2017 Price Monitoring for Food Security in the Kyrgyz Republic Monthly monitoring and outlook of basic food prices in the Kyrgyz Republic Highlights and outlook for the next few
MERIT. Short Overview Document. Prepared for: NZTA. Date: June 2016 Status: Draft Final
 MERIT Short Overview Document Prepared for: NZTA Date: June 2016 Status: Draft Final MERIT A Short Overview Document Prepared for New Zealand Transport Agency Authors: Nicola Smith and Garry McDonald Market
Global and Regional Food Consumer Price Inflation Monitoring
 Global and Regional Food Consumer Price Inflation Monitoring October 2013 Issue 2 Global Overview Consumers at global level saw food price inflation up by 6.3 percent in the twelve months to February 2013