Company XYZ X Y Z. Peer Group Contact Center Benchmark. Company
|
|
|
- Veronica Curtis
- 6 years ago
- Views:
Transcription
1 Company XYZ Peer Group Contact Center Benchmark Company X Y Z
2 Report Contents Project Overview and Objectives Page 2 Industry Background Page 34 Performance Benchmarking Summary Page 42 Best Practices Process Assessment Page 66 Interview Themes and Quotes Page 80 Conclusions and Recommendations Page 90 Detailed Benchmarking Comparisons Page 108 Cost Metrics Page 109 Productivity Metrics Page 114 Service Level Metrics Page 125 Quality Metrics Page 132 Agent Metrics Page 139 Contact Handling Metrics Page 156 About MetricNet Page 165 1
3 Project Overview and Objectives 2
4 Project Objectives Review and assess the performance of the Company XYZ Contact Center in St. Louis, MO Benchmark the performance of the Company XYZ Contact Center against a peer group of comparable Contact Centers Conduct a best-practices process assessment Recommend strategies for improved performance Achieve world-class levels of support Maximize customer satisfaction 3
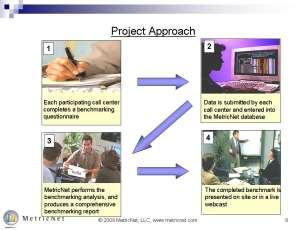
5 Project Approach Module 1: Company XYZ Baselining / Data Collection Module 2: Benchmarking and Gap Analysis Module 3: Balanced Scorecard Module 4: Best Practices Process Assessment Module 5: Strategies for Improved Performance Module 6: Report Development and Presentation of Results 4
6 Module 1: Company XYZ Baselining/Data Collection Core Topics Project Kickoff Data Collection Personnel Interviews 5
7 Project Kickoff Meeting Key Objectives: Project Kickoff Meeting Introduce the MetricNet and Company XYZ project teams Discuss the project schedule Discuss the data collection process Answer questions about the project Company XYZ 6

8 Data Collection 7


9 Interviews Agents, team leads, supervisors QA/QC, workforce schedulers, trainers Personnel Interviews Company XYZ 8
10 Module 2: Benchmarking and Gap Analysis Core Topics Peer Group Selection Benchmarking Comparison Gap Analysis 9


11 Benchmarking Peer Group Selection Scope Scale Complexity IDEAL PEER GROUP Geography Read MetricNet s whitepaper on Benchmarking Peer Group Selection. Go to to get your copy! 10
12 Dynamic Peer Group Selection Scope Scale Complexity Geography Scope refers to the services offered by the Contact Center. The broader the scope of services offered, the broader the skill set required by the agents. As scope increases, so too does the cost of providing those services. The Contact Centers selected for comparison must be comparable in the scope of services offered. Volume refers to the number of contacts handled by the Contact Center. Virtually everything in the Contact Center is subject to scale economies. This is particularly true when it comes to the volume of contacts handled. The approximate scale effect for volume is 5%. What this means is that every time the number of transactions doubles, you should expect to see the Cost per Contact decline by 5%. For this reason, it is important to select peer groups that are similar in scale. The complexity of transactions handled will influence the handle time, and hence the cost per transaction. For example, an address change is a simple transaction that takes very little time, and costs very little to resolve. By contrast, an inquiry for a complex issue such as a lost or stolen card resulting in unauthorized charges takes much longer and costs much more to resolve. MetricNet uses a proprietary algorithm to determine a weighted complexity index based upon the mix of transactions handled by a Contact Center. The companies chosen for a peer group will have similar complexity factors. The main factor that is affected by geography is cost; specifically labor cost. Since labor accounts for 65% of Contact Center operating expense, it is important to compare performance with Contact Centers that have a common geography. Even within a particular geography, wage rates can differ significantly, so MetricNet makes adjustments to ensure that each Contact Center in a peer group is normalized to the same wage rate. 11


13 Contact Center Benchmark: Key Questions Answered Key Questions How is your Contact Center performing? How does your Contact Center compare to other comparable Contact Centers? MetricNet s Database of Process and Performance Indicators Company XYZ Contact Center Data What are the strengths and weaknesses of your Contact Center? What are the areas of improvement for your Contact Center? How can you enhance Contact Center performance and achieve world-class status? Contact Center Benchmark Gap Analysis Improvement Recommendations Realized Performance Gains 12

14 The Benchmarking Methodology Company XYZ Contact Center Performance COMPARE Performance of Benchmarking Peer Group Determine How Best in Class Achieve Superiority Adopt Selected Practices of Best in Class Build a Sustainable Competitive Advantage The ultimate objective of benchmarking Read MetricNet s whitepaper on Benchmarking Defined. Go to to receive your copy! 13
15 Summary of Included Benchmarking Metrics Cost Productivity Service Level Cost per Inbound Contact Cost per Minute of Inbound Handle Time Inbound Contacts per Agent per Month Outbound Contacts per Agent per Month Average Speed of Answer (ASA) % of Calls Answered in 30 Seconds Agent Utilization Call Abandonment Rate Agent as a % of Total Headcount Quality Agent Contact Handling Call Quality Net First Contact Resolution Rate Customer Satisfaction Annual Agent Turnover Daily Agent Absenteeism Agent Occupancy Schedule Adherence New Agent Training Hours Annual Agent Training Hours Agent Tenure Inbound Contact Handle Time Outbound Contact Handle Time Outbound Contacts as a % of Total Contacts IVR Containment Rate Agent Job Satisfaction 14
16 Metric Type Cost Productivity Service Level Quality Agent Benchmarking KPI Performance Summary Key Performance Indicator (KPI) Company XYZ Peer Group Statistics Average Min Median Max Cost per Inbound Contact $12.23 $9.97 $6.86 $9.58 $15.99 Cost per Minute of Inbound Handle Time $1.66 $1.39 $0.95 $1.41 $1.95 Inbound Contacts per Agent per Month Outbound Contacts per Agent per Month Agent Utilization 49.6% 51.2% 37.7% 50.2% 64.0% Agents as a % of Total Headcount 75.5% 76.8% 68.4% 75.7% 87.3% Average Speed of Answer (seconds) % of Calls Answered in 30 Seconds 59.8% 58.0% 13.4% 58.2% 92.2% Call Abandonment Rate 6.9% 8.4% 0.7% 6.2% 25.6% Call Quality 85.4% 84.8% 71.5% 84.8% 95.3% Net First Contact Resolution Rate 71.2% 66.8% 55.9% 66.5% 78.9% Customer Satisfaction 83.3% 77.4% 67.9% 77.3% 91.3% Annual Agent Turnover 32.6% 40.6% 26.7% 38.2% 69.6% Daily Agent Absenteeism 6.2% 11.1% 4.6% 10.9% 19.1% Agent Occupancy 80.8% 74.6% 55.1% 76.1% 88.7% Schedule Adherence 89.5% 86.0% 77.0% 86.3% 96.1% New Agent Training Hours Annual Agent Training Hours Agent Tenure (months) Agent Job Satisfaction 84.2% 75.4% 61.8% 75.5% 85.1% Inbound Contact Handle Time (minutes) Outbound Contact Handle Time (minutes) Contact Handling Outbound Contacts as a % of Total Contacts 4.3% 9.3% 3.6% 9.5% 18.6% IVR Containment Rate 18.7% 28.3% 0.0% 25.4% 60.5% 15
17 Quality (Effectiveness) Sample report only. Data is not accurate. Cost vs. Quality for Company XYZ Contact Center Higher Quality Middle Quartiles Effective but not Efficient Top Quartile Efficient and Effective Company XYZ Global Database Lower Quality Lower Quartile Middle Quartiles Efficient but not Effective Higher Cost Cost (Efficiency) Lower Cost 16
18 Module 3: Balanced Scorecard Core Topics Metrics Selection Metric Weightings Scorecard Construction 17
19 Company XYZ Contact Center Balanced Scorecard Performance Metric Metric Weighting Performance Range Worst Case Best Case Your Actual Performance Metric Score Balanced Score Cost per Inbound Contact 25.0% $15.99 $6.86 $ % 10.3% Customer Satisfaction 25.0% 67.9% 91.3% 83.3% 65.8% 16.5% Agent Utilization 15.0% 37.7% 64.0% 49.6% 45.1% 6.8% Net First Contact Resolution Rate 15.0% 55.9% 78.9% 71.2% 66.7% 10.0% Agent Job Satisfaction 10.0% 61.8% 85.1% 84.2% 96.4% 9.6% Average Speed of Answer (seconds) 10.0% % 6.2% Total 100.0% N/A N/A N/A N/A 59.3% Step 1 Six critical performance metrics have been selected for the scorecard. Step 2 Each metric has been weighted according to its relative importance. Step 3 For each performance metric, the highest and lowest performance levels in the benchmark are recorded. Step 4 Your actual performance for each metric is recorded in this column. Step 5 Your score for each metric is then calculated: (worst case - actual performance) (worst case best case) 100 Step 6 Your balanced score for each metric is calculated: metric score weighting 18
20 Balanced Scores Sample report only. Data is not accurate. Balanced Scorecard Summary 90.0% 85.0% 80.0% 75.0% 70.0% 65.0% 60.0% 55.0% #10 Key Statistics Contact Center Scores High 82.6% Average 53.8% Median 55.9% Low 29.8% Company XYZ 59.3% 50.0% 45.0% 40.0% 35.0% 30.0% 25.0% 20.0% 15.0% 10.0% 5.0% 0.0% Contact Center *The scores shown in the chart are based upon the performance metrics, weightings, and data ranges shown on the previous page. 19
21 Balanced Score Sample report only. Data is not accurate. The Scorecard Can be Updated Monthly 85% 80% 75% 70% 65% 60% 55% 50% 45% 40% Jan Feb Mar Apr May Jun Jul Aug Sep Oct Nov Dec 12 Month Average Monthly Score * Sample Only 20
22 Module 4: Best Practices Process Assessment Core Components Company XYZ Self- Assessment MetricNet Maturity Ranking Process Assessment Rollup 21
23 Six-Part Model for Contact Center Best Practices Model Component Definition Strategy Strategy Defining Your Charter and Mission Stakeholder Communication Customer Enthusiasm Human Resources Human Resources Proactive, Life-Cycle Management of Personnel Process Expeditious Delivery of Customer Service Performance Measurement Technology Process Technology Leveraging People and Processes Performance Measurement A Holistic Approach to Performance Measurement Stakeholder Communication Proactively Managing Stakeholder Expectations 22
24 Best Practices Evaluation Criteria Ranking Explanation 1 No Knowledge of the Best Practice. 2 Aware of the Best Practice, but not applying it. 3 Aware of the Best Practice, and applying at a rudimentary level. 4 Best Practice is being effectively applied. 5 Best Practice is being applied in a world-class fashion. 23
25 Company XYZ Process Self-Assessment Best Practice Strategy Best Practices Defined Company XYZ's Score Peer Group Average The Contact Center has a well-defined mission, vision, and strategy. The vision and strategy are well-documented, and communicated to key stakeholders in the organization. The Contact Center has an action plan for continuous improvement. The plan is documented and 2 distributed to key stakeholders in the organization, and specific individuals are held accountable for implementing the action plan. The Contact Center is well integrated into the company value chain. The Contact Center acts as 3 the "voice of the customer," and is involved in product decisions and deliberations that affect customers. The Contact Center is alerted ahead of time so that they can prepare for major product changes and marketing campaigns. The Contact Center has SLA's that define the level of service to be delivered to customers. The SLA's are documented, published, and communicated to key stakeholders in the organization. The Contact Center has OLA's (Operating Level Agreements) with other support groups in the 5 organization (information technology, desktop support, field support, etc.). The OLA's clearly define the roles and responsibilities of each support group, and the different support groups abide by the terms of the OLA's. The Contact Center actively seeks to improve First Contact Resolution Rates, Level 0 Resolution 6 Rates (Customer Self-Help), and Level -1 (Contact Prevention) Resolution Rates by implementing processes, technologies, and training that facilitate these objectives. Summary Statistics Total Score Average Score
26 Average Score 5.0 Sample report only. Data is not accurate. Best Practices Process Self-Assessment Summary Company XYZ Peer Group 25
27 World-Class = 75.0% Balanced Score Average = 38.8% Sample report only. Data is not accurate. Process Maturity vs. Scorecard Performance 100% 90% 80% Company XYZ Performance Process Assessment Score 63.4% Balanced Score 59.3% 70% 60% 50% 40% 30% 20% Average = 53.8% 10% Company XYZ Global Database 0% 0% 10% 20% 30% 40% 50% 60% 70% 80% 90% 100% Process Assessment Score 26
28 Module 5: Strategies for Improved Performance Core Components Conclusions and Recommendations Roadmap for World- Class Performance 27
29 Conclusions and Recommendations Conclusions and Recommendations fall into six categories 1. Strategy 2. Human Resource Management 3. Call Handling Processes and Procedures 4. Technology 5. Performance Measurement and Management 6. Stakeholder Communication 28
30 Contact Center KPI Correlations Drive Conclusions Cost per Contact Customer Satisfaction Agent Utilization First Contact Resolution Scheduling Efficiency Service Levels: ASA and AR Agents/ Total FTE s Absenteeism/ Turnover IVR Containment Handle Time Call Quality Agent Satisfaction Coaching Career Path Training Hours 29
31 Performance Targets Will be Established Performance Metric Current Company XYZ Performance Target Performance Agent Utilization 49.6% 55.0% Cost per Inbound Contact $12.23 $11.58 Cost per Minute of Inbound Handle Time $1.66 $1.58 Inbound Contacts per Agent per Month Outbound Contacts per Agent per Month Average Speed of Answer (seconds) Call Abandonment Rate 6.9% 8.0% IVR Containment Rate 18.7% 30.0% Balanced Score 59.3% 63.6% Achieving the performance targets recommended above would increase the Company XYZ Contact Center Balanced Score from 59.3% to 63.6%, and would elevate Company XYZ from 10 th place to 6 th place (top quartile!) on the Balanced Scorecard. 30
32 Module 6: Report Development and Presentation of Results Core Topics Report Development Presentation of Benchmarking Results 31


33 Write Benchmarking Report 32
34 MetricNet will present the results of the benchmark in a live GoToMeeting. Presentation of Results Company XYZ 33
35 Industry Background 34


36 An Industry in Transition Every Company Faces Increasing Pressure from Numerous Sources Industry Consolidation Increased Regulatory Scrutiny (e.g. SOX) The emergence of virtual business Growing importance of customer contact! One-Stop Shopping Shareholder pressure Budgetary constraints Increasingly demanding customers Greater customer choice and leverage 35

37 Customer Contact: A Critical Interface! JAN FEB MAR APR MAY JUN JUL AUG SEP OCT NOV DEC 8760 Hours Customer expectation is that you are available 24 X 7, and provide flawless service, on demand! Yet most companies have minimal direct contact with their customers Customer Contact 7-22 minutes/yr. Moment of Truth Opportunity! 36
38 Building a Service-Based Competitive Advantage! A Fundamental Shift OLD PARADIGM Contact Center is a support function Customer contact is a necessary evil Supplement to traditional bricks & mortar facilities Play catch-up with customer needs and expectations reactive! Goal is customer satisfaction NEW PARADIGM Contact Center is a source of value creation Customer contact is a company and product differentiator Replacement for traditional bricks & mortar facilities Stay ahead of customer needs and expectations proactive! Goal is customer enthusiasm, product differentiation, and customer aggregation 37
39 Contact Centers Must Evolve to Survive Support Stage Transitional Stage Strategic Stage Progression along this dimension is critical to success Contact Centers that stay in one place too long risk obsolescence The most effective Contact Centers continually strive to add more value by moving to the right along this axis World-class Contact Centers also have specific plans for how they will continuously improve the quality of contact with their customers Customer needs and requirements are evolving too quickly Competitors can exploit any complacency marked by a Contact Center s failure to evolve Staying ahead of customer needs and expectations Continuously differentiate the underlying products supported 38

40 How Far Has Your Contact Center Evolved? 67% 29% 4% Support Stage Transitional Stage Strategic Stage Traditional customer contact paradigm The Contact Center makes a shift from following the customer to leading the customer The Contact Center operates in a non-traditional customer contact paradigm every transaction adds value! 39
41 Characteristics of a World-Class Contact Center Contact Center consistently exceeds customer expectations regardless of the transaction type Result is high levels of customer satisfaction Call quality is consistently high Business value is managed at or above industry average levels Cost per Contact is below industry average levels Revenue generated is above industry average levels Telemarketing and telesales Debt collections Contact Center follows industry best practices Industry best practices are defined and documented Contact Center follows industry best practices Every transaction adds value A positive customer experience Improves customer loyalty Creates positive brand awareness and switching costs 40
42 The Goal of Benchmarking Higher AFTER Benchmarking BEST-IN-CLASS PERFORMANCE CURVE BELOW-AVERAGE PERFORMANCE CURVE STARTING POINT: Before Benchmarking Lower Cost per Contact Higher 41
43 Performance Benchmarking Summary 42
44 Company XYZ Contact Center Overview Contact Center Location(s) St. Louis, MO Hours of Operation 7 AM 10 PM, 7 days/week Data Time Period January 2017 December 2017 Annual Operating Expense $10,304,235 Monthly Inbound Contact Volume Voice Chat Other Total 37,243 17,501 14, ,187 Monthly Outbound Contact Volume 3,169 FTE Personnel Headcount Technology Profile Agent Level Customer Information System (CIS) IBM Initiate Master Data Svc Agent Level Automatic Call Distributor (ACD) Avaya Aura Contact Center Supervisor/Team Lead 16.0 Interactive Voice Response (IVR) System Avaya Aura Contact Center Manager 3.0 Workforce Management/Scheduling cc-modeler Professional QA/QC 9.5 Call Quality Verint Training 5.0 Workforce Scheduling 2.0 Total
45 Summary of Included Benchmarking Metrics Cost Productivity Service Level Cost per Inbound Contact Cost per Minute of Inbound Handle Time Inbound Contacts per Agent per Month Outbound Contacts per Agent per Month Average Speed of Answer (ASA) % of Calls Answered in 30 Seconds Agent Utilization Call Abandonment Rate Agent as a % of Total Headcount Quality Agent Contact Handling Call Quality Net First Contact Resolution Rate Customer Satisfaction Annual Agent Turnover Daily Agent Absenteeism Agent Occupancy Schedule Adherence New Agent Training Hours Annual Agent Training Hours Agent Tenure Inbound Contact Handle Time Outbound Contact Handle Time Outbound Contacts as a % of Total Contacts IVR Containment Rate Agent Job Satisfaction 44
46 Metric Type Cost Productivity Service Level Quality Agent Benchmarking KPI Performance Summary Key Performance Indicator (KPI) Company XYZ Peer Group Statistics Average Min Median Max Cost per Inbound Contact $12.23 $9.97 $6.86 $9.58 $15.99 Cost per Minute of Inbound Handle Time $1.66 $1.39 $0.95 $1.41 $1.95 Inbound Contacts per Agent per Month Outbound Contacts per Agent per Month Agent Utilization 49.6% 51.2% 37.7% 50.2% 64.0% Agents as a % of Total Headcount 75.5% 76.8% 68.4% 75.7% 87.3% Average Speed of Answer (seconds) % of Calls Answered in 30 Seconds 59.8% 58.0% 13.4% 58.2% 92.2% Call Abandonment Rate 6.9% 8.4% 0.7% 6.2% 25.6% Call Quality 85.4% 84.8% 71.5% 84.8% 95.3% Net First Contact Resolution Rate 71.2% 66.8% 55.9% 66.5% 78.9% Customer Satisfaction 83.3% 77.4% 67.9% 77.3% 91.3% Annual Agent Turnover 32.6% 40.6% 26.7% 38.2% 69.6% Daily Agent Absenteeism 6.2% 11.1% 4.6% 10.9% 19.1% Agent Occupancy 80.8% 74.6% 55.1% 76.1% 88.7% Schedule Adherence 89.5% 86.0% 77.0% 86.3% 96.1% New Agent Training Hours Annual Agent Training Hours Agent Tenure (months) Agent Job Satisfaction 84.2% 75.4% 61.8% 75.5% 85.1% Inbound Contact Handle Time (minutes) Outbound Contact Handle Time (minutes) Contact Handling Outbound Contacts as a % of Total Contacts 4.3% 9.3% 3.6% 9.5% 18.6% IVR Containment Rate 18.7% 28.3% 0.0% 25.4% 60.5% 45
47 KPI Gap Summary Metric Type Key Performance Indicator (KPI) Company XYZ Peer Average Performance Gap Cost Productivity Service Level Quality Agent Cost per Inbound Contact $12.23 $ % Cost per Minute of Inbound Handle Time $1.66 $ % Inbound Contacts per Agent per Month % Outbound Contacts per Agent per Month % Agent Utilization 49.6% 51.2% -3.3% Agents as a % of Total Headcount 75.5% 76.8% -1.7% Average Speed of Answer (seconds) % % of Calls Answered in 30 Seconds 59.8% 58.0% 3.2% Call Abandonment Rate 6.9% 8.4% 18.0% Call Quality 85.4% 84.8% 0.8% Net First Contact Resolution Rate 71.2% 66.8% 6.6% Customer Satisfaction 83.3% 77.4% 7.6% Annual Agent Turnover 32.6% 40.6% 19.7% Daily Agent Absenteeism 6.2% 11.1% 44.2% Agent Occupancy 80.8% 74.6% 8.3% Schedule Adherence 89.5% 86.0% 4.0% New Agent Training Hours % Annual Agent Training Hours % Agent Tenure (months) % Agent Job Satisfaction 84.2% 75.4% 11.7% Inbound Contact Handle Time (minutes) % Outbound Contact Handle Time (minutes) % Contact Handling Outbound Contacts as a % of Total Contacts 4.3% 9.3% 53.5% IVR Containment Rate 18.7% 28.3% -33.9% 46
48 KPI Gap Ranking Key Performance Indicator (KPI) Company XYZ Peer Average Performance Gap Outbound Contacts per Agent per Month % Outbound Contacts as a % of Total Contacts 4.3% 9.3% 53.5% Annual Agent Training Hours % Daily Agent Absenteeism 6.2% 11.1% 44.2% Agent Tenure (months) % Annual Agent Turnover 32.6% 40.6% 19.7% Call Abandonment Rate 6.9% 8.4% 18.0% Agent Job Satisfaction 84.2% 75.4% 11.7% Agent Occupancy 80.8% 74.6% 8.3% Customer Satisfaction 83.3% 77.4% 7.6% Net First Contact Resolution Rate 71.2% 66.8% 6.6% Schedule Adherence 89.5% 86.0% 4.0% % of Calls Answered in 30 Seconds 59.8% 58.0% 3.2% Call Quality 85.4% 84.8% 0.8% Agents as a % of Total Headcount 75.5% 76.8% -1.7% Agent Utilization 49.6% 51.2% -3.3% Inbound Contact Handle Time (minutes) % Inbound Contacts per Agent per Month % Outbound Contact Handle Time (minutes) % Average Speed of Answer (seconds) % Cost per Minute of Inbound Handle Time $1.66 $ % Cost per Inbound Contact $12.23 $ % IVR Containment Rate 18.7% 28.3% -33.9% New Agent Training Hours % 47
49 Quartile Rankings: Cost and Productivity Metrics Cost Metrics Cost per Inbound Contact Cost per Minute of Inbound Handle Time 1 (Top) $6.86 $8.81 $9.58 $11.04 $8.81 $9.58 Quartile 2 3 $11.04 $15.99 $0.95 $1.18 $1.41 $1.59 $1.18 $1.41 $1.59 $ (Bottom) Company XYZ Performance $12.23 $1.66 Productivity Metric Inbound Contacts per Agent per Month Outbound Contacts per Agent per Month Agent Utilization Agents as a % of Total Headcount 1 (Top) Quartile % 55.2% 50.2% 47.3% 55.2% 50.2% 47.3% 37.7% 87.3% 82.4% 75.7% 72.6% (Bottom) 82.4% 75.7% 72.6% 68.4% 4 Company XYZ Performance % 75.5% 48
50 Quartile Rankings: Service Level and Quality Metrics Service Level Metric Average Speed of Answer (seconds) % of Calls Answered in 30 Seconds Call Abandonment Rate 1 (Top) Quartile % 79.2% 58.2% 41.7% 79.2% 58.2% 41.7% 13.4% 0.7% 2.7% 6.2% 13.2% (Bottom) 2.7% 6.2% 13.2% 25.6% 4 Company XYZ Performance % 6.9% Quality Metric Call Quality Net First Contact Resolution Rate Customer Satisfaction 1 (Top) 95.3% 87.5% 84.8% 81.8% 87.5% 84.8% Quartile % 71.5% 78.9% 70.4% 66.5% 63.2% 70.4% 66.5% 63.2% 55.9% 91.3% 80.3% 77.3% 73.6% (Bottom) 80.3% 77.3% 73.6% 67.9% 4 Company XYZ Performance 85.4% 71.2% 83.3% 49
51 Quartile Rankings: Agent Metrics Agent Metrics Annual Agent Turnover Daily Agent Absenteeism Agent Occupancy Schedule Adherence New Agent Training Hours Annual Agent Training Hours Agent Tenure (months) Agent Job Satisfaction 1 (Top) 26.7% 32.4% Quartile % 44.5% 32.4% 38.2% 44.5% 69.6% 4.6% 8.9% 10.9% 14.0% 8.9% 10.9% 14.0% 19.1% 88.7% 78.6% 76.1% 69.9% 96.1% 89.5% 86.3% 82.0% 89.5% 86.3% 82.0% 77.0% % 80.4% 75.5% 71.9% 80.4% 75.5% 71.9% 61.8% 4 (Bottom) 78.6% 76.1% 69.9% 55.1% Company XYZ Performance 32.6% 6.2% 80.8% 89.5% % 50
52 Quartile Rankings: Contact Handling Metrics Contact Handling Metric Inbound Contact Handle Time (minutes) Outbound Contact Handle Time (minutes) Outbound Contacts as a % of Total Contacts IVR Containment Rate 1 (Top) Quartile % 7.2% 9.5% 11.1% 7.2% 9.5% 11.1% 18.6% 60.5% 44.9% 25.4% 11.6% (Bottom) 44.9% 25.4% 11.6% 0.0% 4 Company XYZ Performance % 18.7% 51
53 The Contact Center Balanced Scorecard: An Overview The Contact Center balanced scorecard employs a methodology that provides you with a single, all-inclusive measure of your Contact Center performance. It combines cost, quality, productivity, agent, and service-level metrics into an overall performance indicator for your Contact Center. Your Contact Center score will range between 0 and 100%, and can be compared directly to the scores of other data records in the benchmark. By computing your overall score on a monthly or quarterly basis, you can track and trend your performance over time. Charting and tracking your Contact Center balanced score is an ideal way to ensure continuous improvement in your Contact Center! 52
54 Company XYZ Contact Center Balanced Scorecard Performance Metric Metric Weighting Performance Range Worst Case Best Case Your Actual Performance Metric Score Balanced Score Cost per Inbound Contact 25.0% $15.99 $6.86 $ % 10.3% Customer Satisfaction 25.0% 67.9% 91.3% 83.3% 65.8% 16.5% Agent Utilization 15.0% 37.7% 64.0% 49.6% 45.1% 6.8% Net First Contact Resolution Rate 15.0% 55.9% 78.9% 71.2% 66.7% 10.0% Agent Job Satisfaction 10.0% 61.8% 85.1% 84.2% 96.4% 9.6% Average Speed of Answer (seconds) 10.0% % 6.2% Total 100.0% N/A N/A N/A N/A 59.3% Step 1 Six critical performance metrics have been selected for the scorecard. Step 2 Each metric has been weighted according to its relative importance. Step 3 For each performance metric, the highest and lowest performance levels in the benchmark are recorded. Step 4 Your actual performance for each metric is recorded in this column. Step 5 Your score for each metric is then calculated: (worst case - actual performance) (worst case best case) 100 Step 6 Your balanced score for each metric is calculated: metric score weighting 53
55 Scorecard KPI Performance Spectrum Worst KPI Performance Best KPI Performance Cost/Contact 41.1% Customer Sat. 65.8% Agent Utilization 45.1% Net FCR 66.7% Agent Job Sat. 96.4% ASA 61.5% Balanced Score 59.3% 0% 10% 20% 30% 40% 50% 60% 70% 80% 90% 100% 54
56 Balanced Scores Sample report only. Data is not accurate. Balanced Scorecard Summary 90.0% 85.0% 80.0% 75.0% 70.0% 65.0% 60.0% 55.0% #10 Key Statistics Contact Center Scores High 82.6% Average 53.8% Median 55.9% Low 29.8% Company XYZ 59.3% 50.0% 45.0% 40.0% 35.0% 30.0% 25.0% 20.0% 15.0% 10.0% 5.0% 0.0% Contact Center *The scores shown in the chart are based upon the performance metrics, weightings, and data ranges shown on the previous page. 55
57 Peer Group Scorecard Summary Data The next two pages illustrate the benchmarking peer group performance for each KPI in the scorecard. Page 57 ranks each Contact Center from best performer (Contact Center #16) to worst performer (Contact Center #22) based upon their balanced scores. Page 58 ranks each KPI in the scorecard from best (top row) to worst (bottom row). 56
58 Scorecard Performance Rankings Overall Ranking Contact Center Number Cost per Inbound Contact Customer Satisfaction Scorecard Metrics Agent Utilization Net First Contact Resolution Rate Agent Job Satisfaction Average Speed of Answer (seconds) Total Balanced Score 1 16 $ % 56.5% 77.5% 84.5% % 2 1 $ % 54.7% 78.9% 85.1% % 3 4 $ % 54.5% 72.2% 84.5% % 4 6 $ % 60.2% 71.7% 79.4% % 5 20 $ % 50.2% 72.9% 78.1% % 6 23 $ % 58.1% 66.5% 74.8% % 7 13 $ % 50.2% 67.1% 81.1% % 8 21 $ % 55.2% 66.3% 75.7% % 9 10 $ % 52.4% 69.3% 71.9% % 10 Company XYZ $ % 49.6% 71.2% 84.2% % 11 2 $ % 46.1% 70.4% 70.3% % $ % 45.9% 69.2% 83.6% % 13 9 $ % 64.0% 66.9% 75.4% % $ % 42.7% 68.6% 75.5% % $ % 56.1% 65.7% 62.1% % 16 3 $ % 44.6% 65.1% 75.9% % 17 5 $ % 56.6% 64.5% 73.9% % $ % 47.3% 62.0% 72.3% % $ % 52.2% 61.9% 67.8% % $ % 46.8% 62.4% 76.0% % 21 8 $ % 49.6% 57.2% 71.0% % $ % 49.1% 63.2% 73.6% % $ % 50.8% 58.9% 67.0% % 24 7 $ % 50.1% 55.9% 61.8% % $ % 37.7% 64.1% 80.4% % Average $ % 51.2% 66.8% 75.4% % Key Statistics Max $ % 64.0% 78.9% 85.1% % Min $ % 37.7% 55.9% 61.8% % Median $ % 50.2% 66.5% 75.5% % 57
59 KPI Data in Rank Order Scorecard Metrics Cost per Inbound Customer Net First Contact Agent Job Average Speed of Total Balanced Agent Utilization Contact Satisfaction Resolution Rate Satisfaction Answer (seconds) Score Company XYZ $ % 49.6% 71.2% 84.2% % Ranking Quartile $ % 64.0% 78.9% 85.1% % 2 $ % 60.2% 77.5% 84.5% % 3 $ % 58.1% 72.9% 84.5% % 4 $ % 56.6% 72.2% 84.2% % 5 $ % 56.5% 71.7% 83.6% % 6 $ % 56.1% 71.2% 81.1% % 7 $ % 55.2% 70.4% 80.4% % 8 $ % 54.7% 69.3% 79.4% % 9 $ % 54.5% 69.2% 78.1% % 10 $ % 52.4% 68.6% 76.0% % 11 $ % 52.2% 67.1% 75.9% % 12 $ % 50.8% 66.9% 75.7% % 13 $ % 50.2% 66.5% 75.5% % 14 $ % 50.2% 66.3% 75.4% % 15 $ % 50.1% 65.7% 74.8% % 16 $ % 49.6% 65.1% 73.9% % 17 $ % 49.6% 64.5% 73.6% % 18 $ % 49.1% 64.1% 72.3% % 19 $ % 47.3% 63.2% 71.9% % 20 $ % 46.8% 62.4% 71.0% % 21 $ % 46.1% 62.0% 70.3% % 22 $ % 45.9% 61.9% 67.8% % 23 $ % 44.6% 58.9% 67.0% % 24 $ % 42.7% 57.2% 62.1% % 25 $ % 37.7% 55.9% 61.8% % Average $ % 51.2% 66.8% 75.4% % Max $ % 64.0% 78.9% 85.1% % Min $ % 37.7% 55.9% 61.8% % Median $ % 50.2% 66.5% 75.5% % 58
60 Cost per Inbound Contact Sample report only. Data is not accurate. Scorecard Metrics: Cost per Inbound Contact $18.00 $16.00 $14.00 $12.00 Key Statistics Cost per Inbound Contact High $15.99 Average $9.97 Median $9.58 Low $6.86 Company XYZ $12.23 $10.00 $8.00 $6.00 $4.00 $2.00 $0.00 Contact Center 59
61 Customer Satisfaction Sample report only. Data is not accurate. Scorecard Metrics: Customer Satisfaction 100.0% 90.0% 80.0% Key Statistics Customer Satisfaction High 91.3% Average 77.4% Median 77.3% Low 67.9% Company XYZ 83.3% 70.0% 60.0% 50.0% 40.0% Contact Center 60
62 Agent Utilization Sample report only. Data is not accurate. Scorecard Metrics: Agent Utilization 70.0% 65.0% 60.0% 55.0% Key Statistics Agent Utilization High 64.0% Average 51.2% Median 50.2% Low 37.7% Company XYZ 49.6% 50.0% 45.0% 40.0% 35.0% 30.0% 25.0% 20.0% Contact Center 61
63 Net First Contact Resolution Rate Sample report only. Data is not accurate. Scorecard Metrics: Net First Contact Resolution Rate 85.0% 80.0% 75.0% 70.0% 65.0% Key Statistics Net First Contact Resolution Rate High 78.9% Average 66.8% Median 66.5% Low 55.9% Company XYZ 71.2% 60.0% 55.0% 50.0% 45.0% 40.0% 35.0% 30.0% Contact Center 62
64 Agent Job Satisfaction Sample report only. Data is not accurate. Scorecard Metrics: Agent Job Satisfaction 90.0% 85.0% 80.0% 75.0% Key Statistics Agent Job Satisfaction High 85.1% Average 75.4% Median 75.5% Low 61.8% Company XYZ 84.2% 70.0% 65.0% 60.0% 55.0% 50.0% Contact Center 63
65 Average Speed of Answer (seconds) 160 Sample report only. Data is not accurate. Scorecard Metrics: Average Speed of Answer Key Statistics Average Speed of Answer (seconds) High 151 Average 57 Median 41 Low 6 Company XYZ Contact Center 64
66 Quality (Effectiveness) Sample report only. Data is not accurate. Cost vs. Quality for Company XYZ Contact Center Higher Quality Middle Quartiles Effective but not Efficient Top Quartile Efficient and Effective Company XYZ Global Database Lower Quality Lower Quartile Middle Quartiles Efficient but not Effective Higher Cost Cost (Efficiency) Lower Cost 65
67 Best Practices Process Assessment 66
68 Six-Part Model for Contact Center Best Practices Model Component Definition Strategy Strategy Defining Your Charter and Mission Stakeholder Communication Customer Enthusiasm Human Resources Human Resources Proactive, Life-Cycle Management of Personnel Process Expeditious Delivery of Customer Service Performance Measurement Technology Process Technology Leveraging People and Processes Performance Measurement A Holistic Approach to Performance Measurement Stakeholder Communication Proactively Managing Stakeholder Expectations 67
69 Best Practices Evaluation Criteria Ranking Explanation 1 No Knowledge of the Best Practice. 2 Aware of the Best Practice, but not applying it. 3 Aware of the Best Practice, and applying at a rudimentary level. 4 Best Practice is being effectively applied. 5 Best Practice is being applied in a world-class fashion. 68
70 MetricNet Has Defined 56 Contact Center Best Practices Strategy 6 Best Practices Human Resources 13 Best Practices Process 12 Best Practices Technology Performance Measurement 11 Best Practices Communication 6 Best Practices 8 Best Practices Total Score from 56 to 280 (converted to scale of 0 to 100%) The lowest score possible on the Best Practices Process Assessment is 56: Maturity Level 1 X 56 Best Practices = 56 (0%) The highest score possible on the Best Practices Process Assessment is 360: Maturity Level 5 X 56 Best Practices = 280 (100%) 69
71 Strategy: 6 Best Practices Best Practice Strategy Best Practices Defined Company XYZ's Score Peer Group Average The Contact Center has a well-defined mission, vision, and strategy. The vision and strategy are well-documented, and communicated to key stakeholders in the organization. The Contact Center has an action plan for continuous improvement. The plan is documented and 2 distributed to key stakeholders in the organization, and specific individuals are held accountable for implementing the action plan. The Contact Center is well integrated into the company value chain. The Contact Center acts as 3 the "voice of the customer," and is involved in product decisions and deliberations that affect customers. The Contact Center is alerted ahead of time so that they can prepare for major product changes and marketing campaigns. The Contact Center has SLA's that define the level of service to be delivered to customers. The SLA's are documented, published, and communicated to key stakeholders in the organization. The Contact Center has OLA's (Operating Level Agreements) with other support groups in the 5 organization (information technology, desktop support, field support, etc.). The OLA's clearly define the roles and responsibilities of each support group, and the different support groups abide by the terms of the OLA's. The Contact Center actively seeks to improve First Contact Resolution Rates, Level 0 Resolution 6 Rates (Customer Self-Help), and Level -1 (Contact Prevention) Resolution Rates by implementing processes, technologies, and training that facilitate these objectives. Summary Statistics Total Score Average Score
72 Best Practice Sample report only. Data is not accurate. Human Resources: 13 Best Practices Human Resources Best Practices Defined Company XYZ's Score Peer Group Average The Contact Center has a formalized and documented recruiting process for filling vacancies. Job requirements are well defined, and candidates are tested for both technical skills and customer-service soft skills. New hires go through a formal training curriculum, including product knowledge and customer-service skills, and are required to pass a proficiency exam before independently handling customer contacts. Veteran agents (more than 6 months of experience) have access to training opportunities to improve their skill set, job performance, 3 and the overall performance of the Contact Center. Veteran agents are required to complete a minimum number of refresher training hours each year. Agent training classes and curricula are specifically designed to maximize customer satisfaction and the number of inquiries resolved on first contact. 5 Individual agent training plans are clearly defined, documented, and regularly updated The Contact Center has a formalized, documented agent career path. Agents are made aware of their career advancement 6 opportunities, and are encouraged to proactively manage their careers. Agents are coached at least once yearly on their career path and career-advancement options. Agents have the opportunity to advance their careers in at least two ways: by improving their technical and customer service skills, and by improving their management and supervisory skills. Agents are coached by their supervisors in one-on-one sessions on a monthly basis. Recorded calls are reviewed, and the supervisors provide specific suggestions to each agent on how to improve performance. Agents have quantifiable performance goals (for call quality, customer satisfaction, number of calls handled per month, etc.), and are held accountable for achieving their goals on a monthly basis. Agents are eligible for incentives and rewards based upon performance. These could include monetary incentives such as annual bonuses, or other incentives such as time off work, gift certificates, etc. 11 Agent performance goals are linked to and aligned with the overall Contact Center goals and performance targets Agent job satisfaction surveys are conducted at least once per year, and the results of the surveys are used to manage and improve agent morale. 13 Formal performance reviews are scheduled and completed for all personnel at least once annually Summary Statistics Total Score Average Score
73 Process: 12 Best Practices Best Practice Process Best Practices Defined Company XYZ's Score Peer Group Average 1 The Contact Center is designed as a Single Point of Contact (SPOC) for all customer issues and requests Customers are offered a range of access options to the Contact Center, including live voice, voic , , web chat, self service, and fax. Contact handling processes are standardized, documented, and available to Contact Center agents online. With few exceptions, the standards are followed by the Contact Center agents. Escalation points are well defined and documented. These include other support groups (technical support, etc.), and individuals to whom calls may be escalated. Rules for escalation and call transfer are well defined and documented. Agents know when and where to transfer or route a call if they are unable to assist the customer. Indirect contact channels, including , voic , and fax are treated with the same priority as live phone calls and chat sessions. The work queues from these channels are integrated, or worked in parallel. The Contact Center has contingency plans to handle sudden, unexpected spikes in contact volume. These could include having supervisors and other indirect personnel handle incoming calls during a call spike. 8 The Contact Center has contingency plans to handle both short and long term interruptions in service delivery The Contact Center has a formal knowledge-management process that facilitates the acquisition, qualification, review, approval, and population of knowledge into a knowledgebase. The Contact Center has a mature workforce scheduling process that achieves high agent utilization, while maintaining reasonable service levels. 11 The Contact Center has an effective, ongoing process for projecting future workload and staffing requirements The Contact Center conducts periodic root-cause analysis (RCA) on the customer contact profile to identify customer trends and preferences. Summary Statistics Total Score Average Score
74 Technology: 6 Best Practices Best Practice Technology Best Practices Defined Company XYZ's Score Peer Group Average The Contact Center has a full-featured ticket management system that facilitates effective ticket tracking, service-level compliance, reporting, and root-cause analysis. The Contact Center has a comprehensive knowledge-management tool that facilitates effective 2 knowledge capture and reuse. Contact Center agents are able to quickly find solutions to customer questions by searching the knowledgebase. Solutions for the vast majority of customer inquiries can be found in the knowledgebase. The Contact Center knowledgebase is used continuously by all Contact Center agents, and results in higher First Contact Resolution rates and lower contact handle times. The Contact Center has an effective, integrated self-service portal that is available to all customers. 4 The self-service portal provides information, FAQ's, and answers to the most common customer questions. The tool includes a direct link to Contact Center agents. Customers are aware of the selfservice portal, and usage rates are continuously increasing. 5 The Contact Center has a multi-year plan for an integrated technology strategy The Contact Center utilizes a capital investment justification process based on ROI, and reports on post-installation ROI as part of this process. Summary Statistics Total Score Average Score
75 Performance Measurement: 11 Best Practices Best Practice Performance Measurement Best Practices Defined Company XYZ's Score Peer Group Average 1 Cost per Contact is measured, recorded, and tracked on an ongoing basis Customer Satisfaction is measured, recorded, and tracked on an ongoing basis First Contact Resolution is measured, recorded, and tracked on an ongoing basis Agent Utilization is measured, recorded, and tracked on an ongoing basis Agent Job Satisfaction is measured, recorded, and tracked The Contact Center maintains a balanced scorecard that provides a single, all-inclusive measure of Contact Center performance. The Contact Center conducts event-driven customer surveys, whereby the results of customer-satisfaction surveys can be linked back to a specific inquiry and to a specific agent handling the contact at the Contact Center. Contact Center measures are used holistically and diagnostically to identify performance gaps in Contact Center performance, and to prescribe actions that will improve performance. 9 The Contact Center conducts benchmarking at least once per year Contact Center KPI's are used to establish "stretch" goals The Contact Center understands key correlations and cause/effect relationships between the various KPI's. This 11 enables the Contact Center to achieve desired performance goals by leveraging and driving the underlying "causal" metrics. Summary Statistics Total Score Average Score
76 Communication: 8 Best Practices Best Practice Communication Best Practices Defined Company XYZ's Score Peer Group Average The Contact Center maintains active communication with all stakeholder groups, including Contact Center employees, company managers, and customers. The Contact Center has a formal communications schedule, and provides customized content for each stakeholder group. The Contact Center meets frequently with other company managers, and has a role in product and promotional decisions. The Contact Center plays the role of "customer advocate" in the meetings. The Contact Center receives a "turnover package" for new products or promotions. The turnover package is 4 designed to prepare the Contact Center to provide effective customer support for new products and promotions. 5 Customers are told what to expect on resolution time when their ticket is escalated or if a call-back is required The Contact Center monitors all tickets, including those that are escalated, until ticket closure The business role of the Contact Center is communicated to key managers in the company, and expectations are formally established regarding Contact Center roles and responsibilities. The Contact Center activates a recorded message when call volumes spike, and wait times increase. The message informs callers that their wait time may be excessive, and provides an estimate of the wait time. Summary Statistics Total Score Average Score
77 Best Practices Process Assessment Summary Best Practices Component Number of Relevant Success Factors Company XYZ's Average Score Average Peer Group Score Strategy Human Resources Process Technology Performance Measurement Communication Total Score Percentage Score 63.4% 38.8% * An average score of 4.0 or above is required in each component of the Best Practices Model to achieve Best Practices Certification. 76
78 Average Score 5.0 Sample report only. Data is not accurate. Best Practices Process Assessment Summary Company XYZ Peer Group 77
79 Total Process Assessment Scores Sample report only. Data is not accurate. Overall Process Assessment Scores 100% 90% 80% 70% 60% 63.4% Key Statistics Total Process Assessment Score High 93.2% Average % Median 35.8% Low 6.1% Your Score 63.4% World-Class % 50% 40% 30% 20% 10% 0% 78
80 World-Class = 75.0% Balanced Score Average = 38.8% Sample report only. Data is not accurate. Process Maturity vs. Scorecard Performance 100% 90% 80% Company XYZ Performance Process Assessment Score 63.4% Balanced Score 59.3% 70% 60% 50% 40% 30% 20% Average = 53.8% 10% Company XYZ Global Database 0% 0% 10% 20% 30% 40% 50% 60% 70% 80% 90% 100% Process Assessment Score 79
81 Interview Themes and Quotes 80
82 MetricNet Conducted 10 Interviews Company XYZ Interviewees Aaron Bender Christopher Drummond Eric Fletcher Georgia Hansen Irma Jasper Kermit Lefkin Marvin Noonan Oliver Palmer Quentin Rose Shirley Thompson Roles Contact Center Senior Manager Supervisor Supervisor Trainer Quality Assurance Analyst Contact Center Agent Contact Center Agent Contact Center Agent Contact Center Agent Contact Center Agent 81
83 Key Themes from the Contact Center Interviews Most interviewees agreed that the current staffing level is usually sufficient to handle the contact volume. A majority of the interviewees said that overall morale is high. Some interviewees expressed the need to have more in-depth training for the new agents. Most interviewees would like to see more advance communication to the Contact Center about upcoming product changes. The interviewees agreed that processes are being improved, but that process consistency and knowledge management are still a challenge. Most interviewees said that the Contact Center s technology is adequate but is not strong. They see a need for continued system integration, among other things. The lack of space in the Contact Center department was a concern to many interviewees. 82
84 Representative Comments from the Interviews STAFFING We are currently staffed well. On the weekend, our call queue can be overwhelmed, but the rest of the time the workload is very manageable. We re definitely staffed adequately. When agents are out for illness or vacation, there is usually enough cushion to cover the calls, chats, and s. The biggest stress for the agents is weekend call volume. It can be pretty exhausting trying to keep up with the influx of calls. Perhaps some schedule shifts to move more agents to cover weekends would help. But overall, we have enough agents to handle the contact volume. Turnover is often a significant issue for us, keeping good people. I feel like having five more agents or so on Saturdays would cover all bases; it would give us a little more time between calls. A year ago just keeping up with the work was very stressful, but for the last few months since we brought on more agents, we ve had plenty of room to breathe. 83
85 Representative Comments from the Interviews MORALE Morale is quite good right now; the agents feel supported by management. We have a pretty good culture. We get along well and enjoy one another s company, and we care about one another. There is a lot of support from that standpoint. All things considered, morale is pretty good. In spite of some frustrations, we for the most part stick together and keep a positive attitude. I think morale is much better now than it was a year or two ago. Management is quick to ask for our opinion, but I d like to see them put more stock into it. It s hard to try and keep agents motivated to come in on a Saturday, taking call after call. Overall, on a scale of one to 10, I d probably give morale an eight. The agents appreciate all the training we get and the encouragement from management. If we had more performance incentives and advancement opportunities, morale would probably be even higher. 84
86 Representative Comments from the Interviews TRAINING I think the new-agent training is fairly good. But some of the newer agents have struggled initially. I think a couple more weeks of training would help them get their feet under them more solidly. The initial training has kind of improved; I m glad they were willing to listen to suggestions. I think they just need to give new agents more time. We get a lot of refresher training. That is very helpful to us, especially with all the changes we ve had. The coaching framework and culture has really aided in helping agents with the knowledge and background that is needed. Company XYZ has some online training classes you can choose and do yourself in between calls or on your own time. Training has greatly improved over the course of the last two years. We re still working on getting some training processes up to date, and making sure regular communications are happening. 85
87 Representative Comments from the Interviews CAREER ADVANCEMENT There are some opportunities that come up depending on when people leave or get promoted. The opportunities are out there. There s definitely opportunity for advancement, if you re willing to take the initiative and pursue the opportunities. There are quite a few opportunities for advancement within the Contact Center itself. Also, within the organization, there have been plenty of people who have moved from the Contact Center to other departments. PERFORMANCE GOALS AND INCENTIVES The agents kind of get mixed messages about how to go about their day, and do irrational things to get a low after-call work time or a high schedule adherence (e.g., do follow-up work while still on the phone even though the call is over, or stay in follow-up status for the last ten minutes of their shift). I think daily reporting would be better for the agents, helping motivate them; they could compete with themselves and among themselves. 86
88 Representative Comments from the Interviews COMMUNICATION Communication is pretty good. Management uses the system for most correspondence, so as long as you re watching your s you re fine. We can send an or IM to the agents, but they may not see it while they re on the phone. A better dashboard or bulletin-board system would be something helpful, to show common problems. One challenge is not getting information from other teams about changes that will affect us with call volumes. When it comes to planned product changes or rollouts, we should be made aware further ahead of time. Communication is not a strength; sometimes we find out things what other areas are doing either right before or right after they happen. Some groups are great about sending information to our management about changes coming up, but others are more last minute, or we don t get updates until we re getting flooded with calls. 87
89 Representative Comments from the Interviews PROCESSES Our processes and procedures are a work in progress; they ve come a long way over the last few years. I d say that our knowledgebase is not the best I ve ever seen out there, but it gives the basics of what we need to do. The knowledgebase is built up to where people can come in and pick up the work after less training than we used to need. Searching the knowledgebase can be a struggle. When solutions are hard to find, it affects the agents ability to have First Call Resolution and it affects the amount of time it takes to resolve issues. This is frustrating for both the agent and the caller. We need to make training more consistent and make sure we are following all processes and procedures, such as handling calls in a consistent way and making sure all account documentation is clear and thorough. 88
90 Representative Comments from the Interviews TECHNOLOGY The tools we have are definitely adequate. I think there is still some room for improvement with integrating some of our tools, to reduce manual work and errors. Technology is not one of our biggest strengths. The systems are not integrated like some contact centers have; it chews up time and resources. We ve tried to piecemeal a lot of systems together, and it causes issues with data integrity; sometimes systems don t talk to each other when they should. I would say that for the most part all the tools that we have will help us get the job done. I don t think there is any tool out there that would help us a lot. The account reset tool needs to be improved, so that the call can be resolved quickly and agents can accept additional calls. Our scheduling software may not be the right fit for us; we ve been discussing that. WORK ENVIRONMENT Having more space would help reduce the agents stress level. It would be nice to have a bigger and more ventilated workspace. 89
91 Conclusions and Recommendations 90
92 Notable Strengths The Company XYZ Contact Center has a number of notable strengths. Customer Satisfaction is very high compared to the benchmarking peer group Net First Contact Resolution Rate is in the top quartile First Contact Resolution is the primary driver of Customer Satisfaction % of Calls Answered in 30 Seconds and Call Abandonment Rate are better than the peer-group averages Company XYZ s agent metrics are excellent Agent Job Satisfaction, a key secondary driver of many other metrics, is in the top quartile Agent turnover and absenteeism are low, and tenure, occupancy, schedule adherence, and annual training hours are above the peer-group averages The Company XYZ Contact Center scored well above average on the Best Practices Process Assessment Company XYZ scored 10 th out of 25 Contact Centers on the Balanced Scorecard Second quartile performance overall 91
93 But Opportunities for Improvement Remain Company XYZ s Cost per Inbound Contact is high compared to the benchmarking peer group Agent Utilization is below the peer-group average Utilization is one of the primary drivers of Cost per Contact New Agent Training Hours are lower than the peer group average IVR Containment Rate is lower than the peer-group average Containing transactions within the IVR or other self-service tools can represent a significant opportunity for cost savings Interviewees expressed concerns in the following additional areas: Inadequate communication from other groups about upcoming changes The need for better knowledge management Inadequate system integration The need for more initial training for new agents 92
94 Summary of Benchmarking Recommendations 1. Consider utilizing agents more efficiently by allowing attrition to reduce the staffing level slightly. MetricNet estimates that Company XYZ should reduce the number of Contact Center agents by about 10 FTEs in order to be appropriately staffed. 2. Consider opportunities to deflect contacts into lower-cost channels such as chat, IVR, or online self-service portal. 3. Consider increasing New Agent Training Hours. 4. Consider adopting the MetricNet Contact Center Balanced Scorecard, and update the scorecard monthly. 5. Establish stretch goals in key areas to improve performance. 6. Improve process maturity in compliance with industry best practices. 93
95 Cost per Inbound Contact Sample report only. Data is not accurate. Higher Utilization Reduces Costs $18.00 $16.00 $14.00 $12.00 $10.00 $8.00 $6.00 $4.00 $2.00 $ % 35.0% 40.0% 45.0% 50.0% 55.0% 60.0% 65.0% 70.0% Agent Utilization 94
96 Overall Cost per Contact (incl. IVR-Contained Contacts) Sample report only. Data is not accurate. IVR Containment Reduces Costs $18.00 $16.00 $14.00 $12.00 $10.00 $8.00 $6.00 $4.00 $2.00 $ % 10.0% 20.0% 30.0% 40.0% 50.0% 60.0% 70.0% IVR Containment Rate 95
97 First Contact Resolution Rate Sample report only. Data is not accurate. 100% 90% 80% Training Can Improve FCR 70% 60% 50% 40% 30% 20% 10% 0% New Agent Training Hours 96
98 Consider Adopting the Contact Center Balanced Scorecard Performance Metric Metric Weighting Performance Range Worst Case Best Case Your Actual Performance Metric Score Balanced Score Cost per Inbound Contact 25.0% $15.99 $6.86 $ % 10.3% Customer Satisfaction 25.0% 67.9% 91.3% 83.3% 65.8% 16.5% Agent Utilization 15.0% 37.7% 64.0% 49.6% 45.1% 6.8% Net First Contact Resolution Rate 15.0% 55.9% 78.9% 71.2% 66.7% 10.0% Agent Job Satisfaction 10.0% 61.8% 85.1% 84.2% 96.4% 9.6% Average Speed of Answer (seconds) 10.0% % 6.2% Total 100.0% N/A N/A N/A N/A 59.3% Step 1 Six critical performance metrics have been selected for the scorecard. Step 2 Each metric has been weighted according to its relative importance. Step 3 For each performance metric, the highest and lowest performance levels in the benchmark are recorded. Step 4 Your actual performance for each metric is recorded in this column. Step 5 Your score for each metric is then calculated: (worst case - actual performance) (worst case best case) 100 Step 6 Your balanced score for each metric is calculated: metric score weighting 97
99 Balanced Score Sample report only. Data is not accurate. And Updating the Scorecard Monthly 85% 80% 75% 70% 65% 60% 55% 50% 45% 40% Jan Feb Mar Apr May Jun Jul Aug Sep Oct Nov Dec 12 Month Average Monthly Score * Sample Only 98
100 Some Suggested Performance Targets Performance Metric Current Company XYZ Performance Target Performance Agent Utilization 49.6% 55.0% Cost per Inbound Contact $12.23 $11.58 Cost per Minute of Inbound Handle Time $1.66 $1.58 Inbound Contacts per Agent per Month Outbound Contacts per Agent per Month Average Speed of Answer (seconds) Call Abandonment Rate 6.9% 8.0% IVR Containment Rate 18.7% 30.0% Balanced Score 59.3% 63.6% Achieving the performance targets recommended above would increase the Company XYZ Contact Center Balanced Score from 59.3% to 63.6%, and would elevate Company XYZ from 10 th place to 6 th place (top quartile!) on the Balanced Scorecard. 99
101 Cause-and-Effect for Contact Center KPI s Cost per Contact Customer Satisfaction Agent Utilization First Contact Resolution Scheduling Efficiency Service Levels: ASA and AR Agents/ Total FTE s Absenteeism/ Turnover IVR Containment Handle Time Call Quality Agent Satisfaction Coaching Career Path Training Hours 100
102 World-Class = 75.0% Balanced Score Average = 38.8% Sample report only. Data is not accurate. Company XYZ Can Improve Process Maturity Over Time 100% 90% 80% Company XYZ Performance Process Assessment Score 63.4% Balanced Score 59.3% 70% 60% 50% 40% 30% 20% Average = 53.8% 10% Company XYZ Global Database 0% 0% 10% 20% 30% 40% 50% 60% 70% 80% 90% 100% Process Assessment Score 101
103 Process Maturity Focus Area: Strategy Strategy Best Practices Defined The Contact Center has a well-defined mission, vision, and strategy. The vision and strategy are welldocumented, and communicated to key stakeholders in the organization. The Contact Center has an action plan for continuous improvement. The plan is documented and distributed to key stakeholders in the organization, and specific individuals are held accountable for implementing the action plan. The Contact Center has SLA's that define the level of service to be delivered to customers. The SLA's are documented, published, and communicated to key stakeholders in the organization. The Contact Center is well integrated into the company value chain. The Contact Center acts as the "voice of the customer," and is involved in product decisions and deliberations that affect customers. The Contact Center is alerted ahead of time so that they can prepare for major product changes and marketing campaigns. The Contact Center actively seeks to improve First Contact Resolution Rates, Level 0 Resolution Rates (Customer Self-Help), and Level -1 (Contact Prevention) Resolution Rates by implementing processes, technologies, and training that facilitate these objectives. The Contact Center has OLA's (Operating Level Agreements) with other support groups in the organization (information technology, desktop support, field support, etc.). The OLA's clearly define the roles and responsibilities of each support group, and the different support groups abide by the terms of the OLA's. Company XYZ's Score
104 Process Maturity Focus Area: Human Resources Human Resources Best Practices Defined Agents have the opportunity to advance their careers in at least two ways: by improving their technical and customer service skills, and by improving their management and supervisory skills. Agents are coached by their supervisors in one-on-one sessions on a monthly basis. Recorded calls are reviewed, and the supervisors provide specific suggestions to each agent on how to improve performance. Agent performance goals are linked to and aligned with the overall Contact Center goals and performance targets. Agent job satisfaction surveys are conducted at least once per year, and the results of the surveys are used to manage and improve agent morale. Formal performance reviews are scheduled and completed for all personnel at least once annually. The Contact Center has a formalized and documented recruiting process for filling vacancies. Job requirements are well defined, and candidates are tested for both technical skills and customer-service soft skills. Veteran agents (more than 6 months of experience) have access to training opportunities to improve their skill set, job performance, and the overall performance of the Contact Center. Veteran agents are required to complete a minimum number of refresher training hours each year. Agent training classes and curricula are specifically designed to maximize customer satisfaction and the number of inquiries resolved on first contact. Agents have quantifiable performance goals (for call quality, customer satisfaction, number of calls handled per month, etc.), and are held accountable for achieving their goals on a monthly basis. Individual agent training plans are clearly defined, documented, and regularly updated. Agents are eligible for incentives and rewards based upon performance. These could include monetary incentives such as annual bonuses, or other incentives such as time off work, gift certificates, etc. New hires go through a formal training curriculum, including product knowledge and customer-service skills, and are required to pass a proficiency exam before independently handling customer contacts. The Contact Center has a formalized, documented agent career path. Agents are made aware of their career advancement opportunities, and are encouraged to proactively manage their careers. Agents are coached at least once yearly on their career path and career-advancement options. Company XYZ's Score
105 Process Maturity Focus Area: Process Process Best Practices Defined The Contact Center is designed as a Single Point of Contact (SPOC) for all customer issues and requests. Customers are offered a range of access options to the Contact Center, including live voice, voic , , web chat, self service, and fax. Contact handling processes are standardized, documented, and available to Contact Center agents online. With few exceptions, the standards are followed by the Contact Center agents. The Contact Center has contingency plans to handle sudden, unexpected spikes in contact volume. These could include having supervisors and other indirect personnel handle incoming calls during a call spike. The Contact Center has a formal knowledge-management process that facilitates the acquisition, qualification, review, approval, and population of knowledge into a knowledgebase. Escalation points are well defined and documented. These include other support groups (technical support, etc.), and individuals to whom calls may be escalated. Rules for escalation and call transfer are well defined and documented. Agents know when and where to transfer or route a call if they are unable to assist the customer. The Contact Center has a mature workforce scheduling process that achieves high agent utilization, while maintaining reasonable service levels. The Contact Center has an effective, ongoing process for projecting future workload and staffing requirements. The Contact Center has contingency plans to handle both short and long term interruptions in service delivery. The Contact Center conducts periodic root-cause analysis (RCA) on the customer contact profile to identify customer trends and preferences. Indirect contact channels, including , voic , and fax are treated with the same priority as live phone calls and chat sessions. The work queues from these channels are integrated, or worked in parallel. Company XYZ's Score
106 Process Maturity Focus Area: Technology Technology Best Practices Defined The Contact Center has a comprehensive knowledge-management tool that facilitates effective knowledge capture and reuse. Contact Center agents are able to quickly find solutions to customer questions by searching the knowledgebase. Solutions for the vast majority of customer inquiries can be found in the knowledgebase. The Contact Center knowledgebase is used continuously by all Contact Center agents, and results in higher First Contact Resolution rates and lower contact handle times. The Contact Center has a full-featured ticket management system that facilitates effective ticket tracking, service-level compliance, reporting, and root-cause analysis. The Contact Center has an effective, integrated self-service portal that is available to all customers. The self-service portal provides information, FAQ's, and answers to the most common customer questions. The tool includes a direct link to Contact Center agents. Customers are aware of the selfservice portal, and usage rates are continuously increasing. The Contact Center has a multi-year plan for an integrated technology strategy. The Contact Center utilizes a capital investment justification process based on ROI, and reports on post-installation ROI as part of this process. Company XYZ's Score
107 Process Maturity Focus Area: Performance Measurement Agent Job Satisfaction is measured, recorded, and tracked. The Contact Center conducts benchmarking at least once per year. Contact Center measures are used holistically and diagnostically to identify performance gaps in Contact Center performance, and to prescribe actions that will improve performance. Contact Center KPI's are used to establish "stretch" goals. Performance Measurement Best Practices Defined The Contact Center conducts event-driven customer surveys, whereby the results of customer-satisfaction surveys can be linked back to a specific inquiry and to a specific agent handling the contact at the Contact Center. Customer Satisfaction is measured, recorded, and tracked on an ongoing basis. First Contact Resolution is measured, recorded, and tracked on an ongoing basis. The Contact Center understands key correlations and cause/effect relationships between the various KPI's. This enables the Contact Center to achieve desired performance goals by leveraging and driving the underlying "causal" metrics. Agent Utilization is measured, recorded, and tracked on an ongoing basis. Cost per Contact is measured, recorded, and tracked on an ongoing basis. The Contact Center maintains a balanced scorecard that provides a single, all-inclusive measure of Contact Center performance. Company XYZ's Score
108 Process Maturity Focus Area: Communication Communication Best Practices Defined The Contact Center activates a recorded message when call volumes spike, and wait times increase. The message informs callers that their wait time may be excessive, and provides an estimate of the wait time. Customers are told what to expect on resolution time when their ticket is escalated or if a call-back is required. The Contact Center monitors all tickets, including those that are escalated, until ticket closure. The Contact Center maintains active communication with all stakeholder groups, including Contact Center employees, company managers, and customers. The Contact Center meets frequently with other company managers, and has a role in product and promotional decisions. The Contact Center plays the role of "customer advocate" in the meetings. The business role of the Contact Center is communicated to key managers in the company, and expectations are formally established regarding Contact Center roles and responsibilities. The Contact Center receives a "turnover package" for new products or promotions. The turnover package is designed to prepare the Contact Center to provide effective customer support for new products and promotions. The Contact Center has a formal communications schedule, and provides customized content for each stakeholder group. Company XYZ's Score
109 Detailed Benchmarking Comparisons 108
110 Cost Metrics 109
111 Definition Cost Metrics: Cost per Inbound Contact Cost per Inbound Contact is the total annual operating expense of the Contact Center divided by the annual inbound contact volume of the Contact Center. Operating expense includes all employee salaries, overtime pay, benefits, and incentive compensation, plus all contractor, facilities, telecom, desktop computing, software licensing, training, travel, office supplies, and miscellaneous expenses. Contact volume includes inbound contacts from all sources: live voice, voic , , web chat, fax, walk-in, etc. Why it s Important Cost per Inbound Contact is one of the most important Contact Center metrics. It is a measure of how efficiently your Contact Center conducts its business. A higher-than-average Cost per Contact is not necessarily a bad thing, particularly if accompanied by higher-than-average quality levels. Conversely, a low Cost per Contact is not necessarily good, particularly if the low cost is achieved by sacrificing Call Quality or service levels. Every Contact Center should track and trend Cost per Inbound Contact on a monthly basis. Key Correlations Cost per Inbound Contact is strongly correlated with the following metrics: Agent Utilization Net First Contact Resolution Rate Inbound Contact Handle Time IVR Containment Rate Average Speed of Answer 110
112 Cost per Inbound Contact Sample report only. Data is not accurate. Cost Metrics: Cost per Inbound Contact $18.00 $16.00 $14.00 $12.00 Key Statistics Cost per Inbound Contact High $15.99 Average $9.97 Median $9.58 Low $6.86 Company XYZ $12.23 $10.00 $8.00 $6.00 $4.00 $2.00 $0.00 Contact Center 111
113 Cost Metrics: Cost per Minute of Inbound Handle Time Definition Cost per Minute of Inbound Handle Time is simply the Cost per Contact divided by the average Inbound Contact Handle Time. The average Inbound Contact Handle Time includes all inbound contacts: live voice, voic , , web chat, fax, walk-in, etc. Why it s Important Unlike Cost per Inbound Contact, which does not take into account the Contact Handle Time or call complexity, Cost per Minute of Inbound Handle Time measures the per-minute cost of providing customer support. It enables a more direct comparison of costs between Contact Centers because it is independent of the types of contacts that come into the Contact Center and the complexity of those contacts. Key Correlations Cost per Minute of Inbound Handle Time is strongly correlated with the following metrics: Agent Utilization Net First Contact Resolution Rate IVR Containment Rate Average Speed of Answer Outbound Contacts as a % of Total Contacts 112
114 Cost per Minute of Inbound Handle Time Sample report only. Data is not accurate. Cost Metrics: Cost per Minute of Inbound Handle Time $2.25 $2.00 $1.75 $1.50 Key Statistics Cost per Minute of Inbound Handle Time High $1.95 Average $1.39 Median $1.41 Low $0.95 Company XYZ $1.66 $1.25 $1.00 $0.75 $0.50 $0.25 $0.00 Contact Center 113
115 Productivity Metrics 114
116 Productivity Metrics: Inbound Contacts per Agent per Month Definition Inbound Contacts per Agent per Month is the average monthly inbound contact volume divided by the average Full Time Equivalent (FTE) agent headcount. Contact volume includes contacts from all sources: live voice, voic , , web chat, fax, walk-in, etc. Agent headcount is the average FTE number of employees and contractors handling customer contacts. Why it s Important Inbound Contacts per Agent per Month is an important indicator of agent productivity. A low number could indicate low Agent Utilization, poor scheduling efficiency or schedule adherence, or a higherthan-average Contact Handle Time. Conversely, a high number of inbound contacts per agent may indicate high Agent Utilization, good scheduling efficiency and schedule adherence, or a lower-thanaverage Contact Handle Time. Every Contact Center should track and trend this metric on a monthly basis. Key Correlations Inbound Contacts per Agent per Month is strongly correlated with the following metrics: Agent Utilization Inbound Contact Handle Time Cost per Inbound Contact Cost per Minute of Inbound Handle Time Agent Occupancy Average Speed of Answer 115
117 Inbound Contacts per Agent per Month Sample report only. Data is not accurate. Productivity Metrics: Inbound Contacts per Agent per Month 1, Key Statistics Inbound Contacts per Agent per Month High 880 Average 680 Median 685 Low 434 Company XYZ Contact Center 116
118 Productivity Metrics: Outbound Contacts per Agent per Month Definition Outbound Contacts per Agent per Month is the average monthly outbound contact volume divided by the average Full Time Equivalent (FTE) agent headcount. Outbound contacts can include callbacks to customers who have left voice messages or sent s, or callbacks to deliver information and solutions to customers who had previously called in. Agent headcount is the average FTE number of employees and contractors handling customer contacts. Why it s Important While Outbound Contacts per Agent per Month is technically a productivity metric, it s most important as an indicator of Contact Center effectiveness (quality of performance). The most effective Contact Centers have high Net First Contact Resolution Rates and therefore have low outbound call volumes. Key Correlations Outbound Contacts per Agent per Month is strongly correlated with the following metrics: Net First Contact Resolution Rate Customer Satisfaction Cost per Inbound Contact Cost per Minute of Inbound Handle Time Agent Utilization 117
119 Outbound Contacts per Agent per Month Sample report only. Data is not accurate. Productivity Metrics: Outbound Contacts per Agent per Month Key Statistics Outbound Contacts per Agent per Month High 155 Average 69 Median 69 Low 24 Company XYZ Contact Center 118
120 Definition Productivity Metrics: Agent Utilization Agent Utilization is the average time that an agent spends handling both inbound and outbound contacts per month, divided by the number of work hours in a given month. The calculation for Agent Utilization is shown on the next page. Why it s Important Agent Utilization is the single most important indicator of agent productivity. It measures the percentage of time that the average agent is in work mode, and is independent of Contact Handle Time or call complexity. Key Correlations Agent Utilization is strongly correlated with the following metrics: Inbound Contacts per Agent per Month Cost per Inbound Contact Cost per Minute of Inbound Handle Time Agent Occupancy Average Speed of Answer 119
121 Agent Utilization Defined Agent Utilization = ((Average number of inbound contacts handled by an agent in a month) X (Average inbound handle time in minutes) + (Average number of outbound contacts handled by an agent in a month) X (Average outbound handle time in minutes)) (Average number of days worked in a month) X (Number of work hours in a day) X (60 minutes/hr) Agent Utilization is a measure of the actual time that agents spend providing direct customer support in a month, divided by total time at work during the month. It takes into account both inbound and outbound contacts of all types handled by the agents. But it does not make adjustments for sick days, holidays, training time, project time, or idle time. By calculating Agent Utilization in this way, all Contact Centers worldwide are measured in exactly the same way, and can therefore be directly compared for benchmarking purposes. 120
122 Example: Contact Center Agent Utilization Inbound Contacts per Agent per Month = 375 Outbound Contacts per Agent per Month = 225 Average Inbound Contact Handle Time = 10 minutes Average Outbound Contact Handle Time = 5 minutes Agent Utilization = ((Average number of inbound contacts handled by an agent in a month) X (Average inbound handle time in minutes) + (Average number of outbound contacts handled by an agent in a month) X (Average outbound handle time in minutes)) (Average number of days worked in a month) X (Number of work hours in a day) X (60 minutes/hr) Agent Utilization ((375 Inbound Contacts per Month) X (10 minutes) + (225 Outbound Contacts per Month) X (5 minutes) = = (21.5 work days per month) X (7.5 work hours per day) X (60 minutes/hr) 50.4% Agent Utilization 121
123 Agent Utilization Sample report only. Data is not accurate. Productivity Metrics: Agent Utilization 70.0% 65.0% 60.0% 55.0% Key Statistics Agent Utilization High 64.0% Average 51.2% Median 50.2% Low 37.7% Company XYZ 49.6% 50.0% 45.0% 40.0% 35.0% 30.0% 25.0% 20.0% Contact Center 122
124 Productivity Metrics: Agents as a % of Total Headcount Definition This metric is the average Full Time Equivalent (FTE) agent headcount divided by the average total Contact Center headcount. It is expressed as a percentage, and represents the percentage of total Contact Center personnel who are engaged in direct customer-service activities. Headcount includes both employees and contractors. Why it s Important The agent headcount as a percentage of total Contact Center headcount is an important measure of management and overhead efficiency. Since non-agents include both management and nonmanagement personnel (such as supervisors and team leads, QA/QC, trainers, etc.), this metric is not a pure measure of management span of control. But it is a more useful metric than management span of control because the denominator of this ratio takes into account all personnel that are not directly engaged in customer service activities. Key Correlations Agents as a % of Total Headcount is strongly correlated with the following metrics: Cost per Inbound Contact Cost per Minute of Inbound Handle Time 123
125 Agents as a % of Total Headcount Sample report only. Data is not accurate. Productivity Metrics: Agents as a % of Total Headcount 90.0% 85.0% 80.0% 75.0% Key Statistics Agents as a % of Total Headcount High 87.3% Average 76.8% Median 75.7% Low 68.4% Company XYZ 75.5% 70.0% 65.0% 60.0% 55.0% 50.0% Contact Center 124
126 Service Level Metrics 125
127 Service Level Metrics: Average Speed of Answer Definition Average Speed of Answer (ASA) is the total wait time that callers are in queue, divided by the number of calls handled. This includes calls handled by an Interactive Voice Response (IVR) system, as well as calls handled by live agents. Most Automatic Call Distributor (ACD) systems measure this number. Why it s Important ASA is a common service-level metric in the Contact Center industry. It indicates how responsive a Contact Center is to incoming calls. Since most Contact Centers have an ASA service-level target, the ASA is tracked to ensure service-level compliance. Key Correlations Average Speed of Answer is strongly correlated with the following metrics: Call Abandonment Rate % of Calls Answered in 30 Seconds Agent Utilization 126
128 Average Speed of Answer (seconds) Sample report only. Data is not accurate. Service Level Metrics: Average Speed of Answer Key Statistics Average Speed of Answer (seconds) High 151 Average 57 Median 41 Low 6 Company XYZ Contact Center 127
129 Service Level Metrics: % of Calls Answered in 30 Seconds Definition This metric is fairly self-explanatory. It is the percentage of all inbound calls that are answered by a live agent within 30 seconds. For those who don t track this exact metric, but track a similar metric such as % of Calls Answered in 60 Seconds, MetricNet uses a conversion formula to calculate the equivalent percentage of calls answered within 30 seconds. Why it s Important % of Calls Answered in 30 Seconds is a common service-level metric in the Contact Center industry. It indicates how responsive a Contact Center is to incoming calls. Many Contact Centers have a servicelevel target for % of Calls Answered in 30 Seconds, so the metric is tracked to ensure service-level compliance. Key Correlations % of Calls Answered Within 30 Seconds is strongly correlated with the following metrics: Average Speed of Answer Call Abandonment Rate Agent Utilization 128
130 % of Calls Answered in 30 Seconds Sample report only. Data is not accurate. Service Level Metrics: % of Calls Answered in 30 Seconds 100.0% 90.0% 80.0% 70.0% Key Statistics % of Calls Answered in 30 Seconds High 92.2% Average 58.0% Median 58.2% Low 13.4% Company XYZ 59.8% 60.0% 50.0% 40.0% 30.0% 20.0% 10.0% 0.0% Contact Center 129
131 Service Level Metrics: Call Abandonment Rate Definition Call Abandonment Rate is the percentage of calls that were connected to the ACD, but were disconnected by the caller before reaching an agent or before completing a process within the IVR. Why it s Important Call Abandonment Rate is a common service-level metric in the Contact Center industry. An abandoned call indicates that a caller gave up and hung up the phone before receiving service from a live agent or from the IVR. Since most Contact Centers have an abandonment-rate service-level target, the Call Abandonment Rate is tracked to ensure service-level compliance. Key Correlations Call Abandonment Rate is strongly correlated with the following metrics: Average Speed of Answer % of Calls Answered in 30 Seconds Agent Utilization 130
132 Call Abandonment Rate Sample report only. Data is not accurate. Service Level Metrics: Call Abandonment Rate 30.0% 25.0% 20.0% Key Statistics Call Abandonment Rate High 25.6% Average 8.4% Median 6.2% Low 0.7% Company XYZ 6.9% 15.0% 10.0% 5.0% 0.0% Contact Center 131
133 Quality Metrics 132
134 Quality Metrics: Call Quality Definition Although there is no consistent methodology for measuring Call Quality in the Contact Center industry, most Contact Centers have developed their own scoring system for grading the quality of a call. Most will measure call quality on a scale of zero to 100%, and evaluate such things as agent courtesy, professionalism, empathy, timeliness of resolution, quality of resolution, adherence to the script, etc. Why it s Important Call Quality is the foundation of Customer Satisfaction. Good Call Quality takes into account agent knowledge and expertise, call efficiency (i.e., call handle time), and agent courtesy and professionalism. Unless Call Quality is consistently high, it is difficult to achieve consistently high levels of Customer Satisfaction. When measured properly, Call Quality and Customer Satisfaction should track fairly closely. Key Correlations Call Quality is strongly correlated with the following metrics: Customer Satisfaction Net First Contact Resolution Rate New Agent Training Hours Annual Agent Training Hours 133
135 Call Quality Sample report only. Data is not accurate. Quality Metrics: Call Quality 100.0% 95.0% 90.0% 85.0% Key Statistics Call Quality High 95.3% Average 84.8% Median 84.8% Low 71.5% Company XYZ 85.4% 80.0% 75.0% 70.0% 65.0% 60.0% Contact Center 134
136 Quality Metrics: Net First Contact Resolution Rate Definition Net First Contact Resolution (FCR) applies only to live (telephone or chat) contacts. It is a percentage, equal to the number of inbound calls that are resolved on the first interaction with the customer, divided by all calls that are potentially resolvable on first contact. Some Contact Centers include in their FCR Rate by considering an resolved on first contact if the customer receives a resolution within one hour of submitting the . Why it s Important Net First Contact Resolution is the single biggest driver of Customer Satisfaction. A high Net FCR Rate is almost always associated with high levels of Customer Satisfaction. Contact Centers that emphasize training (i.e., high training hours for new and veteran agents) and have good technology tools, such as knowledge management, generally enjoy a higher-than-average Net FCR Rate. Key Correlations Net First Contact Resolution is strongly correlated with the following metrics: Customer Satisfaction New Agent Training Hours Annual Agent Training Hours Inbound Contact Handle Time 135
137 Net First Contact Resolution Rate Sample report only. Data is not accurate. Quality Metrics: Net First Contact Resolution Rate 85.0% 80.0% 75.0% 70.0% 65.0% Key Statistics Net First Contact Resolution Rate High 78.9% Average 66.8% Median 66.5% Low 55.9% Company XYZ 71.2% 60.0% 55.0% 50.0% 45.0% 40.0% 35.0% 30.0% Contact Center 136
138 Quality Metrics: Customer Satisfaction Definition Customer Satisfaction is the percentage of customers who are either satisfied or very satisfied with their Contact Center experience. This metric can be captured in a numbers of ways, including automatic after-call IVR surveys, follow-up outbound (live-agent) calls, surveys, etc. Why it s Important Customer Satisfaction is the single most important measure of Contact Center quality. Any successful Contact Center will have consistently high Customer Satisfaction ratings. Some are under the impression that a low Cost per Contact may justify a lower level of Customer Satisfaction. But this is not true. MetricNet s research shows that even Contact Centers with a very low Cost per Contact can achieve consistently high Customer Satisfaction ratings. Key Correlations Customer Satisfaction is strongly correlated with the following metrics: Net First Contact Resolution Rate Call Quality 137
139 Customer Satisfaction Sample report only. Data is not accurate. Quality Metrics: Customer Satisfaction 100.0% 90.0% 80.0% Key Statistics Customer Satisfaction High 91.3% Average 77.4% Median 77.3% Low 67.9% Company XYZ 83.3% 70.0% 60.0% 50.0% 40.0% Contact Center 138
140 Agent Metrics 139
141 Definition Agent Metrics: Annual Agent Turnover Annual Agent Turnover is the average percentage of agents that leave the Contact Center, for any reason (voluntarily or involuntarily), in a year. Why it s Important Agent turnover is costly. Each time an agent leaves the Contact Center, a new agent needs to be hired to replace the outgoing agent. This results in costly recruiting, hiring, and training expenses. Additionally, it is typically several weeks or even months before an agent is fully productive, so there is lost productivity associated with agent turnover as well. High agent turnover is generally associated with low agent morale in a Contact Center. Key Correlations Annual Agent Turnover is strongly correlated with the following metrics: Daily Agent Absenteeism Annual Agent Training Hours Customer Satisfaction Net First Contact Resolution Rate Cost per Inbound Contact Agent Job Satisfaction 140
142 Annual Agent Turnover Sample report only. Data is not accurate. Agent Metrics: Annual Agent Turnover 80.0% 70.0% 60.0% 50.0% Key Statistics Annual Agent Turnover High 69.6% Average 40.6% Median 38.2% Low 26.7% Company XYZ 32.6% 40.0% 30.0% 20.0% 10.0% 0.0% Contact Center 141
143 Definition Agent Metrics: Daily Agent Absenteeism Daily Agent Absenteeism is the average percentage of agents with an unexcused absence on any given day. It is calculated by dividing the average number of unexcused absent agents per day by the average total number of agents per day that are scheduled to be at work. Why it s Important High Agent Absenteeism is problematic because it makes it difficult for a Contact Center to schedule resources efficiently. High absenteeism can severely harm a Contact Center s operating performance and increase the likelihood that service-level targets will be missed. A Contact Center s Average Speed of Answer and Call Abandonment Rate typically suffer when absenteeism is high. Also, chronically high absenteeism is often a sign of low agent morale. Key Correlations Daily Agent Absenteeism is strongly correlated with the following metrics: Annual Agent Turnover Agent Job Satisfaction Agent Utilization Cost per Inbound Contact Inbound Contacts per Agent per Month 142
144 Daily Agent Absenteeism Sample report only. Data is not accurate. Agent Metrics: Daily Agent Absenteeism 22.0% 20.0% 18.0% 16.0% 14.0% Key Statistics Daily Agent Absenteeism High 19.1% Average 11.1% Median 10.9% Low 4.6% Company XYZ 6.2% 12.0% 10.0% 8.0% 6.0% 4.0% 2.0% 0.0% Contact Center 143
145 Agent Metrics: Agent Occupancy Definition Agent Occupancy is a percentage, equal to the amount of time that an agent is in his or her seat and connected to the ACD and either engaged in a call or ready to answer a call, divided by the agent s total number of hours at work (excluding break time and lunch time). Why it s Important Agent Occupancy is an indirect measure of agent productivity and Agent Schedule Adherence. High levels of Agent Occupancy indicate an orderly, disciplined work environment. Conversely, low levels of Agent Occupancy are often accompanied by a chaotic, undisciplined work environment. Agent Occupancy and Agent Utilization are sometimes confused. Although Agent Occupancy and Agent Utilization are correlated, they are very different metrics. It is possible to have a high occupancy (when agents are logged into the ACD a large percentage of the time) but a low Agent Utilization (when few calls are coming in). Key Correlations Agent Occupancy is strongly correlated with the following metrics: Agent Utilization Inbound Contacts per Agent per Month Agent Schedule Adherence Cost per Inbound Contact 144
146 Agent Occupancy Sample report only. Data is not accurate. Agent Metrics: Agent Occupancy 100.0% 90.0% 80.0% Key Statistics Agent Occupancy High 88.7% Average 74.6% Median 76.1% Low 55.1% Company XYZ 80.8% 70.0% 60.0% 50.0% 40.0% 30.0% Contact Center 145
147 Definition Agent Metrics: Agent Schedule Adherence Agent Schedule Adherence measures whether agents are in their seats ready to accept calls as scheduled. That is, it measures how well a Contact Center s agents are adhering to the schedule. Agent Schedule Adherence is equal to the actual time that an agent is logged in to the system ready to accept calls, divided by the total time the agent is scheduled to be available to accept calls. Why it s Important Effective agent scheduling is critical to achieving a Contact Center s service-level goals and maximizing Agent Utilization. But a work schedule, no matter how well constructed, is only as good as the adherence to the schedule. It is therefore important for agents to adhere to the schedule as closely as possible to ensure that these productivity and service-level goals are met. Key Correlations Agent Schedule Adherence is strongly correlated with the following metrics: Agent Utilization Inbound Contacts per Agent per Month Agent Occupancy Average Speed of Answer 146
148 Schedule Adherence Sample report only. Data is not accurate. Agent Metrics: Agent Schedule Adherence 100.0% 95.0% 90.0% 85.0% Key Statistics Schedule Adherence High 96.1% Average 86.0% Median 86.3% Low 77.0% Company XYZ 89.5% 80.0% 75.0% 70.0% 65.0% 60.0% Contact Center 147
149 Definition Agent Metrics: New Agent Training Hours The name of this metric is somewhat self-explanatory. New Agent Training Hours is the number of training hours (including classroom, computer-based training, self-study, shadowing, being coached, and on-the-job training) that a new agent receives before he or she is allowed to handle customer contacts independently. Why it s Important New Agent Training Hours are strongly correlated with Call Quality and Net First Contact Resolution Rate, especially during an agent s first few months on the job. The more training that new agents receive, the higher that Call Quality and Net FCR will typically be. This, in turn, has a positive effect on many other performance metrics including Customer Satisfaction. Perhaps most importantly, training levels strongly impact agent morale agents who receive more training typically have higher levels of job satisfaction. Key Correlations New Agent Training Hours are strongly correlated with the following metrics: Call Quality Net First Contact Resolution Rate Customer Satisfaction Inbound Contact Handle Time Agent Job Satisfaction 148
150 New Agent Training Hours Sample report only. Data is not accurate. Agent Metrics: New Agent Training Hours Key Statistics New Agent Training Hours High 332 Average 214 Median 202 Low 120 Company XYZ Contact Center 149
151 Agent Metrics: Annual Agent Training Hours Definition Annual Agent Training Hours is the average number of training hours (including classroom, computerbased training, self-study, shadowing, etc.) that an agent receives on an annual basis. This number includes any training hours that an agent receives that are not part of the agent s initial (new-agent) training. But it does not include routine team meetings, shift handoffs, or other activities that do not involve formal training. Why it s Important Annual Agent Training Hours are strongly correlated with Call Quality, Net First Contact Resolution Rate, and Customer Satisfaction. Perhaps most importantly, training levels strongly impact agent morale agents who receive more training typically have higher levels of job satisfaction. Key Correlations Annual Agent Training Hours are strongly correlated with the following metrics: Call Quality Net First Contact Resolution Rate Customer Satisfaction Inbound Contact Handle Time Agent Job Satisfaction 150
152 Annual Agent Training Hours Sample report only. Data is not accurate. Agent Metrics: Annual Agent Training Hours Key Statistics Annual Agent Training Hours High 90 Average 42 Median 47 Low 0 Company XYZ Contact Center 151
153 Agent Metrics: Agent Tenure Definition Agent Tenure is the average number of months that each agent has worked on a particular Contact Center. Why it s Important Agent Tenure is a measure of agent experience. Almost every metric related to Contact Center cost and quality is impacted by the level of experience the agents have. Key Correlations Agent Tenure is strongly correlated with the following metrics: Cost per Inbound Contact Call Quality Customer Satisfaction Annual Agent Turnover Annual Agent Training Hours Agent Coaching Hours Inbound Contact Handle Time Net First Contact Resolution Rate Agent Job Satisfaction 152
154 Agent Tenure (months) Sample report only. Data is not accurate. Agent Metrics: Agent Tenure Key Statistics Agent Tenure (months) High 43.3 Average 30.4 Median 31.3 Low 9.5 Company XYZ Contact Center 153
155 Definition Agent Metrics: Agent Job Satisfaction Agent Job Satisfaction is the percent of agents in a Contact Center who are either satisfied or very satisfied with their jobs. Why it s Important Agent Job Satisfaction is a proxy for agent morale. And morale, while difficult to measure, affects performance on almost every metric in the Contact Center. High-performance Contact Centers almost always have high levels of Agent Job Satisfaction. A Contact Center can control and improve its performance on this metric through training, coaching, and career pathing. Key Correlations Agent Job Satisfaction is strongly correlated with the following metrics: Annual Agent Turnover Customer Satisfaction Daily Agent Absenteeism Net First Contact Resolution Rate Agent Training Hours Agent Coaching Hours 154
156 Agent Job Satisfaction Sample report only. Data is not accurate. Agent Metrics: Agent Job Satisfaction 90.0% 85.0% 80.0% 75.0% Key Statistics Agent Job Satisfaction High 85.1% Average 75.4% Median 75.5% Low 61.8% Company XYZ 84.2% 70.0% 65.0% 60.0% 55.0% 50.0% Contact Center 155
157 Contact Handling Metrics 156
158 Contact Handling Metrics: Inbound Contact Handle Time Definition Inbound Contact Handle Time for live (telephone) contacts is the average time (in minutes) that an agent spends on each contact, including talk time, wrap time, and after-call work time. For non-live contacts, such as , voic , and faxes, the Inbound Contact Handle Time is the average time that an agent spends resolving each contact (excluding any related outbound contact time). Why it s Important A contact is the basic unit of work in a Contact Center. Contact Handle Time, therefore, represents the amount of labor required to complete one unit of work. Key Correlations Inbound Contact Handle Time is strongly correlated with the following metrics: Cost per Inbound Contact Inbound Contacts per Agent per Month Net First Contact Resolution Rate 157
159 Inbound Contact Handle Time (minutes) Sample report only. Data is not accurate. Contact Handling Metrics: Inbound Contact Handle Time Key Statistics Inbound Contact Handle Time (minutes) High 8.54 Average 7.07 Median 7.03 Low 5.59 Company XYZ Contact Center 158
160 Contact Handling Metrics: Outbound Contact Handle Time Definition Outbound Contact Handle Time is the average time (in minutes) that an agent spends on each outbound contact, including talk time, wrap time, and after-call work time. Outbound contacts can include callbacks to customers who have left voice messages or sent s, or callbacks to deliver information and solutions to customers who had previously called in. Why it s Important A contact is the basic unit of work in a Contact Center. Contact Handle Time, therefore, represents the amount of labor required to complete one unit of work. Key Correlations Outbound Contact Handle Time is strongly correlated with the following metrics: Cost per Inbound Contact Outbound Contacts per Agent per Month 159
161 Outbound Contact Handle Time (minutes) Sample report only. Data is not accurate. Contact Handling Metrics: Outbound Contact Handle Time Key Statistics Outbound Contact Handle Time (minutes) High 3.52 Average 2.97 Median 3.05 Low 2.21 Company XYZ Contact Center 160
162 Contact Handling Metrics: Outbound Contacts as a % of Total Contacts Definition This metric is fairly self-explanatory. It is a measure of outbound contact volume divided by all contact volume, including inbound and outbound contacts from all sources (live voice, voic , , etc.). Why it s Important Effective Contact Centers with a high Net First Contact Resolution Rate generally have fewer outbound contacts. By contrast, a low Net FCR generally results in a higher outbound contact volume. Key Correlations Outbound Contacts as a % of Total Contacts is strongly correlated with the following metrics: Net First Contact Resolution Rate Cost per Inbound Contact Outbound Contacts per Agent per Month 161
163 Outbound Contacts as a % of Total Contacts 20.0% Sample report only. Data is not accurate. Contact Handling Metrics: Outbound Contacts as a % of Total Contacts Key Statistics 18.0% 16.0% 14.0% 12.0% Outbound Contacts as a % of Total Contacts High 18.6% Average 9.3% Median 9.5% Low 3.6% Company XYZ 4.3% 10.0% 8.0% 6.0% 4.0% 2.0% 0.0% Contact Center 162
164 Contact Handling Metrics: IVR Containment Rate Definition The IVR Containment Rate is the percentage of inbound contacts that are contained within the IVR and resolved by the customer without assistance from a live agent. A user who opts out of the IVR to speak with a live agent does not count toward the IVR Containment Rate because the user did not resolve the issue before speaking with a live agent. Why it s Important The Cost per Inbound Contact for IVR-contained contacts is significantly lower than it is for agentassisted calls. By increasing the number of contacts resolved through the IVR, the overall Cost per Inbound Contact can be reduced significantly. Many Contact Centers, recognizing the potential to reduce their costs, constantly strive to increase their IVR Containment Rates. Key Correlations IVR Containment Rate is strongly correlated with the following metrics: Cost per Inbound Contact Inbound Contact Handle Time 163
165 IVR Containment Rate Sample report only. Data is not accurate. Contact Handling Metrics: IVR Containment Rate 70.0% 60.0% 50.0% Key Statistics IVR Containment Rate High 60.5% Average 28.3% Median 25.4% Low 0.0% Company XYZ 18.7% 40.0% 30.0% 20.0% 10.0% 0.0% Contact Center 164
166 About MetricNet: Your Benchmarking Partner 165

167 Your Project Manager: Jeff Rumburg Co Founder and Managing Partner, MetricNet, LLC Winner of the 2014 Ron Muns Lifetime Achievement Award Former CEO, The Verity Group Former Vice President, Gartner Founder of the IT Service and Support Benchmarking Consortium Author of A Hands-On Guide to Competitive Benchmarking Harvard MBA, Stanford MS MetricNet, MetricNet, LLC, LLC, 166


168 Benchmarking is MetricNet s Core Business Information Technology Contact Centers Telecom Service Desk Desktop Support Field Services Technical Support Customer Service Telemarketing/Telesales Collections Price Benchmarking Satisfaction Customer Satisfaction Employee Satisfaction 167

169 28 Years of Contact Center Benchmarking Data Global Database More than 3,700 Benchmarks 30 Key Performance Indicators Nearly 80 Industry Best Practices 168


170 Meet a Sampling of Our Clients MetricNet Conducts benchmarking for Contact Centers worldwide, and across virtually every industry sector. 169


171 You Can Reach MetricNet
Company XYZ X Y Z. Peer Group Service Desk Benchmark. Company
 Company XYZ Peer Group Service Desk Benchmark Company X Y Z Report Contents Project Overview and Objectives Page 2 Industry Background Page 34 Performance Benchmarking Summary Page 43 Best Practices Process
Company XYZ X Y Z. Peer Group Service Desk Benchmark. Company
 Company XYZ Peer Group Service Desk Benchmark Company X Y Z Report Contents Project Overview and Objectives Page 2 Industry Background Page 34 Performance Benchmarking Summary Page 43 Best Practices Process
Company XYZ X Y Z. Peer Group Desktop Support Benchmark. Company
 Company XYZ Peer Group Desktop Support Benchmark Company X Y Z Report Contents Project Overview and Objectives Page 2 Industry Background Page 34 Performance Benchmarking Summary Page 49 Best Practices
HR Service Center Benchmark. Company XYZ
 Company XYZ Your Project Manager: Jeff Rumburg Co Founder and Managing Partner, MetricNet, LLC Winner of the 2014 Ron Muns Lifetime Achievement Award Former CEO, The Verity Group Former Vice President,
Call Center Best Practices
 Call Center Best Practices The Road to World Class Performance! MetricNet Best Practices Series 27 Years of Call Center Benchmarking Data Global Database More than 3,700 Call Center Benchmarks 30 Key Performance
IT Service and Support Benchmark
 IT Service and Support Benchmark For Higher Education Information Briefing Your Speaker: Jeff Rumburg Co Founder and Managing Partner, MetricNet, LLC Winner of the 2014 Ron Muns Lifetime Achievement Award
IT Service and Support Benchmark
 IT Service and Support Benchmark For Higher Education Information Briefing Your Speaker: Jeff Rumburg Co Founder and Managing Partner, MetricNet, LLC Winner of the 2014 Ron Muns Lifetime Achievement Award
Leveraging Metrics to Take Southwest Airlines to a Higher Plane Case Study
 Leveraging Metrics to Take Southwest Airlines to a Higher Plane Case Study Your Speaker: Jeff Rumburg The One Year Path to World-Class Implement Performance Project Annual Initial Benchmark and ROI Calculation
Session 102: Benchmark Your Way to World-Class Performance! Jeff Rumburg, Managing Partner, MetricNet, LLC
 Session 102: Benchmark Your Way to World-Class Performance! Jeff Rumburg, Managing Partner, MetricNet, LLC Characteristics of a World-Class Contact Center Contact center consistently exceeds customer expectations
Call Center Benchmark
 Call Center Benchmark United States In-house/Insourced Call Centers Report Contents Benchmarking Overview Page 2 KPI Statistics and Quartiles Page 8 Benchmarking Scorecard and Rankings Page 15 Detailed
Call Center Industry Benchmark
 Call Center Industry Benchmark In-house/Insourced Call Centers Report Contents Benchmarking Overview Page 2 KPI Statistics and Quartiles Page 8 Benchmarking Scorecard and Rankings Page 15 Detailed Benchmarking
Call Center Benchmark India
 Call Center Benchmark India Outsourced Call Centers Report Contents Benchmarking Overview Page 2 KPI Statistics and Quartiles Page 8 Benchmarking Scorecard and Rankings Page 13 Detailed Benchmarking Data
Turbocharge Your Metrics. With Benchmarking. Jeff Rumburg, Managing Partner at MetricNet
 Turbocharge Your Metrics With Benchmarking Jeff Rumburg, Managing Partner at MetricNet Read the Whitepaper in HDI s Support World http://www.thinkhdi.com/library/supportworld/2017/ turbocharge-your-metrics-with-benchmarking.aspx
Unleashing the Enormous Power of Call Center KPI s. Call Center Best Practices Series
 Unleashing the Enormous Power of Call Center KPI s Call Center Best Practices Series 27 Years of Call Center Benchmarking Data Global Database More than 3,700 Call Center Benchmarks 30 Key Performance
The 80/20 Rule for Service and Support KPIs: The Metrics of Success!
 The 80/20 Rule for Service and Support KPIs: The Metrics of Success! Prepared by: Jeff Rumburg Managing Partner MetricNet, LLC @MetricNet October 2, 2018 Download ebooks and Today s Presentation https://www.metricnet.com/fusion18/
Unleashing the Enormous Power of Service Desk KPI s. Service Desk Best Practices Series
 Unleashing the Enormous Power of Service Desk KPI s Service Desk Best Practices Series Visit Our New Website at www.metricnet.com 1 1 Become a Member: It s Free! 2 MetricNet Benchmarks MetricNet Benchmarks
Service and Support as a Business
 Service and Support as a Business Creating Lasting Value in IT Service and Support MetricNet Best Practices Series Empirical Observations from Our Global Benchmarking Database Global Database More than
IT Service and Support. Key Success Factors in Higher Education
 IT Service and Support Key Success Factors in Higher Education Empirical Observations from Our Global Database Global Database More than 3,700 IT Service and Support Benchmarks 70+ Key Performance Indicators
Session 406: Contact Center Cause-and-Effect: Leveraging the Full Potential of Your KPIs Jeff Rumburg, Managing Partner, MetricNet, LLC
 Session 406: Contact Center Cause-and-Effect: Leveraging the Full Potential of Your KPIs Jeff Rumburg, Managing Partner, MetricNet, LLC 28 Years of Contact Center Benchmarking Data Global Database More
Session 204: A New World Order Managing Your Contact Center as a Business! Jeff Rumburg, Managing Partner, MetricNet
 1 Session 204: A New World Order Managing Your Contact Center as a Business! Jeff Rumburg, Managing Partner, MetricNet 2 Download Today s Presentation https://www.metricnet.com/icmidemo18/ 3 Empirical
The Call Center Balanced Scorecard
 The Call Center Balanced Scorecard Your Overall Measure of Call Center Performance! MetricNet Best Practices Series Some Common Call Center KPIs Cost Cost per Contact Cost per Minute of Handle Time Quality
The Service Desk Balanced Scorecard
 The Service Desk Balanced Scorecard Your Overall Measure of Service Desk Performance MetricNet Best Practices Series Your Speaker: Jeff Rumburg Co Founder and Managing Partner, MetricNet, LLC Winner of
Service Desk Metrics
 AN INTRO TO Service Desk Metrics An introductory guide to Service Desk Metrics including definitions, importance & key correlations. MetricNet, LLC - IT Service and Support Benchmarking - 1 TABLE OF CONTENTS
Service Desk KPIs Definitions & Correlations
 Service Desk KPIs Definitions & Correlations Learn how each of the Service Desk metrics that we benchmark is defined, why it s important, and how it correlates with other metrics. We include metrics from
From Good to Great The Emory Healthcare Success Journey! Your Speaker: Jeff Rumburg
 From Good to Great The Emory Healthcare Success Journey! Your Speaker: Jeff Rumburg Download Two KPI ebooks & Today s Presentation MetricNet.com/smw18 3 The One Year Path to World-Class Performance 4 The
Enterprise Service Desk The Greatest Career Opportunity in a Generation!
 Enterprise Service Desk The Greatest Career Opportunity in a Generation! Your Speaker: Jeff Rumburg Empirical Observations Global Database Nearly 4,000 Service and Support Benchmarks 70+ Key Performance
The ROI of ITSM Know Your Financial Impact!
 The ROI of ITSM Know Your Financial Impact! Jeff Rumburg Managing Partner MetricNet, LLC 28 Years of Service and Support Benchmarks Global Database More than 3,700 IT Service and Support Benchmarks 70+
SAMPLE REPORT. Desktop Support Benchmark DATA IS NOT ACCURATE! In-house/Insourced Desktop Support
 SAMPLE REPORT DATA IS NOT ACCURATE! Desktop Support Benchmark In-house/Insourced Desktop Support Report Number: DS-SAMPLE-IN-0617 Updated: June 2017 MetricNet s instantly downloadable Desktop Support benchmarks
Desktop Support Metrics
 AN INTRO TO Desktop Support Metrics An introductory guide to Desktop Support Metrics including definitions, importance & key correlations. MetricNet, LLC - IT Service and Support Benchmarking - 1 TABLE
SAMPLE REPORT. Desktop Support Benchmark. Outsourced Desktop Support DATA IS NOT ACCURATE!
 SAMPLE REPORT DATA IS NOT ACCURATE! Desktop Support Benchmark Outsourced Desktop Support Report Number: DS-SAMPLE-OUT-0116 Updated: January 2016 MetricNet s instantly downloadable Desktop Support benchmarks
The ROI of ITSM Know Your Financial Impact! Jeff Rumburg Managing Partner MetricNet, LLC
 The ROI of ITSM Know Your Financial Impact! Jeff Rumburg Managing Partner MetricNet, LLC Download Today s Presentation https://www.metricnet.com/fusion17/ 28 Years of Service and Support Benchmarks Global
SAMPLE REPORT. Desktop Support Benchmark DATA IS NOT ACCURATE! Outsourced Desktop Support
 SAMPLE REPORT DATA IS NOT ACCURATE! Desktop Support Benchmark Outsourced Desktop Support Report Number: DS-SAMPLE-OUT-0617 Updated: June 2017 MetricNet s instantly downloadable Desktop Support benchmarks
The ROI of ITSM. Know Your Financial Impact! MetricNet Best Practices Series
 The ROI of ITSM Know Your Financial Impact! MetricNet Best Practices Series Las Vegas, NV #HDIConf APRIL 10 APRIL 13, 2018 Leveraging Metrics to Take Southwest Airlines to a Higher Plane A Case Study Session
The SOURCE for Contact Centers
 BenchmarkPortal is the leader in Call Center Benchmarking, Call Center Training, and Call Center Consulting. Since its beginnings in 1995 under Dr. Jon Anton of Purdue University, BenchmarkPortal has grown
ICMI PROFESSIONAL CERTIFICATION
 ICMI PROFESSIONAL CERTIFICATION Contact Center Management Competencies The ICMI Professional Certification Contact Center Management Competencies specify job role-specific knowledge, skills and abilities
Glossary 1. For a complete glossary of support center terminology, please visit HDI s Web site at HDI Course Glossary
 Glossary 1 Term Abandon Before Answer (ABA) Rate The percentage of customers that terminate a call (i.e., hang up) before the call is answered. ABA is a leading indicator that is used to manage staffing
LEGAL SERVICE DESK SUPPORT
 2nd Edition September 2011 THE GURU S GUIDE FOR LEGAL SERVICE DESK SUPPORT LAW FIRM SPECIFIC METRICS & KEY PERFORMANCE INDICATORS 1 GURU S GUIDE: DATA & SYSTEM ASSUMPTIONS As was the case with the original
Metrics Mania: What, Why, and How (do I compare)?
?") Metrics Mania: What, Why, and How (do I compare)? Credit Union Call Center Conference October 18, 2016 Las Vegas Strategic Contact 9510 SW 151 st Avenue Beaverton, OR 97007 phone 503.579.8560 toll free
Metrics Mania: What, Why, and How (do I compare)? Credit Union Call Center Conference October 18, 2016 Las Vegas Strategic Contact 9510 SW 151 st Avenue Beaverton, OR 97007 phone 503.579.8560 toll free
Walt Disney World Dolphin Resort Orlando, FL May 22 25, 2018
 Session 405: Maximizing the ROI of Customer Care Jeff Rumburg, Managing Partner, MetricNet, LLC 28 Years of Contact Center Benchmarking Data Global Database Nearly 4,000 Contact Center Benchmarks 70+ Key
Travel Services. When your business runs smoothly, you ll gain travelers loyalty.
 Travel Services When your business runs smoothly, you ll gain travelers loyalty. From frequent traveler programs to ticketing and reservations, we manage back-end processes so you can grow customer relationships.
CX Best Practice Award Winner
 CX Best Practice Award Winner for CSR Career Development VSP Vision Care published 03-30-2018 CX Best Practice Success Story CSR Career Development Company Description VSP Vision Care, a VSP Global company,
2012 International Customer Management Institute (ICMI). All Rights Reserved icmi.com I
. All Rights Reserved icmi.com I") Welcome to Presented by: Jean Bave-Kerwin JBK Consulting Contact Center Metrics: What Metrics Matter and Why August 24, 2012 2:00 4:00 PM Eastern 1 Today s Agenda 1 2 KPIs What are they and why do you
Welcome to Presented by: Jean Bave-Kerwin JBK Consulting Contact Center Metrics: What Metrics Matter and Why August 24, 2012 2:00 4:00 PM Eastern 1 Today s Agenda 1 2 KPIs What are they and why do you
Laura Grimes Small Contact Centers: Forecasting and Scheduling
 Welcome to Presented by: Laura Grimes Small Contact Centers: Forecasting and Scheduling February 27, 2013 2:00 4:00 PM EST CEO, Harrington Consulting Group 1 Agenda Characteristics of small contact centers
Award for Continuous Improvement Process: Millennium1 Solutions. published
 Call Center FCRCX Best Practice Award Best Practice AwardWinner Winner Award for Continuous Improvement Process: Millennium1 Solutions published 09-21-2017 CX Awards-Winning Best Practice Success Story
CONTACT CENTER SOLUTIONS
 BROCHURE CONTACT CENTER SOLUTIONS STRENGTHEN CUSTOMER RELATIONSHIPS WHILE PROTECTING THE BOTTOM LINE. Your contact center is the primary interface to your organization, for your most valuable asset your
Getting Workforce Optimization Right
 Getting Workforce Optimization Right How to align agent training and management with customer needs An Ovum White Paper sponsored by Publication Date: July 2011 INTRODUCTION Although the economy is seemingly
Top 35 Reasons You Need Contact Center Performance Management
 Top 35 Reasons You Need Contact Center Performance Management February 2014 Sponsored by: - 1 - DMG Consulting LLC Table of Contents Introduction... 1 Real-Time and Historical CCPM... 1 Top Reasons to
Key Service Qualities to Build Cardmember Satisfaction and Profitability
 Key Service Qualities to Build Cardmember Satisfaction and Profitability The best strategic thinkers at your credit union have developed a set of compelling consumer credit card products and a fail-proof
THE RIGHT WORDS AND PHRASES
 THE RIGHT WORDS AND PHRASES 1. Good vs. Very Good 2. VoC and VoCC to Increase Customer Satisfaction 3. The Emotional Experience 4. Quality Scoring 5. Customer Life Time Value WHAT WE DO Contact Centre
MEASURING WHAT MATTERS
 MEASURING WHAT MATTERS Overview Discussion document and considerations key performance measures that would form the core of a unique, simplified method of measurement called a VALUE Indicator Score. It
QUT Benchmarking Measures mapped against the WPP University HR Advisory Standards Approach
 Page 1 of 17 QUT Benchmarking Measures mapped against the P University HR Advisory Standards Approach Page 2 of 17 Background and Context During the course of the development of the P University HR Standards,
Session 309 C-Level Success, and the Secret Weapon of Service and Support Jeff Rumburg Managing Partner MetricNet, LLC
 Session 309 C-Level Success, and the Secret Weapon of Service and Support Jeff Rumburg Managing Partner MetricNet, LLC 28 Years of Service and Support Benchmarking Data Global Database More than 3,700
Impact 360: Your single-source workforce optimization solution
 Impact 360: Your single-source workforce optimization solution Now You Can: Unify performance management, workforce management, full-time recording, quality monitoring, and elearning under one platform
Award for Escalation CSR Support:
 Call Center FCR Best Practice Award Contact Center FCR Best Practice AwardWinner Winner Award for Escalation CSR Support: Blue Shield Blue Cross of Massachusetts published 05-12-2016 Escalation CSR Support
Five Steps to Aligning KPIs and Balanced Scorecards in Contact Centers
 Five Steps to Aligning KPIs and Balanced Scorecards in Contact Centers You can t manage what you don t measure is an old axiom but an important one in today s contact center environment. In an effort to
Information Technology Analysis Hydro-Quebec Management Presentation. October 30th 2004
 Information Technology Analysis October 30th 2004 Table of Contents Analysis Methodology Objectives and Scope of Analysis Executive Summary Page 1 Analysis Methodology x Page 2 Benchmark Methodology Overview
GSIL s Recruitment & Retention News for Attendant Care Workers (ACW)
") System Advocacy for Attendant Care Workers (ACW) by Jeff Dickinson GSIL recognizes the long-standing need to increase the rate of pay of attendant care workers to make these positions competitive with
System Advocacy for Attendant Care Workers (ACW) by Jeff Dickinson GSIL recognizes the long-standing need to increase the rate of pay of attendant care workers to make these positions competitive with
MITEL MiCONTACT CENTER ENTERPRISE & BUSINESS FOR THE MIVOICE BUSINESS PLATFORM
 BROCHURE MITEL MiCONTACT CENTER ENTERPRISE & BUSINESS FOR THE MIVOICE BUSINESS PLATFORM STRENGTHEN CUSTOMER RELATIONSHIPS WHILE PROTECTING THE BOTTOM LINE. Your contact center is the primary interface
its measurement and impact
 A POINT OF VIEW PAPER First call resolution its measurement and impact relationship management First Call Resolution: its Measurement and Impact First call resolution is the new service level. ~ Keith
EXL 2016 Performance Report. Stacie Loucks, Executive Director May 2, 2016
 EXL 2016 Performance Report Stacie Loucks, Executive Director May 2, 2016 Millions $3 $3 $2 $2 $1 $1 $- Budget $2.82 Personnel Services 2015 EXPENSES: Budget vs. Actual $2.65 $1.37 $0.72 Supplies, Material
To be used in conjunction with Contact Center Benchmarking Survey.
 GLOSSARY OF TERMS FOR CONTACT CENTERS To be used in conjunction with Contact Center Benchmarking Survey. Also used as a reference and resource for ROI Analyses and Onsite Assessments of performance, including
Transforming Internal Audit to Drive Business Performance. 21 June, 2011
 Transforming Internal Audit to Drive Business Performance 21 June, 2011 Agenda Stakeholder Needs from Survey Data Linking Business Performance to Internal Audit The Role of Risk Management Becoming a Strategic
OMNI-CHANNEL CUSTOMER CARE: HOW TO DELIVER CONTEXT-DRIVEN EXPERIENCES
 RR OMNI-CHANNEL CUSTOMER CARE: HOW TO DELIVER CONTEXT-DRIVEN EXPERIENCES October 2017 Omer Minkara VP and Principal Analyst, Contact Center and Customer Experience Management Using more channels is no
From Strategy to Action
 From Strategy to Action Creating the 2020 Contact Center May 2018 Service Territory Eversource is New England s largest energy delivery company, with approximately 4 million electric, natural gas, and
the council initiative on public engagement
 public engagement at the city of edmonton share your voice shape our city the council initiative on public engagement new public engagement practice and implementation roadmap final report CITY OF EDMONTON
SYNCHRONY CONNECT. Making an Impact with Direct Marketing Test and Learn Strategies that Maximize ROI
 SYNCHRONY CONNECT Making an Impact with Direct Marketing Test and Learn Strategies that Maximize ROI SYNCHRONY CONNECT GROW 2 Word on the street is that direct marketing is all but dead. Digital and social
ENTERPRISE WORKFORCE OPTIMIZATION:
 #Verint13 ENTERPRISE WORKFORCE OPTIMIZATION: The Evolution of a Continuous Improvement Culture June 2014 May 1, 2014 LCN-937349-060214 Lincoln Financial Group is the marketing name of Lincoln National
Knowledge Management in the Contact Center. Best Practice Guide
 Knowledge Management in the Contact Center Best Practice Guide Table of Contents Executive Summary... 3 Determining Objectives and Metrics... 4 Planning an Implementation Strategy... 5 Developing a Strong
AVAYA WORKFORCE OPTIMIZATION SELECT
 AVAYA WORKFORCE OPTIMIZATION SELECT AT A GLANCE By generating relevant and timely insights into the customer experience and leveraging this information to improve agent and team performance, AWFOS helps
ICMI s Customer Management Operation Standards provide a results-driven framework for advancing the contact center s overall performance.
 ICMI Customer Management Operations Standards Leadership Strategy and Planning Employee Management Infrastructure Process and Procedures Employee Engagement Measurement Process Customer Experience Management
Masterclass in Resource Planning. Beyond the basic: Exploding some common misconceptions
 Masterclass in Resource Planning Beyond the basic: Exploding some common misconceptions 13 May, 2015 Introducing John Frehse John Frehse is an internationally recognised expert in the field of labour management.
BlueDirect BlueCross Blue Shield of Florida
 BlueDirect BlueCross Blue Shield of Florida Making Best Practices Benchmarking a Transformational Tool The Challenge "So where do I go from here?" Jackie Coffey asked herself. She had just been named Director
Staffing Strategies for the 21 st Century
 Staffing Strategies for the 21 st Century Katherine Spencer Lee Executive Director, Robert Half Technology HDI Northern New England September 18, 2008 Robert Half Technology. An Equal Opportunity Employer
Strategic Growth Leaders DEVELOPING YOUR PLAN FOR GROWTH
 Strategic Growth Leaders DEVELOPING YOUR PLAN FOR GROWTH Agenda About SGL Recap on Strategic Planning Implementing the Plan 3P s & 3C s Case study Tea & Coffee Some Examples & Discussion CFO Forum About
Recruiting and Retention Remain Top Challenges
 February 2018 Like many other aspects of the financial services industry, the call center as we know it is changing. Technology is disrupting historic practices and generating new, client-centric demands
WORKFORCE MANAGEMENT NICE IEX WFM. Scott Buchanan Workforce Optimization, Marketing
 WORKFORCE MANAGEMENT NICE IEX WFM Scott Buchanan Workforce Optimization, Marketing August 6, 2013 INTRO VALUE PROP DELIVERY MODEL BACK OFFICE PERFORMANCE MANAGER QUESTIONS THERE IS NO WFM EASY BUTTON.
CUSTOMER EXPERIENCE: REAL BENEFITS FOR FINANCIAL INSTITUTIONS. by David Tilson
 REAL BENEFITS FOR FINANCIAL by David Tilson After turning off the radio, Peggy took a long sip from her coffee. Before emerging from the comfort of her car for a long walk into the Building that housed
THE CUSTOMER EXPERIENCE MANAGEMENT REPORT & RECOMMENDATIONS Customer Experience & Beyond
 www.sandsiv.com THE CUSTOMER EXPERIENCE MANAGEMENT REPORT & RECOMMENDATIONS TM 1 Customer Experience & Beyond www.sandsiv.com TM Customer Experience & Beyond Legal Notice: Sandsiv 2015. All Rights Reserved.
SESSION 607 Thursday, April 14, 2:45pm - 3:45pm Track: Metrics and Measurements. The Good, Bad and Ugly of Service Desk Metrics. Session Description
 SESSION 607 Thursday, April 14, 2:45pm - 3:45pm Track: Metrics and Measurements The Good, Bad and Ugly of Service Desk Metrics Gary Case Principal Consultant, Pink Elephant g.case@pinkelephant.com Session
Inbound Strategy, Outbound Strategy and the Most Important Strategy of All: Blending Them Into a Seamless Interaction for Your Customers
 Inbound Strategy, Outbound Strategy and the Most Important Strategy of All: Blending Them Into a Seamless Interaction for Your Customers Introduction Ensure your contact center provides a better experience
ON-THE-JOB TRAINING BLUEPRINT
 ON-THE-JOB TRAINING BLUEPRINT SUPERVISOR MODULE BUILDING EFFECTIVE CALL CENTRE WORK TEAMS Developed in collaboration with Customer Service Transformation Pte Ltd Copyright Singapore Productivity and Standards
Effectively Managing Communications with Customers During a Service Outage
 WHITE PAPER Applications Effectively Managing Communications with Customers During a Service Outage An emergency or outage can result in a sudden flood of calls to your business. Keep customers informed
WHITE PAPER February Pay-for-Performance Solutions A Delivery Model for a Risk-free, Turnkey Customer Acquisition Channel
 WHITE PAPER February 2009 Pay-for-Performance Solutions Introduction Though the success of live chat is generally well-documented, many ecommerce managers today have deep concerns about implementing it
COGENT REPORTS. Agile Experienced. Powerful. Accurate. In 2018 we are changing the rules!
 cogent-reports.com COGENT Agile Experienced Reliable Powerful Revolutionary Accurate Trusted Consultative REPORTS In 2018 we are changing the rules! Introducing new capabilities and offerings designed
The Total Economic Impact Of ServiceNow Customer Service Management How Epicor Software Achieves 104% ROI by Transforming Global Customer Support
 The Total Economic Impact Of ServiceNow Customer Service Management How Epicor Software Achieves 104% ROI by Transforming Global Customer Support Anish Shah Principal Consultant Forrester Research Ian
CX Best Practice Award Winner
 CX Best Practice Award Winner for Escalation CSR Support Regence Blue Cross and Blue Shield Plans (Idaho, Oregon, Utah & select counties of Washington State) published 03-30-2018 CX Best Practice Success
Verint Engagement Management Solution Brief. Overview of the Applications and Benefits of
 Verint Engagement Management Solution Brief Overview of the Applications and Benefits of Verint Engagement Management November 2015 Table of Contents Introduction... 2 Verint Engagement Management Advantages...
Collections & Customer Service Flex Agent Proposal
 Collections & Customer Service Flex Agent Proposal Executive Summary 12/01/05 Submitted for consideration for CWPP certification suggested Project #9 Problem Statement Executive Management of a Financial
Next Generation Contact Centre Solution Framework Whitepaper
 Next Generation Contact Centre Solution Framework Whitepaper The key is to understand what does a expects he connect with a contact centre The answer is certainly not only a quick resolution Contact centres
Defining Quality and Efficiency Metrics in an HR SSC. July 24, 2013
 Defining Quality and Efficiency Metrics in an HR SSC July 24, 2013 Housekeeping This webinar is approved for 1.0 hours of recertification credit. You MUST attend for the entire 60 minutes to receive credit.
Award for Call Handling:
 Call Center FCR Best Practice Award Contact Center FCR Best Practice AwardWinner Winner Award for Call Handling: Canadian Tire Bank published 05-12-2016 Call Handling Best Practice Success Story Company
Call Center FCR Best Practice Award Winner Gold Award for Call Handling: Canadian Tire Financial Services
 Call Center FCR Best Practice Award Winner Gold Award for Call Handling: Canadian Tire Financial Services published 03-10-2015 Canadian Tire Financial Services Company Description CTFS is the financial
2017 Contact Center Overflow Vendor Request for Proposals Responses to RFP Questions
 2017 Contact Center Overflow Vendor Request for Proposals Responses to RFP Questions May 5, 2017 All questions are addressed below: Q1: Will the vendor s geographic location(s) or potential location(s)
The Ultimate Guide to Performance Check-Ins
 The Ultimate Guide to Performance Check-Ins The Ultimate Guide to Performance Check-Ins January 2017 1 Table of Contents 03 Introduction 03 Definition of the Performance Check-In 04 05 Rise of Check- Ins
Administrative Response and Timelines PwC Human Resources (HR) Health Check Engagement
 Health Check Engagement") Administrative Response and Timelines PwC Human Resources (HR) Health Check Engagement Recommendation That the report of the General Manager, Corporate Performance Department, dated March 5, 2018, be received
Administrative Response and Timelines PwC Human Resources (HR) Health Check Engagement Recommendation That the report of the General Manager, Corporate Performance Department, dated March 5, 2018, be received
Sponsored By: Contact Center Best Practices: Using Training to Achieve Enterprise Goals
 Sponsored By: Contact Center Best Practices: Using Training to Achieve Enterprise Goals Table of Contents I. Training is Essential for Business Transformation...1 II. Scenario 1: The Role of Training in
Best Managed Lab Experience 2018 Imperial Oil Branded Reseller Leadership Conference. May 2, 2018
 Best Managed Lab Experience 2018 Imperial Oil Branded Reseller Leadership Conference May 2, 2018 What is the Best Managed companies program? A unique program recognized locally and globally Focuses on
SAP Performance Benchmarking Human Capital Management Benchmarking Results. Company: ABC Company 6/25/2012
 SAP Performance Benchmarking Benchmarking Results Company: ABC Company 6/5/0 Statement of Confidentiality and Exceptions The information and analysis contained herein are the confidential and proprietary
BUILDING CREDIBLE BUSINESS CASES FOR CONTACT CENTER PROJECTS: HOW TO USE PROCESS-DRIVEN ANALYSIS TO PRODUCE ROI PROJECTIONS THAT GET PROJECTS FUNDED
 BUILDING CREDIBLE BUSINESS CASES FOR CONTACT CENTER PROJECTS: HOW TO USE PROCESS-DRIVEN ANALYSIS TO PRODUCE ROI PROJECTIONS THAT GET PROJECTS FUNDED By Brian Hinton Senior Consultant Strategic Contact,
Introduction 3. Customer Service Optimization Cycle 3. Agent Effectiveness 5. Contact Center Performance 7. Enterprise Performance 8
 AGENT EFFECTIVENESS TO ENTERPRISE PERFORMANCE: Evolution of the Customer Service Optimization Cycle TABLE OF CONTENTS TABLE OF CONTENTS Introduction 3 Customer Service Optimization Cycle 3 Agent Effectiveness