HR Service Center Benchmark. Company XYZ
|
|
|
- Suzanna Hampton
- 6 years ago
- Views:
Transcription
1 Company XYZ

2 Your Project Manager: Jeff Rumburg Co Founder and Managing Partner, MetricNet, LLC Winner of the 2014 Ron Muns Lifetime Achievement Award Former CEO, The Verity Group Former Vice President, Gartner Founder of the Service Desk Benchmarking Consortium Author of A Hands-On Guide to Competitive Benchmarking Harvard MBA, Stanford MS 2016 MetricNet, LLC, 1
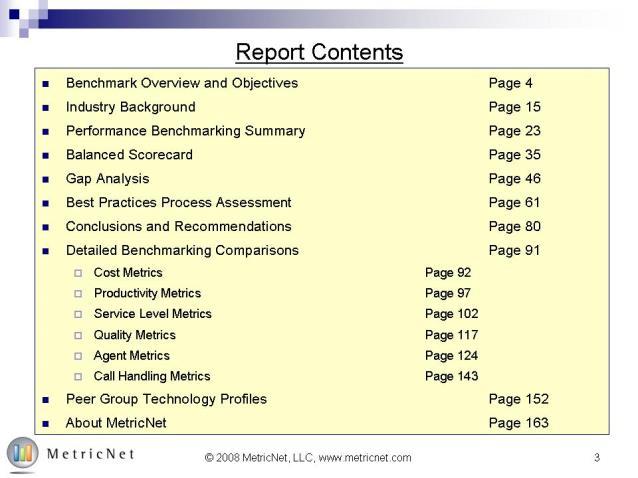
3 Report Contents Project Overview and Objectives Page 2 Industry Background Page 39 Performance Benchmarking Summary Page 50 Best Practices Process Assessment Page 73 Conclusions and Recommendations Page 87 Detailed Benchmarking Comparisons Page 115 Cost and Price Metrics Page 116 Productivity Metrics Page 127 Service Level Metrics Page 136 Quality Metrics Page 143 Technician Metrics Page 150 Contact Handling Metrics Page 165 About MetricNet Page 171 2

4 Project Overview and Objectives Company XYZ 3
5 Project Objectives Review and assess the performance of the Company XYZ Service Desk Benchmark the performance of Company XYZ against a peer group of comparable Service Desks Complete a Best Practices Process Assessment of the Company XYZ Service Desk Recommend strategies for improved performance Achieve world-class levels of support Maximize customer satisfaction 4
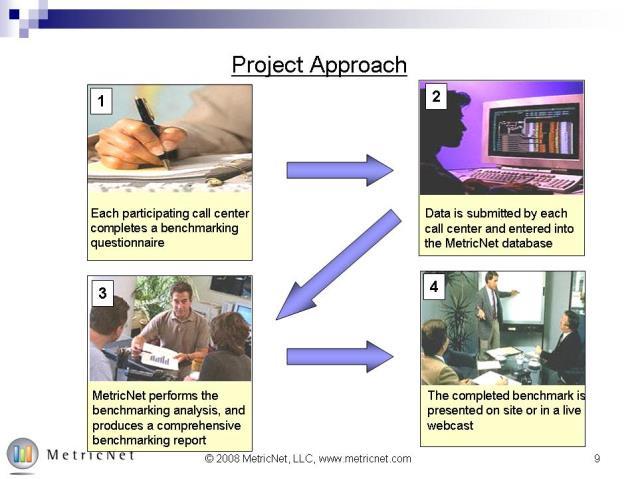
6 Project Approach Module 1: Company XYZ Baselining / Data Collection Module 2: Benchmarking and Gap Analysis Module 3: Balanced Scorecard Module 4: Best Practices Process Assessment Module 5: Strategies for Improved Performance Module 6: Report Development and Presentation of Results 5
7 Module 1: Company XYZ Baselining/Data Collection Core Topics Project Kickoff Data Collection 6


8 Project Kickoff Meeting Company XYZ Key Objectives: Project Kickoff Meeting Introduce the MetricNet and Company XYZ project teams Discuss the project schedule Distribute the data collection document Answer questions about the project 7

9 Data Collection 8
10 Module 2: Benchmarking and Gap Analysis Core Topics Peer Group Selection Benchmarking Comparison Gap Analysis 9


11 Peer Group Selection Scope Scale Complexity IDEAL PEER GROUP Geography Read MetricNet s whitepaper on Benchmarking Peer Group Selection. Go to metricnet.com to get your copy! 10
12 Dynamic Peer Group Selection Scope Scale Complexity Geography Scope refers to the services offered by the Service Desk. The broader the scope of services offered, the broader the skill set required by the agents. As scope increases, so too does the cost of providing support. The Service Desks selected for benchmarking comparison must be comparable in the scope of services offered. Volume refers to the number of contacts handled by the Service Desk. Virtually everything in the Service Desk is subject to scale economies. This is particularly true when it comes to the volume of contacts handled. The approximate scale effect for volume is 5%. What this means is that every time the number of transactions doubles, you should expect to see the cost per contact decline by 5%. For this reason, it is important to select benchmarking peer groups that are similar in scale. The complexity of transactions handled will influence the handle time, and hence the cost per transaction. For example, a password reset is a simple transaction that takes very little time, and costs very little to resolve. By contrast, an inquiry for a complex application like SAP takes much longer and costs much more to resolve. MetricNet uses a proprietary algorithm to determine a weighted complexity index based upon the mix of transactions handled by a Service Desk. The companies chosen for a benchmarking peer group will have similar complexity factors. The main factor that is affected by geography is cost; specifically labor cost. Since labor accounts for 65% of service desk operating expense, it is important to benchmark service desks that have a common geography. Even within a particular geography, wage rates can differ significantly, so MetricNet makes adjustments to ensure that each Service Desk in a benchmarking peer group is normalized to the same wage rate. 11


13 Service Desk Benchmark: Key Questions Answered Key Questions How is your Service Desk performing? How does your Service Desk compare to other comparable Service Desks? What are the strengths and weaknesses of your Service Desk? What are the areas of improvement for your Service Desk? How can you enhance Service Desk performance and achieve world-class status? MetricNet s Benchmarking Database Service Desk Benchmark Gap Analysis Improvement Recommendations Realized Performance Gains Company XYZ Service Desk Data 12


14 The Benchmarking Methodology Company XYZ Service and Support Performance COMPARE Performance of Benchmarking Peer Group Determine How Best in Class Achieve Superiority Adopt Selected Practices of Best in Class The ultimate objective of benchmarking Build a Sustainable Competitive Advantage Read MetricNet s whitepaper on Service Desk Benchmarking. Go to to receive your copy! 13
15 Summary of Included Benchmarking Metrics Cost Quality Productivity Cost per Inbound Contact Cost per Minute of Inbound Handle Time Price per Inbound Contact Price per Minute of Handle Time Customer Satisfaction First Contact Resolution Rate Call Quality Inbound Contacts per Technician per Month Technician Utilization Technicians as a % of Total Headcount First Level Resolution Rate Technician Service Level Call Handling Annual Technician Turnover Daily Technician Absenteeism Schedule Adherence New Technician Training Hours Annual Technician Training Hours Average Speed of Answer (ASA) % of Calls Answered in 30 seconds Call Abandonment Rate Inbound Contact Handle Time User Self-Service Completion Rate Technician Tenure Technician Job Satisfaction 14
16 Benchmarking KPI Performance Summary Metric Type Key Performance Indicator (KPI) Company XYZ Peer Group Statistics Average Min Median Max Cost Productivity Service Level Quality Technician Contact Handling Cost per Inbound Contact $8.42 $11.93 $7.09 $11.40 $20.50 Cost per Minute of Inbound Handle Time $1.46 $1.64 $1.03 $1.54 $2.43 Price per Inbound Contact (PC Helps) $14.59 $15.84 $7.54 $14.62 $24.28 Price per Minute of Handle Time (PC Helps) $1.87 $2.07 $1.25 $2.02 $3.51 First Level Resolution Rate N/A 82.3% 73.7% 82.9% 97.5% Inbound Contacts per Technician per Month Technician Utilization 54.9% 48.1% 30.8% 50.3% 62.7% Technicians as a % of Total Headcount 79.0% 84.5% 75.2% 83.5% 93.7% Average Speed of Answer (ASA) (seconds) % of Calls Answered in 30 Seconds 2.6% 43.9% 2.6% 44.4% 85.8% Call Abandonment Rate 15.3% 6.4% 1.1% 5.9% 15.3% Call Quality N/A 83.7% 65.1% 83.9% 94.5% First Contact Resolution Rate 57.6% 71.6% 57.6% 70.4% 91.4% Customer Satisfaction 87.6% 78.2% 63.1% 76.1% 96.7% Annual Technician Turnover 31.3% 40.7% 13.6% 40.3% 65.6% Daily Technician Absenteeism 10.3% 10.8% 4.7% 10.1% 24.2% Schedule Adherence 89.7% 83.4% 72.7% 83.8% 90.8% New Technician Training Hours Annual Technician Training Hours Technician Tenure (months) Technician Job Satisfaction 99.0% 70.3% 53.3% 66.8% 99.0% Inbound Contact Handle Time (minutes) User Self-Serve Completion Rate 0.0% 9.2% 0.0% 7.9% 25.2% 15
17 Quality (Effectiveness) Cost vs. Quality for Company XYZ Service Desk Higher Quality Middle Quartiles Effective but not Efficient Top Quartile Efficient and Effective Company XYZ Service Desk Global Database Lower Quality Lower Quartile Middle Quartiles Efficient but not Effective Higher Cost Cost (Efficiency) Lower Cost 16
18 Module 3: Balanced Scorecard Core Topics Metrics Selection Metric Weightings Scorecard Construction 17
19 The Service Desk Scorecard: An Overview The Service Desk scorecard employs a methodology that provides you with a single, all-inclusive measure of your Service Desk performance It combines cost, service level, productivity, and quality metrics into an overall performance indicator for your Service Desk Your Service Desk score will range between 0 and 100%, and can be compared directly to the scores of other Service Desks in the benchmark By computing your overall score on a monthly or quarterly basis, you can track and trend your performance over time Charting and tracking your Service Desk score is an ideal way to ensure continuous improvement in your Service Desk! 18
20 Performance Metric The Service Desk Scorecard Metric Weighting Performance Range Worst Case Best Case Your Performance Metric Score Balanced Score Cost per Inbound Contact 25.0% $20.50 $7.09 $ % 22.5% Customer Satisfaction 25.0% 63.1% 96.7% 87.6% 72.9% 18.2% Technician Utilization 15.0% 30.8% 62.7% 54.9% 75.5% 11.3% First Contact Resolution Rate 15.0% 57.6% 91.4% 57.6% 0.0% 0.0% Technician Job Satisfaction 10.0% 53.3% 99.0% 99.0% 100.0% 10.0% % of Calls Answered in 30 Seconds 10.0% 2.6% 85.8% 2.6% 0.0% 0.0% Total 100.0% N/A N/A N/A N/A 62.1% Step 1 Six critical performance metrics have been selected for the scorecard Step 2 Each metric has been weighted according to its relative importance Step 3 For each performance metric, the highest and lowest performance levels in the benchmark are recorded Step 4 Your actual performance for each metric is recorded in this column Step 5 Your score for each metric is then calculated: (worst case actual performance) / (worst case best case) X 100 Step 6 19 Your balanced score for each metric is calculated: metric score X weighting
21 Balanced Scores Balanced Scorecard Summary* 65.0% 60.0% 55.0% Key Statistics Service Desk Scores High 63.8% Average % Median 47.2% Low 31.6% Company XYZ 62.1% 50.0% 45.0% 40.0% 35.0% 30.0% 25.0% XYZ Service Desk *The scores shown in the chart are based upon the performance metrics, weightings, and data ranges shown on the previous page. 20
22 Overall Ranking Scorecard Performance Rankings Cost per Inbound Contact First Contact Resolution Rate % of Calls Answered in 30 Seconds Service Desk Number Customer Satisfaction Technician Utilization Technician Job Satisfaction 1 6 $ % 50.8% 91.4% 88.3% 53.1% 63.8% 2 9 $ % 52.4% 68.5% 74.7% 40.3% 63.2% 3 21 $ % 35.2% 90.0% 89.8% 73.0% 62.7% 4 13 $ % 48.5% 78.8% 78.5% 60.2% 62.5% 5 Company XYZ $ % 54.9% 57.6% 99.0% 2.6% 62.1% 6 22 $ % 55.5% 73.1% 71.8% 27.4% 60.4% 7 3 $ % 56.9% 71.1% 66.8% 17.1% 59.4% 8 5 $ % 47.9% 70.4% 65.6% 62.1% 54.5% 9 18 $ % 53.3% 71.1% 65.3% 44.4% 53.8% $ % 52.6% 72.3% 72.3% 49.1% 49.3% $ % 57.8% 64.8% 53.3% 16.4% 49.3% 12 1 $ % 47.8% 67.5% 66.2% 29.8% 47.2% 13 7 $ % 52.9% 72.9% 66.0% 53.0% 46.9% 14 8 $ % 36.3% 75.1% 66.8% 60.4% 46.6% $ % 45.3% 68.7% 55.3% 37.8% 46.1% $ % 47.5% 69.1% 61.7% 65.8% 45.2% $ % 50.3% 68.1% 72.2% 23.7% 44.9% $ % 62.7% 63.5% 57.0% 23.6% 43.2% 19 2 $ % 39.8% 69.1% 63.2% 42.4% 42.5% $ % 42.3% 66.7% 68.0% 50.0% 41.5% $ % 50.8% 67.8% 57.6% 35.4% 40.1% $ % 33.7% 74.9% 79.2% 56.6% 38.1% 23 4 $ % 30.8% 73.2% 78.3% 85.8% 31.6% Average $ % 48.1% 71.6% 70.3% 43.9% 50.2% Key Statistics Scorecard Metrics Total Balanced Score Max $ % 62.7% 91.4% 99.0% 85.8% 63.8% Min $ % 30.8% 57.6% 53.3% 2.6% 31.6% Median $ % 50.3% 70.4% 66.8% 44.4% 47.2% 21
23 Cost per Inbound Contact KPI Data in Rank Order Scorecard Metrics First Contact Resolution Rate % of Calls Answered in 30 Seconds Customer Satisfaction Technician Utilization Technician Job Satisfaction Company XYZ $ % 54.9% 57.6% 99.0% 2.6% 62.1% Ranking Quartile $ % 62.7% 91.4% 99.0% 85.8% 63.8% 2 $ % 57.8% 90.0% 89.8% 73.0% 63.2% 3 $ % 56.9% 78.8% 88.3% 65.8% 62.7% 4 $ % 55.5% 75.1% 79.2% 62.1% 62.5% 5 $ % 54.9% 74.9% 78.5% 60.4% 62.1% 6 $ % 53.3% 73.2% 78.3% 60.2% 60.4% 7 $ % 52.9% 73.1% 74.7% 56.6% 59.4% 8 $ % 52.6% 72.9% 72.3% 53.1% 54.5% 9 $ % 52.4% 72.3% 72.2% 53.0% 53.8% 10 $ % 50.8% 71.1% 71.8% 50.0% 49.3% 11 $ % 50.8% 71.1% 68.0% 49.1% 49.3% 12 $ % 50.3% 70.4% 66.8% 44.4% 47.2% 13 $ % 48.5% 69.1% 66.8% 42.4% 46.9% 14 $ % 47.9% 69.1% 66.2% 40.3% 46.6% 15 $ % 47.8% 68.7% 66.0% 37.8% 46.1% 16 $ % 47.5% 68.5% 65.6% 35.4% 45.2% 17 $ % 45.3% 68.1% 65.3% 29.8% 44.9% 18 $ % 42.3% 67.8% 63.2% 27.4% 43.2% 19 $ % 39.8% 67.5% 61.7% 23.7% 42.5% 20 $ % 36.3% 66.7% 57.6% 23.6% 41.5% 21 $ % 35.2% 64.8% 57.0% 17.1% 40.1% 22 $ % 33.7% 63.5% 55.3% 16.4% 38.1% 23 $ % 30.8% 57.6% 53.3% 2.6% 31.6% Average $ % 48.1% 71.6% 70.3% 43.9% 50.2% Max $ % 62.7% 91.4% 99.0% 85.8% 63.8% Min $ % 30.8% 57.6% 53.3% 2.6% 31.6% Median $ % 50.3% 70.4% 66.8% 44.4% 47.2% Total Balanced Score 22
24 Service Desk Balanced Score Overall Service Desk Scorecard Trend 85% 80% 75% 70% 65% 60% 55% 50% 45% 40% Jan Feb Mar Apr May Jun Jul Aug Sep Oct Nov Dec 12 Month Average Monthly Score Sample Data Only 2016 MetricNet, LLC, 23
25 Module 4: Best Practices Process Self Assessment Core Components Company XYZ Self Assessment MetricNet Maturity Ranking Process Assessment Rollup 2016 MetricNet, LLC, 24
26 Six-Part Model for Service Desk Best Practices Model Component Definition Strategy Strategy Defining Your Charter and Mission Stakeholder Communication Customer Enthusiasm Human Resources Human Resources Proactive, Life-cycle Management of Personnel Process Expeditious Delivery of Customer Service Performance Measurement Technology Process Technology Leveraging People and Processes Performance Measurement A Holistic Approach to Performance Measurement Stakeholder Communication Proactively Managing Stakeholder Expectations 25
27 Best Practices Evaluation Criteria Ranking Explanation 1 No Knowledge of the Best Practice. 2 Aware of the Best Practice, but not applying it. 3 Aware of the Best Practice, and applying at a rudimentary level. 4 Best Practice is being effectively applied. 5 Best Practice is being applied in a world-class fashion. 26
28 Company XYZ Self Assessment Best Practice Strategy Best Practices Defined Company XYZ's Score Peer Group Average The Service Desk has a well-defined mission, vision, and strategy. The vision and strategy are well-documented, and communicated to key stakeholders in the organization The Service Desk has a published Service Catalog, including a Supported Products List, that is distributed and communicated to key stakeholders including end users. The Service Catalog is available on-line. The Service Desk has an action plan for continuous improvement. The plan is documented and distributed to key stakeholders in the organization, and specific individuals are held accountable for implementing the action plan. The Service Desk is well integrated into the information technology function. The service desk acts as the "voice of the user" in IT, and is involved in major IT decisions and deliberations that affect end users. The Service Desk is alerted ahead of time so that they can prepare for major rollouts, or other changes in the IT environment. The Service Desk has SLA's that define the level of service to be delivered to users. The SLA's are documented, published, and communicated to key stakeholders in the organization The Service Desk has OLA's (Operating Level Agreements) with other support groups in the organization (e.g., level 2 support, desktop support, field support, etc.). The OLA's clearly define the roles and responsibilities of each support group, and the different support groups abide by the terms of the OLA's. The Service Desk actively seeks to improve Level 1 Resolution Rates, First Contact Resolution Rates, Level 0 Resolution Rates (User Self-Help), and Level -1 (Problem Prevention) Resolution Rates by implementing processes, technologies, and training that facilitate these Summary Statistics Total Score Average Score
29 Average Score Best Practices Process Assessment Summary Company XYZ Peer Group 28
30 Module 5: Strategies for Improved Performance Core Components Conclusions and Recommendations Roadmap for World- Class Performance 29
31 Conclusions and Recommendations Conclusions and Recommendations fall into six categories 1. Strategy 2. Human Resource Management 3. Call Handling Processes and Procedures 4. Technology 5. Performance Measurement and Management 6. Stakeholder Communication 30
32 A Summary of the Major KPI Correlations Cost per Contact Customer Satisfaction Technician Utilization First Contact Resolution Scheduling Efficiency Service Levels: ASA and AR Technicians/ Total FTE s Absenteeism/ Turnover First Level Resolution Handle Time Call Quality Technician Satisfaction Coaching Career Path Training Hours 31
33 Quality (Effectiveness) Cost vs. Quality for Global Service Desks Higher Quality Middle Quartiles Effective but not Efficient Top Quartile Efficient and Effective Your Service Desk Peer Group Lower Quality Lower Quartile Middle Quartiles Efficient but not Effective Higher Cost Cost (Efficiency) Lower Cost 32
34 Performance Targets will be Established Performance Metric Current Performance Target Performance First Contact Resolution Rate 57.6% 75.0% First Level Resolution Rate N/A 85.0% Average Speed of Answer (ASA) (seconds) % of Calls Answered in 30 Seconds 2.6% 40.0% Call Abandonment Rate 15.3% 7.0% New Technician Training Hours Service Desk Balanced Score 62.1% 74.3% Achieving the performance targets recommended above will increase the Company XYZ Balanced Score from 62.1% to 74.3%, and put Company XYZ in the top position on the Balanced Scorecard. 33
35 Module 6: Report Development and Presentation of Results Core Topics Conclusions and Recommendations Report Development Presentation of Benchmarking Results 2016 MetricNet, LLC, 34


36 Write Benchmarking Report 35
37 Presentation of Results The results of the benchmark will be presented in a live webcast Company XYZ 36
38 Deliverables include Summary of Deliverables Project Participation Kit: Project Schedule Data collection questionnaires Project Kickoff Meeting Comprehensive Assessment and Benchmarking Report Project Overview and Objectives Industry Background Benchmarking Performance Summary Balanced Scorecard Best Practices Process Assessment Conclusions and Recommendations Detailed Benchmarking Data Live Webcast Presentation of Results via GoTo Meeting 37

39 Benchmarking Schedule 38
40 Industry Background Company XYZ 39
41 27 Years of Service and Support Benchmarking Data Global Database More than 3,700 Service Desk Benchmarks 20+ Key Performance Indicators Nearly 60 Industry Best Practices 2016 MetricNet, LLC, 40
42 Then and Now: 25 Years of Benchmarking Metrics Key Performance Indicator Monthly Contacts per End- User North American Averages Cost per Contact $9.57 $21.84 Average Handle Time 6:27 12:55 Resolved on First Contact 35% 67% Resolved at Level 1 39% 85% Starting Agent Salaries (2016 dollars) Service Desk Cost per End-User per Year $27,280 $35,411 $97 $502 41
43 So What s Going on Here? Industry Megatrends: The Drivers Increasing awareness and understanding of Service Desk TCO (Total Cost of Ownership) Service Desk evolving from a support to a strategic role in the enterprise The growing importance of the Service Desk in shaping end-user opinions on IT 42
44 And What are the Implications? Industry Megatrends: The Result Increased Emphasis on First Contact Resolution (FCR) Strategic Application of Key Performance Indicators (KPI s) Investments in Tech Development New Models for Measuring Service Desk Value Renewed Emphasis on Internal Marketing Increased Starting Salaries for Techs 43
45 % Saying Very Important 90% 80% 70% 60% 50% Support Drives Customer Satisfaction for All of IT 84% n = 1,044 Global large cap companies Survey type: multiple choice 3 responses allowed per survey 47% 40% 30% 20% 31% 29% 22% 19% 10% 8% 0% Service Desk Desktop Support Network Outages VPN Training Enterprise Applications Desktop Software Factors Contributing to IT Customer Satisfaction 84% cited the service desk as a very important factor in their overall satisfaction with corporate IT 47% cited desktop support as a very important factor in their overall satisfaction with corporate IT 44
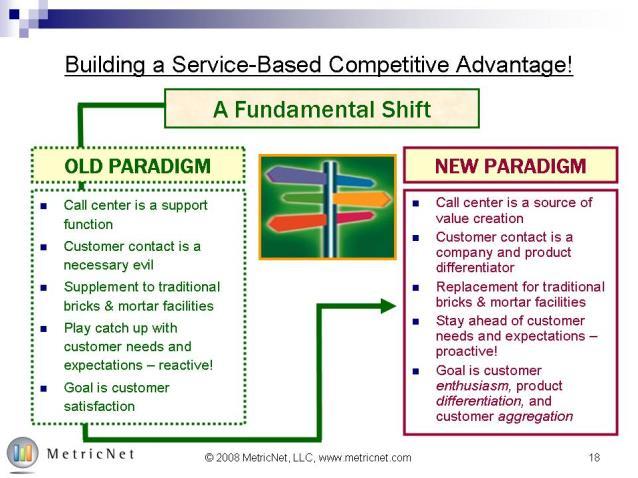
46 Building a Service-Based Competitive Advantage! A Fundamental Shift OLD PARADIGM NEW PARADIGM Service Desk is a support function Customer contact is a necessary evil Play catch up with customer needs and expectations reactive! Goal is customer satisfaction Service Desk is a source of value creation Customer contact is an IT differentiator Stay ahead of customer needs and expectations proactive! Goal is customer enthusiasm 45


47 The Service Desk Evolution Support Stage Growth Stage Strategic Stage Newer Service Desks and less evolved Service Desks are in this category Service Desks in this stage are unable to anticipate or prepare for problems A reactive fire-fighting mentality prevails at this stage Call volume continually increases at this stage Customer satisfaction is the goal Heavy investments in training and technology characterize this stage An expert network of problem solvers is established outside the Service Desk Automation begins ACD, VRU, report generation, etc. Knowledge base established Call volume oftentimes levels off The primary goal of a strategic Service Desk is to make end users more productive Service Desk anticipates problems and takes action to prevent occurrence A proactive mentality prevails Users are given tools to solve their own problems Call volume sometimes declines at this stage Problem complexity increases Customer enthusiasm and value creation is the goal! 46

48 How Far Has Your Service Desk Evolved? 61% 31% 8% Support Stage Transitional Stage Strategic Stage Traditional customer support paradigm The Service Desk makes a shift from following the customer to leading the customer The Service Desk operates in a nontraditional customer support paradigm every transaction adds value! 47
49 Characteristics of a World-Class Service Desk Service Desk consistently exceeds customer expectations Result is high levels of customer satisfaction Call quality is consistently high Costs are managed at or below industry average levels Cost per contact below average Minimizes Total Cost of Ownership (TCO) Service Desk follows industry best practices Industry best practices are defined and documented Service Desk follows industry best practices Every transaction adds value A positive customer experience Drives a positive view of IT overall 48
50 The World-Class Service Desk Defined Higher A World-Class Service Desk BEST-IN-CLASS PERFORMANCE CURVE AVERAGE PERFORMANCE CURVE An Average Service Desk Lower Cost per Contact Higher 49

51 Performance Benchmarking Summary Company XYZ 50
52 Company XYZ Service Desk Overview Service Desk Location Oak Brook, IL Hours of Operation 24 Hours x 7 Days Company XYZ $1,729,380 Annual Operating PC Helps $245,140 Expense Total $1,974,520 Company XYZ 17,114 Monthly Inbound PC Helps 1,400 Contact Volume Total 18,514 Monthly Outbound Contact Volume 747 FTE Headcount Technology Profile Tech Level Trouble Ticket System BMC Service Desk Express Supervisor/Team Lead 2.0 Customer Information System (if different from Trouble Ticket System) SUN LDAP Manager 1.0 Automatic Call Distributor (ACD) Alcatel CC Supervision Training 1.0 Workforce Management / Scheduling System/Software Agent Powers Senior Analyst 1.0 Interactive Voice Response (IVR) Alcatel Total 23.8 Labor Reporting Systems API Company XYZWorks (internal branding) Proactive, Diagnostic or Automated Update Solutions LANDesk 9 Remote Control Software LANDesk 9 Other Self help/self healing software RightStar Custom Solution Call Quality NICE Systems Others Vericom Soundcare 51
53 Summary of Included Service Desk Benchmarking Metrics Cost Quality Productivity Cost per Inbound Contact Cost per Minute of Inbound Handle Time Price per Inbound Contact Price per Minute of Handle Time Customer Satisfaction First Contact Resolution Rate Call Quality Inbound Contacts per Technician per Month Technician Utilization Technicians as a % of Total Headcount First Level Resolution Rate Technician Service Level Call Handling Annual Technician Turnover Daily Technician Absenteeism Schedule Adherence New Technician Training Hours Annual Technician Training Hours Average Speed of Answer (ASA) % of Calls Answered in 30 seconds Call Abandonment Rate Inbound Contact Handle Time User Self-Service Completion Rate Technician Tenure Technician Job Satisfaction 2016 MetricNet, LLC, 52
54 Benchmarking KPI Performance Summary Metric Type Key Performance Indicator (KPI) Company XYZ Peer Group Statistics Average Min Median Max Cost Productivity Service Level Quality Technician Contact Handling Cost per Inbound Contact $8.42 $11.93 $7.09 $11.40 $20.50 Cost per Minute of Inbound Handle Time $1.46 $1.64 $1.03 $1.54 $2.43 Price per Inbound Contact (PC Helps) $14.59 $15.84 $7.54 $14.62 $24.28 Price per Minute of Handle Time (PC Helps) $1.87 $2.07 $1.25 $2.02 $3.51 First Level Resolution Rate N/A 82.3% 73.7% 82.9% 97.5% Inbound Contacts per Technician per Month Technician Utilization 54.9% 48.1% 30.8% 50.3% 62.7% Technicians as a % of Total Headcount 79.0% 84.5% 75.2% 83.5% 93.7% Average Speed of Answer (ASA) (seconds) % of Calls Answered in 30 Seconds 2.6% 43.9% 2.6% 44.4% 85.8% Call Abandonment Rate 15.3% 6.4% 1.1% 5.9% 15.3% Call Quality N/A 83.7% 65.1% 83.9% 94.5% First Contact Resolution Rate 57.6% 71.6% 57.6% 70.4% 91.4% Customer Satisfaction 87.6% 78.2% 63.1% 76.1% 96.7% Annual Technician Turnover 31.3% 40.7% 13.6% 40.3% 65.6% Daily Technician Absenteeism 10.3% 10.8% 4.7% 10.1% 24.2% Schedule Adherence 89.7% 83.4% 72.7% 83.8% 90.8% New Technician Training Hours Annual Technician Training Hours Technician Tenure (months) Technician Job Satisfaction 99.0% 70.3% 53.3% 66.8% 99.0% Inbound Contact Handle Time (minutes) User Self-Serve Completion Rate 0.0% 9.2% 0.0% 7.9% 25.2% 53
55 KPI Gap Summary Metric Type Key Performance Indicator (KPI) Company XYZ Cost Productivity Service Level Quality Technician Contact Handling Peer Average Performance Gap Cost per Inbound Contact $8.42 $ % Cost per Minute of Inbound Handle Time $1.46 $ % Price per Inbound Contact (PC Helps) $14.59 $ % Price per Minute of Handle Time (PC Helps) $1.87 $ % First Level Resolution Rate N/A 82.3% N/A Inbound Contacts per Technician per Month % Technician Utilization 54.9% 48.1% 14.2% Technicians as a % of Total Headcount 79.0% 84.5% -6.5% Average Speed of Answer (ASA) (seconds) % % of Calls Answered in 30 Seconds 2.6% 43.9% -94.1% Call Abandonment Rate 15.3% 6.4% % Call Quality N/A 83.7% N/A First Contact Resolution Rate 57.6% 71.6% -19.5% Customer Satisfaction 87.6% 78.2% 12.0% Annual Technician Turnover 31.3% 40.7% 23.3% Daily Technician Absenteeism 10.3% 10.8% 5.0% Schedule Adherence 89.7% 83.4% 7.5% New Technician Training Hours % Annual Technician Training Hours % Technician Tenure (months) % Technician Job Satisfaction 99.0% 70.3% 40.8% Inbound Contact Handle Time (minutes) % User Self-Serve Completion Rate 0.0% 9.2% % 54
56 KPI Gap Ranking Peer Key Performance Indicator (KPI) Company XYZ Performance Gap Average Inbound Contacts per Technician per Month % Annual Technician Training Hours % Technician Job Satisfaction 99.0% 70.3% 40.8% Cost per Inbound Contact $8.42 $ % Annual Technician Turnover 31.3% 40.7% 23.3% Inbound Contact Handle Time (minutes) % Technician Utilization 54.9% 48.1% 14.2% Customer Satisfaction 87.6% 78.2% 12.0% Cost per Minute of Inbound Handle Time $1.46 $ % Price per Minute of Handle Time (PC Helps) $1.87 $ % Price per Inbound Contact (PC Helps) $14.59 $ % Schedule Adherence 89.7% 83.4% 7.5% Daily Technician Absenteeism 10.3% 10.8% 5.0% First Level Resolution Rate N/A 82.3% N/A Call Quality N/A 83.7% N/A Technicians as a % of Total Headcount 79.0% 84.5% -6.5% First Contact Resolution Rate 57.6% 71.6% -19.5% New Technician Training Hours % Technician Tenure (months) % Average Speed of Answer (ASA) (seconds) % % of Calls Answered in 30 Seconds 2.6% 43.9% -94.1% User Self-Serve Completion Rate 0.0% 9.2% % Call Abandonment Rate 15.3% 6.4% % 55
57 Quartile Rankings: Cost and Productivity Metrics Cost Metric Cost per Inbound Contact Cost per Minute of Inbound Handle Time Price per Inbound Contact (PC Helps) Price per Minute of Handle Time (PC Helps) First Level Resolution Rate Productivity Metric Inbound Contacts per Technician per Month Technician Utilization Technicians as a % of Total Headcount 1 (Top) Quartile (Bottom) $7.09 $8.43 $11.40 $13.84 $8.43 $11.40 $13.84 $20.50 $1.03 $1.39 $1.54 $1.87 $1.39 $1.54 $1.87 $2.43 $7.54 $13.23 $14.62 $19.16 $13.23 $14.62 $19.16 $24.28 $1.25 $1.69 $2.02 $2.20 $1.69 $2.02 $2.20 $ % 86.1% 82.9% 1 (Top) 86.1% 82.9% 77.2% 73.7% Quartile % (Bottom) % 53.1% 50.3% 53.1% 50.3% 43.8% 30.8% 93.7% 89.7% 83.5% 43.8% 80.1% 89.7% 83.5% 80.1% 75.2% Your Service Desk Performance $8.42 $1.46 $14.59 $1.87 N/A Your Service Desk Performance % 79.0% 56
58 Quartile Rankings: Service Level and Quality Metrics Service Level Metric Average Speed of Answer (ASA) (seconds) % of Calls Answered in 30 Seconds Call Abandonment Rate Quality Metric Call Quality First Contact Resolution Rate Customer Satisfaction 1 (Top) Quartile (Bottom) % 58.4% 44.4% 28.6% 58.4% 44.4% 28.6% 2.6% 1.1% 3.9% 5.9% 1 (Top) 9.0% 3.9% 5.9% 9.0% 15.3% Quartile % 90.1% 83.9% 83.9% 4 (Bottom) 90.1% 83.9% 83.9% 65.1% 91.4% 73.2% 70.4% 73.2% 70.4% 68.0% 57.6% 96.7% 83.4% 76.1% 68.0% 74.4% 83.4% 76.1% 74.4% 63.1% Your Service Desk Performance % 15.3% Your Service Desk Performance N/A 57.6% 87.6% 57
59 Quartile Rankings: Technician Metrics Technician Performance Metric Annual Technician Turnover Daily Technician Absenteeism Schedule Adherence New Technician Training Hours Annual Technician Training Hours Technician Tenure (months) Technician Job Satisfaction 1 (Top) Quartile % 34.8% 40.3% 48.8% 4 (Bottom) 34.8% 40.3% 48.8% 65.6% 4.7% 6.8% 10.1% 12.7% 6.8% 10.1% 12.7% 24.2% 90.8% 85.7% 83.8% 85.7% 83.8% 80.2% 72.7% % % 76.5% 66.8% % 76.5% 66.8% 64.3% 53.3% Your Service Desk Performance 31.3% 10.3% 89.7% % 58
60 Quartile Rankings: Contact Handling Metrics Contact Handling Metric Inbound Contact Handle Time (minutes) User Self-Serve Completion Rate 1 (Top) Quartile (Bottom) % 14.1% 7.9% 1.8% 14.1% 7.9% 1.8% 0.0% Your Service Desk Performance % 59
61 The Service Desk Scorecard: An Overview The Service Desk scorecard employs a methodology that provides you with a single, all-inclusive measure of your Service Desk performance It combines cost, service level, productivity, and quality metrics into an overall performance indicator for your Service Desk Your Service Desk score will range between 0 and 100%, and can be compared directly to the scores of other Service Desks in the benchmark By computing your overall score on a monthly or quarterly basis, you can track and trend your performance over time Charting and tracking your Service Desk score is an ideal way to ensure continuous improvement in your Service Desk! 60
62 Performance Range Worst Case Best Case The Company XYZ Service Desk Scorecard Performance Metric Metric Weighting Your Performance Metric Score Balanced Score Cost per Inbound Contact 25.0% $20.50 $7.09 $ % 22.5% Customer Satisfaction 25.0% 63.1% 96.7% 87.6% 72.9% 18.2% Technician Utilization 15.0% 30.8% 62.7% 54.9% 75.5% 11.3% First Contact Resolution Rate 15.0% 57.6% 91.4% 57.6% 0.0% 0.0% Technician Job Satisfaction 10.0% 53.3% 99.0% 99.0% 100.0% 10.0% % of Calls Answered in 30 Seconds 10.0% 2.6% 85.8% 2.6% 0.0% 0.0% Total 100.0% N/A N/A N/A N/A 62.1% Step 1 Six critical performance metrics have been selected for the scorecard Step 2 Each metric has been weighted according to its relative importance Step 3 For each performance metric, the highest and lowest performance levels in the benchmark are recorded Step 4 Your actual performance for each metric is recorded in this column Step 5 Your score for each metric is then calculated: (worst case actual performance) / (worst case best case) X 100 Step 6 61 Your balanced score for each metric is calculated: metric score X weighting
63 Balanced Scores 65.0% 60.0% 55.0% Balanced Scorecard Summary* Key Statistics Service Desk Scores High 63.8% Average % Median 47.2% Low 31.6% Company XYZ 62.1% 50.0% 45.0% 40.0% 35.0% 30.0% 25.0% XYZ Service Desk *The scores shown in the chart are based upon the performance metrics, weightings, and data ranges shown on the previous page. 62
64 Peer Group Scorecard Summary Data The next two pages illustrate the benchmarking peer group performance for each KPI in the scorecard Page 64 ranks each service desk from best performer (service desk #6) to worst performer (service desk #4) based upon their balanced scores Page 65 ranks each KPI in the scorecard from best (top row) to worst (bottom row) 63
65 Overall Ranking Scorecard Performance Rankings Cost per Inbound Contact First Contact Resolution Rate % of Calls Answered in 30 Seconds Service Desk Number Customer Satisfaction Technician Utilization Technician Job Satisfaction 1 6 $ % 50.8% 91.4% 88.3% 53.1% 63.8% 2 9 $ % 52.4% 68.5% 74.7% 40.3% 63.2% 3 21 $ % 35.2% 90.0% 89.8% 73.0% 62.7% 4 13 $ % 48.5% 78.8% 78.5% 60.2% 62.5% 5 Company XYZ $ % 54.9% 57.6% 99.0% 2.6% 62.1% 6 22 $ % 55.5% 73.1% 71.8% 27.4% 60.4% 7 3 $ % 56.9% 71.1% 66.8% 17.1% 59.4% 8 5 $ % 47.9% 70.4% 65.6% 62.1% 54.5% 9 18 $ % 53.3% 71.1% 65.3% 44.4% 53.8% $ % 52.6% 72.3% 72.3% 49.1% 49.3% $ % 57.8% 64.8% 53.3% 16.4% 49.3% 12 1 $ % 47.8% 67.5% 66.2% 29.8% 47.2% 13 7 $ % 52.9% 72.9% 66.0% 53.0% 46.9% 14 8 $ % 36.3% 75.1% 66.8% 60.4% 46.6% $ % 45.3% 68.7% 55.3% 37.8% 46.1% $ % 47.5% 69.1% 61.7% 65.8% 45.2% $ % 50.3% 68.1% 72.2% 23.7% 44.9% $ % 62.7% 63.5% 57.0% 23.6% 43.2% 19 2 $ % 39.8% 69.1% 63.2% 42.4% 42.5% $ % 42.3% 66.7% 68.0% 50.0% 41.5% $ % 50.8% 67.8% 57.6% 35.4% 40.1% $ % 33.7% 74.9% 79.2% 56.6% 38.1% 23 4 $ % 30.8% 73.2% 78.3% 85.8% 31.6% Average $ % 48.1% 71.6% 70.3% 43.9% 50.2% Key Statistics Scorecard Metrics Total Balanced Score Max $ % 62.7% 91.4% 99.0% 85.8% 63.8% Min $ % 30.8% 57.6% 53.3% 2.6% 31.6% Median $ % 50.3% 70.4% 66.8% 44.4% 47.2% 64
66 Cost per Inbound Contact KPI Data in Rank Order Scorecard Metrics First Contact Resolution Rate % of Calls Answered in 30 Seconds Customer Satisfaction Technician Utilization Technician Job Satisfaction Company XYZ $ % 54.9% 57.6% 99.0% 2.6% 62.1% Ranking Quartile $ % 62.7% 91.4% 99.0% 85.8% 63.8% 2 $ % 57.8% 90.0% 89.8% 73.0% 63.2% 3 $ % 56.9% 78.8% 88.3% 65.8% 62.7% 4 $ % 55.5% 75.1% 79.2% 62.1% 62.5% 5 $ % 54.9% 74.9% 78.5% 60.4% 62.1% 6 $ % 53.3% 73.2% 78.3% 60.2% 60.4% 7 $ % 52.9% 73.1% 74.7% 56.6% 59.4% 8 $ % 52.6% 72.9% 72.3% 53.1% 54.5% 9 $ % 52.4% 72.3% 72.2% 53.0% 53.8% 10 $ % 50.8% 71.1% 71.8% 50.0% 49.3% 11 $ % 50.8% 71.1% 68.0% 49.1% 49.3% 12 $ % 50.3% 70.4% 66.8% 44.4% 47.2% 13 $ % 48.5% 69.1% 66.8% 42.4% 46.9% 14 $ % 47.9% 69.1% 66.2% 40.3% 46.6% 15 $ % 47.8% 68.7% 66.0% 37.8% 46.1% 16 $ % 47.5% 68.5% 65.6% 35.4% 45.2% 17 $ % 45.3% 68.1% 65.3% 29.8% 44.9% 18 $ % 42.3% 67.8% 63.2% 27.4% 43.2% 19 $ % 39.8% 67.5% 61.7% 23.7% 42.5% 20 $ % 36.3% 66.7% 57.6% 23.6% 41.5% 21 $ % 35.2% 64.8% 57.0% 17.1% 40.1% 22 $ % 33.7% 63.5% 55.3% 16.4% 38.1% 23 $ % 30.8% 57.6% 53.3% 2.6% 31.6% Average $ % 48.1% 71.6% 70.3% 43.9% 50.2% Max $ % 62.7% 91.4% 99.0% 85.8% 63.8% Min $ % 30.8% 57.6% 53.3% 2.6% 31.6% Median $ % 50.3% 70.4% 66.8% 44.4% 47.2% Total Balanced Score 65
67 Cost per Inbound Contact Scorecard Metrics: Cost per Inbound Contact $22.00 $20.00 $18.00 $16.00 Key Statistics Cost per Inbound Contact High $20.50 Average $11.93 Median $11.40 Low $7.09 Company XYZ $8.42 $14.00 $12.00 $10.00 $8.00 $6.00 $4.00 $2.00 $ XYZ Service Desk 66
68 Customer Satisfaction Scorecard Metrics: Customer Satisfaction 100.0% 95.0% 90.0% 85.0% Key Statistics Customer Satisfaction High 96.7% Average % Median 76.1% Low 63.1% Company XYZ 87.6% 80.0% 75.0% 70.0% 65.0% 60.0% 55.0% 50.0% 21 6 XYZ Service Desk 67
69 Technician Utilization Scorecard Metrics: Technician Utilization 65.0% 60.0% 55.0% 50.0% Key Statistics Technician Utilization High 62.7% Average % Median 50.3% Low 30.8% Company XYZ 54.9% 45.0% 40.0% 35.0% 30.0% 25.0% 20.0% XYZ Service Desk 68
70 First Contact Resolution Rate Scorecard Metrics: First Contact Resolution Rate 95.0% 90.0% 85.0% 80.0% Key Statistics First Contact Resolution Rate High 91.4% Average % Median 70.4% Low 57.6% Company XYZ 57.6% 75.0% 70.0% 65.0% 60.0% 55.0% 50.0% 45.0% XYZ Service Desk 69
71 Technician Job Satisfaction Scorecard Metrics: Technician Job Satisfaction 100.0% 95.0% 90.0% 85.0% Key Statistics Technician Job Satisfaction High 99.0% Average % Median 66.8% Low 53.3% Company XYZ 99.0% 80.0% 75.0% 70.0% 65.0% 60.0% 55.0% 50.0% XYZ Sevice Desk 70
72 % of Calls Answered in 30 Seconds Scorecard Metrics: % of Calls Answered in 30 Seconds 90.0% 80.0% 70.0% 60.0% Key Statistics % of Calls Answered in 30 Seconds High 85.8% Average % Median 44.4% Low 2.6% Company XYZ 2.6% 50.0% 40.0% 30.0% 20.0% 10.0% 0.0% XYZ Service Desk 71
73 Quality (Effectiveness) Cost vs. Quality for Company XYZ Service Desk Higher Quality Middle Quartiles Effective but not Efficient Top Quartile Efficient and Effective Company XYZ Service Desk Global Database Lower Quality Lower Quartile Middle Quartiles Efficient but not Effective Higher Cost Cost (Efficiency) Lower Cost Sample Data Only 72
74 Best Practices Process Assessment Company XYZ 73


75 Six-Part Model for Service Desk Best Practices Model Component Definition Strategy Strategy Defining Your Charter and Mission Stakeholder Communication Customer Enthusiasm Human Resources Human Resources Proactive, Life-cycle Management of Personnel Process Expeditious Delivery of Customer Service Performance Measurement Technology Process Technology Leveraging People and Processes Performance Measurement A Holistic Approach to Performance Measurement Stakeholder Communication Proactively Managing Stakeholder Expectations 2016 MetricNet, LLC, 74
76 Best Practices Evaluation Criteria Ranking Explanation 1 No Knowledge of the Best Practice. 2 Aware of the Best Practice, but not applying it. 3 Aware of the Best Practice, and applying at a rudimentary level. 4 Best Practice is being effectively applied. 5 Best Practice is being applied in a world-class fashion MetricNet, LLC, 75
77 MetricNet Has Defined 72 Service Desk Best Practices Strategy 7 Best Practices Human Resources 13 Best Practices Process 16 Best Practices Technology Performance Measurement 14 Best Practices Communication 10 Best Practices 12 Best Practices Total Score from 72 to 360 The lowest score possible on the Best Practices Process Assessment is 72: Maturity Level 1 X 72 Best Practices = 72 The highest score possible on the Best Practices Process Assessment is 360: Maturity Level 5 X 72 Best Practices =
78 Strategy: 7 Best Practices Best Practice Strategy Best Practices Defined Company XYZ's Score Peer Group Average The Service Desk has a well-defined mission, vision, and strategy. The vision and strategy are well-documented, and communicated to key stakeholders in the organization The Service Desk has a published Service Catalog, including a Supported Products List, that is distributed and communicated to key stakeholders including end users. The Service Catalog is available on-line. The Service Desk has an action plan for continuous improvement. The plan is documented and distributed to key stakeholders in the organization, and specific individuals are held accountable for implementing the action plan. The Service Desk is well integrated into the information technology function. The service desk acts as the "voice of the user" in IT, and is involved in major IT decisions and deliberations that affect end users. The Service Desk is alerted ahead of time so that they can prepare for major rollouts, or other changes in the IT environment. The Service Desk has SLA's that define the level of service to be delivered to users. The SLA's are documented, published, and communicated to key stakeholders in the organization The Service Desk has OLA's (Operating Level Agreements) with other support groups in the organization (e.g., level 2 support, desktop support, field support, etc.). The OLA's clearly define the roles and responsibilities of each support group, and the different support groups abide by the terms of the OLA's. The Service Desk actively seeks to improve Level 1 Resolution Rates, First Contact Resolution Rates, Level 0 Resolution Rates (User Self-Help), and Level -1 (Problem Prevention) Resolution Rates by implementing processes, technologies, and training that facilitate these Summary Statistics Total Score Average Score
79 Human Resources: 13 Best Practices Best Practice Human Resources Best Practices Defined Company XYZ's Score Peer Group Average 1 2 The Service Desk has a formalized and documented recruiting process for filling vacancies. Job requirements are well defined, and candidates are tested for both technical skills, and customer service soft skills. New hires go through a formal training curriculum, including technical and customer service skills, and are required to pass a proficiency exam before independently handling customer contacts. Veteran agents (more than 6 months of experience) have access to training opportunities to improve their skill set, job performance, and the overall performance of the service desk. Veteran agents are required to complete a minimum number of refresher training hours each year. 4 Agent training classes and curricula are specifically designed to maximize customer satisfaction, the number of user inquiries resolved at Level 1, and the number of inquiries resolved on First Contact Individual agent training plans are clearly defined, documented and regularly updated The service desk has a formalized, documented agent career path. Agents are made aware of their career 6 advancement opportunities, and are encouraged to proactively manage their careers. Agents are coached at least once yearly on their career path and career advancements options Agents have the opportunity to advance their careers in at least two ways: by improving their technical and customer service skills, and by improving their management and supervisory skills Agents are coached by their supervisor in one-on-one sessions on a monthly basis. Recorded calls are reviewed, and the supervisor provides specific suggestions to each agent on how to improve performance Agents have quantifiable performance goals (e.g., for call quality, customer satisfaction, number of calls handled per month, etc.), and are held accountable for achieving their goals on a monthly basis Agents are eligible for incentives and rewards based upon performance. These could include monetary incentives such as annual bonuses, or other incentives such as time off work, gift certificates, etc Agent performance goals are linked to and aligned with the overall Service Desk goals and performance targets Agent Satisfaction surveys are conducted at least once per year, and the results of the survey are used to manage and improve agent morale Formal Performance reviews are scheduled and completed for all personnel at least once annually Summary Statistics Total Score Average Score
80 Process: 16 Best Practices Best Practice Process Best Practices Defined Company XYZ's Score Peer Group Average 1 The Service Desk is designed as a Single Point of Contact (SPOC) for all IT related problems, issues, and service requests Customers are offered a range of access options to the Service Desk, including live voice, voice mail, , web chat, self-service, fax, and walk-in Contact handling processes are standardized, documented, and available online. With few exceptions, the standards are followed by the service desk agents. Escalation points are well defined and documented. These include other support groups (e.g., Level 2 support, Deskside Support, etc.), and individuals to whom calls may be escalated Rules for escalation and call transfer are well defined and documented. Agents know when and where to transfer or route a call if they are unable to assist the user Indirect contact channels, including , Voice Mail, and Faxes are treated with the same priority as live phone calls and chat sessions. The work queues from these channels are integrated, or worked in parallel Incoming contacts are assigned a severity code based upon the number of users impacted, and the urgency of the incident System alarms notify the service desk when a service level has been breached, whether at Level 1, or at another support level within the organization The Service Desk has a formal, rapid notification and correction process that is activated when a service level has been breached, whether at Level 1, or at some other support level The Service Desk has contingency plans to handle sudden, unexpected spikes in contact volume. These could include having supervisors and other indirect personnel handle incoming calls during a call spike The Service Desk has contingency plans to handle both short and long term interruptions in service delivery The Service Desk has a well defined service planning and readiness process that works closely with both internal 12 engineering groups and vendors, and continues through product field testing and pre-release. This process enables the Service Desk to train for and prepare for supporting new products and services in the IT environment The Service Desk has a formal Knowledge Management Process that facilitates the acquisition, qualification, review, approval, and distribution of knowledge into a Knowledgebase The Service Desk has a mature workforce scheduling process that achieves high agent utilization, while maintaining reasonable service levels The Service Desk has an effective, ongoing process for projecting future workload and staffing requirements The Service Desk conducts periodic Root Cause Analysis (RCA) on the user contact profile to eliminate problems at their source Summary Statistics Total Score Average Score
81 Best Practice Technology: 10 Best Practices Technology Best Practices Defined The Service Desk has a full-featured incident management system that facilitates effective incident tracking, service level compliance, reporting, and root cause analysis. The Service Desk has a comprehensive knowledge management tool that facilitates effective knowledge capture and re-use. Service desk agents are able to quickly find solutions to user problems by searching the knowledge base. Solutions for the vast majority of user problems and questions can be found in the knowledge base. The incident management system can track and monitor the skill levels of Service Desk agents based on closed tickets by product and/or service code. Company XYZ's Score The Service Desk knowledgebase is used continuously by all Service Desk agents, and results in higher First Contact and First Level Resolution Rates, and lower contact handle times. 2.5 The Service Desk has an effective tool that allows agents to proxy into a user's computer, take control of the computer, and remotely perform diagnostics and problem solving (e.g., Tivoli, Bomgar, GoTo Assist, etc.). The tool increases both first contact and first level resolution rates, and reduces contact handle times. The Service Desk has an Automated Password Reset (APR) capability that dramatically reduces the number of password resets that must be performed manually by the Service Desk agents. The Service Desk has an effective, integrated self-service portal that is available to all users. The self-service portal provides information, FAQ's, and solutions to problems that are more complex than simple password resets. The tool includes a direct link to service desk technicians. Users are aware of the self-service portal, and usage rates are continuously increasing. The Service Desk uses technology alerts/alarms to notify the Service Desk or perform self healing scripts when a customer or system issue is proactively identified. Peer Group Average 9 The Service Desk has a multi-year plan for an integrated technology strategy The Service Desk utilizes a capital investment justification process based on ROI, and reports on post installation ROI as part of this process Summary Statistics Total Score Average Score
82 Performance Measurement: 14 Best Practices Best Practice Performance Measurement Best Practices Defined Company XYZ's Score Peer Group Average 1 Cost per Contact is measured, recorded, and tracked on an ongoing basis Customer Satisfaction is measured, recorded, and tracked on an ongoing basis First Contact Resolution is measured, recorded, and tracked on an ongoing basis First Level Resolution is measured, recorded, and tracked on an ongoing basis Agent Utilization is measured, recorded, and tracked on an ongoing basis Agent Satisfaction is measured, recorded, and tracked The Service Desk maintains a balanced scorecard that provides a single, all-inclusive measure of service desk performance The Service Desk tracks the number of incidents that are resolved outside of the Level 1 Service desk (e.g., at Level 2, Desktop Support, etc.) that could have been resolved by the service desk at Level The Service Desk conducts event driven customer surveys whereby the results of customer satisfaction surveys can be linked back to a specific incident, and to a specific agent handling the contact at the service desk Service Desk measures are used holistically, and diagnostically to identify performance gaps in Service Desk performance, and to prescribe actions that will improve performance The Service Desk conducts benchmarking at least once per year Service Desk KPI's are used to establish "stretch" goals The Service Desk understands key correlations and cause/effect relationships between the various KPI's. This 13 enables the Service Desk to achieve desired performance goals by leveraging and driving the underlying "causal" metrics. 14 The Service Desk tracks the Mean Time to Resolve (MTR), and the Percentage of tickets resolved within 24, 48, and 72 hours Summary Statistics Total Score Average Score
83 Best Practice Communication: 12 Best Practices Communication Best Practices Defined Company XYZ's Score Peer Group Average 1 The Service Desk maintains active communication with all stakeholder groups, including service desk employees, IT managers, company managers outside of IT, and customers The Service Desk has a formal communications schedule, and provides customized content for each stakeholder group The Service Desk has established User Group Liaisons who represent different groups within the user 3 community. The Service Desk meets periodically with the liaisons to learn about user concerns and questions, and to communicate Service Desk services, plans, and initiatives. The Service Desk meets frequently with user groups, and holds "informational briefings" to educate users on 4 supported products and services, hours of operation, training opportunities, tips for getting the most benefit from the service desk, etc. 5 The Service Desk meets frequently with other IT managers, and is an integral part of key decisions made within IT. The Service Desk plays the role of "voice of the user" within IT IT is required to deliver a "turnover package" to the service desk for all changes that will impact the user 6 environment. This could include application updates, new desktop software, etc. The turnover package is designed to prepare the service desk to provide support to users in the affected areas. 7 Customers are told what to expect on resolution time when their ticket is escalated or if a call-back is required The Service Desk monitors all tickets, including those that are escalated, until ticket closure. The value added by the service desk is communicated to key managers in IT, and expectations are formally established regarding service desk roles and responsibilities The Service Desk tracks the number of training related contacts it receives, and provides feedback to user groups within the organization on training areas that could help to reduce service desk contact volumes The Service Desk provides training aids to users that enable them use the service desk more effectively. These could include log-in screens with the service desk phone number, chat windows that can be clicked to initiate a real-time chat session, mouse pads imprinted with the service desk IVR menu, etc The Service Desk transmits outbound messages to users announcing major system and network outages, 12 thereby alerting users about potential problems in the IT environment. These proactive messages help to reduce contact volumes during incidents that impact a large number of users. Summary Statistics Total Score Average Score
84 Best Practices Process Assessment Summary Best Practices Component Number of Success Factors Average Company XYZ Score Average Peer Group Score Strategy Human Resources Process Technology Performance Measurement Communication Total Score * An average score of 4.0 or above is required in each component of the Best Practices Model to achieve Best Practices Certification 83
85 Average Score Best Practices Process Assessment Summary Company XYZ Peer Group 84
86 Total Process Assessment Scores Overall Process Assessment Scores Key Statistics Total Process Assessment Score High Average Median Low 82.0 Your Score World-Class
87 World-Class = 288 Balanced Score Average = Process Maturity vs. Scorecard Performance 100% 90% 80% Company XYZ Performance Process Assessment Score Balanced Score 62.1% 70% 60% 50% Average = 50.2% 40% 30% 20% 10% 0% Company XYZ Global Database Process Assessment Score 86

88 Conclusions and Recommendations Company XYZ 87
89 Notable Strengths The Company XYZ Service Desk has a number of notable strengths. Costs are low Cost per Inbound Contact, Cost per Minute of Handle Time, and the Price paid to PC Helps are in the top two quartiles Customer Satisfaction is in the top quartile Customer Satisfaction is the most important measure of quality Technician Utilization is well above average This is a key driver of Company XYZ s low costs Technician Job Satisfaction is the highest in the benchmark! This has a positive impact on many other metrics in the service desk Company XYZ scored above average on the Best Practices Process Assessment Company XYZ performed well above average on the benchmark Company XYZ placed 5th out of 23 service desks on the Balanced Scorecard First quartile performance overall! 88
90 But Opportunities for Improvement Remain Service Levels are universally weak All Company XYZ service levels are in the 4 th quartile First Contact Resolution is the lowest in the benchmark FCR is an important driver of Customer Satisfaction Some technician metrics are weak New Technician Training Hours are in the 4 th quartile Technician Absenteeism and Tenure are in the 3 rd quartile Lack of recognition and investment in the Service Desk has created a number of problems, including: Poor integration into the IT department, understaffing, inadequate training, ineffective knowledgebase, access restrictions, and limited career options 89
91 Summary of Benchmarking Recommendations 1. Consider transitioning to a Service Desk model that emphasizes Level 1 incident resolution 2. Offer additional agent training that is oriented specifically towards improving First Contact and First Level Resolution Rates 3. Develop and document a formal career path for service desk agents 4. Consider adding additional agent headcount to improve service levels and First Contact/First Level Resolution Rates Four additional agents would be needed to bring Company XYZ into alignment with industry average headcount figures This would also enable agents to spend more time adding solutions to the knowledgebase 5. Consider adopting the MetricNet Service Desk Balanced Scorecard, and update the scorecard monthly 6. Develop an internal communication program to improve the visibility and reputation of the Company XYZ Service Desk 7. Work on improving process maturity and compliance with industry best practices 90


92 Level 1 Resolution is the Biggest Driver of Support TCO Support Level Cost per Ticket Vendor $471 Field Support $196 Level 3 IT (apps, networking, NOC, etc.) Level 2: Desktop Support $85 $62 Level 1: Service Desk $22 91
93 First Contact Resolution Rate 100% 90% 80% Training Can Improve First Contact Resolution Rates 70% 60% 50% 40% 30% 20% 10% 0% New Technician Training Hours 92
94 First Contact Resolution Rate Training Can Improve First Contact Resolution Rates (contd.) 100% 90% 80% 70% 60% 50% 40% 30% 20% 10% 0% Veteran Technician Training Hours 93
95 Training and Career Pathing are Key to Improving Agent Effectiveness Cost per Contact Customer Satisfaction Technician Utilization First Contact Resolution Scheduling Efficiency Service Levels: ASA and AR Technicians/ Total FTE s Absenteeism/ Turnover First Level Resolution Handle Time Call Quality Technician Satisfaction Coaching Career Path Training Hours 94
96 Performance Metric Metric Weighting Performance Range Worst Case Best Case Consider Adopting the Service Desk Balanced Scorecard Your Performance Metric Score Balanced Score Cost per Inbound Contact 25.0% $20.50 $7.09 $ % 22.5% Customer Satisfaction 25.0% 63.1% 96.7% 87.6% 72.9% 18.2% Technician Utilization 15.0% 30.8% 62.7% 54.9% 75.5% 11.3% First Contact Resolution Rate 15.0% 57.6% 91.4% 57.6% 0.0% 0.0% Technician Job Satisfaction 10.0% 53.3% 99.0% 99.0% 100.0% 10.0% % of Calls Answered in 30 Seconds 10.0% 2.6% 85.8% 2.6% 0.0% 0.0% Total 100.0% N/A N/A N/A N/A 62.1% Step 1 Six critical performance metrics have been selected for the scorecard Step 2 Each metric has been weighted according to its relative importance Step 3 For each performance metric, the highest and lowest performance levels in the benchmark are recorded Step 4 Your actual performance for each metric is recorded in this column Step 5 Your score for each metric is then calculated: (worst case actual performance) / (worst case best case) X 100 Step 6 95 Your balanced score for each metric is calculated: metric score X weighting 95
97 Service Desk Balanced Score And Update the Scorecard Monthly 85% 80% 75% 70% 65% 60% 55% 50% 45% 40% Jan Feb Mar Apr May Jun Jul Aug Sep Oct Nov Dec 12 Month Average Monthly Score Sample Data Only 96
98 PERCEIVED VALUE Internal Communication: Positioning Company XYZ for Future Success HIGHER Perceived Value > Actual Value LOWER Perceived Value < Actual Value LOWER ACTUAL COST VALUE HIGHER 97
99 PERCEIVED VALUE Where Does the Company XYZ Service Desk Operate? HIGHER Perceived Value > Actual Value A Common (but Dangerous) Operating Position LOWER Perceived Value < Actual Value LOWER ACTUAL COST VALUE HIGHER 98
100 PERCEIVED VALUE #2 Brand Management Operational Effectiveness First! HIGHER Perceived Value > Actual Value #1 Operational Effectiveness LOWER Perceived Value < Actual Value LOWER ACTUAL COST VALUE HIGHER 99
101 PERCEIVED VALUE Closing the Perception vs. Reality Gap HIGHER Perceived Value > Actual Value Where you Should Be Closing the Perception Gap LOWER Where you Are Perceived Value < Actual Value LOWER ACTUAL COST VALUE HIGHER 100
102 Image Management: The Five W s 1. Who Who are the Key Stakeholder Groups? 2. What What are the Key Messages? 3. When When are You Going to Communicate Them? 4. Where/How Where/How do You Reach the Stakeholders? 5. Why Why are We Doing This? 101
103 Timing Timing Key Success Factors in Service Desk Image Management Channels Use All Available Log-in messages Newsletters Reference Guides Asset tags Surveys User liaisons Timing Frequent Contact New employee orientation At session log-in During training During the incident At scheduled sessions Messages Messages Multiple Messages Services Major initiatives Performance Levels FAQ s Success Stories 102
104 Why are We Doing This? We ve all heard the expression Expectations Not Set are Expectations Not Met! So, let s get serious about proactively managing expectations! 103
105 104
106 % Saying Very Important 90% 80% 70% 60% 50% Support Drives Customer Satisfaction for All of IT 84% n = 1,044 Global large cap companies Survey type: multiple choice 3 responses allowed per survey 47% 40% 30% 20% 31% 29% 22% 19% 10% 8% 0% Service Desk Desktop Support Network Outages VPN Training Enterprise Applications Desktop Software Factors Contributing to IT Customer Satisfaction 84% cited the service desk as a very important factor in their overall satisfaction with corporate IT 47% cited desktop support as a very important factor in their overall satisfaction with corporate IT 105
107 Company XYZ Internal Communication Summary Managing the gap between perception and reality is fairly straightforward It doesn t take a lot of time, or cost a lot of money But it is critically important The success of your service desk depends as much on your image, as it does on your actual performance! The Benefits of effective Image Management Include: Customer loyalty and positive word-of-mouth referrals Credibility, which leverages your ability to Get Things Done! A Positive Image for IT overall High levels of Customer Satisfaction 106
108 World-Class = 288 Balanced Score Average = Company XYZ Must Improve Process Maturity Over Time 100% 90% 80% Company XYZ Performance Process Assessment Score Balanced Score 62.1% 70% 60% 50% Average = 50.2% 40% 30% 20% 10% 0% Company XYZ Global Database Process Assessment Score 107
109 Best Practice Focus Areas: Strategy Strategy Best Practices Defined The Service Desk has a well-defined mission, vision, and strategy. The vision and strategy are well-documented, and communicated to key stakeholders in the organization. The Service Desk has a published Service Catalog, including a Supported Products List, that is distributed and communicated to key stakeholders including end users. The Service Catalog is available on-line. The Service Desk has an action plan for continuous improvement. The plan is documented and distributed to key stakeholders in the organization, and specific individuals are held accountable for implementing the action plan. The Service Desk is well integrated into the information technology function. The service desk acts as the "voice of the user" in IT, and is involved in major IT decisions and deliberations that affect end users. The Service Desk is alerted ahead of time so that they can prepare for major rollouts, or other changes in the IT environment. The Service Desk has OLA's (Operating Level Agreements) with other support groups in the organization (e.g., level 2 support, desktop support, field support, etc.). The OLA's clearly define the roles and responsibilities of each support group, and the different support groups abide by the terms of the OLA's. The Service Desk has SLA's that define the level of service to be delivered to users. The SLA's are documented, published, and communicated to key stakeholders in the organization. The Service Desk actively seeks to improve Level 1 Resolution Rates, First Contact Resolution Rates, Level 0 Resolution Rates (User Self-Help), and Level -1 (Problem Prevention) Resolution Rates by implementing processes, technologies, and training that facilitate these objectives. Company XYZ's Score
110 Best Practice Focus Areas: Human Resources Human Resources Best Practices Defined Veteran agents (more than 6 months of experience) have access to training opportunities to improve their skill set, job performance, and the overall performance of the service desk. Veteran agents are required to complete a minimum number of refresher training hours each year. Agents are eligible for incentives and rewards based upon performance. These could include monetary incentives such as annual bonuses, or other incentives such as time off work, gift certificates, etc. New hires go through a formal training curriculum, including technical and customer service skills, and are required to pass a proficiency exam before independently handling customer contacts. Agents have the opportunity to advance their careers in at least two ways: by improving their technical and customer service skills, and by improving their management and supervisory skills. The Service Desk has a formalized and documented recruiting process for filling vacancies. Job requirements are well defined, and candidates are tested for both technical skills, and customer service soft skills. Agent training classes and curricula are specifically designed to maximize customer satisfaction, the number of user inquiries resolved at Level 1, and the number of inquiries resolved on First Contact. Individual agent training plans are clearly defined, documented and regularly updated. The service desk has a formalized, documented agent career path. Agents are made aware of their career advancement opportunities, and are encouraged to proactively manage their careers. Agents are coached at least once yearly on their career path and career advancements options. Agents are coached by their supervisor in one-on-one sessions on a monthly basis. Recorded calls are reviewed, and the supervisor provides specific suggestions to each agent on how to improve performance. Agents have quantifiable performance goals (e.g., for call quality, customer satisfaction, number of calls handled per month, etc.), and are held accountable for achieving their goals on a monthly basis. Agent performance goals are linked to and aligned with the overall Service Desk goals and performance targets. Agent Satisfaction surveys are conducted at least once per year, and the results of the survey are used to manage and improve agent morale. Formal Performance reviews are scheduled and completed for all personnel at least once annually. Company XYZ's Score
111 Best Practice Focus Areas: Process Process Best Practices Defined Indirect contact channels, including , Voice Mail, and Faxes are treated with the same priority as live phone calls and chat sessions. The work queues from these channels are integrated, or worked in parallel. Incoming contacts are assigned a severity code based upon the number of users impacted, and the urgency of the incident. The Service Desk has a formal, rapid notification and correction process that is activated when a service level has been breached, whether at Level 1, or at some other support level. The Service Desk has a well defined service planning and readiness process that works closely with both internal engineering groups and vendors, and continues through product field testing and pre-release. This process enables the Service Desk to train for and prepare for supporting new products and services in the IT environment. The Service Desk has contingency plans to handle sudden, unexpected spikes in contact volume. These could include having supervisors and other indirect personnel handle incoming calls during a call spike. The Service Desk conducts periodic Root Cause Analysis (RCA) on the user contact profile to eliminate problems at their source. System alarms notify the service desk when a service level has been breached, whether at Level 1, or at another support level within the organization. Customers are offered a range of access options to the Service Desk, including live voice, voice mail, , web chat, self-service, fax, and walk-in. Rules for escalation and call transfer are well defined and documented. Agents know when and where to transfer or route a call if they are unable to assist the user. The Service Desk has contingency plans to handle both short and long term interruptions in service delivery. The Service Desk has a formal Knowledge Management Process that facilitates the acquisition, qualification, review, approval, and distribution of knowledge into a Knowledgebase. The Service Desk has a mature workforce scheduling process that achieves high agent utilization, while maintaining reasonable service levels. The Service Desk has an effective, ongoing process for projecting future workload and staffing requirements. The Service Desk is designed as a Single Point of Contact (SPOC) for all IT related problems, issues, and service requests. Contact handling processes are standardized, documented, and available online. With few exceptions, the standards are followed by the service desk agents. Escalation points are well defined and documented. These include other support groups (e.g., Level 2 support, Deskside Support, etc.), and individuals to whom calls may be escalated. Company XYZ's Score
112 Best Practice Focus Areas: Technology Technology Best Practices Defined The Service Desk uses technology alerts/alarms to notify the Service Desk or perform self healing scripts when a customer or system issue is proactively identified. The Service Desk has an Automated Password Reset (APR) capability that dramatically reduces the number of password resets that must be performed manually by the Service Desk agents. The Service Desk has a multi-year plan for an integrated technology strategy. The Service Desk utilizes a capital investment justification process based on ROI, and reports on post installation ROI as part of this process. The Service Desk has a comprehensive knowledge management tool that facilitates effective knowledge capture and re-use. Service desk agents are able to quickly find solutions to user problems by searching the knowledge base. Solutions for the vast majority of user problems and questions can be found in the knowledge base. The Service Desk knowledgebase is used continuously by all Service Desk agents, and results in higher First Contact and First Level Resolution Rates, and lower contact handle times. The incident management system can track and monitor the skill levels of Service Desk agents based on closed tickets by product and/or service code. The Service Desk has an effective, integrated self-service portal that is available to all users. The self-service portal provides information, FAQ's, and solutions to problems that are more complex than simple password resets. The tool includes a direct link to service desk technicians. Users are aware of the self-service portal, and usage rates are continuously increasing. The Service Desk has a full-featured incident management system that facilitates effective incident tracking, service level compliance, reporting, and root cause analysis. The Service Desk has an effective tool that allows agents to proxy into a user's computer, take control of the computer, and remotely perform diagnostics and problem solving (e.g., Tivoli, Bomgar, GoTo Assist, etc.). The tool increases both first contact and first level resolution rates, and reduces contact handle times. Company XYZ's Score
113 Best Practice Focus Areas: Performance Measurement Performance Measurement Best Practices Defined The Service Desk tracks the Mean Time to Resolve (MTR), and the Percentage of tickets resolved within 24, 48, and 72 hours. Cost per Contact is measured, recorded, and tracked on an ongoing basis. The Service Desk maintains a balanced scorecard that provides a single, all-inclusive measure of service desk performance. The Service Desk tracks the number of incidents that are resolved outside of the Level 1 Service desk (e.g., at Level 2, Desktop Support, etc.) that could have been resolved by the service desk at Level 1. The Service Desk conducts benchmarking at least once per year. Agent Utilization is measured, recorded, and tracked on an ongoing basis. Customer Satisfaction is measured, recorded, and tracked on an ongoing basis. First Contact Resolution is measured, recorded, and tracked on an ongoing basis. First Level Resolution is measured, recorded, and tracked on an ongoing basis. Agent Satisfaction is measured, recorded, and tracked. The Service Desk conducts event driven customer surveys whereby the results of customer satisfaction surveys can be linked back to a specific incident, and to a specific agent handling the contact at the service desk. Service Desk measures are used holistically, and diagnostically to identify performance gaps in Service Desk performance, and to prescribe actions that will improve performance. Service Desk KPI's are used to establish "stretch" goals. The Service Desk understands key correlations and cause/effect relationships between the various KPI's. This enables the Service Desk to achieve desired performance goals by leveraging and driving the underlying "causal" metrics. Company XYZ's Score
114 Best Practice Focus Areas: Communication Communication Best Practices Defined The Service Desk has established User Group Liaisons who represent different groups within the user community. The Service Desk meets periodically with the liaisons to learn about user concerns and questions, and to communicate Service Desk services, plans, and initiatives. The Service Desk meets frequently with user groups, and holds "informational briefings" to educate users on supported products and services, hours of operation, training opportunities, tips for getting the most benefit from the service desk, etc. IT is required to deliver a "turnover package" to the service desk for all changes that will impact the user environment. This could include application updates, new desktop software, etc. The turnover package is designed to prepare the service desk to provide support to users in the affected areas. The Service Desk monitors all tickets, including those that are escalated, until ticket closure. The Service Desk tracks the number of training related contacts it receives, and provides feedback to user groups within the organization on training areas that could help to reduce service desk contact volumes. The Service Desk meets frequently with other IT managers, and is an integral part of key decisions made within IT. The Service Desk plays the role of "voice of the user" within IT. The value added by the service desk is communicated to key managers in IT, and expectations are formally established regarding service desk roles and responsibilities. Customers are told what to expect on resolution time when their ticket is escalated or if a call-back is required. The Service Desk has a formal communications schedule, and provides customized content for each stakeholder group. The Service Desk provides training aids to users that enable them use the service desk more effectively. These could include log-in screens with the service desk phone number, chat windows that can be clicked to initiate a real-time chat session, mouse pads imprinted with the service desk IVR menu, etc. The Service Desk maintains active communication with all stakeholder groups, including service desk employees, IT managers, company managers outside of IT, and customers. The Service Desk transmits outbound messages to users announcing major system and network outages, thereby alerting users about potential problems in the IT environment. These proactive messages help to reduce contact volumes during incidents that impact a large number of users. Company XYZ's Score
115 Some Suggested Performance Targets Performance Metric Current Performance Target Performance First Contact Resolution Rate 57.6% 75.0% First Level Resolution Rate N/A 85.0% Average Speed of Answer (ASA) (seconds) % of Calls Answered in 30 Seconds 2.6% 40.0% Call Abandonment Rate 15.3% 7.0% New Technician Training Hours Service Desk Balanced Score 62.1% 74.3% Achieving the performance targets recommended above will increase the Company XYZ Balanced Score from 62.1% to 74.3%, and put Company XYZ in the top position on the Balanced Scorecard. 114
116 Detailed Benchmarking Comparisons Company XYZ 115
117 Cost and Price Metrics Company XYZ 116
118 Definition Cost Metrics: Cost per Inbound Contact Cost per Contact is strongly correlated with the following metrics: Technician Utilization First Contact Resolution Rate Contact Handle Time Self-Serve Completion Rate Average Speed of Answer Cost per Inbound Contact is the total annual operating expense of the Service Desk divided by the annual inbound contact volume of the Service Desk. Operating expense includes all employee salaries, overtime pay, benefits, and incentive compensation, contractor costs, facilities expense, telecom costs, desktop computing, software licensing, training, travel, office supplies, and miscellaneous expenses. Contact volume includes contacts from all sources: live voice, voice mail, , web, fax, etc. Why it s Important Cost per Contact is one of the most important Service Desk metrics. It is a measure of how efficiently your Service Desk conducts its business. A higher than average Cost per Contact is not necessarily a bad thing, particularly if accompanied by higher than average quality levels. Conversely, a low Cost per Contact is not necessarily good, particularly if the low cost is achieved by sacrificing Call Quality or service levels. Every Service Desk should track and trend Cost per Contact on a monthly basis. Key Correlations 117
119 Cost per Inbound Contact Cost Metrics: Cost per Inbound Contact $22.00 $20.00 $18.00 $16.00 Key Statistics Cost per Inbound Contact High $20.50 Average $11.93 Median $11.40 Low $7.09 Company XYZ $8.42 $14.00 $12.00 $10.00 $8.00 $6.00 $4.00 $2.00 $ XYZ Service Desk 118
120 Cost Metrics: Cost per Minute of Inbound Handle Time Definition Cost per Minute of Inbound Handle Time is simply the Cost per Contact divided by the Average Inbound Contact Handle Time. The Average Inbound Contact Handle Time includes all inbound contacts: voice calls, voice mail, , web chat, walk-in, etc. Why it s Important Unlike Cost per Inbound Contact, which does not take into account the Contact Handle Time or call complexity, Cost per Minute of Inbound Handle Time is a measure of the per minute cost of providing customer support. It enables a more direct comparison of costs between Service Desks because it is independent of the types of contacts that come into the Service Desk and the complexity of those contacts. Key Correlations Cost per Minute of Inbound Handle Time is strongly correlated with the following metrics: Technician Utilization First Contact Resolution Rate User Self-Serve Completion Rate Average Speed of Answer Inbound Contacts as a % of Total Contacts 119
121 Cost per Minute of Inbound Handle Time Cost Metrics: Cost per Minute of Inbound Handle Time $2.60 $2.40 $2.20 $2.00 $1.80 $1.60 Key Statistics Cost per Minute of Inbound Handle Time High $2.43 Average $1.64 Median $1.54 Low $1.03 Company XYZ $1.46 $1.40 $1.20 $1.00 $0.80 $0.60 $0.40 $0.20 $ XYZ Service Desk 120
122 Definition Price Metrics: Price per Inbound Contact Price per Inbound Contact is strongly correlated with the following metrics: Agent Utilization First Contact resolution rate Inbound Contact Handle Time User Self-Service Completion Rate Average Speed of Answer Price per Inbound Contact is the amount paid to the outsourcer for each inbound contact handled. It is typically calculated by dividing the annual fee paid to the outsourcer by the annual inbound contact volume. Contact volume includes contacts from all sources: live voice, voice mail, , web, fax, etc. Why it s Important Price per Inbound Contact is one of the most important Service Desk metrics. It is a measure of contract efficiency and effectiveness with your outsourcer. A higher than average Price per Inbound Contact is not necessarily a bad thing, particularly if accompanied by higher than average quality levels. Conversely, a low Price per Inbound Contact is not necessarily good, particularly if the low price is achieved by sacrificing Customer Satisfaction or service levels. Every outsourced Service Desk should track and trend Price per Inbound Contact on an ongoing basis. Key Correlations 121
123 Price per Inbound Contact Price Metrics: Price per Inbound Contact (PC Helps) $26.00 $24.00 $22.00 $20.00 $18.00 $16.00 Key Statistics Price per Inbound Contact High $24.28 Average $15.84 Median $14.62 Low $7.54 Company XYZ $14.59 $14.00 $12.00 $10.00 $8.00 $6.00 $4.00 $2.00 $ XYZ Service Desk 122
124 Price Metrics: Price per Minute of Handle Time Definition Price per Minute of Handle Time is simply the Price per Contact divided by the average Inbound Contact Handle Time. Why it s Important Unlike Price per Contact, which does not take into account the Contact Handle Time or call complexity, Price per Minute of Handle Time is a measure of the per minute price paid to your outsourcer for providing technical support. It enables a more direct comparison of price between service desks and outsourcers because it is independent of the types of calls that come into the service desk and the complexity of those calls. Key Correlations Price per Minute of Handle Time is strongly correlated with the following metrics: Agent Utilization First Contact Resolution Rate User Self-Service Completion Rate Average Speed of Answer 123
125 Price per Minute of Handle Time Price Metrics: Price per Minute of Handle Time (PC Helps) $4.00 $3.50 $3.00 $2.50 Key Statistics Price per Minute of Handle Time High $3.51 Average $2.07 Median $2.02 Low $1.25 Company XYZ $1.87 $2.00 $1.50 $1.00 $0.50 $ XYZ Service Desk 124
126 Definition Cost Metrics: First Level Resolution Rate First Level Resolution is strongly correlated with the following metrics: First Contact Resolution Rate New Technician Training Hours Annual Technician Training Hours Cost per Inbound Contact Total Cost of Ownership First Level Resolution Rate is the number of incidents resolved in the Service Desk, divided by all incidents that can potentially be resolved at the Service Desk. Any incident that is pushed out to another support level (Desktop Support, Level 2 IT support, Vendor Support, etc.) is, by definition, not resolved at Level 1. Incidents than cannot be resolved at Level 1, such as a hardware failure, do not count in the First Level Resolution Rate. MetricNet considers this a cost metric since it has a strong impact on Total Cost of Ownership for end-user support Why it s Important First Level Resolution is a measure of the overall competency of the Service Desk, and is a proxy for Total Cost of Ownership (TCO). A high First Level Resolution Rate helps to minimize TCO because each contact that is resolved at Level 1 avoids a higher cost of resolution at Level n (IT, Desktop Support, Vendor Support, etc.). Service Desks can improve their First Level Resolution Rates through training, and investments in certain technologies such as remote diagnostic tools, and knowledge management systems. Key Correlations 125
127 First Level Resolution Rate Cost Metrics: First Level Resolution Rate 100.0% 98.0% 96.0% 94.0% 92.0% Key Statistics First Level Resolution Rate High 97.5% Average % Median 82.9% Low 73.7% Company XYZ N/A 90.0% 88.0% 86.0% 84.0% 82.0% 80.0% 78.0% 76.0% 74.0% 72.0% Service Desk 126
128 Productivity Metrics Company XYZ 127
129 Productivity Metrics: Inbound Contacts per Technician per Month Definition Inbound Contacts per Technician per Month is the average monthly inbound contact volume divided by the average Full Time Equivalent (FTE) Technician headcount. Contact volume includes contacts from all sources: live voice, voice mail, , web, fax, etc. Technician headcount is the average FTE number of employees and contractors handling customer contacts. Why it s Important Inbound Contacts per Technician per Month is an important indicator of Technician productivity. A low number could indicate low Technician Utilization, poor scheduling efficiency or schedule adherence, or a higher than average Contact Handle Time. Conversely, a high number of Technician handled contacts may indicate high Technician Utilization, good scheduling efficiency and schedule adherence, or a lower than average Contact Handle Time. Every Service Desk should track and trend this metric on a monthly basis. Key Correlations Inbound Contacts per Technician per Month is strongly correlated with the following metrics: Technician Utilization Inbound Contact Handle Time Cost per Inbound Contact Cost per Minute of Inbound Handle Time Technician Occupancy Average Speed of Answer 128
130 Inbound Contacts per Technician per Month Productivity Metrics: Inbound Contacts per Tech per Month XYZ Service Desk Key Statistics Inbound Contacts per Technician per Month High 910 Average Median 574 Low 329 Company XYZ
131 Definition Productivity Metrics: Technician Utilization Technician Utilization is the average time that a Technician spends handling both inbound and outbound contacts per month, divided by the number of work hours in a given month. The calculation for Technician Utilization is shown on the next page. Why it s Important Technician Utilization is the single most important indicator of Technician productivity. It measures the percentage of time that the average Technician is in work mode, and is independent of Contact Handle Time or call complexity. Key Correlations Technician Utilization is strongly correlated with the following metrics: Inbound Contacts per Technician per Month Cost per Inbound Contact Cost per Minute of Inbound Handle Time Technician Occupancy Average Speed of Answer 130
132 Technician Utilization Defined Technician Utilization = ((Average number of inbound calls handled by an tech in a month) X (Average inbound handle time in minutes) + (Average number of outbound calls handled by an tech in a month) X (Average outbound handle time in minutes)) (Average number of days worked in a month) X (Number of work hours in a day) X (60 minutes/hr) Tech Utilization is a measure of actual time worked by techs in a month, divided by total time at work during the month It takes into account both inbound and outbound contacts handled by the techs But it does not make adjustments for sick days, holidays, training time, project time, or idle time 131
133 Example: Service Desk Technician Utilization Inbound Contacts per Technician per Month = 375 Outbound Contacts per Technician per Month = 225 Average Inbound Contact Handle Time = 10 minutes Average Outbound Contact Handle Time = 5 minutes Technician Utilization = ((Average number of inbound Contacts handled by a Technician in a month) X (Average inbound handle time in minutes) + (Average number of outbound Contacts handled by a Technician in a month) X (Average outbound handle time in minutes)) (Average number of days worked in a month) X (Number of work hours in a day) X (60 minutes/hr) Technician Utilization ((375 Inbound Contacts per Month) X (10 minutes) + (225 Outbound Contacts per Month) X (5 minutes) = = 50.4% (21.5 working days per month) X (7.5 work hours per day) X (60 minutes/hr) Technician Utilization 132
134 Technician Utilization Productivity Metrics: Technician Utilization 65.0% 60.0% 55.0% 50.0% Key Statistics Technician Utilization High 62.7% Average % Median 50.3% Low 30.8% Company XYZ 54.9% 45.0% 40.0% 35.0% 30.0% 25.0% 20.0% XYZ Service Desk 133
135 Productivity Metrics: Technicians as a % of Total Headcount Definition This metric is the Full Time Equivalent Technician headcount divided by the total Service Desk headcount. It is expressed as a percentage, and represents the percentage of total Service Desk personnel who are engaged in direct customer service activities. Why it s Important The Technician headcount as a percent of total Service Desk headcount is an important measure of management and overhead efficiency. Since non-technicians include both management and nonmanagement personnel (e.g., supervisors and team leads, QA/QC, trainers, etc.), this metric is not a pure measure of management span of control. It is, however, a more useful metric than management span of control because the denominator of this ratio takes into account all personnel that are not directly engaged in customer service activities. Key Correlations Technicians as a % of Total Headcount is strongly correlated with the following metrics: Cost per Inbound Contact Cost per Minute of Inbound Handle Time 134
136 Technicians as a % of Total Headcount Productivity Metrics: Technicians as a % of Total Headcount 96.0% 94.0% 92.0% 90.0% 88.0% 86.0% Key Statistics Technician as a % of Total FTE High 93.7% Average % Median 83.5% Low 75.2% Company XYZ 79.0% 84.0% 82.0% 80.0% 78.0% 76.0% 74.0% 72.0% 70.0% XYZ Service Desk 135
137 Service Level Metrics Company XYZ 136
138 Service Level Metrics: Average Speed of Answer (ASA) Definition Average Speed of Answer is the total wait time that callers are in queue, divided by the number of calls handled. This includes both IVR-handled calls as well as calls handled by a live Technician. Most ACD systems provide this number. Why it s Important ASA is a common service level metric in the Service Desk industry. It is an indication of how responsive a Service Desk is to incoming calls. Since most Service Desks have an ASA service level target, the ASA is tracked to ensure service level compliance. Key Correlations Average Speed of Answer is strongly correlated with the following metrics: Call Abandonment Rate Percentage of Calls Answered in 30 Seconds Technician Utilization 137
139 Average Speed of Answer (ASA) (seconds) Service Level Metrics: Average Speed of Answer Key Statistics Average Speed of Answer (ASA) (seconds) High 129 Average Median 71 Low 20 Company XYZ XYZ 11 3 Service Desk 138
140 Service Level Metrics: % of Calls Answered in 30 Seconds Definition This metric is fairly self explanatory. It is the percentage of all incoming calls that are answered by a live Technician within 30 seconds. For those who don t track this exact metric, but track a similar metric such as % answered within 60 seconds, MetricNet uses a conversion formula to calculate the equivalent percentage of calls answered within 30 seconds. Why it s Important The percentage of calls answered within 30 seconds is a common service level metric in the industry. It is an indication of how responsive a Service Desk is to incoming calls. Many Service Desks have a service level target for the percentage of calls answered within 30 seconds, so the metric is tracked to ensure service level compliance. Key Correlations The Percentage of Calls Answered Within 30 Seconds is strongly correlated with the following metrics: Average Speed of Answer Call Abandonment Rate Technician Utilization 139
141 % of Calls Answered in 30 Seconds Service Level Metrics: % of Calls Answered in 30 Seconds 90.0% 80.0% 70.0% 60.0% Key Statistics % of Calls Answered in 30 Seconds High 85.8% Average % Median 44.4% Low 2.6% Company XYZ 2.6% 50.0% 40.0% 30.0% 20.0% 10.0% 0.0% XYZ Service Desk 140
142 Service Level Metrics: Call Abandonment Rate Definition Call Abandonment Rate is the percentage of calls that were connected to the ACD, but were disconnected by the caller before reaching a Technician, or before completing a process within the IVR. Why it s Important Call abandonment rate is a common service level metric in the Service Desk industry. An abandoned call is an indication that a caller has given up, and hung up the phone before receiving service from a live Technician or from an IVR. Since most Service Desks have an abandonment rate service level target, the call abandonment rate is tracked to ensure service level compliance. Key Correlations Call Abandonment Rate is strongly correlated with the following metrics: Average Speed of Answer Percentage of Calls Answered in 30 Seconds Technician Utilization 141
143 Call Abandonment Rate Service Level Metrics: Call Abandonment Rate 16.0% 14.0% 12.0% Key Statistics Call Abandonment Rate High 15.3% Average % Median 5.9% Low 1.1% Company XYZ 15.3% 10.0% 8.0% 6.0% 4.0% 2.0% 0.0% XYZ Service Desk 142
144 Quality Metrics Company XYZ 143
145 Quality Metrics: Call Quality Definition Although there is no consistent methodology for measuring Call Quality in the Service Desk industry, most Service Desks have developed their own scoring system for grading the quality of a call. Most will measure call quality on a scale of 0 to 100%, and include such things as Technician courtesy, professionalism, empathy, timeliness of resolution, quality of resolution, following the script, etc. in their Call Quality evaluations Why it s Important Call Quality is the cornerstone of Customer Satisfaction. Good Call Quality takes into account Technician knowledge and expertise, call efficiency (i.e. Call Handle Time), and Technician courtesy and professionalism. Unless Call Quality is consistently high, it is difficult to achieve consistently high levels of Customer Satisfaction. When measured properly, Call Quality and Customer Satisfaction should track fairly closely. Key Correlations Call Quality is strongly correlated with the following metrics: Customer Satisfaction First Contact Resolution Rate New Technician Training Hours Annual Technician Training Hours 144
146 Call Quality Quality Metrics: Call Quality 96.0% 94.0% 92.0% 90.0% 88.0% 86.0% Key Statistics Call Quality High 94.5% Average % Median 83.9% Low 65.1% Company XYZ N/A 84.0% 82.0% 80.0% 78.0% 76.0% 74.0% 72.0% 70.0% 68.0% 66.0% 64.0% 62.0% Service Desk 145
147 Quality Metrics: First Contact Resolution Rate Definition First Contact Resolution applies only to live (telephone) contacts. It is the percentage of inbound calls that are resolved on the first interaction with the customer, divided by all calls that are potentially resolvable on first contact. Calls that cannot be resolved on first contact, such as a hardware break/fix, are not included in the denominator of First Contact Resolution Rate. Calls that require a customer callback, or are otherwise unresolved on the first contact for any reason, do not qualify for First Contact Resolution. For contacts, some Service Desks consider an resolved on first contact if the customer receives a resolution within one hour of submitting the . Why it s Important First Contact Resolution is the single biggest driver of Customer Satisfaction. A high First Contact Resolution Rate is almost always associated with high levels of Customer Satisfaction. Service Desks that emphasize training (i.e., high training hours for new and veteran Technicians), and have good technology tools, such as remote diagnostic capability and knowledge management, generally enjoy a higher than average First Contact Resolution Rate. Key Correlations First Contact Resolution is strongly correlated with the following metrics: Customer Satisfaction Net Level 1 Resolution Rate New Technician Training Hours Annual Technician Training Hours Inbound Contact Handle Time 146
148 First Contact Resolution Rate Quality Metrics: First Contact Resolution Rate 95.0% 90.0% 85.0% 80.0% Key Statistics First Contact Resolution Rate High 91.4% Average % Median 70.4% Low 57.6% Company XYZ 57.6% 75.0% 70.0% 65.0% 60.0% 55.0% 50.0% 45.0% XYZ Service Desk 147
149 Quality Metrics: Customer Satisfaction Definition Customer Satisfaction is the percentage of customers who are either satisfied or very satisfied with their Service Desk experience. This metric can be captured in a numbers of ways including automatic after-call IVR surveys, follow-up outbound (live Technician) calls, surveys, postal surveys, etc. Why it s Important Customer Satisfaction is the single most important measure of Service Desk quality. Any successful Service Desk will have consistently high Customer Satisfaction ratings. Some Service Desk managers are under the impression that a low Cost per Inbound Contact may justify a lower level of Customer Satisfaction. But this is not true. MetricNet s research shows that even Service Desk s with a very low Cost per Inbound Contact can achieve consistently high Customer Satisfaction ratings. Key Correlations Customer Satisfaction is strongly correlated with the following metrics: First Contact Resolution Rate Call Quality 148
150 Customer Satisfaction Quality Metrics: Customer Satisfaction 100.0% 95.0% 90.0% 85.0% Key Statistics Customer Satisfaction High 96.7% Average % Median 76.1% Low 63.1% Company XYZ 87.6% 80.0% 75.0% 70.0% 65.0% 60.0% 55.0% 50.0% 21 6 XYZ Service Desk 149
151 Technician Metrics Company XYZ 150
152 Technician Metrics: Annual Technician Turnover Definition Annual Technician Turnover is the percentage of Technicians that leave the Service Desk, for any reason (voluntarily or involuntarily), on an annual basis. Why it s Important Technician turnover is costly. Each time a Technician leaves the Service Desk, a new Technician needs to be hired to replace the outgoing Technician. This results in costly recruiting, hiring, and training expenses. Additionally, it is typically several weeks or even months before a Technician is fully productive, so there is lost productivity associated with Technician turnover as well. High Technician turnover is generally associated with low Technician morale in a Service Desk. Key Correlations Annual Technician Turnover is strongly correlated with the following metrics: Daily Technician Absenteeism Annual Technician Training Hours Customer Satisfaction Net First Contact Resolution Rate Cost per Inbound Contact Technician Job Satisfaction 151
153 Technician Metrics: Annual Technician Turnover 70.0% 65.0% 60.0% 55.0% 50.0% Key Statistics Annual Technician Turnover High 65.6% Average % Median 40.3% Low 13.6% Company XYZ 31.3% Annual Technician Turnover 45.0% 40.0% 35.0% 30.0% 25.0% 20.0% 15.0% 10.0% 5.0% 0.0% XYZ Sevice Desk 152
154 Technician Metrics: Daily Technician Absenteeism Definition Daily Technician Absenteeism is the average percentage of Technicians with an unexcused absence on any given day. It is calculated by dividing the number of absent Technicians by the total number of Technicians that are scheduled to be at work. Why it s Important High Technician Absenteeism is problematic because it makes it difficult for a Service Desk to schedule resources efficiently. High absenteeism can severely impact a Service Desk s operating performance, and increase the likelihood that service level targets will be missed. A Service Desk s ASA and Call Abandonment Rate typically suffer when absenteeism is high. Also, chronically high absenteeism is often a sign of low Technician morale. Key Correlations Daily Technician Absenteeism is strongly correlated with the following metrics: Annual Technician Turnover Technician Job Satisfaction Technician Utilization Cost per Inbound Contact Contacts per Technician per Month 153
155 Technician Metrics: Daily Technician Absenteeism Daily Technician Absenteeism 26.0% 24.0% 22.0% 20.0% 18.0% 16.0% 14.0% 12.0% 10.0% 8.0% 6.0% Key Statistics Daily Technician Absenteeism High 24.2% Average % Median 10.1% Low 4.7% Company XYZ 10.3% 4.0% 2.0% 0.0% XYZ Sevice Desk 154
156 Technician Metrics: Technician Schedule Adherence Definition Technician Schedule Adherence is a measure of whether Technicians are in their seats ready to accept calls as scheduled. It measures how well a Service Desk s Technicians are adhering to the schedule. Technician Schedule Adherence is equal to the actual time that a Technician is logged in to the system ready to accept calls, divided by the total time the Technician is scheduled to be available to accept calls. Why it s Important Effective Technician scheduling is critical to achieving a Service Desk s service level goals and maximizing Technician Utilization. However, a work schedule, no matter how well constructed, is only as good as the adherence to the schedule. It is therefore important for Technicians to adhere to the schedule as closely as possible to ensure that these productivity and service level goals are met. Key Correlations Technician schedule adherence is strongly correlated with the following metrics: Technician Utilization Inbound Contacts per Technician per Month Technician Occupancy Average Speed of Answer 155
157 Technician Metrics: Technician Schedule Adherence 92.0% 90.0% 88.0% 86.0% Key Statistics Schedule Adherence High 90.8% Average % Median 83.8% Low 72.7% Company XYZ 89.7% Schedule Adherence 84.0% 82.0% 80.0% 78.0% 76.0% 74.0% 72.0% 70.0% XYZ Sevice Desk 156
158 Technician Metrics: New Technician Training Hours Definition The name of this metric is somewhat self explanatory. New Technician Training Hours is the number of training hours (including classroom, CBT, self-study, shadowing, being coached, and OJT) that a new Technicians receives before he/she is allowed to handle customer contacts independently. Why it s Important New Technician Training Hours are strongly correlated with Call Quality and Net First Contact Resolution Rate. particularly during a Technician s first few months on the job. The more training a new Technician receives, the higher the Call Quality and Net FCR will typically be. This, in turn, has a positive effect on many other performance metrics including Customer Satisfaction. Perhaps most importantly, training levels have a strong impact on Technician morale: Technicians who receive more training typically have higher levels of job satisfaction. Key Correlations New Technician Training Hours are strongly correlated with the following metrics: Call Quality Net First Contact Resolution Rate Customer Satisfaction Inbound Contact Handle Time Technician Job Satisfaction 157
159 New Technician Training Hours Technician Metrics: New Technician Training Hours Key Statistics New Technician Training Hours High 238 Average Median 125 Low 67 Company XYZ XYZ Service Desk 158
160 Technician Metrics: Annual Technician Training Hours Definition Annual Technician Training Hours is the average number of training hours (including classroom, CBT, self-study, shadowing, etc.) that a Technician receives on an annual basis. This number includes any training hours that a Technician receives that are not part of the Technician s initial (new Technician) training, but it does not include routine team meetings, shift handoffs, or other activities that do not involve formal training. Why it s Important Annual Technician Training Hours are strongly correlated with Call Quality, Customer Satisfaction, and Net First Contact Resolution Rate. Perhaps most importantly, training levels have a strong impact on Technician morale: Technicians who train more typically have higher levels of job satisfaction. Key Correlations Annual Technician Training Hours are strongly correlated with the following metrics: Call Quality Net First Contact Resolution Rate Customer Satisfaction Inbound Contact Handle Time Technician Job Satisfaction 159
161 Annual Technician Training Hours Technician Metrics: Annual Technician Training Hours Key Statistics Annual Technician Training Hours High 74 Average Median 12 Low 0 Company XYZ XYZ Service Desk 160
162 Definition Technician Metrics: Technician Tenure Technician tenure is the average number of months that Technicians have worked on a particular Service Desk. Why it s Important Technician tenure is a measure of Technician experience. Virtually every metric related to Service Desk cost and quality is impacted by the level of experience the Technicians have. Key Correlations Technician tenure is strongly correlated with the following metrics: Cost per Inbound Contact Call Quality Customer Satisfaction Annual Technician Turnover Training Hours Coaching Hours Inbound Contact Handle Time Net First Contact Resolution Rate Technician Job Satisfaction 161
163 Technician Tenure (months) Technician Metrics: Technician Tenure Key Statistics Technician Tenure (months) High 86.9 Average Median 28.2 Low 17.6 Company XYZ XYZ Service Desk 162
164 Technician Metrics: Technician Job Satisfaction Definition Technician Job Satisfaction is the percent of Technicians in a Service Desk that are either satisfied or very satisfied with their jobs. Why it s Important Technician Job Satisfaction is a proxy for Technician morale. And morale, while difficult to measure, is a bellwether metric that affects almost every other metric in the Service Desk. High performance Service Desks almost always have high levels of Technician Job Satisfaction. Perhaps more importantly, this metric can be controlled and improved through training, coaching, and career pathing. Key Correlations Technician Job Satisfaction is strongly correlated with the following metrics: Annual Technician Turnover Customer Satisfaction Daily Technician Absenteeism Net First Contact Resolution Rate Technician Training Hours Inbound Contact Handle Time Technician Coaching Hours Cost per Inbound Contact 163
165 Technician Job Satisfaction Technician Metrics: Technician Job Satisfaction 100.0% 95.0% 90.0% 85.0% Key Statistics Technician Job Satisfaction High 99.0% Average % Median 66.8% Low 53.3% Company XYZ 99.0% 80.0% 75.0% 70.0% 65.0% 60.0% 55.0% 50.0% XYZ Sevice Desk 164
166 Contact Handling Metrics Company XYZ 165
167 Contact Handling Metrics: Inbound Contact Handle Time Definition Inbound Contact Handle Time for a live (telephone) contact is the average time that a Technician spends on the contact, including Talk Time, wrap time, and After Call Work Time. For non-live contacts, such as , voice mail, and faxes, the Inbound Contact Handle Time is the average time that a Technician spends resolving the contact. Why it s Important A contact is the basic unit of work in a Call Center. Contact Handle Time, therefore, represents the amount of labor required to complete one unit of work. Key Correlations Inbound Contact Handle Time is strongly correlated with the following metrics: Cost per Inbound Contact Inbound Contacts per Technician per Month Net First Contact Resolution Rate 166
168 Inbound Contact Handle Time (minutes) Contact Handling Metrics: Inbound Contact Handle Time Key Statistics Inbound Contact Handle Time (minutes) High 9.08 Average Median 7.35 Low 5.29 Company XYZ XYZ Service Desk 167
169 Contact Handling Metrics: User Self-Serve Completion Rate Definition The User Self-Serve Completion Rate is the percentage of incidents that are resolved by the user without the assistance of a live Technician. These could include contacts that are resolved within the IVR (e.g., automated password resets), and incidents that are resolved by the user through a self-help portal. A user who opts out of the IVR or self-help session to speak with a live Technician does not count as User Self-Serve because the user did not obtain a resolution for their issue before speaking with a live Technician. Why it s Important The Cost per Contact for self-serve contacts is significantly lower than it is for Technician assisted calls. By increasing the number of contacts resolved through Self-Serve, the average Cost per Inbound Contact can be reduced significantly. Many Service Desks, recognizing the potential to reduce their costs, constantly strive to increase their Self-Serve Completion Rates. Key Correlations User Self-Serve Completion Rate is strongly correlated with the following metrics: Cost per Inbound Contact 168
170 User Self-Serve Completion Rate Contact Handling Metrics: User Self-Serve Completion Rate 26.0% 24.0% 22.0% 20.0% 18.0% Key Statistics User Self-Serve Completion Rate High 25.2% Average % Median 7.9% Low 0.0% Company XYZ 0.0% 16.0% 14.0% 12.0% 10.0% 8.0% 6.0% 4.0% 2.0% 0.0% XYZ Sevice Desk 169
171 Your Speaker: Jeff Rumburg Co Founder and Managing Partner, MetricNet, LLC Winner of the 2014 Ron Muns Lifetime Achievement Award Former CEO, The Verity Group Former Vice President, Gartner Founder of the Service Desk Benchmarking Consortium Author of A Hands-On Guide to Competitive Benchmarking Harvard MBA, Stanford MS 2016 MetricNet, LLC, 170

172 About MetricNet: Your Benchmarking Partner Company XYZ


173 Benchmarking is MetricNet s Core Business Information Technology Call Centers Telecom Service Desk Desktop Support Field Services Technical Support Customer Service Telemarketing/Telesales Collections Cost Benchmarking Satisfaction Customer Satisfaction Employee Satisfaction 2016 MetricNet, LLC, 172
174 27 Years of Service and Support Benchmarking Data Global Database More than 3,700 Service Desk Benchmarks 20+ Key Performance Indicators Nearly 60 Industry Best Practices 2016 MetricNet, LLC, 173


175 More than Half the FORTUNE 500 Use MetricNet Benchmarks MetricNet Conducts HR Service Center benchmarking for organizations worldwide, and across virtually every industry sector MetricNet, LLC, 174
176 Your Project Manager: Jeff Rumburg Co Founder and Managing Partner, MetricNet, LLC Winner of the 2014 Ron Muns Lifetime Achievement Award Former CEO, The Verity Group Former Vice President, Gartner Founder of the Service Desk Benchmarking Consortium Author of A Hands-On Guide to Competitive Benchmarking Harvard MBA, Stanford MS 2016 MetricNet, LLC, 175

177 Thank You! Company XYZ
Company XYZ X Y Z. Peer Group Service Desk Benchmark. Company
 Company XYZ Peer Group Service Desk Benchmark Company X Y Z Report Contents Project Overview and Objectives Page 2 Industry Background Page 34 Performance Benchmarking Summary Page 43 Best Practices Process
Company XYZ X Y Z. Peer Group Service Desk Benchmark. Company
 Company XYZ Peer Group Service Desk Benchmark Company X Y Z Report Contents Project Overview and Objectives Page 2 Industry Background Page 34 Performance Benchmarking Summary Page 43 Best Practices Process
IT Service and Support Benchmark
 IT Service and Support Benchmark For Higher Education Information Briefing Your Speaker: Jeff Rumburg Co Founder and Managing Partner, MetricNet, LLC Winner of the 2014 Ron Muns Lifetime Achievement Award
IT Service and Support Benchmark
 IT Service and Support Benchmark For Higher Education Information Briefing Your Speaker: Jeff Rumburg Co Founder and Managing Partner, MetricNet, LLC Winner of the 2014 Ron Muns Lifetime Achievement Award
Company XYZ X Y Z. Peer Group Desktop Support Benchmark. Company
 Company XYZ Peer Group Desktop Support Benchmark Company X Y Z Report Contents Project Overview and Objectives Page 2 Industry Background Page 34 Performance Benchmarking Summary Page 49 Best Practices
The 80/20 Rule for Service and Support KPIs: The Metrics of Success!
 The 80/20 Rule for Service and Support KPIs: The Metrics of Success! Prepared by: Jeff Rumburg Managing Partner MetricNet, LLC @MetricNet October 2, 2018 Download ebooks and Today s Presentation https://www.metricnet.com/fusion18/
Turbocharge Your Metrics. With Benchmarking. Jeff Rumburg, Managing Partner at MetricNet
 Turbocharge Your Metrics With Benchmarking Jeff Rumburg, Managing Partner at MetricNet Read the Whitepaper in HDI s Support World http://www.thinkhdi.com/library/supportworld/2017/ turbocharge-your-metrics-with-benchmarking.aspx
Session 102: Benchmark Your Way to World-Class Performance! Jeff Rumburg, Managing Partner, MetricNet, LLC
 Session 102: Benchmark Your Way to World-Class Performance! Jeff Rumburg, Managing Partner, MetricNet, LLC Characteristics of a World-Class Contact Center Contact center consistently exceeds customer expectations
Service and Support as a Business
 Service and Support as a Business Creating Lasting Value in IT Service and Support MetricNet Best Practices Series Empirical Observations from Our Global Benchmarking Database Global Database More than
Company XYZ X Y Z. Peer Group Contact Center Benchmark. Company
 Company XYZ Peer Group Contact Center Benchmark Company X Y Z Report Contents Project Overview and Objectives Page 2 Industry Background Page 34 Performance Benchmarking Summary Page 42 Best Practices
Unleashing the Enormous Power of Call Center KPI s. Call Center Best Practices Series
 Unleashing the Enormous Power of Call Center KPI s Call Center Best Practices Series 27 Years of Call Center Benchmarking Data Global Database More than 3,700 Call Center Benchmarks 30 Key Performance
IT Service and Support. Key Success Factors in Higher Education
 IT Service and Support Key Success Factors in Higher Education Empirical Observations from Our Global Database Global Database More than 3,700 IT Service and Support Benchmarks 70+ Key Performance Indicators
The Service Desk Balanced Scorecard
 The Service Desk Balanced Scorecard Your Overall Measure of Service Desk Performance MetricNet Best Practices Series Your Speaker: Jeff Rumburg Co Founder and Managing Partner, MetricNet, LLC Winner of
The Call Center Balanced Scorecard
 The Call Center Balanced Scorecard Your Overall Measure of Call Center Performance! MetricNet Best Practices Series Some Common Call Center KPIs Cost Cost per Contact Cost per Minute of Handle Time Quality
Leveraging Metrics to Take Southwest Airlines to a Higher Plane Case Study
 Leveraging Metrics to Take Southwest Airlines to a Higher Plane Case Study Your Speaker: Jeff Rumburg The One Year Path to World-Class Implement Performance Project Annual Initial Benchmark and ROI Calculation
Session 204: A New World Order Managing Your Contact Center as a Business! Jeff Rumburg, Managing Partner, MetricNet
 1 Session 204: A New World Order Managing Your Contact Center as a Business! Jeff Rumburg, Managing Partner, MetricNet 2 Download Today s Presentation https://www.metricnet.com/icmidemo18/ 3 Empirical
Call Center Best Practices
 Call Center Best Practices The Road to World Class Performance! MetricNet Best Practices Series 27 Years of Call Center Benchmarking Data Global Database More than 3,700 Call Center Benchmarks 30 Key Performance
Enterprise Service Desk The Greatest Career Opportunity in a Generation!
 Enterprise Service Desk The Greatest Career Opportunity in a Generation! Your Speaker: Jeff Rumburg Empirical Observations Global Database Nearly 4,000 Service and Support Benchmarks 70+ Key Performance
Unleashing the Enormous Power of Service Desk KPI s. Service Desk Best Practices Series
 Unleashing the Enormous Power of Service Desk KPI s Service Desk Best Practices Series Visit Our New Website at www.metricnet.com 1 1 Become a Member: It s Free! 2 MetricNet Benchmarks MetricNet Benchmarks
From Good to Great The Emory Healthcare Success Journey! Your Speaker: Jeff Rumburg
 From Good to Great The Emory Healthcare Success Journey! Your Speaker: Jeff Rumburg Download Two KPI ebooks & Today s Presentation MetricNet.com/smw18 3 The One Year Path to World-Class Performance 4 The
Session 406: Contact Center Cause-and-Effect: Leveraging the Full Potential of Your KPIs Jeff Rumburg, Managing Partner, MetricNet, LLC
 Session 406: Contact Center Cause-and-Effect: Leveraging the Full Potential of Your KPIs Jeff Rumburg, Managing Partner, MetricNet, LLC 28 Years of Contact Center Benchmarking Data Global Database More
Call Center Benchmark
 Call Center Benchmark United States In-house/Insourced Call Centers Report Contents Benchmarking Overview Page 2 KPI Statistics and Quartiles Page 8 Benchmarking Scorecard and Rankings Page 15 Detailed
Call Center Industry Benchmark
 Call Center Industry Benchmark In-house/Insourced Call Centers Report Contents Benchmarking Overview Page 2 KPI Statistics and Quartiles Page 8 Benchmarking Scorecard and Rankings Page 15 Detailed Benchmarking
Call Center Benchmark India
 Call Center Benchmark India Outsourced Call Centers Report Contents Benchmarking Overview Page 2 KPI Statistics and Quartiles Page 8 Benchmarking Scorecard and Rankings Page 13 Detailed Benchmarking Data
Walt Disney World Dolphin Resort Orlando, FL May 22 25, 2018
 Session 405: Maximizing the ROI of Customer Care Jeff Rumburg, Managing Partner, MetricNet, LLC 28 Years of Contact Center Benchmarking Data Global Database Nearly 4,000 Contact Center Benchmarks 70+ Key
The ROI of ITSM. Know Your Financial Impact! MetricNet Best Practices Series
 The ROI of ITSM Know Your Financial Impact! MetricNet Best Practices Series Las Vegas, NV #HDIConf APRIL 10 APRIL 13, 2018 Leveraging Metrics to Take Southwest Airlines to a Higher Plane A Case Study Session
The ROI of ITSM Know Your Financial Impact! Jeff Rumburg Managing Partner MetricNet, LLC
 The ROI of ITSM Know Your Financial Impact! Jeff Rumburg Managing Partner MetricNet, LLC Download Today s Presentation https://www.metricnet.com/fusion17/ 28 Years of Service and Support Benchmarks Global
Any Time Any Place Support: The Ultimate Customer Experience. Jeff Rumburg, Managing Partner at MetricNet
 Any Time Any Place Support: The Ultimate Customer Experience Jeff Rumburg, Managing Partner at MetricNet The Origins of Any Time, Any Place The Consumerization of Support What do End Users Want? Channel
Service Desk Metrics
 AN INTRO TO Service Desk Metrics An introductory guide to Service Desk Metrics including definitions, importance & key correlations. MetricNet, LLC - IT Service and Support Benchmarking - 1 TABLE OF CONTENTS
Service Desk KPIs Definitions & Correlations
 Service Desk KPIs Definitions & Correlations Learn how each of the Service Desk metrics that we benchmark is defined, why it s important, and how it correlates with other metrics. We include metrics from
The ROI of ITSM Know Your Financial Impact!
 The ROI of ITSM Know Your Financial Impact! Jeff Rumburg Managing Partner MetricNet, LLC 28 Years of Service and Support Benchmarks Global Database More than 3,700 IT Service and Support Benchmarks 70+
Session 309 C-Level Success, and the Secret Weapon of Service and Support Jeff Rumburg Managing Partner MetricNet, LLC
 Session 309 C-Level Success, and the Secret Weapon of Service and Support Jeff Rumburg Managing Partner MetricNet, LLC 28 Years of Service and Support Benchmarking Data Global Database More than 3,700
Metric of the Month. First Contact Resolution Rate By Jeff Rumburg. Managing Partner at:
 Metric of the Month First Contact Resolution Rate By Jeff Rumburg Managing Partner at: Every month MetricNet highlights one Key Performance Indicator for the Service Desk, Call Center, or Desktop Support.
The Balanced Scorecard
 By Jeff Rumburg Managing Partner at: The Balanced Scorecard Today s call center technologies and reporting packages make it easy to capture copious amounts of performance data. Most call center managers
The Service Desk Balanced Scorecard By Jeff Rumburg. Managing Partner at:
 By Jeff Rumburg Managing Partner at: This month we depart from our usual format, and instead of discussing a single metric I will explain how a handful of critical metrics can be combined to create a single,
Desktop Support Metrics
 AN INTRO TO Desktop Support Metrics An introductory guide to Desktop Support Metrics including definitions, importance & key correlations. MetricNet, LLC - IT Service and Support Benchmarking - 1 TABLE
SAMPLE REPORT. Desktop Support Benchmark. Outsourced Desktop Support DATA IS NOT ACCURATE!
 SAMPLE REPORT DATA IS NOT ACCURATE! Desktop Support Benchmark Outsourced Desktop Support Report Number: DS-SAMPLE-OUT-0116 Updated: January 2016 MetricNet s instantly downloadable Desktop Support benchmarks
SAMPLE REPORT. Desktop Support Benchmark DATA IS NOT ACCURATE! Outsourced Desktop Support
 SAMPLE REPORT DATA IS NOT ACCURATE! Desktop Support Benchmark Outsourced Desktop Support Report Number: DS-SAMPLE-OUT-0617 Updated: June 2017 MetricNet s instantly downloadable Desktop Support benchmarks
SAMPLE REPORT. Desktop Support Benchmark DATA IS NOT ACCURATE! In-house/Insourced Desktop Support
 SAMPLE REPORT DATA IS NOT ACCURATE! Desktop Support Benchmark In-house/Insourced Desktop Support Report Number: DS-SAMPLE-IN-0617 Updated: June 2017 MetricNet s instantly downloadable Desktop Support benchmarks
Glossary 1. For a complete glossary of support center terminology, please visit HDI s Web site at HDI Course Glossary
 Glossary 1 Term Abandon Before Answer (ABA) Rate The percentage of customers that terminate a call (i.e., hang up) before the call is answered. ABA is a leading indicator that is used to manage staffing
Eight Essential KPI s for Managing Desktop Support
 How Does YOUR Desktop Support Stack Up? By Jeff Rumburg and Eric Zbikowski Managing Partners at: Introduction When it comes to end-user support, most people automatically think of the Level 1 Help Desk.
Desktop Support: IT Backbone or Fossil? Susan Sheehan Service Line Manager, Lifecycle Services Outsourced Managed Solutions
 Desktop Support: IT Backbone or Fossil? Susan Sheehan Service Line Manager, Lifecycle Services Outsourced Managed Solutions Tuesday, August 5, 2014 General Webinar Information Share the webinar Ask a question
Information Technology Analysis Hydro-Quebec Management Presentation. October 30th 2004
 Information Technology Analysis October 30th 2004 Table of Contents Analysis Methodology Objectives and Scope of Analysis Executive Summary Page 1 Analysis Methodology x Page 2 Benchmark Methodology Overview
Metric of the Month. Net Promoter Score. By Jeff Rumburg Managing Partner at:
 Metric of the Month By Jeff Rumburg Managing Partner at: Every month Industry Insider highlights one Key Performance Indicator for the Service Desk or Desktop Support. We define the KPI, provide recent
The Total Economic Impact Of ServiceNow Customer Service Management How Epicor Software Achieves 104% ROI by Transforming Global Customer Support
 The Total Economic Impact Of ServiceNow Customer Service Management How Epicor Software Achieves 104% ROI by Transforming Global Customer Support Anish Shah Principal Consultant Forrester Research Ian
MEASURING WHAT MATTERS
 MEASURING WHAT MATTERS Overview Discussion document and considerations key performance measures that would form the core of a unique, simplified method of measurement called a VALUE Indicator Score. It
ICMI PROFESSIONAL CERTIFICATION
 ICMI PROFESSIONAL CERTIFICATION Contact Center Management Competencies The ICMI Professional Certification Contact Center Management Competencies specify job role-specific knowledge, skills and abilities
The SOURCE for Contact Centers
 BenchmarkPortal is the leader in Call Center Benchmarking, Call Center Training, and Call Center Consulting. Since its beginnings in 1995 under Dr. Jon Anton of Purdue University, BenchmarkPortal has grown
YOUR BEST ITSM BUDGET EVER. How to be absolutely sure you 've thought of everything for 2016.
 YOUR BEST ITSM BUDGET EVER How to be absolutely sure you 've thought of everything for 2016. " End user support makes up 95% of the perception of IT across an organization. But, the typical IT department
Staffing Strategies for the 21 st Century
 Staffing Strategies for the 21 st Century Katherine Spencer Lee Executive Director, Robert Half Technology HDI Northern New England September 18, 2008 Robert Half Technology. An Equal Opportunity Employer
Top 35 Reasons You Need Contact Center Performance Management
 Top 35 Reasons You Need Contact Center Performance Management February 2014 Sponsored by: - 1 - DMG Consulting LLC Table of Contents Introduction... 1 Real-Time and Historical CCPM... 1 Top Reasons to
The Ohio State University June 8, 2018 Board of Trustees
 The Ohio State University June 8, 2018 Board of Trustees THURSDAY, JUNE 7, 2018 TALENT AND COMPENSATION COMMITTEE MEETING Hiroyuki Fujita Alex Shumate Clark C. Kellogg Erin P. Hoeflinger John W. Zeiger
SAP Performance Benchmarking Human Capital Management Benchmarking Results. Company: ABC Company 6/25/2012
 SAP Performance Benchmarking Benchmarking Results Company: ABC Company 6/5/0 Statement of Confidentiality and Exceptions The information and analysis contained herein are the confidential and proprietary
2017 Contact Center Overflow Vendor Request for Proposals Responses to RFP Questions
 2017 Contact Center Overflow Vendor Request for Proposals Responses to RFP Questions May 5, 2017 All questions are addressed below: Q1: Will the vendor s geographic location(s) or potential location(s)
Transforming Internal Audit to Drive Business Performance. 21 June, 2011
 Transforming Internal Audit to Drive Business Performance 21 June, 2011 Agenda Stakeholder Needs from Survey Data Linking Business Performance to Internal Audit The Role of Risk Management Becoming a Strategic
SESSION 607 Thursday, April 14, 2:45pm - 3:45pm Track: Metrics and Measurements. The Good, Bad and Ugly of Service Desk Metrics. Session Description
 SESSION 607 Thursday, April 14, 2:45pm - 3:45pm Track: Metrics and Measurements The Good, Bad and Ugly of Service Desk Metrics Gary Case Principal Consultant, Pink Elephant g.case@pinkelephant.com Session
The Ohio State University April 6, 2018 Board of Trustees
 The Ohio State University April 6, 2018 Board of Trustees THURSDAY, APRIL 5, 2018 TALENT AND COMPENSATION COMMITTEE MEETING W. G. Jurgensen Janet B. Reid Michael J. Gasser Erin P. Hoeflinger Hiroyuki Fujita
ON-THE-JOB TRAINING BLUEPRINT
 ON-THE-JOB TRAINING BLUEPRINT SUPERVISOR MODULE BUILDING EFFECTIVE CALL CENTRE WORK TEAMS Developed in collaboration with Customer Service Transformation Pte Ltd Copyright Singapore Productivity and Standards
Key Service Qualities to Build Cardmember Satisfaction and Profitability
 Key Service Qualities to Build Cardmember Satisfaction and Profitability The best strategic thinkers at your credit union have developed a set of compelling consumer credit card products and a fail-proof
The Secrets of Successful Knowledge Management
 SESSION 408 Thursday, April 14, 10:00am - 11:00am Track: Industry Insights The Secrets of Successful Knowledge Management Peter McGarahan Senior IT Director, Infrastructure Corporate IT, First American
Efficiency First Program
 Efficiency First Program Short-Term Impact; Long-Term Results Presented to: Discussion Points About AOTMP Your Telecom Environment The Efficiency First Framework Our Approach The Efficiency First Program
CUSTOMER SERVICE. Overview
 CUSTOMER SERVICE Overview Better Customer Service Drives Company Value companies with high customer satisfaction scores have blown the S&P 500 out of the water, especially over the last few years. Not
Metrics Mania: What, Why, and How (do I compare)?
?") Metrics Mania: What, Why, and How (do I compare)? Credit Union Call Center Conference October 18, 2016 Las Vegas Strategic Contact 9510 SW 151 st Avenue Beaverton, OR 97007 phone 503.579.8560 toll free
Metrics Mania: What, Why, and How (do I compare)? Credit Union Call Center Conference October 18, 2016 Las Vegas Strategic Contact 9510 SW 151 st Avenue Beaverton, OR 97007 phone 503.579.8560 toll free
IT MANAGER - BUSINESS & TECHNOLOGY APPLICATIONS (12235) ( )
 ( )") GENERAL DESCRIPTION OF WORK IT MANAGER - BUSINESS & TECHNOLOGY APPLICATIONS (12235) (31000275) Positions in this banded class are responsible for supervisory and managerial work in directing a designated
GENERAL DESCRIPTION OF WORK IT MANAGER - BUSINESS & TECHNOLOGY APPLICATIONS (12235) (31000275) Positions in this banded class are responsible for supervisory and managerial work in directing a designated
Trends and Best Practice in Customer Service
 www.pwc.com Customer Service Trends and Best Practice in Customer Service March 4 th, 2018 A call to arms.the vast majority of respondants to s CEO survey 2018 believe customer behaviour changes will be
LEGAL SERVICE DESK SUPPORT
 2nd Edition September 2011 THE GURU S GUIDE FOR LEGAL SERVICE DESK SUPPORT LAW FIRM SPECIFIC METRICS & KEY PERFORMANCE INDICATORS 1 GURU S GUIDE: DATA & SYSTEM ASSUMPTIONS As was the case with the original
Microsoft REJ Framework: Step by Step
 Microsoft REJ Framework: Step by Step Quantifying the Business Value of Information Technology (IT) Investments Abstract IT managers today face challenges of delivering products to markets faster, making
ROUNDTABLE WORKFORCE MANAGEMENT TIPS AND TECHNIQUES
 Jeff Whitt, Solutions Consultant, Aspect Paul Chance, Senior Product Marketing Manager, WFM, NICE Larry Schwartz, Chairman and CEO of WorkFlex Solutions, LLC ROUNDTABLE WORKFORCE MANAGEMENT TIPS AND TECHNIQUES
Customer Advocacy: Maintain a Customer Focus Throughout the Incident Management Process. Julie L. Mohr
 Customer Advocacy: Maintain a Customer Focus Throughout the Incident Management Process By Julie L. Mohr The IT organization exists to efficiently provision and support technology to meet business objectives.
Getting Workforce Optimization Right
 Getting Workforce Optimization Right How to align agent training and management with customer needs An Ovum White Paper sponsored by Publication Date: July 2011 INTRODUCTION Although the economy is seemingly
IT MANAGER - BUSINESS & TECHNOLOGY APPLICATIONS (12235) ( )
 ( )") GENERAL DESCRIPTION OF WORK Positions in this banded class are responsible for supervisory and managerial work in directing a designated team of computer applications analysts and applications programmers
GENERAL DESCRIPTION OF WORK Positions in this banded class are responsible for supervisory and managerial work in directing a designated team of computer applications analysts and applications programmers
CX Best Practice Award Winner
 CX Best Practice Award Winner for Escalation CSR Support Regence Blue Cross and Blue Shield Plans (Idaho, Oregon, Utah & select counties of Washington State) published 03-30-2018 CX Best Practice Success
Service Business Plan
 Service Business Plan Service Name Information Technology Service Type Internal Service Owner Name Christine Swenor Budget Year 2017 Service Owner Title Service Description Director of IT Services An internal
Company: Rockwell Collins Industry: Aerospace & Defense Category: Technology
 Company: Rockwell Collins Industry: Aerospace & Defense Category: Technology Sam Slingluff saslingl@rockwellcollins.com Rockwell Collins (319)-295-8750 400 Collins Rd NE (319)-295-0878 Cedar Rapids, IA
ITIL from brain dump_formatted
 ITIL from brain dump_formatted Number: 000-000 Passing Score: 800 Time Limit: 120 min File Version: 1.0 Экзамен A QUESTION 1 Which role is responsible for carrying out the activities of a process? A. Process
EXL 2016 Performance Report. Stacie Loucks, Executive Director May 2, 2016
 EXL 2016 Performance Report Stacie Loucks, Executive Director May 2, 2016 Millions $3 $3 $2 $2 $1 $1 $- Budget $2.82 Personnel Services 2015 EXPENSES: Budget vs. Actual $2.65 $1.37 $0.72 Supplies, Material
Maximize the Strategic Value of Your Service Professionals. Shawn Fox Industry Director Professional Services
 Maximize the Strategic Value of Your Service Professionals Shawn Fox Industry Director Professional Services Safe Harbor Statement The following is intended to outline our general product direction. It
 ITIL in the Workplace The Practical Application of a Best Practice Framework Susan Ryan April 3, 2009 Agenda Hello! Why IT Service Management? ITIL 101 Maturity Assessment and Roadmaps Project Foundation
OMNI-CHANNEL CUSTOMER CARE: HOW TO DELIVER CONTEXT-DRIVEN EXPERIENCES
 RR OMNI-CHANNEL CUSTOMER CARE: HOW TO DELIVER CONTEXT-DRIVEN EXPERIENCES October 2017 Omer Minkara VP and Principal Analyst, Contact Center and Customer Experience Management Using more channels is no
Collections & Customer Service Flex Agent Proposal
 Collections & Customer Service Flex Agent Proposal Executive Summary 12/01/05 Submitted for consideration for CWPP certification suggested Project #9 Problem Statement Executive Management of a Financial
IBM Tivoli Service Desk
 Deliver high-quality services while helping to control cost IBM Tivoli Service Desk Highlights Streamline incident and problem management processes for more rapid service restoration at an appropriate
EXIN ITIL. Exam Name: Exin ITIL Foundation
 EXIN ITIL Number: EX0-001 Passing Score: 800 Time Limit: 120 min File Version: 24.5 http://www.gratisexam.com/ Exam Name: Exin ITIL Foundation Exam A QUESTION 1 Which role is responsible for carrying out
ITIL Foundation v.3. Number: Passing Score: 800 Time Limit: 120 min File Version: 1.0.
 ITIL Foundation v.3 Number: 000-000 Passing Score: 800 Time Limit: 120 min File Version: 1.0 http://www.gratisexam.com/ Exam A QUESTION 1 Which of the following is NOT an example of Self-Help capabilities?
EX0-114_Wins_Exam. Number: Passing Score: 800 Time Limit: 120 min File Version: 1.0
 EX0-114_Wins_Exam Number: 000-000 Passing Score: 800 Time Limit: 120 min File Version: 1.0 http://www.gratisexam.com/ 20000 IT Service Management Foundation Bridge based on ISO/IEC Total Questions: 78
the council initiative on public engagement
 public engagement at the city of edmonton share your voice shape our city the council initiative on public engagement new public engagement practice and implementation roadmap final report CITY OF EDMONTON
Award for Continuous Improvement Process: Millennium1 Solutions. published
 Call Center FCRCX Best Practice Award Best Practice AwardWinner Winner Award for Continuous Improvement Process: Millennium1 Solutions published 09-21-2017 CX Awards-Winning Best Practice Success Story
Defining Quality and Efficiency Metrics in an HR SSC. July 24, 2013
 Defining Quality and Efficiency Metrics in an HR SSC July 24, 2013 Housekeeping This webinar is approved for 1.0 hours of recertification credit. You MUST attend for the entire 60 minutes to receive credit.
Service Level Agreement Policy. Table of Contents
 Table of Contents Service Level Agreement... 3 Definition of What a Service Level Agreement is... 3 Sample Service Level Agreement... 4 Assumptions... 4 Service Stakeholders... 5 Service Scope... 5 IT
IT Service Management Foundation based on ISO/IEC20000
 IT Service Management Foundation based on ISO/IEC20000 Number: EX0-115 Passing Score: 60 Time Limit: 90 min File Version: 4.0 http://www.gratisexam.com/ Exin EX0-115 IT Service Management Foundation based
IT HELP DESK RFQ SUPPLIER QUESTIONS AND COMMONWEALTH ANSWERS. Questions Submitted prior to the 4/4/12 Preproposal Conference
 Questions Submitted prior to the 4/4/12 Preproposal Conference 1. Based on your Service Level of a 10 minute or less average talk time, is there any additional process time required after the call is terminated?
Vendor: Peoplecert. Exam Code: CMS7. Exam Name: ITIL V3 Foundation. Version: Demo
 Vendor: Peoplecert Exam Code: CMS7 Exam Name: ITIL V3 Foundation Version: Demo Topic 1, Volume A QUESTION NO: 1 Which of the following is NOT an example of Self-Help capabilities? A. Requirement to always
CORROSION MANAGEMENT MATURITY MODEL
 CORROSION MANAGEMENT MATURITY MODEL CMMM Model Definition AUTHOR Jeff Varney Executive Director APQC Page 1 of 35 TABLE OF CONTENTS OVERVIEW... 5 I. INTRODUCTION... 6 1.1 The Need... 6 1.2 The Corrosion
COGENT REPORTS. Agile Experienced. Powerful. Accurate. In 2018 we are changing the rules!
 cogent-reports.com COGENT Agile Experienced Reliable Powerful Revolutionary Accurate Trusted Consultative REPORTS In 2018 we are changing the rules! Introducing new capabilities and offerings designed
Driving a Development Culture
 Driving a Development Culture Thank You for Joining Us!!! Today s Presenters Aisha Thomas-Petit Vice President, Human Resources, ADP Sandy Thomas Sr. Director, Global Talent & Development, ADP Agenda:
Introduction. Lost business hours. Change success rate. Infrastructure stability. Ticket volume trends. SLA compliance rate.
 CONTENTS 01 02 04 07 11 14 18 21 24 27 28 Introduction Lost business hours Change success rate Infrastructure stability Ticket volume trends First call resolution rate (FCRR) SLA compliance rate Cost per
Award for Escalation CSR Support:
 Call Center FCR Best Practice Award Contact Center FCR Best Practice AwardWinner Winner Award for Escalation CSR Support: Blue Shield Blue Cross of Massachusetts published 05-12-2016 Escalation CSR Support
Customer Care Services
 Customer Care Services Traditional Technology ISDN, ADSL, DNIS, PSTN, PBX, IVR, ACD, SBR, Predictive Dialer, CTI. Web-Based Technology - E-Mail, Live Chat, Co-Browsing, VoIP, Call-Back with Collaboration.
Not Your Mother s Call Center Using Context to Maximize Customer Experience and Operational Excellence
 Not Your Mother s Call Center Using Context to Maximize Customer Experience and Operational Excellence Tom Hanson Product Manager RightNow Contact Center Solutions RightNow Technologies, Inc. Call Centers