MULTIPURPOSE ROOM INTERIOR NOISE CONTROL FOR OWNERS AND FACILITY MANAGERS CLARE ELIZABETH SEIP. B.S., Kansas State University, 2007 A REPORT
|
|
|
- Helena Sparks
- 6 years ago
- Views:
Transcription
1 MULTIPURPOSE ROOM INTERIOR NOISE CONTROL FOR OWNERS AND FACILITY MANAGERS by CLARE ELIZABETH SEIP B.S., Kansas State University, 2007 A REPORT submitted in partial fulfillment of the requirements for the degree MASTER OF SCIENCE Department of Architectural Engineering and Construction Science College of Engineering KANSAS STATE UNIVERSITY Manhattan, Kansas 2007 Approved by: Major Professor Julia Keen
2 Abstract Throughout recent years, to minimize the cost of construction, a large number of multipurpose spaces have been built using lightweight, less expensive materials without considering or designing for noise control to mitigate any sound that is loud, unpleasant, unexpected, or undesired yet after construction is completed, noise issues are often evident within the space and, if severe enough, may render the intended function of the structure useless. To address this problem, this report is intended to introduce Owners and Facility Managers to some of the common solutions to resolve noise issues in multipurpose rooms. The report focuses on solutions for existing projects primarily, but it is also sensitive to budget constraints and the impact of renovation. Typical multipurpose rooms researched have a volume of 50, ,000 cubic feet and are expected to be used for speech activities, small music functions, and some physical sports activities. Therefore, this report will introduce the fundamentals of sound and room acoustics including interior surface materials and construction. Also included are typical noise issues from interior sources, solutions that can be taken within the building to attenuate noise, and the trade-offs associated with each solution.
3 Table of Contents List of Figures... v List of Tables... vii Dedication... ix CHAPTER 1 - Introduction... 1 CHAPTER 2 - Acoustic Fundamentals... 3 Section 2.1 Sound Properties... 3 Section 2.2 Room Acoustics Reflection Diffusion Absorption Porous Absorbers Panel Absorbers Resonant Absorbers Transmission Reverberation Time Calculating Reverberation Time CHAPTER 3 - The Characteristics and Sources of Noise Section 3.1 Noise Characteristics and Human Impacts Noise Criterion (NC) Curves Finding NC Room Criterion (RC) Curves Finding RC Consequences of Noise Section 3.2 Types of Noise Structure-borne Noise Footfall Structural Deflection Structural Member Noise Transfer iii
4 3.2.2 Airborne Noise Mechanical System Noise Electrical System Noise CHAPTER 4 - Sound Transmission and Isolation Section 4.1 Sound Transmission STC Rating Finding STC Construction Techniques and Methods Sound Insulation vs. Sound Absorption Doors and Windows Construction Types - Wall, Floor, and Ceiling Composition Calculating Transmission Loss Example Room Problem CHAPTER 5 - Noise Solutions Section 5.1 Room Acoustics Section 5.2 Structure-borne Noise Section 5.3 Airborne Noise Section 5.4 Mechanical System Noise Mechanical Equipment Noise Electrical System Noise CHAPTER 6 - Case Study Section 6.1 Facility Description Section 6.2 Noise Issues Section 6.3 Initial Room Analysis Section 6.4 Potential Noise Solutions and Trade-offs Section 6.5 Applied Noise Solutions Section 6.6 Final Room Analysis CHAPTER 7 - Conclusion References Appendix A - Absorption Coefficients for Common Materials Appendix B - STC and Transmission Loss for Common Materials Appendix C - Permissions iv
5 List of Figures Figure 2-1: Wavelength of Sound vs. Frequency (Modified from Mapp)... 5 Figure 2-2: Inverse Square Law (Nave)... 6 Figure 2-3: Reaction of Sound Striking a Partition... 7 Figure 2-4: Focused Reflections from Domed Ceiling... 8 Figure 2-5: Flutter Echo... 9 Figure 2-6: Typical Ceiling and Wall Diffuser Shapes Figure 2-7: Typical Absorption Characteristics of Porous Material (Mapp) Figure 2-8: Typical Absorption Characteristics of Panel Absorber (Modified from Mapp) Figure 2-9: Perforated Metal Decking (Olsen) Figure 2-10: Typical Absorption Characteristics of Helmholtz Resonator (Mapp) Figure 2-11: Reverberation Time by Room Type versus Volume (Mehta, Johnson, Rocafort, 218) Figure 2-12: Rectangle Room Figure 3-1: Standard NC Curves (Beranek) Figure 3-2: Multipurpose Room NC Curve Figure 3-3: Standard RC Curves (ASHRAE) Figure 3-4: Multipurpose Room RC Curve Figure 3-5: Shared Duct Noise Transmission Figure 3-6: Correct and Incorrect Installation of Flexible Duct (Fry, 267) Figure 3-7: Diffuser Airflow Conditions (Fry, 267) Figure 4-1: Sound Transmission through Partitions Figure 4-2: Standard STC Curve Figure 4-3: Subjective Perception of STC Values (Mehta, Johnson, Rocafort, 116) Figure 4-4: STC Example: Roof/Ceiling System Figure 4-5: Calculating STC Example Figure 4-6: Mass Law (Modified from Mapp) v
6 Figure 4-7: ASTM Standard E 795 Mounting Conditions (Mehta, Johnson, Rocafort, 81) Figure 4-8: Approximate STC Values for Masonry Wall Constructions (Mehta, Johnson, Rocafort, 123) Figure 4-9: Typical Staggered Stud and Double Stud Wall Assemblies (Mehta, Johnson, Rocafort, 127) Figure 4-10: Source and Receiving Rooms Figure 5-1: Variable Absorption Examples (Mehta, Johnson, Rocafort, 295) Figure 5-2: Sound Control Components for Floor System ( 70 Figure 5-3: Typical Isolation Hanger Figure 5-4: Middle and Exterior Located Door Drop Closures (Mehta, Johnson, Rocafort, 139) Figure 5-5: Door Drop Hinges (Mehta, Johnson, Rocafort, 139) Figure 5-6: Types of Vibration Isolators (Long, 393) Figure 5-7: Flexible Pipe Fittings Figure 5-8: Mechanical Duct Elbows (Fry, 270) Figure 5-9: Duct Lagging and Lining Figure 5-10: Duct Silencers (Cavanaugh, Wilkes, 72) Figure 6-1: Multipurpose Room Floor Plan Figure 6-2: Multipurpose Room North Figure 6-3: Multipurpose Room Southeast Corner Figure 6-4: Multipurpose Room Suspended Tectum Ceiling Panels Figure 6-5: Multipurpose Room with Added Absorption on North Wall Figure 6-6: Multipurpose Room East Wall with Additional Absorption Figure 6-7: Multipurpose Room Absorptive Seating vi
7 List of Tables Table 2-1: 2 Fiberglass Panel Absorption Coefficients Table 2-2: Air Attenuation Coefficient (Harris, 4.7) Table 2-3: Typical Reverberation Time Targets (Mapp) Table 2-4: Example A Total Room Absorption Using Reflective Materials Table 2-5: Example A Approximate Reverberation Time Table 2-6: Example B Total Room Absorption Using Absorptive Materials Table 2-7: Example B Approximate Reverberation Time Table 2-8: Example C Total Room Absorption with Seating Area Table 2-9: Example C Approximate Reverberation Time Table 3-1: Human Perception of Sound Level Changes (Coffeen) Table 3-2: Recommended NC Values for Unoccupied Spaces (Modified from Mehta, Johnson, Rocafort, 168) Table 3-3: Multipurpose Room Sound Pressure Level (SPL) Measurements Table 3-4: Recommended RC Values for Unoccupied Spaces (Modified from Mehta, Johnson, Rocafort, 168) Table 3-5: Multipurpose Room Sound Pressure Level (SPL) Measurements Table 4-1: Transmission Loss Values for Roof/Ceiling System Table 4-2: Frequency vs. Decibels below STC Curve Example Table 4-3: Transmission Loss Reduction by an Opening (Mehta, Johnson, Rocafort, 103) Table 4-4: Typical STC Values for Wood Stud Walls (Mehta, Johnson, Rocafort, 127) 61 Table 4-5: STC and IIC Ratings for Common Floor/Ceiling Assemblies (Modified from Harris, 6.4) Table 5-1: Approximate Installed Cost for Typical Acoustical Treatments (Olsen) Table 6-1: Approximate Room Absorption for Multipurpose Room Case Study Table 6-2: Approximate Reverberation Time for Multipurpose Room Case Study Table 6-3: Initial Field-Measured Reverberation Time for Multipurpose Room vii
8 Table 6-4: Summary of Noise Problems and Potential Solutions Table 6-5: Approximate Room Absorption for New Conditions Table 6-6: Approximate Reverberation Time for New Conditions Table 6-7: Final Field-Measured Reverberation Time for Multipurpose Room Table 6-8: Summary of Reverberation Time - Before and After Table A-1: Absorption Coefficients of Common Materials Table B-1: Transmission Loss and STC Values for Common Materials viii
9 Dedication This report is dedicated in loving memory to my Grandmas Donna Seip and Dorothy Wood. Through these great women, I have seen the strength and perseverance that has helped me through different situations. I know that they would have been very proud to see this report completed. ix
10 CHAPTER 1 - Introduction This report is aimed at Owners and Facility Managers who are having noise control problems within a multipurpose room. The information in this report is significant because many multipurpose spaces exist that cannot be used to their fullest potential due to bothersome noise. In recent years, to minimize the cost of construction, a large number of spaces have been built with lightweight, less expensive materials without initial consideration or design for noise control. Consequently, after construction is completed, noise issues are often evident within the space and, if severe enough, may render the intended function useless. This report primarily discusses solutions for existing projects to correct noise problems while being sensitive to budget constraints and the impact of renovation. Some solutions pertaining to new construction projects are also mentioned. Multipurpose rooms offer unique acoustic challenges because owners often use these spaces for activities with differing acoustical requirements. For example, the same space used for athletic and sporting events may also be used for musical performances and speeches. The multipurpose rooms within the scope of this report have a volume of 50, ,000 cubic feet and are expected to be used for speech activities, small music functions, and some physical sports activities. Two examples of this type of space include a school gymnasium that is also used as the school auditorium and cafeteria, and a church sanctuary that is also used for worship services, sermons, and youth activities and therefore often referred to by acousticians as a sanctanasium. This report covers the fundamentals of sound and room acoustics as well as typical noise issues and solutions. The final chapter illustrates these concepts by analyzing a case study. For an Owner or Facility Manager who is relatively unfamiliar with the properties of sound and noise, the report should be read starting from Chapter 2 and continued through to the end. If an Owner or Facility Manager is familiar with how sound reacts in a space and the type of noise that is being experienced in the designated multipurpose room, the reader can skip to Chapter 5 for solutions to typical multipurpose room noise problems. To clarify, this report only covers noises from interior sources and solution methods involving changes within the building. Another method of interior noise 1
11 control, active noise control, utilizing electronic circuiting to provide a sound system that masks and cancels out noise will not be covered by this report because it is not typically used in multipurpose room applications. Also, exterior noise control from vehicular traffic and roadways is not covered within the scope of the report due to the irregularity of such noise sources that this report is unable to account for. 2
12 CHAPTER 2 - Acoustic Fundamentals What is sound and why is it important? This chapter will discuss this question by reviewing the fundamentals of sound and its properties, as well as introduce some basic room acoustics principles for noise control. Section 2.1 Sound Properties Sound is created by pressure fluctuations caused by the motion of a source through a medium that is typically air, although the medium can be any gas, liquid, or solid. Listeners perceive sound because pressure fluctuations vibrate the ear drum and cause electronic impulses to be sent to the brain, which are in turn interpreted as sound (Mehta, Johnson, Rocafort, 1). These sound waves have specific characteristics referred to as frequency and wavelength. Frequency is measured in Hertz (Hz) which is the number of complete cycles of motion in one second of time. The frequency range of audible sound that the human ear can hear is 20 to 20,000 Hz. This range is difficult to use to express individual sounds because most sounds created within a space are composed of multiple frequencies. Sound is classified, therefore, into frequency bands called octaves which are identified by their center frequency to make using and understanding all of the frequencies easier. An octave is the doubling of a frequency and is easy for the human ear to distinguish. For example, doubling 250 Hz results in the 500 Hz octave band. Doubling 500 Hz results in the octave band of 1000 Hz. The octave band frequencies most commonly used for room acoustics purposes are 125, 250, 500, 1000, 2000, 4000, 8000, and 16,000 Hz (Coffeen). To evaluate the room acoustics of a space, these octave frequency bands are used to evaluate building materials for their acoustical properties and other characteristics. This is because through testing of the materials, researchers found that materials respond differently in each octave band. Material characteristics are discussed further in Section 2.2. To make a larger, general classification when dealing with room acoustics, the frequencies are organized into ranges that are commonly referenced in three categories: low, medium, and high frequencies. Low frequency sounds are below 200 Hz, mid- 3
13 frequency sounds range between 200 and 2000 Hz, and high frequency sounds are above 2000 Hz. The wavelength of the sound wave measures the distance of travel of the wave motion. To calculate wavelength represented by the symbol λ, Equation 2-1 can be used where f is the frequency of the sound and c is the speed of sound in air (Long, 38). Equation 2-1 λ = c f Equation 2-2 should be used to determine the effect on the speed of sound, c, because the speed of sound is variable based on space temperature (Mapp, 7). Equation 2-2 c = F For example, with a temperature of 65 F the speed of sound can be adjusted to: c = = 1122 ft / sec. Acousticians will typically approximate the speed of sound to be 1000 ft/sec to allow for simpler calculations in the field without a calculator (Coffeen). Wavelength is an important characteristic to consider in room acoustics because it explains the sound wave behavior as it reacts to the space in which it is contained. For example, if an object depth is shorter than the wavelength of the sound, the sound will flow around the object as if it were not there (Long, 51). Characteristically, wavelengths are longer at lower frequencies and shorter at higher frequencies and Figure 2-1 illustrates this relationship. Sound is measured as the amount of pressure per unit of surface area. The primary unit is the Pascal, an SI unit of pressure thus the Pascal is the pressure generated by one Newton of force over one square meter of surface area, which is equivalent to approximately 14.5 x 10⁻⁵ psi (pounds per square inch). The range of sound intensities is broad ranging from Pascals at the threshold of hearing to 100,000 Pascals, therefore defining the amount of pressure in terms of a level makes it is easier to express and understand the value achieved. The decibel (db) is utilized as the unit for these levels and is a logarithmic representation of the sound intensity. With decibels for measuring sound, the threshold of hearing equates to zero and is much easier to utilize in acoustical calculations when more than one sound in present within a space (Coffeen). 4
14 Figure 2-1: Wavelength of Sound vs. Frequency (Modified from Mapp) Sound pressure levels (SPL) can not be added together because of the logarithmic nature of the equation. Instead, Equation 2-3 should be used to determine the change in sound pressure level (Coffeen). In this equation, L 1 is the higher sound level and L 2 is the other sound level in the space. The SPL change (ΔdB) will be the amount that is added to the higher sound level, L 1, to find the resultant sound level in the space. Equation 2-3 Δ db = 10 log( L L 1 2 ) The following is an example of how to determine the sound pressure level when two sound sources are being produced in a space. Each sound is individually measured; for example, one is 10 db, the other is 15 db. It is common to incorrectly assume that the sound level within the room is now 25 db attained by simply adding the two values together. Instead, the correct method of determining the SPL when the sources are combined is determined using Equation 2-3, which shows that the change in sound level is actually: ΔdB = 10log(15/10) = 1.8 db 2 db 5


15 The difference in sound level can be rounded off to 2 db since it is difficult to measure fractions of decibels. The difference is then added to the highest sound level in the space. The final resultant sound level therefore becomes 15 db + 2 db = 17 db. If more than two sounds are being generated at a time, a similar procedure is followed by evaluating two sounds at a time and using the resultant sound level from those two to help determine the next sound level. This procedure is repeated until all sounds have been accounted for. Along with the change in sound pressure levels due to the addition of another sound source, the distance from a sound source to a listener will also affect the sound pressure level the listener perceives (Coffeen). Here, another common misconception is that doubling the distance away from a sound source will cause the level to drop in half. Instead, Equation 2-4 below should be used to determine the sound level change at a distance from the sound source. A standard measurement is that for every doubling of the distance away from a sound source, the sound pressure level will drop 6 db. This comes from the mathematical Inverse Square Law, which is illustrated in Figure 2-2. This result can also be seen using Equation 2-4 and the following example. A sound source is heard at a distance of 10 feet. At 20 feet from the source, the sound is replayed. The change in sound level due to the change in distance equals: 10 log (20/10) 2 = 6 db change. The resulting sound level is 6 db lower than the original level heard which is to be expected from the Inverse Square Law (Nave). Equation 2-4 Δ db = 10log( d d 2 2 1) Figure 2-2: Inverse Square Law (Nave) Used with permission by Rod Nave, Georgia State University, 6
16 Now that the sound level of the space has been determined, the room must be examined to determine the spatial response to the sound. This includes determining reflection, diffusion, absorption, and transmission characteristics of all the surfaces affected by the sound waves. These characteristics are discussed in the following section. Section 2.2 Room Acoustics Sound waves are constantly moving in many directions and interacting with many planes of a space and objects that are in their path. Therefore, the type of material used in a space will influence the reaction of the sound wave due to impact. As shown in Figure 2-3, when a sound wave strikes a material such as a partition, a portion of the energy will be absorbed, a portion will transmit through the material to the other side, and the final portion will be reflected back into the space. The amount of sound that reacts in each of the three ways will be determined by the composition of the material. Figure 2-3: Reaction of Sound Striking a Partition This section discusses each of these characteristics: reflection, absorption, and transmission. Section expands on how these characteristics affect the spatial response of a room by changing the reverberation time. Chapter 3 discusses the details on specific materials and construction techniques as they apply to achieving the desired room response and noise attenuation. 7
17 2.2.1 Reflection Reflecting surfaces do as the name implies; they reflect sound waves away from the surface toward another location in the space, which can be a single listener, audience, or another acoustic surface. Reflective materials are hard surfaces such as plaster, gypsum board, brick, concrete, CMU block, metal, and so forth. In certain situations, reflecting surfaces are needed to direct sound waves in a desired direction that will, in turn, absorb or diffuse the sound waves (D Antonio, 109). If not properly positioned, reflective surfaces can magnify the sound level and create noisy spaces that are difficult to use. The shape of a space is an important consideration because it will affect the direction of the reflections. For example, a domed ceiling or wall can create focused reflections in a space, also known as a hot spot as illustrated in Figure 2-4, where the sound pressure level will be greatly increased in one area compared to neighboring areas. Figure 2-4: Focused Reflections from Domed Ceiling Just as hot spots can be created by a concentration of sound waves, dead spots are a created when there is a lack of sound as a result of uneven dispersion of sound waves by a reflective surface or barrier (Mehta, Johnson, Rocafort, 41). Surfaces that obstruct a sound wave path, such as a partial height wall or extended balcony, can create an acoustical shadow. Acoustical shadows, also referred to as dead spots, are desirable in some types of spaces, such as an office building, to create a sense of privacy for the occupants. However, in multipurpose rooms, the effect is typically undesirable because 8
18 of resulting poor hearing conditions. Thus, if an acoustical shadow is present, some reflective surfaces may be necessary to promote a wider distribution of sound in the space. Additionally, spaces with a surplus of reflective surfaces can become a noise problem. By promoting the continuation of the sound waves, multiple reflections will extend the amount of time before a sound becomes quieted, called the reverberation time. If the time is too long, speech will become difficult to understand and music will be difficult to hear due to the echoes. This is a common problem in spaces with parallel walls that both comprise hard, reflective materials. Sound reflection between the walls will create flutter echo, caused by multiple long reflections between parallel planes, illustrated in Figure 2-5. Figure 2-5: Flutter Echo The flutter echo will create a longer reverberation time because of the delay in receiving the original sound. Thus, speech will become more difficult to comprehend because the listener will hear repeated syllables from many locations as the echo reflects around the room. The flutter echo will also make the ambient sound level in the room seem louder due to prolonged sound from the reflections (Mehta, Johnson, Rocafort, 59). A detailed discussion of reverberation time and examples of how it is calculated are in Section
19 The section also provides the recommended reverberation times for different types of spaces including multipurpose rooms. An ideal acoustical design of a multipurpose room will promote reflections of natural sound, which is sound directly from the source, toward a desired location, such as a lecturer or occupants, while eliminating the opportunity for flutter echo and long reflections (Olsen). When these types of reflections do not exist, the room will better contain a sound field that is diffuse throughout the space Diffusion A diffuse field is one in which there is an equal energy density at all points within the space (Long, 298). The benefits of having a space with a diffuse sound field include allowing the listener to feel surrounded by sound, making the room seem lively, and aiding in the transmission of sound from the source to the listener. To create a diffuse sound field, materials such as diffusive shapes and absorptive materials must be used in balance to promote natural sound reflections while avoiding flutter echo. A diffusive shape, examples illustrated in Figure 2-6, is composed of reflective materials and is shaped using various angles to allow for a scattering of the incident sound waves. The shapes can be many different sizes and shapes such as cylinder, domes, rectangles, and pyramids. Multiple shapes with varying angles can be placed together to create a larger multi-dimensional surface for sound to scatter. An entire wall can also act as a diffuser when it is shaped with different geometries in comparison with other walls. Different shapes and geometries will have varying diffusion characteristics; however, concern about precise placement and shape to use is not as primary a concern in a multipurpose room as it is in a theater or auditorium. Figure 2-6: Typical Ceiling and Wall Diffuser Shapes 10
20 Theoretical sound calculations are made under the assumption that a room is totally diffuse. Although this is the objective of ideal design, it is not often the case in the field due to several factors that are difficult to account for including construction and installation, and exact sound source locations. Consequently, hot spots, dead spots, or flutter echo occur in a room, diffuse surfaces may be required to promote continuous and equal sound distribution. Diffusion is not a value that can be directly measured; however, some manufacturers of diffusing surface materials will list a diffusing coefficient to give a general idea of the diffusion characteristics for comparison to other diffusers (Coffeen). The importance of diffusion within a room will vary depending on the primary function of the space. For instance, spaces used for music, diffusion is useful for creating a lively environment that serves to enhance the music and quality of sound within a space. Diffusers are also helpful in assuring all listeners are able to hear clearly at all room locations (D Antonio, 110). For spaces used for speech, humans benefit from seeing the source as well as hearing it, and having sound from all directions such as that in a diffuse environment can detract from this directivity of sound. Therefore, diffusion becomes less important due to the greater need for source localization, which is being able to identify the direction of sound coming from the source (Mehta, Johnson, Rocafort, 49). For multipurpose rooms this can become a balancing act because the space may be used for both speech and music. Typically the room will be designed more ideally for the dominant use of the space whether that is music or speech (Mehta, Johnson, Rocafort, 294). The shape, amount, orientation and placement of diffusers required should be determined by an acoustical consultant or manufacturer during the design process of a new construction project or for a renovation project, after the space is evaluated to establish the current room response Absorption Besides reflection and diffusion surfaces within a space, absorptive surfaces can be a large factor in the performance of a space. This is because materials that are absorptive in nature can help reduce long reflections and echoes to decrease the room reverberation time. Specifically, absorptive materials transform sound energy into small amounts heat, which is absorbed by the material. Care must be taken to ensure the sound balance of a room because certain materials only absorb sounds at particular frequencies. 11
21 This effect is termed coloration (Long, 588). An emphasis of certain frequencies over others will cause the room to sound unbalanced. A material that has a greater thickness and mass such as that of a wall or partition will result in an increased reduction of sound at lower frequencies because low frequency sound has a longer wavelength, while the internal material composition within the wall will reduce higher frequency sound because of its ability to absorb shorter wavelengths (Olsen). The absorption coefficient (α) is the unit used to evaluate the effectiveness of an individual sound absorbing material. It is a ratio of the amount of sound energy absorbed compared to the total amount of sound that comes in contact with the material (Mehta, Johnson, Rocafort, 61). The resulting absorption coefficient value is a unit-less number between , where a value of 0.00 indicates no absorption, and a value of 1.00 indicates that all incident sound is being absorbed. The total absorption of a space, represented by A, is calculated using Equation 2-5 by multiplying the absorption coefficient by the area of the material in square feet. Absorption is measure in sabins (Mehta, 63). Equation 2-5 A = α AREA The result quantifies the value as the absorption per unit area. For example, if 100% of the sound is absorbed in one square foot area, the amount absorbed would be one Sabin. Most materials will have an absorption coefficient of less than 1.00 because some amount will be reflected back to the space. An object will also have various absorbing coefficients for each frequency band. Included in Appendix A of this report is a table of absorption characteristics for common materials based on the corresponding frequency. Absorptive materials are also listed by manufacturers using a noise reduction coefficient (NRC) which is the average absorption coefficient over 250, 500, 1000, and 2000 Hz frequencies (Mehta, 62). The NRC value can be used to evaluate the approximate absorption response to perform a basic analysis of the space. The NRC is not always the best description of a material because it generalizes the material response to include only the average of the mid-frequency bands and ignores any major irregularities that may occur within an individual frequency band (Coffeen). For example, 12
22 a 2 fiberglass absorbing panel has the following absorption coefficients as listed in Table 2-1 related to the corresponding frequencies (Long, 258): Table 2-1: 2 Fiberglass Panel Absorption Coefficients 125 Hz 250 Hz 500 Hz 1000 Hz 2000 Hz 4000 Hz The average of the 250, 500, 1000, and 2000 Hz values results in an NRC = This value describes the average absorbing characteristics of that material and approximates that 84% of the sound will be absorbed, which is a good NRC for a porous absorber. Unfortunately, this value does not indicate at what frequency range the material will best or least absorb, which is the information needed for a complete design of the space. In this example, the material s absorption starts to drop in the higher and lower frequencies, and the 84% absorption will occur primarily between 250 and 1000 Hz. Just by examining the NRC value given by a manufacturer, a designer may not anticipate this drop-off within the low and high frequency bands; therefore, absorption characteristics at all frequency bands should be considered for a detailed analysis (Coffeen). The NRC value is useful information when designing spaces where speech will be the primary function because speech primarily occurs in the mid-frequency bands. Thus, the NRC value can be an effective and time-efficient value to use when making a material selection (Mehta, Johnson, Rocafort, 62). Most sound energy related to speech falls within the octave bands of 250 to 2000 Hz; therefore, the 2 Fiberglass Panel would be a good selection because the primary absorption occurs in this range. Thus far this section has explained what absorption is and how it is calculated. The following sub-sections discusses the different types of materials used as absorbers. Absorptive materials can be classified into three categories: porous, panel, and resonant absorbers. The following sections will describe each absorber type including how it absorbs sound, material identification, and common building applications Porous Absorbers Porous absorbers are often fibrous. The composition is effective due to many small holes or spaces that allow air and sound energy to pass through. This category of 13
23 absorber comprises many types of substances including fiberglass, fiberboard, pressed wood shavings, cotton, felt, foam, and carpet, and they are the most common type of absorber found in buildings. Porous absorbers work under the principle that forward motion loses momentum due to friction loss when the sound wave passes between the fibers or particles. Thus, the porous absorber will work to attenuate mostly high frequency sound. Even though porous absorbers can reduce some low frequency sounds, they are generally considered less effective in this range due to their lack of mass, which is the primary means of lowfrequency absorption. The friction loss between the sound and the absorber accounts for most of the high frequency losses through the material. As the sound wave passes through the absorber, it causes the air within the spaces of the absorber to vibrate thereby converting the sound energy into heat, which the fibers can absorb and dissipate causing some low frequency absorption (Long, 261). Next, absorption effectiveness of the material depends on the thickness. A thicker material will have a higher absorption coefficient and absorb longer wavelengths at lower frequencies (Long, 268). This concept is illustrated in Figure 2-7 displaying typical absorption characteristics for different thicknesses of material although it is important to note that different material composition will affect the specific characteristics of the absorber. The figure shows that the 1 thick material will have an absorption coefficient in the low frequency range of approximately 0.1. As the material increases in thickness, the absorption coefficient increases in the low frequency range. The figure also shows that the high frequencies are minimally affected by the change in thickness. Porous absorbers can be placed in a variety of shapes and styles to fit into all types of spaces. In multipurpose rooms there are several common types of absorbers: Fabric Covered Wall Panels Lay-in Acoustical Ceiling Tile Ceiling Suspended Baffles Acoustical Plaster Rigid Fiberboard Carpet 14
 Acoustical ceiling tile is available with various levels of absorption depending on the needs of the space.")
24 Fabric covered wall panels are a typical product used because they can be mounted easily to existing walls, and the fabric is available in a variety of colors and patterns that easily blend into many spaces. Figure 2-7: Typical Absorption Characteristics of Porous Material (Mapp) Acoustical ceiling tile is available with various levels of absorption depending on the needs of the space. The texture of the tile can be adjusted based on the desired appearance as well as the color of the tile. In rooms with high ceilings or where structural or mechanical systems do not allow for a lay-in acoustical ceiling, ceiling suspended baffles can be used. The baffles are beneficial in spaces with high ceilings because they can be suspended to bring the absorption closer to the source. The closer the absorption is to the source, the faster it will begin absorbing sound energy which will cause the reverberation time of the space to decrease. Acoustical plaster is a partition assembly comprising fiberglass boards that are covered with coats of a plaster made from materials such as cotton that allow sound to penetrate and be absorbed. The plaster can be applied to walls and ceilings to provide the absorption needed while keeping the look of a standard gypsum board wall. This is a good material to use where mounting additional materials to the walls or ceiling is not an option, such as for curved or irregularly shaped surfaces in the space (Mehta, Johnson, Rocafort, 83). Examples of manufacturers that produce acoustical plaster include Fellert, Baswaphon, USG, and International Cellulose 15
25 Corporation. For multipurpose rooms where a stronger, more durable material is needed, rigid fiberboard such as Tectum can provide high absorption. This is ideal for gymnasium spaces where impacts from sports balls are likely (Mehta, Johnson, Rocafort, 71). Finally, carpet is a commonly used flooring material because it is cost effective and provides absorption close to the occupants. Air will provide some sound attenuation in a space similar to that of a porous absorber. However, this will only be a significant factor at frequencies of 2000 Hz and higher because air can only dampen short wavelengths, but it is important to include in the reverberation time calculation since it will make an impact within large volume spaces. The amount of attenuation due to air is calculated using a different equation than for total absorption. Equation 2-6 is used in the calculation where m is the air attenuation coefficient as shown in Table 2-2 and V is the volume of the room in cubic feet. Equation 2-6 A air = mv Table 2-2: Air Attenuation Coefficient (Harris, 4.7) Frequency (Hz) ,000 Air Attenuation Coefficient (m) Panel Absorbers Panel absorbers are non-porous lightweight sheets made of metal that can be either solid or perforated. They are installed with an air cavity behind them to act as an absorber that will react to sound waves and vibrate the panel. The vibrations are not noticeable to the human eye because they are very small and move with the motion of the sound wave. This conversion of sound energy to motion will attenuate the sound energy within the space. The typical absorption characteristics of a panel absorber corresponding to the depth of the airspace are shown in Figure 2-8. A panel absorber is rarely used on its own. More commonly the panel is used with a porous absorber fill in the airspace, such as fiberglass batt insulation. This fill material will act to dampen the sound energy and will improve the sound attenuation in the higher frequencies, while the panel is most effective attenuating at lower frequencies due to the metal having a higher mass than the porous absorber. Combining the porous absorber within the cavity creates an absorber that works over a broadband frequency range 16
26 helping ensure a balanced reduction in sound levels over all frequencies. The effectiveness of these absorbers depends on the mass of the panel, the depth of the air space behind it, and the type of material inserted into the cavity. Figure 2-8: Typical Absorption Characteristics of Panel Absorber (Modified from Mapp) An example of a panel absorber commonly used in multipurpose room applications is perforated metal roof decking. This material is typically used in large volume spaces with exposed structure and where another type of acoustical ceiling cannot be used. Manufacturers list acoustical data for each type of deck including the absorption coefficients within each frequency band. The effectiveness of the decking depends on the thickness of the absorbing material and the location of the perforations in the metal. The most effective decking has the perforations located along the bottom of the cells rather than the sides as illustrated in Figure 2-9. If the perforations are located along the sides of the cells, likely, the sound reverberating in the space may never see those openings and will therefore not be absorbed (Coffeen). 17
27 Figure 2-9: Perforated Metal Decking (Olsen) Resonant Absorbers Resonant absorbers can be one of two types. The first are lightweight partitions that will vibrate at their mass-air-mass resonance. A mass-air-mass resonant system is one in which two free masses are separated by an air cavity that provides the spring force between them (Long, 278). The spring force is what allows the vibrations to oscillate the material and attenuate the sound energy. The effectiveness of these absorbers will depend on the mass of the partition although they are typically best at absorbing lower frequencies due to being thicker and more massive than a typical porous or panel absorber. For example, a typical interior stud wall acts as a resonant absorber where the gypsum board on each side acts as a free mass separated by the air space between studs. The induced motion of the air within the resonator as the entire body vibrates will absorb sound by changing sound energy into motion and heat. The thickness of the stud wall will typically be 4-6 inches and will work better at absorbing lower frequencies than a wall mounted porous absorber that may only be 1-2 inches thick. The second type of resonant absorber is a Helmholtz resonator, which is a concrete masonry block with an enclosed body of air connected by a narrow passage, called the neck, to the main space. When sound waves interact with the absorber it causes the air in the neck to vibrate, and the larger volume of air in the block acts as a damper 18
28 for the sound energy (Mehta, Johnson, Rocafort, 76). Figure 2-10 shows an example Helmholtz resonator and its typical absorption characteristics. The figure also demonstrates the characteristic that these resonators absorb effectively within a particular frequency band, specifically the low-frequencies, because of their natural mass. A Helmholtz resonator is most effective absorbing sound at the block s resonant frequency which is the natural frequency of the material. The resonant frequency of the block will change based on the volume of the main body, the volume of the neck, and the crosssectional area of the neck (Mehta, Johnson, Rocafort, 77). Figure 2-10: Typical Absorption Characteristics of Helmholtz Resonator (Mapp) An advantage to using a Helmholtz Resonator is that a room can be tuned precisely for the frequency response desired by installing blocks with the particular resonant frequencies that are undesired. This can be accomplished by changing the shape and size of the neck opening. Helmholtz resonators are especially useful when a long reverberation is being experienced at a single frequency. Then, installing a matching 19
29 resonator can reduce that frequency reverberation without impacting the average room reverberation. Installing these types of absorbers in a renovation or retrofit situation will be costly and require space and therefore may not be the most appropriate choice. Nevertheless, resonant absorbers are a good choice in new construction because they can be integrated into the structural system and architectural floor plan and designed in advance for the anticipated sound characteristics of the space Transmission Transmitting materials allow sound energy to pass through without reflecting, diffusing, or absorbing the sound. These materials can be useful as screens to protect acoustical items such as acoustical panels or loudspeakers from wear and also to improve aesthetics without altering the sound passing through it. For example, when determining the location for a loudspeaker cluster in a multipurpose room, an owner may decide that for aesthetic reasons he or she does not wish to not see the loudspeakers in the space. As a result the loudspeakers are recessed in a ceiling cove and the area of the ceiling in front of the speakers is covered with a fabric to allow the sound to pass through unimpeded. A transmitting material can be a cloth fabric, perforated metal, or wood. For this purpose, any products are available with different hole shapes and sizes. The size of the holes is referenced as the openness of a material. The openness is what allows the material to be more invisible to the sound energy. The goal of a material used for transmission is to be as open as possible while still being able to protect or hide the acoustical components behind it (Mehta, Johnson, Rocafort, 44). If the holes are too large, the material will be invisible to the sound passing through, but it may not provide the needed coverage. If the holes are too small they can become clogged with dirt or paint which will not allow all the sound to pass through the material. In this case, the material may act more like a panel absorber or reflector than a transmitting material. As a general rule, there must be at least 15-20% open area across the panel for the material to be completely transmitting, as if it were not there at all (Long, 269). 20
30 2.2.5 Reverberation Time Reverberation is the persistence of a sound in an enclosed space through multiple reflections of the sound waves. Reverberation time is the amount of time it takes for a tested sound to decay to a level of 60 db (RT60), the level that is perceived as inaudible. The desired reverberation time for a room depends on the volume of the space and the type of room use as shown in Figure Figure 2-11: Reverberation Time by Room Type versus Volume (Mehta, Johnson, Rocafort, 218) Rooms that will be used for music are designed for a longer reverberation time, between 1.5 and 3.5 seconds. This will make the room lively enough for music to sound its best to a listener. Rooms used for speech such as classrooms or lecture halls require a lower reverberation time of 1.2 seconds or less (Olsen). This will ensure proper speech intelligibility because when reverberation times are greater than this value, speakers will begin to hear themselves in echoes which can be distracting. Also, listeners will begin to find it difficult to distinguish between the source and the reflections. Speech intelligibility tends to be a major complaint in noisy spaces and is further discussed in Section 3.1. For multipurpose rooms, which may be used for both speech and music, the ideal reverberation time is between 1.0 and 1.5 seconds (Mapp, 48). This time may seem on the long end for speech, but considering the volume of a multipurpose room is likely to 21
31 be larger than a room such as a classroom, this time will be appropriate in maintaining suitable speech intelligibility. A maximum recommended reverberation time of 1.5 seconds also seems to be on the short end for music. However, the longer reverberation times for music apply to large volume spaces such as theaters and auditoriums. Since most multipurpose rooms will have a smaller volume, a 1.5 second reverberation time is sufficient (Olsen). Table 2-3 shows a summary of typical reverberation times based on the use of the space. Table 2-3: Typical Reverberation Time Targets (Mapp) Now that the ideal reverberation time for the space is understood, how is that value achieved? One basic equation for determining a room s reverberation time is the Sabine Equation named for Wallace Clement Sabine who discovered the equation while correcting a problem in the Fogg Art Museum lecture hall at Harvard College (Long, 300). Sabine measured the amount of time it took for the sound level to drop below 60 db for varying amounts of absorptive material placed in the space. Sabine used 60 db because that was the level at which his test sound became inaudible with the existing ambient noise of the space (Mehta, Johnson, Rocafort, 213). Through the testing, he found that the more absorption was placed in the room, the more quickly the sound would 22
32 decay. The empirical formula he discovered, now known as the Sabine Equation, is shown in Equation 2-7 where RT 60 is the reverberation time in seconds, V is the volume of the space in cubic feet, and A is the total absorption in the room in sabins. Equation 2-7 RT 60 = ( V A) This equation will provide an approximation of the reverberation time; however, it assumes that the sound level in the space is completely diffuse and does not take into account any major architectural irregularities that might serve to create focused reflections. Nonetheless, for most multipurpose rooms the Sabine Equation is valid and does provide a value that is fairly accurate when later compared to field measurements (Mehta, Johnson, Rocafort, 214). The following section shows examples of calculated reverberation times using the Sabine Equation for a simple model space Calculating Reverberation Time In order to illustrate the concept of reverberation and how the calculation works in a space, three examples are shown: Examples A, B, and C. The space used for all three examples is a 60 x45 x15 room as depicted in Figure Figure 2-12: Rectangle Room For Example A, the walls and ceiling are composed of 1/2 Gypsum Board on 2x4 studs, and the floor material is wood. Reverberation time is calculated by determining the absorption coefficients of each surface, which are in Appendix A. The areas of each surface must also be determined. The absorption coefficient and area values 23
33 in Equation 2-7, are used to calculate the surface absorption of each material, A = αarea where α is the absorption coefficient, and it is multiplied by the area of the surface. The equation is employed for each surface material in the space and totaled as illustrated in Table 2-4 to determine the total absorption in the space. The total absorption also includes the attenuation due to air at 2000 Hz and 4000 Hz using Equation 2-6 introduced in Section : is the volume of the room in cubic feet. A air = mv where m is the air attenuation coefficient and V The values calculated for total surface absorption in each frequency band and the volume of the space are used with the Sabine Equation, RT ( V A) 60 =, to calculate the reverberation time (RT60). For example, in Table 2-4 at 1000 Hz the total surface absorption was sabins. The RT60 for this frequency using Equation 2-7 is: 3 RT 60 = 0.049(40,500 ft 423) = 4.7 sec Table 2-5 lists the reverberation times calculated for each frequency band as well as the average over the mid-range frequencies (MID). The MID value is calculated using the average absorbing coefficient over 500 and 1000 Hz for the material multiplied by the area. Each material is totaled similar to the other frequencies and the reverberation time is calculated from Equation 2-7. In Example A, the MID absorption for the gypsum board is 0.045, but is rounded off to 0.05 as seen in Table 2-4. Multiplying this value by the area of the material will give the MID surface absorption for the gypsum board. Totaling this column and using the Sabine Equation, the MID is calculated to be 4 seconds, shown in Table 2-5. MID values are a good approximate to use for estimating the overall reverberation time of the space because the mid-frequencies are where speech intelligibility is most affected (Coffeen). In this case, a 4 second reverberation time exceeds the recommended range of seconds as discussed in Section Therefore, the space is very reverberant and speech will be extremely unintelligible. 24


34 Table 2-4: Example A Total Room Absorption Using Reflective Materials Table 2-5: Example A Approximate Reverberation Time In order to reinforce the impact of material selection on a space s acoustical characteristics, this example is recalculated using materials that are more absorptive. Example B includes changing the ceiling treatment to a standard 5/8 mineral fiber lay-in tile and the floor to carpet on concrete while maintaining the 1/2 gypsum board walls. Table 2-6 shows that the lay-in ceiling tile and carpet have higher absorption coefficients and will provide higher levels of surface absorption. Table 2-7 shows the approximate reverberation time calculated for the space over each frequency band and MID, whose value is now calculated to be 0.7 seconds. This reverberation time is more appropriate for a speech setting; however, if used for music, the room may not feel lively enough. Therefore, a solution is needed that will satisfy both needs such as reducing the amount of absorption within the space which will cause the reverberation time to increase. The Sabine Equation can be adjusted until the desired reverberation time is achieved. Table 2-6: Example B Total Room Absorption Using Absorptive Materials 25

35 Table 2-7: Example B Approximate Reverberation Time When determining the total absorption of a space, the calculation must also include the number of occupants within a space due to the body s ability to absorb sound waves. Furthermore, any seating in the room will also aid in sound absorption and should be added into the equation. For Example C, the surface materials will be those used in Example A, but now upholstered chairs that are unoccupied will be added as represented in Table 2-8. Upholstered chairs are used because the padding will be more absorptive in order to resemble a person; the chairs also allow the room to maintain a constant reverberation time regardless of the number of occupants present. Accounting for the amount of chairs in the calculation will result in a more conservative answer as opposed to estimating the number of occupants because this value may not be known or may change at different events. The calculation could also be made for different types of seating, and common absorption coefficients for each type are listed in Appendix A. As a result for Example C, the MID reverberation time is approximately 1.4 seconds as indicated in Table 2-9. This renders a much more effective multipurpose room reverberation time than does Example A with the only change being the addition of padded seating. The reverberation time is long enough for music purposes and is also acceptable for speech intelligibility. Table 2-8: Example C Total Room Absorption with Seating Area Table 2-9: Example C Approximate Reverberation Time 26
36 CHAPTER 3 - The Characteristics and Sources of Noise In Chapter 2, the definition, characteristics, and properties of sound have been identified along with the basic components of room acoustics. Chapter 3 will focus on defining noise including how noise differs from sound as well as common sources and pathways for noise that are experienced in multipurpose rooms. Section 3.1 Noise Characteristics and Human Impacts Noise is defined as a sound that is loud, unpleasant, unexpected, or undesired (American Heritage Dictionary). Different people will perceive noise differently because determination of noise is a subjective judgment of a listener. This makes the design for noise control a difficult issue because even the most careful design may still create annoyances to some listeners while others have no objection. In all cases, regardless of who the listener is, noise is unwanted and will be affected by several factors (Long, 98): The level at which it is heard, or its perceived loudness The frequency range of the sound The duration and rate of recurrence of the sound The primary component of noise is how loud it is perceived to be. Loudness is a human perception of the magnitude of sound and is also a subjective value because it will differ depending on the listener (Long, 81). As a person listens to a noise, he or she can perceive the loudness of the sound as well as changes in decibel levels between multiple noises. Table 3-1 outlines the way people perceive these sound level changes. Table 3-1: Human Perception of Sound Level Changes (Coffeen) Change in Sound Level (db) Change in Perceived Loudness 1 Imperceptible 3 Perceptible 6 Clearly Noticeable 10 About Twice (or Half) as Loud 20 About Four Times (or One-Fourth) as Loud 27
37 For example, a person hears a noise that would be measured at 80 db and another noise that would be measured at 70 db. The person will be able to identify that the first noise was about twice as loud as the second noise since the difference in decibel levels was 10 db. Also related to the perceived loudness is the ability for the listener to understand the syllables of speech. When noise occurs in a space such as a multipurpose room it can interfere with the speech intelligibility of a speaker. Speech intelligibility is a direct measure of the fraction of words or sentences understood by a listener (Long, 93). Correspondingly, a measure was developed to rate the intelligibility of speech called the Speech Transmission Index (STI). Speech is modeled by a test signal that contains speech-like characteristics. The resulting values of STI range from zero, which equals totally unintelligible, to a complete intelligibility value of one. How much noise interferes with the intelligibility of the speech is dependent on the signal-to-noise ratio (SR), shown in Equation 3-1, which equals the source level (Ls) minus the noise level (Ln) measured in decibels (Long, 94). Equation 3-1 SR = Ls( db) Ln( db) This equation can result in a negative signal-to-noise ratio when the noise level exceeds the source level. For example, a space has a source-producing sound, such as a presenter, at 30 db and an interfering noise of 45 db generated by noise from an adjacent space. Here, the signal-to-noise ratio SR = = -15 db. The lower the signal-to-noise ratio, the less intelligible the speech will be (Long, 93) Noise is an annoyance to many people especially when it interferes with a person s work or ability to clearly receive information. Unfortunately, annoyance is not something that can be directly measured. Therefore, to come up with some way to determine what a majority of occupants would consider reasonable, the Noise Criterion (NC) curves were developed in These curves establish satisfactory noise levels for various indoor environments Noise Criterion (NC) Curves As a means to establish the noise level of a space and the general response to that level, the Noise Criterion (NC) Curves can be used. Figure 3-1, the standard NC curves 28
38 developed by Leo Beranek, shows all standard curves and the corresponding NC value associated with each individual curve. On the right side of the figure, the noise classifications are labeled corresponding to those curves. For example, NC-35 and NC-40 are classified as moderate whereas NC-65 and NC-70 are classified as extremely noisy. These values are based on what an average person would consider the level of noise to be. The NC value for the room of interest is established by plotting the sound pressure level that is measured at different room locations compared to their corresponding octave-band center frequencies. Given the points plotted to the standard curves shown in Figure 3-1, the graph shows the NC rating is the lowest standard curve not exceeded by the plotted points (Mehta, Johnson, Rocafort, 164). An example of the procedure for determining the NC value of a room is shown in Section Figure 3-1: Standard NC Curves (Beranek) Recommended NC values for design of different types of spaces have been established. Therefore, if a space sound pressure level is measured and it is determined that all or a portion of the values at specific frequencies are above the recommended NC 29
39 curve, the space will be considered noisy by the occupants. Table 3-2 shows the recommended NC levels and approximate db values that correspond to the type of space in an unoccupied condition. These are the standard values used to evaluate the noise level within a space. In the case of multipurpose rooms, a NC of would be ideal. Table 3-2: Recommended NC Values for Unoccupied Spaces (Modified from Mehta, Johnson, Rocafort, 168) Recommended NC value Appoximate db value Space Office Building: Open plan offices Private offices Lobbies Churches School: Classrooms Cafeterias Multipurpose Spaces Indoor Gymnasium Performing Arts Space: Auditoriums and theaters 25 max. 33 max. Music practice rooms 35 max. 43 max Finding NC A multipurpose room is measured, and the following values are the sound pressure levels corresponding to the measured frequency: Table 3-3: Multipurpose Room Sound Pressure Level (SPL) Measurements Frequency (Hz) SPL (db) Plotting these points on the NC curve, Figure 3-2 shows that the lowest curve not exceeded by any of the points is NC-35. Therefore, the NC value for the room would be 30
40 NC-35 which would be an appropriate value since it falls in the recommended range of Figure 3-2: Multipurpose Room NC Curve Room Criterion (RC) Curves In 1981, Room Criterion (RC) curves were developed by the American Society of Heating Refrigerating and Air Conditioning Engineers (ASHRAE) during a study of mechanical system noise within office environments. The standard RC curves, shown in Figure 3-3, were established to provide a more comprehensive evaluation of the noise within a room that the NC curves do not account for. The objective of the RC method is to meet the desired curve within ±2 db along all the frequencies (Fry, 83). 31
41 Figure 3-3: Standard RC Curves (ASHRAE) The RC system allows for the noise to be classified as neutral, rumbly, or hissy because rumbly and hissy environments, typically caused by the mechanical system, can create annoyance for the occupants even if the noise level falls within the recommended NC value for that type of space (Mehta, Johnson, Rocafort, 165). The procedure for determining the RC value for a space starts with measurements taken at different room locations compared to their octave-band center frequencies. The RC value of the environment is calculated to be the average of the sound level at the 500, 1000, and 2000 Hz range. Once this has been determined, a chart is used to plot this point starting at 1000 Hz and drawing a line with a 5 db slope. Two additional lines, which classify the environment as rumbly or hissy are now drawn. The rumbly line (R) is a line parallel but 5 db higher to the left of 500 Hz and the hissy line (H) is parallel but 3 db higher to the right of 1000 Hz. The neutral area lies in between these two. With all the points on the chart, the curve can be used to determine the noise environment. An example of this procedure is detailed in Section The final classification of the room environment 32
42 will be the region where any measured sound level values are higher than for that region (Mehta, Johnson, Rocafort, 166). Table 3-4 lists the recommended RC values and approximate db values that correspond to the type of space. Table 3-4: Recommended RC Values for Unoccupied Spaces (Modified from Mehta, Johnson, Rocafort, 168) Recommended RC Value Appoximate db value Space Office Building: Open plan offices Private offices Lobbies Churches School: Classrooms Cafeterias Multipurpose Spaces Indoor Gymnasium Performing Arts Space: Auditoriums and theaters 25 max. 33 max. Music practice rooms 35 max. 43 max. Prior to 1995, ASHRAE recommended either NC or RC curves for design purposes. However, in 1995, ASHRAE changed their recommendation to only the RC curves as the better means of noise assessment for the space (Mehta, Johnson, Rocafort, 165). Many acousticians, however, continue to use the NC curves as the primary tool for noise level evaluations. This is because NC curves have been in use for longer than RC curves and are therefore more widely understood by many people including designers, contractors, and owners. Also, for multipurpose rooms, NC levels are considered to be an acceptable means of evaluation by acousticians because of the difficulty in achieving precise RC values in the field (Olsen). 33
43 Finding RC This example reuses the data from the example in Section on page 30 to find the NC of a multipurpose room. When the room is measured, the following values in Table 3-5 are found to be the sound pressure levels corresponding to the measured frequency: Table 3-5: Multipurpose Room Sound Pressure Level (SPL) Measurements Frequency (Hz) SPL (db) Following the procedure explained in the prior section, the first step is to calculate the average sound level at the center frequencies. Using 500, 1000, and 2000 Hz frequencies, the average sound pressure level is equal to ( )/3 = 33 db. Therefore the multipurpose room has a value of RC-33. From the chart, a line with a 5 db slope can be drawn from 33 db and 1000 Hz. Now, the lines representing the rumbly (R) and hissy (H) regions can be plotted where R lays 5 db higher and left of 500 Hz, and H lays 3 db higher and right of 1000 Hz. Now plotting all SPL points on the RC curve, as shown in Figure 3-4, shows that two points exceed the hissy region of the curve. Therefore, the RC value for the room would be RC-33(H). This implies that the type of noise in the space will be hissy, but this can be mitigated. The RC-33 value would be an appropriate value for the multipurpose room since the ideal range is and the calculated RC value falls below this range. Since the calculated RC value does fall below the recommended range, the hissing will not be a problem in the space. The type of noise, whether it is hissy or rumbly becomes a larger concern when the calculated value exceeds the recommended levels. 34
44 Figure 3-4: Multipurpose Room RC Curve Aside from being an annoyance, noise within our environment has other consequences. These are significant problems including occupant health and productivity loss, which can result in a great deal of extra cost and liability for owners Consequences of Noise First, noise can adversely affect on a person s health. For this reason, noise can be a liability for an owner because high sound levels can cause hearing loss. As a result of this increased liability for owners, it is estimated that the total annual dollar sales of noise control measures has increased eightfold during the past decade in the U.S. (Harris, 1.3). In particular, occupants can develop problems such as increased stress level, higher blood pressure, and most commonly, develop permanent or temporary hearing damage if the noise exceeds NC-85 levels for eight hours a day or more. The noise can be continuous or intermittent; however, a continuous noise will cause the most 35
45 physical damage, where as an intermittent noise may simply create more irritation for the occupants. OSHA classifies unacceptable noise in a work environment as 90 db for eight hours a day. This is typically not an issue for a multipurpose room since the acceptable noise level will relate to the optimal NC level of 30-35, which corresponds to decibel levels of db as shown in Table 3-2. Sound levels higher than this will be considered noisy by the occupants, but would rarely occur. Second, noise can also affect worker productivity in cases where occupants spend most of their work time within a noisy environment. Naturally, lost productivity equals lost time, which directly affects profit. Overall, increased liability for an owner can lead to money spent on litigation in an amount greater than the cost of installing proper sound control in the space. The types of noise and their sources should therefore be understood so that potential noise problems can be avoided or controlled. This is the goal of the following Section 3.2, Types of Noise. Section 3.2 Types of Noise It is essential to understand the common types of noise before identifying the solutions to noise problems. Consequently, this section will identify many typical noise sources in multipurpose spaces and solutions to these noise problems will be thoroughly discussed in Chapter 5 on page 66. Noise fits into two categories: structure-borne noise, and airborne noise. Unfortunately, analysis is complicated by the fact that a source can produce noise that falls under both categories Structure-borne Noise Impacts to a structural element including walls, floors, and the roof result in vibrations that cause structure-borne noise. The structural element that is impacted will amplify the noise so that a small impact may result in a large noise. This amplification will depend on the ease with which the vibrations can be transferred along the structural path. Noise and vibration that occur along the structure have become a more prevalent issue in many buildings today because of the lightweight building materials, which allow a higher transmission of noise along them. This is because lightweight materials allow vibrations to transmit with greater ease and do not reduce as much low frequency sound 36
46 due to the lack of mass. The following subsections identify the types of structure-borne noise: footfall, structural deflection, and structural member noise transfer Footfall Footfall is created by the impact of a hard object, such as a heel of a shoe, when it strikes the surface of the floor. The noise is typically described as a higher pitched click sound. The level of noise that is perceived by the listener depends on the characteristics of the floor covering such as its material composition, thickness, and softness (Long, 417) Structural Deflection Structural systems are designed to deflect a certain degree under the weight of objects and people. Under excess weight, these deflections may become increased and their movement can cause sounds within a space. Unlike footfall, the sound produced will be described as a low frequency thumping (Long, ). Structural deflection is most prevalent in lightweight building structures such as wood-framed residential buildings because the lightweight members will deflect more easily. However, this noise source is not common in multipurpose rooms because the structural system is likely steel and/or concrete, which is has a higher mass and rigidity. This type of structure-borne noise, therefore, will not be discussed further Structural Member Noise Transfer A building structural system consists of joists, beams, studs, columns, and other members that are connected. Due to the support required, the members are typically connected in a rigid manner such as with bolts and welds for steel structures. These rigid connections provide pathways for sound energy to transfer (Long, 143). For example, the noise and vibrations of a floor in a remote area of the building can be transferred along the structural members and connections into more sound-sensitive areas. The noise and vibration transferred along structural members can be a source of great annoyance for occupants and can be a problem for sensitive equipment. Also, the mass and stiffness of the structure will contribute to the amount of sound that is allowed to transfer through the structural member. For example, a member that is stiffer and has more mass will not 37
47 allow vibrations to transfer as easily and will thereby act as a sound dampener (Mehta, Johnson, Rocafort, 144). In general, structural member noise is created by sources such as floor squeak and vibrations from mechanical systems. Floor squeak is a type of noise resulting from structural members. This is typically found in wood structures and is caused by misplaced or loose nails rubbing against wood framing members (Long, 447). This problem is usually created during the construction process when a nail is placed in a member in an incorrect position and is therefore not affixed to another member. During the natural deflections of the structure, those nails can move from their position and cause a high frequency squeaking noise (Long 418). The deflection is usually attributable to the transfer of weight such as an occupant walking along the structure. This noise source is not common in multipurpose rooms because the structural system is likely steel and/or concrete, and therefore nails will not be used. This type of structure-borne noise, therefore, will not be discussed further. Mechanical equipment is usually the prime source of structural noise in a multipurpose space. This is because equipment such as pumps and motors create vibrations that can be transmitted along structural members into surrounding spaces. A mechanical system also creates other pathways beyond the standard structural members for noise and vibrations to be transmitted. These structure-borne pathways include ductwork, piping, and anchors that support these materials and connect them to the structure. Ductwork and piping are designed as rigid and leak-free members to maintain efficiency. They must penetrate walls, floors, and ceilings along their path to reach the desired location and are typically sealed to maintain proper fire barriers, which results in a rigid connection to the structural member and a perfect pathway for vibrations and noise transfer (ASHRAE) Airborne Noise Along with noise created and transmitted by the structure, airborne noise can also be created by sources both within the space and from outside sources. The difference between structure-borne and airborne noise is the path from the source to the listener. Airborne noises reach the listener through the pathway of air as opposed to the structural pathways and vibrations discussed in Section on page 36. This section will define 38
48 the terminology that will be used in later sections and will discuss primary sources of noise that can occur through the air. Airborne noise can be generally classified into two categories: noise generated within the space and noise generated outside the space. Before a solution to a noise issue can be determined, the type of noise and source must first be determined. The source of the noise can usually be found easily when it is occurring within the space concerned. Unfortunately, noise sources generated in outside spaces may be more difficult to find because the pathways into the space can be complex (Mehta, Johnson, Rocafort, 159). Transmission paths can include voids in and around the structure, through the path created by ductwork, and through partitions such as walls, floors, and ceilings that create indirect sound paths known as flanking paths. Refer to Section 4.1 on page 46 for detailed discussion of sound transmission through partitions. The composition of the enclosure is the primary determinant of whether noise from adjacent spaces can be transmitted to the space in question. Doors and windows are typically the weakest section of the partition in regards to sound insulation capability (Mehta, Johnson, Rocafort, 105). Consequently, special consideration must be taken in their design and construction, which will be discussed in further detail in Chapter 4 beginning on page 46. Mechanical and electrical systems can also be a chief source of airborne noise. Noise can be created by nearly all pieces of equipment including fans, pumps, ductwork, generators, lights, and other components such as dampers and diffusers. The following Section will outline the primary sources of airborne noise attributable to the mechanical system, and Section will detail common sources attributable to the electrical system Mechanical System Noise Airborne mechanical system noise can be created two ways. First, the noise can be created actively, by the equipment itself. This refers to when the specific piece of equipment such as a fan or pump is the origin of the noise. Second, mechanical noise can be created passively by the components, which can produce flow-generated noise (Long, 457). For example, air flowing through ductwork at a high velocity can be a source of noise for a space. The ductwork itself may not be creating the noise, but rather the noise is a result of the force of air flow through the duct. This section will identify the types of 39
49 air-side heating, ventilating, and air-conditioning (HVAC) equipment that are common sources of noise in a building: Fans: Some type of fan can be found in almost all buildings to help circulate air. Fan noise is generated by several mechanisms, including the surge of the air pressure and velocity each time a blade passes, turbulent airflow in the air stream, and physical movement of the fan casing or enclosure (Long, 459). Turbulence in the air stream occurring at the inlet and outlet of the fan as well as a velocity change at the tip of the fan blades will increase the noise levels at the fan. This noise typically falls in the low frequency range between 16 and 250 Hz. If a fan is improperly sized and performing outside of its design conditions, noise levels can be greatly increased (ASHRAE, A47.2). Terminal Units: Terminal units include heat pumps, fan coil units, variable air volume (VAV) terminals, and fan powered mixing (FPM) terminals. VAV and FPM terminals are becoming commonplace in many buildings to allow for more temperature-controlled zoning and enhanced occupant comfort. The difference between the two is that VAV terminals do not contain a fan. In any type of terminal unit, there is a damper that will modulate the airflow entering the space. As the damper closes, the area for air to pass through decreases, which limits the amount of air discharged to the space. This air limitation also causes a disturbance in the flow of air, which leads to noise due to pressure fluctuations. The noise generated will usually occur in the low and mid frequencies between 63 and 1000 Hz. (ASHRAE, A47.2) In terminal units that contain a fan, the fan becomes another noise source and the noise level depends on the type of terminal unit. FPM terminals can be configured in two ways: parallel and series. In a parallel configuration, the fan sits out of the air stream and only operates when the space requires additional mixed air. This means that the fan will be activated only as needed. This can become an annoyance to occupants who dislike hearing the start and stop of the fan throughout the day. Series configured terminals are in-line with the air stream 40
50 and operate on a continuous basis. This fan operation will not be as noticeable because it is constant, although the ambient noise level in the space may be increased due to the fan contribution. Regardless of the type of terminal used, manufacturers publish noise information along with the performance data of the unit for the designers to evaluate. Ductwork: Many sources of noise can be found in ductwork such as break-in/breakout, transitions and fittings in ductwork, and turbulent air. Duct break-in/breakout is when sound does not follow the ductwork along the run but can go in and out of ductwork at arbitrary locations. Break-out is the transmission of sound energy from inside the duct outward into the space through the duct walls (Long, 497). It can be most likely to occur within the first twenty to thirty feet from the fan (Mehta, Johnson, Rocafort, 199). Break-in is the transmission of sound energy from the space into the duct through the duct walls (Long, 503). This can be a possible source of noise occurring in adjacent spaces because ductwork connects all locations receiving supply air and noise from one space and so noise can break-in to the duct and break-out into another space. Break-in or break-out occurs because the sound energy will travel along the path of least resistance. In two adjoining spaces that are interconnected by a common duct, the path of least resistance is commonly the ductwork as opposed to the common wall between the rooms, as shown in Figure 3-5, because it provides the least resistance to the sound energy. Pressure fluctuations in ductwork caused by transitions and fittings can create unwanted sound. Noise generated in transition elements such as turns, elbows, junctions, and takeoffs can run 10 to 20 db higher than sound levels generated in straight duct runs (Long, 469). High velocity airflow will produce turbulent air, which can create noise within a duct, and improper installations can exaggerate the noise issues. For example, flexible duct routed to the diffuser can become constricted or kinked if not installed properly and will produce noise that will be radiated into the space through the diffuser. Figure 3-6 illustrates the noise 41
51 effects due to improper installation of flexible duct connections where the sound levels are based on the diffuser rating. Figure 3-5: Shared Duct Noise Transmission Figure 3-6: Correct and Incorrect Installation of Flexible Duct (Fry, 267) Diffusers and Grilles: Noise generated by diffusers and grilles is important to control because they are the part of the mechanical system closest to the occupants. Diffuser noise is difficult to attenuate once it has been created by the diffuser because it reaches the occupants so directly (Fry, 266). The noise is dependent on the velocity of the air traveling through the diffuser; also, diffuser noise will vary based on the diffuser style. For example, a perforated diffuser face has higher 42
52 noise levels than a louvered-face diffuser because the perforations cause the velocity and consequently the sound to increase. Manufacturers publish performance data including noise data corresponding to diffuser style and velocity through the face. The values given are for ideal flow conditions with proper diffuser installation, which may not be the case as shown in Figure 3-7; however these values can be used as guidelines. Figure 3-7: Diffuser Airflow Conditions (Fry, 267) Dampers are typically installed near a diffuser outlet so that the diffuser can be balanced to an exact amount of air. These dampers can add appreciable noise at the diffuser because of the sudden airflow change and pressure fluctuations. Waterside Mechanical Water side mechanical systems will also be sources of noise. Indeed, piping will act similarly to ductwork in that it will be the source of noise while also acting as a pathway for noise to travel throughout the building. Typical noise related to the plumbing systems can occur for the following reasons (Doelle, 189): Water flowing through piping is turbulent Sudden interruptions in flow along the piping can create water hammer which is described as a loud clank sound Noise and vibrations from pumps can travel through voids and along piping Some components such as valves or fittings may be loose or possibly defective Air is entrapped within the piping Solving a mechanical noise issue can become a complex situation because multiple system components may create the problem. One example of this is a hydronic 43
53 system involving a centrifugal chiller and an air handling unit (AHU). This system will have multiple sources of noise including water flow though the piping between the chiller and AHU, which will cause flow generated noise. The vibrations from the motors, fan and pump will create structure-borne and airborne noise. Also, ductwork from the AHU to the rooms being served will have airflow-generated noise as well as break-in and break-out noise. To determine if equipment in the mechanical room is causing the noise problem, each piece of equipment should be shut down until the noise stops. Once the source of the noise has been established, the possible pathway of noise from the source to the receiving room should be determined. Some pathways, for example, include flanking through penetrations in the wall or floor joining the spaces and air-borne noise through ducts or pipes, or equipment vibrations through the structure (ASHRAE, A37.20). Depending on the source and the path, a different solution to the problem may be required. Overall, there are many different types of solutions that will vary in cost to implement. Section 5-4 on page 72 will outline some of the typical solutions to HVAC noise Electrical System Noise The mechanical and plumbing equipment such as fans, pumps, ductwork and piping are sources of noise that are routinely considered. Indeed, the electrical system may not be considered immediately as a source for noise, but common problems can occur in or be transmitted into multipurpose rooms due to electrical components. This section will identify some of the prominent noise sources from the electrical system. Emergency Generators: Generators are loud during operation. If located in a mechanical room adjacent to a multipurpose room, noise can be transmitted into the multipurpose room like it is transferred by other mechanical equipment. Light Fixture Ballasts: Some fixture lamping, such as fluorescent require ballasts for operation. During their operation, some types of ballasts will generate a humming sound that can become an annoyance for the occupants. The ballast for the fixture should be 44
54 selected as a Noise Class A ballast which is becoming more commonplace in ballast selection. Electrical Connections: Mechanical equipment that requires electrical connections using cables that are routed through rigid conduit will be susceptible to transmitting vibrations similar to piping and ductwork as previously discussed in Section on page 39. Electrical Boxes: The most economical placement for electrical wall boxes that share a common wall is to place them back-to-back in the wall. Since the boxes contain openings for the necessary cables to be routed, these boxes become sound leak paths. The material that the boxes are composed of is also typically lightweight such as plastic or thin metal, which does little to prevent sound from being transmitted through the material. When the boxes are placed back-to-back, the area becomes a weak spot in the wall where sound can penetrate and transmit between two adjoining spaces (Long, 376). A thorough discussion of sound transmission and how sound leaks affect the transmission loss rating of a partition is in the following Chapter 4. The noise sources listed within this chapter create some of the typical problems experienced in a multipurpose room. Chapter 4 discusses noise paths, in particular how the construction of partitions adjacent to the multipurpose room affect the transfer of noise. Chapter 5, beginning on page 66, evaluates solutions to the noise problems listed in this chapter based on construction characteristics from Chapter 4 as well as trade-offs that occur when choosing which solution to utilize. 45
55 CHAPTER 4 - Sound Transmission and Isolation Chapter 2 discussed room acoustics and materials utilized inside spaces to create an acoustically pleasing environment. Chapter 3 defined noise and identified potential sources of noise frequently experienced within multipurpose spaces. This chapter will more thoroughly evaluate sound transmission and isolation from outside sources and how it relates to adjoining space partitions including the ceiling, floor, and walls. The partitions are important to control sound within a specific space because they can aid or hinder the dampening of noise from outside sources depending on construction. Section 4.1 Sound Transmission Sound transmission is the passage of sound from one space to another through a partition. A partition may be a wall, ceiling, or floor. When sound strikes a [surface], numerous resonances are generated in it. Resonances are created when sound strikes a partition because the impact of the sound creates vibrations that generate wave-like motion across the surface of the partition. When the frequency of the sound matches the frequency of the partition movement a transmission hole is introduced, which creates frequency spaces that enable sound to transmit across a barrier with more ease. The most prominent transmission occurs at the mass-stiffness resonance and the coincidence effect. At these frequencies, more sound can be transmitted across the surface than at other frequencies (Rettinger, 89). Laboratory and manufacturer tests for materials and construction assemblies can be consulted to determine at what frequencies any transmission holes occur, which will be transmission loss values at frequencies that are much lower than the surrounding frequencies. Transmission loss (TL) is the calculated difference in sound levels between two adjoining spaces (Coffeen). As more sound passes through a barrier, the sound level difference between the spaces will be small, and consequently the barrier is considered to have a low transmission loss. The preferred assembly is one with a high transmission loss allowing less sound to transmit through the material resulting in a greater sound level difference across the partition. There may be circumstances where a partition with a low 46
56 transmission loss is desired; however, this chapter will assume that noise from adjacent spaces is undesirable because this is generally the more prominent situation in multipurpose room applications. When determining the transmission loss of a partition, that partition can be a wall separating adjacent spaces or a floor/ceiling between vertically stacked spaces as illustrated in Figure 4-1. Figure 4-1: Sound Transmission through Partitions If the transmission of sound from an outside source is reduced, this will reduce the amount of noise perceived within the receiving space. To calculate the sound level in a receiving space Equation 4-1 can be used, where L s is the sound pressure level measured in db of the source room, ΔL TL is the transmission loss of the partition in db, S w is the area of the transmitting surface in square feet, and R r is the room constant in the receiving room measured in square foot sabins (Rettinger, 91). Equation 4-1 Lr = Ls ΔLTL + 10log( Sw Rr) Another commonly used term for transmission loss when referring specifically to specifying sound insulation between rooms is noise reduction (NR). This takes into account the effects of direct and indirect transmission paths between the source room and receiving room as well as the acoustical properties of the receiving room (Doelle, 166). 47
57 The equation for noise reduction is shown in Equation 4-2 where TL is the transmission loss of the partition, A 2 is the total absorption, in Sabins, of the receiving room and S is the area of the partition between the rooms (Mehta, Johnson, Rocafort, 177). Equation 4-2 NR = TL + 10log A2 S Typically, the designer is trying to determine how much of a noise reduction is needed to obtain a desired transmission loss. Equation 4-2 is best suited to fit this need and is therefore the most commonly used equation for the calculation of transmission loss through a partition because it deals more precisely with the composition of the barrier between adjoining spaces and uses terms that are simple to define for the space being evaluated (Doelle, 166). As an industry standard, transmission loss measurements are done using octave bands over a standard range of frequencies from 125 Hz to 4000 Hz (Long 317). Although the calculations for transmission loss are done over all the frequency bands, it can be more practical to have a single-number rating system to classify the sound characteristics of each construction element. This system is the Sound Transmission Class (STC) ratings STC Rating STC is a rating that was established for the purpose of gauging the sound transmission loss through a wall and was created by the American Society for Testing and Materials (ASTM) International. The STC rating is derived from a three-segment curve, seen in Figure 4-2, which is used as a comparison to the measured transmission loss data on a tested material. The transmission loss values are plotted on the chart based on their corresponding frequencies and the curve is moved vertically until both conditions for the rating are met (Mehta, Johnson, Rocafort, 102): No single transmission loss corresponding to a particular frequency may fall below the STC curve by more than 8 db. The total difference between the curve value and the transmission loss values over all related frequencies that fall below the curve may not exceed 32 db. 48
58 The STC rating corresponds to the highest value intersecting with the 500 Hz frequency that meets the stated requirements above. An example of the STC calculation method can be found in Section on page 51. Figure 4-2: Standard STC Curve Similar to sound pressure levels, multiple STC values do not add together. For example, a wall with an STC of 30 constructed next to a wall with an STC of 25 does not result in a total wall rating of 55. The rule of thumb is that doubling the mass of a partition will add 6 db of transmission loss, so the additional mass contributed by the second wall above in the example may only contribute a few decibels of performance to the wall. In general, an STC rating of less than 39 is considered to be poor and will provide minimal noise reduction. A minimum STC rating of 48 or higher is recommended and a rating of greater than 60 is considered to be an excellent (Tinianov, 74). These values will relate to the subjective perception of noise reduction across a partition, which is illustrated in Figure 4-3. This figure explains how the STC values relate to the perception of what is experienced in the space. For example, a wall with an STC rating of 30 will provide little to no transmission loss and most speech or music on the other side will be easily perceived. An STC rating of 60, by comparison, will have a 49
 There are two limitations to STC values.")
59 transmission loss high enough that quiet speech will be unheard, loud speech will be barely audible, and music will be heard faintly. Figure 4-3: Subjective Perception of STC Values (Mehta, Johnson, Rocafort, 116) There are two limitations to STC values. First, the STC value is a single number rating system; thus it does not include any information on potential dips that occur at specific frequencies in the transmission loss of a material. Therefore, a material that may have a high STC rating could have a resonant frequency that will allow the transmission 50
60 loss at this frequency to be much lower than at other frequencies and will act as a transmission hole in the partition. Therefore, the 8 db and 32 db, detailed on page 48, criteria serve to address this limitation as much as possible. The second limitation is that the STC curve is limited to the frequency range of speech, Hz. While some applications may extend outside this range, it is adequate for use in designing multipurpose rooms because most applications for this room type fall within this range (Mehta, Johnson, Rocafort 102) Finding STC Using the standard STC curve shown in Figure 4-2 and the following conditions, the STC of a material or construction type can be found. No single transmission loss corresponding to a particular frequency may fall below the STC curve by more than 8 db. The total difference between the curve value and the transmission loss values over all related frequencies that fall below the curve may not exceed 32 db. The following example will demonstrate the procedure for determining the STC for a partition: Roof/Ceiling system: 3 concrete topping over metal deck on 10 bar joists with 5/8 gypsum board hung from spring hangers to create the ceiling. This system is illustrated in Figure 4-4. The distance from the ceiling to the decking will not greatly affect the transmission loss values achieved. The transmission loss values for the roof/ceiling system were measured by the testing laboratory and are listed in Table
61 Figure 4-4: STC Example: Roof/Ceiling System Table 4-1: Transmission Loss Values for Roof/Ceiling System Trans. Loss (db) Frequency (Hz) Plotting the transmission loss values with the corresponding frequency on the STC chart as shown in Figure 4-5, the standard curve is moved upwards until no frequency falls more than 8 db below the curve, and the total number of transmission loss values below the curve does not exceed 32 db. In this case, the 32 db condition ends up being the determining factor after trial and error of moving the standard curve around. If the curve was moved any higher, the total decibels below the curve would exceed 32 db. The maximum values below the curve that would comply with the maximum requirement of 32 db total below the curve are listed in Table 4-2. Reading the value that intersects with the curve at 500 Hz shows that this roof/ceiling assembly has an STC of
62 Figure 4-5: Calculating STC Example Table 4-2: Frequency vs. Decibels below STC Curve Example Frequency (Hz) db Below Curve Total = 31 The STC can be determined for each construction element; however this process is time consuming and unnecessary because tables are available for the STC and transmission loss values for many materials and construction assemblies. Section explains further some of these construction assemblies used for sound isolation, and Section illustrates the approximate STC rating for typical construction types as determined by testing laboratories. 53
63 4.1.2 Construction Techniques and Methods This section will explain some of the typical construction techniques and methods that can be utilized within a building to provide acoustical noise solutions. Within this section, material characteristics will be discussed as well as possible wall, floor, and ceiling composition to reduce noise within a space and transmission from adjacent areas. The discussion accounts for a partition having a higher level of transmission loss, less sound will be perceived on the other side. The effectiveness of the transmission loss of a partition will relate to the sound isolative properties of the components used in construction. Section explains some of the properties of materials that are sound insulators and how they relate to sound transmission loss. Additionally, the types of doors and windows used in the partition also affect the sound isolative properties. Section explains how these types of openings will change the STC rating of the partition. Appendix B offers a compiled list of typical construction assemblies and their corresponding transmission loss data and STC ratings as determined through laboratory testing by the National Bureau of Standards. These values have typically been found through testing and are reasonable approximations; however, the manufacturer s technical data should be consulted to determine precise values for a specific material or assembly Sound Insulation vs. Sound Absorption A common mistake is to assume that any acoustical absorptive material is also a good sound insulative material. Many believe that by applying a sound absorbing material to a partition it will attenuate sound transmission between adjacent spaces. This is generally not a true statement. To be a true sound insulating barrier, which will result in a maximum transmission loss between adjacent spaces, the barrier must have mass. Absorbent materials tend to be more lightweight and porous, thereby making them easily penetrable by air and sound waves. This porous nature does not prevent sound passage through the material into other locations such as a space adjoined by a wall, ceiling, or floor (Rettinger, 185). Therefore, such a material would not be a good sound insulator. As a general rule, if air or water can pass through a material, sound will also be able to pass through (Mehta, Johnson, Rocafort, 91). 54
64 The primary function of an absorbent material, as was previously discussed in Section 2.2.3, is to reduce the reverberant sound energy within the same enclosure, not to impede transmission through the material. This does not imply that absorbing materials do not eliminate any sound energy through a partition. Absorbent materials do attenuate some sound energy; however, generally not enough to make a significant and noticeable sound level change (Mehta, Johnson, Rocafort, 91). Rather than cause a significant decrease in the sound insulation of the partition, which is the attribute of a more massive material, the absorbing materials placed inside the cavity of a partition are beneficial by providing damping to the assembly. Damping refers to the ability to absorb bending and vibrational energy at resonance by converting the sound energy into heat (Mehta, Johnson, Rocafort, 96). In general, the best way to increase the sound insulation, and consequently the transmission loss, of a partition is to add a material with more mass because mass will block sound energy from passing through the material (Olsen). As was discussed in Section 3.1 on page 27, the sound level must be reduced by at least 3 db for the noise reduction to be perceptible to the human ear and by at least 6 db for the noise reduction to be clearly noticeable. The amount of mass that a barrier has will aid in determining the amount of transmission loss because as the partition becomes denser, the amount of transmission loss through the partition will increase due to the mass law as Figure 4-6 shows. 55
65 Figure 4-6: Mass Law (Modified from Mapp) Doors and Windows Doors and windows will often become the controlling factor in the transmission loss for a partition. This is due to their mass typically being much lower than that of the surrounding wall. Although care may be taken to design a partition with a high STC rating that will minimize sound transmission, a component within the wall such as a window, door, or other opening with a lower STC rating will actually control the effectiveness of the partition (Mehta, Johnson, Rocafort, 103). Reduced transmission loss effectiveness can be calculated based on the percentage of wall area that the opening occupies as listed in Table 4-3. Furthermore, the amount of reduction due to the opening 56
66 is subtracted from the original TL of the wall to determine the overall TL of the entire assembly. Table 4-3: Transmission Loss Reduction by an Opening (Mehta, Johnson, Rocafort, 103) Reduction in the Transmission Loss of Wall by an Opening (db) Opening Area (% Total Wall Area) 100% 50% 20% 10% 5% 2% 1% 0.50% 0.10% 0.01% TL wall - TL opening The following example shows how to determine the reduction in transmission loss due to an opening: A 30 ft by 9 ft wall with a transmission loss 60 db contains a window that is 6ft by 4ft. The window has a transmission loss of 20 db as determined from the manufacturer s technical data. The percentage of the total wall area that the opening occupies can be determined by dividing the window area by the total wall area. In this case, the percentage of total wall area is found to be: % Total Wall Area = (24 SF/270 SF) x 100 = 8.9% To use Table 4-3, this value will be rounded to 10% and will result in a more conservative answer. The difference in TL between the wall and the opening is calculated to be equal to = 40 db. Table 4-3 at the point where the 10% column and 40 db row meet shows a TL reduction of 30 db. The overall transmission loss of the 57
67 wall can be determined with the TL value of the wall and TL reduction value: TL = = 30 db. Even though over 90% of the wall has a transmission loss of 60dB, the 10% of a much weaker 20 db transmission loss reduced the overall effectiveness of the wall to 30 db. If a situation like this occurs, it can result in a lot of money wasted in the construction of a high TL partition that cannot perform to reduce noise; this means more money to alleviate the problem. The closer the transmission loss of the opening is to that of the primary wall, the lower the reduction in overall transmission loss will be. Therefore, the doors and windows should be specified to match the TL ratings of the partition for optimum performance. The field installation of doors and windows during construction is also important. If a door or window is not properly installed, it can have leaks, often located at the jamb, head and threshold, which create sound paths and render the transmission loss of the door or window ineffective (Mehta, Johnson, Rocafort, 105). Doors and windows will usually have a seal applied around the perimeter of the opening to reduce leaks; however, over time the seals will degrade because of wear. Louvered openings, undercut thresholds, and glass panel inserts in doors create other noise transmission paths. Also doors and operable windows are frequently opened providing unobstructed sound paths, although they generally remain closed when transmission losses are critical Construction Types - Wall, Floor, and Ceiling Composition Various wall, floor and ceiling compositions are built in a laboratory and tested to evaluate what transmission loss, rated as STC, can be achieved. Laboratory testing occurs in a reverberation chamber with a sound diffuse field, a specially built room used to test materials for transmission loss. Tests are done with and without the sample partition and the resulting reverberation times are compared to calculate the absorptive characteristics of the partition. ASTM E 795: Standard Practices for Mounting Test Specimens during Sound Absorption Tests specifies laboratory test mountings for various applications. As illustrated in Figure 4-7, Mountings A, B, C, and D are commonly used for most prefabricated products, whereas Mounting E is used for acoustical ceiling applications. Other mounting options are available, but the mounting types shown are the most commonly used in most interior building applications. 58
68 Figure 4-7: ASTM Standard E 795 Mounting Conditions (Mehta, Johnson, Rocafort, 81) Even though partitions matching these construction compositions are erected in the field frequently they do not perform as well as the laboratory tests have predicted for several reasons (Mehta, Johnson, Rocafort, 108): A different sized partition is constructed in the field than the one used for testing in the lab. This can yield varying results due to the larger area for sound waves to pass through. Inferior workmanship during construction. In the laboratory, each partition is built exactly to specification, but this may not be the case in the field. Inferior or lesser grade materials used to construct the partitions. If a different product is substituted to save money, there will be a change in how well the partition performs. Figure 4-8 shows some typical STC ratings for different masonry wall constructions. Table 4-4, on page 60, lists typical STC ratings for wood stud wall constructions based upon the number of layers of gypsum board secured to both sides of 59
 Table 4-4 shows that a double stud wall with two layers of gypsum board on both sides yields the")
69 the wall. These are just a few examples of some typical construction STC values; Appendix B lists more transmission loss and STC values for commonly used materials. Figure 4-8: Approximate STC Values for Masonry Wall Constructions (Mehta, Johnson, Rocafort, 123) Table 4-4 shows that a double stud wall with two layers of gypsum board on both sides yields the highest STC rating of 63 whereas a standard stud wall with one layer of gypsum board on both sides and no cavity absorption yields the lowest rating of 37. The 60
70 thickness of the gypsum board, between 1/2 and 5/8, will not have a major effect on the values listed in the chart. Adding additional layers of gypsum board, as the chart suggests, will have a more significant effect on the STC values than the TL values due to the increase in mass of the wall system. Table 4-4: Typical STC Values for Wood Stud Walls (Mehta, Johnson, Rocafort, 127) Typical STC Values for Wood Stud Walls Without Cavity Absorption With Cavity Absorption Layers of gypsum board (left side/right side) Layers of gypsum board (left side/right side) Wall System 1/1 1/2 2/2 1/1 1/2 2/2 2x4 wood studs x4 woods studs, resilient channel on one side x4 wood studs, resilient channel on both sides Staggered 2x4 wood stud wall Double stud wall with 1" airspace between studs Table 4-4 lists typical STC values for wood stud walls, as opposed to steel stud walls, which tend to have a higher STC rating, 5 db higher typically, than wood stud walls. Wood has more mass than steel; however, the steel is more flexible, which allows it to dissipate more sound energy by converting it into motion. Also, different constructions can be applied to partitions to increase the transmission loss. For example, a staggered stud wall can be used in place of a standard stud wall. Staggered stud construction allows for better transmission loss than a standard single stud wall, but at less cost than building a double stud wall. The staggered stud wall will also take up a less floor area than a double stud wall (Mehta, Johnson, Rocafort, 127). The staggered stud wall, illustrated in Figure 4-9, is typically done only with wood studs because it is difficult to run the necessary continuous runner across the top and bottom plates if steel studs are used. If a much higher transmission loss is needed than a staggered stud wall 61
71 can provide, designers prefer to design the partition using double-studs and multiple layers of gypsum board or heavy plaster (Long, ). Figure 4-9: Typical Staggered Stud and Double Stud Wall Assemblies (Mehta, Johnson, Rocafort, 127) Adding fiberglass or other absorptive material between wood and metal studs will increase the transmission loss of the wall especially in the low and mid-frequency ranges. This absorptive material allows the wall to absorb longer wavelengths of sound and acts as a damper for the partition. The effectiveness of the added sound insulation is mostly dependent on the material thickness and density (Long, 337). Floor and ceiling systems are listed for an STC value as well as an IIC (Impact Isolation Class) value. Table 4-5 lists STC and IIC ratings for common floor and ceiling assemblies. IIC refers to the effectiveness of a floor/ceiling assembly in isolating impact sound transmission. Constructing assemblies with high STC and IIC values will produce a structure that transmits minimal noise and vibrations. 62
72 Table 4-5: STC and IIC Ratings for Common Floor/Ceiling Assemblies (Modified from Harris, 6.4) Floor Assembly Image Description STC Rating IIC Rating Plywood floor and gypsum board ceiling directly attached to wood joists Plywood floor and gypsum board ceiling directly attached to wood joists with carpet and underlayment on top Plywood floor and gypsum board ceiling resiliently suspended from wood joists; cavity filled with sound absorptive material Plywood floor and gypsum board ceiling resiliently suspended from wood joists; cavity filled with sound absorptive material with carpet and underlayment on top inch thick concrete slab inch thick concrete slab with carpet and underlayment on top Plywood floor and gypsum board ceiling resiliently suspended from wood joists; cavity filled with sound absorptive material, concrete topping, carpet and underlayment on top 6-inch thick concrete slab with wood floor on furring floating on compressed fiberglass board Calculating Transmission Loss Example Room Problem This section illustrates the calculation of transmission loss for a multipurpose room utilizing a simple room example with a noise source room and a receiving space that is more sound critical illustrated in Figure The following information is provided about the rooms: The area of the full height partition wall between spaces is (25 x15 )+(20 x15 )=675 ft 2 The source room functions as an open office. The receiving room will be used as a multipurpose room for meetings and presentations, and is therefore more sound critical. The wall between the spaces is composed of a single 2x4 wood stud wall without insulation and one layer of gypsum board on both sides. 63
73 The sound absorption in the receiving room includes carpet on a concrete floor and standard 5/8 acoustical lay-in ceiling tile. The exterior side walls are composed of ½ gypsum board on 2x4 studs. Acoustical tile and carpeting cover the entire area of the ceiling and floor of the receiving room. Absorption characteristics of the source room are not factored into Equation 4-2 to find the noise reduction across the partition. Figure 4-10: Source and Receiving Rooms According to Appendix B, the transmission loss for the wall is 32 db at 500 Hz (Long, 258). This example will use only 500 Hz to calculate transmission loss because this frequency will provide a good approximation for the entire assembly; however, a full spectrum analysis should be done using all frequencies for a better examination of the transmission loss. The first element that must be calculated is the total absorption in the receiving room, A 2. Going back to the example calculating the reverberation time on page 23, the total absorption can be found by multiplying the area of the absorbing surface by its absorption coefficient. Since for this example we are only examining the 500 Hz value, we will only use that frequency to find the total absorption. Again, however, a fullspectrum analysis should be performed for a more thorough analysis of the space 64
74 transmission loss. Using the table of absorption coefficients from Appendix A, we can calculate the total absorption to be: Ceiling Tile = (500 ft 2 )0.60 = 300 Sabins Carpet Floor = (500 ft 2 ) 0.14 = 70 Sabins Gyp. Walls = (1350 ft 2 )0.05 = 67.5 Sabins Total Absorption = Sabins The noise reduction across the partition is calculated using Equation 4-2 where TL is the transmission loss of the partition, A2 is the total room absorption, in sabins, of the receiving room, and S is the area of the partition between the spaces: NR( db) = TL + 10 log( A2 S) = log( ) = 30dB This value offers a moderate reduction in noise for this partition. There will be a noticeable difference in the sound reduction coming from the source room, but it will be at a level that may still create some annoyance to the occupants of the receiving room. Fortunately, some variables in this equation can be changed to increase the transmission loss and minimize dissatisfaction. One option is to increase the amount of absorption in the receiving room. This can be accomplished by changing the flooring to carpet on a pad instead of carpet attached directly to the subfloor and by changing the surface of two walls (25 x15 ) and (20 x15 ) to 1 fiberglass acoustical panel board. With these changes, the total absorption is increased as calculated below: Ceiling Tile = (500 ft 2 )0.60 = 300 Sabins Carpet Floor = (500 ft 2 )0.57 = 285 Sabins Gyp. Walls = (600 ft 2 )0.05 = 30 Sabins Fiberglass Walls = (675 ft 2 )0.80 = 540 Sabins Total Absorption = 1155 Sabins The noise reduction as a result will be increased: NR( db) = TL + 10 log( A2 S) = log( ) = 34dB Adding over 1000 square feet of improved sound absorbing material only increased the noise reduction by 4 db. As stated previously in Section 3.1 on page 27, a 65
75 4 db change will be perceptible to the human ear, but not clearly noticeable. Thus, a significant investment in material and labor for this increase would not noticeably improve the sound characteristics from the previous construction assembly. Rather than adding a large amount of absorption to a room, another method of increasing transmission loss is to adjust the partition construction. This may involve constructing another partition around the existing one to increase the overall mass, or build a completely new wall with an increased STC value. Further detail concerning construction of partitions can be found in Section on page 53. Another item that can be adjusted in partition construction is to add insulation into the cavity of the partition to aid in damping the sound energy. By applying all three improvements in this example, changing the wall construction to a 2x4 staggered stud wall, using batt insulation in the airspace, and adding one layer of gypsum board on both sides of the partition, would improve the transmission loss. Thus, the total transmission loss for the staggered stud wall with insulation increases to 45 db, and the total noise reduction through the partition equals: Ceiling Tile = (500 ft 2 )0.60 = 300 Sabins Carpet Floor = (500 ft 2 )0.57 = 285 Sabins 2-layer Gyp. Walls = (600 ft 2 )0.9 = 540 Sabins Total Absorption = 1125 Sabins NR( db) = TL + 10 log( A2 S) = log( ) = 47dB A noise reduction across the partition of 47 db is improved by 17 db over that of the initial example construction. This result will be a noticeable reduction in noise coming from the source, through the partition and into the receiving room. Even though this may produce the best increase in noise reduction across the partition, there will be some disadvantages to implementing all of these changes, the largest being the cost of each. For an existing building, replacing the existing 2x4 stud wall and constructing a new staggered stud wall will be costly and will reduce the floor space available. In new construction, the cost would be less because these features can be designed for in advance. Additionally, other trade-offs must be weighed to determine the best solution possible for each project. Some of these will be discussed in Chapter 5 along with common solutions for specific types of noise listed in Chapter 3 as well as trade-offs associated with the solutions. 66
76 CHAPTER 5 - Noise Solutions Chapter 5 is an evaluation of solutions to the noise problems in existing multipurpose rooms that have been previously discussed in this report. Each section details some of the common solutions to the noise issues listed in Chapter 3 and also discusses the trade-offs of choosing one solution over another. There are times when the most effective solution is not feasible due to budget constraints and an alternative must be used instead. However, most problems will accommodate several solutions to consider for each problem and this chapter cannot cover each one; instead, this chapter strives to give a general idea of the availability and result of some of the most commonly used solutions. Section 5.1 Room Acoustics The most common problem experienced in multipurpose rooms is that the space is too reverberant, so the room experiences long reflections resulting in difficulty comprehending speech and music and a perceived loud space. This usually occurs because the composition of the surfaces in the room is primarily hard and consists of reflective materials with minimal absorption. A resolution for this problem is to install sound absorbing materials in multipurpose rooms experiencing reverberation times that exceed the recommended times of between 1.0 and 1.5 seconds. Sound absorbers, previously discussed in Section on page 11, improve the room acoustics by eliminating sound reflections. Cost will vary depending on the type of absorber used and the number needed, but prices are typically based on a dollar per square foot value. Table 5-1 lists some approximate costs for typical room acoustical treatments including different types of absorbers and diffusers. These prices will change with the product that is used and the level of absorption of the material 67
77 Table 5-1: Approximate Installed Cost for Typical Acoustical Treatments (Olsen) Noise Reduction Coefficient (NRC) Acoustical Treatment Wall Treatments $3 - $6/SF $6 - $15/SF Lay-in Panels $0.5 - $1/SF $ $2/SF $2 - $4/SF Suspended Treatments Baffles $5 - $7/SF Clouds $6/SF Roof Deck $6/SF Spray On Treatments $ $3.50/SF Drapery $20 - $25/SF Diffusing Shapes $250 each The recommended solution to resolve long reflections is to use enough absorptive materials that achieve the target reverberation time for the space. Using the Sabine Equation, previously demonstrated in Section on page 23, the space reverberation time can be calculated to determine what effect different materials will have in the space. Appendix A is a list of many different materials and their absorption coefficients for each frequency band for use in calculations. Using materials that are good absorbers within the upper-mid and high frequency bands will be important to achieve the desired room effect. This is because these are the frequencies that are crucial to speech intelligibility. Arguably, aesthetics will be the primary trade-off when using different absorptive materials. This means a less expensive product will not look as polished as a more expensive product, although most manufacturers will offer different colors and patterns for fabric-covered treatments that can be adjusted to the owner s preference. There are times when multipurpose rooms will be used for events that require a variation of room effects. Then, the target reverberation time aims to find a balance for rooms that will be used for both speech and music. For some rooms, this compromise may not provide enough absorption for speech and too much absorption for music. In these rooms, a good alternative is to use variable absorption (Mehta, Johnson, Rocafort, 295). Variable absorption can take several forms but have similar results. Generally, the absorption is moveable or provides multiple surfaces that can be changed to alter the room acoustics. Figure 5-1 shows some examples of variable absorption. For example, drapery can be hung on a track and pulled out when extra absorption is needed or tucked 68
78 away when more reflective surfaces are needed. Other forms can be rotating panels that have an absorptive material on one side and reflective material on the other side. Variable absorption can be the most effective way to achieve any room response that is desired, although it may be more expensive and space consuming than fixed panels. Figure 5-1: Variable Absorption Examples (Mehta, Johnson, Rocafort, 295) These recommendations can be applied to any type and size of multipurpose room and many options are available from several manufacturers to fit any need for the space. Ultimately, utilizing absorbers and reflectors throughout the space will create a pleasant acoustical environment that allows the multipurpose room to function as it was intended to without distracting echoes or incomprehensible speech. 69

79 Section 5.2 Structure-borne Noise Structure-borne noise, as discussed in Section on page 36, is related to noise and vibrations that transfer along the structure. In such cases, mass of the structure is the most important factor in reducing structure-borne noise. A lightweight structure will be more susceptible to vibrations and will therefore transmit a greater amount throughout the building. In contrast, a structural member with a higher mass will transmit less because it will be harder to vibrate the material. In the end, two basic strategies can be adopted to reduce the structure-borne noise in a building. First, a soft floor covering such as carpet, cork, or rubber should be used where possible to reduce footfall and impact noise before it can be transmitted into the structure (Doelle, 167). Of these three materials, carpet will provide the best improvement in impact noise reduction. Furthermore, each one of these materials is economical to install. In a variation on this strategy, floor underlayments can be placed under wood and concrete floors to provide additional sound insulation where carpet or another soft floor covering cannot be used. Floor underlayments increase the amount of sound insulation in the floor by adding mass to the system and therefore increasing the transmission loss for the floor system more than would a soft floor covering alone, as shown in Figure 5-2. The drawback to this option is that it is more expensive and would be better implemented in a new construction application. Figure 5-2: Sound Control Components for Floor System ( 70
80 The second strategy to reduce structure-borne noise is to provide discontinuities along the structure. One method of achieving this includes using a floating floor which uses vibration isolators to decouple the floor from the surrounding structure. Another method includes isolating vibrating equipment from the structure as described in more detail in Section 5.4 on page 72. Disconnecting the structure using flexible connections eliminates the path for vibrations to move along (Mehta, Johnson, Rocafort, 146). For example, a room that is located below another space that is creating vibrations may experience problems as the vibrations travel through the floor and into the ceiling of the lower space. Isolating the ceiling from the structure above using isolation hangers, shown in Figure 5-3, can prevent some of the vibrations from being transmitted along the structure. Providing discontinuities along the structure is a more expensive option due to the intensive labor and materials that can be involved depending on the project size. As a result, this option may only be employed within a limited area that is particularly sensitive to vibrations or in areas closest to the source to dampen vibrations as quickly as possible. Figure 5-3: Typical Isolation Hanger Section 5.3 Airborne Noise The mass of a partition will be the most important factor in reducing airborne noise from outside sources. Accordingly, a partition with a higher mass generally has a higher level of sound insulation, which means that the transmission loss across a partition 71
81 is increased and will better prevent sound from penetrating between spaces. So it follows that to decrease the transmission through a partition, the sound insulation of the partition must be increased. This can be accomplished by changing the wall construction to use materials with higher STC values. Appendix B offers a list of several construction assemblies and their corresponding transmission loss and STC values for reference. Along with the construction of partitions, any components, particularly doors and windows within those partitions, must be designed to maintain the intended transmission loss. Special door hinges can be used in areas where noise is transmitted in the gap under the door and the threshold. Drop closures and hinges seal against the threshold when the door is closed and lift when the door is open. Drop closures, illustrated in Figure 5-4, differ from drop hinges because they have a spring loaded device located in the base of the door that drops upon the door being closed. On the other hand, a drop hinge, shown in Figure 5-5, physically lifts and lowers the entire door as it opens and closes. To maximize the transmission loss of the door, sound rated, solid-core doors should be used. Ideally, the transmission loss of the door should be as close as possible to that of the partition wall in which it is located to avoid degrading the wall transmission loss rating as discussed in Section on page 55. Figure 5-4: Middle and Exterior Located Door Drop Closures (Mehta, Johnson, Rocafort, 139) 72
82 Figure 5-5: Door Drop Hinges (Mehta, Johnson, Rocafort, 139) There are also ways of increasing the transmission loss of window construction. Multiple panes of glass, also referred to as glazing, can be used in a window. The thickness of the glass will affect the sound insulating properties because a thicker pane of glass will have a higher mass and thus a higher sound insulating value. Using gasses such as argon between panes is another method of increasing the transmission loss of the window because of a mismatch in the mass of the gas versus the air outside the window. This forces the sound wave to use up more energy to penetrate the glass, thus reducing the amount of sound that is able to transmit through the window. Sound loss can also be experienced due to sound leaks at the perimeter of the window. Naturally, both doors and windows will experience some level of sound leakage around the perimeter of their frame; however, all penetrations must be sealed with an acoustical sealant to prevent as little flanking noise as possible. An acoustical sealant is a non-hardening, non-drying sealant that remains flexible to last longer and avoid cracking, which will eliminate the seal s effectiveness against preventing sound transmission. Many manufacturers provide acoustical sealants, such as Owens Corning, USG Corporation, Pecora Corporation, and Tremco. Older doors and windows should be resealed because their seals will degrade naturally over time due to wear. This is a relatively inexpensive maintenance option that will maintain the acoustic performance of a space. Section 5.4 Mechanical System Noise Solutions to mechanical system noise must counter act or correct many issues that could be occurring at the mechanical source itself or along the transmission path due to air or water flow. Noise issues can be a structure-borne problem, airborne problem, or a 73
83 combination of both. This section will discuss different sections of the mechanical system and some typical solutions for each. Regardless of the type of noise being generated from the mechanical system, the mechanical room is the first location that should be treated to control noise from equipment. Specifically, surfaces can be treated with acoustical material such as wall mounted absorptive panels to attenuate as much sound as possible before it can leave the room. At a minimum, the structure around the mechanical room should have a high STC, at least a rating of 60, to prevent as much transmission of noise into surrounding areas as possible Mechanical Equipment Noise Mechanical Equipment: The primary source of noise from the mechanical system will be generated by the equipment and solutions to the noise problem can take place at two locations. The first location is at the source itself. First, the equipment should be evaluated to determine if it was sized correctly. Equipment that is improperly sized for the required load will typically result in higher levels of noise and ideally, the equipment should be replaced. This is a costly approach. An alternative that is more economical to construct an enclosure around the equipment to attenuate the noise immediately after it leaves the equipment. The cost of this approach will depend on the enclosure construction and the equipment being concealed. Additionally, the construction will change depending on the amount of attenuation required. The ideal enclosure will have most of the characteristics discussed in Section , on page 53, because it is desirable for the enclosure to have a high sound insulation value and therefore a high transmission loss to prevent noise from exiting the enclosure and entering the surrounding space. The second location for mechanical equipment noise reduction is along the noise path. These paths include the structure where vibration energy can be transmitted, ductwork, piping, and connections. The following paragraphs further discuss the solutions that can be incorporated along the path from the mechanical equipment into the multipurpose room. Vibration Isolation: A concern related to mechanical equipment is the vibrations that can be transmitted through the structure and system components throughout the building. All mechanical equipment will vibrate to some degree; however, the vibrations from mechanical equipment have become more noticeable in recent years due to 74
84 lightweight construction materials that are more flexible and therefore transfer vibrations more easily (Simmons, 30). Also, pieces of equipment that push air or water throughout the mechanical system, such as fans and pumps, create large vibrations due to the motor operation. If left un-isolated, these vibrations will transfer through the structure or along other equipment and into the space. Fortunately, there are methods to isolate for these types of equipment that will reduce the potential to transfer vibrations. The most economical method of isolation is using vibration isolators. Isolators are listed by their range of rated loads and deflections associated with those loads. There are three primary categories for vibration isolators: resilient pads, neoprene mounts, and a combination of a steel spring and neoprene pad. Resilient pads, Type W and Type WSW as shown in Figure 5-6, are made of materials such as cork and fiberglass and are designed to be loaded to a specified weight per unit area of the pad (Long, 393). The typical application of these isolation pads is non-critical or high frequency uses where large vibrations and low frequencies are not being experienced. Neoprene isolators, Type N and ND as shown in Figure 5-6, are individual mounts that are placed underneath equipment. For example, steel springs, Type V, O, and OR, as shown in Figure 5-6, are the most common type to isolate large mechanical equipment. Used alone, these isolators are effective at attenuating low frequency and can absorb the vibrational energy from the equipment. To achieve isolation that occurs over a wider frequency range, the spring isolators must be used in combination with resilient pads. Mechanical equipment can be mounted to an inertia base supported by vibration isolators, which is simply a concrete pad that is supported by Type V, O, or OR isolators (Long, 393). In this case, the base becomes a floating surface on which to mount the heavier equipment. Care must be taken to ensure that the isolators or base do not become short-circuited to another surface which eliminates the isolation between the equipment and the structure. This report will not cover the details of specifying vibration isolators due to the complexity and variation from project to project. Instead, an acoustician should be consulted to determine the isolator needed for a specific project. 75
85 Figure 5-6: Types of Vibration Isolators (Long, 393) While vibration isolators work to eliminate the path for vibrations from the equipment into the structure, other components of the mechanical system may provide alternate pathways for vibrations that need to be attenuated. This includes pipe and duct movement due to the motion of water and air inside. Flexible fittings for piping, shown in Figure 5-7, should be installed near pumps to help decrease vibrations along piping. The flex pipe acts as a vibration isolator by separating the coupling between the pipe and the vibrating pump. Flexible connections will also reduce the strain on and rigidity to the equipment which allows the isolators located underneath the equipment to operate as designed. Figure 5-7: Flexible Pipe Fittings Ductwork: Ductwork should be sized to ensure that the designed quantity of air is delivered to the space while maintaining a low velocity of air traveling through the duct. 76
86 As previously determined in Section 3.1.1, page 28, NC-35 is the recommended level for a multipurpose room based upon the Noise Criterion. To achieve this result, the air velocity should not exceed 1020 feet per minute (fpm) in main ducts and 540 fpm in branch ducts. Noise being transferred along a straight line of ductwork may never come in contact with the duct and therefore will not lose any energy and so provides little to no resistance for the noise. To combat this, items such as bends, junctions, and size changes will serve to reduce the noise transmitted along the ductwork because they force the noise path to change direction and cause interact with the duct, which consumes energy and reduces noise. Additionally, elbows that contain sharp 90 bends tend to be approximately 10 db noisier than lower angled and smooth radial bends (ASHRAE, 47.16). This is because of turbulence within the air stream caused by the sharp angle directional change. A good way of reducing elbow noise is to use smooth radial elbows as opposed to 90 bends, illustrated in Figure 5-8. Figure 5-8: Mechanical Duct Elbows (Fry, 270) The smooth radial bend will create less turbulence in the airflow. If space for ductwork is an issue and 90 bends must be used, elbows that contain turning vanes should be used. These vanes will help direct the air stream and help promote laminar flow along the path (Long, 469). A minimum of four duct diameters between elbows and branch take-offs, should be allowed to promote straight laminar flow and minimize noise (ASHRAE, A47.3). Also, abrupt changes in duct cross-sectional area should be avoided to keep the air stream as smooth as possible. Ductwork should be lined if possible to provide some noise control within the mid-frequency range. Such lining is typically fiberglass and will reduce the break-in and break-out noise along the ductwork. Compared to an unlined metal duct, which may attenuate mid-frequency sound by 0.5 db/ft, a duct with a 1 lining will yield 1 db/ft [attenuation] (Cavanaugh, Wilkes, 67). Of course, in some circumstances, lining ductwork is not permitted. One example is hospitals where there is 77
87 a safety risk due to the potential for particulate or bacterial growth from duct lining without the option to clean the lining where it may contaminate the air stream. If a duct cannot contain a liner to provide sound attenuation for health and safety issues, it may also be lagged. Duct lagging involves wrapping the duct with insulation and gypsum board. This can also be installed in addition to using a lining within the duct as shown in Figure 5-9. Lagging is the most effective way of preventing duct break-in and break-out noise because adding mass to the duct increases its transmission loss. However, this is a costly expense and should typically not be considered in most multipurpose spaces. Figure 5-9: Duct Lagging and Lining If there is a need for a higher level of attenuation than only duct lining or lagging can provide, a duct silencer can be installed in the system. Duct silencers, shown in Figure 5-10, page 79, will differ based on the manufacturer. In general, the silencer is rated based on its dynamic insertion loss, and airflow-generated noise, sometimes referred to as self-noise. Dynamic insertion loss is the sound level loss expressed in decibels based on a given airflow direction and velocity. The term dynamic is used 78
88 because of the property of the silencer is to absorb sound but still allow air to pass through unimpeded (Cavanaugh, Wilkes, 128). The dynamic insertion loss will vary based on the direction of the airflow versus the direction of the sound referred to as forward flow or reverse flow. Airflow-generated noise is the sound level created by the silencer when quiet air flows through it, and the sound is created only by its own movement (Long, 496). Airflow-generated noise will counteract some of the attenuation provided by the silencer and so must be examined when determining the size of silencer needed. There are two primary types of silencers, rectangular or circular, and each manufacturer provides standard sizes and lengths. The first type of silencer divides the air stream into two or more paths by baffles that are lined with an acoustical fill. These are effective because adding multiple paths increases the surface area for acoustical material to absorb sound. The second type of silencer is a packless silencer that uses no acoustical fill within the body of the silencer. These are good to use in clean applications such as hospitals where fibers and particulate from the fill could contaminate the air stream and cause problems (Olsen). For multipurpose rooms, the packless type may be unnecessary, though there is not a large difference in cost between the two. An economical option to installing a silencer is to use an expansion in duct size with lined ductwork for a short distance, which serves to attenuate low frequency noise. The size of expansion needed will depend on the amount of sound attenuation desired and the available length of duct for the expanded portion. A longer distance of expansion can provide a similar level of attenuation with a smaller change in size than a shorter length of a larger sized expansion. Regardless of the type of silencer used, the location within the ductwork should be at least three duct diameters away from fan discharges, inlets, or fittings to maintain smooth airflow in the system (ASHRAE 47.7). 79
89 Figure 5-10: Duct Silencers (Cavanaugh, Wilkes, 72) Fans: The fan size should be determined so the fan operates at its peak efficiency the majority of the time. This is because noise will be generated by fans that are operating outside of their peak efficiencies. Also, duct connections at the fan inlet and outlet should be as straight as possible to eliminate turbulent air entering or leaving the fan. Roof Mounted Equipment: Any equipment on the roof of the facility should be located so that it does not sit above the multipurpose room. If the equipment is unable to be moved, penetrations through the roof should be properly sealed to avoid sound leaks and vibrating equipment should be isolated from the structure using vibration isolators to reduce structure-borne noise. Diffusers and Grilles: Airspeed velocity through the diffuser neck should be kept to a minimum, 1500 fpm or less, to prevent the whistling or humming sound that can be generated through diffusers (ASHRAE, 47.9). The style of diffuser can be changed to one that has a lower level of self-noise based on the manufacturer s performance data. If noise continues to be an issue, additional diffusers or larger sized diffusers may need to be installed. 80
90 5.4.2 Electrical System Noise Just like to mechanical noise and structure-borne noise, vibrations from electrical connections to equipment can create noise problems in the building. To solve this problem, electrical connections made to vibrating mechanical and electrical equipment such as pumps, air handlers, transformers, and dimming equipment should be made with sufficient lengths of flexible conduit that will act as an isolator for the vibrations. The length needed will fluctuate depending on the distance between the equipment and the conduit path. A general rule of thumb is that the flexible conduit should be long enough and slack enough that a 360 loop can be made in it (Long, 402). Sound from outside sources can penetrate into the room through weak areas in the wall. A common example is openings for electrical boxes. As described in Section , page 44, electrical boxes that are placed back-to-back create a location in the wall that allows sound to transmit due to its reduced transmission loss compared to the surrounding wall. For new constructions, electrical boxes that share a common wall should be located at least one stud length apart to reduce the weak point for sound transmission (Mehta, Johnson, Rocafort, 129). If possible, walls should contain acoustical insulation that will increase the mass of the partition and provide increased sound absorption and increase transmission loss. In an existing building, moving electrical boxes is not a cost-effective option, and so these boxes must be treated in other ways to increase the transmission loss and reduce the ability for flanking as much as possible. Accordingly, the back surface of any electrical box should be sealed with acoustical sealant to make the connection with the wall airtight (Mehta, Johnson, Rocafort, 106). Increasing the sound insulation around and between the boxes will also be beneficial in reducing the sound transmission. 81
91 CHAPTER 6 - Case Study Chapter 6 will illustrate the concepts discussed in Chapters 2-5 utilizing a case study of a multipurpose room to demonstrate the trade-offs associated with controlling noise. An existing church multipurpose room was experiencing noise issues within the space that were noticeable after construction. The noise minimized the space functionality by making it difficult for the occupants to comprehend speech and music. The owner desired to resolve as many issues as possible while staying within the available budget. This chapter describes the facility in Section 6.1 while Section 6.2 is an outline of the noise issues experienced in the space. By analyzing the space to determine the room response, as examined in Section 6.3, potential solutions to the noise issues were determined, which are summarized in Section 6.4. Section 6.5 describes the solutions that were implemented in the space based on the trade-offs associated with each solution. Following the renovation, the space was analyzed again to determine the effectiveness of the changes. The results of the final analysis are listed in Section 6.6. Section 6.1 Facility Description The church multipurpose room is a separate building located away from the primary church building. The space is used for speech, music, and physical activities. Figure 6-1 shows a floor plan of the space, and Figures 6-2 and 6-3 are images within the space of the existing conditions. The conditions of the room are summarized as follows in order to evaluate this space throughout the case study: Building Type: Church multipurpose room Space Uses: Meetings, worship services, luncheons, musical performances, plays, and youth activities Size and Volume of Space: Primary floor area is 69 L x 50 W x 37 H with a total room volume of 114,000 ft 3 Surfaces: Floor Finished Concrete with no covering Walls Steel studs with brick veneer exterior and gypsum board interior 82
92 Twelve (6 x 5 ) Glass Windows: six along both east and west walls Ceiling Wood Tongue and Groove with a pitch of 30 1 thick porous absorptive wall panels around the east doors Audience seating with thin padding: 90 seats taking up approximately 500 ft 2 and 50 seats and tables taking up approximately 700 ft 2 Figure 6-1: Multipurpose Room Floor Plan 83

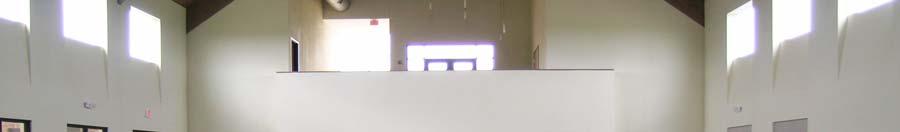


93 Figure 6-2: Multipurpose Room North Figure 6-3: Multipurpose Room Southeast Corner 84
94 Section 6.2 Noise Issues The room was experiencing several noise issues that caused occupants difficulty in comprehending speech and created an annoyance. The noise issues included excessive reflections, flutter echo, and mechanical system noise from the air handling unit in the mechanical room next to the balcony. As discussed in Section 2.2, excessive reflections are a result of reflective materials being the majority surface material within the space. Also, flutter echo is occurring because the east and west walls are parallel to each other and the construction of gypsum board on studs creates a hard surface that allows flutter echo to be created between the walls. The ceiling shape also affects the reflections in the space. The peaked ceiling created a concave shape that may have been creating some hot spots within the room; however, this was not severe enough to create a noticeable problem. The mechanical unit next to the balcony is connected directly into the multipurpose room by means of a straight run of uninsulated ductwork. The acoustician determined that the noise from the air handling unit was due to noise generated by the fan radiating into the multipurpose room through the ductwork as well as diffuser noise as a result of the high air velocity from the unit. Section 6.3 Initial Room Analysis The room was analyzed under the existing conditions to determine the reverberation time of space and the ambient noise levels. A reverberation time calculation was run using the Sabine Equation introduced in Section 2.2.5, page 21. This calculation is an approximate analysis of the space because it uses the approximate RT values using absorption coefficients for materials found in Appendix A. Since the Sabine Equation assumes that the sound field is completely diffuse in the space, the result should be close to what is actually being experienced, but may not be exact because the sound distribution within the space is not known. This means that the Sabine Equation will not be able to predict the reverberation time exactly if the sound distribution in the room is more directional rather than diffuse because it does not have a factor within the equation to take this into account. Also, because the Sabine Equation does not take room shape into account, the peaked ceiling will not directly factor into the calculation; only the total volume of the space will be utilized in the equation. The estimated calculation for the 85

 = 0.")
95 room absorption can be found in Table 6-1. This calculation was run using estimated values from Appendix A. Materials were chosen that best fit the existing conditions of the space. Though there may be some error in the result, nonetheless this result will be fairly accurate and will not change significantly if slightly different materials are chosen. The approximate reverberation time for the multipurpose room was then estimated at 3.7 seconds in the mid frequency range, where speech occurs, as seen in Table 6-2. Table 6-1: Approximate Room Absorption for Multipurpose Room Case Study Table 6-2: Approximate Reverberation Time for Multipurpose Room Case Study Reverberation Time (sec) = 0.049(V/(A total)) Since the Sabine Equation is only an approximation of the reverberation time, determining the actual reverberation time of the space was the next task. Field measurements were then taken using a sound source loudspeaker, microphones, and computer software. (Note: Field measurements should be performed by an acoustician to ensure an accurate result.) The measurements taken in the space determined that the actual reverberation time for the space is 3.6 seconds in the mid-frequencies as seen in Table 6-3. This result is slightly higher than what was calculated in the previous figures. This is most likely due to a slightly different absorption level in the space than what was previously estimated. Table 6-3: Initial Field-Measured Reverberation Time for Multipurpose Room 86
96 As discussed in Section on page 21, a more ideal reverberation time would be between seconds; however, at a minimum the reverberation time should not exceed about 1.6 seconds at mid frequencies for a space with the volume of this multipurpose room to maintain speech intelligibility and lively music environment (Coffeen). When designing a multipurpose space, the design should be focused more on the primary function of the space while remaining sensitive to the needs of the other room functions. During the field testing, the room was also measured to determine the ambient sound level within the room. Without the air handling unit operating, the ambient noise level was measured as having a Noise Criterion rating of 30. With the air handling system operating, the room ambient noise was measured as having a Noise Criterion rating of 49 (Coffeen). Comparing the rating NC-30 to the rating with the air handling unit of NC-49 shows that the air handling unit is causing a significant increase in noise for the space. A rating of NC-49 also exceeds the recommended levels for a multipurpose room of NC-30 to NC-35. Section 6.4 Potential Noise Solutions and Trade-offs After determining the room response and noise issues occurring in the space, the potential solutions can be compiled and evaluated to determine which best resolves the problems while still preserving the owner s needs. Table 6-4 following is a summary of the noise problems and potential solutions for this multipurpose room. The table also lists trade-offs for each solution and general notes concerning the effectiveness of that solution within this case study. The solution indicated by an asterisk is defined as the ideal solution because it would provide the best control and reduction of noise for the space regardless of the cost for implementing the solution. Evaluating the costeffectiveness of implementing each potential solution and considering the trade-offs will be the basis for determining which solution to implement. The goal is to create a functional space within an acceptable budget. Finally, it should be noted that the final solutions chosen may not provide complete noise control but will be an improvement over the existing conditions. 87
97 Table 6-4: Summary of Noise Problems and Potential Solutions Noise Problem Potential Solutions Available Trade-offs General Notes Excessive Reflections *Add Absorptive Material: Flutter Echo Mechanical AHU Noise - Fabric Covered Wall Panels Panels are available with a range of absorption coefficients Variety of colors and sizes available Susceptible to damage when struck by sports balls - Absorptive Ceiling Panels Panels are available with a range of absorption coefficients Color options are more limited Less susceptible to damage when struck by sports balls - Carpet Flooring Floor location puts absorbing material closer to source and occupants Minimizes reflections from floor Lower absorption coefficient values for carpeting Add Absorptive Material to Parallel Surfaces: - One wall - *Two walls *Relocate AHU: *Reduce Fan Speed Line Ductwork: Add Duct Silencer: Add Elbows and Fittings: Absorptive material will eliminate flutter echo between parallel walls. Placing material on one wall only may cause the room to be aesthetically assymetrical. Absorptive material will eliminate flutter echo between parallel walls. Placing material on both walls will achieve aesthestic balance Higher cost for installing more SF Noise will occur further from space Costly to move large existing equipment Often there is not another space available to move to Static pressure in system will increase which decreases system effficiency Reducing velocity will reduce airborne noise May affect AHU ability to condition the space Static pressure for the system Attenuates noise before leaving the ductwork Reduces break-in and break-out noise Attenuates noise before it leaves the ductwork Will add static pressure to system Good option for existing buildings Cost based on type and size of silencer needed Attenuates noise as it passes by fittings Will add static pressure to system Note: * Indicates the ideal solution to reduce noise regardless of trade-offs Cost will vary based on manufacturer used and the square foot amount needed Cost will vary based on manufacturer used and the square foot amount needed. Absorbing material will aid in reducing excessive reflections Not a realisitic option due to cost involved. Considering placement of AHU is better suited in new construction projects Cost-effective option as long as the room can still be conditioned so the occupants are comfortable Not a cost effective option because type of ductwork existing is spiral lock seam and cannot be lined without double layer duct Option better suited to new construction projects because of cost to reroute ductwork and add fittings 88

98 Section 6.5 Applied Noise Solutions After weighing the benefits and costs of the recommended solutions for the church multipurpose room, the owner had to choose what solutions would meet the needs of the space while maintaining other needs including cost and ease of implementation for an existing facility. Unfortunately, the mechanical noise problem was not completely resolved for this space because the cost of eliminating all of the noise from the air handling unit was not within the owner s budget. However, the fan speed of the air handling unit was reduced to try and eliminate as much noise as possible without compromising the ability of the unit to condition the space. Also, three other solutions were employed to directly reduce the other two noise issues concerning reflections and echo. First, the owner desired that the wood ceiling not be completely covered to maintain its aesthetic appeal, however, some absorption was necessary in that location. The final choice was to install 4-0 x 5-0 suspended absorptive panels made of Tectum to the ceiling, which is shown in Figure 6-4. Figure 6-4: Multipurpose Room Suspended Tectum Ceiling Panels The panels were spaced so that they would be aesthetically pleasing and they were suspended from the ceiling as opposed to surface mounted to provide an air space behind the panels, which will improve their low frequency absorption as discussed in Chapter 2. 89


99 The suspended panels also help eliminate some of the concave shape of the ceiling and reduce the potential for hot spots. Due to budget constraints, panels could not be placed in every bay of the ceiling, therefore, the acoustician determined that the center bays were more critical to cover with the panels than the exterior bays without compromising the effectiveness too much. The second solution to reduce flutter echo and long reflections was to place additional fabric covered porous absorptive panels on the walls. These panels are 2 thick fiberglass board and are surface mounted. A majority of the north wall, shown in Figure 6-5, was covered with the panels, and portions of the east wall, shown in Figure 6-6 were also covered. The acoustician also recommended that a larger square foot area of the east wall be covered with the panels for the best reduction in excessive reflections; however, for economic reasons only the north wall and some of the east wall could be remediated. In the future, if the budget allows, additional panels can be installed along the rest of the east wall. Figure 6-5: Multipurpose Room with Added Absorption on North Wall 90


100 Figure 6-6: Multipurpose Room East Wall with Additional Absorption The third solution chosen to improve the space was to use seating that has additional padding and provides more absorption in the room. The chairs can be seen in Figure 6-7. These chairs are moveable, but will remain in the space for a majority of the functions. Figure 6-7: Multipurpose Room Absorptive Seating 91

101 Section 6.6 Final Room Analysis With all three of these solutions in place, the space was re-evaluated to determine how effective the changes were. Consequently, the Sabine Equation was utilized to determine the approximate reverberation time for the space under the new conditions. Table 6-5 and Table 6-6 illustrate the new estimate for the total absorption and reverberation time of the space. Table 6-6 shows the reverberation time at the mid frequencies will now be approximately 1.5 seconds. The reverberation time was also field-measured again to compare the actual time after the changes were made to the approximated value and to the previous field measurement. Table 6-7 lists the values achieved from the field test, showing that the new reverberation time for the space is 1.6 seconds in the mid-frequencies. This time is much more appropriate for this type and volume of space such that speech will be more intelligible and music will be lively and enjoyable for the occupants. Table 6-5: Approximate Room Absorption for New Conditions Table 6-6: Approximate Reverberation Time for New Conditions Reverberation Time (sec) = 0.049(V/(A total)) 92

102 Table 6-7: Final Field-Measured Reverberation Time for Multipurpose Room The ambient noise level of the room after the changes was also field-measured. Reducing the fan speed created a slower air velocity in the system and reduced the noise that the higher velocity was generating. The new field-measured level has a Noise Criterion rating of 37. This NC rating is still slightly higher than the recommended maximum of NC-35, but it is enough of a change to be considered acceptable and will decrease the annoyance for the occupants. Final analysis of the space proves that all the changes made have reduced excessive reflections and noise, making the environment acoustically pleasing. A summary of all before and after values is in Table 6-8. Overall, the owner was pleased with the results and is now able to fully utilize the space as it was intended. Table 6-8: Summary of Reverberation Time - Before and After Approximate RT Field Measured RT Field Meaured NC Level Before 3.7 seconds 3.6 seconds NC-49 After 1.5 seconds 1.6 seconds NC-37 93
4-Acoustics: Background
 4-Acoustics: Background In the past acoustics for buildings especially concert halls was done by luck. A design would be done that worked well and then it would be mimicked. Other times awful designs emerged
ROOM ACOUSTICS DESIGN. Room Acoustics Design Intent Appropriate Articulation
 ROOM ACOUSTICS DESIGN (and continuing to look at OPR) http://mikebm.files.wordpress.com/2008/06/walt-disney-hall-1.jpg Ball State Architecture ENVIRONMENTAL SYSTEMS 1 Grondzik 1 Room Acoustics Design Intent
Reverberation Time Design for IM Building Addition
 INTRAMURAL BUILDING Reverberation Time Design for IM Building Addition Project 1 Andrew Brouwers Kelly Cerri Melissa Consiglio Michael Devaney Kenna Markel March 20, 2014 Table of Contents Introduction......................................................
Enhancing Acoustic Performance through the use of Window Shade Fabric White Paper
 Enhancing Acoustic Performance through the use of Window Shade Fabric White Paper As architecture and design evolve, more demand can be seen for obtaining creative solutions for occupancy comfort. In designing
Architectural Acoustics
 Architectural Acoustics SUSPENDED CEILING SYSTEMS A Sustainable Integrated Ceiling Platform Presented by: United States Gypsum Company AIA Provider #: K011 Credit(s) earned on completion of this course
Sound Control Manual Sound Construction Room Acoustics
 Sound Control Manual Sound Construction Room Acoustics Acoustics is usually very broadly defined as "the science of sound." The term "Room Acoustics" can be more narrowly defined as the shaping and equipping
Noise Control Of Building
 International Conference on Electrical, Electronics, and Optimization Techniques (ICEEOT) - 2016 Noise Control Of Building Sandesh G. Jharbade Civil Department P.R.M.I.T & R, Badnera Badnera, India Mayur
Corporate Environments
 Acoustics and the Impact on Corporate Environments falconproducts.com Achieving High-Quality Acoustics in Corporate Settings Knowledge is power. Here s what you need to know about sound, noise and creating
Church Soundproofing. Church Soundproofing & Soundproofing Solutions
 Church Soundproofing Church Soundproofing & Soundproofing Solutions Church Soundproofing This type of acoustic need requires special attention and knowledge to the nuances of voluminous spaces & hard surfaces,
Office Soundproofing. Office Soundproofing & Soundproofing Solutions
 Office Soundproofing Office Soundproofing & Soundproofing Solutions Office Soundproofing Proper office design will factor in the sound levels within the office space and determine where office noise control
NOISE CONTROL OF BUILDINGS
 A Seminar report On NOISE CONTROL OF BUILDINGS Submitted in partial fulfillment of the requirement for the award of degree Of Civil SUBMITTED TO: SUBMITTED BY: www.studymafia.org www.studymafia.org Acknowledgement
AUDITORIUM: A CASE STUDY ON ACOUSTIC DESIGN BUILDING SCIENCE II ARC3413/BLD61303 SEMESTER 5
 AUDITORIUM: A CASE STUDY ON ACOUSTIC DESIGN BUILDING SCIENCE II ARC3413/BLD61303 SEMESTER 5 BACHELOR OF SCIENCE (HONS) IN ARCHITECTURE SCHOOL OF ARCHITECTURE BUILDING AND DESIGN LECTURER: MR. AZIM SULAIMAN
BUILDING SYSTEMS NOISE CONTROL
 BUILDING SYSTEMS NOISE CONTROL Ball State Architecture ENVIRONMENTAL SYSTEMS 2 Grondzik 1 First An Acoustics Refresher from ARCH 273 Ball State Architecture ENVIRONMENTAL SYSTEMS 2 Grondzik 2 1 Sound conceptually
Hospitals Soundproofing. Hospital Soundproofing & Soundproofing Solutions
 Hospitals Soundproofing Hospital Soundproofing & Soundproofing Solutions Hospital Soundproofing Clean room environments impose sanitation constraints diametrically opposed to the basic construction of
Introduction to Acoustics
 Introduction to Acoustics Absorption Have you walked into a racquetball court and heard the echo as the ball strikes the wall? Or have you been in the country with snow on the ground and noticed how quiet
UNDERSTANDING SOUND/NOISE
 UNDERSTANDING SOUND/NOISE Noise has been an environmental issue throughout the ages. Ancient Romans complained about chariots rattling on cobble stone roadways. Renaissance metal smiths often lost their
A few amazing facts about Acoustiblok
 A few amazing facts about Acoustiblok A standard metal stud 5/8" gypsum board wall with only 1 layer of 16 oz. Acoustiblok has better sound reduction, (STC 53*, Riverbank Laboratories), than a solid 12"
SOUND INVESTMENT How the Acoustical Properties of Building Products Are Measured and Why This Is Important
 SOUND INVESTMENT How the Acoustical Properties of Building Products Are Measured and Why This Is Important Introduction Acoustics and noise control have become important issues since the late 1950s with
BY: United Plastics Corporation 511 Hay Street Mount Airy, NC (800)
") HSW/STC SOUND ENVIRONMENT LEARNING AND HEALING BY: United Plastics Corporation 511 Hay Street Mount Airy, NC 27030 (800) 577-3931 www.dbsoundcontrol.com Learning Objectives Upon completion of this course,
HSW/STC SOUND ENVIRONMENT LEARNING AND HEALING BY: United Plastics Corporation 511 Hay Street Mount Airy, NC 27030 (800) 577-3931 www.dbsoundcontrol.com Learning Objectives Upon completion of this course,
IAC Acoustics Noise-Foil Sound Absorption Panels for Industrial Applications. Dan O Brien
 IAC Acoustics Noise-Foil Sound Absorption Panels for Industrial Applications Presented by Dan O Brien Industrial Business Unit Manager IAC Acoustics, A Division of Sound Seal 401 Airport Road North Aurora,
ACOUSTICAL INFORMATION
 ACOUSTICAL INFORMATION Alpro has been successfully used for over 50 years to provide sound absorption for a variety of environments from gymnasiums and auditoriums to water treatment plants and outdoor
Acoustical Engineering Solutions.
 Acoustical Engineering Solutions. Meeting IBC Acoustical Requirements for Multifamily Construction By Scott Harvey, PE, INCE Bd. Cert. Phoenix Noise & Vibration Frederick, Maryland Copyright Materials
Acoustics and Classrooms BARD MANUFACTURING COMPANY REGISTERED AIA PRESENTER VAUGHAN SMITH
 Acoustics and Classrooms BARD MANUFACTURING COMPANY REGISTERED AIA PRESENTER VAUGHAN SMITH Acoustics and Classrooms SOURCES OF NOISE ACOUSTICAL TERMS AND DEFINITIONS ANSI STANDARD OCCUPIED AND UNOCCUPIED
Analysis 4 Acoustical Analysis of Interior Partitions- Breadth
 Analysis 4 - Breadth Background Good classroom acoustics are vital when the teaching and learning process relies strongly on verbal communication. Transmission of noise from one learning environment to
APPLICATIONS HVAC Acoustics and Vibration
 APPLICATIONS HVAC Acoustics and Vibration Technical Development Program Technical Development Programs (TDP) are modules of technical training on HVAC theory, system design, equipment selection and application
Acoustical Characteristics of Carpet
 CRI TECHNICAL BULLETIN Acoustical Characteristics of Carpet Carpet is an outstanding sound absorptive material. When properly selected, carpet absorbs airborne noise as efficiently as many specialized
21 ST CENTURY LEARNING ACOUSTICS. Steve Meszaros, M.Sc., P.Eng Acoustical Technical Director / Associate
 21 ST CENTURY LEARNING ACOUSTICS Steve Meszaros, M.Sc., P.Eng Acoustical Technical Director / Associate Introduction Steve Meszaros B.Sc. (Mechanical Engineering) University of Manitoba M.Sc. (Biosystems
Custom Audio Designs Ltd
 Understanding the New BB93 Acoustics in Schools Recent studies have shown that many classrooms have poor acoustics. As a result, children with normal hearing are often unable to make out what is being
NINTH INTERNATIONAL CONGRESS ON SOUND AND VIBRATION, ICSV9 CASE STUDY OF A HOSPITAL ATRIUM WITH OVERLOOKING PATIENT ROOMS
 Page number: 1 NINTH INTERNATIONAL CONGRESS ON SOUND AND VIBRATION, ICSV9 CASE STUDY OF A HOSPITAL ATRIUM WITH OVERLOOKING PATIENT ROOMS Sarah B. Knight, Jack B. Evans, P.E., Chad N. Himmel JEA COUSTICS
Accutone2 Architectural Enclosures
 Architectural Enclosures A Complete Range of Certified, High-Performance Voice-Over, Broadcasting and Post-Production s & Suites Provides optimum acoustic space Modular design allows relocation if required
ACOUSTIC TREATMENT. 1 Reverberation. Inside a given internally reflective enclosure, the human ear receives:
 ACOUSTIC TREATMENT Acoustic Treatment addresses the quality, intelligibility and level of sound INSIDE a room and has nothing to do with how much internal sound is or is not heard outside the given room,
NEW HOUSE RESIDENCE HALL CARNEGIE MELLON UNIVERSITY, OAKLAND, PA
 Acoustical Analysis: Design Objective The primary acoustical goal of space planning is to place noisy equipment as far as possible from noise sensitive areas. New House did everything possible to achieve
Association of Australian Acoustical Consultants Guideline for Commercial Building Acoustics. May 2011
 Association of Australian Acoustical Consultants Guideline for Commercial Building Acoustics TABLE OF CONTENTS 1.0 INTRODUCTION... 3 2.0 OBJECTIVES... 3 3.0 CRITERIA... 5 2 1.0 INTRODUCTION Members of
ARCHITECTURAL ACOUSTICAL WALL & CEILING PRODUCTS
 ARCHITECTURAL ACOUSTICAL WALL & CEILING PRODUCTS SOUND QUALITY DIVISION OF SOUND SEAL Solving a customer s problem is the motivation behind everything we do in the Sound Quality Division of Sound Seal.
Introduction to Acoustics:
 Introduction to Acoustics: How I Learned to Stop Worrying and Love the Sound Level Meter Samantha Rawlings, LEED AP BD+C For IFMA New Mexico 07.14.2015 Veneklasen Associates INTRODUCTION Consultants in
Technical Features Sound Construction Design Aid For Office Acoustics
 Technical Features Sound Construction Design Aid For Office Acoustics HOW TO DETERMINE COMPOSITE SOUND ISOLATION RATINGS FOR OFFICES BY COMBINING PERFORMANCE OF WALLS, CEILINGS AND FLOORS by Vincent M.
ARCHITECTURAL ACOUSTICAL WALL & CEILING PRODUCTS
 ARCHITECTURAL ACOUSTICAL WALL & CEILING PRODUCTS ALL NOISE CONTROL Solving a customer s problem is the motivation behind everything we do in the Sound Quality Division of ANC. In addition to our extensive
University of Idaho Lionel Hampton School of Music
 Facility Acoustic Study For the University of Idaho Lionel Hampton School of Music Ridenbaugh Hall & Music Building Moscow, Idaho Update: June 25, 2018 CKA Project Number: 18044 C A S T E L L A W K O M
ENSURING YOUR SCHOOL MAKES SWEET MUSIC: HOW TO STRIKE THE RIGHT NOTE IN SCHOOL ACOUSTICS
 ENSURING YOUR SCHOOL MAKES SWEET MUSIC: HOW TO STRIKE THE RIGHT NOTE IN SCHOOL ACOUSTICS Cristofer Gore, International School Specialist October 2014 The Fundamental Requirements of a Music Suite Project
INNOVATIONS FOR LIVING
 INNOVATIONS FOR LIVING Contents Introduction 1 What is Sound 2 Basic Principles of Noise Control 4 Sound Absorption 9 Sound Transmission Loss 12 Ceiling Sound Transmission Loss 14 Impact Sound Transmission
SOUNDBLOX SOUNDCELL FAQ
 Most Frequently Asked Questions About SOUNDBLOX and SOUNDCELL How do SOUNDBLOX and SOUNDCELL units work? SOUNDBLOX and SOUNDCELL units work on the principle of a Helmholtz resonator. It is well known that
Acoustics and Office Design. We are surrounded by sound at all times. Some sounds are pleasant and soothing; others annoying and distracting.
 Acoustics and Office Design We are surrounded by sound at all times. Some sounds are pleasant and soothing; others annoying and distracting. Sound affects the way we feel and behave. In the working environment,
In order to solve the problems associated with sound, there. is a need to look at the acoustic component of the buildings. These
 1.0 INTRODUCTION In order to solve the problems associated with sound, there is a need to look at the acoustic component of the buildings. These include walls, furniture, windows, ceiling etc. sources
ACOUSTIC DESIGN OF THE AUDITORIUM IN THE CHURCH OF RISPESCIA
 ACOUSTIC DESIGN OF THE AUDITORIUM IN THE CHURCH OF RISPESCIA Sergio Luzzi and Lucia Busa Vie en.ro.se. ingegneria, Via Stradivari, 19, 50127 Florence, Italy email: sergio.luzzi@vienrose.it The authors
ARCHITECTURAL ACOUSTICS
 ARCHITECTURAL ACOUSTICS KINETICS STANDS OUT ACOUSTIC PRODUCT EXPERTS SINCE 1958 DIVERSITY OF PRODUCT SOLUTIONS AND FINISHES BEFORE THE MUSIC BEGINS, THE PERFORMANCE STARTS WITH THE ELEMENTS OF THE ROOM
Noise-Foil Acoustic Metal Panels Sound Absorption Systems for Industry & Commerce
 Noise-Foil Acoustic Metal Panels Sound Absorption Systems for Industry & Commerce Abuse resistant metal jacketed constructions Lab certified acoustic performances Suitable for interior and exterior installations
Sound Attenuation. Slide 1 of 48. PAC International Inc START
 Sound Attenuation START www.pac-intl.com Slide 1 of 48 Sound Attenuation PAC International 7310 Smoke Ranch Rd Suite "E" Las Vegas, NV. 89128 Course Number: XXXXXX Learning Units: 1.00 PAC International
NOISE CONTROL FOR BUILDINGS
 CertainTeed NOISE CONTROL FOR BUILDINGS Guidelines for Acoustical Problem Solving 1 The technology of noise control both inside and outside buildings is well developed today. The problem is that it is
Optimizing Ceiling Systems and Lightweight Plenum Barriers
 Optimizing Ceiling Systems and Lightweight Plenum Barriers Gary S. Madaras, ROCKFON, Chicago, Illinois Andrew E. Heuer, NGC Testing Services, Buffalo, New York Acoustics is one of the lowest scoring indoor
From: Tyler Adams, Mei Wu Acoustics
 Experts in acoustics, noise and vibration To: Jim Inglis, Stanford University John D. Donahoe, Stanford University Doug Sams, ZGF jinglis@stanford.edu jdonahoe@stanford.edu doug.sams@zgf.com From: Tyler
Equipment Noise Sources
 MECHANICAL AND ELECTRICAL* EQUIPMENT NOISE CONTROL Three elements of concern: source path receiver *the electrical part may be premature, but that s OK Ball State Architecture ENVIRONMENTAL SYSTEMS 2 Grondzik
ACOUSTICAL TREATMENT OF EMERGENCY POWER GENERATOR. Dr. M.Abd El Gawad Saif
 ICSV14 Cairns Australia 9-12 July, 2007 ACOUSTICAL TREATMENT OF EMERGENCY POWER GENERATOR Dr. M.Abd El Gawad Saif Housing & Building National Research Center, Dokki, Giza, Egypt msaifeldin2002@yahoo.com
Presented By: Jim O Neill. Acoustics
 Presented By: Jim O Neill Acoustics Topics STC and IIC 101 Sound in floors Sound in walls Noise In Multifamily Measurements of Noise Two ASTM Standards STC Sound Transmission Classification Measurement
What is Noise? In daily life, noise means unwanted sound.
 NAME PIYUSH ZINZALA DHAVAL KARKAR JEEGAR VARIYA YASH BANKER CHINTAN BAROT ROLL NO. 14SA162 14SA122 14SA134 14SA180 14SA120 What is Noise? In daily life, noise means unwanted sound. As you have no doubt
Quiet in the classroom Enhancing the learning environment through better acoustics
 CEILING&WALL SY ST EM S B e t w e e n u s, i d e a s b e c o m e r e a l i t y Quiet in the classroom PA G E O N E On any given school day, thousands of students across the country are unable to understand
RC CHANNEL ACOUSTIC ASSEMBLY
 RC CHANNEL ACOUSTIC ASSEMBLY FLOOR/CEILING ASSEMBLY DIRECT FIX TO TJI DSA TJI rc channel FSTC 53 FIIC 44 PAC INTERNATIONAL CONSTRUCTION * Hardwood Flooring * 1/2" Plywood Fire resistance ratings * 1-1/2"
Equipment Noise Sources
 MECHANICAL AND ELECTRICAL EQUIPMENT NOISE CONTROL Ball State Architecture ENVIRONMENTAL SYSTEMS 2 Grondzik 1 Equipment Noise Sources Chillers Pumps Cooling towers Exhaust fans Air-handling units (fans)
CJ Buma. To: Steelform Building Products Inc. Wednesday, 2007 May Avenue Edmonton, AB, T6B 2V2. Attn: Mr.
 To: Steelform Building Products Inc. Wednesday, 2007 May 7 4104 69 Avenue Edmonton, AB, T6B 2V2 Attn: Mr. Marty MacDonald aci Acoustical Consultants Inc. Suite 107, 9920-63Ave Edmonton, Alberta, Canada
Numerical prediction and experimental validation of sound transmission loss for different acoustic materials
 J. Build. Mater. Struct. (2018) 5: 95-101 Original Article DOI : 10.5281/zenodo.1297183 Numerical prediction and experimental validation of sound transmission loss for different acoustic materials Kirti
Acoustic Management of Library Fishbowls
 Acoustic Management of Library Fishbowls A Senior Project presented to the faculty of the Materials Engineering Department California Polytechnic State University, San Luis Obispo In Partial Fulfillment
Innovations In Sound Control
 Innovations In Sound Control by Bonnie Schnitta New materials and techniques make it easier to manage noise in home theaters and other loud spaces When I formed my acoustical consulting company in 1981,
Delia Chamberlain, Vice President, Kolay Floors Steve Hedback and Joel Esselstrom, SSA Acoustic, LLP
 SSA Acoustics LLP 222 Etruria St, Suite 100 Seattle, WA 98109 Office: (206) 839-0819 TO: FROM: DATE: May 24, 2017 Delia Chamberlain, Vice President, Kolay Floors Steve Hedback and Joel Esselstrom, SSA
Design of a standalone, modular test facility for measuring sound transmitted through a common ceiling plenum
 Design of a standalone, modular test facility for measuring sound transmitted through a common ceiling plenum Edward A. BARCLAY 1 ; Robin R. WAREING 2 ; John R. PEARSE 3 1, 2, 3 University of Canterbury,
Innovations in Acoustical Ceilings for Today's Flexible Interiors
 Innovations in Acoustical Ceilings for Today's Flexible Interiors Comprehensive Acoustical Quality for Offices, Healthcare Facilities, and Classrooms Course Number K1504W A Credit Designation: HSW Learning
Noise and Vibration Control in Wood-Framed, Multi-Family Buildings
 Noise and Vibration Control in Wood-Framed, Multi-Family Buildings Presented by Scott Harvey, PE, INCE Bd. Cert. Disclaimer: This presentation was developed by a third party and is not funded by WoodWorks
Acoustic Performance
 Acoustic Performance From LEED: BD& C for Schools IEQ P3 Requirements: Design classrooms and other core learning spaces to include sufficient sound-absorptive finishes for compliance with the reverberation
Highway Traffic Noise
 Page 1 of 5 Highway Traffic Noise Noise Barrier Design - Visual Quality Highway Traffic Noise Barriers at a Glance Highway traffic noise barriers: can reduce the loudness of traffic noise by as much as
Freedomd From Distraction
 A C O U S T I C S Freedomd From Distraction n I UNDERSTANDING THE ACOUSTICS OF OPERABLE WALLS SOUND IS... 1. Generated In specifying operable partitions or planning multi-use space for your facility, no
Accutone2 Music Practice Rooms A Complete Range of High-Performance Music Practice Rooms
 Practice Rooms A Complete Range of High-Performance Practice Rooms Provides optimum acoustic rehearsal space Modular design allows relocation if required Glazed doors Silent ventilation 12 standard colors
Experimental study of sound insulation performance in the wood-framed building
 Experimental study of sound insulation performance in the wood-framed building Atsuo HIRAMITSU Research Engineer Building Research Institute Ibaraki, Japan Hirotsugu HOUNO Director Japan 2x4 Home Builders
Evaluation of a Modern Catholic Church by Acoustical Software Based on the Ray-Tracing Method
 rychtarikova.qxd 11.8.2004 20:52 StrÆnka 21 RECEIVED 5. 6. 2003 ACCEPTED 15. 12. 2003 M. RYCHTÁRIKOVÁ, M. MUSABUDA, F. OHRABLO Evaluation of a Modern Catholic Church by Acoustical Software Based on the
Ceiling Systems: Overhead Investments Preliminary selection guide for lay-in panels
 Ceiling Systems: Overhead Investments Preliminary selection guide for lay-in panels by Michael Chusid, RA, FCSI, CCS Photo @ Chun Lai Photography CEILINGS ARE ONE OF THE MOST VISIBLE ARCHITECTURAL SURFACES
IntelliPak Ton and IntelliPak II Ton Rooftops
 IntelliPak 20-130 Ton and IntelliPak II 90-150 Ton Rooftops Subject: Indoor Sound Issued by: Clarksville Large Commercial Unitary June 2008 RT-PRB022-EN Table of Contents Engineering Bulletin....................................................
Jim Huber, NEBB Vice President and President of Complete Commissioning
 October 14, 2014 Jim Huber, NEBB Vice President and President of Complete Commissioning Jim Huber is the President of Complete Commissioning. He has over 29 years of industry experience, is a Certified
Standard Practice for Architectural Application and Installation of Operable Partitions 1
 Designation: 93 Standard Practice for Architectural Application and Installation of Operable Partitions 1 This standard is issued under the fixed designation ; the number immediately following the designation
NEW FROM AMF THERMATEX Alpha ONE THERMATEX Alpha HD
 6/21 PERFORMANCE CEILINGS More scope for innovation NEW FROM AMF THERMATEX Alpha ONE THERMATEX Alpha HD SOUND ABSORPTION SOUND REFLECTION SOUND INSULATION THERMATEX ACOUSTIC CEILING RANGE ABSORPTION, INSULATION
Standard Practice for Installing Sound-Isolating Lightweight Partitions 1
 Designation: E 497 99 Standard Practice for Installing Sound-Isolating Lightweight Partitions 1 This standard is issued under the fixed designation E 497; the number immediately following the designation
Sound Insulation for Glass and Panel
 SEMINAR ON TESTING AND CERTIFICATION OF GREEN CONSTRUCTION MATERIALS Sound Insulation for Glass and Panel Ir Dr CHONG Fan HIGHLIGHTS 1. Sound insulation of building construction 2. Sound insulation tests
Wall and Floor/Ceiling Assemblies
 Introduction Catalog of STC and IIC Ratings for Wall and Floor/Ceiling Assemblies Russell B. DuPree Office of Noise Control, California Department of Health Services Berkeley, California 94704 building
1. Acoustic Panels. Building & Construction Catalog. October 2014 Addicional info on
 1. Acoustic Panels Building & Construction Catalog. October 2014 Addicional info on www.vicoustic.com 1. Acoustic Panels In Vicoustic s Building & Construction Line you can find a variety of products specially
LEED for Homes Approved ID Request:
 LEED for Homes Approved ID Request: Introduction The following is an Innovative Design Request (IDR) that has been approved for broader use in for the LEED for Homes program. This credit should not be
Acoustic problems. unfinished ceilings. increased use of glass. hard reflecting surfaces
 Acoustic Guide Acoustic problems unfinished ceilings increased use of glass hard reflecting surfaces open areas Current interior space trends can lead to increased noise problems. Unfinished ceilings
Functions of Finish Ceilings. Play a part in the visual expression of the room. Controls diffusion of light and sound in the room
 Finish Ceilings Functions of Finish Ceilings Play a part in the visual expression of the room Controls diffusion of light and sound in the room May play a role in preventing the passage of sound vertically
Airbourne Sound Transmission Test
 Airbourne Sound Transmission Test 1.0 INTRODUCTION AND TEST RESULTS SUMMARY This National Acoustic Laboratories were commissioned by Modular Wall Systems to measure the acoustical transmission loss of
NOISE IN HIGH RISE BUILDINGS
 NOISE IN HIGH RISE BUILDINGS Ross H. Palmer CPEng RPEQ Principal Palmer Acoustics (Australia) Pty Ltd ross@palmeracoustics.com Noise in high rise buildings has traditionally not been considered an issue,
2. Manufacturer ESSI Acoustical Products Company Berea Road Cleveland, OH Product Description. Acoustic room components
 1. Product Names ESSI Absorber Panels ESSI Pyramid-Shaped Diffuser Panels ESSI Radial Reflector Panel ESSI Flat Reflector Panel 2. Manufacturer 10271 Berea Road Cleveland, OH 44102 Phone: (800) 886-6678
Acoustic Design, Rooms for Speech
 Acoustic Design, Rooms for Speech Jon Farren Marshall Day Acoustics, Sydney, jfarren@marshallday.com.au Nonrefereed Ever been at a lecture or conference and found it difficult to understand what is being
Acoustical Engineering Solutions
 Acoustical Engineering Solutions Noise & Vibration Control in Wood Framed, Residential Structures By Scott Harvey, PE, INCE Bd. Cert. Phoenix Noise & Vibration Frederick, Maryland Copyright Materials This
The acoustical environment in and around buildings is COPYRIGHTED MATERIAL. Introduction to Architectural Acoustics and Basic Principles.
 chapter1 1.1 INTRODUCTION Introduction to Architectural Acoustics and Basic Principles WILLIAM J. CAVANAUGH The acoustical environment in and around buildings is influenced by numerous interrelated and
ICF/Building System FSTC Test Report
 REP ICF STC test.doc 1of5 2003 03 12 C/o Michel Philippe IntegraSpec Insulating Concrete Forms (ICF) Building System By: Phil-Insul Corporation 735 Arlington Park Place, 11U Kingston, ON, K7M 8M8 TEL:
Proceedings of Meetings on Acoustics
 Proceedings of Meetings on Acoustics Volume 2, 213 http://acousticalsociety.org/ 166th Meeting of the Acoustical Society of America San Francisco, California 2-6 December 213 Session 3aEDa: Education in
PROVEN, RELIABLE SOUND CONTROL COST EFFECTIVE SOLUTION FOR WALLS/CEILINGS MULTI-FAMILY, SINGLE FAMILY, HOME THEATER
 SOUND ISOLATION SOLUTIONS PROVEN, RELIABLE SOUND CONTROL COST EFFECTIVE SOLUTION FOR WALLS/CEILINGS MULTI-FAMILY, SINGLE FAMILY, HOME THEATER Model A237R Thermoplastic rubber with no metal washer or ferrule;
CASE STUDY OF THE SOUND REDUCTION OF VARIOUS RESIDENTIAL GLAZING TREATMENTS
 Abstract CASE STUDY OF THE SOUND REDUCTION OF VARIOUS RESIDENTIAL GLAZING TREATMENTS Greg Barry 1, Darren Jurevicius 2 and Matthew Stead 3 1 Resonate Acoustics, Adelaide SA 5082, Australia Email: greg.barry@resonateacoustics.com
Identifying impacts of amplified sound in commercial spaces below residences in mixed-use buildings
 Identifying impacts of amplified sound in commercial spaces below residences in mixed-use buildings Tyler Adams a) Mei Wu b) Mei Wu Acoustics 3 Twin Dolphin Drive, Suite 190, Redwood City, CA 94065-1516
Fabric detail available in any of these standard options. Timber finishes available in any of these standard species
 AP1 Acoustic Wall Panel These are highly effective acoustic treatment solutions for rooms where 'full' cover treatments are not desirable or affordable. They offer a high performance solution to the control
ACOUSTICS DESIGN IN AUDITORIA: THE CASE OF THE LRC AT CUEA
 ACOUSTICS DESIGN IN AUDITORIA: THE CASE OF THE LRC AT CUEA A paper presented at The 5 th East African regional workshop on 13 th & 14 th August 2014 at the Department of Architecture & Building Science,
Sound & Vibration Commissioning STUART MCGREGOR, PE ENGINEERING DYNAMICS, INC.
 Sound & Vibration Commissioning 1 STUART MCGREGOR, PE ENGINEERING DYNAMICS, INC. 2 Sound and Vibration: Maintaining Tenants Spaces and Building Mechanical Systems 22 August 2018 Speaker 3 Stuart McGregor,
ARCHITECTURAL AND STRUCTURAL NOISE CONTROL SOLUTIONS
 13080/KIN BuyLine 1062 Providing solutions to common noise and vibration problems since 1958. ARCHITECTURAL AND STRUCTURAL NOISE CONTROL SOLUTIONS IIC 51 STC 72 FLOOR/CEILING STC 84 IIC 70 FLOOR/CEILING
Effect of implementation quadruple glazing panel into the walls on the airborne sound insulation of building facades
 Effect of implementation quadruple glazing panel into the walls on the airborne sound insulation of building facades Pavel Drabek 1,* 1 Tomas Bata University in Zlin, Faculty of Applied Informatics, Department
Sound Control Solutions in Floor/Ceiling Assemblies
 Sound Control Solutions in Floor/Ceiling Assemblies Controlling sound becomes more important every day. At SAMfloors, it is our mission to provide elegant, functional sound control solutions to meet the