Silviculture Survey Procedures Manual
|
|
|
- Cameron Norman
- 6 years ago
- Views:
Transcription

1 RESOURCE PRACTICES BRANCH Silviculture Survey Procedures Manual -Regen Delay, Stocking and Free Growing Surveys - plus Alternative Survey Methodologies April 1,
2 This version of the Silviculture Surveys Procedures Manual was edited and produced by: Ministry of Forests, Lands and Natural Resources Operations - Resource Practices Branch, March 6,
3 Table of Contents X 1 Introduction Manual Organization Stand Structures Background Legislative Requirements FPC versus FRPA to a surveyor FPC or FRPA Survey Data Submission Requirements - RESULTS - Information Submission Specifications Forest Practices and Range Act Forest Planning and Practices Regulation Woodlot Licence Planning and Practices Regulation Forest Practices Code Guidebooks Survey Principles Survey Timing Regeneration Delay Survey Timing Stocking Survey Timing Free Growing Survey Timing Preparing for a Survey File Review Silviculture Plans and Prescriptions Backlog Standards - Pre-1987 Stands with No Silviculture Plan or Prescription Preliminary Stratification Regeneration Delay Surveys Well Spaced Trees Definition Advance Regeneration Definition Free Growing Surveys Free Growing Definition Guidance Procedures for the Assessment of Vegetation Competition in Conifer Managed Stands Maximum Density Site Index Methods to Determine Site Index Basal Area (BA)
4 3.7 Dispersed Types Walk-through Field Stratification Ecological Classification SU Mapping Variation Preliminary Assessment of Forest Health Factors Site Index Determination Method Potential Treatments Minimum Stratum Size Sampling Principles Survey Objective Sampling Intensity Plot Radius and Plot Multiplier M-value Tallying in Excess of the M-value Sampling Methods Field Marking Procedures Point of Commencements Marking Plots Strip Lines Amendments Field Data Collection Data Field Descriptions for the Front of the Ministry of Forests FS 657 Card Data Field Descriptions for the Back of FS 657 card Silviculture Survey Plot Card of the Ministry of Forests - FS Suggested Allowable Errors in Measurement Forest Health Data Compilation Data Field Descriptions for the Ministry of Forests FS Statistics Treatment Recommendations Reports Inventory Label - Polygon Silviculture Label - SU Alternative Survey Methodologies Survey Methodology Selection Matrix
5 9.2 Complex Vertical Structure Survey Methodologies Multi storey Survey Layered Survey Deviation from Potential Survey (DFP) - Interior Single Entry Dispersed Retention (SEDRSS) Survey Boreal Mixedwood Stand Structures Survey NI Forest Region Complex Horizontal Structure Survey Methodologies Even-aged Clustered Stand Structures Survey Intermediate Cuts Commercial Thinning Survey (Openings without regeneration objectives) Coastal Mixedwood Stand Structure Survey Coastal Forest Region Clearcut with Reserves Survey Data Small Scale Harvested Openings Survey Small Scale Salvage (SSS) or Helicopter Harvested Units Other Alternative Survey Methodologies Green-up (Adjacency) Survey Use of Planting Quality Inspection plots (FS 704) to meet Regen Delay Declaration Survey Use of Juvenile Spacing Quality Inspection plots (FS 749) to meet Free Growing Declaration Survey Provincial Accreditation and Training Appendices Appendix 1: Glossary Appendix 2: Determining area of dispersed strata Appendix 3: List of References and Hyperlinks Acts Regulations Guidebooks Field Cards FORREX - Stand Establishment Decision Aids (SEDA) Training Materials Policies and Other Documents Land Management Handbooks FRDA Handbooks Miscellaneous Publications Appendix 4: Using a Prism
6 Appendix 5: Magnetic Declination and Annual Change Appendix 6 Forest Cover Map Legend A 6.1 New Forest Cover Label A 6.2 Old Forest Cover Legend Appendix 7: Table of Age Corrections for Boring Height Appendix 8: Ministry of Forests Field Cards and Forms Appendix 9: Crown Closure Comparative Diagrams Appendix 10: FS660 Silviculture Reference Card (Nov. 2014) Appendix 10a: Stand Development Monitoring (SDM) Damage Criteria for Even-aged (Age Class 2 and 3) Coniferous Trees Appendix 10b: Free-Growing Damage Criteria for Even-Aged (Age Class 1) Coniferous Trees (rev. 6, July 2014) Appendix 11: Broadleaf Forest Health Free-Growing Damage Criteria as a supplement to the FS 660 (Oct 2011) Appendix 12: GPS Application in Silviculture Surveys Appendix 13: Local Geographic Free Growing Competition Assessment Criteria A 13.1 Coast Area FG Guidance A 13.2 North (Northern Interior) Area FG Guidance A 13.3 South (Southern Interior) Area FG Guidance A South Area Williams Lake, Quesnel and 100 Mile TSA's (SBPSmk, SBPSdc, SBSdw1, SBSdw2, IDFdk3, and IDFdk1 only) Alternative FG Guidance Appendix 14: Guidance Matrix for reporting Retention Openings into RESULTS
7 1 Introduction This manual has been prepared by the Resource Practices Branch as a reference for data collection and compilation of stocking and free growing surveys as well as the associated sub-surveys such as plantability, brushing and forest health surveys. There are no explicit legislated survey requirements, to use the procedures outlined in this manual, but there are reporting requirements for licensee obligations. These survey procedures will provide the necessary guidance to meet the legislated reporting requirements. Concepts believed to be best practices but not necessarily required by legislation have been highlighted using a box like this. Recently revised subjects and commonly misunderstood issues have been highlighted using a box like this. In summary, there is no obligation to follow the procedures described in this manual. However, for the purpose of measuring the successful achievement of an obligation, the results reported by a licensee must be consistent with the results that would be reached by the procedures described here. Survey methods and stocking standards contained within an approved Forest Stewardship Plan (FSP) take precedence over the guidance methodologies provided herein. Signed survey contracts also take precedence. Variations from this procedures manual are acceptable if the outcomes resulting from the alternative methods are the same as those that would be found using the guidance in this document. 1.1 Manual Organization This document has been grouped into sections relative to different stand structures possibly encountered by a surveyor: Sections 1 to 6 Sections 7 to 8 Section 9.0 Section 9.2 Section 9.3 Fundamentals of Silviculture Surveying - Common to all survey designs and methodologies. Standard Clearcut Even-aged Stand Structure - Data collection and data compilation using standard MoFLNRO field cards. Alternative Survey Methodologies Complex Vertical Stand Structure Multi-Storey (uneven-aged) Survey; Layered (even-aged); Deviation from Potential (DFP even-aged) and Single Entry Dispersed Retention Stocking Standard (SEDRSS - even-aged); Boreal Mixedwood Survey (even-aged). Complex Horizontal Stand Structure Even-aged Clustered Stands; Intermediate Cut Commercial Thinning; Clearcut with 7
8 Reserves; Small Scale Harvested Openings; Coastal & Interior Mixedwood Patch Mixtures. 1.2 Stand Structures The following is a summary of illustrations found throughout the document that depict the type of Stand Structure relative to the survey methodology described in each corresponding section. I) Standard Clearcut Even-aged Stand Structure II) Complex Vertical Stand Structure Multi-storey Uneven-aged Layered Even-aged Layered & Deviation From Potential (DFP) Boreal Mixedwood Intimate Mixture III) Complex Horizontal Stand Structure 8
9 Even-aged Clustered Intermediate Cut Commercial Thinning Coastal & Interior Mixedwood Patch Mixtures Clearcut with Reserves Illustration 1: Stand Structures relative to survey methodologies Efforts have been made to write the first 8 Sections of the manual to correspond with the chronological sequence in which surveys are conducted, from the office preparation to the final survey summary report that is submitted to the Ministry of Forests, Mines and Lands. This document contains numerous links to additional references found on the Internet or within this document. These are formatted in blue and underlined. The Silviculture Survey Procedures Manual will be subject to on-going review by ministry and non-ministry survey experts, and will continue to be updated as survey methods improve. Your suggestions for improvements to this manual can be sent to the Forest Practices Branch Provincial Silviculture Surveys Specialist. 1.3 Background Each year, silviculture surveys are conducted on approximately one million hectares of crown land. In terms of hectares treated, silviculture surveys exceed the hectares of all other silviculture activities combined. On a per hectare basis, silviculture surveys are one of the lowest cost silviculture activities. This, however, does not mean that they are of little value. Surveys costing relatively few dollars per hectare provide the information necessary to prescribe silviculture treatments costing hundreds of dollars per hectare. Silviculture surveys assemble the baseline information required to develop and implement effective silviculture programs. They are an essential element in the confirmation of completed silviculture obligations and may also be used in assessment of 9
10 due diligence with respect to achievement of free growing obligations. The silviculture survey is the tool used to measure the achievement of stated objectives. Survey information may be used for planning treatments, conducting resource analyses, preparing annual reports, conducting audits, or monitoring compliance with silviculture plans or prescriptions. Forest managers are using this information increasingly, as the input data for growth projection models. Survey data can also be used to update longterm history files for openings and forest cover maps. Accuracy and consistency in conducting surveys is vitally important. Poor or incorrect data collection can result in improper treatments being recommended and completed, or lead to incorrect land status classification. Consistency is required to allow comparisons to be made between blocks, licensees and districts. Standardized concepts ensure the survey system remains consistent and predictable. They also allow comparison between standards and current conditions as well as between openings and licensees. Deviation from standardized concepts may be discussed in individual plans or contracts. Where no specifics are discussed, standardized concepts should be used. Update Maps & Databases Found to be SR Declare Free Growing Conduct Treatments Found to be NSR Continued Growth Schedule Next Next Survey r &/or vey and or Treatment Found to be not Free Growing Submit Report 5.Prepare Report Begin With 1.Office Review Create Treatment Recommendations Identify Parameters and Standards 2.Walkthrough Identify Final Limiting Stratification Factors 3.Gather Data 4.Summarize Data Preliminary Stratification Select survey objective(s), method and intensity Identify Final Limiting Stratification Factors Figure 1: Conceptual flow of the silviculture survey process The inner/blue line represents stocking surveys and the outer green line represents free growing surveys. The larger/red text represents the 5 steps in the survey process. Within the last three decades forest legislation in British Columbia is best described as evolving. Surveyors have operated within seven broad eras and are currently in a transition into the seventh. With the addition of each era the role of a silviculture surveyor becomes more complex. 10
11 Silviculture surveys are based on standards that may have been created many years in the past. The silviculture plan or prescription covering an opening is legally binding until the requirements contained within it are met or amended by mutual agreement. This means a Pre-Harvest Silviculture Prescription created in 1987 is still in effect until its standards are met, amended or replaced with approved FSP or Woodlot Licence Plan (WLP) standards. Surveyors must understand the terms and implications of the older documents even though current standards may be quite different. Stocking standards, regardless of the document they are contained within, state the reforestation requirements. This manual provides a description of the methods used to measure the achievement of these standards. For the purpose of simplicity in this manual reference is made to the collective set of documents that provide stocking standards and reforestation objectives as the silviculture plans and prescriptions. The various eras are: Pre January 1, 1982 With a few exceptions, before 1982, persons who harvested on provincial forest land had no obligation to reforest. The Ministry of Forests managed the reforestation activities. January 1, 1982 to October 1, 1987 With a few exceptions, before October 1, 1987, persons who harvested on provincial forest land had no obligation to reforest. This era is complicated in that there was an expectation for the licensees to manage the reforestation activities, but for the Ministry of Forests to fund the activities. October 1, 1987 to April 1, 1994 Licence holders were obligated to create a Pre Harvest Silviculture Prescription (PHSP) stating the harvesting and reforestation objectives. All reforestation activities were managed and funded by the licensee. April 1, 1994 to June 15, 1995 The Silviculture Regulations were reformulated and renamed the Silviculture Practices Regulation. The PHSP became the Silviculture Prescription (SP). June 15, 1995 to December 17, 2002 Forest management activities were directed by The Forest Practices Code, and its more than a dozen regulations and many guidebooks. November 30, 1998 to present For woodlot licensees only, silviculture prescriptions were replaced by woodlot site plans and default standards in accordance with the new Woodlot Licence Forest Management Regulation. Transition period from the Forest Practices Code to the Forest and Range Practices Act depended on the expiration date of an individual woodlot license s Forest Development Plan. 11
12 December 17, 2002 to January 31, 2004 The Silviculture Prescription changed to the Site Plan within this period but operations continued under the Forest Practices Code. In this era stocking standards may have migrated into the Forest Development Plan in the form of Silviculture Regimes. January 31, 2004 to present The current era is under the Forest Practices and Range Act and its regulations. Much of the content and intent found in the Forest Practices Code was forwarded into the Forest and Range Practices Act. There were transitional periods that lead to full implementation as of effect January 1, For woodlot licenses only, site plans are not a legal requirement as stocking standards are described in the Woodlot Licence Plan. Full implementation to the Forest and Range Practices Act depends on the expiration date of an individual woodlot license s Forest Development Plan. 1.4 Legislative Requirements The discussion that follows should be considered as general guidance and discussion. This should not be construed to be legal interpretation FPC versus FRPA to a surveyor Openings being held by a licensee can still be under two types of legislative umbrella: either still under the Forest Practices Code (FPC) or they can be under Forest Range and Practices Act (FRPA) and the corresponding regulations - Forest Planning and Practices Legislation (FPPR) or Woodlot Licence Planning and Practices Regulation (WLPPR) Openings under FPC: These would be openings that are still linked with a Forest Development Plan (FDP) and Silviculture Prescription (SP) or woodlot site plan under the FPC. A licensee can still opt to retain their obligations under these approved plans, up to relief of their obligations. These openings must be surveyed to the stocking standards as outlined in these documents. However, the methodology does not need conform to procedures outlined in this manual. That aspect of the FPC was removed when FRPA was passed. As well the content required to be submitted with a declaration of a FPC opening now must correspond with the data requirements as expected from FRPA openings Openings under FRPA: These would be openings that are new cutblocks established under the umbrella of an approved Forest Stewardship Plan (FSP) or Woodlot Licence Plan (WLP), and/or old FPC openings where the FSP specified, either the specific blocks FRPA standards would be applied to, or a process for FRPA standards to be applied to blocks with an FPC 12
13 obligation.. Therefore these openings will be surveyed to the stocking standards outlined in the FSP or WLP. As well, there is no requirement that the field procedures and methodologies in this manual be adhered to by the surveyor. The only requirement is as above, that the data submitted by the licensee conforms to the content required FPC or FRPA Survey Data Submission Requirements - RESULTS - Information Submission Specifications The survey data submission requirements outlined in this manual are consistent with the requirements for RESULTS submissions. Refer to the RESULTS website for a detailed discussion on Results submissions. This direction is empowered in FPPR by section 97 (7) - "a written declaration...for the regeneration date or free growing date include a forest cover inventory" " and in WLPPR by section 75 (3)... must carry out a survey... on or before free growing date, identifying... the forest cover inventory.. The definition of forest cover and authority to define the content of these labels is in FPPR section 1-" includes information required by the minister". This definition also applies to the WLPPR in accordance with WLPPR section 1 (1). This authority has been delegated to the Chief Forester's signature Forest Practices and Range Act In its most simplistic form, the Forest and Range Practices Act, requires the establishment of a free growing stand. The Planning and Practices Regulation and the Woodlot Licence Planning and Practices Regulation requires a forest inventory be completed. This inventory, simply by the nature of the required timing, is the stocking and free growing surveys for most licenses and the free growing survey only for woodlot licenses. These are a few relevant highlights of FRPA that guide silviculture surveys: Part 1defines the terms of forest practice and a free growing stand. Part 2 includes a discussion of Forest Stewardship Plans (sec 3 and 5), Site Plans (sec 10) and Woodlot Licence Plans (sec 13). Part 3, sections discuss forest health and pests on Crown and private land. Part 3 sections 29 and 30 discuss the subject of free growing stands. Here the requirement to establish a free growing stand is established for 4 groups: major licence holders, timber sales manager, woodlot licence holders and nonreplaceable licence holders. The use of suitable seed is required. Part 3 section 31 is to ensure that seed use conforms to the prescribed requirements. Part 7 section 107 discusses declaration of obligations. Section 107 (5) (b) indicates the District Manager must not give written notice that an obligation has 13
14 not been met unless he/she has determined the stand is under threat from competing vegetation or forest health factors or is unlikely to remain free growing without a further treatment. Part 9 Section 157 states The Lieutenant Governor in Council may make regulations respecting silvicultural systems and silviculture treatments. Part 9 section 169 provide the Chief Forester authority to, among other things, make standards regarding tree seed and stocking standards. Part 11 - The Transition, section 177 defines silviculture plans and prescriptions as the collective term for pre-harvest silviculture prescriptions, silviculture prescriptions and site plans Forest Planning and Practices Regulation In Section 1 a number of terms are defined such as standards units, stocking standards, regeneration date, free growing date, forest health factors, net area to be reforested, primary forest activity and silviculture treatment. One that is of particular importance to silviculture surveyors is forest cover inventory. This means a survey of trees and treerelated matters in an area that includes information required by the minister. Section 16 deals with stocking standards in a forest stewardship plan. Section 26 discusses the Minister's consideration of stocking standards (i.e., approval tests). Section 34 describes the content requirements for site plans. Section 43 describes the use of seed. Sections 44, 45 and 46 discuss free growing stands. Sections describe the requirements for annual reporting. The timing of the requirements is noteworthy. Each report covering the period of April 1 through March 31 of each year is due before June 1 of each year. Section 87 describes the details of reporting and mapping. Sections 97 and 97.1 discuss declarations. Section 111 deals with amalgamating obligations to establish a free growing stand. Schedule 1 section 6 discusses factors relating to stocking specifications Woodlot Licence Planning and Practices Regulation This regulation only applies to woodlots. All relevant terms are defined in Part 1. 14
15 Sections 8, 9, 34 and 35, describe the requirement to produce a Woodlot Licence Plan, map, objectives, free growing stands and stocking standards. Section 12 deals with stocking information for specified areas. Section 13 discusses alternative performance requirements. Section 33 covers pre harvest mapping. Section 75 identifies surveys are specifically required. Section 76 states annual reports are required before April 30 of each year. Section 84 discusses declarations. 1.5 Forest Practices Code Guidebooks With the transition from the Forest Practices Code era to the current Forest and Range Practices era the status of the Forest Practices Code Guidebooks has been reduced. The Guidebooks are not referenced in legislation, therefore there is no legal obligation to follow the advice provided within them. However, they were created by individuals knowledgeable of the subjects discussed. They form a collection of advice, suggested procedures and reference sources that continues to be valuable. The term of best practices has been used to describe them. Most are still available online. Links to Guidebooks are provided in Appendix 3. 2 Survey Principles The survey methods in this manual have been carefully developed to promote a balance between the costs of performing surveys and the level of risk of making a wrong decision as a result of inconclusive data collected. In this version, under Section 7, advice is provided as to the relative importance of each data item found on the survey plot cards. The basic survey principles are based on an understanding of: a licensee s freedom to manage the forest resource (within the context of their licence agreement and the legal framework); a licensee s responsibility to meet stated reforestation objectives; reporting requirements (RESULTS); the role of the Professional Forester and Registered Forest Technologist; and the role of compliance and enforcement activities regarding milestone obligations of licensees. The process of conducting most silviculture surveys has five steps: 15
16 1. Office review: Preparing for the survey; reviewing currently available information, included especially the silviculture plan or prescriptions and its associated approved amendments; preliminary stratification; acquiring and analyzing air or ortho photos, and reviewing historic activities. 2. Walk-through of each stratum: Identifying the location of standards units from the silviculture plans and prescriptions on the opening; stratifying these into like populations and strata within the standards units; determining the survey objectives, methods and intensity; determining the site index method; identifying the leading and second species in the inventory label; and listing preliminary treatment recommendations. 3. Data gathering for each stratum: Finalizing the survey design, sampling methodology and intensity; Collecting the data within each standards unit and stratum. 4. Summary of each stratum: Summarizing the data, by calculating statistics where applicable; preparing inventory label and silviculture labels; and preparing treatment recommendations. 5. Reporting of each stratum: Submitting forest cover, label and map data into RESULTS. This manual allows flexibility within the bounds of standard principles that make up the silviculture survey procedures. Alternate survey methods that can produce significantly similar results are acceptable. Consistent and accurate data collection, summarization, data analysis and treatment recommendations is essential. The forest professional who submits reports based on poor survey data is held professionally accountable for his or her actions. 2.1 Survey Timing Survey timing is an issue usually left to the manager of the silviculture program for a licensee, but it is also useful for individual surveyors to have an understanding of the issue. Silviculture plans or prescriptions usually specify the regeneration date, may have an early free growing date and will always have a late free growing date. Usually these are expressed in terms of the number of years following the commencement of harvest to attain a stocked or free growing stand. The accuracy of the regeneration date and free growing date requirements is assumed to be to the month where a specific date is not available or accurate. This is relevant since there are known errors within the various corporate databases. Often the 1 st or 15 th or 30 th day has been entered as a default value. It is also necessary to redefine the terms used to describe the various survey types or names to ensure consistency. The survey used to prove that the regeneration requirements have been met will be referred to as the Regeneration Delay Survey. This distinction is important 16
17 since the definition of a well spaced tree is strictly applied. This definition is dramatically different than has been used in previous years. Intermediate surveys, conducted after the regeneration obligation has been met and before the free growing survey proves the stratum to be free growing will be called the Stocking Survey. Its objective is to reassess the stocking status, need for treatments (fill plant, brushing, spacing), and monitor the progress of the young stand toward meeting the free growing requirements. The Free Growing survey is undertaken when it is likely that the survey will find that the stand meets the free growing requirements. Early free growing date* 1 Time Commencement of harvest Regeneration date Free growing date *2 or Free growing Height *1 Not all silviculture plans and prescriptions have an early free growing date. *2 For openings managed under FRPA free growing heights represent a surrogate to the Early Free Growing Date. Figure 2: Reforestation timeline Regeneration Delay Survey Timing The terminology used by forest managers and surveyors is refined with the clarification of the regeneration delay survey. This survey used to prove that the regeneration requirements have been met, will now be referred to as the regeneration delay survey. Previous terms were stocking surveys and regen surveys. This clarification is necessary as a result of the redefinition of a well spaced tree. Regeneration delay surveys must be completed on or before the regeneration date. Woodlot licensees are the exception they must establish a stand that conforms to the applicable stocking standards by the regeneration date but are not required to complete a survey. The regeneration delay survey can be effectively completed at any snow free time of year. Where the presence of vegetation makes small trees difficult to locate, it will be advantageous to schedule regeneration delay surveys for early spring, or late fall, after leaf fall but before snowfall. This will reduce the likelihood of missing trees during data collection. However, on some sites it may be desirable to do the survey during leaf out to 17
18 prove regeneration requirements have been met and properly evaluate vegetation competition. Openings that have silviculture plans and prescriptions containing an early free growing date will benefit from conducting the regeneration delay surveys as soon as possible. This will allow the licensee to apply the sliding rule to their maximum benefit. Surveys that will be used to report meeting the regeneration obligation should be scheduled with some pre-consideration. An area harvested in late winter, may be still snow covered on the anniversary of the commencement of harvesting. Practically, this means the regeneration delay survey will have to be completed before winter. Where harvesting completion has been delayed, it may be best to complete the survey at the time of planting (i.e. in conjunction with post-planting inspection). See Using the Planting Quality Inspection FS 704 to report regeneration obligation met. Example: An opening in which the harvesting began on February 15th 2004, has a four year regeneration delay. The District Manager is expecting the licensee to prove that the opening is satisfactorily restocked before the end of February Given the typical winter snow conditions over most of the province, the last reasonable time to complete the regeneration delay survey will be fall of Leaving the survey to this late date leaves the licensee at some risk. What if the area is not sufficiently restocked? There is no practical way to remedy the problem in time to meet the deadline Stocking Survey Timing The stocking survey is any non-reportable intermediate survey that is intended to assess the progress of an opening toward meeting the free growing requirements. Historically there have been a few terms to describe these surveys: regen survey, stocking/free growing surveys, regen performance surveys etc. Although these are not mandatory surveys, they represent the greatest number of surveys conducted. As a result it is prudent that we provide guidance. They are necessary for forest managers to confirm continued sufficient stocking, and to project treatment needs necessary to achieve free growing status before the late free growing date Free Growing Survey Timing Licensees who are required to establish a free growing stand must report an inventory on the harvested area before the late free growing date. Many silviculture plans or prescriptions have both early and late free growing assessment dates. Openings managed under the Forest and Range Practices Act will have free growing heights. This restricts the allowable time period for free growing assessment. As with regeneration delay surveys, pre-planning of the free growing survey is beneficial. In areas where herbaceous vegetation competition may be a factor in the free growing determination, free growing surveys should be done between the time of maximum leaf out and before leaf fall. 18
19 On sites where vegetation competition is a smaller factor in determining free growing status, or the competing vegetation is nearly exclusively broadleaf competition, the survey can be done any time of the year, subject to the limitations of snow depth. Section 107 (4) of the Forest Range and Practices Act (FRPA) indicates the District Manager has the option to reject a free growing declaration, if the stand is under threat from competing vegetation or forest health, or is unlikely to remain free growing without a further treatment. Utilizing existing guidance such as the following, are considered best management practices to potentially limit the risk of rejection: 1. Table 1 - Number of years growth, recommended following a brushing treatment prior to a free growing survey; Biogeoclimatic zone Number of years 1 ICH, IDF, MS, PP, BG, SBPS, CWH, CDF, MH, 2 and ESSF SBS and BWBS following herbicide treatment 2 manually or otherwise treated 3 1) Number of years is defined as the number of complete (full summer months) growing seasons, post treatment. 2. Free Growing Damage Criteria (Appendix 5 of the Establishment to Free Growing Guidebook) and; 3. Free Growing Guidelines (Appendix 9 of this manual). Where a juvenile spacing treatment has been completed, a waiting period following the treatment is not required before conducting a free growing survey. A free growing declaration under FRPA section 107 should only be made when the stand is currently free growing and likely to remain so in the future. In general it is advisable to schedule free growing surveys as early as possible in the development of the stand. This will allow for the identification of issues early and the opportunity to manage the issues prior to the late free growing assessment date. 3 Preparing for a Survey 3.1 File Review The objective of a file review is to prepare the surveyor for undertaking a survey, make a preliminary assessment of the site and stand conditions, identify the survey standards from the silviculture plans and prescriptions and determine the history of previous activities. In general, gain as much knowledge of an area from the existing information as possible and be prepared to gather the correct data during the upcoming survey. The following is a list of information that a surveyor should consider before conducting any silviculture survey: 19
20 silviculture plan or prescription and any amendments, - Note: woodlot licensees have different requirements and standards in their WLP or defaulted in the WLPPR; silviculture treatment regime; forest cover map; aerial photos, (conventional 10 x 10 inch, orthophotos or high resolution digital); corporate database describing history, (including RESULTS database); previously prepared silviculture treatment prescriptions and post treatment reports; previous surveys; and previous methods of site index determination. Once the reference materials and information have been gathered and reviewed for each opening, some of the fields on the Silviculture Survey (FS 657 card can be completed. A few examples of these include the opening number, licence number, licensee, stocking standards, forest region and district. Even though many of the data fields of the site description portion of the FS 657 field card can be found within the opening file, these items should be left blank until the walkthrough is completed. A few of these include the soil texture, elevation, aspect, slope percent, survey date and ecological classification Silviculture Plans and Prescriptions Before a survey is carried out on an opening, surveyors must familiarize themselves with the opening and, in particular, the associated silviculture plans and prescriptions. The silviculture plans and prescriptions is the collective term for pre-harvest silviculture prescriptions, silviculture prescriptions, site plans, woodlot pre-harvest map or other site specific document that contain management objectives and stocking standards that will be used during surveys to measure the success of re-establishing a free growing stand. These site specific plans describe the nature and extent of timber harvesting and silviculture activities proposed for an opening. Only older silviculture prescriptions will have silviculture activities specified in them. In newer silviculture plans or prescriptions, the surveyor should review the Silviculture Treatment Regime. The silviculture plan and prescription is the source of the stocking standards and parameters used to conduct the survey. Surveyors are not recommended to create any other standards, when ones already exist, but may make recommendations for different standards where ecologically justified. On October 31, 1987 the requirement to create a site specific harvesting and reforestation plan became required. Generally, areas harvested before this point will not have a standards document. See also Pre-1987 Stands with No Silviculture Prescription. On April 1, 1994, the pre-harvest silviculture prescription form evolved to become silviculture prescription. June 15, 1995 the Forest Practices Code came into force and 20
21 provided for the creation of silviculture prescriptions on backlog areas, (those areas disturbed before October 31, 1987) where treatments were proposed. On November 30, 1998, for woodlot licenses only, the silviculture prescription was replaced by the woodlot site plan. On December 17, 2002 the silviculture prescription evolved to the Site Plan, in association with the Forest Development Plan. The latest evolution occurred with The Forest and Range Practices Act (FRPA). For woodlot licenses under FRPA, site plans were replaced by a pre-harvest map showing stocking standards for a specified area Standards Unit versus Treatment Unit Throughout the years of silviculture plan and prescription development, there has been an evolution of many of their components. One of the changes has been the use of the terms treatment unit and standards unit. The current definitions are as follows: Standards Unit (SU): An area within a cutblock that is subject to uniform soil disturbance limits and stocking standards. Treatment Unit (TU): An area of land upon which a silviculture activity is planned and carried out. There may be more than one TU within a SU. Many older prescriptions use the term treatment unit in place of standards unit. If more than one treatment unit has identical stocking standards, these treatment units can be surveyed as a single stratum, all other parameters being similar. Treatment units with different stocking standards are surveyed as separate standards units Stocking Requirements Since the requirement for silviculture plans or prescriptions was first established, there has been periodic evolution of the document. Content requirements have changed. The size of these documents range from one page to dozens of pages. One constant is their inclusion of stocking standards. These are the various specifications for the regenerating crop trees. Surveyors are guided to become familiar with, and use, the stocking standard requirements found in the silviculture plan or prescriptions MSS versus MSSp versus MSSpa With the creation of the Silviculture Practices Regulation, in April of 1994, one of the requirements for silviculture prescriptions was the addition of the minimum number of preferred species. The goal of this requirement was to ensure that reforestation activities be targeted to produce not just species that are ecologically suited to the site but also to produce those species that have the greatest commercial viability. For example, a silviculture plan or prescription indicates: Douglas-fir and spruce are preferred and western hemlock is acceptable the minimum stocking is 700 trees per hectare the minimum preferred stocking is 600 trees per hectare 21
22 This sample opening must have at least 700 free growing trees per hectare in any proportion of Douglas-fir, spruce and western hemlock. However, there must be at least 600 free growing trees per hectare in any combination of Douglas-fir and/or spruce for the area to be considered free growing. The minimum stocking standard is often abbreviated as MSS or MSSpa, while the minimum preferred stocking standard is abbreviated as MSSp. Most silviculture prescriptions or site plans make reference to both preferred and acceptable species in their stocking standards or stocking requirements section. Generally, silviculture prescriptions approved prior to April 1, 1994 will not have minimum preferred stocking standards unless it was amended for some other reason since it was originally created. The minimum preferred stocking standard concept is only a requirement if it is explicitly stated in the silviculture plan or prescription Order of Species While there is great significance in the designation of preferred and acceptable species, there is no significance in the order, (or relative position), in which they are recorded in the stocking standards section of the silviculture plan or prescription Species in Parentheses Some older pre harvest silviculture prescriptions, or silviculture prescriptions used a method of placing parentheses around those species that would be restricted to a certain percentage of the minimum-stocking standard. For example, upon review of an older silviculture prescription, Douglas-fir, spruce, and (western hemlock) are listed as the acceptable species in the stocking standards section. This would suggest that, when determining stocking status, only a small percentage of the minimum stocking standard could be comprised of western hemlock. The actual percentage must be specified in the silviculture prescription. It is recommended to contact the local forest district office to identify the correct percentage for the era of the silviculture prescription. The maximum percentage of bracketed species ranged from 10 to a maximum of 30% Double Standards Some older pre harvest silviculture prescriptions or silviculture prescriptions (found in the former Kamloops Forest Region in particular), contain two sets of stocking standard values. The most common format indicates one set of stocking standards for pure lodgepole pine stands and a second set for other species. The Pli standards are used where the silviculture label has 80% or more lodgepole pine, otherwise, the other standards are used Minimum Inter-Tree Distance (MITD) The silviculture plan or prescription specifies a minimum horizontal inter-tree distance. All trees considered well spaced and free growing must be at least this specified distance from other well spaced or free growing trees. MITD is always measured horizontally 22
23 between well spaced stems. On steep slopes, attention to maintain a horizontal measuring distance is required. If a minimum horizontal inter-tree distance is not specified, discussions may be required between the licensee and the Ministry of Natural Resource Operations. From 1994 to 1998 the default inter-tree distance was assumed to be 2.0m if it was not specified in the pre harvest silviculture prescription or silviculture prescription. Some silviculture plans and prescriptions and Forest Stewardship Plans provide for the minimum inter-tree distance to be changed when certain conditions exist, (e.g. colluvial slopes, site preparation, planting) Target Leader Growth Through the late 1980 s and early 1990 s, silviculture prescriptions and pre-harvest silviculture prescriptions included a target leader growth or target leader length in the stocking standards. The intent was to ensure that not only sufficient quantities of trees were present on the site but that they were also growing at a minimum rate. A speciesspecific growth rate per year or per three year period was common. The concept of minimum growth rates was replaced by the minimum free growing height in later silviculture plan or prescriptions. Target leader growth is not a legally binding component of the stocking standards and compliance is not required Minimum Free Growing Height Another change in the post 1994 era was the requirement for trees to be at least a minimum height before they could be considered free growing. If these values are not found or defaults referenced in the silviculture plan or prescription, then there are no legal requirements for a tree to meet this height specification. The only exception to this is if the surveyor is using the revised free growing guidelines found in Appendix 9 of this manual or Appendix 9 of the Establishment to Free Growing Guidebook, in which case, a minimum height is required. The addition of minimum free growing heights and the application of relaxed definitions of competing vegetation are the only adjustments to be made to the standards if the Free Growing Guidelines are applied Adjustment of the Early Free Growing Dates The subject of changing the early free growing date, also known as the sliding rule is discussed in the Establishment to Free Growing Guidebook page 35. This concept is applicable where an early free growing date is specified in the silviculture plan or prescription. It encourages licensees to conduct prompt reforestation activities by allowing the early free growing date be moved earlier. It may be moved back an amount equal to the amount of time the regeneration requirements were met before regeneration date. For example if the regeneration plan provides a 4 year regeneration date and the licensee shows the standards unit is SR in year 3, the early free growing date can be moved one year earlier. This has no effect on the late free growing date. Woodlot site 23
24 plans were not required to include an early free growing date but some did. For blocks under Silviculture prescriptions or woodlot site plans, an amendment requiring approval is necessary to adjust the early free growing date. For Blocks under an FDP site plan an amendment requiring approval to an FDP stocking standard may also be required to adjust the early free growing date. The District manager has the option to decline the application of this concept such as, where forest health issues risk the continued free growing status Minimum Age of a Free Growing Tree There is no legally required minimum age of a free growing tree, unless it is specifically stated in the silviculture plans and prescriptions. One guidance exception is for surveys on singletree selection systems, generally drybelt Douglas fir management, the Establishment to Free Growing Guidebook, page 38 indicates free growing trees must be on site for 5 years and be 40 cm tall Backlog Standards - Pre-1987 Stands with No Silviculture Plan or Prescription Most areas harvested prior to October 31, 1987 do not have a silviculture plan or prescription. It is recommended to refer to the following Backlog policy and procedures for guidance and they are located on the following link: Backlog Management Policy. Some regions and districts have prepared procedures for conducting surveys on these areas. The most common version includes direction for surveyors to create stocking standards using the Establishment to Free Growing Guidebook. This is not the intended use for this guidebook, but is often a reasonable solution. 3.2 Preliminary Stratification The office review uses the information found in the opening file, in the silviculture plan or prescription and in the corporate database as the basis for the preliminary stratification. The data found on file, including air photos, previous surveys, previous treatments and other maps provides the background for an opening and can help give an initial impression of what can be expected. This is a critical first step in the survey process. The first step in preliminary stratification for any regeneration delay, stocking or free growing survey is to identify the standards unit(s) (SU) described in the silviculture plan or prescription. Each SU has distinct survey parameters and must be surveyed independently of the others to ensure legal stocking and free growing requirements have been achieved. SUs are then subdivided, or stratified for any number of reasons such as forest cover, stocking status, forest health factors or treatment reasons. Additional 24
25 stratification may be required based on a re-evaluation of the biogeoclimatic ecosystem classification. This must be done with special care since it may result in the need for an amendment to the silviculture plan or prescription. In a few very rare cases it is possible to survey two standards units as one stratum. This is only possible if all the factors of the stocking standards in the silviculture plan or prescription are identical and the two areas are significantly similar (not different enough to be stratified). Scenario Example: An example map has been provided in figure 3 to assist with the description of preliminary stratification. The crosshatched area is Standards Unit 1; the dotted area is Standards Unit 2. These two halves of the opening have different stocking standards. Regardless of any other subsequent stratification, the boundary between stratum A and stratum B must be maintained. SU-1 SU-2 C A B D N Figure 3: Preliminary Stratification In this particular silviculture prescription SU 1 has two Treatment Units (TUs). The stocking standards for TU 2 are the same as TU1, but TU2 has a restriction for no ground-based machinery to be used. We can suspect there may be something different about this area. Therefore standards unit 1 is tentatively split into 2 strata, A and C. Once the walk-through has been completed, this stratification will be either confirmed or eliminated. Upon further review of the information on file, the recent air photo indicates a lighter color in the eastern edge of SU 2. The cause is currently unknown. This portion of stratum B appears to be different than the remainder of the stratum. Stratum D is therefore noted and will be investigated during the walk-through. This and other preliminary stratification will be reconsidered during the walk-through. The standards unit boundary is not reconsidered; it remains fixed unless an amendment to the silviculture plan or prescription is prepared. 25


26 Figure 4 provides the final stratification for our fictional opening. During the walkthrough it was confirmed that stratum A and C are significantly different. As a result of the machine free restriction, the understorey of previously suppressed balsam was not damaged during harvesting or mechanical site preparation. There is a higher component of balsam, in the south west corner and as a result the inventory label will be different. Stratum C is retained and surveyed separately from stratum A. Stratum D turned out to have a higher percentage cover of grass than the remainder of the east half of the opening. While it appears to be a different color on the air photo the photo was not recent. The free growing trees have grown since the aerial photography and are now unaffected by the difference in herb species or grass species on this stratum. The stratification, prior to establishing plots has been finalized as seen in the figure below. SU-1 SU-2 C A B N Figure 4: Stratification Following the Walk-through Take note that even if the current characteristics of stratum A and B are identical, these are two separate standards units and therefore must be surveyed as separate strata. Stratification based on an assessment completed while walking the block to establish plots is not the most recommended practice, but is the usual practice if a walk-through is not completed prior to plot establishment. 3.3 Regeneration Delay Surveys Tally Method: Tally the number of trees within the plot by species that meet all of the acceptability criteria and the minimum inter-tree distance requirements, including those that exceed the M-value and record these in the appropriate species columns of the FS 658 (field number 99). In the TOTAL W column, record the sum of preferred and acceptable well spaced trees in the plot, up to the maximum per plot indicated on the FS 657 (M-value). If the maximum is reached, or exceeded, record the letter M rather than the numeric value. Follow the arithmetic procedure on the FS 659 (field number 148). Surveyors are expected to produce silviculture labels as part of the survey report. The details of silviculture labels are described later in this document. This method is also recommended for use in Stocking surveys. 26
27 3.3.1 Well Spaced Trees Definition Trees that contribute to stocking are the subset of all the trees in a plot that are most likely to form the managed portion of the new crop and will likely need additional time to meet the requirements of a free growing tree. Over the years, as legislation has evolved, so has the definition of the well spaced tree. The current legislation has no definition of a well spaced tree. It is clear that there are two well spaced tree characteristics to consider that will be mandatory once this well spaced tree grows to free growing status. These mandatory factors are: the preferred or acceptable species listed in the silviculture plan or prescription at least the minimum inter-tree distance as specified in the silviculture plan or prescription from any other tree that is recorded as a well spaced tree Local Forest District specific criteria may be applicable to well spaced trees criteria and if authorized by the District Manager, the surveyor must consider them. The intent is to apply criteria that increase the likelihood for the trees selected as well spaced to survive and thrive to a free growing status. These are often developed cooperatively by local silviculture practitioner steering committees. Guidance may include such things as specific: minimum age and/or heights, suitable growing microsites, forest health criteria. Note: The Free Growing Damage Criteria does not apply to the regeneration delay survey. It is highly recommended that it be used during the stocking surveys. It may not be realistic to apply all of the free growing damage criteria to well spaced trees. However, damage agents affecting well spaced trees at the regeneration stage could still be affecting the same trees at the free growing stage. For example, if mistletoe is found on a young tree, it will persist through to the free growing stage and beyond. This tree should not be accepted as well spaced during the stocking survey. This same tree must not be accepted in the free growing survey. Therefore it is highly recommended that the surveyor consider with caution, damage agents affecting well spaced trees, and use judgment in the best interest of achieving a free growing stand Advance Regeneration Definition Advance regeneration is defined as trees that are present on an opening that were established prior to the disturbance that created the opening. They may make up all, part, or none of the reforestation obligation. They may also be present on the opening as part of a strategy to increase biodiversity or to maintain visual quality objectives. These trees may only be tallied as well spaced and/or free growing trees if they meet the criteria specified in the silviculture plan or prescription. 27
28 Where acceptability criteria have not been included in the silviculture plan or prescription or where there are no regional guidelines, the best management practice is to consult Appendix 10 of the Establishment to Free Growing Guidebook or page 10, table 21 of the FS Free Growing Surveys Tally Method: Tally the number of free growing trees within the plot by species that meet the free growing height, quality, health, minimum inter-tree distance and vegetation free requirements, including those that exceed the M-value and record in the appropriate species columns of the FS 658 (field number 99). In the TOTAL FG column, record the sum of preferred and acceptable free growing trees in the plot, up to the maximum per plot indicated on the FS 657 (M-value). If the maximum is reached, or exceeded, record the letter M rather than the numeric value. In the TOTAL W column, record the sum of preferred and acceptable well spaced trees in the plot, without regard for the M-value. If the maximum is reached, or exceeded, do not record the letter M, record the numeric value. Surveyors are expected to produce silviculture labels as part of the survey report. The details of silviculture labels are described later in this document. The key is to describe free growing trees when the stratum is found to be free growing. If not, describe well spaced trees. Even with a thorough walk-through some strata are still indeterminate. In these instances it may be preferable to record two completely separate rows of data on plot cards: one row to describe well spaced trees and a second row for free growing tree data. Once the data collection has been completed and statistics calculations completed, the most appropriate data can be summarized. Follow the arithmetic procedure on the FS 659 (field number 148) Free Growing Definition Free growing trees are the subset of well spaced trees that are healthy, and the growth is not impeded by competition from plants, shrubs and other trees, and meets the free growing heights. It is the stand of trees that we can expect to produce a commercially valuable crop tree. The assessment process is conducted at two levels: at the tree level and at the stratum level Tree Level A free growing tree meets the criteria of a well spaced tree and the following additional criteria: 28
29 Is it free of unacceptable levels of forest health damage? Refer to the FS 660 or Appendix 5 the Establishment to Free Growing Guidebook, Free Growing Damage Criteria Appendix 5; Is it free of unacceptable levels of vegetative competition (herb, shrub or broadleaf tree)? Has it achieved the minimum Free Growing Height? and Does it meet any additional criteria explicitly stated in the silviculture plan or prescription for the area? Stratum Level At the stratum level surveyors consider the following: Are there sufficient free growing preferred plus acceptable tree species per hectare? If specified in the silviculture plan or prescription, are there sufficient free growing preferred tree species per hectare? For blocks managed under the Forest Practices Code, are there less than the maximum density value of countable conifers present? Has a brushing treatment recently been completed? (This is not a mandatory requirement under FRPA). However, it is a recommended best practice that there is significant risk of vegetation re-sprouting following a brushing treatment by certain species in certain ecosystems. It may be unlikely that the stratum will remain free growing into the near future, therefore a post brushing treatment waiting period may be necessary (refer to Table 1, located in section 2.1.3) Recording Unacceptable Species as Well Spaced or Free Growing It is suggested, but not required, to record well spaced or free growing species that are performing well on the opening, but are considered unacceptable according to the silviculture prescription or site. The surveyor must always maximize the plot with the preferred and acceptable species before tallying any unacceptable species. Unacceptable species must be recorded and compiled separately to avoid any potential confusion with the preferred and acceptable species. The intent of tallying unacceptable species is primarily for treatment recommendations. Tallying unacceptable species will also provide justification when recommending an amendment to allow the unacceptable species to be considered as an acceptable species on the opening. 29
30 General Eras of Free Growing Standards There are three general eras of definitions and specifications of the assessment of competing vegetation: Pre 1994 Silviculture Practices Regulation Period; Post 1994 Silviculture Practices Regulation Period; Two Options Time Period Pre 1994 Silviculture Practices Regulation Era The pre 1994 Silviculture Practices Regulation Era covers a time frame of December 17, 1987 through to February 7, These older silviculture prescriptions or site plans have a wide range of specifications with regards to free growing definitions. Some have no specifications for the determination of free growing status. In this era, there were regional and district specific methods of defining free from unacceptable levels of vegetative competition Conifer Brush Ratio - Post 1994 Silviculture Practices Regulation Era The Post 1994 Silviculture Practices Regulation Period era is characterized by a consistent approach to free growing determination. It covers the period of time from February 7, 1994 through to spring The effective growing space of a tree is defined as a one-meter radius cylinder around the tree. For a tree to be considered free growing, the tree must be at least the required height above the competing brush. The required height is expressed in the form of percent conifer to brush ratio. The two most common conifer-to-brush ratios used in the province are 125 percent and 150 percent. Others may be present in specific silviculture plans and prescriptions. 30
31 A B C D Figure 6: Examples of free growing determination. Example A: The crop tree is free growing because there is no vegetation within a 1m radius. Example B: The crop tree is free growing because the crop tree is 150% or more the height of the tallest competing vegetation within a 1m radius of the crop tree. Example C: The crop tree is free growing because there is no vegetation taller than 66cm (150% the height of the conifer) within a 1m radius. Other conifers are not considered as competition at this stage. They are considered at the stratum level with maximum density. Example D: The crop tree is not free growing because the crop tree is not 150% or more the height of the tallest competing vegetation within a 1m radius of the crop tree. Any encroachment of vegetation within the 1m radius cylinder makes the crop tree not free growing. This may be as little as a single leaf or other relatively minimal vegetation Two Options Time Period In the spring of 1999, a document entitled, Interim Free Growing Guidelines was introduced. This was formalized in 2000 and incorporated into the Establishment to Free Growing Guidelines Appendix 9 and remains recommended practice. The licensee responsible for producing a free growing opening has the choice to select one of two methods of assessing the level of competing vegetation to determine the free growing status of the area being surveyed. The method used is recorded by checking the appropriate box on the FS 657. It may be acceptable to specific District Managers to select separate methods for each standards unit within an opening and pre-approved is recommended. 31
32 Method 1: Survey the opening based on the parameters specified in the silviculture plan or prescription. Method 2: Survey the opening based on the procedures for assessing competing vegetation described in Appendix 9 of this manual or Appendix 9 of each regional Establishment to Free Growing Guidebook, (Cariboo Region link provided). This procedure requires that licensees accept the added minimum free growing height standards, as found in the Establishment to Free Growing Guidebook or Forest Stewardship Plan, if they are not already described in their current silviculture plan or prescription when using the new free from brush guidelines. None of the other stocking standards change; the minimum inter-tree distance, species acceptability, conifer to brush ratio, the minimum free growing heights (if specified), and the minimum and target stocking standards are still used as prescribed in the silviculture plan or prescription. Only minimum free growing heights are added in compensation for reduced vegetation competition specifications Guidance Procedures for the Assessment of Vegetation Competition in Conifer Managed Stands Introduction to Assessing Vegetation Competition A free growing stand as defined in the Forest and Range Practices Act (FRPA) is: a stand of healthy trees of a commercially valuable species, the growth of which is not impeded by competition from plants, shrubs, or other trees. The intent of the free growing concept is to identify the point where a managed stand is not being impeded by brush and can reasonably be expected to continue development to maturity without significant additional intervention. At this stage, liability and responsibility for free growing stands reverts from the obligation holder to the Crown. In this section and the subsequent Appendix 13, guidance has been provided for regionally specific competition threshold criteria of acceptable vegetation competition in conifer stands. These free growing criteria are not a competition index or a decision tool for treating stands. Rather, they identify a desired state of the free growing crop within the free growing assessment period, which represents an acceptable level of risk to the Crown. 32
33 Methods for evaluating acceptable levels of brush and broadleaf tree competition at free growing Licensees with free growing obligations have three options available for competition evaluation: 1) Use the defined unique Acceptable Competition criteria and procedures in an approved FSP or SP; 2) Use the default Crop/Brush Ratios in the FDP Stocking Standards (Reference Guide for FDP Stocking Standards); or 3) Use the Local Geographic Competition Assessment Criteria listed below and linked to sections of Appendix 13, for the licensees operating region Vegetation Categories Regardless of the assessment methodology, the risk that future treatments will be required, will vary with the type of vegetation and the maturity of the crop tree. The following illustration shows the relative risk as a function of potential height growth over time per vegetation type. Figure 6a: relative Height growth over time per Vegetation Category 33
34 For this reason, acceptable levels of vegetation within the effective growing space of a crop tree will usually be evaluated separately, following three broad vegetation categories and hierarchy: 1 st Shrubs and Herbs vegetation communities without broadleaf tree competition 2 nd 2 nd Interior Broadleaf Coast Broadleaf vegetation communities that include aspen, birch, and upland cottonwood vegetation communities with red alder, big leaf maple, and cottonwood (coastal form) This conceptual approach to evaluating vegetation types separately is incorporated into the competition guidance contained in the Appendix 13 section of this manual Shrub and Herb Competition Details for all criteria in Appendix 13 Shrub and herb (or non-broadleaf tree vegetation) includes all other types of vegetation including herbaceous/low shrub and tall woody shrub species (e.g., fireweed and willow). To be Free Growing, the crop tree must be taller than the shrub and herb vegetation in at least three quadrants of its effective growing space. Note: Quadrant - Is represented by a 1 meter radius cylinder around the crop tree (as shown in Figure 6b below). The quadrants are moveable or mobile at the discretion of the surveyor, to best suit the situation per crop tree. 34
 Appendix 13 allowance for a capped specific number of")
35 Figure 6b: FG Crop tree that is taller than shrub in at least 3 of 4 quadrants Broadleaf Competition Details Preferred or Acceptable Conifer overtopped by an Acceptable Deciduous (also identified as a Countable Broadleaf) Appendix 13 allowance for a capped specific number of broadleaf per plot would not apply to SU s with acceptable broadleaf species in their stocking standards. The concept of potentially free growing tree with one broadleaf in a quadrant and allowable broadleaf in the plot of between 2 to 5, would not apply. Therefore the crop tree to brush ratio would apply to conifers in these types of SUs. Acceptable broadleaf would be considered free growing if they are well spaced and meet the broadleaf damage criteria (free from brush does not apply to broadleaf in this case). The Potentially FG concept doesn t apply when broadleaf Ep, At or Act are either preferred or acceptable species in the SU s Stocking Standard Layer 1 ( 12.5 dbh) Broadleaf Species will be considered non-competitive when using the quadrant method for assessing Free Growing Conifers, if the collective layer one, total broadleaf species in the plot are either: < 6% Crown Closure (Rationale: 6% crown Closure is used as the threshold for overstorey creating impact for multi-storey stands and impact on understory regeneration), OR 35

36 < 8 m 2 Basal Area (Rationale: 8 m2 is the threshold BA used by Comeau and Cortini in the Mixedwood Well Growing standards developed for the Aspen and Sw mixtures). Broadleaf tree clumps The crown area of multiple stemmed broadleaf trees is larger than that of single-stemmed individuals. However, the total crown area and competitive effects of a multiple stemmed tree are often not as large as would be encountered with the same number of single-stemmed trees. While numerous birch stems will often originate from one stump, aspen is more likely to sucker from below the ground or at the root collar (see Figure A9-8). Table A9-1 shows the relationship between the actual number of birch stems originating from a cut stump and the related number of countable broadleaf trees used during a free growing assessment. For aspen and cottonwood, and for birch that originate from below the ground level, all stems greater than the median height of the potentially free growing trees will be tallied as countable stems. Figure 6c. Table 1a. Numerous broadleaf stems originating from a stump and from below ground root suckers. Left: Three stems originating from a birch stump would be tallied as two countable trees. Right: Three aspen stems originating from below ground aspen root suckers are tallied as three countable trees. Comparison of multi-stemmed birch to numbers of countable birch trees. Number of birch stems Number to count
37 Local Geographic Free Growing Competition Assessment Criteria Appendix 13 The province has been separated in to 3 broad geographic regions for these Competition Criteria. These rough separations are based on: 1) Different Broadleaf species (i.e. red alder on the Coast and aspen in the Interior); and 2) Different Broadleaf species competitiveness relative to the local ecologies (i.e. aspen is more competitive in the North Area than in the South Area) Within these broad regionally mapped separations there may be more detailed criteria potentially per local BEC variants. Refer to Appendix 13 on page for the specific Local Geographic Competition Assessment Criteria Broadleaf Criteria for local BEC variants of interest Maximum Density The term maximum density is used to describe a tree density threshold, above which the licensee responsible for an opening is obligated to conduct a juvenile spacing treatment prior to declaring a stand free growing. The term repression level, as used in early silviculture prescriptions, has the same meaning as our current definition of maximum density Forest Practices Code (FPC) era Opening: Density levels must be controlled as per the densities prescribed in the approved SP or PHSP. If the SP or PHSP does not state a maximum density or repression level, default densities would apply, as described below. For Woodlot Licensees, the maximum density thresholds are outlined in WLFMR sec 78(7) which parallel the approach listed below. If the silviculture prescription was approved on or after April 1, 1994, and the number of countable conifers per hectare exceeds or a number specified by the regional manager, prior to the free growing date, the number of conifers must be reduced to within the range specified in the silviculture plan or prescription. For silviculture prescriptions or site plans approved before April 1, 1994, that state a maximum density or repression level, spacing is required if the density of lodgepole pine or drybelt Douglas-fir exceeds per hectare or a number specified by the district manager. Maximum density thresholds have been changes by the Regional Managers of the northern and southern interior: The Northern Interior Forest Region, in August of 2007, redefined the thresholds for the maximum density juvenile spacing obligation by a licence to: o 20,000 countable conifers per hectare where lodgepole pine is >80 in the inventory label, o 10,000 countable conifers per hectare all others 37
38 The Southern Interior Forest Region, in February 2006, redefined the thresholds for the maximum density juvenile spacing obligation by a licence to: o 25,000 countable conifers per hectare where lodgepole pine is >80 in the inventory label, o 10,000 countable conifers per hectare all others Forest and Range Practices Act (FRPA) era Opening For those areas managed under a FSP or WLP, maximum density levels approved within the plan will apply. If a FSP or WLP does not have a stated maximum density, then there is no default maximum density that applies. For areas harvested after January 31, 2004, under a FSP and areas where the FSP has specified that FRPA FSP stocking standards apply, the responsibility to conduct juvenile spacing treatments will depend on the contents of the plan itself Countable conifers When determining if the total number of conifer trees (TC) exceeds maximum density, an understanding of countable conifers is required. On areas where the number of countable conifers are well below the maximum density, it would be irrelevant to collect countable conifer data. Since this data can be time consuming to collect, you may wish to discuss not collecting this data in these circumstances with the district manager. Some districts have issued letters providing this advice. The following methodology steps are used for determining the number of countable conifers: For even aged silviculture systems: 1. Determine the median height (explained in section ) of the well spaced trees in the plot. The surveyor should tally the tallest well spaced trees. It is not required and can be detrimental to tally more well spaced trees than the M value. 2. Where the median height is: 2 m., the countable height is 30% times the median height as determined in step 1. >2 m., the countable height is 50% times the median height as determined in step Countable conifers are either: I. All the lodgepole pine or drybelt Douglas-fir above the countable size calculated in step 2 for all those silviculture prescriptions or site plans approved before April 1, 1994, or 38
39 II. III. All conifers taller than the countable size calculated in step 2, for all those silviculture prescriptions or site plans approved after April 1, 1994, but not under a Forest Stewardship Plan, or Other maximum density and or countable conifer definitions that may be specified in Forest Development Plans or Forest Stewardship Plans. For stands managed on a single tree selection basis: 1. All conifers in layer three (>1.3m tall but <7.49 cm dbh) contribute toward the maximum density determination and are considered countable conifers. On areas where the number of countable conifers are well below the maximum density, it would be irrelevant to collect countable conifer data Median Height Determination Procedure Median height, as it is used for countable height is defined as the middle height. Procedural Steps: 1. Identify up to the M-value number of well spaced trees in the plot (best to select the tallest well spaced trees). 2. Determine the median height of the well spaced tree. This involves measuring all of the well spaced trees, arrange their values in order from smallest to tallest. Select the height of the middle tree, or the average height of the two middle trees. Example: In the example below, figure 7, the countable height is equal to the measured height of tree number four, times 50%. 2.1 x 50% = 1.05m, or 105 cm. The trees taller than 105 cm are countable. Tree number 4 may or may not be a free growing tree, but it is one of the five well spaced trees. 39

40 Figure 7: An example of median height determination with an odd number of free growing trees on an even-aged stand. 40
/2 x 30% = 0.58 m or 58 cm. 2.6 2.3 2.1 1.8 1.")
41 In the example below, figure 8, the countable height is determined by the average of the measured heights of trees two and four, times 30 %. ( )/2 x 30% = 0.58 m or 58 cm Figure 8: An example of median height determination with an even number of free growing trees on an even-aged stand. 41
42 3.5 Site Index Site index is a measure of the growing potential of a site. Site index is defined as the average top height of trees, of a certain species, at fifty years breast height age. Accurate site index values are required for inventory, timber supply analysis and silviculture decision making. In silviculture, site index is often used to select or rank sites for treatment, to prescribe appropriate treatments and to schedule these treatments. The reporting of site index is an integral part of an inventory label. A complete discussion on site index determination can be found at: publication Site Index Estimate by Site Series Methods to Determine Site Index During the walk-through, a surveyor must decide which method will be used to determine the site index for each stratum. Guidance on site index method selection is provided on the FS 660 and FS 659. There are five methods used to determine site index: growth intercept, SIBEC (site index by biogeoclimatic classification), site index curves, site class conversion and professional interpretation. These methods differ in their accuracy, availability and in the input data required. A key to assist surveyors in selecting the method to use for estimating site index is provided on the FS 660. It is strongly encouraged to select the most reliable method for estimating site index as outlined in the decision key in particular, to use the Growth Intercept method wherever it is suitable and feasible. Normally, the leading species in the stratum's inventory label is chosen as the site index species. Each of the site index determination methods has an approved abbreviation (these are listed in Section 8.1, data point #172). Site Tools 4.0 provides convenient access to determining site index for a stand using the Growth Intercept (GI) and Site Index Curve methods. Site index is calculated from the height and age of sample trees measured on the site. Specifically for GI, once the latest version of Site Tools is loaded on your computer, follow these steps: 1) Click on Tools in the top menu bar and select Calculate Value ; 2) Select your SI species from the drop down menu (note the recommended equation to be used will appear below species); 3) Select Calculate SI from the next drop down menu; 4) Enter your sample tree total height and breast height age and then click Calculate ; 5) The GI Site Index will be displayed to the right of the screen. 42
43 SIBEC Leading Species Issues when determining Site Index When the leading species of the inventory label is not the appropriate choice for determining site index using the SIBEC method, (i.e. a deciduous species not identified on the SIBEC tables) it is recommended as a best practice that the next leading species of the inventory label should be chosen for the site index species. This may commonly be the leading species in the silviculture label. If this is done, a comment should be submitted along with the RESULTS entry to identify this difference. Growth Intercept When the leading species of the inventory label is not the appropriate choice for determining site index using the Growth Intercept method, (when it is silviculturally unsuitable - not a preferred or acceptable species, suppressed or its height is affected by forest health factors), it is recommended as a best practice that the leading species of the silviculture label should be chosen for the site index species. If this is done, a comment should be submitted along with the RESULTS entry to identify this difference. An acceptable alternative practice, if the leading species in the inventory is not a species available for Growth Intercept methodology, a conversion between species is available for some species in the Site Tools program. 3.6 Basal Area (BA) Basal area is the cumulative cross sectional area, represented in m 2, of the live trees, that are greater than or equal to 12.5 centimeters in diameter, measured at breast height, that are determined in using a prism (specifically only applicable for Layer 1 trees). Basal area must be collected by species where the silviculture plan or prescription specifies basal area by species and by diameter class. It is a legal requirement to collect basal area data if the stocking standards in the silviculture plan or prescription require that a specific basal area per hectare be retained after harvest. If the silviculture plan or prescription does not stipulate the planned residual basal area per hectare to be retained after harvesting, the surveyor should only collect basal area for the Layer 1 stems, if Multistorey Stocking Standards apply to the opening. Procedures for measuring basal area are contained in Appendix Dispersed Types In some cases, strata in an opening may be better described by their characteristics rather than by their geographic location. When the walk-through identifies strata that are so distinctly different, but so intimately mixed that it is impractical to map the location of each portion of the strata, these can be surveyed as dispersed strata. During the walk- 43
44 through the characteristics of each of the strata must be clearly and distinctively defined for application during the field data collection. It is preferable that these dispersed strata are identified in the silviculture plan or prescription; if not an amendment to the silviculture plan or prescription may be required, if a change of the stocking standards for one or more of the strata is required. Identifying an area as a dispersed type is not a replacement for proper stratification. Dispersed strata must: have distinctively different characteristics that can be clearly described, and have occurrences of each stratum that are impractical to map (too small and numerous and/or too inter-mixed) The following methodology is used to sample dispersed strata: clearly define the characteristics of each stratum establish the number of plots in each stratum that are required to meet the desired statistical precision. Plots may have to be moved to ensure that they are fully located within a stratum. If a grid pattern sampling design is used, plots should be moved along the strip line in increments of 10m until the plot falls fully within one of the strata. estimate the proportion of the opening that is representative of each stratum summarize the data for each stratum separately record stratum labels on the map. A Figure 9: An example of dispersed strata map label The determination of the area represented by each stratum is relatively complex. (Further detail on how to determine the area of a Dispersed Strata is contained in Appendix 2). Area is expressed as a percentage of the combined total area of the dispersed strata. Area can be determined by either: visual estimate; photo interpretation; line intersect ; or high intensity point sampling. 44
45 (Visual estimates or photo interpretation are the most simple, but are typically the least accurate) Stratum Proportion of Area Represented by Each Stratum A n/a 8 } B Combined 60% 6 Area 10ha C 40% 4 Net Area to be Reforested Table 2: An example of a dispersed strata area calculation 3.8 Walk-through Area (ha) A walk-through is an initial reconnaissance of the opening. As the name walk-through implies, one of the most effective ways of conducting the walk-through is to physically walk-through the opening, visually noting the characteristics found on the opening. The procedure can often be completed by other methods such as all-terrain vehicles and aircraft. This step in the survey process is often not performed to the formal level as outlined in this manual. This step is at the discretion of the surveyor and can often depend on the strength of the initial stratification, the surveyor s local knowledge of the opening being surveyed and the time allotted to this step in the survey contact. It is recommended that all surveyors perform a walk-through or initial reconnaissance of each opening, but this is not a necessary step. The walk-through is used to confirm a variety of site and survey decision information, including but not limited to the following: ecological classification stratification definition of dispersed strata survey objectives sampling method sampling intensity identification of the leading and second inventory species method of determining site index 18 45
46 forest health factors present limiting factors potential treatments stand structure (even-aged, even-aged layered or multi-storey uneven-aged - as related to the stocking standards for the opening) prism size to use to capture basal area 46
47 3.8.1 Field Stratification Stratification is the most critical step in the survey process. Stratification is the process of defining and identifying populations with similar characteristics within an opening. The objective of stratification is to increase sampling precision by delineating homogenous strata within an opening, so that there is less variation within each stratum than within the entire opening. Stratification is used to increase the efficiency of the survey by reducing the number of plots required per stratum to reach a desired sampling precision. Stratification can also improve the reliability of the treatment recommendations. Stratification is required to meet the legal requirements specified in the silviculture plan or prescription. Silviculture prescriptions or site plans contain one or more standards units that are developed according to biogeoclimatic classification, site attributes and stand management objectives. If more than one standard unit is defined in the silviculture plan or prescription, these standard units must be stratified and surveyed separately. These standards units (SUs are the first initial stratification criteria) are further subdivided based on the following stratification criteria: stocking NSR, SR, FG leading inventory label species Change of leading species, for example, Fd 80 Ss 20 vs. Ss 70 Cw 30 inventory species composition >20% difference, for example, Fd 80 Ss 20 vs. Fd 60Ss 40 age class >20 years difference between leading species* height class >10 m difference between leading species* crown closure >20% difference between strata site index >3 m difference in SI 50 treatment recommendations stand structure * Note: These are the minimum requirement guidelines set by the Forest Analysis and Inventory Branch. The following two examples provide a comparison of the significantly different survey findings that correct stratification will result in. Figure 10 depicts the results of an unstratified survey for a fictional opening. Figure 11 demonstrates the results of correct stratification for the same opening. 47
48 Figure 10: Systematically positioned plots without stratification Well spaced Minimum stocking standard Confidence interval Recommendation 750 tr/ha 700 tr/ha 200 tr/ha establish more plots? or Fill plant The results of this survey without stratification are inconclusive. After a thorough file review, preliminary stratification and walk-through, two strata were identified and sampled separately. The data from the thirteen plots indicate the following results: A B Figure 11: Systematically positioned plots after pre-stratification Stratum A Stratum B Well spaced 1000 tr/ha Well spaced 500 tr/ha Minimum stocking standard 700 tr/ha Minimum stocking standard 700 tr/ha Confidence interval 75 tr/ha Confidence interval 70 tr/ha Recommendation * Satisfactorily restocked Recommendation * fill plant The results of the correctly stratified survey are more likely to provide definitive results, and describe the condition of the current opening. 48
49 3.8.2 Ecological Classification The ecological classification should be confirmed during the walk through. The classification completed during the preparation of the silviculture plan or prescription can be used as a likely reliable starting point for field verification. If there is a variation in the ecological classification from that of the silviculture plan or prescription, that will change the stocking standards, then an amendment should be recommended SU Mapping Variation During a walk-through it may become apparent that the standards unit boundaries as mapped in the silviculture plan and prescription do not match the location of the characteristics as they are found on the site. The ability to accurately map terrain features and ecological classification is greatly enhanced once the mature forest is removed during harvest operations. As a result it is common to see more accurately the actual location of the intended standards unit boundaries. Standards unit mapping as found in the silviculture plan and prescription Actual location of the standards units as found during the survey A B A A B A Figure 12: Standards unit mapping variation The sample diagrams above show that the intent of the prescription was to recognize the presence of, for example, a wetter, low lying standards unit B. A portion of the block that meets the characteristics of standards unit B is identified and mapped during the walk-through. It is approximately the same size and position, yet noticeably different. If one were to follow only the standards unit map, many of the plots and their data would be summarized as representing the wrong stratum. When the intent of the prescription is clear, surveyors are directed to update the standards unit mapping. The variation must be pointed out and consideration be given to the need for an amendment. The magnitude of the difference will dictate the relative necessity to recommend an amendment. In the above example, the area represented by B is similar and therefore an amendment may be of little value. In both there are approximately 10 ha of the standards unit B. Generally when a change in standards unit boundaries occurs, an amendment is likely required. 49
50 3.8.4 Preliminary Assessment of Forest Health Factors During the walk-through, a preliminary assessment of forest health factors should be noted and recorded. The walk-through is done with less rigidity, than the typical systematic survey grid pattern, therefore allowing the surveyor to assess trees that have unusual color, vigour or form. The forest health factors noted are recorded on the back of the FS 657 field card Site Index Determination Method During the walk-through surveyors are expected to ascertain the most appropriate method for the determination of site index. The site index training materials describe the process in detail. In brief, the characteristics of the survey site are compared to the site index determination methods and the site index method is then selected Potential Treatments While completing the walk-through it often becomes apparent to the experienced silviculture surveyor that a specific treatment will be required. As a result, additional data can be collected during the survey that will provide a more precise prescription for the subsequent treatment. For example, if few trees are identified during the walk-through, a planting project may be required, therefore the surveyor should take the extra time required to collect the additional data required to complete a planting prescription. The same can be said for anticipated site preparation, brushing and spacing treatments Minimum Stratum Size The minimum stratum size is a complex composite of: legislative and contractual obligations operational feasibility biological practicality cost, benefit and risk In the spring of 2007, strata size and distribution became specified in regulation: Reserves and NP areas 0.25 ha mappable* Mappable is suggested as being defined as a polygon greater than 20m throughout its length. Areas that do not meet the stocking obligations less than 20m from the nearest NSR or Not FG area are considered contiguous units.(note: Mappable may be defined within an approved FSP). SUs less than 1 ha the entire SU 50
51 Milestone Surveys: Regeneration delay and free growing 1 ha Mappable not free growing portion of a SU 1 to 2 ha, maximum of 5% of the SU NAR Note: Refer the following document Forest Cover Stratification and Milestone Declaration V1.4 for examples and illustrations of conditions referenced above. The reforestation obligation is for the net area defined in the silviculture plan or prescription. 4 Sampling Principles The current silviculture survey procedures has at its foundation in two survey principles: 1. Identify strata 2. Gather data within each stratum The data gathering principle has three sub-components a. Survey Objective b. Survey Method c. Survey Intensity There are many sampling objectives, methods and intensities that can produce valid results, but they will only withstand an intensive review if stratification has been done correctly. Forest management legislation requires a forest cover inventory to be produced through a survey but the particular survey methodology or intensity is not defined. The emphasis is put on the expectation for the survey to accurately represent the stand as opposed to the methods and intensity of the survey conducted. The results reported are expected to be significantly similar to those resulting from using the methods described in this manual Survey Objective The survey objective is recommended to be determined by the surveyor during the walkthrough. The selection of the survey objective or objectives is based on a combination of the office and field observations. Example: A licensee survey contract may indicate you are to conduct a free growing survey. During your walk-through you find significant mortality from some forest health factor. Not only is the stand not free growing, but in fact it is NSR. The licensee would likely not want a free growing survey completed, instead they would prefer stocking and plantability data collected. 51
52 4.1.2 Sampling Intensity Generally, sampling is performed where it is too time consuming to complete a full inventory. In the case of silviculture surveys the time required to count every tree in a stratum is excessively costly compared to the relative accuracy required. As a result, we collect data from a relatively small number of small sample plots, and then average the data and project the information over the entire stratum. The intensity of the survey should be varied to match the variability of the population. That is, the more obvious the answer is to the questions posed in the survey objective, the less intensive the level of sampling is required. Conversely, the closer the characteristics of a survey stratum are to an important threshold, such as minimum stocking standard or maximum density, the more intensively the stratum should be sampled. Example A: During your walk-through you can visually see the rows of planted trees that were planted 13 years ago are now over 3 meters tall. Survival was nearly 100% and forest health factors are very few. Natural regeneration and the competing vegetation is minimal. This stratum is very clearly free growing. A light intensity survey with few, if any, plots would be acceptable. Example B: Another stratum on the same opening has had poor survival. Stocking is patchy resulting from years of frost damage. Survival is better on the ridges, but poor in the depressions. Heights of the well spaced trees range from 30 to 200cm. A more intensive and more structured survey methodology will be required to adequately sample this diverse stratum. The better the stratification, the less plots will be required to achieve acceptable survey results. Generally more plots will result in a tighter survey confidence interval, however establishing large volumes of plots is not a substitute for inadequate stratification Plot Radius and Plot Multiplier Circular plots with a known radius are integral to the sampling procedure. The most common plot radius for the collection of silviculture data is 3.99 meters. There is no mandatory requirement to use any specific plot size, but the 3.99m plot radius has become a commonly used sample size. A rule of thumb is to select a plot radius that will ensure four or more crop trees will be found in the plot at target stocking. A plot with a 3.99 meter radius has an area of 50 m 2. This is determined using the formula for calculating the area of a circle. A hectare is m 2. This means that a 3.99 meter plot represents 1/200 of a hectare. The plot multiplier is determined by dividing m 2 by 50 m 2. Therefore, the plot multiplier is 200. The same mathematical principles can be applied to a plot radius of 5.64 meters. The plot multiplier is 100. For a 1.26 m plot radius, the multiplier is
53 Area of a plot (plot radius) x = plot area m or 2 2 (3.99m) x 3.14 = 50 m 2 2 Area of a hectare 1 hectare = 100m x 100m = m 2 Plot Multiplier m 50m = tree in a plot = 200 trees/ha Figure 5: Plot multiplier concept For a complete range of possible plot radii and their associated areas and plot multipliers, refer to item number 5 on the FS 660 card M-value The M in M-value represents maximum. That is, the maximum allowable number of well spaced or free growing trees that may be recorded in a single plot. The M value is derived from the Target Stocking Standard (TSS) divided by the plot multiplier it is not a value set or predetermined and is solely a function of this equation. Example: If the TSS is 1200 and the plot multiplier is 200, the M value is 6. The M-value is one of the principle factors considered within the formulation of stocking standards. The M-value acts as a cap on the number of trees in a single plot that can compensate for low stocking in other plots. Without the M-value, over stocked plots would over compensate for under stocked plots. The result would be an unacceptable level of variation in stocking, or a patchy stand. When stands of equal densities are compared, we find that the stand with an even distribution produces more volume over a rotation than the stand with a patchy distribution. The subject of M value, its necessity in our survey system and the effects changing it has on the resulting stands is discussed in Land Management Handbook number 50. The M-value is an integral part of the silviculture survey process and is essential to the determination of stocking, (NSR, SR or FG). The M-value, along with the minimum inter-tree distance and stratification criteria provides the district manager with some measure of assurance that the regenerated stand is sufficiently consistent in its stocking distribution. 53
54 Example: Consider the following extreme data set: Plot Number Number of Well Spaced Trees in Each Plot Without M With M Total Average Trees per hectare assuming 3.99m plots 1167 tr/ha 667 tr/ha Target Stocking Standard Minimum stocking Standard The example above depicts a situation where ignoring the M-value would produce a result of 1167 well spaced trees per hectare. This would suggest a near fully stocked stratum. Utilizing the M-value suggests a stocked stratum is below minimum. In reality this describes a stratum with patchy stocking levels and a great deal of variability in the stratum Tallying in Excess of the M-value Tallying trees in excess of the M-value was optional for many years. Some forest managers have expressed an interest in knowing the number of well spaced and/or free growing trees without the limitations of the M-value. At the request of many licensee representatives this additional data was added to the mandatory reporting requirements for surveys submitted after December 31, The stocking of a stratum is still determined based on the survey results which apply the M-value. The reporting of well spaced or free growing trees per hectare in silviculture labels is also still based on survey results which apply the M-value. The process for determining the species composition in the silviculture label remains calculated by including those trees in excess of the M-value Sampling Methods The establishment of plots is the basis for the statistical methods used in the survey. The requirement for a systematic pattern has often been stressed as important to the integrity 54
55 of the sampling method. Regardless of the sampling method used, stratification must be correctly completed. The basis for statistics requires that all potential plots in the survey area have an equal chance of being selected. The purpose of systematic locations for the plots is to ensure that there is no bias in the collected data. For instance, plots on rocky outcrops or in thick brush will be as likely to be chosen as plots in farm-field spots. It has the added benefit of ensuring appropriate coverage and simplifying the mapping of the stratum. The provincial survey system provides a great deal of flexibility in selection of intensity and survey design. A survey is reliant on the completion of stratification first, followed by the sampling of the resulting strata and lastly an analysis of the statistical reliability of the data collected. The method of sampling and the number of samples collected is determined by the surveyor beforehand based on the homogeneity of the stratum. Surveyors are expected to select the most appropriate survey method and intensity to adequately sample the characteristics of individual strata. Regardless of the sampling pattern used, the results should be significantly similar. If they are not, then the selected method may not have been appropriate. The credibility of the survey results is only as good as the appropriateness of the sampling method and sampling intensity chosen by the surveyor. All of the methods discussed below are equally valid survey methods. The key is selecting a sampling method and sampling intensity suitable for the complexity of the stratum being surveyed. Considerations: Homogeneous populations can be adequately sampled with few plots and with less structured sampling design. The less structured survey methods are more likely to have satisfactory results when completed by more experienced surveyors. The sampling method used is recorded on the bottom right corner of the FS 657 card, field 56. It is important to make a distinction between the sampling method and the sampling intensity. The four methods used, in order of decreasing structure are: Grid Sampling, Vector Sampling, Representative Sampling and Visual Assessments. All can be equally valid survey methods when applied under the correct conditions Grid Sampling The grid pattern method of plot positioning has historically been the most commonly used method. It is the most structured of the methods and as such is often the most expensive. It has the advantage of being a systematic method which will provide accurate, reproducible results. It also provides proof that surveyor has walked over the strata being reported on. The grid system may be used with a low or high plot intensity, which should depend on the variability within the stratum. 55
56 The grid pattern method is effective where a larger number of plots are required in a stratum. The grid pattern results in a more predictable plot location as long as bearing and distance measurements are taken carefully. Although one plot per hectare on a grid pattern was the most commonly used in past years, it is not a provincial standard. The grid pattern can also be very effectively applied when few plots are required, by simply widening the distance between plots and or strip lines, in examples A and B below. Plots are positioned at equal intervals along pre-determined strip lines. A baseline, as in example C, may be used to maintain the integrity of the grid pattern over longer distances. The example D shows an offset grid pattern that is also acceptable. The key to maintaining the randomness of this sampling method is the arbitrary selection of the starting point and maintaining the systematic positioning of the plots. Bearings and distances are predefined at the beginning of the survey. Inherent in the grid sampling method, some pre-determined plot locations can end up in the field as being too close to timber edges (under drip lines) or in unmappable nonproductive areas. It is recommended as a best management practice to include a version of the following clauses in survey contracts, to give guidance to surveyors to adjust survey grid designs and to standardize field offset standards for plot locations: If established plots in the field are located in un-mappable NP, then the plot should be offset a predetermined distance and bearing ONCE (after this initial offset, if an issue of placement is still occurring, the plot will be dropped). The survey should continue on the original grid design and NOT from the offset plot (in order to remain on the original survey design pattern). A. B C. D. Figure 13: Examples of locating plots on a grid pattern 56
57 Vector Sampling Vector sampling is less structured than the grid system and can be used when few plots are required. It is also useful for small, narrow and irregularly shaped strata. Procedural Steps: 1. The walk-through and stratification is completed as normal. 2. Based on the variability of the strata, as found during the walk-through, estimate the number of plots to adequately sample the stratum. This is often difficult for new surveyors. 3. Draw a desired sample strip line pattern on the stratum map. Measure the total length and bearing for each line segment. (Single line should be limited to very small strata.) If more than two bearing changes are required, vector sampling should be reconsidered in favor of grid sampling - unless mitigating factors preclude the use of grid sampling and a vector line with more than two compass bearings changes are required Figure 14: Example of bearing and distance for plots along vectors 4. To calculate the distance between plots along the line, divide the total length of the lines by the number of plots. Rounding this value will make the field application of the method easier without affecting the results. In this example 850m 6 plots = 141.6m, or 142m. 5. In openings that are < 10 ha in size and of irregular shapes, it is suggested as a best management practice for surveyors to switch to non-cardinal bearings and the vector sampling design. 57
58 142m 142m 142m 142m 142m 142m Figure 15: Example of locating plots along vectors Representative Sampling Representative sampling is a subjective assessment of an opening when compared with the more formal methods of silviculture surveys described in this manual. It should not be confused with the walk-through done before silviculture surveys. Representative sampling is a valid survey method where the conditions are clearly visually evident. If there is any chance a knowledgeable forest practitioner would find a differing result, then this method is not appropriate. Grid or vector sampling should be conducted. Representative sampling can be efficient and effective. The results of the representative sampling are expected to be significantly similar to those that would result from a formal survey. This survey is best applied when: the outcome of the survey is obvious and only a small quantity of data is required to substantiate a recommendation. i.e. Where the outcome is intuitively known. (i.e. obviously free growing, or grossly over maximum density, or in serious need of a brushing treatment). In other words, the decisions are apparent without the likelihood of controversy. It is not suitable where population variability is high or tree densities are near the important thresholds of maximum density, SR and FG status; skilled surveyors (many years of directly related experience) are used to making determinations and estimates based on their experience and professional judgment; an update or confirmation of conditions or characteristics following a treatment such as juvenile spacing or brushing treatments proving the treatments have been effective; or 58
59 an opening is nearing the early free growing date and the manager wishes to determine if the opening is on track to meet the free growing assessment period, or that an intervention is required. Procedural Steps: 1. The walk-through and stratification is completed as normal. 2. The surveyor wanders across the stratum stopping periodically and assesses, If a plot were established, would the data collected adequately represent the conditions on the stratum?. If the answer is yes, a plot is established at this point. If the answer is no, the surveyor continues to wander and repeat the process. If the answer is repeatedly no, or inconclusive, then this stand is not suitable for the representative sampling method. Grid or vector sampling would be more appropriate. 3. Upon collecting 5 or more plots, the survey summary compilation is completed as normal. The surveyor still provides all the normally expected survey results. Inventory and silviculture labels are generated based on the visual observations. Warning: these results are expected to meet the same levels of precision standards specified in table 17 of the RESULTS Information Submission Specifications Licensee Submissions (edition 3b) document, as for formal surveys. Since formal plots are not established, statistical analysis is not required Visual Assessments A visual assessment is a subjective assessment of an opening when compared with the more formal methods of silviculture surveys described in this manual. This survey method may also be referred to as a reconnaissance survey. It should not be confused with the walk-through done before silviculture surveys. A visual assessment should be conducted adhering to conventional survey objectives and guiding principles. However, the data gathering procedure becomes less formal. The visual assessment may be a general reconnaissance of the stratum, done by walking through, riding through, or flying over the opening. The information collected will generally involve ocular estimates with few, if any, plots established and a limited amount of quantitative data. Statistical validation is not applicable. When conducted by a skilled surveyor, the survey results can be sufficiently reliable to meet the required objectives and precision level of the survey. Visual assessment is a valid survey method where the conditions are clearly visually evident without reasonable justification for debate by experienced forest managers. If there is any chance a knowledgeable forest practitioner would find a differing result, then this method is not appropriate. Grid or vector sampling should be conducted. Visual assessments can be efficient and effective. The results of the visual assessment are expected to be significantly similar to those that would result from a formal survey. This survey is best applied when: 59
60 the outcome of the survey is obvious and only a small quantity of data is required to substantiate a recommendation. i.e. Where the outcome is intuitively known. (i.e. obviously free growing, or grossly over maximum density, or in serious need of a brushing treatment) skilled surveyors (many years of directly related experience) are used to make determinations and estimates based on their experience and professional judgment an update or confirmation of conditions or characteristics following a treatment such as juvenile spacing or brushing treatments proving the treatments have been effective an opening is nearing the early free growing date, and the manager wishes to determine if the opening is on track to meet the free growing assessment period, or that an intervention is required Example: An experienced surveyor flies via helicopter over a 13 year old cutblock at low altitude. There are no signs of dead or dying trees, the species composition is clearly a single species. The trees planted ten years ago are now 3m tall. Competing vegetation is limited to herbs and low shrubs. In this case, a combination of file data, visual observations, supporting photographs and brief ground based observations can meet the survey need. Very little if any quantitative data is required to confirm the obvious free growing nature of this block. This example is obviously free growing. The surveyor is still expected to provide all the normally expected survey results. Inventory and silviculture labels are generated based on the visual observations. Warning: these results are expected to meet the same levels of precision standards specified in table 17 of the RESULTS Information Submission Specifications Licensee Submissions (edition 3b) document, as the formal surveys.. Since formal plots are not established, statistical analysis is not required Multiple Sample Designs in an Opening The methods for plot positioning and or sampling intensity are often different in each of the strata within a single opening. The example below depicts stratum A using a grid plot location method starting from a selected starting tie point. The high level of sampling intensity may have been selected because of the patchy nature of the stocking identified during the walk-through. Stratum B uses a random method of plot location as well as a low level of sampling intensity. This method and intensity may have been selected to reflect the very consistent level of stocking on stratum B. The statistical analysis would subsequently have a small confidence interval. 60
61 A B Figure 16: An example of sampling methods that vary by stratum Guidance in minimum stratum size is also provided in the Forest Cover Stratification. Confirm the minimum stratum size expectations prior to completing any survey. The District Manager or Forest Stewardship Plan may establish specific minimum stratum sizes for particular types of surveys, e.g., stocking versus free growing. 5 Field Marking Procedures For all silviculture surveys, the following basic field procedures are recommended. 5.1 Point of Commencements The point of commencement (P.O.C.) is the beginning or starting point of the survey. A point of commencement may be required for the random sampling method. All tie points and points of commencement should be tied into easily identifiable features indicated on a map or on an aerial photo (i.e. road junctions, creek crossings, creek junctions or block boundaries). 5.2 Marking Plots Plot centers must be marked on the ground in such a way that they may be re-located for monitoring or auditing purposes. If the ground is frozen or very rocky ground and a shovel or stick cannot be used for a plot center, a comment should be made on the back of the FS 657 card indicating what was used for the plot center. This topic is also discussed in Appendix 12 GPS Application in Silviculture Surveys. 61
62 A B C D Tied to a branch and in a shovel slit at plot center Tied to a branch and tied loosely at the base of the tree used for plot center Figure 17: Examples of plot marking methods Tied to a branch and tied to a stick pushed into the ground at plot center Tied to a stick and in the shovel slit at plot center Method B should only be used if it will not bias the results of the survey plot. Method D should be limited to areas with low slash and vegetation. In all cases, the plot is marked in two places with flagging tape/ribbon: 1. as high as possible, to allow for easy identification of the location of the plot; and 2. at the exact location of the center used to measure the plot radius. 5.3 Strip Lines Strip lines are often used in association with the grid pattern method. They are typically oriented to run up and down hills, thus crossing contour lines and the ecological strata that are often associated with changes in elevation and often strata boundaries. This allows the surveyor to verify eco-stratification boundaries and identify strata boundaries. Strip lines should ensure that each stratum is evenly sampled and that the plots are well distributed. Strip lines should be marked in the field (refer to Appendix 5 Magnetic Declination and annual change links). Where the sampling intensity varies across strata, strip lines and or inter-plot distances may also have to be varied. 62
63 6 Amendments Periodically, the content of a silviculture plan or prescription requires changes. This may be a result of the re-consideration of the biological characteristics of the site, or to remedy a previously unrecognized data entry error, or for many other reasons. Since the silviculture plan or prescription is essentially a contract between a licensee and the government, both parties must agree to any changes. If an amendment has been approved, it replaces specific components of the silviculture plan or prescription. This must be reflected in the survey that is about to be conducted. A more complex issue is if an amendment has been applied for but not yet approved, there may be a cover letter, or copy of an un-approved amendment found on the opening file. A licensee may propose an amendment, but it only becomes a legal amendment to the silviculture plan or prescription once the district manager has approved it. This should trigger further investigation by the surveyor with the project administrator or supervisor. Unless a prior understanding has been reached between the surveyor(s), the district manager, and the licensee, the proposed amendments should not be incorporated into the survey methodology until the district manager has approved the silviculture plan or prescription amendment. A licensee must prepare an amendment to the silviculture plan or prescription if it becomes evident that the desired results of the silviculture plan or prescription are not achievable. Surveyors should be aware of this scenario when conducting a walk-through and when preparing treatment recommendations. A recommendation to prepare an amendment for a biologically necessary reason is expected of a silviculture surveyor. In addition, there are other reasons that may also require amendments. While these can be district specific, surveyors should also consider recommending an amendment when: the area has changed by more than an amount set by the policy of Ministry of Forests Mines and Land, or local MNRO Regional or District policy; the biogeoclimatic description and subsequent stocking standards are not representative of the current site conditions found on the opening. In selected situations where licensees employ surveyors skilled in the process of developing stocking standards for silviculture prescriptions or site plans, it may be suitable to collect data using both the specifications in the approved silviculture plans and prescriptions as well as the proposed amendment specifications. This additional information can be used to justify an amendment and will eliminate an additional survey from having to be performed. 63
64 7 Field Data Collection The following Sections 7 and 8 describe the standard methodology for survey data collection for Clearcut even-aged stand structure openings (as depicted by the following illustration). Illustration 2: Standard Clearcut Even-aged Stand Structure While the use of the standard Ministry of Forest s survey field cards and forms is not mandatory, they do allow for the following: organized collection of data required to meet the reforestation obligations of the silviculture plan or prescription data recording standard data compilation standard data summaries easy comparison of results If forms and electronic data software other than those provided by the Ministry of Forests, Mines and Lands are used, it is prudent to consider the data needs for reporting declarations into RESULTS. The most commonly used forms are highlighted in Appendix 3. Standard Ministry of Forests, Mines and Lands field cards and forms are available from Where a field is not applicable to a particular stratum, it is a common convention to mark the field with a dash, to signify the field was considered and not forgotten. 64
65 7.1 Data Field Descriptions for the Front of the Ministry of Forests FS 657 Card Information to complete the front of the Silviculture Survey FS 657 card will generally be obtained by reviewing the silviculture plan or prescription, corporate database, opening files and RESULTS data summary for the opening. All information obtained during the office review are usually confirmed during the initial walk-through. Described on the following pages is a comprehensive and detailed description of the information to be recorded on the Silviculture Survey FS 657 card. The Silviculture Survey FS 657 card has a number in each one of the fields that corresponds with the following headings. Next to the field name you will find two letters separated by /. This is provided as an indication of the relative importance of the particular field. Separate ratings are provided for stocking and free growing surveys. The letter to the left of the / represents the data importance for regeneration delay surveys and the letter to the right of the / represents the data importance for free growing surveys. In a few instances additional clarification is provided where a number is found in superscript. Example: H/L - means the data item is required or very important to collect, and do so accurately, during regeneration delay surveys, but is not important and may be omitted during a free growing survey. The letters are abbreviations for the descriptions listed below. Abbreviation Description of Importance Examples H T L O required to meet legislated requirements, essential component, accuracy is critical desired where it has an effect on treatments being prescribed useful for a complete description of a stratum, nice to have optional data, field provided for your convenience survey date, stocking standards, licence, cutting permit, block, licensee % coarse fragments where site preparation is being recommended project identification, access km growth intercept sample data N not required BAF during a single layered survey, soil depth during a free growing survey 65


66 Figure 18: FS 657 Silviculture Survey card, front side, with sample data. Figure 19: FS 657 Silviculture Survey card, front side, with field numbers. 66
67 1. Region: L/L Record the name or abbreviation for the region. This information may be located in the silviculture plan or prescription, opening file, corporate database, contract or from local knowledge. A map of the Forest Regions and Districts may be consulted. 2. District: L/L Record the name or abbreviation for the district. This information may be located in the silviculture plan or prescription, opening file, corporate database, contract or from local knowledge. A map of the Forest Districts and Regions may be consulted. 3. Location: L/L Record the geographic location of the opening. This information may be located in the silviculture plan or prescription, forest cover map, opening file, corporate database or from local knowledge. It should match any existing description or be corrected if the currently recorded location is misleading. 4. Project Identification/Contract Number: L/L If the survey is being completed under a contract, record the specified project identification number or contract number. 5. Page: L/L Record the page number. Include all silviculture survey cards in a logical numbering sequence. The goal is to provide a logically organized package of survey cards to include in the finished report. 6. Survey date: H/H Record the date in which the survey data was collected in the field. 7. Mapsheet -Opening No.: H/H The complete opening number is made up of both the mapsheet number and the opening number. Record the map sheet and opening number of the area being surveyed. This information may be located in the silviculture plan or prescription, opening file, corporate database or on the forest cover map. 8. Licence No.: H/H Record the licence number of the licensee responsible for the reforestation activities on the opening. This information may be located in the silviculture plan or prescription, corporate database or in the opening file. 9. Cutting permit: H/H Record the cutting permit number assigned to the opening. This information may be located in the silviculture plan or prescription, corporate database or in the opening file. Not every area has a cutting permit number. 10. Block: H/H Record the cut block number assigned to the opening. This information may be located in the silviculture plan or prescription or in the opening file. 11. Standards Unit: H/H Each opening has one or more standards units as defined in the silviculture plan or prescription. Enter the same number or letter as found in the silviculture plan or prescription. 12. Stratum: H/H Capital letters, numbers or a combination of both are acceptable. For an opening with strata that correspond to the standards units, the two fields will likely be the same to limit possible confusion. 13. Licensee: H/H Record the name of the major tenure holder responsible for the reforestation activities on the opening. This information may be located in the silviculture plan or prescription, corporate database or in the opening file. 14. Air Photo No Used: L/L Record the appropriate air photo numbers for the opening. This information may be located on the air photo that provides coverage of the block or on a flight line key map that covers the survey area. The air photo number found in the 67
68 silviculture plan or prescription is often of little value since that photo will usually have been taken before the block was harvested. 15. Surveyor Name(s) & Registration No(s): H 1 /H 1 Record the name(s) of the person who completed the survey. The Ministry of Forests, Mines and Lands assigns surveyor accreditation numbers to surveyors who have passed the silviculture survey accreditation exam. Record the silviculture surveyor accreditation number of the surveyor(s) who completed the survey. 1 If the survey is being completed without the use of an accredited surveyor enter none. 16. Stratum Area (ha): H/H Record the net area of the stratum. 17. History symbol: L/L Record the history of the opening by using the symbols described in the following table. The last 2 digits of the year of the treatment are to be recorded beside the code letter. This information may be located on the forest cover map, in corporate database or in the opening file. CLASS SYMBOL CODE HISTORY OR TREATMENT Disturbance Regeneration B BE BG BR BW D F I K L L% R S W P N Wildfire Escaped Burn Ground Burn Range Burn Wildfire Burn Disease Flooding Insect Fume Kill Logging Logged (10% increments) Site Rehabilitation Slide Windthrow Planted (>50 Planted) Natural (>50% Natural) Stand Tending Site Preparation Table 4: History symbols F H J M P R S T W B C G H RB S M MS W Fertilization Hack and Squirt Juvenile Spacing Mistletoe control Pruning Conifer Release Sanitation Spacing Commercial Thinning Brushing and Weeding Broadcast burn Chemical Grass Seeded Hand Preparation Range Management Burn Spot Burn Mechanical Mechanical and Spot Burn Windrow 68
69 18. Survey Objectives: H/H Check the box next to the applicable survey objective(s) for the survey being completed. Frequently more than one survey objective may be checked as surveyors regularly do a combination of surveys at the same time. Multiple objectives should be selected with care since the survey standards and methods vary as the primary objective of the survey changes. With a plantability survey being done in conjunction with a stocking survey there is no conflicting objectives. Both objectives may be checked. One will often choose to record the number of free growing trees during a stocking survey. The primary objective of a regeneration delay survey is the collection of well spaced tree and silviculture label data. The objective to be checked is the stocking survey. The collection of well spaced data is generally an integral component of a free growing survey but the primary objective is the collection of free growing tree and free growing silviculture label data. The objective to be checked is the free growing survey. However, if both stocking and free growing data is collected, it is recommended both survey objectives should be checked off. 19. Elevation: T/L Record the minimum, maximum and average elevation of the stratum in meters above sea level. This information may be located in the silviculture plan or prescription, in corporate database or on topographical maps. Elevation should be confirmed by contour map, recently calibrated altimeter, TRIM digital elevation database or high quality GPS during the walk-through. The elevation calculated by the commonly available inexpensive GPS units is not sufficiently accurate to determine elevation used subsequently for Seedlot selection. 20. Aspect: T/L Record the direction toward which a slope faces for the stratum. This information may be located in the silviculture plan or prescription or in a corporate database. Aspect should be confirmed during the walk-through. This information is recorded as found in the table below All three of the columns are acceptable methods. DESCRIPTION ABBREVIATION APPROXIMATE RANGE OF BEARINGS North N to 22.5 degrees North East NE 22.5 to 67.5 degrees East E 67.5 to degrees South East SE to degrees South S to degrees South West SW to degrees West W to degrees North West NW to degrees Flat F No identifiable aspect, associated with 0% slope Variable V No consistent aspect, associated with 69
70 Table 5: Aspect and associated abbreviations rolling and broken topography 21. Slope Pos.: T/L Record the position for the slope of the stratum. This information is recorded as crest, upper slope, middle slope, lower slope, toe, depression and level, as described in Figure 1 on the FS 660 card. This information may be located in the silviculture plan or prescription. Slope position should be confirmed during the walkthrough. Either name or abbreviation are acceptable. C U M L T D F Crest Upper slope Middle slope Lower slope Toe Depression Flat or Level Table 6: Slope position abbreviations 22. Surface Expression: T/T Record the surface expression of the stratum. This information may be located in the silviculture plan or prescription. Surface expression should be confirmed during the walk-through. For more information on surface expression, refer to Figure 2. on the FS 660 card. Either name or abbreviation are acceptable. P U R T C D F H M Plain Undulating Ridges Terraces Cone Depression Fan Hummock Rolling Table 7: Surface expression abbreviations 23. Slope %: T/T Record the minimum, maximum and average slope percentage of the stratum. This information may be located in the silviculture plan or prescription. Slope percent should be confirmed during the walk-through using a clinometer. 70
71 24. LFH (cm): T/L Record the average depth, in centimeters, of the Litter-Fermented- Humus (LFH) layer of the forest floor. Measure from the top of the mineral soil to the top of the litter layer. This information may be located in the silviculture plan or prescription. LFH depth should be confirmed during the walk-through. 25. Humus Form: T/L Record the humus form of the organic layer of the stratum. Three types of humus form are recognized: Mor, Moder and Mull. The humus form classification can be located in the silviculture plan or prescription, but it can change following harvest. Humus form should be confirmed during the walk-through. For more information on humus form, consult the regional ecological classification field guide, (a link to the one for the Prince Rupert Region is provided since it is the same for all regions) or Field Manual for Describing Terrestrial Ecosystems. 26. Soil Texture: T/L Record the soil texture of the stratum. This is generally inferred to be the upper 10 to 30 cm. This information may be located in the silviculture plan or prescription or corporate database. Regardless, the soil texture should be confirmed during the walk-through. For more information on soils classification consult the regional ecological classification field guide (a link to the one for the Kamloops Forest Region is provided since it is the same for all regions) or Field Manual for Describing Terrestrial Ecosystems. 27. Effective Rooting Depth (cm): T/L Record the depth in centimeters of the soil that is available for root development. This should involve digging a soil pit, observing root mats of wind thrown trees or looking at road cuts. This information may be located in the silviculture plan or prescription. Effective rooting depth should be confirmed during the walk-through. 28. Soil Depth (cm): T/N Record the depth in centimeters of the soil to bedrock or parent material. This is generally inferred to be the upper 10 to 30 cm. This should involve digging a soil pit, observing root mats of wind thrown trees or looking at road cuts. This information may be located in the silviculture plan or prescription. Soil depth should be confirmed during the walk-through. 29. Drainage: T/L Check the appropriate box to indicate the drainage of water through the soil. Drainage is often related to the soil texture. This information may be located in the silviculture plan or prescription. Drainage should be confirmed during the walkthrough. The three selections can be roughly defined by: Table 8: Drainage definitions Good water freely drains into the soil profile Fair intermediate generally associated with coarse textured soils Poor water is likely to accumulate on the surface and/or result in surface flow generally associated with fine textured soils, high soil bulk density 71
72 30. Coarse Fragments: T/L Check the appropriate box to indicate the estimated percent of coarse fragment content. Coarse fragments are greater than 2 millimeters in diameter. This information may be located in the silviculture plan or prescription. Coarse fragment percent should be confirmed during the walk-through. 31. BGC Zone, Subzone and Variant: H/H Record the biogeoclimatic zone, subzone and variant of the stratum. This information can be located in the silviculture plan or prescription, in a corporate database and on biogeoclimatic subzone maps and handbooks. However, biogeoclimatic information should be confirmed during the walkthrough. Regional ecological classification zone and subzone maps and field guides should be used to confirm the biogeoclimatic zone, subzone, variant and site series. Current zone/subzone/phase/variant phase code combinations can be found at Biogeoclimatic subzone/variant mapping is provided as a single ESRI ArcGIS compatible GIS layer, and can be obtained from When the ecological classification determined by the surveyor differs from the silviculture plan or prescription an amendment is not necessarily required. There is often minor variation between individuals conducting the assessment as well as the pre and post-harvest vegetation found on openings. The agency responsible for the silviculture plan or prescription may wish to consider an amendment if the re-evaluated and confirmed classification gives rise to a possible change in the stocking standards. 32. Site Series: H/H The regional field guides for identification and interpretation of ecosystems are used to determine the site series of the stratum. Record the 1(primary) site series that covers the majority of the stratum. Record the 2(secondary) site series that is the next predominant site series that covers the stratum. Record the 3(tertiary) site series, or third most predominant site series that covers the stratum. 33. Site Series %: H/H If there is more than one site series present within the stratum, a percentage should be assigned to each of the different site series. The site series should be rounded to the nearest 10 percent and the combined site series percentages should equal 100 percent. 34. Edatopic grid: L/L The moisture and nutrient co-ordinates of the site can be determined by using the edatopic grid of the corresponding biogeoclimatic zone site series. This information may be located in the silviculture plan or prescription, on biogeoclimatic maps and in handbooks. However, the edatopic grid should be confirmed during the walk-through. 35. Acceptability: H/H Enter P, A or U corresponding to the level of acceptability (preferred, acceptable or unacceptable) as is found in the silviculture plan or prescription. The use of the unacceptable is intended to clearly identify tree species that are present on the stratum, but are neither preferred nor acceptable. This does not mean that all unacceptable tree species must be listed, rather only those which appear to have potential 72
73 as an acceptable species but are not currently listed as such in the silviculture plan or prescription. If there is no silviculture plan or prescription the preferred and acceptable species are defined in the stocking standards provided by the district manager. This may be in the form of a district species selection guideline or by consultation with a Professional Forester. 36. Species: H/H Record the species that corresponds to the preferred, acceptable, and unacceptable fields of the FS 657 card. This information may be located in the silviculture plan or prescription. If there is no silviculture plans and prescriptions, the preferred and acceptable species are defined in the stocking standards provided by the district manager. Unacceptable species need only be included where unacceptable commercial tree species are present. 37. Ws Ht./Age: H 2 /H 2 Record the minimum height and/or minimum age of the corresponding well spaced trees that will contribute to stocking at the regeneration date. This information is not located in the silviculture plan or prescription, but is often established by the district manager or licensee. 2 These values may not be specified for all Districts. 38. Min. FG Ht: L/H 3 Record the minimum height that a healthy, vegetation competition free well spaced tree must attain in order to be considered free growing. This information will be specified in the silviculture plan or prescription or stocking standards in a forest stewardship plan (FSP) or forest development plan (FDP). If there is no free growing height stipulated on the silviculture plan or prescription, the free growing trees have no minimum free growing height requirement unless the surveyor, in consultation with the licensee, has selected to use the free growing guidelines found in Appendix 9 of the Establishment to Free Growing Guidebook. 3 Free growing minimum heights are only required if they are specified in the silviculture plan or prescription or as described in Appendix 9 of the Establishment to Free Growing Guidebook. 39. Silviculture Plan or Prescription Used / Free Growing Guidelines Standards Used: N/H Check the appropriate box as to which standards are being used for the survey. More information on this subject is found in Appendix 9 of the Establishment to Free Growing Guidebook 40. Free Growing Damage Standards Used: L 5 /H Record the date or version number of the Provincial Free Growing Damage Criteria or standards used to determine acceptable free growing trees. 5 see Acceptable Tree Characteristics earlier in this document. 41. Layer: H/H For as single layered stand, enter the stocking standards into the row for layer 4. For layered surveys additional rows would be completed to match the stocking standards as found in the silviculture plan or prescription. 42. Target Stocking Standard/ha: H/H Record the target stocking standard (TSS) for the stratum being surveyed. The target stocking standard is the target number of preferred 73
74 and acceptable healthy, well spaced or free growing trees per hectare. This information may be located in the silviculture plan or prescription. 43. Target Maximum/Plot: H/H Record the maximum number of well spaced or free growing trees to be tallied in a plot for the stratum. Maximum per plot is also called the "M" value. This is calculated by dividing the target stocking standard per hectare by the plot multiplier (fields 59 or 60). The M value places a ceiling on the number of well spaced trees and free growing trees in any one plot. This prevents over-stocking in one plot compensating for under-stocking in other plots. This is a key concept in the survey system. Thus, a relatively uniform distribution of stems must be attained before the opening can achieve regeneration delay or free growing status. The Ideal Target Inter tree distance is a concept that is no longer used. 44. Minimum Inter-Tree Spacing: H/H Record the minimum inter-tree distance between well spaced or free growing trees. Minimum inter-tree distance specifies the minimum allowable horizontal distance between preferred and/or acceptable trees which are well spaced or free growing. This information may be located in the silviculture prescription, site plan or FSP. For information regarding accepting trees at the distance allowed at the time of planting, refer to the Minimum inter-tree distance section. 45. Minimum Stocking Standard Preferred + Acceptable: H/H Record the minimum number of healthy, preferred and acceptable, well spaced or free growing trees per hectare (MSSpa). This number of trees must be on an opening in order to consider the area satisfactorily restocked or free growing. This information may be located in the silviculture plan or prescription. In older silviculture plan or prescriptions, prior to the requirement to specify a MSSp (see next field) MSSpa is referred to as MSS. 46. Minimum Stocking Standard Preferred: H 6 /H 6 Record the minimum number of healthy, preferred well spaced or free growing trees per hectare (MSSp). This is the minimum number of trees that must be on the opening in order to consider the area satisfactorily restocked or free growing. This information may be located in the silviculture plan or prescription. 6 - If the silviculture plan or prescription was approved prior to April 1, 1994, there will be no minimum stocking standard for preferred species. This field will then be recorded as - or N/A. (see section on MSS vs. MSSp vs. MSSpa). 47. Planting Stocking Standard/ha: T/N Record the target number of planted trees per hectare desired in the stratum. This planting stocking standard is calculated using the formula to the left of field 51 of the FS 657 card then rounded up to the next hundred (e.g becomes 1400), or set by district or licensee policy. 48. Planting Maximum/Plot: T/N Record the maximum number of plantable spots to be recorded in a plot for the stratum. This is calculated by dividing the planting stocking standard per hectare by the plot multiplier, (fields 59 or 60). 49. Planting Ideal Inter-Tree Spacing: T/N This field is recorded in plantability surveys. This distance will be specified in the planting contract, Schedule B. It should be set in consideration of the instructions that will be given to the planting crews. 74
75 50. Planting minimum inter-tree spacing: T/N Record the minimum inter-tree distance between planted and/or well spaced trees. This distance will be specified in the planting contract, Schedule B. It should be set in consideration of the instructions that will be given to the planting crews. 51. Expected Survival %: T/N Record the estimated expected survival of the species that will be planted on the site. This information comes from the contract or the district manager or can be based on local knowledge or on practical experience. If more than one species is recommended to be planted on the site, the expected survival rate is a combined or pro-rated estimate of each species. The contract should provide the number for the expected natural fill-in rate. The planting stocking standard is always rounded up to the nearest 200. For example, if the planting stocking standard calculation resulted in 1233, this number would be rounded to The planting stocking standards calculation can be overridden by the planting contract. 52. Conifer to Brush Ratio (%): N/H 1 Record the height of the crop tree relative to competing vegetation for free growing trees. This is usually recorded as a percentage. This information may be located in the silviculture plan or prescription. If there is no conifer/brush ratio stipulated on the silviculture plan or prescription, there is no legal requirement for the free growing trees to meet a conifer/brush ratio. However, the crop trees must still be free growing and the current method may be appropriate. Consult with the holder of the silviculture plan or prescription on how to assess areas with no conifer/brush ratio specified in the silviculture plan or prescription. 1 May not be present on stocking standards approved as part of an FSP as it is not a legal content requirement under FRPA. 53. Maximum Density (countable conifers/ha): T/H Record the maximum allowable density of the total countable conifers. For more information on this subject refer to the Maximum Density Section. 54. Basal Area Factor (BAF): H 9 /H 9 Record the prism size used in completing the prism sweeps in a multi-story survey. A discussion of this topic is found in Appendix 4. Used for multi-story surveys, in partially cut even-aged stands and intermediate cuts where layer 1 trees are being recorded. 9 Only required in multi storey surveys or DFP related surveys like SEDRSS. 55. Sampling Method: H/H Check the box corresponding to the sampling method being used on this stratum. Descriptions and recommendations for selecting a sampling method is provided in the Sampling Principles section of this document. 56. Distance between plots (m): H 7 /H 7 Record the average distance, in meters, between plots that was used during the survey. If a random sampling design was used, note random in this field or leave it blank. 7 Only required for grid sampling and vector sampling 75
76 57. Distance between lines (m): H 8 /H 8 Record the average distance, in meters, between strip lines that was used during the survey. If a random sampling design was used, note random in this field or leave it blank. 8 Only required for Grid Sampling 58. Radius 3.99 or 5.64 m: H/H Check one of these boxes if a plot radius of 3.99m or 5.64 m is being used or enter a different specific plot radius in the blank provided. 59. Plot Radius (m), Area, Multiplier: H/H Record the plot radius, in meters, used for the survey. Record the plot area, in m 2, associated with the plot radius used for the survey. This number can be found on Table 5 of the FS 660 card. Record the number used to multiply the tree counts in the survey plot to yield equivalent trees per hectare. Refer to the Plot Radius and Plot Multiplier section for more information. 7.2 Data Field Descriptions for the Back of FS 657 card Information to complete the back of the FS 657 is gathered during the initial walkthrough of the stratum. It is important that the information collected in this section is accurate so that it can be incorporated into the development of treatment recommendations and contract requirements. 76

77 Figure 20: FS 657 Silviculture Survey card, back side, with sample data. Figure 21: FS 657 Silviculture Survey card, back side, with field numbers. 77
78 Previously described field numbers will not be repeated in the descriptions to follow. Refer to a previous section for their description. 60. Screefing Depth: T/N Record the maximum depth, in centimeters, that is required by the planter to remove the organic matter from a spot to prepare it for planting. This information is district specific and more often site specific. 61. Scalp Size: T/N Record the maximum scalp size, in centimeters, that is required by the planter to remove the organic matter from a spot to prepare it for planting. When recommending the maximum scalp size, one must consider vegetative competition and soil nutrient status. This information is district specific and more often site specific. 62. Acceptable Planting Medium: T/N Record the acceptable planting medium for the site. 63. Tree Species Planters Must Recognize: T/N Record the tree species that a planter must recognize during planting either to respect or to ignore. This information will be site specific depending on the biogeoclimatic zone site series. 64. Minimum Height for Trees to be Visible: T/N Record the minimum height of a tree, in centimeters, that a planter is expected to see during planting and will influence the number of plantable spots. This value may be different than that shown in the acceptable tree characteristics under height/age on the front of the FS 657 card. This information will be site specific. When establishing this value, consider the height of surrounding vegetation. 65. Planting Difficulty Points: T/N Record the number of points for the planting difficulty for the stratum. This information is site specific and can be determined by using Table 10 on the FS 660 card. 66. Planting Difficulty: T/N Check the box that represents the average planting difficulty for the stratum. This information is site specific and can be determined by using Table 10, and particularly the bottom right (Difficulty Class) on the FS 660 card. 67. Estimated Slash Cover %: T/T Record the estimated percent of the ground that is covered by slash and debris. This is a visual observation that should be averaged throughout the entire stratum. Slash cover percent should be estimated during the walkthrough. 68. Average Slash Height (cm): T/T Record the estimated height, in centimeters, of the slash and debris on the ground. This is a visual observation that should be averaged throughout the entire stratum. Average slash height should be estimated during the walkthrough. 69. Slash Class: T/T Check the box next to the appropriate estimated slash class. This is a visual observation that should be averaged throughout the entire stratum. Slash class should be estimated during the walk-through. 70. Slash Distribution: T/T Record the estimate of slash continuity. This is a visual observation that should be averaged throughout the entire stratum. Slash distribution should be estimated during the walk-through. Continuous slash is spread evenly over the stratum. 78
79 Patchy slash-free areas cover approximately the same percentage of ground as slashcovered areas. Scattered slash-free areas are larger than slash-covered areas. 71. Estimated Brush Cover %: T/H Record the estimated percent of competing vegetation within the stratum. This is a visual observation that should be averaged throughout the entire stratum. Brush cover should be estimated during the walk-through. 72. Average Brush Height (m): T/H Record the estimated height, in meters, of the competing vegetation within the stratum. This is a visual observation that should be averaged throughout the entire stratum. Average brush height should be estimated during the walk-through. 73. Brush Severity: T/H Check the box next to the appropriate estimate of brush severity. This is a visual observation that should be averaged throughout the entire stratum. Brush severity should be estimated during the walk-through. 74. Brush Distribution: T/H Record the spatial arrangement or distribution estimate of brush continuity. This is a visual observation that should be averaged throughout the entire stratum. Brush distribution should be estimated during the walk-through. Continuous brush is spread evenly over the stratum. Patchy brush-free areas cover approximately the same percentage of ground as brushcovered areas. Scattered brush-free areas are larger than brush-covered areas. 75. Potential Danger Trees: T/T Record the estimated number of danger trees per hectare that are greater than 5 meters in height. This is a visual observation that should be averaged throughout the entire stratum. The number of danger trees should be estimated during the walk-through. 76. Danger Trees on Perimeter / Outside of the Stratum: T/T Check this box if there are danger trees on the perimeter or outside of the stratum. 77. Work Hazard: T/T Record the estimated potential work hazard that the danger trees may pose to workers on the site. Check the appropriate box. This is a visual observation that should be averaged throughout the entire stratum. Work hazard should be estimated during the walk-through. It is often valuable to describe the snag distribution. For example, found in south corner only or none in block, or many on perimeter. Visit the Ministry of Forests, Mines and Lands website for information about Wildlife Danger Tree Assessment. 78. Machine Trafficability: T/T Record the ability of a machine to travel through the stratum. Check the appropriate box next to machine trafficability. This is a visual observation that should be averaged throughout the entire stratum. Machine trafficability should be estimated during the walk-through and will be impacted by slope, slash, soil moisture, residuals and drainage patterns (i.e. creeks). 79. Soil Compaction Hazard: T/T Record the soil compaction hazard rating of a machine traveling through the stratum. Soil compaction hazard can be estimated during 79
80 the walk-through as an average throughout the stratum. This information may be determined by using Table 13 on the FS 660 card. 80. Resource Values: T/T Record the presence or absence of the specified resource values in the area by checking the appropriate boxes, using visual observations. Resource values can be estimated during the walk-through. They can also be found in the silviculture plans and prescriptions. 81. Access: T/T Record the distance, in kilometers or hours, to the opening from a known location. The kilometers or hours should be listed by each of the individual modes of transportation. 82. Total Travel Time: T/T Record the estimated time required to travel to the opening from a known location. The time is to be recorded in hours and should be rounded off to the nearest ¼ hour. Record the nearest readily identifiable geographic location, such as a city, a town, a village, or a camp. 83. Potential Road Construction and Maintenance Problems: T/T Record on the card and note on the survey map any road construction and maintenance problems which could be encountered during any upgrading, construction, or reconstruction of the access to the opening. Where a road into an opening has been deactivated, add a check to indicate so and estimate the length of road from the start of the deactivation to the opening. It is not necessary to describe the extent of repairs necessary to re-construct a deactivated road. 84. Accommodation: T/T Record the most convenient accommodation available when surveying the opening. This may be useful for crews returning to conduct a future treatment. 85. Other: L/L This field is left open for general comments about the stratum. The following are examples of what could be recorded: success of treatments to date; defining characteristics of the stratum; the major limiting factors to achieving free growing; the average snow depth during the time of survey; ribbon color used; the preliminary treatment recommendation(s) for the stratum. 80
81 7.3 Silviculture Survey Plot Card of the Ministry of Forests - FS 658 The Silviculture Survey Plot Card FS 658 is commonly used to collect data from individual plots during a silviculture survey. Data from the FS 658 card(s) is then summarized on the Silviculture Survey FS 659 Summary cards, or entered into a survey summary program. Detailed on the following pages is a comprehensive discussion regarding the information to be recorded on the FS 658. The sample FS 658 below has a number in each of the fields that correspond with the following headings. 81


82 Figure 22: FS 658 Silviculture Survey Plot card, with sample data. 82
83 Figure 23: FS 658 Silviculture Survey Plot card, with field numbers Previously described field numbers will not be repeated in the descriptions to follow. Refer to a previous section for their description. 86. Point of Commencement: H/H Record a written description of the location of the point of commencement in the field. This location should be identifiable on an air photo and a map to ensure the strip lines and plots can be accurately positioned on a map at the completion of the survey. This also applies to random plots. 87. Bearing and Distance: H/H Record the bearing and distance from the point of commencement to the first plot. Surveyors do not universally fill this field out the same way. Some surveyors may write 90 at 100m, or 100m E, or 90. The bearing and distance data is recorded from the plot above to the plot below. If the bearing and distance is from a plot that is not directly preceding the present plot, then a reference should be made to the preceding plot. For example, 100 m E of plot Plot No.: H/H Record the plot number assigned to the plot. 89. Stratum: H/H This field is applicable to multi-storied surveys, or even-aged systems. 90. Layer: H 9 /H 9 In multi-storied stands, there are four layers (1 - mature, 2 - pole, 3 - sapling, 4 - seedling) that are tallied separately in each plot. 9 Only used in multi storey, layered, DFP or SEDRSS surveys. 91. Total Trees: H/H Record the total number of live coniferous and broadleaf trees within the plot. This includes both acceptable and unacceptable quality trees. Noncommercial tree species (as defined by the Resource Inventory Branch) are not tallied under total trees. All trees, regardless of their height, are to be tallied, including germinants. Table 9 provides guidance on the level of accuracy required. 92. Total Conifers: H/H Record the total number of live coniferous trees, including both acceptable and unacceptable quality trees in the plot. All conifers, regardless of their height, are to be tallied, including germinants. Refer to the RESULTS for a list of the tree species, the codes and the common names of those species that are found in British Columbia. A list is also present on the FS Count. Conifers: T/H 11 The term countable trees is used in reference to maximum density determination. Record the total number of live coniferous trees in the plot, regardless of species and quality, which are greater than or equal to the minimum countable height (See field 94). This data does not legally need to be collected during stocking surveys or for standards units that do not have a maximum density indicated in the silviculture plan or prescription. If it is apparent during a stocking survey that a spacing treatment may be required, surveyors will typically collect this information. It is not required for strata that are obviously less than maximum density. 11 Only used for strata with a maximum density requirement in the stocking standards. 94. Count. Height: T/H 11 Record the countable height. For guidance on determining countable height consult the maximum density of this document. 83
84 For openings managed on an uneven-aged basis, the calculation of countable height is not applicable, since all conifers in layer 3 contribute towards the maximum density calculations. 11 Only required for strata with a maximum density requirement in the stocking standards. 95. Well spaced or Free Growing: H/H Check ( or ) the appropriate box that corresponds to the objective of the survey. Selecting one of these boxes will signify that the data collected in the columns of field 98, 101 and 102 represents either well spaced trees or free growing trees. When both stocking and free growing information is collected, check and report information on both lines. The preference in selecting preferred or acceptable tree species is only important if the stratum has a minimum preferred stocking standard found in field 46. If field 46 is blank, there is no requirement to select preferred or acceptable tree species. Preferred or acceptable species may be selected equally. Figure 24 assumes field 46 has a minimum preferred stocking standard value. All of the conifers in the example provided are preferred or acceptable species and meet the well spaced criteria. Figure 24. An example of tallying well spaced trees. 84
85 When conducting a regeneration delay or stocking survey, the surveyor is expected to maximize the number of well spaced trees in each plot, even if this means a reduction in the number that are of the preferred species, within the limits of the M-value. By selecting only preferred species (marked P in the figure above) only 5 trees would be identified as well spaced. By selecting a mix of both preferred and acceptable species, more will be identified. If the M-value were 6, it would be simple to select 4 preferred plus 2 acceptable, thereby maximizing well spaced to the M-value. 96 & 97. Blank (no title): H/H Fields 96 and 97 should be considered together. These two fields are used to provide headings to the columns and subsequent data collection in field 98. The data is found in fields 35 and 36. Example: Segment of FS 657 Segment of FS 658 ACCEPTABILITY SPECIES PREFERRED AND ACCEPTABLE SPECIES p Pli p p a u p Lw Pli Lw Sx Bl a Sx u Bl or PREFERRED AND ACCEPTABLE SPECIES Pli Lw Sx Bl p p a u All cards used to collect data for a given stratum should be prepared with column labels in the same sequence. Data summary errors are more likely if they are not. 98. Titles Based on Field 96 & 97: H/H The data recorded in the 99 fields depends on the box checked in field 95. Record the number of trees in the appropriate species column as labeled in field 96 & 97. Record all those present in excess of the M-value where they exist in the plot. Unacceptable species can also be recorded here if they are performing well on the opening. Refer to the recording unacceptable species as well spaced or free growing section for more information about recording unacceptable species. Well spaced and free growing trees may be recorded in field 98, regardless of the box checked in field 95. Ensure if this is done, that the data collected is clearly indicated (this could be a F, FG, W or WS recorded in column 90) 99. Total W: H/H Record the sum of the preferred and acceptable well spaced trees in the plot, up to a maximum of the M-value. If the maximum value is reached, or exceeded, 85
86 record the letter M rather than the numeric value. The number of Ms will be used in calculations on the FS 659 card. Do not include unacceptable species in this field Total FG: N/H Record the sum of the preferred and acceptable free growing trees in the plot up to a maximum of the M-value. If the maximum value is reached, or exceeded, record the letter M rather than the numeric value. When tallying free growing trees, the surveyor must maximize the number of preferred and acceptable trees that meet the criteria for an acceptable free growing tree, using the free growing damage criteria. The M s will be used in calculations on the FS 659 card. Do not include unacceptable species in this field Age: H/H The data recorded in this field depends on the box checked in field 95. Select an average well spaced or free growing tree (depending on the selection made in field 95) from within the plot. Measure and record the age of the selected average tree. In older or multi-storied stands, tree ages are based on ring counts derived from bored core samples. Samples must include the correction factor for the bore height based on the site index. Appendix 7 contains a table to adjust the age at boring height to the actual age. The age of many young stands can be reliably estimated by counting the number of whorls in species that exhibit determinate growth. Cutting a disc from the base of a sample tree and counting the number of rings will also estimate the age of younger trees, and those species of undetermined leader growth. Destructive sampling for the purpose of accurately determining age is acceptable. The age of the trees that have been planted can often be determined by adding the age of the planting stock plus the number of completed growing seasons since the planting treatment. The source of the trees is irrelevant to the determination of age. The point is, how old is the tree not how many years has it been growing on this area. For example; where 2 year old planting stock has been growing on an opening for 4 years, the age of the tree is recorded as 6, not 4. Where surveys are being conducted during the growing season, record the number of completed year s growth. The reported age may be more accurately described as the number of completed growing periods. A survey conducted in June or July will not include the current partial year s growth Total Height (m): H/H The data recorded in this field depends on the box checked in field 95. Select an average well spaced or free growing tree (depending on the selection made in field 95) from within the plot. Measure and record the total height to the last completed year s growth, from the point of germination to the top of the terminal bud of the dominant leader of the selected average tree. It is preferred that sample measurements are recorded for approximately 1 out of every 4 plots established. A minimum of three samples collected per stratum is considered a standard practice, although more samples are acceptable if not encouraged. 86
87 Where surveys are being conducted during the growing season, record the height to the last completed year s growth. A survey conducted in June or July will not include the current year s leader growth Plantable: T/N Check ( or ) in this box if a plantability survey is a survey objective. It is recommended that plantability data be collected on all surveys where significant quantities of plantable spots are present. If a multi-story survey is being completed, plantability is recorded in the row of data corresponding to layer four, or the lowest layer recorded Number In : H 12 /H 12 Check ( or ) in this box, if a multi-story survey is being completed. The data entered here corresponds with the data collected for layer 1, and represents the number of layer 1 trees found within the prism sweep. This data is used to calculate the basal area. It is desirable to collect this data on all multi-story surveys. 12 Only mandatory for multi-story stands or for any stocking standard that have a minimum basal area specified GI Sample & Data Spp.: N/H If this stratum is suitable for determining site index by growth intercept method, record the measurements and species here. Refer to site index training materials on the growth intercept method Plantable/Number IN : The data recorded in this field is dependant on the box checked in field 103. See field 104 for Importance. Record the number of plantable spots found in the plot. A plantable spot is defined as suitable microsites on which a seedling could be planted (see field 63). The suitability of the microsites is dependent on site conditions and limiting factors such as soil moisture, soil temperature, soil nutrients, climatic conditions, tree species and the stock type to be planted. The intent of recording the number of plantable spots is to determine if planting can be completed without site preparation. It will also estimate the number of seedlings that will be required to complete a planting project on the survey area. As a result it is important to record the number of plantable spots based on the same criteria that will be used by the planters. Since the planters will be instructed to plant trees on microsites as directed by the licensee s silviculture staff, it will be important to discuss planting spot selection with them prior to conducting the survey. During a survey on a multi-story stand, the plantable data is recorded in the row for layer 4, (or the lowest layer) and the number of layer 1 trees IN the prism sweep is recorded in the row for layer Preparable: T/N Record the number of preparable spots found in the plot. A preparable spot is defined as a microsite that is presently unsuitable for planting but, with site preparation, could become an acceptable planting microsite. Preparable spots are tallied independent from plantable spots. The preparable data is recorded in the row for layer 4, (or the lowest layer) and the modal diameter of layer 1 trees is recorded in the row for layer Competing Vegetation Species: T/H Record the first four letters of the genus, followed by the first three letters of the species of the competing herbaceous, shrub or 87
88 brush species (see table 8 FS 660). This method is recommended but not essential. Consult with the district for a comprehensive list of competing vegetation Competing Vegetation - % Cover: T/H Record the average percent of the ground that is covered by the competing vegetation species. This is an ocular estimate of the competing vegetation percent cover in and around the plot, not just within the plot Competing Vegetation - Height (m): T/H Record the average height, in meters, of each of the competing vegetation species. This is an ocular estimate based on the average height of the competing vegetation in and around the plot, not just within the plot Forest Health Pest Code: H/H Record the applicable pest code of the forest health on each affected tree within the plot, not just on the well spaced or free growing trees. Only those trees that are found to be unacceptable based on the free growing damage criteria are recorded. Forest health data is collected at every plot. If there is more than one forest health factor on the same tree, record only the one with the longer and/or more damaging impact. Multiple rows may be required where multiple forest health factors are present in a single plot. Refer to the Damage Agent and Condition Codes FS 747 for a comprehensive list of forest health factors and their corresponding pest code. If a forest health factor is unknown or uncertain, describe and record the type of damage, obtain a sample, and consult either the Field Guide to Forest Damage in British Columbia, or the district or regional forest health specialist. If the licensee requires the surveyor to record all pest incidence, beyond damage criteria for treatment or planning reasons, this can be recorded here but separated from required data. It is suggested to separate this tally in space between plots or in the comments section in order to keep the data separate Forest Health Live Trees: H/H Record the number of live trees affected by the forest health indicated in field Forest Health Dead Trees: H/H Record the number of dead trees affected by the forest health indicated in field Notes: L/L Record site specific details that are relevant to the survey and potential treatment recommendations. If the opening being surveyed is a Retention Silviculture System and has Dispersed retention, this would be the appropriate location to record Tree Cover Pattern observed (refer to section ) Leader height, local anomalies within a stratum, presence of wildlife trees are but a few of the dozens of possible items that might be recorded. The notes can often be as valuable as the numerical values. Inventory Label Background: Inventory labels are produced to concisely describe a few of the more important characteristics of the strata surveyed. It is important to recognise an inventory label is a very general description. As such there are a number of liberties taken in the generalization of a very complex young forest into a rudimentary string of numbers and letters. Some surveyors may wish to collect data in a manner different than the methods described below. The inventory label data will be transferred to central 88
89 Ministry of Forests, Lands and Mines database. It becomes important that the data be recorded in a consistent manner in order to allow subsequent analysis. Silviculture surveyors receive guidance on the creation of inventory labels from the MoFLNRO, and Forest Analysis and Inventory Branch. The methods described below are considered their second most representative data source. Permanent sample plots are the only superior data source. The label describes commercial tree species. For the purpose of creating inventory labels the list of species considered commercial can be found in the reference RESULTS and the FS 660. Inventory labels are determined through a combination of visual observations and individual tree measurements from within the stratum. The estimates and measurements are periodically recorded on the FS 658 plot card. Collect at least three sets of observations or approximately one per four plots established to represent each stratum. These will be roughly averaged, (mathematically averaged and manually adjusted as the surveyor sees fit to best describe the stratum) and combined with data from other sources to generate an inventory label for the stratum. Species composition is determined by ocular estimate. This method of visual observations is known to be most directly comparable to the methods by Forest Analysis and Inventory Branch on mature stands. The leading and second species should be determined during the walk-through stage of the survey process for the purposes of stratification. The determination of species composition is based on tree density for young stands. Volume is used once merchantable volume is present. Merchantable volume, for this purpose is considered trees with a dbh of 12.5 cm and greater. In practice this means species composition is based on volume only for layer 1 in multi-story surveys. All the rest are based on visually estimated tree density. An important expression of the generality of the inventory label can be seen in the requirement for species composition to be rounded to the nearest 10% and expressed as a single digit, e.g. 40% = 4. The combination of all species must sum to 100% or 10. Inexperienced surveyors often overestimate the minor species present. They also under estimate the proportion represented by small trees that may be visually obscured by larger trees. This is most common where dense layers of shade tolerant species naturally regenerate under the partial shade of larger and older planted trees. Age and height are recorded to the last completed year s growth Str.& Layer: H/H Fields 117 through 124 are provided as a location to record the data used to create inventory labels. Two areas are provided to keep the data for two strata separate. Record the stratum as found in field 12 or the layer (for multistory surveys) as found in field Leading Spp.: H/H Record the abbreviation for the most abundant species %: H/H Record a visual estimate of the proportion of total trees present that are Leading Spp. The species composition is rounded to the nearest 10 percent and expressed as 1=10%, 4=40%. When combined, the species composition must equal 100%. 89
90 118. Age: H/H Select a dominant or co-dominant tree of the leading species as recorded in field 116 and determine its age Ht: (m) H/H Select a dominant or co-dominant tree of the leading species as recorded in field 116. Height is expressed in m to 1 decimal place nd Spp.: H/H Record the abbreviation for the second most abundant species % Age Ht. (m): H/H Record the three values as described in field 117, 118 and 119 for the second most abundant species as recorded in field Minor Spp.: H/H For the purpose of data collection, minor species can be considered all those species not already recorded in fields 117 or 121 that represent 10% or more of the total species composition %: H/H Fields 122 and 123 are treated as a matched pair. The percentage entered in field 123 corresponds to the species entered above it in field Cr Cl: H/H Forest Analysis and Inventory Branch prefers that crown closure be determined from the visual observation from aerial photography. There are a number of speckle diagrams available to assist with calibrating ones estimate. Since recent aerial photographs are not always available we are forced to use ground based visual assessments. Figure 27a in the FS 660, Silviculture Survey Reference may be useful as a benchmark. It should be used with caution. While it may be effective for robust coastal stands, it often over estimates the interior stands whose crowns are smaller in diameter. Lower site index sites are also greatly over estimated. Crown closure is estimated to the neared 1%. 7.4 Suggested Allowable Errors in Measurement The following represents the generally accepted contract tolerances in place in many survey contracts by licensees. These tolerances are secondary to the final data requirements; encrypted in FRPA via the - RESULTS - Information Submission Specifications Oct 1, 2008 Section 7 Precision Standards. Herein, Table 17 Minimum Precision Standards has been established and parallels the suggested allowable errors below. Attribute Allowable Error P.O.C. 10 meters All plot centers and tie points 5% of horizontal distance Total trees, Total conifers and Count conifers 20% per hectare Well spaced tr/ha 10% Free growing tr/ha 10% Plantable spots/ha 20% Tree heights 20% Tree diameters 20% Tree ages 20% 90
91 Site index Stratum area in hectares Forest health factors Table 9: Allowable errors in measurement 3 meters + 10% >10% absolute difference (e.g. 2% vs. 13% of incidence of host species) 7.5 Forest Health In the context of a survey, any cause of tree damage is called a forest health factor. A forest health factor is only considered to be a pest on a particular opening when it presents a risk to the successful achievement of management objectives. As a result only pests are recorded in the plot data. 1) Tally only those occurrences of forest health factors where the extent of damage is unacceptable as defined in the free growing damage criteria for the openings stand structure (even or uneven-aged). If there are two forest health factors on the same tree, only one is recorded. The one to record should be the one with the more detrimental effect. For example, a pest which causes mortality should be recorded over one that causes a growth rate reduction. 2) Tally all incidences of forest health factors (regardless if acceptable or unacceptable) if the licensee requires this data. It is recommended that these values be recorded as notes and included when significant in survey reports and recommendations. When it appears evident that a particular forest health factor is a serious problem in an opening, the survey should be scheduled for a time when the factor is most apparent and easily seen. Forest health is a key component of stratification. Areas with treatable incidence levels of forest health factors should be stratified as a separate stratum, as should areas that are NSR or not free growing because of a high incidence of forest health factors. Useful forest health references include, but are not limited to, the following Forest Practices Code Guidebooks: Forest Health Survey Bark Beetle Management Defoliator Management Dwarf Mistletoe Management Management of Terminal Weevils in BC Pine Stem Rust Management Root Disease Management Tree Wound and Decay 91
92 A valuable companion reference to these guidebooks is the course materials for the Forest Health for Silviculture Surveyors (2000), as well as the Forest Health Network s Common Tree Diseases of British Columbia at A useful field guide is the Field Guide to Forest Damage in British Columbia. 8 Data Compilation For each stratum identified and confirmed in the field during the walk-through, a separate compilation must be completed. If compiling well spaced and free growing data for the same stratum, the data must be compiled separately on two different FS 659 cards. Various field cards (e.g., Silviculture Survey Summary FS 659, Calculation Card for Silviculture Survey Confidence Limits FS 1138A, Steps to Calculate Confidence Limits for Silviculture Surveys FS 1138B, and Silviculture Survey Reference FS 660) are available to assist in data compilation. The FS 659 is used to summarize data collected on the FS 657 and FS 658. Before leaving the opening, statistical calculations must be completed to ensure statistical precision has been met. Additional plots may need to be established in order to meet statistical precision. Comments that will be used to create treatment recommendations should also be recorded prior to leaving the opening. The process of completing the FS 659 is described below. Refer to the FS 657 and FS 658 cards to assist in completing this card. 8.1 Data Field Descriptions for the Ministry of Forests FS

93 Figure 29: FS 659 Silviculture Survey Summary card, front side, with sample date. Figure 30: FS 659 Silviculture Survey Summary card, front side, with field numbers. 93
94 Previously described field numbers will not be repeated in the descriptions to follow. Refer to a previous section for their description. Be sure to summarize only the data for one stratum on each summary card Report Date: H/H Enter the date that the FS 659 is being filled out Data Entry Date: H/H Enter the date that the survey information is being entered into RESULTS, GENUS or corporate database Compiled By: H/H Enter the name or company filling out the FS659 card Data Entry By: H/H Enter the initials of the person completing the data entry. This is related to field No. plots (n): H/H Record the number of plots established in the stratum Total trees (T): H/H Record the sum of the total trees from the Total Trees (field 91) of the FS 658 card Total conifers (TC): H/H Record the sum of the total conifers from the Total Conifers (field 92) of the FS 658 card Countable conifers (CC): N/H 11 Record the sum of the countable conifers from the Countable conifers (field 93) of the FS 658 card. If compiling data for a stocking survey, data will not be recorded in this field. 11 Only required for strata with a maximum density requirement in the stocking standards Blank: H/H Record the number of well spaced trees by species (field 96 or 97) as entered in field Sum of WS disregarding the M value (WnoM): H/H Record the sum of all values in fields Total M s (Wm s): H/H Record the number of M s in field Total (W): H/H Sum the number of well spaced trees from field 100 not including the M s Well Spaced Species Composition: H/H For each species divide each value from field 133 by the value in field Sum of Preferred (SPW): H 6 /H 6 Sum the values found in field 137 for each of the columns marked p (preferred) as found in fields 97 or If the silviculture plan or prescription was approved prior to April 1, 1994, there will be no minimum stocking standard for preferred species. This field will then be recorded as - or N/A. (see section on MSS vs. MSSp vs. MSSpa) Blank: H/H Record the number of free growing trees by species (field 96 or 97) as entered in field Sum of FG disregarding the M value (FGnoM): H/H This field is the sum of all values found in field Total M s (FGm s): L/H Record the number of M s in field
95 142. Total (FG): L/H Record the sum of the number of free growing trees from field 100 not including the M s Free Growing Species Composition: H/H For each species divide each value from field 139 by the value in field Sum of Preferred (SPFG): H 6 /H 6 Sum the values found in field 143 for each of the columns marked p (preferred) as found in fields 96 or If the silviculture plan or prescription was approved prior to April 1, 1994, there will be no minimum stocking standard for preferred species. This field will then be recorded as - or N/A. (see section on MSS vs. MSSp vs. MSSpa) WS Sample Tree Age: H/H Record the average age of the sampled well spaced trees. This is the sum of the Age (field 101) from the FS 658 card divided by the number of sample ages recorded WS Sample Tree Height (m): H/H Record the average height of the sampled well spaced trees. This is the sum of the Total Height (m) from field 102 on the FS 658 card divided by the number of sample heights recorded FG Sample Tree Age: H/H Record the average age of the sampled free growing trees. This is the sum of the Age (field 101) from the FS 658 card divided by the number of sample ages recorded FG Sample Tree Height (m): H/H Record the average height of the sampled free growing trees. This is the sum of the Total Height (m) from field 102 on the FS 658 card divided by the number of sample heights recorded Plantable (P): T/N If plantability is selected as an objective on the FS 657 in field 18 record the sum of the plantable spots from field 106 from the FS 658 card, not including M s M Plantable: T/N If plantability is selected as an objective on the FS 657 field 18 count the number of Ms entered in the plantable spots column, field 106 of the FS 658 card Preparable (PR): T/N If plantability is selected as an objective on the FS 657 field 18 record the sum of the preparable spots found in field 108 from the FS 658 card Total Number "IN" (TNI): H 12 /H 12 This field is required for multi-story surveys only. Record the sum of the total trees "in" a prism sweep from all plots on the FS 658 card, (field 106). This value can be confused with Plantable data. 12 Only mandatory for multi-storey stands that have a minimum basal area On-Site Cost/ha: L/L When required by the agency responsible for producing the free growing stand, record the survey cost/ha for the stratum Funding Source: L/L Record the funding source used to pay for the survey Calculations: Follow the formulae provided to determine the resulting values. H/H - Total Trees per ha H/H - Total Conifers per ha 95
96 N/H 11 - Countable Conifers per ha H/H - Total Well Spaced per ha without regard for the M-value L/H - Free Growing per ha without regard for the M-value H/H - Total Well Spaced per ha H 2 /H 2 - Preferred Well Spaced per ha L/H - Free Growing per ha H 2 /H 2 - Preferred Free Growing per ha T/N - Plantable Spots per ha T/N - Potentially Preparable per ha H 9 /H 9 Layer 1 Basal Area per ha 2 - If the silviculture prescription was approved prior to April 1, 1994, there will be no minimum stocking standard for preferred species and there may also be no minimum preferred for some approved FRPA FSP stocking standards. This field will then be recorded as - or N/A. (see section on MSS vs. MSSp vs. MSSpa).This methodology represents the preferred best management practice approach to calculate the Preferred Well Spaced and Free Growing per ha., for this is the easiest and most efficient approach. Other methodologies are also acceptable as proposed by several practitioners, where the absolute values are used rather than the capped M-value totals. 9 Layers are only required in Multi-story surveys or as required for a Layered or DFP survey like SEDRSS. 11 Only required for strata with a maximum density requirement in the stocking standards. Statistical Calculations: These fields are provided to record the results of the various statistical calculations required following a survey. The methods are fully described in this document under the section entitled Statistics. The FS 1138A card may be used to calculate the Silviculture survey confidence limits Growth Intercept Sample Trees: N/O Data may be collected and directly recorded in this area for the ten growth intercept sample trees. Look up the site index for each sample tree on the FS 415 for the site index species. Average the individual tree site indexes Site Index Reminders: H/H This text is provided to remind users of the priority when selecting a site index method Survey Confidence Limits For Well Spaced / Free Growing: H/H Check ( or ) the box corresponding to the statistics completed Standard Deviation: H/H While there is a long form manual calculation, instructions are available on the FS 1138B, although most surveyors will choose to use a statistical calculator. 96
97 160. Standard Error of the Mean: H/H While there is a long form manual, calculation instructions are available on the FS 1138B, although most surveyors will choose to use a statistical calculator t.90: H/H Commonly known as the T value, it is determine by looking up the value corresponding to field 129 minus 1 on either the FS 1138B or item 28 on the FS Confidence Interval: H/H The confidence interval is calculated by multiplying field 160 by field Lower Confidence Limit: H/H The lower confidence limit is calculated by subtracting the confidence interval, field 162 from the well spaced or free growing per ha (field 155), again depending on which box is selected in field Leading Species & %: H/H Average the data found in fields 116. The species composition is roughly averaged and rounded to the nearest 10 percent and expressed as 1=10%, 4=40%. For further details see inventory label. The surveyor may choose to adjust these values up or down as necessary to best reflect the characteristics of the stratum. Fields must add up to 100%. Note: The percent leading species will be based on Volume for predominately Layer 1 and 2 SU s and on relative Density of stems per ha. for younger Layer 3 and 4 dominated SU s nd Species & %: H/H Average the data found in the % column of field 120. The species composition is roughly averaged and rounded to the nearest 10 percent. For further details see inventory label. The surveyor may choose to adjust these values up or down as necessary to best reflect the characteristics of the stratum Spp & %: H/H Average the data found in fields 122 & 124 for the remainder of the species listed Ldg. Age (years): H/H Average of the age measurements collected on the FS 658 field 118. This number must be rounded to a whole number. The surveyor may choose to adjust this value up or down as necessary to best reflect the characteristics of the stratum nd Age (years): H/H Average of the age measurements collected on the FS 658 field in the age column of field 121. This number must be rounded to a whole number. The surveyor may choose to adjust this value up or down as necessary to best reflect the characteristics of the stratum Ldg. Height (m): H/H Record the average of the height measurements collected on the FS 658 field 119. This number is expressed in meters and is rounded to the nearest tenth of a meter. The surveyor may choose to adjust this value up or down as necessary to best reflect the characteristics of the stratum nd Height (m): H/H Record the average of the height measurements collected on the FS 658 under the height column in field 121. This number is expressed in meters and is rounded to the nearest tenth of a meter. The surveyor may choose to adjust this value up or down as necessary to best reflect the characteristics of the stratum. 97
98 171. Site Index: H/H Record the site index for the leading species (field 116 and 164) in the inventory label. A complete discussion on site index determination can be found on the SIBEC website. 98
99 172. Source Code: H/H Record the method used to determine the site index for the stratum. Enter the abbreviation. Abbreviation Description Surveyor Priority A Adjacent stand Very rare I Growth intercept, or subsequently converted using the Average site index relationship table found in the FS 660 #1, preferred method for FG Surveys O November 1998 provincial SIBEC rollover Not used by surveyors C Site index curve, height age reference curves May have value in some multilayered stands or stands > 30 years BHA H Stand before harvest, rarely used Very rare E SIBEC or Site index from the biogeoclimatic classification #1, preferred method for RD survey or #2 common alternative method for FG survey M Converted from site class #3, last resort S Assigned by District Stewardship Section local preference Table 9a: Site Index Method Codes 173. Cr Cl %: H/H Crown Closure is the average of the various crown closure samples collected as recorded in field 124 of the FS Total Trees / ha: H/H Record the number of total trees / ha as calculated in field Survey Year: H/H Enter the last 2 digits of the survey year. For example 2008 = Stocking Status: H/H Check ( or ) the box corresponding to the correct stocking status as determined by this survey. 99
100 177. Silviculture Label Ldg Spp & %: H/H Record the largest value and corresponding species in fields 137 or143 depending on the value in 184. For well spaced data, use field 137; free growing 143. Fields must equal 100% Silviculture Label 2nd Spp & %: H/H Record the second largest value in fields 137 or 143 depending on the value in 184. For well spaced data, use field 137; free growing 143. Fields must equal 100% Silviculture Label Spp & %: H/H Record the remaining values, in decreasing order, in fields 137 or143 depending on the value in 184. For well spaced data, use field 137; free growing 143. Fields must equal 100% Silviculture Label Age: H/H The value recorded in this field is dependent on the box checked in field 184. For well spaced data, record the value in field 145. For free growing data, record the value in field Silviculture Label Height (m): H/H The value recorded in this field is dependent on the box checked in field 184. For well spaced data, record the value in field 146. For free growing data, record the value in field Site Index: H/H Record the site index of the leading species in the silviculture label. This value may be different than field 171 if the leading species are different Well Spaced / Free Growing: H/H Check ( or ) the box corresponding to the data in the silviculture label Trees / ha: H/H Record the value from the statistics in field 155 for either well spaced or free growing trees depending on field 184. For well spaced use the well spaced per ha value. For free growing use the free growing per ha value (using the calculation employing the M value for each entry). 100


101 Figure 31: FS 659 Silviculture Survey Summary card, back side, with sample data. Figure 32: FS 659 Silviculture Survey Summary card, back side, with field numbers. 101
102 Previously described field numbers will not be repeated in the descriptions to follow. Refer to a previous section for their description Summary of Competing Vegetation: T/T Record the species abbreviations from the Competing Vegetation-Species (field 108) on the FS 658 card. The seven most significant competing vegetation are to be recorded in this field Estimated % Cover: T/T Record the average percent ground cover of each of the species listed in the Summary of Competing Vegetation (field 185). The percent ground cover of each of the competing vegetation species can be averaged from the Competing Vegetation - % Cover (field 109) of the FS 658 card Current Height (m) Minimum, Maximum, and Average: T/T Record the average height of each of the competing vegetation species listed in the Summary of Competing Vegetation (field 110). The maximum and minimum values are based on visual observations Annual Height Increment (cm): T/T Record, in centimeters, the average annual height increment of each of the species listed in field 185. These are determined by visual observations Distribution, Current Competition, Potential Competition: L/H Check continuous, patchy, or scattered when describing the distribution pattern of each of the species listed in field 185. These are determined by visual observations. Continuous Patchy Scattered Table 12: Distribution definitions brush is evenly distributed over the stratum. brush-free areas cover approximately the same percentage of ground as brush-covered areas. brush-free areas are larger than brush-covered areas. Check the appropriate field when describing the present impact (high, medium, low or nil) of each of the competing vegetation species listed in the Summary of Competing Vegetation (field 185). These are determined by visual observations. Check the appropriate field when describing the potential competition (high, medium, low, and nil) of each of the competing vegetation species listed in the Summary Competing Vegetation (field 185). These are determined by visual observations Pest Code: T/H Record pest codes for the seven most severe forest health factors entered into the Forest Health-Pest Code (field 111) of the FS 658 card Area (ha) if only part of the stratum is affected: H/H Record the amount of area (ha) of the stratum affected by the pest listed in field Live trees affected: T/H Record the sum of the live trees affected by each pest code. The number of live trees affected can be found on the Forest Health-Live Trees (field 112) of the FS 658 card. 102
103 193. Dead Trees Affected: T/H Record the sum of the dead trees affected by each pest code. The number of dead trees affected can be found in the Forest Health-Dead Trees (field 113) of the FS 658 card Host Species Comp.: T/H Record the sum of the inventory label species composition of the tree species affected by each pest. This value can be found in fields 164, 165 and 166 and the number is expressed as a decimal (i.e. 60% = 0.6) % Total Trees Affected: T/H Complete the provided calculations to obtain the percent of total trees affected by each pest % Conifers Affected: T/H Complete the provided calculations to obtain the percent of conifers affected by each pest % Host Trees Affected: T/H Complete the provided calculations to obtain the percent of host trees affected by each pest. This is the number reported in the stocking and free growing reports and entered into RESULTS. Note: The following rule of thumb applies - if there is 0% of a species showing up in an inventory label, then there should be 0% host pest incidence reported. However, a possible scenario may occur where complete mortality of a dominant species has resulted from a pest infestation (Pl from MPB for example), and therefore does not show up in the inventory label, but the surveyor feels the professional practice would be to report the pest incidence somehow. It is recommended as a best management practice for the surveyor to attach a Pest Incidence Note to the opening file report in RESULTS to identify the presence of the pest, but still resulting in no incidence value into the database directly Primary Treatment Recommendations and Considerations: H/H When completing treatment recommendations, include specifics such as treatment method, season and year, and follow-up activities for the recommended treatments. For guidance on completing treatment recommendations see Framework for Effective Silviculture Treatment Recommendations course. Provide a summary of the treatment recommendations, including the time frames in which they should occur. Follow the silviculture plan or prescription for any recommendations. If there are recommendations in the silviculture plan or prescription that should not be there, bring this to the attention of the agency responsible for the opening. An amendment to either the silviculture plan or prescription may be required. Any treatment that will overcome the site limiting factors should be considered at this stage. Social or economic factors should be secondary to the biological concerns. All recommendations should be specific, reasonable, timely and legal. It is important that treatment recommendations be directed to establish and encourage preferred species and target stocking standards Alternate Treatment Recommendations and Considerations: H/H Provide additional treatment regimes to be applied in the event that the primary treatment recommendations cannot be implemented. 103
104 8.1.1 Statistics Silviculture surveys collect information so that decisions can be made on the stocking or free growing status of a stand and so that realistic, sound recommendations can be made for future treatments. Statistics enable surveyors to determine how precisely the survey data describes the status of an opening. It is of note to remember that the system is designed only as a sample of a population and is a rigorous survey process intended to aid in making the best decision on a stratum s status. It is intended for use when an unbiased sampling methodology has been selected. A borderline fail in the statistics of an SU targeted for a declaration may mean the need to move to a discussion and/or field trip with joint parties to seek another resolve. The individuals making the declaration need to satisfy themselves that the area will stand up to the test of another survey(s) returning the same decision - especially in highly variable areas. The statistical calculations are only necessary when plots are established. Since formal plots are not established during visual assessments, statistical evaluations are not required for visual assessments. The section below discusses mostly statistics on free growing tree data. However, these statistical procedures are equally applicable to well spaced trees. They could also be applied to plantable spots or preparable spots by substituting the corresponding data. The density and distribution of trees within a stratum varies. Surveyors sample only a portion of that stratum s population. A statistical analysis must be completed in order to obtain an indication of the variability of the sample population and to provide a measure of the confidence of the average number of well spaced or free growing trees. For surveys completed on homogenous strata, the statistical requirements can often be met with as few as five plots per stratum. The MoFLNRO has determined that five plots per stratum is the minimum required. Non-homogeneous strata require more than the minimum number of plots to meet statistical precision. The higher the variability in the population - the more plots that are required. Establishing more plots however should not be a substitute to proper stratification. In strata where the distribution of free growing trees is variable and the free growing status is not clear, calculation of statistics is extremely important. Calculating confidence intervals for the survey data provides a measure of the variability in the sample population, and therefore a measure of the relative confidence that the decision made will be correct 95% of the time and the results of the survey accurately representing a particular stratum. 104
105 Definitions Used in Statistics n number of plots established X s pm sample mean or average standard deviation of the mean plot multiplier s/ha stems per hectare (may also be referred to as tr/ha) se X standard error (may also be referred to as se) t90 CI t value, found on the FS 1138B or figure 13 on the FS 660. Choose the value with the degrees of freedom equal to the number of plots established minus one for calculations confidence interval, with repeated surveys of a stratum, 90% of the time the confidence interval will contain the population mean. LCL lower confidence limit. There is a 90% chance that the actual number of well spaced or free growing trees is above the lower confidence limit. MSS minimum stocking standard e desired survey precision Desired Precision - e Precision is a measure of the variability around the mean. Variability is inherent in sampling, as only part of the population is being measured. In order for survey results to have a degree of reliability and to be representative of the entire population being sampled, there must be a sufficient number of plots within each stratum. For stocking and free growing surveys, the desired survey precision has been set by the MoFLNRO. Where the average number of well spaced or free growing trees per hectare is: Less than or equal to 1000 trees per hectare, the precision is +/- 100 trees per hectare OR More than 1000 trees per hectare, the precision is 10% of the average number of well spaced or free growing trees per hectare. i.e. (For Example: If the mean number of free growing trees per hectare is 1125 then, thex is trees per plot, therefore e is, trees per plot or trees per hectare. 105
106 Use of the FS 1138 A, Calculation Card for Silviculture Survey Confidence Limits The FS 1138A card is designed to provide a format for a methodical approach to the calculation of statistics. Those less fluent with statistical evaluation often find the card provides a more complete flow of data analysis. The use of this card is optional, since the statistical results can be recorded on the FS 659 card. However, when additional plots are required to meet statistical precision, the 1138A will show the statistical calculations from the first pass or first set of calculations. The FS 659 will show final confidence limits after the additional plots have been established. The 1138A can also be used for the second pass or second set of calculations once more plots have been established Use of the FS 1138 B The card FS 1138B includes a glossary of common statistical terminology. It describes the step-by-step approach to calculating statistics, and it provides a table that lists the number of plots established to the corresponding t value. The t value table is also found in the FS 660. This card also describes the testing procedures to follow when measuring the difference between two means Statistical Analysis The statistical calculation MUST be done in the field to determine the need for additional plots. There is no statistical analysis required for preferred species alone, only for the combination of preferred and acceptable species. Where plots have been established, a minimum of five plots per stratum is required. More plots, may be required to meet the 90 % low confidence interval (LCI). The following decision rule steps and illustrated scenarios - performed in the order as presented below - are to be completed when determining statistical achievement of stocking or free growing: 1. If the mean (X number of free growing trees per hectare and its 90 % lower confidence limit (LCL) are greater than the minimum stocking standard, the area is considered free growing. No further plots are required. There is no need to proceed any further. Fewer free growing trees More free growing trees MSS LCL X 106
107 2. If the mean (X ) number of free growing trees per hectare is less than the minimum stocking standard (MSS), the area is considered not free growing. No further plots are required. There is no need to proceed any further. Fewer free growing trees More free growing trees LCL MSS X 3. The MoFLNRO has determined that survey results with a low confidence interval will be accepted at their mean value regardless of their lower confidence limit if the confidence interval is less than the MoFLNRO s desired precision or e value. There are two methods for calculating the desired precision, or e value: (a) Where the (X ) is less than or equal to 5, (or 1000 trees per hectare), the desired precision is, 0.5 trees per plot, or +/-100 trees per hectare. (b) Where the (X ) is more than 5, (or 1000 trees per hectare), the desired precision is 10% of the X (X ) x 10% = e For example, if the mean number of free growing trees per hectare is 1125 then, thex is trees per plot, therefore e is, trees per plot or trees per hectare. 4. If the CI < e, then the survey meets the desired precision; no further plots are required. To determine the stocking, proceed to step If the CI > e, then more plots may be required to meet statistical precision. Proceed to step If thex is greater than the minimum stocking standard (MSS), but the lower confidence limit is less than the minimum stocking standard and the, CI > e, then additional plots must be established to obtain an accurate estimate. The methodology used to determine the number of additional plots necessary to meet precision is described below. Fewer free growing trees More free growing trees LCL MSS X To determine the number of additional plots required, use the following formula: 107
108 (t 2 x s 2 ) e 2 = The number of plots required to meet precision The number of plots required to meet precision - The number of plots already established = The number of additional No more than 1.5 plots per hectare plots required are required. As some plots have already been established, subtract the number of plots established from the value derived using the formula. The resulting value is the total number of plots that are left to be established. The MoFLNRO has determined that 1.5 plots per hectare is the maximum required. Therefore, if the formula indicates more than this number, then only enough additional plots to reach 1.5 plots per ha. are required. Conversely if the value derived from the formula indicates less than 1.5 plots per hectare, establish only the number of plots required by the formula. NOTE: That the establishment of more plots up to the maximum of 1.5 plots per hectare, is a second step only and not a primary step. It should only be implemented once step 6 occurs, due to the first statistical analysis and the failure of the sample meeting the test of LCL and e. As well, in very small strata less than 3 ha. the 1.5 plots per ha. guidance becomes awkward and breaks down in its accuracy. It is recommended that the maximum 5 plots only be established see section for guidance in surveying small areas. Where the initial plots are established on a systematic pattern, it is equally acceptable to establish the additional plots on either a single diagonal line which extends across the stratum, or between existing plots on a systematic basis. In the following example, the original plots are circles. The additional plots required to meet statistical precision are squares. All of these are acceptable methods. A B A B Figure 25 Examples of location of additional plots to meet statistical precision 7. Re-calculate the statistics as a final evaluation of the sample population. 108
109 1) If maximum plots are not established and only extra plots, then regular statistical analysis is performed using LCL 2). However, if maximum plots were established up to 1.5 plots per hectare, then the stocking/free growing decisions are now completed based on the comparison of thex and the MSS and not by using the LCL. Therefore, if thex is greater than or equal to the MSS the stratum is determined to be stocked/free growing. If not, the area is determined to be not stocked/ not free growing. 109

110 Figure 25a: Example of a completed 1138A 110
111 Multi-story Statistics Confidence limits do not apply to multi-story surveys. Some districts request that surveyors calculate statistics and establish additional plots. Surveyors should consult with the district to confirm their requirements. Currently there are no provincially approved or required methods for statistical analysis on multi-story surveys Treatment Recommendations The Forest and Range Practices Act does not require treatment recommendations. However, the agency responsible for the opening is required to produce a free growing stand. Treatment recommendations that aid in achieving this goal will be an important component of most silviculture surveys. Surveys conducted for government under the FS 925A (Silviculture Contract for Silviculture Surveys) do require treatment recommendations. Many licensees use a similar contract. In order to develop treatment recommendations, one compares the results of the survey to the standards and the management objectives in the silviculture plan or prescription. Where the present opening fails to meet those standards or management objectives, treatments or actions need to be recommended that will enable the opening to meet those objectives. Effective treatment recommendations are ones that are ecologically suited to the opening, are cost effective, will result in a free growing stand within the prescribed time frames, and will provide for management of preferred and acceptable species at target stocking. Recommendations may also include suggestions for amending the silviculture plan or prescription or the silviculture treatment regime. For each opening, an alternative recommendation should be included. Where applicable, treatment recommendations should include a brief explanation supporting the recommendations made. Several factors should be considered when making treatment recommendations: Does the data collected and summarized equate to the visual observations? Is a treatment required to meet the regeneration date? Is a treatment required to assure a free growing stand within the prescribed free growing time frame? Are the recommended treatments cost effective? Are the recommended treatments feasible? 111
112 Treatment recommendations should be SMART: Succinct Measurable Achievable Relevant Timebound The SMART concept is discussed in the Framework for Effective Silviculture Treatment Recommendations course. The first step in creating treatment recommendations is to compare the survey data to the standards in the silviculture prescription, site plan or FSP and in the contract. The data collected during the survey should reflect the standards set out in the silviculture prescription, site plan or FSP and in the contract. The next step is to identify any deficiencies noted in the survey. For example, is the stratum SR, or is it NSR? If there are no treatments required, then there are no recommendations to be made. Every site has limiting factors such as climate, forest health, competing vegetation, or nutrients. The next step is to incorporate the limiting factors into the suggestions. For each deficiency or limiting factor found in the survey, consider possible solutions. At this point, consider every solution, regardless of feasibility or cost-effectiveness. Always aim for the target standards, not the minimum standards. Where possible, try to meet the silviculture prescription, site plan or FSP requirements. This may not always be possible, and amendments may be necessary. If the standards in the silviculture prescription, site plan or FSP cannot be met, the surveyor may recommend that an amendment be made to bring the silviculture prescription, site plan or FSP more in line with what is actually on the site. When making recommendations for amendments, be specific as to what needs amending. Only recommend amendments for deficiencies that could not be fixed otherwise. Some of the types of treatments that surveyors can recommend include, but are not limited to: Site Preparation Planting Juvenile Spacing Brushing Sanitation 112
113 8.1.3 Reports Only surveys that are used as the basis for meeting the regeneration date or free growing declaration or activity reported ( as per government funded programs like FFT or FIA) need to be formally reported in RESULTS. Other intermediate surveys are not required to be reported according to legislation. It is essential to keep a written record of the survey (e.g. the FS657, 658 and 659) and the results and provide these to the district manager if requested. There are a few different categories of survey reports to consider: Regeneration Delay Surveys Free growing Surveys With regeneration objectives (most common) Without regeneration objectives Compliance Report Required by the Government Report Contents The Forest and Range Practices Act and its Regulations do not explicitly state the individual components of a report. Historically, reports have required the list of items below. It is realistic to expect reports will likely have the similar components. The items can be expected to include: identification of the area under the obligation (Licence, cutting permit, block, opening number where available) the agreement and name of the holder of the agreement (where applicable) the standards unit boundaries and their areas the survey strata and their areas the biogeoclimatic ecosystem classification the incidence of forest health the inventory label, including species composition, ages, heights, crown closure, total tree density, site index, site index method and survey year the silviculture label, including the number of preferred and acceptable trees per hectare number of countable conifers, if near maximum density thresholds 113
114 Regeneration Delay and Free Growing Survey Reports A regeneration delay and free growing survey report has very few mandatory items. FRPA requires polygon, inventory and silviculture label. The silviculture survey cards, summaries or other data gathering methods (i.e. video recordings, photographs and aerial photos) kept on file and shall be made available for audit purposes at the request of the district manager Regeneration Delay Survey Reports on Woodlots The WLPPR specifies that a survey be undertaken if the minister believes that the woodlot licence holder has not met the regeneration delay requirements. The details of such a survey are not specified but one can expect the process discussed earlier in this document would be reasonable Free Growing Surveys for Intermediate Cuttings on Woodlots Between 1 and 3 years following the completion of harvesting, the woodlot licence holder is responsible to conduct a survey of the following: the identification of the area the inventory label, including species component, age, height, density and site index, and the incidence of damage by forest health factors affecting trees The report is submitted as part of the annual report Free Growing Surveys on Woodlots The free growing assessment requirements are quite similar to those of the major licence holders. identification of the area the number of healthy well spaced free growing preferred and acceptable trees per hectare the number of healthy well spaced free growing preferred trees per hectare the total number of countable coniferous trees per hectare for the purpose of determining compliance with the maximum number of coniferous trees allowed per hectare under the prescription 114
115 the inventory label and silviculture labels including species, age, height, density and site index, and identification of areas that are: satisfactorily stocked (SR) not satisfactorily restocked (NSR) free growing (FG) The report is submitted as part of the annual report SU Nomenclature when stratifying and ultimately reporting survey compilations into RESULTS The following is a best practice procedure recommended by practitioners in order to keep reporting nomenclature consistent, when a surveyor is first stratifying and then reporting Polygons within established SUs. The recommended process would be to always start with the identifier established for a specific SU. The surveyor is limited by the legal documentation as to what the SU is designated as initially (either numeric or alphabetical). Keeping track of the strata/polygon within each SU should follow a sequential pattern, be it numeric or alphabetical. Therefore, the first stratum or polygon within that SU, should be labeled 1 or A. Then the second stratum within that SU should be labeled 2 or B and so on. The result is that the SU and the strata/polygon designations are joined to form the Strata/Polygon label (i.e. SU 1 and Strata/polygon 1 is known as Strata 1-1). The following Figures illustrate this best practice. SU-1 SU-2 C1- A 1-2- B D2- Figure 25a Examples of SU Nomenclature Numeric/Numeric 115
116 SU SU-1 A C A- A-A B- B DB- SU SU-2 B Figure 25b Examples of SU Nomenclature Alpha/Numeric 116
117 8.1.4 Inventory Label - Polygon An inventory label is a standardized method of describing the commercial tree species growing on a polygon (traditionally called a stratum). Surveyors make ocular estimates of the species composition (to the nearest ten percent) and the average height and age of the dominant and co-dominants of the leading and second species and crown closure. In practice this means surveyors will visually gather this data from within the polygon as they conduct the survey. These estimates are collected at the first and every fourth plot thereafter. Where few plots are established in a large polygon, inventory label data should be recorded more often. The density is based on plot data. Site Index, based on the method described on the FS 657, may (growth intercept) or may not (SIBEC) be based on plot information. Note: The percent leading species will be based on Volume for predominately Layer 1 and 2 polygons and on relative Density of stems per ha. for younger Layer 3 and 4 dominated polygons. The sample inventory label below describes a stratum with the following characteristics: Sx 40 Fdi 30 Ac 20 Bl 10 13/12-1.7/1.6 18/I (08) species composition of the total trees is spruce 40 percent, Douglas-fir 30 percent, cottonwood 20 percent and subalpine fir 10 percent. average age of dominant and co-dominant spruce is 13 years and the Douglas-fir is 12 years average height of dominant and co-dominants spruce is 1.7 meters and the Douglas-fir is 1.6m site index of the leading species, spruce, is 18 meters at 50 years site index I is growth intercept crown closure of all the commercial tree species is 19 percent total trees per hectare is year of the survey is Silviculture Label - SU A silviculture label is a standardized format of the string of data that describes the well spaced or free growing component of a stratum. Most of the data items are selected from the FS 659 summary card when plots are established. When no plots are established the entire label can be generated from visual observations, but should be done with extreme caution and only by very experienced surveyors. The sample silviculture label below describes a SU with the following characteristics: 117
118 FG-Fd 56 Sx 22 Bl 13 Cw /E - 920(08) this prefix identifies the stocking status of the SU, NSR, SR or FG. Subsequently the data that follows NSR and SR represent well spaced trees and following FG represents free growing trees. (Note: This prefix data is for information purposes only and there is no legal reporting requirement into RESULTS). species composition of the free growing trees is Douglas-fir 56 percent, spruce 22 percent, subalpine fir 13 percent and western red cedar 9 percent average age of all species of free growing trees is 12 years average height of all species of free growing tree is 2.4 meters site index of the leading species, Douglas-fir, is 21 meters at 50 years site index, E is SIBEC free growing trees per hectare is 920 (based on the calculations completed on the FS 659 where plots are completed) year of survey is 2008 When completing the silviculture label for a free growing survey, the label components (e.g., species, age, height) refer to free growing trees per hectare only if the stand has achieved free growing status as determined by the survey. Otherwise, the well spaced values are used in creating the silviculture label. 118
119 9 Alternative Survey Methodologies The following sections refer to alternatives to the basic standard survey techniques (for simpler even-aged clearcut scenarios) previously presented up to Section 8. The application and use criteria of the following alternative methodologies are prefixed at the beginning of each survey method section. Note, that many fundamental aspects of the basic standard survey procedures maybe incorporated into the following alternatives. If reference is made to these basic principles (such as sampling principles), please refer to the appropriate sections of the previous 8 sections for detailed reference. While it is not the focus of this manual to fully describe these alternative procedures, it is important that surveyors understand the assessment options and their potential applications. In addition, a Survey Methodology Selection Matrix Table has been provided below to aid as guidance in the selection of an appropriate survey methodology and the appropriate situations and circumstances where an alternative methodology should be used. In addition, Appendix 14 Guidance Matrix for Reporting Retention Openings into RESULTS, contains the same guidance below regarding Survey Methodologies. However there are more detailed reporting guidance and many illustrations and photos that are intended to aid all practitioners in deciding on the appropriate survey and reporting practice. It is important to always refer to the approved silviculture plan and prescriptions for the opening being surveyed, in order to implement the appropriate survey methodology prescribed for that opening. The methodologies prescribed in these opening prescription documents, would supersede any selection of a survey methodology from the matrix table below. 119
120 9.1 Survey Methodology Selection Matrix Management Regime Stocking Standard Silviculture System Survey Methodology Options Recommended FG Damage Criteria Even-aged stand structure One Layer Target & Minimum Stocking Standard Clearcut (CC) 5 m 2 /ha BA Dispersed Retention residual stems Standard CC/Even-aged Survey Methodology (up to section 8 in this manual) Use even aged damage criteria Dispersed Retention of residual stems: > 5 m 2 /ha BA & < 20 m 2 /ha Interior (< 40 m 2 /ha Coast) Layered Survey Procedures DFP related (SEDRSS) Procedures for Salvage or Nontimber objective openings Table 9b Survey Methodology Selection Matrix Mixedwood (Dec/Conifer) Survey Procedures NE Interior and CFR Layered and DFP (SEDRSS) Use the SEDRSS Damage Criteria Uneven-aged stand structure Multiple Layer Target & Minimum Stocking Standards Single tree selection > 5 m 2 /ha BA & < 20 m 2 /ha Interior (< 40 m 2 /ha Coast) Multi-storey Survey procedures recommended for only IDF zones or small area based tenures such as Woodlots. Use Multi-storied Damage Criteria 120
121 9.2 Complex Vertical Structure Survey Methodologies Multi storey Survey Prescribing forest professionals, contract supervisors, and surveyors must know the provincial definition of stand layers, be familiar with basic silvicultural systems and understand which stand types are suitable in order to know when to properly employ the provincial multi-story silviculture survey methodology. Recognizing the application of other assessment procedures will encourage the use of the multi-story system where it is best suited. If a surveyor requires more information and detail then provided in this manual section, please refer to the Multi-Storey Silviculture Survey Course Workbook. Illustration 3: Multi-storey Uneven-aged Stand Structure Multi-storey Definitions Forest Practices and Investment and Forest Analysis and Inventory Branches have agreed on layer definitions. 121
122 Figure 25c: Multi-storey layer definitions The multi-storey survey methodology is suitable to assess stands in which all three of the following criteria apply: 1) The stand is being managed for single tree selection; 2) Layers one and two combined is either : i) 6% crown closure, or ii) > 5 m2/ha of basal area in layer 1; and 3) Layers three and/or four are present. Uneven-aged management is defined in FPPR Schedule 1 Sec. 6: Uneven-aged means a stand of trees with three or more age classes. The uneven-aged system develops or maintains a mixture of three or more distinct layers, with clear differences in height, diameter and age for the entire cutting cycle. The multi-storey survey procedure is best suited to a single tree selection silvicultural system. This is an uneven-aged system, where mature timber is removed either as single stems or in small groups, at relatively short intervals, repeated indefinitely, maintaining an uneven-aged stand. The intent of the system is to recruit trees into successive age classes over time with regeneration occurring in pulses after harvest entries. Note: Use of the default Stocking Standards for Single Tree Selection listed on the Reference Guide to Stocking Standards, is only recommended to be used for IDF sub zones within the province or small area based tenures such as Woodlots. Mark to leave and faller selection are common approaches to single tree selection. 122
123 A single tree selection silvicultural system commonly relies on natural regeneration, however planting may be appropriate where seed supply is questionable. The multi-story survey procedure may be suited to an uneven-aged group selection system where the size of openings is minimal. The multi-story survey procedure may be suited to the irregular shelterwood system. This system is broadly aged and therefore considered to be between an even-aged and an uneven-aged stand. It has an extended regeneration strategy and there is often an extended period of over-story influence on the regeneration. This is similar to single tree selection, where residual trees are left for long periods beyond the regeneration phase. This system is only acceptable if multiple harvest entries are prescribed as defined above. Other shelterwood systems are not considered to be multi-story. Crown closure is best estimated by a combination of air photo interpretation and ocular ground estimates by experienced, trained personnel. Calculations utilizing stem density and crown radius may also be helpful. See Appendix 9 for additional detail on estimating crown closure Complex Stands not suited to the Multistorey Survey System Generally stands being managed under an even-aged system are not well suited to the multi-story survey procedure. These management categories would include clearcut, clearcut with reserves (dispersed or grouped), patch cut, coppice, seed tree and most shelterwood systems. Stands managed as an irregular shelterwood may be considered multi-storied as discussed under notes on the previous page. Typically even-aged stands have one or two well-represented age classes with regeneration established shortly following harvest. Diameter-limit cuts, or selective harvesting, which target high-quality, larger stems for harvest, may not be suited to a multi-story stocking standard, based on the lack of intent to leave preferred quality stems of all diameter classes. Where limited prescription information exists (e.g.: Salvage harvest areas), surveyors need to consider what an appropriate silvicultural system is and be prepared to discuss assumptions made in the survey report. Considerations may include species composition, stem density, stem quality and age class distribution. Even or uneven-aged management may be prescribed. An amendment or development of a prescription may be required. Where the stand is unmanaged, and the intent is single tree selection, the development of a stand table to adequately describe stand dynamics is preferred when developing a prescription. Properly describing stand structure requires an understanding and consistent use of nomenclature for describing multi-story stands. (see Silviculture Systems publication). 123
124 Uneven-aged Stocking Standards Note: Use of the default Stocking Standards for Single Tree Selection listed on the Reference Guide to Stocking Standards website, is only recommended to be used for IDF sub zones within the province or small area based tenures such as Woodlots. The overall goal in making a stocking status decision at regeneration delay or free growing is to determine whether adequate stocking (site occupancy) occurs over the stand. In order to logically integrate structural diversity and the reality that larger trees occupy more site resources than smaller trees, stocking standards need to be provided by layer. All four layers in a multi-story stand occupy and require different amounts of growing space and influence each other. It is recommended that stocking and survey parameters include preferred and acceptable criteria as well as planned residual basal area per hectare. Silviculture plans and prescriptions may prescribe standards and survey criteria for a standards unit that deviate from the provincial guidelines: a surveyor must employ those survey criteria when surveying that unit in order to assess whether the SP standards have been met. All four layers in a multi-story stand can contribute to the stocking status of the stratum: each layer will have its own Target and Minimum Stocking Standard (TSS and MSS). As all four layers in a multi-story stand occupy and require different amounts of growing space and influence each other, each layer can completely stock (i.e. fully occupy the site resources) the stratum on its own, or contribute to the overall stocking. To make a stocking decision, data for all plots in the stratum are summarized. Wellspaced and/or free growing density by layer is calculated. The calculated density is compared to the uneven-aged minimum stocking standard (MSS) starting with layer one. If the layer one density exceeds the MSS for that layer then the stratum is considered stocked or free growing. If however the calculated density is less than the MSS you MUST combine the calculated density for layer one and two and compare it to the MSS for layer two. If need be, the process continues to layer four where the total calculated density for all four layers is compared to the MSS for layer four. This process is referred to as nesting. As with even-aged surveys, it may be a requirement to meet both MSS(p+a) and MSS(p). 124
125 For this example, assume that the total FG stems are all preferred. Layer TSS MSS(p+a) MSS(p) Total Nested FG/ha Total /ha In this example it is not until the 4 th layer that the total calculated density, or nested total, exceeds both the MSS(p+a) and the MSS(p) (i.e. 525/ha > 500/ha) Making a stocking status decision using uneven-aged standards The stocking status decision should be based on the content of the silviculture plan and prescription stocking target stocking in each layer. This will be a function of the stated management intent, the desired stand structural regime and stand condition forecast for future regeneration success. Therefore the measurement of stocking achievement will be individual as the approved prescription. This will normally be a mix of required stocking thresholds in Layer 1 down to Layer 4. Refer to the example of a Stocking Decision Key in the Multi-Storey Silviculture Survey Course Workbook Suitable Conversion to Uneven-aged Stocking Standards Many silviculture prescriptions for multi-layered stands developed between October 1987 and June 1995 provide only even-aged (single-storey) stocking standards. If it was prescribed for, or it is suited to, uneven-aged management, it may be necessary to convert from even-aged, single-layered standards to uneven-aged, multi-story standards. This conversion is not appropriate where a multi-layered stand structure has resulted from poor implementation of the prescription (for example, using the multi-story survey procedures to accept poor quality residuals where a clear-cut silvicultural system was prescribed). The Uneven-aged Stocking Standards (Table 10-following page) provide the parameters necessary to conduct a stocking or free growing survey and make a status decision. They should be used for multi-story stands harvested before October 1987 or stands that have silviculture plans and prescriptions that inadequately provide stocking standards. The contract administrator, prior to start-up, should provide direction to the surveyor regarding the use of these standards. If used, the surveyor must acknowledge the shift from even to uneven-aged standards. The licensee will be responsible for amending prescription documents. The minimum inter-tree distance does not apply between layer one well spaced or free growing trees Species: consider even-aged stocking standards. Shade tolerance may impact the species selection decision. 125
126 Minimum height: dry-belt Fdi stands = 40cm; otherwise use even-aged height standards. Competing vegetation (as per Appendix 9 of the Establishment to Free Growing Guidebook) applies to layers three and four (unless the prescription indicates otherwise). 126
127 Target evenaged stocking standard Layer Target stock. stds. Min stock. stds. Min pref. Stk. stds. Max. regen Early FG** delay* Late FG Well spaced sph post spacing (min/max.) layer 3 only Table 10: Uneven-aged stocking standards (single-tree selection only) To make a stocking status decision for a multi-story stand, relevant stocking standards are required. Where possible, the management objectives, silvicultural system and stocking standards for a multi-story stand should be reviewed at the pre-work. If the opening lacks a silviculture plan and prescription, or if the relevant document does not provide adequate standards, then from a surveyor s perspective an amendment is preferred. If an amendment is not completed prior to the survey, then the Uneven-aged Stocking Standards should be used. Uneven-aged standards use the nesting procedure to determine the stocking status. Basal area should be collected by species during all multi-story survey assessments as a best management practice. RESULTS only requires total BA for layer one. In the absence of standards prescribed in a silviculture plan or prescription, the following apply: Maximum density of sph (applicable to conifers in layer three only); 25,000 sph for pine stands in the Southern Interior Region and 20,000 sph for 80% pine stands in the Northern Interior. 127
128 For prescriptions approved before April 1, 1994, maximum density refers to drybelt Douglas-fir and lodgepole pine species only. Regen. delay can be met immediately following harvest if the residual stand has no significant damage or pest problems and meets minimum stocking. If regeneration is achieved immediately following harvest, earliest free growing date is 12 months after completion of harvest Silviculture and Inventory Labels It is essential to properly and adequately describe layers in a multi-story stand in order to accomplish three main survey objectives. The silviculture related objectives are to make accurate stocking and sound silviculture management decisions while the inventory objective is to collect accurate information for inventory purposes. Multi-story stand assessment and data collection are much more complex than those of a single-storey stand. Basal area by species is required to be collected at each plot for layer one trees. Modal diameter measurements are only recommended to be collected and not required. Silviculture and inventory information must be collected for each layer Silviculture Labels Section defined the four layers and how they are used to make a stocking decision. The second silviculture related objective is to make sound management decisions. To accomplish the second objective there may be a need to subdivide one or more of the four layers. where management objectives are unclear, collecting diameter class information to produce a stand table will allow a manager to develop a sound prescription. recruitment is important in uneven-aged management (the species, quality and quantity), therefore layer four may be subdivided to characterize new regeneration versus advanced regeneration. any other management objective indicated on the silviculture plan or prescription may require that enhanced layer data be described in order to assess whether the objective has been met. enhanced layer data may provide information for prescribing silviculture treatments (i.e. spacing layer three), or to meet other objectives (ex. hydrological recovery or visual cover) Inventory Labels As with silviculture labels, inventory information is collected by layer. Key stratification criteria for inventory purposes include significant changes in species composition, age, height, site index and crown closure. Follow the procedures outlined for even-aged stand inventory labels in Section and Section 7.3 data fields 115 to Ghost Trees Ghost trees are trees that remain on site for a specified reason (e.g. wildlife tree) but do not count towards stocking as they will not be harvested in the future. 128
129 ghost trees should be identified in the silviculture plan or prescription as being reserved: the specifications (i.e. density, distribution, etc.) and rationale should be provided. if a silviculture plan or prescription does not exist, or if it does not address trees that have apparently been reserved, then the surveyor should a) consult with the contract supervisor or b) make a judgment call, record it on the 657 and survey accordingly. ghost trees have significant implications on long-term management objectives. trees within a survey plot that fall within the vertically projected crown (drip-line) of a ghost tree are counted towards the total tree count but should be carefully evaluated before being accepted as crop trees. ghost trees need to be accounted for in the inventory label as they occupy growing space and may influence performance of regeneration Basal Area (BA) Basal area must be collected by species for layer one during a multi-story survey. BA is used to make stand management decisions and is an important component of the inventory data submission used to improve growth and yield calculations. basal area is determined for layer one only, using a prism size chosen to capture on average 4 to 9 trees per plot. if included in the silviculture plan or prescription as a stocking standard, the data collected should be defensible: i.e. measure in/out trees. the basal area of layer one is proportional to the amount of growing space taken up by layer one trees and hence provides a means by which stocking may be judged. recording "in" trees provides a measured estimate of species composition (by volume) for layer one which is superior to an ocular estimate. (refer to Appendix 4 for guidance on the use of a prism) Modal Diameter Definition: Modal Diameter is the most frequently observed diameter in layer one. modal diameter is not a RESULTS requirement. modal diameter is a useful stand descriptor in management planning for future stand entries: i.e. what would be the most frequent log size. average diameters are inadequate in that they may describe a tree size that does not exist in the stand. a stand having two distinct groupings of diameters in layer one is called bimodal: both diameters should be recorded. 129
130 Steps Required to Complete a Multi-Storey Silviculture Survey The main steps required to conduct a multi-story survey are no different than that of a typical even-aged survey. Some of the specifics are different and discussed below. 1 - Office Review and Pre-Stratification 2 - Walk-through and Survey Design 3 - Data Collection 4 - Data Compilation and Summary 5 - Recommendations and Mapping 6 - Survey Submission Office Review and Pre-stratification The office review for a multi-story survey is similar to that of an even-aged one, and should include: a review of the silviculture plan and prescription showing stocking standards, SU typing, previous surveys, ecological classification information, silviculture project reports, forest health information, and history information. Recent aerial photographs are particularly useful when assessing a multi-story stand. They help gauge stand structure and crown closure and thereby the block s suitability to the multi-story survey procedure. Office pre-stratification using photos will include attempting to divide areas of varying vertical stand structure into homogenous units - this is in addition to the normal criteria for stratification in a silviculture survey as described on the 2008 FS 660 field cards. The photo stratification is combined with other stratification criteria on a map upon which a survey design can eventually be drawn. Minimum stratum size was put into legislation in For a brief summary see the 2008 FS 660. For a detailed discussion see the Ministry of Forests and Range 2007 document Forest Cover Stratification Walk-through and Survey Design The walk-through has particular significance for a multi-story survey, as it is necessary to confirm that the stand is suited to multi-story procedures. Optimal prism size is selected in addition to verification of pre-stratification. Other issues to be addressed during the walk-through include: identification of ecological classification, sampling intensity, site index methodology, forest health factors, site limiting factors, survey objectives and potential treatments. Typical sampling intensity for a multi-story survey is one plot per hectare. A grid system is well-suited but not a required design. This relatively high intensity has been practiced as statistics are not required with multi-story surveys. It may be reasonable to reduce plot intensity on uniform types or excessively large strata when experienced surveyors are employed. Consideration of reduced plot intensity should be discussed with the contract administrator prior to start-up. 130
131 Data Collection Although silviculture surveyors develop their own style for collecting data in a plot, the data collection process is described in a step by step process as follows: 1. Sweep the plot to determine total trees and total conifers for each layer. A 3.99m plot is typically used. In stands where stocking is more dispersed or irregular in distribution, a 5.64m plot may be a more effective plot size. 2. Choose your well spaced (or free growing) trees by the following rules: a) select the well-spaced trees starting in layer one and "nesting down" to layer four. "nesting down" means: selecting all acceptable layer one trees up to a maximum of the equivalent M value for layer one, then... selecting well-spaced acceptable layer two trees so that the combined number of well spaced in layer one and two does not exceed the equivalent M value for layer two, then... selecting well-spaced acceptable layer three trees so that the combined wellspaced in layers one, two and three does not exceed the equivalent M value for layer three, then... selecting well-spaced acceptable layer four trees so that the combined well-spaced in layers one, two, three and four does not exceed the equivalent M value for layer four. b) all acceptable layer one trees in a plot should be recorded in the well-spaced column, but only up to the M value recorded in the Total W column. c) an acceptable well-spaced tree in layers two, three or four must be: a) the MITD (minimum inter-tree distance)- as per the silviculture plans and prescriptions - from ALL acceptable layer one trees and b) the MITD from the SELECTED acceptable trees in the layers above. d) If you are doing a multi-story stocking survey, maximize the number of wellspaced trees; if you are doing a free growing survey, maximize the number of free growing trees (i.e. you may select different trees depending upon your objectives). If you are uncertain if the stratum is free growing or not, then collect both sets of data so that you have the correct information to produce a silviculture label. e) All well-spaced, acceptable trees must meet leave tree criteria as described in the prescription and/or Free Growing Damage Criteria for Multi-layered Conifer Stands. 3. Do a prism sweep and record the number of "in" trees in layer one by species. Record the modal diameter. Although not required in RESULTS, recording by species and collection of modal diameter, are best management practices. 4. Record countable conifers for layer three (all layer three conifers contribute towards maximum density). 5. Record forest health data for each layer. Note new Forest Health rules are available - Appendix
132 6. Targeting every fourth plot, but collecting as required, to obtain a complete data set, collect and record the following three sets of data (a minimum of three data sets per stratum is required): a. Record the competing vegetation in conjunction with silviculture height, age and inventory labels. b. Choose an average well-spaced tree (or FG) for each layer and record the height and age of the samples. c. Record the inventory label data for each layer. Species composition is based on volume for layers one and two, and on density (sph) for layers three and four. Ages and heights are of the average dominant/co-dominant trees for the leading and secondary species. 7. Collect site index information. Generally, single-tree selection does not lend itself to accurate results from the Growth Intercept Method. If the mature trees are vigorous, site index curves may be used. Most commonly, site index information is determined from the SIBEC method for multi-story surveys. For more detailed discussion, see the 2008 Silviculture Survey Procedures Manual. For current SIBEC tables by region check the web: 8. Collect plantable and preparable data every plot. Generally a drip-line rule is applied for layer one stems, i.e. spots are not considered plantable or preparable under the crown of a layer one tree. Otherwise the assessment procedure is as per even aged surveys. 9. Assess and record any other data that is required by the silviculture plan or prescription, or that contributes to assessing the silvicultural management objectives for the stand. Completing a multi-story survey follows the same steps and sequence as used in a normal even-aged silviculture survey. However, the complexity and importance of some of the steps is much greater than that of a normal survey. Multi-story surveys will take more time and cost more money Data compilation and summary Multi-story data is summarized by layer, allowing stocking and management decisions as well as providing suitable inventory information. There are two means by which to summarize data from a multi-story survey. Data may be summarized by hand, a time consuming process prone to error, or it may be summarized electronically. Many surveyors use hand-held computers to collect data and then download to their PC to analyze and generate reports. Others prefer to use field cards and then enter onto their PC. Over time there have been a number of summary programs designed. It is the surveyor s and contract administrator s responsibility to ensure that the system selected is suitable. Utilizing statistical analysis on a multi-story survey is difficult due to the nature of how trees are selected during the nesting down process. At this time statistics are not a requirement when completing multi-story surveys. Since the data collection rules require accepting all layer one trees that qualify, statistics can be meaningfully calculated for this layer. The lower confidence limit for this layer becomes especially important if the stand 132
133 has been declared stocked or free growing based on the layer one density alone. Statistical analysis of layers two, three or four, or a combination of them would not be meaningful due to nesting down. If a stratum is not declared stocked or free growing until the cumulative well-spaced for layer four, is compared with the MSS for layer four, then some benefit may be gained by determining the lower confidence limit of the mean of the total number of well-spaced (all four layers) in each plot Recommendations and Mapping Requirements Survey recommendations are a key output of the survey. The surveyor is responsible for providing a stocking status determination, as well as recommendations for any treatment or follow-up survey that may be required, to ensure that stand development is consistent with the objectives and requirements set out in the silviculture plan or prescription. The actual submission of the survey report is optional, but a report must be kept on file. Submissions may be made by the SU, however, the ministry will not acknowledge the declaration of the opening until all SUs are declared Layered Survey A second assessment method commonly utilized on layered even-aged stands involves recording the survey information by layer but applying even-aged stocking standards. Stand structures suitable for Layered Surveys are: Stands are managed on an even-aged management regime, with no planned multiple entry system; Low BA (suggested < 10m2 Interior) Stems retained post-harvest (planned or un-planned) are of acceptable health and vigor to contribute to stocking and free growing tallies and the next rotational harvest volumes. Illustration 4: Layered Even-aged Stand Structure Layered, DFP or SEDRSS 133
134 Surveys Using the Layered Survey method, silviculture data is summarized as one layer and compared to the prescribed even-aged stocking standards. Inventory information is recorded by layer and either amalgamated into one over-storey and one under-storey layer or in some cases a single layer is selected which best represents stems most contributing to the next harvest. Layered Surveys have the advantage that the standard even-aged statistical calculations can be used on the survey results. The following is a best management practice procedure to follow for the implementation of a Layered Survey - which would differ from a standard even-aged survey: Photo Stratification: Office pre-stratification from photos and/or a map is often difficult in stands where there is a complex residual structure. Recent aerial or orthophotos or images would be beneficial. Attempt to divide the stand into homogenous strata based on varying vertical stand structures. Walk-through Confirm or alter pre-stratification based on the actual stand conditions observed. Preliminary assessment of which layers will contribute to overstorey and understorey inventory labels. Data Collection Record the sample plot data using a 3.99 m. plot radius and sweep the plot to determine, for all layers: Total Trees by layer; Total Conifers by layer; Count Conifers all layer 3 stems and all layer 4 stems using Count Conifer procedures as per standard even-aged survey procedures. Recording the Basal Area of Layer 1 trees is optional and dependent on the requirements of the approved prescription (SP or FSP) for the opening. Choose Well Spaced (WS) and /or Free Growing (FG) trees with preference given to the most vigorous preferred and acceptable species that can contribute towards the merchantable volume at the time of the next harvest. Layer 1 stems are only selected over stems in lower layers if they are the best candidate to contribute to the next rotation. This is considering all layers at once and not using the nesting procedure used in the multi-storied survey procedure section. The M value, based on the even-aged target stocking standard, is used to cap total plot tallies, considering the well spaced or free growing trees, regardless of layer. The goal is to maximize the WS and FG trees within the plot. Therefore all layers are considered by using the following criteria: o Layer 1 WS/FG trees are acceptable if damage meets or exceeds the free growing damage criteria for even-aged conifer trees the MITD will be 0 m. for Layer 1 trees or whatever other MITD is prescribed. 134
135 o Layers 2, 3and 4 WS / FG trees are acceptable if damage meets or exceeds the SEDRSS free growing damage criteria in Section Rationale: These SEDRSS Damage Criteria were specifically designed to address even-aged stands with dispersed overstorey retention, that may or may not contribute to stocking for the next full rotation the criteria are separated by layer 1 stems and layer 2, 3 and 4 stems being grouped into separate criteria. It was the result of a complete review process of all stakeholders and is a true blend of the even-aged and multi-layered damage criteria, considering layers and length of retention of overstorey stems. -MITD will be the drip-line ( or 2.0 m whichever is the most) between all Layer 1 trees and lower Layer 2, 3 and 4 trees. -MITD will be 2.0 m (or as prescribed in a SP or FSP) between all Layer 2, 3 and 4 trees. Data Summarization and Label Generation Inventory Layer This is recorded by layer at every 1 st and 4 th plot per strata (as per even-aged survey), but can be summarized either by each layer or by either amalgamated into one over-storey and one under-storey layer or in some cases a single layer is selected which best represents stems most contributing to the next harvest guidance to the surveyor for this decision should be founded in the approved prescription management objectives. WS and FG Obligation Stocking Standard Determination The WS and FG stems per ha. will be tallied and a mean calculated as per the standard procedures for even-aged surveys and confidence limits determined using the same statistical analysis. The prime difference will be the compilation of all WS by Layer together to produce a mean WS and/or FG per ha. Nesting used in multi-storied surveys will not be used. Silviculture Label This will be derived from the WS and FG calculations above. The best management practice is to report the Silviculture Label by each layer into RESULTS. However, it is also acceptable as an alternative to report the Silviculture label as one layer - subject to the following 2 criteria: 1) if the level of similarity of the label attributes is close and 2) if the specific SU is a nonobligation unit (i.e. backlog Oct 31, 1987 or FFT survey). In this combination label method, all layers will be amalgamated into one layer for the species composition, ages, heights and densities Deviation from Potential Survey (DFP) - Interior DFP is a new approach to regeneration stocking assessment in partially cut stands in the BC interior. It is an alternative survey method to the four layered, multi-story system, and 135
136 is especially relevant to stands with substantial variation in the size and spatial arrangement of live trees retained after harvest with an even aged management regime. DFP is not recommended to be interpreted as a stocking standard. Use of DFP as a stocking standard would only be applicable in specific isolated situations such as: previously disturbed or salvaged areas lacking full prescriptions or; areas with moderate or high retention of live residual stems for non- timber objectives. This approach is designed to deal with high levels of stocking diversity within a standards unit. An index, or deviation from potential, is derived from the combination of a stem count of small well-spaced healthy crop trees and a basal area measurement of larger stems. This deviation from potential is a measure of site occupancy and is used as the yardstick to determine if stocking objectives have been met. The derived information is also used to assist in the determination of appropriate silvicultural treatments where required. This system was developed with MPB salvage assessments in mind. Surveyors should check with prescriptions and survey administrators to determine if this assessment procedure is an acceptable option in their respective contract. The web site Stocking in Partial Cut Stands provides further information. Also refer to Sections and below in the SEDRSS Survey Section, for detailed descriptions of DFP survey methodologies Single Entry Dispersed Retention (SEDRSS) Survey 2014 Recently, partial cutting approaches have been more widely used on the B.C. Coast. In most cases, where a partial cut system has been applied it has been incorrectly described as a Single Tree Selection Silvicultural System and subsequently used the Multi-storey Survey methodology, which assumes multiple harvest entries. The following sections represent an alternative approach to assessing single entry Coastal partial cutting and are direct excerpts from an Implementation Guide Paper - Single Entry Dispersed Retention Stocking Standard Feb. 14, 2014 originally presented to the Coastal Region FRPA Implementation Team (CRIT) from the Coastal Silviculture Working Group Single Entry Dispersed Retention System Suitability This proposed stocking standard framework is meant for stands managed with a Single Entry Dispersed Retention hybrid type of Silvicultural System - defined as a partial cut harvest entry where retained overstorey stems contribute towards a regen and free growing obligation. This stocking standard is meant to replace the multi-storied stocking standard, referenced in the Ministry of Forests and Range (MFR) publication titled: 136
137 Reference Guide to Forest Development Plan Stocking Standards. It is therefore assumed that future stand entries are not required to meet prescribed long term stand structural objectives. The intent of this standard and subsequent survey methodologies are for guidance purposes and represent suggested best management practices. The CRIT silviculture working group would like to highlight for forest professionals that the DFP tables within this SEDRSS methodology have been calibrated only for old growth Coastal Hemlock / Cedar stands. When applying the proposed methodology to other stand types, new tables will need to be developed and calibrated for these new conditions. We suggest that the proposed survey methodology may be used in all circumstances when coupled with the appropriate stand specific stocking tables. SEDRSS Suitable Stand Criteria: 1. Dispersed Retention Residual Basal Area (RBA) ranging from 9 to 39 m 2 /ha (Note this range is an interim guideline and is subject to revision for specific situations) and, 2. Stands that meet the specific Situations and Circumstances - Section 2.0 below (SEDRSS is not intended for a broad application across managed landscapes but rather is intended to be a tool to address specific management concerns within a local management unit) Stratification Criteria for Stand Unsuitable for SEDRSS 1. Areas 1.0 ha. with 8m 2 /ha of Dispersed Retention (1) (Open stands, clearcuts or stands with low levels of dispersed retention): Remove from the SU and treat with an Even-aged Stocking Standard; 2. Areas 1.0 ha with 40 m 2 /ha of Dispersed Retention (full stocking of ecologically suitable species with no openings > 0.1 ha. in size): Defined as an Intermediate cut (with no regeneration obligations) requiring a separate stocking standard; 3. Areas 0.25 ha Uncut: (large areas of reserved stems where no harvested or disturbance has occurred): Remove from SU and map as a Grouped Retention SU, classify as Group Reserve, removed from NAR and report in RESULTS; 4. Areas 1.0 ha. Broadleaf leading: SEDRSS is designed for conifer management only. (1) Note: That all stands that have > 5 m 2 of Dispersed Retention, including SEDRSS suitable stands of between 8 and 39 m 2, require that the overstorey retention inventory labels be reported appropriately into RESULTS as per the document: Procedures for Submitting Forest Cover to RESULTS for Openings with Treed Retention Situations and Circumstances for SEDRSS The stocking standard provides the linkage from stand level to forest level management. This type of standard is generally only applicable where retention of dispersed stems is 137
138 required to achieve non- timber FRPA management objectives. The Forest Stewardship Plan (FSP) must specify the situations and circumstances where the stocking standard will be applied. Complexes SEDRSS is best applied to only one site series - meaning the dominate site series for an SU- For example: An SU for an complex should just have the 01 site series standards applied, and not a 01/12 blend of the TSS and MSS threshold values. The SEDRSS standard is best applied to the dominate site series as long as the appropriate stratification practices are used (i.e. 1 ha. contiguous areas of minor 12 site series are not lumped in with 01 site series areas). Low Productivity Sites SEDRSS is not applicable for site series that would not be capable of achieving a closed canopy stand like very poor sites of low productivity where the TSS for even-aged is 400 sph or less (e.g. CWHvh1 12 or 02 sites series). The rationale is that these sites have very low stocking standards already and the application of the DFP concept is unworkable once the BA increases in the SEDRSS tables. It is recommended provincially that where possible harvesting or even partial harvesting with retention should be avoided on these sites. Most likely these sites will represent minor inclusions within a stratum within a dominant site series and areas greater than 1 ha of these sites series where SEDRSS will be applied will likely be very small SEDRSS Regen and Free Growing Obligation Criteria The following table matrix identifies the application of each obligation criteria relative to the SEDRSS standard (for both SEDRSS methodology options): 138
139 Layer COMMON Criteria REGEN FREE GROWING (FG) Criteria (REGEN & FG) Criteria Residual Overstorey Layer cm DBH Understorey (Advanced or Artificially Established) Layers 2, 3 & 4 < 12.5cm DBH Footnotes: Spp (1) MITD BA & Density As per FSP or SEDRSS Tabular As per FSP or SEDRSS Tabular 0 meters From Layer 1: Dripline (2) Between Layers 2, 3 & 4: 2.0 meters or as per FSP (SEDRSS Tabular only) BA as per SEDRSS Tabular Minimum Stocking as per SEDRSS Tabular REGEN Delay (Max Years) As per FSP or SEDRSS Tabular FG Declar ation (Min Yrs) Comp. Brush Factor (4) Min Ht (5) Damage Criteria 2 (3) N/A N/A As per SEDRSS As per FSP As per FSP or SEDRSS Tabular 1) Preferred and Acceptable species by site series. Option 1): As identified in the MFR publication titled: Reference Guide to FDP Stocking Standards. Option 2): Individual FSP authors may prefer to use the guidance in the above mentioned document as a good starting point for identifying one list of ecologically suitable species, and a species composition range for retained layer 1 trees that are based on the pre-harvest conditions. New emerging information, especially as it relates to shade tolerance, contained within published literature, research or data regarding species acceptability will aid FSP authors with this option. 2) The Dripline is defined as the vertical boundary of the outside of the outer live foliage of the overstorey tree. An understory tree is considered outside the Dripline if the main stem pith of the understorey stem is outside of the Damage Criteria for Layer 1 As per SEDRSS Damage Criteria for Layers 2, 3 & 4 139
140 Dripline as defined above. Overstorey stems (regardless if counted as a crop tree) inside and outside of survey plots are used to determine the Dripline. 3) Declaration of the Free Growing Obligation is recommended to be two years or greater after the completion of harvest. Although the date specified under Forest Planning and Practices Regulation (FPPR) 44 (1) (b) for which a person who has an obligation to establish a free growing stand must meet the applicable stocking standards and free growing criteria is no more than 20 years from the commencement date, for SEDRSS after two years the stand could be considered having met the Free Growing Criteria if the overstorey trees and understory of advanced regeneration meet the minimum criteria set out in the standard. This is considered as sufficient time for wind throw to be expressed in the residual stand. However, two years post-harvest will often be insufficient to allow for expression of added growth or release. 4) As required by legislation, a free growing stand must not be impeded by competing plants, shrubs or other trees. 5) Acceptable guidance is to list the minimum heights as 75% of the heights listed in the MFR publication titled: Reference Guide to FDP Stocking Standards for each species on a given site series unless certified under FPPR There may be situations where this reduced minimum height has not been achieved, but the understory stems meet all other criteria. In this situation a forest professional can use Forest Planning and Practices Regulation (FPPR) section 97.1 to indicate the obligation has been met and provide a rationale that indicates the crop trees are well established, free from vegetative competition and are not expected to be impacted by a forest health agent SEDRSS Damage Criteria All stems considered to be crop trees in both SEDRSS Methodologies, must meet or exceed the following damage criteria for both Layer 1 stems and Layers 2, 3, and 4 stems (separate damage criteria tables have been developed for each stand structure component). 140
141 FINAL October 6, 2010 FG DAMAGE CRITERIA FOR SINGLE ENTRY DISPERSED RETENTION STOCKING STANDARD (SEDRSS) MANAGED STANDS IN COASTAL B.C. and for INTERIOR DFP and Layered Surveys Note: this table overrides all other damage criteria for SEDRSS managed stands TABLE A- Layer cm DBH. SEDRSS damage criteria Location of Damage Type of Damage Tree being assessed is UNACCEPTABLE if: Hw, Ba, Bg, Bl, Cy, Fd, Ss, Pw, Cw Pl, Lw, Sx, Py No criteria Stem Wound Wound girdles >33% stem circumference, or One wound >400 cm 2 on stem, or Wound on major root within 1 m of stem, or Tree has gouge in stem. Stem Decay Any pathological indicator(s) are present. This may include conk, blind conk, frost crack, or rotten branches. Stem Bark Mining Any of the following signs are No criteria visible: pitch tubes, boring dust, exit holes on bark surface, galleries under the bark. Possible damage agents & codes fire NB, windthrow NW, sunscald NZ, logging TL, mechanical TT. various decay fungi DD. Douglas-fir beetle IBD, Ips pini IBI, Pityogenes & Pityophthorus IBP Comments A wound is defined as an injury in which the cambium is dead (e.g., sunscald) or completely removed from the tree exposing the sapwood. Measure the wound across the widest point of the exposed sapwood (or dead cambium when the tree is damaged by sunscald). Healed over wounds (=scars) are acceptable. Note: pitch tubes can be associated with trees that have successfully repelled bark beetles, bark must be removed above pitch tube to confirm successful attack (successful galleries will be filled with frass and not pitch, contain adult beetles and/or larval galleries). Stem Deformation (including crook, fork and dead or broken top) A crook displaces the portion of the stem above the defect by >50% from the line of growth formed by the stem below the point of defect in the bottom 2/3rds of the stem only. A fork occurs above stump height in the bottom 2/3rds of the stem only. A dead or broken top extends more than 20% of the stem length or the live crown is removed. No criteria A dead tree with no live foliage the stem is unable to produce > 50% merchantable volume. frost NG, hail NH, snow NY, drought ND, logging TL, mechanical TT, Dwarf mistletoes (see below). Stressed trees are susceptible to secondary bark and twig beetles. Cw: Unacceptable as a contributing Crop Tree if assessed as unable to produce > 50% Merchantable Volume in the first 10 m. log length defined as either: 1.Utility Grade At least a solid 8 inch shell Shake and Shingle and /or 2.Higher Grade Complete solid wood Saw Logs Note: Field guidance procedures and photo examples for the estimation of merchantable Cw volume are identified in Appendix BB. 141
142 Location of Damage Stem Type of Damage Dwarf Mistletoe Infection Hw, Ba, Bg, Bl, Cy, Fd, Ss, Pw, Pl, Lw, Sx, Py Hawksworth rating >3, or severe stem infections (major swelling or deformity) present. Foliage Defoliation For defoliating insects: > 80% of foliage has been removed, lost or damaged due to insect defoliation. For foliar diseases: > 50% of foliage has been removed, lost or damaged Tree being assessed is UNACCEPTABLE if: No criteria No criteria Cw Possible damage agents & codes hemlock dwarf mistletoe DMH defoliators ID, foliage diseases DF Comments The Hawksworth rating system is described in the FPC Dwarf Mistletoe Management Guidebook (or refer to Appendix AA of this document) For SEDRSS, this rating system will only apply to the tree/plot assessment level, and not at the stand level. Foliage Live Crown Vigour Stems < 17.5 cm dbh - < 30% live crown due to poor vigour. Stems 17.5 cm dbh - < 20% live crown due to poor vigour. A dead tree with no live foliage Percent live crown is the length of continuous green foliage on a tree expressed as a percentage of its total height. 142
143 Location of Damage Type of Damage Tree being assessed is UNACCEPTABLE if: Hw, Ba, Bg, Bl, Cy, Fd, Ss, Pw, Pl, Lw, Sx, Py Roots Root Disease Sign(s) or definitive combinations of symptoms of root disease are observed Cw For Cw, there is no criterion for net down calculation - considered not susceptible or low susceptibility. Infected conifer or stump found in plot. See Table Y for well-spaced tree net down calculation by layer. TABLE Y. Deductions from numbers of acceptable well-spaced uninfected stems for trees infected by root disease in layered stands. Tree layer with infected tree(s) or stumps Layer 1 Multiplier used to determine number of acceptable trees to be deducted from: Layer 1 Layer 2 Layer 3 Layer 4 Deduct BA of infected layer 1 from Crop BA Layer Layer Layer 4 2 Possible damage agents & codes armillaria root disease DRA, laminated root rot DRL, annosus root disease DRN. armillaria root disease DRA, laminated root rot DRL, annosus root disease DRN. Comments Signs are direct evidence of the pathogenic fungus including fruiting bodies, distinctive mycelium or rhizomorphs. Symptoms include foliar thinning or chlorosis, pronounced resin flow near the root collar, reduced recent leader growth, a distress cone crop, and wood decay or stain. Symptoms alone are not usually sufficient to identify root disease. Both signs and symptoms may be detected from old stumps, root balls, or other post-harvest remains. Example: How to apply net down for root disease. If root disease-infected trees are found in the plot: 1. Determine the number of healthy, well-spaced trees in each layer using the prescribed minimum inter-tree distance (MITD) (e. g., 3 layer 1, 3 layer 3 and 4 layer 4 = 10 healthy, wellspaced) ignoring the M-value; 2. Count the number of infected trees (e. g., 1 layer 1 tree and 1 layer 3 tree); 3. Working from the uppermost layer down, apply the multiplier in Table Y to each lower layer. Subtract the resultant from each layer in turn, for susceptible species only (e. g., if all trees are susceptible, 1 infected layer 1 tree removes 1 healthy, wellspaced layer 1 tree plus 3 layer 3 trees plus 4 layer 4 trees). Note the effects are cumulative, not exclusive and lower layers do not affect higher layers; Calculate the remaining healthy, well-spaced trees once all removals due to infected trees are completed (e. g = 2). The result is the maximum number of free growing trees tallied for the plot. TABLE B- Layers 2, 3 & 4 - < 12.5 cm DBH. SEDRSS damage criteria 143
144 Location of Damage Type of Damage Tree being assessed is UNACCEPTABLE if: Stem Wound Wound girdles >25% stem circumference, or One wound >10% the length of stem Host Species All Possible damage agents & codes fire NB, windthrow NW, sunscald NZ, logging TL, mechanical TT. Comments A wound is defined as an injury in which the cambium is dead (e.g., sunscald) or completely removed from the tree exposing the sapwood. Measure the wound across the widest point of the exposed sapwood (or dead cambium when the tree is damaged by sunscald). Healed over wounds (=scars) are acceptable. Stem Decay Any pathological indicator(s) are present. This may include conk, blind conk, frost crack, or rotten branches. Stem Bark Mining Any of the following signs are visible: pitch tubes, boring dust, exit holes on bark surface, galleries under the bark. All All various decay fungi DD. Douglas-fir beetle IBD, Ips pini IBI, Pityogenes & Pityophthorus IBP Note: pitch tubes can be associated with trees that have successfully repelled bark beetles, bark must be removed above pitch tube to confirm successful attack (successful galleries will be filled with frass and not pitch, contain adult beetles and/or larval galleries). Stem Deformation (including crook, fork and dead or broken top) The pith is horizontally displaced more than 30 cm from the point of defect and originates above 30 cm from the point of germination The tree leader has been killed three or more times in the last 5 years (weevil only) The tree has two or more leaders with no dominance expressed after five years growth and the fork originates above 30 cm from the point of germination. The tree has a dead or broken top at a point that is > 3cm in diameter. The tree has a flat top (umbrella like) form and no distinct leader. Stem Lean and Sweep The tree leans >30 0 from the vertical with or without growth correction. All Ss, Sx All All defoliators ID, white pine (spruce) weevil IWS, lodgepole pine terminal weevil IWP, cattle AC, deer AD, elk AE, moose AM, frost NG, hail NH, snow NY, drought ND, logging TL, mechanical TT, Dwarf mistletoes (see below). Flooding NF, snow NY, slides NS, wind NW, mechanical TM Stressed trees are susceptible to secondary bark and twig beetles. This criterion applies only for terminal weevil damage. Leader dominance occurs when the tallest leader is at least 5 cm taller than the second tallest leader. See Appendix AA on Damage Types. 144
145 Location of Damage Type of Damage Tree being assessed is UNACCEPTABLE if: Host Species Possible damage agents & codes Comments Stem Infection (includes cankers and galls) Any infection occurs on the stem. All white pine blister rust DSB, atropellis canker DSA, Dwarf mistletoes (see below). Note: Wounds caused by rodent feeding around rust cankers should have stem rust recorded as the causal agent. Branch Infection (cankers) An infection occurs on a live branch less than 60 cm from the stem. Branch Galls A gall rust infection occurs on a live branch less than 5 cm from the stem. Foliage Defoliation >60% tree foliage has been removed by hemlock looper Pw, Pl, Py Pl, Py Hw white pine blister rust DSB, comandra blister rust DSC, stalactiform blister rust DSS. western gall rust DSG. Hemlock looper IDL > 80% of foliage has been removed, lost or damaged due to insect defoliation. All other defoliators ID > 50% of foliage has been removed, lost or damaged due to foliar disease. All foliage diseases DF Foliage Live Crown Vigour <30% live crown present due to poor vigour. Percent live crown is the length of continuous green foliage on a tree expressed as a percentage of its total height. Stem or Branch Adelgid Gouting Any adelgid gouting occurs on a stem or branch. Ba, Bg, Bl balsam woolly adelgid IAB. Gouting is defined as excessive swelling on a branch or shoot caused by balsam woolly adelgid, and is often accompanied by misshapen needles and buds. It is most common on branch tips and at nodes near the ends of branches. Consult a recent distribution map to identify the geographic extent of this pest. Stem or Branch Dwarf Mistletoe Infection Any infection occurs on the stem or a live branch, or A susceptible tree is located within 10 m of the bole of a higher layer tree that is infected with dwarf mistletoe. Hw hemlock dwarf mistletoe DMH Note: To confirm infection, the surveyor must observe mistletoe aerial shoots or basal cups on regeneration or on live or dead fallen brooms. 145
146 Location of Damage Type of Damage Tree being assessed is UNACCEPTABLE if: Host Species Possible damage agents & codes Comments Roots Root Disease Sign(s) or definitive combinations of symptoms of root disease are observed All armillaria root disease DRA, laminated root rot DRL, annosus root disease DRN. Signs are direct evidence of the pathogenic fungus including fruiting bodies, distinctive mycelium or rhizomorphs. Symptoms include foliar thinning or chlorosis, pronounced resin flow near the root collar, reduced recent leader growth, a distress cone crop, and wood decay or stain. Symptoms alone are not usually sufficient to identify root disease. Both signs and symptoms may be detected from old stumps, root balls, or other post-harvest remains. Infected conifer or stump found in plot. See Table Y for well-spaced tree net down calculation by layer. Infected conifer or stump found in plot. See Table Y for well-spaced tree net down calculation by layer. All Fd, Ba, Bg armillaria root disease DRA. laminated root rot DRL. Example: How to apply net down for root disease. If root disease-infected trees are found in the plot: 4. Determine the number of healthy, well-spaced trees in each layer using the prescribed minimum inter-tree distance (MITD) (e. g., 3 layer 1, 3 layer 3 and 4 layer 4 = 10 healthy, wellspaced) ignoring the M-value; 5. Count the number of infected trees (e. g., 1 layer 1 tree and 1 layer 3 tree); 6. Working from the uppermost layer down, apply the multiplier in Table Y to each lower layer. Subtract the resultant from each layer in turn, for susceptible species only (e. g., if all trees are susceptible, 1 infected layer 1 tree removes 1 healthy, wellspaced layer 1 tree plus 3 layer 3 trees plus 4 layer 4 trees). Note the effects are cumulative, not exclusive and lower layers do not affect higher layers; Calculate the remaining healthy, well-spaced trees once all removals due to infected trees are completed (e. g = 2). The result is the maximum number of free growing trees tallied for the plot. Note: Bl, Cw, Pl, Pw, and broadleaf species are considered not susceptible for survey purposes only Infected conifer or stump found in plot. See Table Y for well-spaced tree net down calculation by layer. Ba, Hw, Ss annosus root rot DRN. Note: Bg, Bl, Cw, Cy, Fd, Hm, Pl, Pw, and broadleaf species are considered not susceptible for survey purposes only. 146
147 Appendix AA Damage Types Silviculture Survey Procedures Manual April 1,
148 Appendix BB: SEDRSS Field Guidance Procedures for the Estimation of Cw Merchantable Volume 1. Cw Stem Merchantability Criteria Criteria Definition: A Cw tree being assessed is Unacceptable as a contributing Crop Tree if unable to produce > 50% Merchantable Volume in the first 10 m. of log length, either: 1. Utility Grade At least a solid 8 inch shell Shake and Shingle and /or 2. Higher Grade Complete solid wood Saw Logs Figure 1: Visual Graphic Examples of Cw Stem Merchantability Criteria >50 % Merch >10 Meters OR >50 % Merch >10 Meters 148
149 Suggested Assessment Key Steps Step 1 Is the Tree1 live? No Reject Yes 2 Is the Total Stem 10 m in height, but shows potential for further growth? (i.e. not severely impeded or damaged) or No Reject Does the First 10 m. of log length, contain > 50% Merchantable Volume? Yes ACCEPT as CROP TREE Cw 1 Live tree means a tree has at least 1 live branch with green foliage. 149
150 2. Significant Visible Defect Indicators - Representing Unmerchantable Conditions 1. Significant Butt Rot as to produce a complete see through gap in the flared butt of a Cw above the root collar. 2. Woodpecker Holes around the complete circumference of the first and second 10 m. length of the stem. 3. Excessive Grain Twist to the Left 2 for the entire first and second 10 m. length of the stem. 4. Large Branches the diameter of sound bole wood around the complete circumference of the first and second 10 m. length of the stem. 5. Excessive Sun Check on grey ghost upper segment of dead top on a Cw for sun checks will penetrate twice the visible distance into sound wood to create unacceptable splitting. 2 Twist to the left extends into the heartwood significantly degrading the log quality and value. 150


151 3. Example Photos of Acceptable and Unacceptable Cw Trees Acceptable Cw Trees Acceptable Butt Rot Note: Butt rot does not extend completely through the tree. Acceptable Forking and form Live tree with first 10 meters containing > 50 % merchantable volume 151


152 Live tree First 10 meter log shows contains > 50 % merchantable volume Unacceptable Cw trees Catface and live fork First and second 10 meters of stem contain < 50 % merchantable volume due to large catface. 152
153 SEDRSS Methodologies Two Options: 1) SEDRSS DFP or 2) SEDRSS Tabular Background DFP Concept The Deviation From Potential (DFP) method of stocking assessment recognizes two stand components: overstorey trees - those trees greater than a designated DBH (e.g., 12.5cm) - and understory trees, those less than the designated diameter. The DFP method focuses on the future yield from the understory component. The underlying concept is that understory yield varies based on understory density and the amount of overstorey. To calibrate the concept, Martin et al (2005) 3 used TIPSY and TASS to relate understory density to future yield. Without an overstorey, as understory density increases, future yield increase rapidly and then level off. Predictions from TASS and other published research on the growth impact of retained overstorey were used to relate overstorey basal area to understory yield reduction. With increased overstorey basal area, understory yield potential decreases. The DFP combines the two relationships providing future understory yield over a range of understory density and overstorey basal area. Since the DFP is constructed from these fundamental relationships, it provides a solid biological basis for stocking assessments and standards. Deviation From Potential ranges from 0 to 1. A DFP of 0 at a sample point indicates that the sample point is fully stocked - that is there is no additional space available for added stocking at that point. At the other end of the spectrum a DFP of 1 (or 100%) indicates the point has no stocking and has a 100% deviation from the potential. This concept is a significant departure from historic forest stocking evaluation processes. Two implementation protocols are presented for SEDRSS to aid in clarifying the concept. Evaluation and survey approaches are presented based on either 1) the DFP model or 2) the Tabular integrated approach. These alternative approaches are presented to show how the stocking standard could be developed for an FSP submission. The working group members and resource specialists involved in the design and testing of this protocol strongly recommend forest professionals adopt option 2, the Tabular approach. Of the two methodologies the Tabular approach is considered as being the most accurate and practical methodology for use within a Forest Stewardship Plan Common Methodologies for Options 1) and 2) Survey Design Pre-stratification: Identify the areas suitable for SEDRSS as per the criteria listed in Section Martin, P.J., Bancroft, B., Day, K., and Peel, K A new basis for understory stocking standards for partially harvested stands in the British Columbia Interior. West. J. Appl. For. 20(1):
154 Plots: Establish 1 plot per ha within SU (stratum) or a minimum of 5 plots per SU (stratum). Plot Size: To tally understory stems use a 3.99m. or 5.64m. radius plot depending on stand condition. Use the same plot size throughout the entire SU. Prism size: Choose a prism that captures a minimum of 4 trees per plot from the preharvest condition (in cut areas this would be a combination of standing trees and stumps) RESULTS Entry The RESULTS Information Submission Specifications document has a recent supplement document (dated July 28, 2010) called - Procedures for Submitting Forest Cover to RESULTS for Openings with Treed Retention. This document clearly provides the content requirements for reporting SU s with Dispersed and Grouped Tree Retention. Basically, the reporting of Polygon, Inventory and Silviculture components are the same as reporting an even-aged clear cut stand with < 5m 2 of RBA, except for the following additional information: 1. Polygon Component a. Reserve Type: Enter Dispersed. b. Reserve Objective: Enter TIM (for timber objective, for the retained stems are contributing to the stocking and the next harvest). c. Tree Cover Pattern: Enter the Tree Cover Pattern Number for the pattern observed and recorded on the field card that best represented the pattern of the layer 1 residuals. 2. Inventory Component a. Layers: Report for layers 1 and individually for all other regen layers layer 2, 3, and 4, as explained in the data summary section below. b. Basal Area: Enter the Total BA m 2 /ha. value (including crop and non-crop stems) for the Residual Layer but not just the Crop BA. 3. Silviculture Component a. Layers: As for the Inventory Component, report for layers 1 and individually for all other regen layers layer 2, 3, and 4, as explained in the data summary section below. b. Well-spaced or Free Growing: Enter the mean WS or FG/ ha. value from the summary data (Whichever is being reported). c. Free Growing: Enter the mean FG / ha. value from the summary data. 154
155 d. Basal Area: enter the Crop BA m 2 /ha. value for the Residual Layer not the total BA as for the Inventory Label. 4. Add Comments regarding SEDRSS use a. In the comments field next to a milestone declaration, include a comment on the SEDRSS methodology used. Specifically for the SEDRSS DFP method, include the mean DFP value and the % stocking classes Option 1) SEDRSS DFP Survey Sampling Procedures This approach uses the DFP table (developed for the interior by Martin 2005) solely as the basis for the stocking decision. The resultant DFP derived from the Dispersed Retention BA and present understorey stocking levels at each plot produces an averaged DFP value for the SU, which must meet a standards threshold value. In addition three other thresholds must be met by the SU in order to achieve the obligation (a threshold percent of the plots in each stocking class of the DFP table must be met - refer to the decision table below). Field Survey Measurements: Determine the Dispersed Retention BA per plot and assess regen stocking using criteria for WS stems from the stocking standard. Use the overstorey crop trees BA only, and tally non crop BA separately. The non-crop tally may be used to identify the need for additional harvesting if non crop trees are found to be fully occupying the site. In some cases the stand may have been dominated by trees of non-crop status and this should be identified prior to assessment to address what should be tallied. o Plot card data field modifications (use of modified FS 658 Example shown in Figure 25d - without the WS and FG M values): o Data Collection procedures (using the modified FS 658 above): Set up the card similar as one would while collecting data for a multistorey or a layered even-aged survey (i.e. one row for each layer 1 and then another line for understorey /regen layers 2, 3 and 4 combined) o Tally of Residual Overstorey Layer 1 1. Start with tallies for Residual Layer 1 in the first row: a. Layer 1 = all stems 12.5 cm. DBH b. TT and TC; c. Number of Crop stems by species (all stems are recorded, for there is no MITD) 155
156 d. in GI column record Total # in sweep regardless if crop or noncrop stem; e. in the plantable/in column record Crop #in sweep; f. in the preparable column record Crop BA (crop # in sweep x BAF) g. Record the DFP for that plot using the DFP table below (a copy of this table is required to be included in the surveyors note book or loaded in their handheld program). 2. Record Tree Cover Pattern during the full survey data collection. Estimate the overall Tree Cover Pattern for the SU being surveyed, based on the diagram in Section of the Silviculture Survey Manual. Write the corresponding Tree Cover Pattern number in the comments section of the FS 658. o Tally of Regeneration Understorey Layers 2, 3 and 4 1. Tally the remaining Regeneration Layers 2, 3 and 4 in separate rows below layer 1 s row (no nesting of Layers, but use drip line MITD from ALL layer 1 stems regardless if Crop or Non-Crop trees or inside or outside of the plot (influence layer 1 trees are considered) and use MITD from the FSP for all other trees between layers 2, 3 and 4): a. TT and TC for each regeneration layer; b. Number of WS stems by species in the preferred and acceptable species columns relative to MITD criteria; c. In the total W column total all WS per each Regeneration Layer for all species; d. In the total FG column total all FG per each Regeneration Layer for all species; 2. Tally Plantable Spots, Preparable Spots and Competing Vegetation as regular surveys for each Regeneration Layer row and tally Forest Health Agents as regular surveys for each Regeneration Layer. o Record Inventory Label Data o An Inventory Label is recorded every 1 st and 4 th plot as regular surveys for each layer. This can be located at the bottom of the FS 658 comprised of a line per layer 1 and a line for each regen layer. If the leading species changes per layer, additional leading species can be listed in the additional inventory table to the right. o The best way to estimate Site Index for SEDRSS stands is to use the SIBEC methodology accessible from the following SIBEC website. Specifically the 1 st approximation SIBEC (if available for the site series) would be best used 156
157 for the Layer 1 overstorey SI and the 2 nd approximation SIBEC for the other Layers in the understorey labels. NOTE: The 1 st approximation SIBEC Site Indexes are identifiable by the listing of WHOLE numbers with no decimal places and no Standard Error (SE) value in the SIBEC Table for the species and sites series referenced. In contrast, the 2 nd approximation SIBEC Site Indexes are identifiable by the listing of FRACTIONS with decimal places and SE values in the SIBEC Table for the species and sites series referenced. Data Summary The field survey results are tallied and the following thresholds are calculated: 1.The average DFP value from all individual plots. 2.The percent of the total plots established per stocking class from the plot data and a value generated for each class stocked; partial stocked; and open. 3.Inventory and Silviculture Labels will be generated for Layer 1 and individually for all other regen layers Layer 2, 3, and 4. The Inventory Label will be generated from the data collected in the field every 1 st and 4 th plot for total species %, crown closure and from the mean TT summary for all layers. The Silviculture Label will be generated from the tally totals for WS and FG values and species percentages. Stocking Decision The SU is found to have met its Regen Obligation or Free Growing Obligation if the following table s criteria have been met. Table 10a DFP Regen and FG Obligation Criteria DFP Threshold Value Obligation Standard Average DFP Proportion of plots in open class (shaded red on DFP table) 0.32 or less 25% 157
158 Table 10b DFP COASTAL 2013 version 2 *- Basal Area and WS/ha. (Note: 1. Guidance for this table application is only recommended for cedar/ hemlock stands of SI 50 for Cw between 18 to 30m; if used below SI 18, provide rationale; 2. Red shaded areas are open and green shaded are stocked categories). BA of Overstorey crop trees 12.5 cm dbh Understorey density well spaced sph. and/or free growing sph
159 *(The development of this new 2013 table involved growth models assuming Cw and Hw overstorey and understorey; SI 24 of the overstorey and a rotation of 100 years.) Option 2) SEDRSS Tabular - Survey Sampling Procedures This approach integrates the overstorey and understorey aspects of the DFP approach and presents them in a tabular format. The working group members and resource specialists involved in the design and testing of this protocol strongly recommend that forest professionals adopt the Tabular approach. Of the two methodologies, the tabular approach is considered as being the most accurate and practical for use within a Forest Stewardship Plan. The DFP Table has been consolidated by grouping basal area (BA) and listing the density groups into a table (an example is shown below in Table 4). The tabular format is designed to match as close as possible, the current stocking standard tables found in the MFR publication titled: Reference Guide to FDP Stocking Standards at the following link: Ps/Reference_Guide.xls Target and minimum Well Spaced (WS) density standards are listed for each BA grouping in the table. These values were derived from the original DFP table and correspond to the open and stocked threshold lines used in the DFP approach above. The primary difference in using this Tabular approach versus the DFP approach above is the concept of a maximum (M value) for BA and for target WS stems. For example, if the maximum overstorey BA is set at 40 m 2 /ha, for a plot with more than 40 m 2 /ha, the value would be capped at 40 m 2 /ha with the understory contributing 0 WS. Correspondingly, the WS density has an M value depending on the BA grouping. 159
160 The intention is for FSP licensees to develop stocking standard tables specific to their coastal BEC Subzones and site series (or grouping of site series) for Single Entry Dispersed Retention management regimes. Table 10c: SEDRSS Tabular Method (derived from the DFP Table table 10b) - COASTAL 2013 Showing grouped BA Categories and corresponding MSS (red) threshold and TSS (green) threshold. (Note: The red shaded area is the MSS threshold & less; the green shaded area is the TSS & more; the grey shaded area is the management area in-between the MSS and TSS thresholds) BA of Overstorey crop trees 12.5 cm dbh Understorey density well spaced sph
161
162 Table 10d Example SEDRSS Tabular Method Coastal 2013 for CWHvh1 01 (based on table 10c) BGC U CWH vh1 01 Field Survey Layer Residual Layer (L1) ( 12.5dbh) (BA m 2 /ha) Regen Layer (L2-L4) (WS / ha. TSS Target MSS - Minimum) Measurements: Determine BA per plot and assess regen stocking using the obligation criteria for WS and/or FG stems from stocking standard (Insure to reference all possible BA range columns regardless of the level of dispersed retention for all ranges can be present within any Stratum being sampled but overall the resultant average BA for the Stratum will be within one level of dispersed retention Moderate or High). o Plot card data field modifications (use of modified FS 658 Example shown in Figure 25d ): 1. Within Column Heading Boxes across the top of the data entry section, modify: Count Conifer column to TSS; Count Height to MSS o Data Collection procedures (using the modified FS 658 above): 2. Set up the card similar as one would while collecting data for a multistorey or a layered even-aged survey (i.e. one row for each layer 1 and then another line for understorey /regen layers 2, 3 and 4 combined) o Tally of Residual Overstorey Layer 1 3. Start with tallies for Residual Layer 1 in the first row: a. Layer 1 = all stems 12.5 cm. DBH b. TT and TC; Regeneration Guide Species Site Occupancy Rege n Dela y (max yrs) All BA combinations are applicable to survey plots Cw, Hw, Cy, Pl Cw, Hw, Cy, Pl Only used during plots 0-8 m 2 /ha 900 TSS 500 MSS One of these 4 BA combinations are applicable to final SU REGEN / FG SEDRSS obligations 9-15 m 2 /ha 800 TSS 400 MSS m 2 /ha 700 TSS 300 MSS m 2 /ha 500 TSS 200 MSS m 2 /ha 400 TSS 100 MSS Only used during plots 40 m 2 /ha MIT D N/ A 3 L1 Drip line or 2.0 m (L2- L4) Free Growing Guide Species Cw,Yc, Pl Hw N/A Height (m)
163 c. Number of Crop stems by species (all stems are recorded, for there is no MITD) d. in GI column record Total # in sweep regardless if crop or noncrop stem; e. in the plantable/in column record Crop # in sweep; f. in the preparable column record Crop BA (crop # in sweep x BAF) 4. Using Crop BA determined above and the DFP tabular table, enter the TSS M value and MSS M value for the plot in the columns as modified above (example: If using a 5.64 m radius plot [1/100 ha.], and the BA is 20 m 2, then the TSS is 400 or 4 M value and MSS is 200 or 2 stems per plot). Note: Cap determination of BA at 40 m 2 when entering plot data i.e. if 50m 2 recorded in plot, 40 m 2 is entered. 5. Record Tree Cover Pattern during the full survey data collection. Estimate the overall Tree Cover Pattern for the SU being surveyed, based on the diagram in Section of the Silviculture Survey Manual. Write the corresponding Tree Cover Pattern number in the comments section of the FS 658. o Tally of Regeneration Understorey Layers 2, 3 and 4 6. Tally the remaining Regeneration Layers 2, 3 and 4 in separate rows below layer 1 s row (no nesting of Layers, but use drip line MITD from ALL layer 1 stems regardless if Crop or Non-Crop trees or inside or outside of the plot - influence layer 1 trees are considered and use the MITD from the table or FSP for all other trees between layers 2, 3 and 4): a. TT and TC for each regeneration layer; b. Number of WS stems by species in the preferred and acceptable species columns relative to MITD criteria; c. In the total W column total all WS per each Regeneration Layer for all species, if the sum exceeds the M value for that plot, enter the M value; d. In the total FG column total all FG per each Regeneration Layer for all species, if the sum exceeds the M value for that plot, enter the M value; 7. Tally Plantable Spots, Preparable Spots and Competing Vegetation as regular surveys for each Regeneration Layer row and tally Forest Health Agents as regular surveys for each Regeneration Layer. o Record Inventory Label Data 1. An Inventory Label is recorded every 1 st and 4 th plot as regular surveys for each layer. This can be located at the bottom of the FS 658 comprised of a line per layer 1 and a line for each regen layer. If the leading species 163
 would be best used for the layer 1 overstorey SI and the 2 nd approximation SIBEC for the other layer understorey labels.")
164 changes per layer, additional leading species can be listed in the additional inventory table to the right. 2. The best way to estimate Site Index for SEDRSS stands is to use the SIBEC methodology. Specifically the 1 st approximation SIBEC (if available for the site series) would be best used for the layer 1 overstorey SI and the 2 nd approximation SIBEC for the other layer understorey labels. Figure 25d: Example Field Card for DFP and Tabular Sampling Procedure Data Summary The field survey results are tallied and the mean calculated using the following test steps: 1.The Type of Retention System would be predetermined from the SP (Moderate, High or Very High Intermediate Cut) and verified in the field (i.e. determine which BEC, situation and circumstance and corresponding table that applies to this SU). 2.The average Crop BA/ha. for the Residual Layer 1 would be determined from the plot data and the appropriate column located on the table. 3.The mean WS or FG / ha. is determined from the plot data. The M value for each plot sum will be used in the compilation of the tallies and the determination of the mean value, as noted above in the Field Survey section. 164
165 Note: Statistical analysis is not applicable, due to the lower stocking values used in this methodology. 4.Inventory and Silviculture Labels will be generated for Layer 1 and individually for all other regen layers Layer 2, 3, and 4. The Inventory Label will be generated from the data collected in the field every 1 st and 4 th plot for total species %, crown closure and from the mean TT summary for all layers. The Silviculture Label will be generated from the tally totals for WS and FG values and species percentages. Stocking Decision The SU is found to have met its Regen Obligation or Free Growing Obligation if: 1. the mean Regen or FG sph the MSS sph for the corresponding Average Crop BA from the table Boreal Mixedwood Stand Structures Survey NI Forest Region Presently a draft for Mean Stocked Quadrants (MSQ) and Boreal Mixedwood surveys have been provided here for discussion purposes and reference only. Illustration 5: Boreal Mixedwood Intimate Stand Structures 165
166 Mean Stocked Quadrant Survey (MSQ) Office Procedures Map & Previous Data A Silviculture Prescription (SP) map (or equivalent) should be used to develop the plot locations of the stand survey and should be updated following each survey. This map should show block boundaries, non-productive (NP), non-commercial cover (NCC), wildlife tree patches (WTP), riparian management areas (RMA), permanent access structures (PAS), and temporary roads. The surveyor should also be familiar with the block history Office Stratification Each block map should be stratified prior to field sampling to show areas included in the volume estimate (the area equivalent to the current definition of NAR), and areas to be netted-out. Sample plots should only be located in the NAR. Stratification of the surveyed area should then be updated in the field after the survey is complete. Prior to field sampling, the following information should be added to the survey map: i) Transfer NAR boundary to the survey map ii) Transfer the Standard Unit boundaries from the SP to the survey map Plot Locations Sample plots are located on a 100 m grid (or 50 m grid for strata less than 5 ha) using UTM NAD 83 coordinates. Plot locations should be marked on the map prior to field sampling. All grid points within the NAR of each block should be sampled Sample Size The sample in each stratum includes full measure plots located on the 100 m grid points. This gives a sample intensity of one plot/ha. If strata are smaller than 5 ha, the sample size should be increased by adding plots on a 50 m grid between the100 m grid points. No fewer than 5 plots should be established in any stratum. If a multi-block reforestation approach is employed increasing plot density on smaller strata may not be necessary. Also, in multi-block surveys the minimum 5 plots per strata could be applied across multiple blocks containing the same stratum type Field Sampling Field Stratification Field stratification consists of the following components. i) The NAR must be clearly defined and the map updated if necessary. ii) Map inventory polygons. Follow current procedures to map inventory polygons using species composition, site productivity, and stand density. It is critical to distinguish between areas considered SR and NSR. Areas to update and identify on maps include: 166
167 iii) a) NP (swamps, rocks, shallow soil, etc.) 0.25 ha. b) NC brush. c) Roads (permanent and temporary). d) WTPs. e) Partially-cut areas. f) RMAs (reserves and management zones as necessary). g) Strata based on site index or site series, leading species, and density. Map potential treatment units. If cutblocks contain a viable treatment unit, add to the map the approximate location of the treatment unit and describe the treatment opportunity. The updated block maps will provide better information for volume and product modeling, and will help identify areas where additional silviculture treatments may increase volume production or improve product quality Measure Plots Each full measure plot includes a 50 m2 (3.99 m radius) plot divided into quadrants along cardinal directions to measure tree attributes and, at every 2 nd plot, a 100 m2 (5.64 m radius) plot to collect site tree data (located at the same plot center). Site index should be estimated for each species in the site index plot where suitable site trees of each species have three or more year s height growth above breast height Main Plot - 50 m2 Quadrant Information - Record each quadrant as stocked if it contains at least one healthy tree of an acceptable species that is free of brush competition (according to current free growing regulations). If a non-stocked quadrant could support tree growth, comment on why there are no trees (e.g., type of non-productive ground, missed plantable spots, brush competition, health problems). Tree Information - Data for each tree in the plot includes: i) Quadrant number (1-4). ii) Tree species. iii) Height (measure some for reference and visually estimate others). iv) Forest health codes use the same codes used in other silviculture surveys. Brush Information - In each quadrant record percent cover and average height of brush by species. If brush coverage and height is consistent, brush information may only need to be collected every fourth plot. NP Area Information - In each quadrant record the type and percent cover of NP area (e.g., rock, water). 167
168 Site Index Plots m2 Record site index information for one tree of each species from the site index plot (5.64 m radius) located at each plot center. Site trees are: i) The largest diameter (dbh) tree in the 100 m2 plot for that species. ii) Undamaged (stem damage resulting in less than 5% reduction in height growth). iii) Not overtopped by other trees or competing vegetation where height growth may be affected. The second tallest tree can be measured for site index if the tallest is not suitable. This must be noted on the field card. Information collected for each tree should include: i) Total height ii) iii) iv) Age at breast height (yrs) Total age (yrs) Rank in height relative to other trees in the plot of that species (e.g. tallest, 2 nd tallest, etc.) Compilation Each stratum identified within a standard unit must have a separate compilation of the results of the survey. Information in this methodology has been adapted from: J.S. Thrower and Associates Ltd Stand Survey & Growth Modeling for the TFL 49 Results-Based Pilot Project: Final Report. FRBC/Riverside Forest Products Ltd. J.S. Thrower and Associates Ltd Stand Survey & Growth Modeling for the Fort St. John TSA. CANFOR Boreal Mixedwood Survey Procedures The plot radii for stocking assessment is 3.99 meters and the stocked quadrant approach applies. The plot is divided into quarters along N-S and E-W axes. Once the plot orientation is established it is fixed for the entire survey, i.e. the quadrant orientation cannot be rotated differently in individual plots. The surveyor counts the number of plot quarters (quadrants) stocked with at least one acceptable tree. So, there may be 0, 1, 2, 3, or 4 stocked quadrants in a plot. The average of the plot tallies is Mean Stocked Quadrants (MSQ). MSQ ranges from 0 to 4.0. One plot per hectare is required. 1. If a quadrant is occupied by an acceptable At and there are no Sw present that are greater than the minimum height then the quadrant is recorded as stocked with aspen. For the regeneration date assessment a minimum of 3 At are required in a quadrant to tally 1 At. For assessments at free growing the ratio is 1:1. 168
169 The proposal of a ratio of 3 At to tally 1 At at regen date is intended to reflect the risk associated with relying on too low an initial At density given the damaging events that can significantly impact young At stand stocking levels. This ratio requires further evaluation. 2. If one or more Sw greater than the minimum height are present in a quadrant then the following procedure applies. i. First a one-meter radius is assessed around the Sw tree as per the standard free growing assessment procedure. To be tallied as free growing the one meter radius around the Sw tree cannot contain overtopping branches from non At or Ac competitors in more than 1 quadrant. This assessment applies to all potential competing vegetation (e.g. Ep, willow, calamagrostis). This one-meter radius can be rotated to minimize the number of quadrants overtopped. ii. If the Sw tree does not meet the one meter radius requirement then it cannot be tallied as free growing or well growing in that quadrant of the 3.99 meter radii stocking assessment plot. If there are no free growing Sw in a quadrant of the stocking assessment plot then the quadrant is assessed for At. If one or more At stems are in the quadrant and meet the provincial free growing standards then the quadrant is recorded as stocked with At. (At the regeneration date assessment a minimum of 3 At are required in a quadrant to tally 1 At. At free growing the ratio is 1:1.) Regardless of the number of acceptable At in a given quadrant only 1 At stem is tallied in the quadrant. iii. If the Sw tree meets the one meter radius (i.e. standard free growing) requirement then a further assessment of the Sw tree is undertaken to determine if it can be classified as likely to remain well growing as follows: For intimate mixedwoods a. First the BA around the potentially well/free growing is determined. If the BA is 8 m2 or less then the Sw can be classed as well/free growing. b. If the BA around the potentially well/free growing Sw is > 8 m2 then its Relative-Height-in-the-Canopy (RHC) is determined. c. To determine RHC: i. First the height of the Sw is determined. Then the top height and crown bottom of the At stand is determined. ii. iii. iv. At crown depth is determined by subtracting the At top height from the height of the At crown base. Subtract the height of the At crown base from the Sw height. Divide this number by the At crown depth to determine RHC If the RHC is less than 0.5 then the Sw cannot be considered well/free growing. d. If the Sw RHC is greater than 0.5 then Sw crown length within the canopy is determined. 169
170 i. The length of the Sw crown is determined by subtracting top height from the height of the Sw crown base and dividing by 3. ii. iii. The resulting number is then compared to the result of subtracting the height of the At crown base from the Sw height. If this number is greater than 1/3 the Sw crown depth then the Sw can be considered well/free growing. e. To be considered well/free growing in intimate mixtures with At BA > 8m2 the RHC must be greater than 0.5 and the Sw crown length within the At canopy must be greater than 1/3 Sw crown length. For successional mixedwoods a. Determine if Sw height is greater than 2m. b. Determine if the average leader length for the past 3 growing seasons is 20 cm or greater. c. Divide Sw height by DBH and determine if the height-to-diameter ratio (HDR) is 1.0 or less. d. To be determined well/free growing the Sw must be > 2m in height, have a 20 cm or greater average leader length for the past 3 growing seasons, and have a HDR of 1.0 or less. For macro, meso, and micro-patch mixedwoods a. The individual Sw tree to be assessed now becomes the plot center for a 5- metre radius assessment plot. b. To be assessed as likely to remain well growing there must not be any At within 2 meters of the Sw tree (measured stem to stem) in 2 quadrants of the 5 meter radius plot and 2 quadrants must be free of At for 5 meters (measured stem to stem). c. The 5-metre plot can be rotated to optimize the arrangement of the quadrants. Unlike the standard free growing assessment procedure, the 5-metre radius plot considers At both within and outside of the 3.99 radii plot. The 5-metre quadrant can cover any portion of the 3.99 meter radii plot (i.e. it could be oriented either away or towards the plot center). The proposal of the 5522 meter opening is tentative. Ongoing research may indicate the need to adjust this specification. Figure 28: 2255 Concept Diagram 5m Sx At 2m 170
171 d. A Sw tree meeting these criteria as well as the free growing criteria (as verified in step 2ii above) is tallied in the quadrant. If there are also one or more At occupying the quadrant and recorded as in step 2 ii above, then the quadrant is tallied as ½ Sw and ½ At. (At the regeneration date assessment a minimum of 3 At are required in a quadrant to tally 1 At. At free growing the ratio is 1:1.) The maximum stem count for any 3.99 meter radii stocking assessment plot cannot exceed Example Plots Plot samples modified from Schaad, A Mixedwood Survey Investigation The 2255 Method. MoFR. Victoria Quadrant Plot Sample 1-regeneration: 1m Sx Sx 4 3 At 1 2 At At 3.99m Quadrant Tally Comments At 1 1 At in the quadrant, one outside with a crown extending inside the quadrant. Do not record as being stocked with At 2 At 3 At present in the quadrant, recorded as stocked with At 3 Sx A t 4 Sx 1m dotted line provided for example only. 171
172 Quadrant Plot Sample 2 Free/Well growing : At At Sx At At At At At At At At Sx Sx Sx Quadrant Tally Comments 1 At 2 Sx 3 Sx present but recorded as 1 quadrant stocked with Sx 3 At 4 Sx The aspen stems are outside the quadrant and outside the 5522 area. 172
173 Quadrant Plot Sample 3 - Free/Well growing : At At At At At At At Sx At At Sx At At At At At At At Quadrant Tally Comments 1 The Sx meets the 1m but not the 5522 requirements. The Sx could be made free growing if the At in the 5m quadrant were removed. This is an understorey spruce over 1m tall and it is brushable. 2 At Multiple At in the quadrant. 3 ½ + ½ The Sx meets the 1m and the 2255 requirements and there is a well growing At in the quadrant too. 4 At Multiple At in the quadrant. 173
174 Quadrant Plot Sample 4 - Free/Well growing : Quadrant 1 Quadrant 2 At At At At At At At At At Sx At At At At At At At At Sx Sx Sx Sx Sx Sx At At Sx Sx Sx Sx Sx At At At At At At At At At At At At At At At At At At At At Sx At At At At At At At At Sx Sx Sx Sx Sx Sx At At Sx Sx Sx Sx Sx At At At At At At At At At At At Quadrant 3 Quadrant 4 At At At At At At At At At Sx At At At At At At At Sx Sx Sx Sx At Sx Sx At Sx Sx At At Sx At At At At At Sx Sx At At At At At At At At At At At At At At Sx At At At At At At At At Sx Sx Sx Sx Sx Sx At At Sx Sx Sx Sx Sx At At At At At At At At At At At Quadrant Tally Comments 1 Sx The Sx meets the 1m and the Sx The Sx meets the 1m and the Sx The Sx meets the 1m and the Sx The Sx meets the 1m and the
:4.5 m Sw crown in At canopy: SCL/3 SHC 4.5/3 1.")
/3 = 23 cm DBH: 3.4 cm Sw Height to Diameter ratio: 3.0/3.4=0.88 Sw exceeds the 2.")
175 Plot Sample 5 - Free/Well growing intimate mix: Sw height: 5.6 m At top height: 7.0 m At bottom live crown: 4.0 m At crown depth (ACD): = 3.0 m Sw height into crown (SHC):5.6 4=1.6m RHC: SHC/ACD 1.6/3.0 = 0.53 Sw exceeds the 0.5 RHC requirement Sw crown length (SCL):4.5 m Sw crown in At canopy: SCL/3 SHC 4.5/3 1.6 < 0 Sw exceeds the Sw crown in At canopy requirement. Sw is Free/Well growing Plot Sample 6 - Free/Well growing successional mix: Sw height: 3.0 m Last 3 growing season leader length average: ( )/3 = 23 cm DBH: 3.4 cm Sw Height to Diameter ratio: 3.0/3.4=0.88 Sw exceeds the 2.0 m height criteria Last 3 growing season leader length average exceeds 20 cm Sw HDR is < 1.0 Sw can be considered as Free/Well growing 175
176 9.3 Complex Horizontal Structure Survey Methodologies Even-aged Clustered Stand Structures Survey Cluster treatments result in groups of trees that do not have a relatively even spatial distribution. Cluster treatments can increase biodiversity, while reducing planting and vegetation management costs. Cluster treatments may also be used on openings that have a reduced number of microsites suitable for tree survival and growth. Examples of these treatments are cluster planting and cluster juvenile spacing. The silviculture plan or prescription sets a minimum inter-tree distance that is commonly lower than the minimum inter-tree distance used on non-cluster treated openings. Illustration 6: Even-aged Clustered Stand Structures The stand level objectives of the cluster treatment must be clearly defined prior to beginning the survey. Objectives may include: total trees per hectare number of trees per cluster minimum inter-tree spacing maximum inter-tree spacing total clusters per hectare target inter-cluster spacing cluster design. The survey data collected may change depending on the objective of the survey, but the data and recording techniques will be consistent with other survey types. For example, when determining planting quality, the conventional planting criteria will be assessed (e.g., plantable spots, number of trees planted, excess trees, satisfactorily planted trees) 176
177 with the addition of cluster spacing and/or clusters per hectare. Establishment of plots will follow the same procedures as other silviculture surveys, except that a larger plot radius is recommended. A 5.64 meter radius plot is recommended to be used where there are more than 100 clusters per hectare. Openings having fewer than 100 clusters per hectare may require an even larger plot. At each plot, the surveyor should record the number of cluster centers that fall within the plot radius and the number of trees that fall within the plot radius. Regardless as to whether the cluster center falls within the plot radius or not, the trees that fall within the plot should be tallied Intermediate Cuts Commercial Thinning Survey (Openings without regeneration objectives) Openings without regeneration objectives are most often areas of commercial thinning, removal of individual trees or other types of intermediate cutting. The Forest Planning and Practices Regulation requires, for openings without regeneration objectives, a survey to be completed twelve months after the completion of harvesting. The survey enables the district manager to determine that the requirements of the silviculture plan or prescription and stocking standards have been met. Illustration 7: Intermediate Cuts Commercial Thinning Even-aged Stand Structures 177
178 Commercial Thinning Survey Procedures The majority of the survey components for the commercial thinning survey are the same as for other forms of silviculture surveys. Stratification is completed for all of the reasons applied to other silviculture surveys. There are a few notable differences. These are: identification of gaps; determination of plot method (prism or fixed radius); number of sample trees; site index method; forest health damage criteria for scars; and data collection in 5 cm diameter classes. Identification of gaps in the stocking are particularly important, since there is no intent to regenerate the opening, existing gaps will persist through to the next harvest. The walkthrough should pay particular attention to gaps or voids produced during the commercial thinning operations. During the walk-through the surveyor will have to determine the form of sample plots that will be established. If during the walk-through it is determined that 4 to 8 trees will be found in each of the prism sweeps using a BAF 5 prism, (or larger for the coast) then prism plots should be used to survey the stand. The plots should be measured carefully as they would be during timber cruising. If less than 4 to 8 trees would be found in the BAF 5 prism plots (or larger for the coast) then fixed radius plots should be used. The plot radius is selected based on the table 3. below to ensure the survey plots will identify 6 or more crop trees in each fixed radius plot. Estimated Crop Tree Density (tr/ha) Fixed Radius Plot Site index will usually be determined using the site index (height/age) curve method, since the stand will likely be taller than can be surveyed using the growth intercept 178 (m) > < Table 10d: Plot Radius to Crop Tree Densities Relationship A minimum number of 5 crop trees should be sampled for their age and height rather than the minimum three used during other stocking and free growing surveys.
179 method. The forest health damage criteria have been adjusted to reflect the known harvesting damage potential in commercial thinning as well as the older nature of the candidate stands when compared to the typical free growing stand upon which the free growing damage criteria are applied. Individual wounds may have a maximum size of 400 cm 2 (20 x 20 cm). Multiple wounds may have a maximum cumulative area of 900 cm 2. Any single wound may not extend more than 1/3 rd of the circumference of the crop tree. The plot data to be collected is similar to a pre and post stand tending survey; data is collected in 5 cm diameter classes. Where an experienced surveyor is confident during the walk-through that there are no concerns present, the visual assessment survey method may be a suitable alternative to the formal plot establishment process Coastal Mixedwood Stand Structure Survey Coastal Forest Region This section is an excerpt from the discussion paper - Hardwood Management in the Coast Forest Region published in April The paper outlines the strategic plan for the management of hardwoods in several management regimes and how achievement of those stocking standards will be measured. This section focuses on the Mixedwood Management Regime, regarding the management of primarily Red Alder in patch mixtures with conifers (not intimate mixtures). Illustration 8: Coastal Mixedwood - Patch Mixtures Stand Structures Mixedwood Management Strategy Under a mixedwood management regime, with either natural or artificial regeneration, the target rotation age to produce a hardwood and a conifer sawlog with minimum size characteristics is years. Under this regime there is an anticipated reduction to Allowable Annual Cut (AAC) when compared to conifer management. This regime is complex to model; the magnitude of the 179
180 reduction is anticipated to be similar to the extensive management regime. The regime is sub-divided into forest types or land classes based on the leading species component. Conifer leading (C): >80% basal area is conifer Conifer leading mixedwood (CD): > 50% but < 80% basal area is conifer Deciduous leading mixedwood (DC): > 50% but < 80% basal area is deciduous hardwoods Deciduous leading (D): > 80% B=basal area is deciduous broadleaf. The mixed designations, CD and DC, are recognized to have differentiations based on structural attributes. These classes can be broken into: Stratified mixtures: where one component (usually deciduous) makes up the overstorey and the other is in the understory Intimate mixtures: where both components share dominance on the site and each are within the overstorey. Mosaic mixtures: where each component is a distinct separate patch. A mixedwood strategy should outline: The objectives for mixedwood management (e.g. products, yield, stand and landscape diversity, etc.) The method for classifying and tracking the forest types or land classes (CD, DC) The ecosystems where mixedwood management will achieve the desired rotation lengths and product values ((BEC zone/subzone site series) The types of mixedwood strategies being pursued The stocking standards and free growing criteria associated with each type Types of Mixedwood Strategies The potential mixedwood strategies are Macro patch mixedwood (large distinct and discreet patches of pure hardwood and pure conifer e.g. one block hardwood one conifer, or one half a block as hardwood the other 1/2 conifer) Meso patch mixedwood (medium sized distinct and discreet patches of pure hardwood and pure conifer e.g. a stratum divided into one portion hardwood and the rest conifer) Micro patch mixedwood (small distinct and discreet patches >1/2ha - of pure conifer and hardwood intermixed throughout the stratum) Intimate mixedwood (intermixing of both conifer and hardwood throughout with the intention of producing a crop of both at the same time in the future) Successional mixedwood (intermixing of both conifer and hardwoods but stratifying based on canopy level with the intent of sequentially harvesting one then the other ) 180
181 At this point the main focus of the Coastal Mixedwood Strategy is on management of Red Alder with conifers on similar rotations. The only feasible mixedwood strategies for this focus, given the growth requirements, are the patch mixedwood strategies (macro, meso, and micro). Example regime: Patch mixedwood management Strategy Option Patch mixedwood (macro, meso, micro) Site Preparation Planting density Final Harvest Optional - mechanical sph of conifer Natural regeneration of hardwoods (Alder) (technical rotation) Target Hardwood diameter 30 cm Rotation years Target hardwood volume 300 m 3 per ha Comments -Natural regeneration of hardwoods may be managed for if various criteria are met; (appropriate density and tree distribution, > minimum patch, appropriate ecosystem) Stocking standards and free growing criteria Every mixedwood structural class will have associated with it unique stocking standards and free growing criteria. A definition of what constitutes a free growing tree in each of these structural classes is required to ensure that the desired future conditions are achieved. A free growing Fdc in a large patch mixedwood will look considerably different than a free growing (or well growing) Fdc in an intimate mixture. In a mixedwood scenario the free growing criteria should describe the attributes of the target tree that indicate that it is currently growing, and is anticipated to continue to grow, at a rate that is consistent with achieving the targeted future land classification and yield targets. Within each broad land class designation there is a range of potential combinations of broadleaf and coniferous species, as such the management strategy undertaken and the resultant species mix within each stand will have different impacts on the future realized yield. If a landscape level approach is taken in the management of the mixedwood resource, determination of future yield targets for each component (broadleaf and coniferous) should be determined and managed for Target rotations and mixedwood strategies A critical component of mixedwood management is making allowance for the rotation 181
182 length target for each stand and each component of the stand. Depending on how rotation length is to be defined (e.g. economic, max Mean Annual Increment (MAI), target diameter, etc.) broadleaf and coniferous species can have different rotation lengths. As such, prescribing the desired rotation length for the stand, or the components of that stand, can influence the choice of stocking standards and configuration of the mixedwood strategy undertaken. If a significant difference in rotation length for the desired components of the mixedwood is anticipated, or deliberately targeted, it may result, depending on strategy chosen, in different stocking standards and free growing criteria. It may also limit the configuration of the mixedwood (i.e. the pattern and size of patches) on the unit being managed. The main reason for this consideration of mixedwood configuration and standards in relation to rotation length is to be able to effectively and efficiently access each component at the anticipated harvest time and not foreclose on future harvest options on the site Patch mixedwood stocking standards (Macro, Meso, and Micro patches) Stocking standards for the patch mixedwood strategy should consider developing complementary standards that will be applied depending on the land class that the survey plot falls within. In areas designated as CD or DC, survey plots that fall within conifer dominated portions of the opening will have a coniferous stocking standard applied and survey plots that fall within broadleaf dominated portions will have the broadleaf stocking standard applied. In order to focus on the management of target species within each of these patches, the use of coniferous species as acceptable in broadleaf standards or broadleaf species as acceptable in coniferous standards should be avoided. It is assumed that in these situations where lone individuals or groups of individuals of the non-target species occur within a patch that the tolerance allowances outlined in the Free Growing criteria will compensate for their presence. Inclusion of the non-target species in the stocking standards may cloud the actual achievement of the land class designation on the unit as a whole. In all patch mixedwood cases, the complementary conifer stocking standard should reflect those developed for the applicable site series the unit falls within for even aged conifer reforestation. A stocking standard combining both the deciduous and coniferous portion could be presented. 182
183 Example: patch mixedwood stocking standard, deciduous portion only (CWH mm1 05) Preferred Accept Stocking density (stems per ha) Mitd Regen delay Free growing (years) % Ht above brush Species Species Preferred p&a (m) (Years) Early Late (m) Dr Min. Ht. Example: patch mixedwood combined deciduous and conifer stocking standard (CWH mm1 05) Class Preferred Accept Stocking density (stems per ha) Species Species Preferred p&a Min p Mitd Regen delay Free growing (years) % Ht above brush Min. Ht. (m) (Years) Early Late (m) D Dr Dr4.0 C Fd Cw Pw Fd3.0 Cw1.5 Pw Free Growing Criteria All coniferous free growing criteria will be as per Appendix 9 Free from brush free growing criteria in the Establishment to Free Growing Guidebook version 2.3 (May 2000 revised October, 2007). Broadleaf free growing criteria should include the appropriate height-above- brush ratio for the ecosystem being managed and include considerations for the relationship between the target tree and surrounding vegetation Free Growing Damage Criteria All coniferous free growing damage criteria will be as per appendix 5 Free growing damage criteria for British Columbia in the Establishment to Free Growing Guidebook version 2.3 (May 2000 revised October, 2007). Unless otherwise stated in regulation or an approved FSP stocking standard, an acceptable broadleaf crop tree must: Not have a tree pith that is laterally displaced more than 30 cm from the location of the root-crown pith. Not originate from a cut stump 4. 4 Stems originating from the sides or cut surface of stumps are very susceptible to breakage at the coppice point, exception may be Big leaf maple 183
184 Have one dominant live leader 5. Not have a wound that is greater than 10% of the stem circumference nor is greater than 10% of the total length of the stem. 6. Not have any fungal infections or insect infestations affecting tissues below the bark surface, visible without destructive sampling 7. Not be browsed so as to limit its ability to become a crop tree Free growing Survey System Pre-stratify the block into appropriate polygons assigning land class designations of C, D, CD, or DC. In each unit identified as being managed for patch mixedwood strategies establish a grid of plots based on 1 plot per ha to a minimum of 5 plots per polygon. At each plot identify the leading land class designation, and then utilize the applicable broadleaf or coniferous stocking standard for that unit. Tally the number of plots falling into each land class category and determine the percentage of the plots as either D or C. Determine the overall mixedwood land class designation based on the proportion of the area comprised of both D and C classes. For example, if 60% of the plots are classified as C and 40% of the plots are classified as D the land class for the polygon will be CD. All C and D plots will be tallied separately to determine overall achievement of stocking and reporting of inventory labels for each land class within the mixedwood identified polygon Minimum patch size The establishment of a minimum patch size is essential to ensure that each species being managed for within the mixedwood achieves the desired volume and product value targets. Patch size should be large enough to ensure adequate growth rates and the development of acceptable tree form, so that desired rotation lengths are achieved and so that product value is maximized for each species. Regarding coastal Red Alder /conifer mixed woods, in order to achieve optimal growth rates it is recommended that patches not be smaller than ½ ha. Any patch smaller than these sizes should not be tallied as achieving the targeted land class. 5 The objective is that the tree has a single stem that will develop into a healthy crop tree. Accordingly, a healthy, free growing broadleaf tree must have an identifiable live leader. It is not important if a portion, but not all, of the leader is browsed or killed for example by venturia blight. 6 A wound is defined as an injury in which the cambium is dead or completely removed from the tree exposing the sapwood. Measure the wound across the widest point of the exposed sapwood. Healed-over wounds (= scars) are acceptable. Fire or sunscald damage can also cause wounds. 7 Visible stem infections include cyptospora canker or sooty-bark canker, and visible insect infestations, such as poplar borer. The significance of some diseases, such as armillaria root disease, to broadleaves is unknown or uncertain, and several cannot be feasibly identified by visual features during free growing surveys. 184
185 9.3.4 Clearcut with Reserves Survey Data Reserves are forested patches or individual trees retained during harvesting or other forestry operations to provide habitat, scenic values, biodiversity, or other values. They are long-term retention areas generally left one rotation or longer. Trees retained for a short term, such as seed or shelterwood trees, are not reserve trees, and are described in conjunction with the description of the silvicultural system on the silviculture plan or prescription. Illustration 8: Clearcut with Reserves Stand Structures Reserve patches do not normally have harvest entries. However, entries may occasionally be required to address safety concerns or a management objective such as forest health. Where a harvest entry occurs, a standards unit must be delineated for that reserve and the licensee may have reforestation responsibilities. Where removals are very light, there may not be any regeneration objectives. If the licensee has reforestation responsibilities, surveys must be conducted on these areas. No silviculture responsibilities are associated with reserve patches that have no harvest entries Reserve Data to Collect During the Silviculture Survey Reserve Data for Un-harvested Areas: Ground surveys are performed only in those reserves in which harvesting has occurred. For reserves in which harvesting has not occurred, the reserve can be described on the forest cover RESULTS entry based on preharvest stand information (e.g., from older forest cover maps or from timber cruise information), plus the addition of a reference year. Reserve Data for Harvested Areas: Recording ground surveyed openings forest cover 185
186 for harvested areas with reserved treed retention is fully described in the RESULTS Information Submission Specifications (RISS) located on the RESULTS website and further examples are presented in a supplement to this document on the same web link Submitting Forest Cover to RESULTS for Openings with Treed Retention. This document provides examples of how to prepare RESULTS forest cover submissions for harvesting associated with silvicultural systems that contain some kind of retention in the form of long term treed residuals (reserves for the entire rotational planning cycle) or short term treed residuals (with anticipated subsequent harvest removals prior to the end of the rotational planning cycle). The examples span a range of retention levels from low basal area (BA) retention to high BA retention. Inventory Label and Crown Closure%: When submitting an inventory label for various layers of retention, it is important for surveyors to be aware that the uppermost layer present will be selected first to update inventories as long as the crown closure is 10%. If the upper most layer has a crown closure of < 10% - the next lowest layer will be selected for inventory update, as long as its crown closure is 10%. Note: The percent leading species will be based on Volume for predominately Layer 1 and 2 SU s and on relative Density of stems per ha. for younger Layer 3 and 4 dominated SU s. Survey Data Collection in Treed Retention Openings: In order to report retention within a surveyed opening, it is recommended that the surveyor adhere to the following process, to report the data points (Reserve Type; Reserve objective; and Tree Cover Pattern) for the opening to be entered into RESULTS under forest cover polygon component: 1) Identify Reserve Type and Objective: Identify if the opening has a prescribed retention type and objective within the silviculture plan or prescription for the opening. The options are for Reserve Type are Grouped or Dispersed. Grouped reserves would be areas not harvested and would be described as above and removed from the survey area. Dispersed reserves would be scattered un-mappable residual stems purposely left post harvest (as per the silviculture plan or prescription). The options for the Reserve Objective would vary, depending on the value being represented for example: TIM for timber production and they contribute to the opening s stocking standards; WTR for wildlife habitat; or VIS for a visual quality objective; etc. 2) Record Reserve Type and Objective: Record the type and object (if applicable) on the back of the FS 657 under other resource values and with further explanation if needed in the comment section. 3) Record Tree Cover Pattern: During the initial walk-through and/or during the full survey data collection, estimate the overall Tree Cover Pattern for the SU being surveyed, based on the following diagram (originally from page 61 in the vegetation Resource Inventory Photo Interpretation Procedures). Write the corresponding Tree Cover Pattern number in the comments section of the FS
187 Figure 28a Tree Cover Pattern 1. Single to very few (<4) occurrences of limited extent, circular to irregular shape. 2. Single to very few (<4) occurrences of limited extent, linear or elongated shape. 3. Several (>3) sporadic occurrences of limited extent, circular to irregular shape. 4. Several (>3) sporadic occurrences of limited extent, linear or elongated shape. 5. Intimately intermixed units, often with gradational transitions from one to the other. 6. Discontinuous but extensive occurrences, parallel to sub-parallel elongated in shape. 7. Limited continuous occurrence with few inclusions. 8. Continuous occurrence with several inclusions. 187
188 9. Continuous occurrence with very few inclusions. 4) Reporting the Reserve Type, Reserve Objective and Tree Cover Pattern: When entering the final survey compilation into RESULTS for an activity record or milestone declaration, enter the appropriate codes for these 3 values into the inputs for the forest cover polygon component of the SU s with dispersed retention. Follow the examples within the document - Submitting Forest Cover to RESULTS for Openings with Treed Retention - to aid in coding the specific retention situation observed during the field survey Small Scale Harvested Openings Survey Small Scale Salvage (SSS) or Helicopter Harvested Units. The following is a suggested methodology to perform a stocking survey of SSS or helicopter harvested openings resulting from harvesting very small openings which are: usually < 1 ha. in size, and; scattered in close proximity across a localized landscape (approximately in an area less than 4 square kilometres - to make it operational). This suggested survey method is a blend of Representative Sampling and Visual Assessments and should therefore best be performed by experienced surveyors only. A full grid pattern survey design is not recommended for these openings. SSS / Small Helicopter Harvested Units - Survey Procedure Steps 1) Opening Identification: Locate all of the openings on a digital map or if unavailable, on orthophotos at a minimum. 2) Pre-stratification and Grouping: Stratify or group the tiny openings into common BEC Subzones - either by overlapping a BEC layer from MapView or referring to the BEC map for your area. If Predictive Ecosystem Maps (PEMs) are available, these will facilitate the grouping of openings further by site series for the openings. Label these groups of openings into pre-stratified sampling strata. 3) Stocking Standard Reference from Prescription or Default Determination: Reference the existing Stocking Standards if they exist on file. If there are no existing Stocking Standards in an approved silviculture plan or prescription, locate the applicable regional stocking standards for the BEC Subzones and site series in order to establish baseline species and stocking levels needed to declare the openings stocked (SR) or not 188
189 satisfactorily regenerated (NSR). 4) Visual Assessment Survey of Grouped Openings: An experienced surveyor is recommended to walk-through most of the individual openings within each grouped strata as determined from the previous steps (some openings may be visually assessed from a distance if they appear similar to the adjacent opening). The goal of this assessment survey would be to collect critical data in order to determine the stocking status. A visual assessment collects the information listed below for each opening and target establishing at least one representative plot per final treatment unit (common site series and stocking status) in order to physically confirm the treatment unit status on the ground. Collect the following critical data for each opening and ultimately for each grouped opening treatment unit strata: i) Inventory Label and Silviculture Label ii) BEC Subzone and site series ii) if NSR plantable spots per ha and species prescription iv) present brush species and levels and anticipated future levels v) one photo per treatment type, showing any significant differences observed. 5) Compilation of Grouped Strata and Treatment Units: Compile grouped openings into common treatment units and draft prescriptions for planting/brushing for NSR areas. Enter SR areas into RESULTS (following recommended procedures for entry of SSS into RESULTS via the guidance document on RESULTS website) as stocked and schedule further treatments,surveys or free growing surveys when appropriate. 189
190 9.4 Other Alternative Survey Methodologies Green-up (Adjacency) Survey Objective of a Green up Survey The objective of a green-up survey is to determine whether or not a cut block is greenedup as specified in a silviculture plan or prescription (FDP or FSP), or as specified in the appropriate Regulation depending if the proposed new cut block is under a Forest Development Plan or Forest Stewardship Plan. In general for both regulation requirements, the surveyor must at least assess the following: 1. Area Achieving Green-up Height: Determine the proportion of the net area to be reforested, meeting Density and Green-up Height requirements below; 2. Density: Estimate the total density of commercially valuable species (TCV) Total Conifer count of preferred and acceptable species including other commercially valuable species if present that are > 1.3 m. in height; 3. Green-up Height: Estimate the average height of the tallest 10% of the above identified trees (tallest trees in a 1/100 of a ha. plot in a 5.64 m. radius plot). Prior to commencing green-up data collection, a surveyor must determine if cut block adjacency and green-up status, is an issue for the opening being assessed. Both FPC and FRPA have potential exemptions to green-up requirements, as well higher level plans may have approved exemptions and different value criteria for achievement of green-up. Therefore it is recommended for the surveyor to seek direction from the contract and/or licensee administrators regarding these specifics and requirement of data collection. 190
191 FPC Forest Development Plan (FDP) and FRPA Forest Stewardship Plan (FSP) New Cut Block s Adjacency Assessment Requirements The following are the general criteria for new cut blocks proposed under a FDP and FSP, required to achieve adjacency provision: New Cut Block Plan 1. Area Achieving Green-up Height: 2. Density 3. Green-up Height FDP 75% 800 TCV (1) Coast 1000 TCV Interior 3 m. 500 TCV Coast 700 TCV Interior FSP 75% 500 TCV Coast 700 TCV Interior 3.5 m. 3 m. (1) Commercially Valuable Species. This is not defined in legislation either in the old FPC or in the current FRPA and FPPR. Therefore as guidance, the use of the default definition in the Green-up Guidebook from the FPC era is recommended practice: "Commercially valuable species" would generally include the species listed in applicable Establishment to Free Growing guidebooks (currently the default Stocking Standards on the Stocking Standard website), regional mixed wood and hardwood stocking standards, and species included in the timber supply review as contributing to allowable annual cut (AAC) Data Collection Method Options. If a surveyor is assessing green- up for a new FDP cut block, more specific detail on data collection options and methodologies are contained in the FPC Green-up Guidebook. Note, that the sampling intensity of a minimum of 10 green-up plots per opening is only a guideline and not a requirement During a Free Growing Survey The use or collection of green-up data from or during a free growing survey is the preferred options for surveyors. This is the most efficient opportunity to assess if greenup has been achieved or when one can forecast green-up achievement and prescribe a 191
192 verification recce survey. Four scenarios are proposed for using or collecting green-up data from free growing data and procedures: 1. Free Growing Survey Recently Completed: a. With High FG Density and Height Data: The results can be used, as long as the FG trees on all of the strata (at least 75% of the net area) meets or exceeds the densities listed above for the plan for the cut block and that the FG height of the FG stems exceeds the required green-up heights to the corresponding densities. b. With Lower FG Density Data then required criteria: If FG trees alone are insufficient to meet the density requirement, the data could be mined (depending on the collect method cards or data loggers) to extract just the well spaced trees, regardless if they meet forest health criteria. As well total trees in surplus of the well spaced and free growing trees (that are still preferred and acceptable species) could be added to the total density tally for green-up trees need not be well spaced. However the green-up height may not be reflected in the data or maybe lower than required. With this scenario, depending on the depth and reliability of the data mining, an on-site reassessment of the opening to verify the green-up criteria maybe required. 2. Additional Data to be Collected during a planned Free Growing Survey: a. With Apparent Adequate Density and Green-up Heights: Tally two addition data points per plot: i. Total number TCV per plot - if different then total conifer (TC) count; ii. Determine the height of the tallest preferred and acceptable species per plot, based on a 5.64 meter radius sweep. b. Without Obvious Adequate Density and/or Green-up Heights: If it is relatively clear after a walkthrough or walk-by prior to the establishment of plots, that the opening would not achieve green-up, tally only the following data, in order to roughly project when the opening could be expected to achieve green-up height and when to schedule a subsequent recce walkthrough to confirm green-up achievement: i. Collect an average of the current leader lengths of the total preferred and acceptable species per plot During a Recce Walkthrough When there is no reliable free growing data, or it is not obvious from the mined survey data that the opening is greened-up, an onsite inspection will be required. It is recommended that an initial ground or aerial inspection recce be performed to determine 192
193 if the opening is potential greened-up or not. If it appears potentially greened-up, then it is recommended to perform a recce walkthrough survey that could resemble the sampling design of a combination of a vector, representative or visual assessment of the opening. Sample points or plots can be established along the sampling transects, if desired and as required. Required data to be collected either at each plot or data point or for the complete summary for the opening are: 1. Tally of TCV species per ha. > 1.3m.; 2. The average height of the TCV trees per 5.64 plot and/or the average height of 10% of the preferred and acceptable species for the opening; 3. The % of the total strata NAR that has achieved green-up. Note, that this sampling method is only recommend for experienced surveyors familiar with the local management issues in the survey area and they would be confident that their determination of green-up status, could be duplicated by another similarly experienced forest professional Use of Planting Quality Inspection plots (FS 704) to meet Regen Delay Declaration Survey Under the Forest Practices Code of British Columbia Act and FRPA, stocking establishment can be achieved through planting. Certain conditions must be met in order for the stocking requirements to be fulfilled at time of planting: 1. Less than 10 percent of the total trees after planting are natural regeneration or previously planted trees. (i.e., silviculture label = inventory label). 2. The minimum planting inter-tree distance must equal or exceed the minimum inter-tree distance specified in the silviculture prescription, site plan or FSP. 3. FS 704 plots are properly stratified (by standards unit) and evenly distributed over the opening. 4. All the species planted are listed as preferred for the applicable stratum in the silviculture plan or prescription. (On the rare occasion where both preferred and acceptable species are planted, the FS 704 plots are not sufficient.) 5. The well spaced trees in the FS 704 plots are tallied to a maximum of the M value for the target stocking standards (not the planting target stocking standard) in order to show that the minimum stocking has been met or exceeded. The total number of well spaced trees (trees planted >minimum inter tree distance) should also be recorded and reported. If all of the above conditions exist, the data from the FS 704 plots is adequate evidence that regeneration obligations have been met. The data should be compiled in the same format as a stocking survey report and requirements as outlined in regen milestone 193
194 declaration in RESULTS information submission specifications. If more than 10% of the total trees after planting, are naturally regenerated or previously planted trees, or any of the other conditions above do not exist, then a stocking survey must be carried out. The stocking survey can be completed in conjunction with the planting quality inspection or separately Use of Juvenile Spacing Quality Inspection plots (FS 749) to meet Free Growing Declaration Survey Juvenile spacing quality inspection plots can be used to declare an opening free growing if all of the requirements of a free growing survey report are met, and submitted to the district manager. Additional data that is not normally collected as part of the juvenile spacing quality inspection plots will be required. The most thorough method to meet the reporting requirements is to complete a minimum number of five free growing plots while collecting the desired number of FS 749 plots. The visual assessment sampling method is often suitable to collect the needed free growing data following spacing treatments. 194
195 10 Provincial Accreditation and Training In the 1980 s a silviculture survey certification and training process was developed for British Columbia with the goal of ensuring quality silvicultural surveys. However, surveyors and survey contractors were dissatisfied with the process of certification and with the structure of the intensive five-day training course, followed by an exam. In 1995, the certification process changed to an accreditation process. This separated the training components from the examination. There are no pre-requisites for the silvicultural surveyor accreditation exam. However, the average surveyor requires considerable field experience working under the guidance of experienced accredited surveyors before he or she can successfully complete the exam. To pass the examination, a person will need to meet a range of performance expectations as outlined in the Silviculture Survey Accreditation brochure produced by the Ministry of Forests. To ensure that surveyors have sufficient opportunity to acquire the needed skills and knowledge required for accreditation, training modules will be available through educational institutes throughout the province. Refer to the Forest Practices Branch silviculture surveys website for an updated list of available training. Accreditation exams are usually offered at the beginning and at the end of each field season. Dates and locations of the exams will be advertised on the Ministry of Forests website. There is no expiry date for the silviculture surveyor accreditation certificate. Therefore, it is the responsibility of each surveyor to keep informed of any changes to standards and procedures. The accreditation process provides no assurance that the survey work completed by any one person, or that any particular survey, is done to the recommended standard. It is not a replacement for diligent supervision and auditing. In the fall of 2008, the Association of BC Forest Professionals (ABCFP) passed a bylaw to include Accredited Silviculture Surveyors as potential individuals eligible for Associated Member Status. This means that surveyors who are not already members of the ABCFP as a RPF or RFT, can join this organization as an Associate Member. As an Associate Member of the ABCFP, one would have all of the benefits available to all other members and would have to abide by all of the professional and ethical conduct bylaws of all other members. The only difference in this Associate Membership is that the new member would only vote on items pertaining to this Associate Member class and would not be subject to random practice reviews. The cost of joining the ABCFP as an Associate Member is considerately less than registered members presently set at $150 annually, for The benefit to an individual accredited surveyor to join the ABCFP as an Associate Member depends on their current professional status and goals. 195
196 For more information on the silviculture surveyor accreditation process, contact the silviculture surveys program administrator at the Mo FLNRO office Dave Weaver (250)
197 11 Appendices Appendix 1: Glossary Acceptable species: Acceptable species are ecologically suited to the site, but management activities are not aimed at establishing them. The reasons for including a species in this category may be increased site limitations, such as pest risk, for biodiversity. Activity treatment unit (ATU): An area of land upon which a silviculture activity is planned and carried out, usually within the boundary of an opening (also see Treatment Unit). Advance regeneration: Regeneration that was present on an opening prior to harvesting. Advance regeneration, if present, should be carefully evaluated to determine its potential for future management. This term was formerly known as advanced regeneration. Age class: Any interval into which the age range of trees, forests, stands or forest types are divided for classification and use. Age class is defined by Resource Inventory Branch as groups of 20 years: 1 = 1-20, 2 = 21-40, etc. Aspect: The direction toward which a slope faces. Backlog area: The Forest Practices Code of British Columbia Act defines a backlog area as an area, from which timber was harvested, damaged or destroyed before October 1, 1987, and that, in the district manager s opinion, is insufficiently stocked with healthy well spaced trees of commercially valuable species. See also Backlog Reforestation Publications. Bareroot seedling: Seedlings that are grown in nursery seedbeds, prior to planting. Basal area (BA): The cumulative cross sectional area of trees as measured at breast height. The calculation of the basal area can be derived using the following formula: Average number of trees per plot found in a prism sweep x BAF of the prism used Basal area factor (BAF): The factor used to multiply the number of trees found in during the prism sweep to yield the basal area per hectare. For example, with a BAF of 5, each tree found within the prism sweep represents 5 m2/ha of cumulative cross sectional area. Basal resinosis: Large exudations of pitch at the base of the stem, found at or below the root collar. This symptom is often associated with Armillaria root disease or Warren s root collar weevil. Basic silviculture: The silviculture treatments that are carried out to ensure regeneration to the free growing stage. BCTS: British Columbia Timber Sales. Formerly known as the Small Business Forest Enterprise Program. BC Timber Sales is an independent organization within the B.C. Ministry of Forests created to develop Crown timber for auction to establish market price 197
198 and capture the value of the asset for the public. Biodiversity: The full spectrum of flora and fauna that occurs in a geographic area. Biodiversity includes species diversity, genetic diversity and ecosystem diversity. Biogeoclimatic classification: Ecosystem classification on the basis of vegetation, soils, topography and climate. Biogeoclimatic zone: A geographic area having similar patterns of energy flow, vegetation and soils as a result of a broadly homogenous macroclimate. Biogeoclimatic zones are typically named after one or more dominant climax tree species occurring on zonal sites. The names often include a geographic or climatic modifier using the terms subzone, variant, site series, site type and site phase. Breast height (b.h.): The standard height (1.3 meters above the point of germination) at which the diameter of a standing tree is measured. Brush blade: A straight blade with curved teeth extending below the blade like a rake. The blade is mounted on the front of a prime mover, such as a crawler tractor or a skidder, for use in mechanical site preparation. Brush: This refers to competing vegetation, such as broadleaf species, shrubs or herbs. Brushing: A silviculture treatment to remove broadleaf species, shrubs or herbs that compete with conifers for sunlight, water and soil nutrients. Buffer strip: A strip of land where disturbance is either not allowed or the disturbance is closely monitored to preserve or enhance aesthetic and other qualities along or adjacent to roads, trails, watercourses and recreation sites. Cartographic Manual: The Ministry of Forests Cartographic Manual document is no longer a current reference source, however many contracts referrer to this document for guidance related to survey mapping. CASI: Compact Airborne Spectral Imagery. Chlorosis or chlorotic: Blanched or yellowish coloring of normally green foliage in plants, caused by a variety of factors, including nutrient or light deficiencies. Clearcut: A silviculture system resulting in the harvesting of all trees from an area of forest land in a single cut. Clinometer: An instrument for measuring vertical angles or slopes commonly used to calculate tree heights. Co-dominant: In upper stands with a closed canopy, those trees whose crowns form the level of the canopy and receive full light from above, but comparatively little from the sides. In young stands, co-dominant trees have above average height growth. Commencement Date: This term is defined by Section 70(1) of the Forest Practices Code. There are specific interpretations of the definition suited to the context where it is being applied. The two most common definitions are described below. 1. The date when harvesting, excluding road and landing construction, begins on the area 198
199 under the silviculture plan or prescription. 2. In the case of silviculture prescriptions on backlog areas, the commencement date is defined as the date any silviculture treatment, (i.e. site preparation); under the backlog silviculture prescription begins. Section 23 of the Forest Practices Code. Commercial thinning: The thinning of older immature stands where trees have reached merchantable size, to provide an interim harvest and a financial return while maintaining or restoring a higher rate of growth on well spaced, better quality final crop trees. Competing vegetation: Vegetation that competes for the limited common resources (space, light, water and nutrients) of a forest site that are otherwise needed for survival and growth by commercially valuable preferred trees. Conifer: Cone bearing tree having needles or scale-like leaves, usually evergreen and producing wood known commercially as softwood. Container seedling: Seedling grown in small containers in a controlled nursery environment. Countable conifer: Conifers meeting or exceeding a minimum countable height and counted towards the maximum density determination during a free growing survey. See also Maximum density. Countable height: The height above which all trees are tallied and considered as countable conifers Crop tree: A tree in a young stand selected to be retained until final harvest. Crown closure: The stand condition resulting in the crowns of trees touching and effectively blocking sunlight from reaching the forest floor. Crown closure is expressed as a percentage. Cut block: A specific area with defined boundaries authorized for harvest. Danger tree: Any tree that is hazardous to people or facilities because of it s location, degree of lean, physical damage, overhead hazards, limb, stem, top or root system deterioration, or a combination of any of these. If work in a forestry operation will expose a worker to a dangerous tree, the tree must be removed. DBH (diameter at breast height): The stem diameter of a tree measured at breast height, 1.3 meters above the point of germination. DIB (diameter inside bark): The diameter of a tree or log excluding bark thickness. Decay: The disintegration of plant tissue. The process by which sound wood is decomposed by the action of wood-destroying fungi and other micro-organisms. Deciduous: Term applied to trees, commonly broadleaf trees, which usually shed their leaves annually. Also known commercially as hardwoods. Declination (magnetic): The angle between true north and magnetic north. Declination varies from place to place and can be set on a compass for a particular location. Defoliator: An agent that damages trees by destroying leaves or needles. DFP (Deviation from potential): A new approach to regeneration stocking assessment 199
200 in partially cut stands in the BC interior. Disc trencher: A machine designed for mechanical site preparation. Disc trenchers consist of rotating scarifying steel discs equipped with teeth that create rows. The discs are attached to the rear of a prime mover such as a skidder. Dominant: Trees with crowns extending above the general level of the canopy and receiving full light from above and partly from the side. Dominant trees are taller than the average trees in the stand, with well-developed crowns. Drag scarification: A method of site preparation. The objective of drag scarification is to disturb the forest floor and to prepare harvested areas for natural regeneration. Drag scarification is done with anchor chains or sharkfin barrels. These tools are large, specially constructed steel chains that are dragged behind a prime mover such as a skidder. Dripline: It is a visual boundary for assessing understorey tree s minimum distance from an overstorey tree. The boundary is defined by where the main stem of the understory tree is outside of the outer foliage of the overstorey tree. DSH (Diameter at stump height): The diameter of a tree, as measured at 30 cm above the point of germination. Also referred to as DBHg, diameter at ground. Ecosystem: The sum of plants, animals, environmental influences and their interactions within a particular habitat. EDT: Electronic data transfer. Even-aged: A forest stand or a forest type in which relatively small (10-20 year) age differences exist between individual trees. Even-aged stands are often the result of fire, or a harvesting method such as clearcutting, or the shelterwood method. FCAPS: Forest Cover Attribute Processing System Fertilization: The addition of fertilizer to promote tree growth on sites deficient in one or more soil nutrients. Commonly used to improve the vigor of crop trees following juvenile spacing or commercial thinning. FC1: The digital map files of forest cover maps, i.e. 93B035 FC1. This file contains the forest cover map data for map sheet 093B035. FG: Free growing Fill planting: Supplementary planting required to augment poorly stocked natural regeneration or to replace seedlings that have died on previously planted sites. FIP (Forest Inventory Polygon): This is a digital file containing the information that describes the forest resource growing on each polygon on a forest cover map. Forest and Range Practices Act: The 2004 replacement to the Forest Practices Code. The Forest and Range Practices Act is the most current form of forest management legislation in British Columbia. Forest cover inventory: This means a survey of trees and tree-related matters in an area that includes information required by the minister. 200
201 Forest cover labels: A combination of letter and number codes in a sequential order that describes the forest cover characteristics. Forest cover map: A map showing relatively homogenous forest stands or cover types produced from the interpretation of aerial photos and from information collected from field surveys. Commonly includes information on species, age class, height class, site and stocking level. Forest Development Plan: An operational plan under the Forest Practices Code containing a licensee s plans for harvesting, road construction and silviculture activities. Forest ecology: The relationship between forest organisms and their environment. Forest health factor: Biotic or abiotic influences on the forest that are usually naturally occurring components of forest ecosystems. Biotic influences include fungi, insects, plants, animals, bacteria and nematodes. Abiotic influences include frost, snow, fire, wind, sun, drought, nutrients and mechanical human caused injury. Forest health pest: A forest health that limits the ability to meet resource management objectives. Forest Licence (FL): A forest licence is a form of tenure which allows the orderly timber harvest over a portion of a sustained yield management unit. The forest licence provides for the timely reforestation of these harvested areas according to a strategic resource management plan prepared by the Ministry of Forests for each timber supply area. The licence commonly has a term of 15 to 20 years, generally replaceable every five years (some are non-replaceable) and operating areas that shift over time. A forest licence specifies an annual allowable cut, requires a management and working plan and specified management activities. Forest Practices Code (FPC): The Forest Practices Code is a term commonly used to refer to the Forest Practices Code of British Columbia Act. This also includes regulations by Cabinet under the Act and the standards established by the Chief Forester of BC. The term may sometimes be used to refer to Guidebooks. It should be remembered that unlike the Act, the Regulations and the Standards, Guidebooks are not legally enforceable. See also Forest and Range Practices. Forest Stewardship Plan: A plan (or document) that is (a) required under section 3 of the Forest and Range Practices Act or (b) approved under section 16[1] of the Forest and Range Practices Act. Fork: A deformation of the main stem resulting in two or more leaders. FPC: Forest Practices Code. Free growing height: The minimum height that a crop tree must attain before it forms part of a free growing stand. Free growing tree: A healthy, preferred or acceptable well spaced tree that is at least the minimum height and is at least the minimum size relative to competing vegetation within the effective growing space. Free growing stand: A stand of healthy trees of a commercially valuable species, the 201
202 growth of which is not impeded to an unacceptable level by competition from plants, shrubs or other trees. Fruiting body: The reproductive part of a fungus that contains or bears spores. Gall: Nodule or lump of malformed bark or woody material caused by a variety of factors such as western gall rust or insects. Galleries: Passages carved out under bark or in wood by insects feeding or laying eggs. Ghost tree: Trees that, for a specified reason, will not count towards the stocking of the stand but has an impact on the development of the regeneration. GI: Growth intercept Girdling: To kill a tree by severing or damaging the cambium layer and interrupting the flow of nutrients between the leaves and the rest of the tree. Girdling is carried out using a hatchet or special tool to cut through the bark and the cambium. Global Positioning System (GPS): A navigational tool that allows the user to determine their location on the surface of the earth. The location is determined using a hand held or aircraft mounted instrument and the radio signals from several satellites. Gouting: Excessive swelling of a branch or shoot, often accompanied by misshapen needles and buds. Gouting is most common at nodes or on branches and is frequently caused by balsam woolly adelgid on Abies species. Growing season: The period of active growth from the start of bud elongation until bud set. ha: Hectare Hack and squirt: A method of killing a tree. The bark of the tree is cut (hack) and herbicides are injected into the wound (squirt). Height class: Any interval into which a range of tree heights is divided for classification and use. Herbicide: Chemical substances or living organisms that are used to kill or to control vegetation such as brush, weeds and competing or undesirable trees. Immature: Trees or stands that have grown past the regeneration stage, but are not yet mature. Incidence: The proportion (0 to 1) or percentage (0 to 100) of entities (normally a tree) affected by forest health within a sample unit. This can easily be referred to as the proportion or percentage of forest health factors present within an opening. INCOSADA: Integrated Corporate Spatial and Attribute Database. Incremental silviculture: Refers to treatments carried out to maintain or to increase the yield and the value of forest stands. Treatments include site rehabilitation, conifer release, spacing, pruning and fertilization. Indicator species: Plant species used to predict site characteristics with respect to site moisture and site nutrients in the biogeoclimatic classified system. 202
203 Infections: Characterized by lesions on the stem and/or branches, or characterized by swellings around the point of entrance of a pathogen. Influence trees: Trees growing outside the plot radius whose effective growing space projects inside the plot radius. Injury: Damage to a tree by a biological, physical or chemical agent. Inter-tree distance: The horizontal distance between two trees on a center to center basis. Inter-tree distance is calculated or measured to the nearest 1/10 of a meter, unless otherwise specified. See also Minimum Horizontal Inter-tree Distance Section. Intermediate Cut: Stand entries to remove (usually merchantable) trees prior to the final harvest or regeneration cut phase. Usually designed to modify the stand so that continued stand development enhances the quality or growth of established trees. ISIS: Integrated Silviculture Information System. Replaced by RESULTS Juvenile spacing: A silviculture treatment resulting in the reduction in density of young stands, preferably between 3 meters to 5 meters in height, to control stocking, prevent stagnation and improve crop tree quality so that at final harvest end-product quality and value is increased. Landing: The area where logs are collected for loading. Layered: A stand is considered layered if the stand is being managed as an even-aged system, where an single harvest entry is planned for all layers within longer rotation cycles (>50 years), and layer 1 and/or 2 are dominant and one of these two layers is considered in combination with 3 and/or 4. (an even aged system) LCL: see Lower Confidence. Leader: The annual growth of the apical meristem of a tree. It is the extension of the main stem. Leave trees: Trees selected to be left on an area following harvesting, juvenile spacing or commercial thinning. LFH (Litter-Fermentation-Humus): The accumulation of organic material over mineral soil. L, F, and H refer to litter, fermentation and humus respectively. Licensee: Tenure holder. See Tenure. Lower Confidence Limit: This statistical value indicates the lowest average number of well spaced trees per hectare that another survey on the stratum would be expected to find, nine times out of ten. The LCL of 90 percent must be attained before the opening can be considered satisfactorily restocked or free growing. Mature: Trees or stands that have sufficiently developed to be harvested. Maximum density: The maximum allowable stand density of total countable conifers, above which openings must be spaced down to a specified density of well spaced preferred and/or acceptable stems in order to achieve free growing status. See also 203
204 Maximum Density. Median Height: The middle height. Used in the countable conifers and countable broadleaf determination. Refer to Figure 6 and Figure 7 for illustrations of this concept. Mesic: Within the biogeoclimatic classification system, mesic sites are those that are most common (average) within a single zone. It may also be referred to as zonal. Microclimate: The climate of small areas, especially if it differs significantly from the climate of the region. Microsite: A small area exhibiting specific characteristics that are different from the surrounding area. During planting projects, microsite is commonly referred to as acceptable microsite. Acceptable microsites are those spots that are best suited for the optimum survival and growth of the planted tree. Milestone Survey: There are two important reporting points and as a result two milestone surveys. These are the regeneration delay survey and the free growing survey. Stocking surveys are not milestone surveys. Minimum height at free growing: The minimum height that a healthy, well spaced tree must attain in order to be considered free growing. On areas for which a silviculture plan or prescription was approved on or after April 1, 1994, minimum heights vary by species, biogeoclimatic zone and site series. Minimum inter-tree distance (MITD): The minimum horizontal distance between two trees on a center-to-center basis. Inter-tree distance is calculated or measured to the nearest 1/10 of a meter, unless otherwise specified. See also Minimum Horizontal Intertree Distance. Minimum preferred stocking standard (MSSp): The minimum number of well spaced trees per hectare, of preferred species only, that must be present for the stratum to be considered satisfactorily restocked or free growing. Minimum stocking standard (MSS, MSSp+a): The minimum number of well spaced trees per hectare, of preferred and acceptable species, that must be present for the stratum to be considered satisfactorily restocked or free growing. MLSIS: Major Licensee Silviculture Information System, in the late 1990 s. This system was integrated into ISIS then RESULTS. Moder: A humus form characterized by a greater than 1 centimeter thick F horizon and an Ah layer. Typically soil organisms are responsible for the intermediate decomposition rates through soil mixing. MOF, M of F: Ministry of Forests. Monoculture: Cultivation of a single tree species. Mor: A humus form characterized by a greater than 1 centimeter thick F horizon and an absent Ah layer. Typically, decomposition is slow due to a lack of soil organism. Mosaic: Distinct strata that occur in a dispersed manner. MSS: Minimum stocking standards. 204
205 Mull: A humus form developing under conditions that favor rapid decomposition of organic matter. F layers are generally less than 1 centimeter thick, Ah layers are greater than 2 centimeters thick and extensive soil mixing is caused by soil organisms. Multi-storey: A stand is considered multi-storied if layer 1 and/or layer 2 have a crown closure greater than 6 percent and one of these two layers is considered in combination with layer 3 and/or layer 4. (an uneven aged system) M-value: The maximum number of healthy, well spaced trees that may be tallied in a single plot. This value is calculated by dividing the target stocking standard for the stratum by the plot multiplier. This prevents over-stocking in one plot compensating for under-stocking in others. This is a key concept in the survey system. NAR: Net area to be reforested. Natural regeneration: The renewal of a tree crop by natural means. NCBr: Non-commercial brush. Net area to be reforested (NAR): The area on which the licensee is responsible for establishing a free growing crop of trees. This figure is the sum of Standard Unit (SU) areas. The NAR does not include any man caused non-productive areas, reserves of immature trees, and natural non-productive areas that are large enough to stratify and map, as well as non-commercial brush areas greater than 4 hectares that are not deemed to be the obligation of the licensee. Non-productive or non-commercial areas that are too small to stratify are included in the SU area. Node: A joint or portion of a stem from which a leaf or branch has grown. Non-commercial brush (NCBr): Describes a potentially productive forest site that is occupied by shrubs and other deciduous species that are not utilized commercially. Non-productive (NP): Land that is incapable of growing a merchantable stand within a reasonable length of time. Not satisfactorily restocked (NSR): Productive forest land that has been denuded and has not been regenerated to the specified stocking standards for the opening. No-work zones: Areas in which equipment and people are not allowed during forestry operations, usually for safety or ecological reasons. NP: Non-productive. Not FG: Not free growing. NSR: Not satisfactorily stocked. Opening: An area denuded of trees by means of harvesting, insects, disease, fire, wind, flooding, landslide or by any other similar events. Overmature: Those trees or stands past the mature stage, which commonly have a higher level of damage and decay. Overstorey: Generally layer 1 and/or 2 trees growing that may be as a full or partial canopy over layer 3 and /or 4 trees. These may be conifers and or broadleaf trees. 205
206 Overtopping: Vegetation that is taller than the crop species, within a 1 meter radius around the crop species. Pesticides: A general term for chemicals used to kill either vegetative pests (herbicides) or insect pests (insecticides). PHSP: Pre harvest silviculture prescription. Planting (artificial regeneration): Establishing a new stand by planting seedlings or by direct seeding, as opposed to natural regeneration. Plantable spot: A suitable microsite on which a seedling could be planted. The suitability of the microsite is dependent on site conditions and limiting factors such as soil moisture, soil temperature, soil nutrients, climatic conditions, tree species and stock type to be planted. Plantation: A human-made forest, usually established by planting seedlings. Plot multiplier: The factor used to multiply the tree count in the survey plot to yield the equivalent stems per hectare. It is calculated by dividing the area of one hectare ( m 2 ) by the area of the sample plot. For example, a plot radius of 3.99 m has an area of 50 m 2 and a resulting plot multiplier of 200. (10 000m 2 50m 2 = 200) Plug: A seedling grown in a small container under carefully controlled nursery conditions. When seedlings are removed from containers for planting, the nursery soil remains bound up in their roots. Point of Commencement (POC, P of C): This term is used to describe the starting place of a survey. POCs should be tied into features indicated on the forest cover map or on an air photo (e.g. road junctions, creek crossings or junctions, or block boundaries). Polygon (or called Stratum): A subdivision of a forest area to be inventoried based on a group of trees with the same or similar species composition, age, and/or height class, (plural = strata). Population: Consists of the total number of the observations with which we are concerned (e.g., all the well spaced trees in an opening). Potential Free Growing Tree: The concept used in the Free Growing Guidelines to identify a tree that may be free growing if there are less than a specified number of countable sized broadleaf trees present in the plot. Potential Danger Tree: Loosely defined as usually dead trees that may pose a hazard to crews conducting treatments. Wildlife Danger Tree assessment would be necessary to determine it s hazard status. The term snag may have been previously used to describe these. Preferred species: Those species ecologically suited to the site. Management activities are primarily aimed at establishing preferred species. The characteristics of these species are consistent with the desired timber and non-timber objectives for the opening. Pre-harvest silviculture prescription (PHSP): A legally binding, site-specific plan describing the nature and extent of any timber harvesting and silviculture activities carried out on an opening. The PHSP outlines the required management objectives, 206
207 standards and timelines that the owner of the opening must achieve, including reaching a free growing stand. PHSPs are the pre-forest Practices Code equivalent to Silviculture Prescriptions. With the initiation of the Forest Practices Code, all PHSPs will be treated in the same manner as silviculture prescriptions. Preparable spot: A microsite that is presently unsuitable for planting but, with site preparation, would become an acceptable planting microsite. PRF: plot radius factor Prime mover: Heavy equipment used to tow other machines such as disc trenchers for site preparation. Prism: An optical instrument consisting of a thin wedge of glass. The prism creates the appearance that part of the object being looked at is laterally displaced. If the object and the displaced part of the object overlap, the object is in the plot, and if there is no overlap, then the object is out of the plot. A prism sweep results in the tally of stems based on stand basal area using a variable radius plot. Pruning: The removal of the lower branches of crop trees to a pre-determined height, usually correlated to log lengths, to produce clear, knot-free wood. Knot-free wood increases the value of the final wood products. PSS: Planting stocking standard Rank: A term used in inventory labels. It describes the relative position of a layer in its progression toward merchantability. Rank 1, for example, denotes the next potentially harvestable layer of a stand. Rank is no longer used. Reforestation: The natural or artificial restocking of an area. Regeneration date / delay: The date by which a minimum number of healthy, well spaced trees of both the preferred and acceptable species, and the minimum number of preferred species, must be established, and afterwards maintained until the stand is declared free growing. Reserve: An area of forest land that, by law or by policy, is not available for harvesting. Areas of land and water set aside for ecosystem protection, outdoors and tourism values, preservation of rare species, wildlife protection, etc. The retention of live or standing dead trees following harvest for purposes other than regeneration that are pole size or larger. Reserves can be uniformly distributed as single trees or left in small groups. Reserve tree: A tree that is specifically reserved from harvesting and/or silviculture activities. Reserve zone: The inner portion of a riparian management area situated adjacent to a stream, lake, or wetland. Reserve zones are established to conserve and to maintain the productivity of aquatic and riparian ecosystems. Residual basal area: The basal area per hectare left standing after harvest. Residuals (residual trees): Trees left standing after harvesting. 207
208 RESULTS: This is an acronym for Reporting Silviculture Updates and Land status Tracking System. This is the Ministry of Forest's corporate database and application used to track silviculture information on openings. Additional information about RESULTS can be found at this link. Riparian: An area of land adjacent to a stream, river, lake or wetland that contains vegetation that, due to the presence of water, is distinctly different from the vegetation of adjacent upland areas. Riparian Management Area (RMA): An area of specified width surrounding or adjacent to streams, lakes, riparian areas and wetlands. The RMA includes, in many cases, adjacent upland areas. It extends from the top of the stream bank (bank full height) or from the edge of a riparian area or wetland or the natural boundary of a lake, outward to the greater of: 1) the specified RMA distance, 2) the top of the inner gorge, or 3) the edge of the flood plain. Where a riparian area or wetland occurs adjacent to a stream or lake, the RMA is measured from the outer edge of the wetland. Riparian Reserve: A type of reserve adjacent to a water body. Rotation: The planned number of years between the formation or regeneration of a tree crop or stand and its final cutting at a specified stage of maturity. Rotation can be based on physical, biological, pathological or economic criteria. Rotation age: The age at which a stand is considered mature and ready for single entry harvesting under an even-aged management strategy. RPF (Registered Professional Forester): A person registered under the Foresters Act who performs or directs works, services or undertakings requiring specialized knowledge, training and experience in forestry. Sanitation cutting: Improving the growth and health of young stands by removing damaged or diseased stems. Sapling: A young tree that is larger than a seedling but smaller than a pole. Size varies by region. Satisfactorily restocked (SR): Productive forest land that has been denuded and subsequently regenerated to the specified stocking standards in the silviculture plan or prescription. SBFEP: Small Business Forest Enterprise Program. This is now known as BC Timber Sales. Scalping: A site preparation method that exposes favorable mineral soil in which tree seedlings can be planted. Scar: A mark left after re-growth of damaged tissue following an injury. Scarification: See Drag Scarification. Screefing: Removing organic material to a specified depth. Second growth: A second forest that develops after harvest of the original mature forest. Seed orchard: An area of specially planted trees that have been selected for their 208
209 superior characteristics to breed genetically improved seed. Seedbed: In natural regeneration, the soil or forests floor on which seed falls. In nursery practice, a prepared area over which seed is sown. Seedlot: A quantity of cones or seeds having uniformity of species, source, quality and year of collection. SEMS: Silviculture Electronic Mapping System. Seral Species: A tree species (or plant) that is adapted to exist during a specific period of forest succession or seral stage. Shade-tolerance: The capacity of a tree or plant species to develop and grow in the shade of other trees or plants. Shade tolerance is one trait of the silvics of a species and independent of competition vigor. SIBEC: An acronym for the method of determining site index which uses biogeoclimatic classification system. Silviculture: The art and science of managing the establishment, growth, composition, health and quality of forests and woodlands to meet the diverse needs and values of landowners and society on a sustainable basis. Silviculture plans and prescriptions: The generic term used in this document to describe collectively the documents containing the documents which contain the applicable stocking standards and stand management objectives. Pre-harvest Silviculture Prescription (PHSP), Silviculture Prescription (SP), Forest Development Plan (FDP), Forest Stewardship Plan (FSP) and Site Plan (SP) may all be included under this heading. Silviculture prescription (SP): A legally binding, site-specific plan describing the nature and extent of any timber harvesting and silviculture activities carried out on an opening. The Silviculture Prescription outlines the required management objectives, standards and timelines that the owner of the opening must achieve, including reaching a free growing stand. Prior to the Forest Practices Code, silviculture prescriptions were known as preharvest silviculture prescriptions (PHSPs). The silviculture prescription is one of the many forms of silviculture plans and prescriptions. Silviculture survey: An examination of an opening for the purpose of providing information to the forest manager on how the site and the stand are progressing relative to the prescribed management objectives. Silviculture Treatment Regime: A legally required, site-specific list of silviculture treatments that can reasonably be expected to produce the designated stocking levels specified in the site plans by the end of the determined free growing assessment period. Found as a component of a Forest Development Plan and may be part of Forest Stewardship Plan. This regime must be prepared and kept on file by a registered professional forester. Refer to Section 11 of the Silviculture Practices Regulation for more information. Site class: The measure of the relative productive capacity of a site. No longer used after approximately It was replaced by site index. 209
210 Site class conversion: The method of determining site index by estimating the site class then using the table below to convert site class to site index. This method is the least accurate of site index determination methods. There are very few instances where this method should be used for conifers. Consider why you have not selected one of the more representative methods before selecting to use the site class conversion method to determine site index. Inventory Label Leading Species Region Good Medium Poor Low Broadleaf Species Ac Province At Province Dr Province E, Ea, Ep Province B, Ba, Bg Coastal B, Ba, Bg Interior Mb Province Conifer Species Bl Province Cw Coastal Cw Interior Fd Coastal Fd Interior H, Hm, Hw Coastal H, Hm, Hw Interior L, La, Lt, Lw Province Pa, Pf, Pj, Pl Province Pw Province Py Province S Coastal S Interior Ss Province Sb, Se, Sw Province Yc Coastal Yc Interior Table 13: Site Class to Site Index Conversion Site index: A measure of site growth potential for a given tree species over a fixed time period. It is the average top height of trees of a certain species at fifty years measured at breast height. The top height trees are the 100 largest DBH trees per hectare of the species being considered. The breast height age is the number of annual growth rings at 1.3 m from the point of germination. A complete discussion on site index determination can be found at: Site Plan: The post 2000 Forest Practices Code form of silviculture prescription. 210
211 Site preparation: Disturbance of an area s topsoil and ground vegetation to create conditions suitable for regeneration. Site rehabilitation: The conversion of potentially productive land presently occupied by stands of undesirable species or by brush, back to a condition appropriate for establishing desired coniferous species. Site series: Subdivisions of site associations. Site series include all sites within a biogeoclimatic subzone that are capable of producing the same climax vegetation unit or plant association. Skid trail: A roughly formed, temporary forest trail suitable for use by horses or equipment such as skidders in hauling trees or logs from the place of felling to a landing. Slash: The residue left on the ground after felling, juvenile spacing, brushing, pruning or commercial thinning that includes cut trees, uprooted stumps, branches and broken tops. Sliding rule: The ability to move the early free growing date earlier an amount of time equal to the amount of time the regeneration requirements were met before the regeneration date. This has no effect on the late free growing date. An amendment or other form of approval is not required. See also Adjusting the Early Free Growing Date. Slope correction tables: Tables with conversions from slope distance to horizontal distance. Snag: A historic term for standing dead tree, greater than 3 m in height. These are often used by birds for nesting or by wildlife for refuge. They can be a hazard to forest workers, as they could fall unexpectedly. Terms Danger tree or Wildlife tree are more current. Spacing: See juvenile spacing. sph: Stems per hectare. This term is interchangeable with trees per hectare or tr/ha. Satisfactorily restocked (SR): Productive forest land that has been denuded and has been regenerated to the specified stocking standards for the opening. Stand density: A relative measure of the amount of stocking on a forest area. Often described in terms of stems per hectare. Stand management prescription (SMP): A site-specific plan describing the nature and extent of the silviculture activities planned for a free growing stand of trees. SMPs facilitate the achievement of specified social, economic and environmental objectives. Stand tending: A variety of forest management activities carried out at different stages in the life of a stand. Treatments may include juvenile spacing, brushing, commercial thinning, fertilization, conifer release, site rehabilitation, mistletoe control, seed tree control and pruning. Standards Unit (SU): An area within a cutblock that is subject to uniform: limits for soil disturbance and regeneration dates, stocking standards, free growing dates and free growing heights. Statistical sampling: The selection of sample units from a population and the 211
212 measurement and/or recording of information on these units to obtain estimates of population characteristics. Stocking class: A numeric code representing a range of stems per hectare. Example, stocking class 1 is mature, with 76+ stems/ha of > 27.5 cm dbh; stocking class 2 is mature, with < 76 stems/ha; stocking class 0 is immature. Stocking standards: Stocking standards detail site-specific legal requirements that are stated in a pre-harvest silviculture prescription, silviculture prescription, site plan, Forest Development Plan or Forest Stewardship Plans. They specify the standards required to reforest denuded areas with a healthy new crop of trees within specific time frames. Stocking standards include, but are not limited to, such information as the target and minimum number of healthy, well spaced, preferred and acceptable trees per hectare, the conifer to brush ratio, the maximum density, the regeneration date and the early and late free growing dates. Stocking status: Stocking is an indication of growing space occupancy relative to a preestablished standard. Status refers to whether the site has met those standards. Stocking status is most often described as satisfactorily restocked, not satisfactorily restocked, free growing or not free growing. Stocking survey: A survey used to determine the stocking of an opening by describing both the preferred and acceptable well spaced and total trees, and to generate an inventory label for updating the forest cover map. Stratification: The process of defining and identifying populations with similar characteristics within an opening. Stratum (or called Polygon): A subdivision of a forest area to be inventoried based on a group of trees with the same or similar species composition, age, and/or height class, (plural = strata). Suppressed: Trees with crowns entirely below the general level of the crown cover and receiving little or no direct light from above or from the sides. Survival assessment: A survey that estimates the percentage of trees living after a set period of growth after planting. Target stocking standard (TSS): The number of well spaced, preferred and acceptable trees per hectare that will, in normal circumstances, produce an optimum free growing crop. Target stocking standards are those standards that should be achieved through silviculture activities. Tenure: The holding of a property. Land tenure may be broadly categorized into private lands, federal lands and provincial crown lands. The Forest Act defines a number of forestry tenures by which the cutting of timber and other user rights to provincial crown land are assigned. For example, Forest Licence. Transplanting: Moving seedlings from one place to another. Treatment prescription: A legal document describing the operational details required for carrying out individual silviculture activities such as site preparation and planting. 212
213 Treatment Unit (TU): An area of land upon which a silviculture activity is planned and carried out, usually within the boundary of an opening. In old PHSPs, TUs are areas managed through the uniform application of stocking standards. In newer SPs, TUs are now referred to as Standards Units (SUs). Tree Farm Licence (TFL): A form of tenure agreement which allows the long-term practice of sound forest management and harvesting on Crown land or on a combination of Crown and private land, by private interests under the supervision of the MOF. TRIM: Terrain Resource Information Management Understorey: Generally layer 3 and 4 trees growing under the full or partial canopy of layer 1 and 2 trees. These may be conifers and or broadleaf trees. Uneven-aged: Stands with a wide range of ages and sizes. Uniform Leave Tree (ULT): A type of reserve where trees are retained in an even pattern of distribution. Vet (veteran): A living remnant of a former stand. When used in the context of inventory labels, vets must have a combined crown closure of less than six per cent and must be at least 40 years older and 10 m taller than the main stand. This term is being phased out. Walk-through: An initial reconnaissance of an opening prior to the onset of a survey. Well spaced stems per ha: The number of healthy, preferred and acceptable trees, in one hectare, that are all at least the minimum horizontal inter-tree distance from one another. The inter-tree distance is specified in the silviculture plan or prescription. Whorl: An arrangement of branches in a circle around a stem or tree trunk often, but not always, associated with one year s height growth. Wildlife tree patch (WTP): An area specifically identified for the retention and recruitment of suitable wildlife trees. It can contain a single wildlife tree or many. A wildlife tree patch is synonymous with a group reserve. Wildlife tree: A standing live or dead tree with special characteristics that provide valuable habitat for the conservation or enhancement of wildlife. Characteristics include large diameter and height for the site, current use by wildlife, a declining or dead condition, value as a species, valuable location, and relative scarcity. Windrowing: The concentration of slash, branches and debris into rows to clear the ground for regeneration. Windrows are often burned. Wound: An injury that removes a portion of the bark and cambium from the tree, but does not penetrate into the sapwood. Wounds often serve as entry points for wood decay fungi. Xeric: The driest site series within each unit of the biogeoclimatic system. Xeric is always referred to as an 02 site series. Zonal: Within the biogeoclimatic classification system, zonal sites are those that are the most common or average within a single zone. It may also be referred to as mesic. 213
214 Appendix 2: Determining area of dispersed strata For dispersed strata, it is necessary to determine the area represented by each stratum found on an opening. Although the area represented by each stratum may be estimated, a more quantitative measurement may be desired. In this event, there are two methods to consider: Line Intersect and High Intensity Point Sampling. Option 1: Line Intersect One method of determining the area represented by each stratum, in dispersed strata, is the line intersect survey. The amount of strip line that crosses each stratum is used to calculate the proportion of the opening that is represented by that stratum. The amount of strip line per hectare required to be sampled on an opening is dependent upon the characteristics of the stratum. An opening with two evenly distributed strata requires less strip line than an opening with more strata or less evenly distributed strata. Option 2: High Intensity Point Sampling Another method of determining the area represented by each stratum, in dispersed strata, is the high intensity point sampling survey. The intent of this survey is to tally large quantities of very simple point samples. The data is used to estimate the area of each stratum. This sampling method provides the same results as the line intersect survey, but uses a less onerous field procedure. There have been no statistical analyses of these procedures to determine the number of point samples required to calculate the precision of the survey. Initial estimates suggest that 100 point samples is a reasonable preliminary sampling intensity. The following steps describe the point sampling process: 1. Describe each stratum or forest type. 2. Establish the desired quantity of point samples in a systematic method. 3. At each point sample, mark a or a to indicate which stratum or forest type the sample is within. 214
215 Plot Stratum/ Forest Type A SR & FG 1 2 Stratum/ Forest Type B SR but not FG Stratum/ Forest Type C NSR Stratum/ Forest Type D 3 alder 4 5 NP Comments 6 plantable 7 8 slash, but plantable 9 rock, no stumps 10 alder # of Point Samples Stratum A Stratum B Stratum C Forest Type D SR & FG SR but not FG NSR NP 85% 10% 4% 1% Figure 24a. High Intensity Point Sample Plot Card 215
216 Appendix 3: List of References and Hyperlinks The following references are useful to silviculture surveyors in British Columbia. This is not an exhaustive list, however. Acts Ministry of Forests Act Forest Act Forest and Range Practices Forest Practices Code Regulations Forest Planning and Practices Regulation Woodlot License Planning and Practices Regulation 216
217 Guidebooks Establishment to Free Growing Guidebook Cariboo Establishment to Free Growing Guidebook Kamloops Establishment to Free Growing Guidebook Nelson Establishment to Free Growing Guidebook Prince George Establishment to Free Growing Guidebook Prince Rupert Establishment to Free Growing Guidebook Vancouver Soil Conservation Guidebook Soil Conservation Survey Soil Rehabilitation Guidebook Forest Health Survey Bark Beetle Management Defoliator Management Dwarf Mistletoe Management Management of Terminal Weevils in BC Pine Stem Rust Management Root Disease Management Tree Wound and Decay Green-up Guidebook Sheep Vegetation Management Guidelines 217
218 Field Cards FS 657 Silviculture Survey Card FS 658 Silviculture Survey Plot Card FS 659 Silviculture Survey Summary Card FS 660 Silviculture Survey Reference Card FS 747 Damage Agent and Condition Codes Card FS 1138 A Calculation Card for Silviculture Survey Confidence Limits FS 1138 B Steps to Calculate Confidence Limits for Silviculture Surveys FORREX - Stand Establishment Decision Aids (SEDA) Competing Vegetation SEDAs Forest Health SEDAs 218
219 Training Materials How to Determine Site Index Fundamentals of Natural Lodgepole Pine Regeneration and Drag Scarification Juvenile Spacing Quality Inspection Planting Quality Inspection Developing Stand Density Management Regimes Stocking in Partial Cut Stands - DFP Silviculture Survey Accreditation Brochure %207,%2009.pdf Silvicultural Systems Training website Growth Intercept Method for Silviculture Surveys. August Ministry of Forests. ISBN Policies and Other Documents Backlog Backlog Reforestation Publications and Products Land Management Handbooks Forest Science Program - Land Management Handbooks LMH 02 Identification and Interpretation of Ecosystems of the Western Kamloops Forest Region Identification and Interpretation of Ecosystems of the Western Kamloops Forest Region LMH 03 A Guide to Some Common Plants of the Kamloops Region, 219
220 Abstract for LMH04, A Guide to Some Common Plants of the Skeena Area, British Columbia Abstract for LMH05, A Guide to Plant Indicators of Moisture for Southeastern British Columbia, with Engineering Interpretations Abstract for LMH06, Some Common Plants of the Sub-Boreal Spruce Zone Abstract for LMH07, A Guide to Some Common Plants of the Southern Interior of British Columbia Abstract for LMH08, Site Diagnosis, Tree Species Selection, and Slash burning Guidelines for the Vancouver Forest Region Abstract for LMH09, A Preliminary Guide to the Response of Major Species of Competing Vegetation to Silvicultural Treatments Abstract for LMH10, A Field Guide for Identification and Interpretation of the Sub- Boreal Spruce Zone in the Prince Rupert Forest Region Abstract for LMH11, Field Handbook for Prescribed Fire Assessments in British Columbia Abstract for LMH12, A Field Guide for Identification and Interpretation of the Interior Cedar-Hemlock Zone, Northwestern Transitional Subzone (ICHg), in the Prince Rupert Forest Region Abstract for LMH13, Handbook for Timber and Mule Deer Management Co-ordination on Winter Ranges in the Cariboo Forest Region Abstract for LMH14, A Field Guide for Identification and Interpretation of the Coastal Western Hemlock Zone, Northern Drier Maritime Subzone (CWHf), in the Prince Rupert Forest Region 220
221 Abstract for LMH15, A Field Guide for Identification and Interpretation of Ecosystems of the Rocky Mountain Trench, Prince George Forest Region Abstract for LMH16, A Field Guide for Identification and Interpretation of Seral Aspen Ecosystems of the BWBSc1, Prince George Forest Region Abstract for LMH17, A Field Guide for Identification and Interpretation of the Engelmann Spruce-Subalpine Fir Zone in the Prince Rupert Forest Region, British Columbia A Field Guide for Site Identification and Interpretation for the Nelson Forest Region. LMH 20. May ISSN Ministry of Forests. LMH 21 (Northwest Portion of the Prince George Forest Region) -February LMH 22 (Northeast Portion of the Prince George Forest Region) -February LMH 23 A Guide to Site Identification and Interpretation for the Kamloops Forest Region 1 through 7. February ISSN Ministry of Forests. LMH 24 (Southwest Portion of the Prince George Forest Region) -January LMH 25 Field Manual for Describing Terrestrial Ecosystems LMH 26 A Field Guide for Site Identification and Interpretation for the Prince Rupert Forest Region, Parts 1 and 2. June ISSN Ministry of Forests. LMH 28 A Field Guide for Site Identification and Interpretation for the Vancouver Forest Region ISSN Ministry of Forests. LMH 29 (Northern Rockies Portion of the Prince George Forest Region) Abstract for LMH30, A Guide to the Biology and Use of Forest Tree Seeds Abstract for LMH36, Silviculture of Temperate and Boreal Broadleaf-conifer Mixtures LMH 39 A Field Guide to Forest Site Identification and Interpretation for the Cariboo Forest Region. Parts 1 and ISSN Ministry of Forests. 221
222 LMH 46 Plant Indicator Guide for Northern British Columbia, By Beaudry. L., R. Coupé, C. Delong, J. Pojar, LMH 47 Silviculture Prescription, Interpretive Guide for Data Collection, Site Stratification, and Sensitivity Evaluation for Silviculture Prescriptions LMH 50 The Effects of the Silviculture Survey Parameters on the Free Growing Decision Probabilities and Projected Volume at Rotation, by Wendy A. Bergerud, Ministry of Forests, Forest Science Program, ISBN LMH 51 A field Guide to Site identification and Interpretation for the Southeast portion of Prince George Forest Region C. DeLong, 2003 FRDA Handbooks A Guide to Vegetation Control Equipment. FRDA Handbook 005. March ISSN Herbicide Field Handbook. FRDA Handbook 006. March ISSN A Guide to the Response of Common Plants in British Columbia to Management Treatments FRDA Handbook 008. ISSN April Ministry of Forests. Effectiveness of Forest Vegetation Control Methods in British Columbia. FRDA Handbook 011. January ISSN Hardwood Management Problems in Northeastern British Columbia: An Information Review. March FRDA Report 066. ISSN Autecology of Common Plants in British Columbia: A Literature Review. December FRDA Report 158. ISSN Green, R.N., Trowbridge, R.L., and Klinka, K Operational summaries for Vegetation Management: Broom - Putting it in its place Dry Alder Complex Ericaceous Shrub Complex 222
223 Fireweed Complex Gorse - The spiny competitor Managing Vegetation in Provincial Forests Managing Vegetation with Sheep Mixed-shrub Complex Pinegrass Complex Reedgrass Complex Wet Alder Complex Willow Complex Silviculture Note #26 - Sheep Grazing in Forestry Silviculture Note #25 - Boreal Plant Community Diversity 10 yrs after treatment; a report summary Miscellaneous Publications Additional publications may be available from Crown Publication Ministry of Forest Cartographic Manual Forest Practices Branch Biogeoclimatic Zones of British Columbia The Tree Book Ecosystems of British Columbia. Special Report Series 6. ISSN February 223
224 1991. Ministry of Forests. Field Guide to Forest Damage in British Columbia, Joint Publication Number 17. ISBN Field Guide to Pests of Managed Forests in British Columbia. Joint Report No. 16. ISSN (Out of print. Replaced by Field Guide to Forest Damage in British Columbia) Vegetation Management Publications and Products Indicator Plants of Coastal British Columbia. By K. Klinka, V.J. Krajina, A. Ceska, A.M. Scagel. University of British Columbia Press Information Management Group Controlling Weeds Using Biological Methods Provincial Seedling Stock Type Selection and Ordering Guidelines. Site Index Estimates by Site Series - SIBEC Ministry of Forests. ISBN Glossary of Forestry Terms 224
225 Appendix 4: Using a Prism The prism is a tool used to estimate the amount of basal area currently present on an opening. Basal area is a measure of site occupancy. It is expressed in terms of m 2 per hectare. While it is possible to very accurately determine basal area using a prism, in the context of multi-story surveys it is often necessary only to determine a reasonable estimate of the basal area. The procedures described below are recommended where the silviculture plan or prescription does not specify a minimum basal area requirement in the stocking standards. Where a minimum basal area is specified in the silviculture plan or prescription, the procedures for basal area determination described in the Ministry of Forests Cruising Manual should be applied. It is essential that all prisms used on a single stratum be of the same basal area (BAF). Using prisms of different sizes on the same strata would have the same effect as using multiple plot radii on a single stratum. All data collected for a single stratum must be gathered using a single BAF. The surveyor holds the prism over plot center and looks at a tree across the upper edge of the prism. The surveyor should see the tree simultaneously above the prism in its natural position, and also through the prism. Since a ray of light is bent upon passing through the prism, the tree image seen through the prism will be horizontally displaced. If the displacement is greater than the diameter of the tree, the tree is considered "out", and therefore not counted. If the displacement is less than or equal to the diameter of the tree, the tree is "in", therefore is counted. 5m 5m In Out Borderline Figure 34: Using a prism to determine if a tree is "in", "out", or "borderline". Borderline Trees The precision required for determining basal area is dependant on whether the silviculture plan or prescription for the stratum contains a minimum basal area. Where a borderline tree is identified: Using the prism, confirm that the tree is in fact borderline, then, Make an arbitrary decision to record the tree in or out. The next time a 225
226 borderline tree is identified in the stratum, record it opposite to the first. In other words, double check your measurement using the prism, then simply alternate the borderline calls. The collection of basal area is not mandatory, but is highly recommended. The resulting data can be a valuable descriptive characteristic of stand structure. Where it is not required as part of the stocking standards for an opening, the desired level of accuracy for basal area data is relatively low. Field procedures can therefore be streamlined to keep costs in line while still gathering useful data. Silviculture plan or prescription with Minimum Basal Area The status of borderline trees is more important on areas where a minimum basal area is specified in the silviculture plan or prescription. Alternating is not sufficiently accurate. We must use the more precise techniques used in cruising. This requires the following steps: 1. Measure the diameter at breast height of the borderline tree. 2. Identify the correct plot radius factor (PRF) for the prism being used. The plot radius factor (PRF) is determined using the following formula: The BAF is the prism basal area in m 2 /ha. PRF = 0.5/BAF 226
227 Or, use the following table. BAF PRF RELASKOP VALUE BAF PRF RELASKOP VALUE Table 14: Plot Radius Factors and Relaskop Values for Selected Basal Area Factors 3. Multiply the DBH by the PRF to determine the maximum distance the tree can be from the plot center. 4. Measure the distance from the estimated center (half of the diameter of the tree measured at dbh) of the tree to the plot center. 5. If this measured tree is less than or equal to maximum distance away from the plot center, the tree is in. If it is further away than maximum distance this tree is out. For example; BAF 5 = PRF cm dbh x = 6.26 m If this 28.0 centimeter tree is less than or equal to 6.26 meters from the plot center, the tree is in. If it is further away than 6.26 meters the tree is out. The subject is discussed in further depth in the Vegetation Resource Inventory - Ground Sampling Procedures. 227
228 Appendix 5: Magnetic Declination and Annual Change Magnetic declination is the adjustment for the difference between magnetic north and grid north. Correct calibration of the compass used by surveyors is one important factor to ensure the desired accuracies are met. Surveyors should ensure that the proper declination has been set on their compass prior to conducting a survey. The amount of adjustment varies with current position and over the passing of time. Appendix E of the Vegetation Resource Inventory Ground Sampling Procedures, Magnetic Declination and Annual Change provides the adjustment factors. In addition, the web site below provides an automated declination calculator where latitude and longitude are known. Many GPS receivers have the capacity of calculating the declination for ones current location. 228

229 Appendix 6 Forest Cover Map Legend A 6.1 New Forest Cover Label The following is an example of the New MapView Available legend. Generally the order of interpretation would be the following for this example map above: Silv. Symbol and Opening# Polygon # Species Comp. in order of %... Pa Bl Pl 220 Age Class Code /... (2) Height Class Code /.. (2) Crown Closure Class Code (0) Calculated Site Index. 16 Estimated Site Index

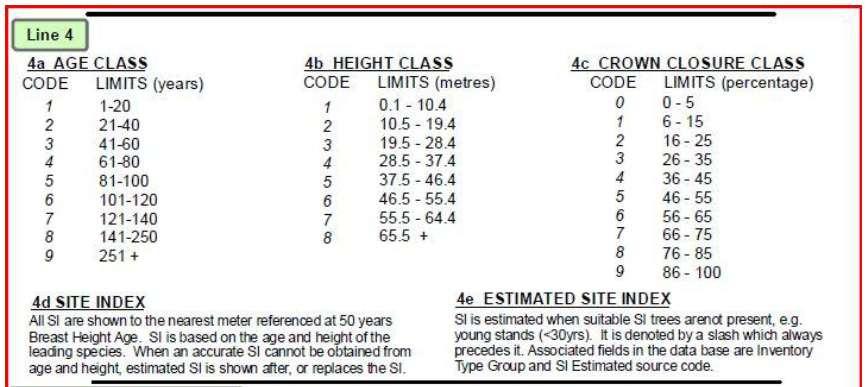
230 New Legend Description and VRI link to the full explanatory text: 230
231 A 6.2 Old Forest Cover Legend 231
232 232
233 233
234 Appendix 7: Table of Age Corrections for Boring Height The following reference table is provided to correct the counted age. Bore the sample tree at 1.3 meters above the ground and count the number of rings. This number equals the dbh age. On the table below locate the row corresponding to the species of the sample tree. Locate the corresponding site index for the strata in which this sample tree is located. Follow up this column to find the number of years to be added to the dbh age. Fdi: site index of 25 = 8 years to add dbh age + age at 1.3 meters = total age Age at 1.3 meters ( add this number of years to the dbh age to determine total age) Interior Species Pli >=23 Fdi >=29 Cw >=36 Bl >=32 Hw <= >=35 Sw >=34 Py >=23 Pw >=34 Lw >=28 At >=18 Ep >=18 Coastal Species Ba <= >=32 Fdc <= >=48 Act 2 years all sites Dr Cw <= >=48 Hw <= >=43 Table 15. Boring Height Age Correction 234
235 Appendix 8: Ministry of Forests Field Cards and Forms FS# Form Name Fmt Paper Business Supply Area 1138A CALCUL.CARD/SILVI.SUR.CONFID PDF OPC Forest Practices 1138B STEPS CALCUL.CONFI.LIM.SIL.S PDF OPC Forest Practices 209 MANUAL BRUSHING INSPECTION PDF OPC Forest REPORT Practices 251 JUVENILE SPACING QUALITY PDF Forest INSPECTION DRAFT, 1.7MB Practices 415A GROWTH INTERCEPT TABLE- PDF HFP Forest LODGEPOLE PINE-INTERIOR Practices 415B GROWTH INTERCEPT TABLE- PDF HFP Forest INTERIOR SPRUCE-INTERIOR Practices 415C GROWTH INTERCEPT TABLE- PDF HFP Forest WESTERN HEMLOCK-COASTAL Practices 415D GROWTH INTERCEPT TABLE- PDF Forest SITKA SPRUCE-COASTAL Practices 415E GROWTH INTERCEPT TABLE- PDF HFP Forest DOUGLAS-FIR-COASTAL Practices 415F GROWTH INTERCEPT TABLE- PDF HFP Forest DOUGLAS-FIR-INTERIOR Practices 415G GROWTH INTERCEPT TABLE- PDF HFP Forest SUBALPINE FIR-INTERIOR Practices 415H GROWTH INTERCEPT TABLE- PDF HFP Forest WESTERN HEMLOCK-INTERIOR Practices 415I AVERAGE SITE INDEX PDF HFP Forest RELATIONSHIP Practices 415J GROWTH INTERCEPT TABLE PDF HFP Forest WESTERN LARCH Practices 415k GROWTH INTERCEPT TABLE PDF HFP Forest WESTERN RED CEDAR Practices 466 INSECT & DISEASE COLLECTION PDF HFP Forest Practices Version OPR 1997/11/17 HFP 1997/11/17 HFP 1997/11/16 HFP 2001/08/30 HFP 1997/02/01 HFP 1995/06/01 HFP 1995/06/01 HFP 1995/11/01 HFP 1996/05/01 HFP 1997/02/01 HFP 1997/07/01 HFP 1998/11/01 HFP 1998/11/01 HFP 2000/05/01 HFP 2000/05/01 HFP 1996/08/01 HFP 235
236 FS# Form Name Fmt Paper Business Supply Area 657 SILVICULTURE SURVEY PDF OPC Forest Practices 658 SILVICULTURE SURVEY PLOT PDF OPC Forest Practices 659 SILVICULTURE SURVEY PDF OPC Forest SUMMARY Practices 660 SILVICULTURE SURVEY PDF OPC Forest REFERENCE (3.36 Mb!) Practices 703 PLANTING DIFFICULTY RATING PDF OPC Forest Practices 704A PLANTING QUALITY INSPECTION PDF OPC Forest Practices 704DRY PLANTING INSPECTION REPORT PDF OPC Forest Practices 704WET PLANTING INSPECTION REPORT PDF OPC Forest Practices 707 SURVIVAL STAKED PLOTS PDF Forest Practices 739 PLANTING SITE PRESCRIPTION PDF OPC Forest Practices 747 DAMAGE & CONDITION CODES- PDF OPC Forest REF Practices 748 PRE-STAND TENDING SURVEY PDF OPC Forest Practices 749 POST SPACING EXAMINATION PDF OPC Forest Practices 770 PRE-STAND TENDING SITE PDF Forest DESCRIP/PRESCRIPTION Practices 810A FOREST COVER DATA ENTRY PDF Resources LIST Inventory 844 SURVIVAL STAKED LINES PDF HFP Forest Practices Version OPR 2008/03/18 HFP 2008/03/18 HFP 2008/03/18 HFP 2008/03/28 HFP 1997/11/17 HFP 1998/06/10 HFP 1997/04/01 HFP 1997/04/01 HFP 2001/05/02 HFP 1997/11/17 HFP 2005/02/02 HFP 1997/11/17 HFP 2001/04/01 HFP 1991/07/01 HFP 11/17/97 HRI 1997/11/18 HFP 236
237 Appendix 9: Crown Closure Comparative Diagrams 237

238 Appendix 10: FS660 Silviculture Reference Card (Nov. 2014) 238
239 239
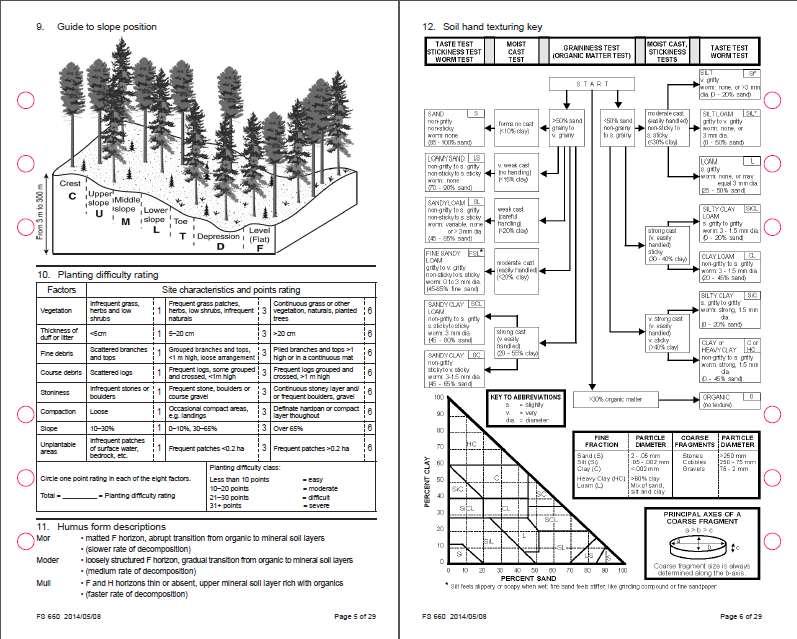
240 240
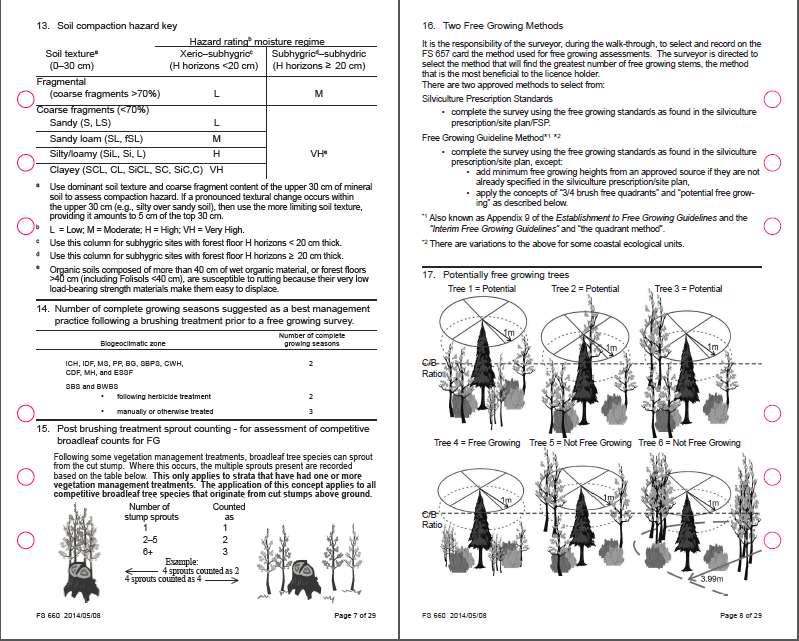
241 241
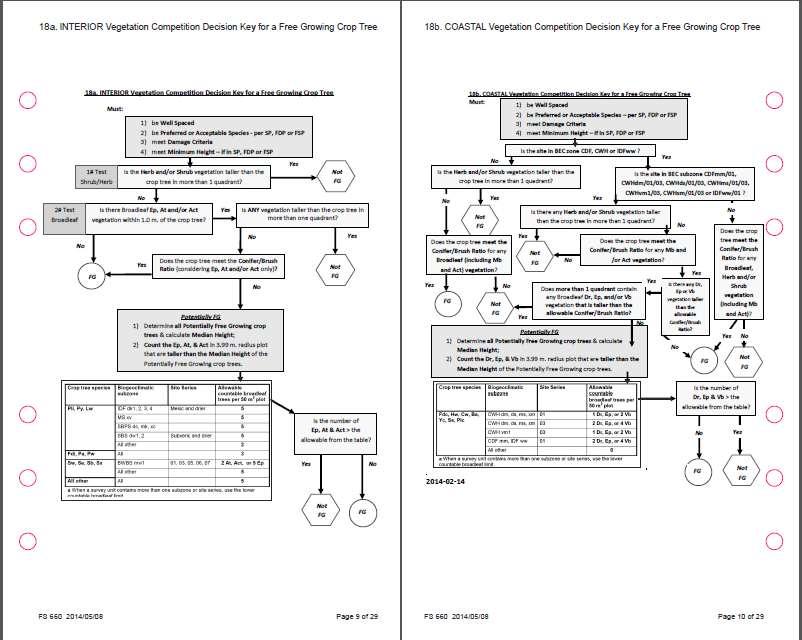
242 242
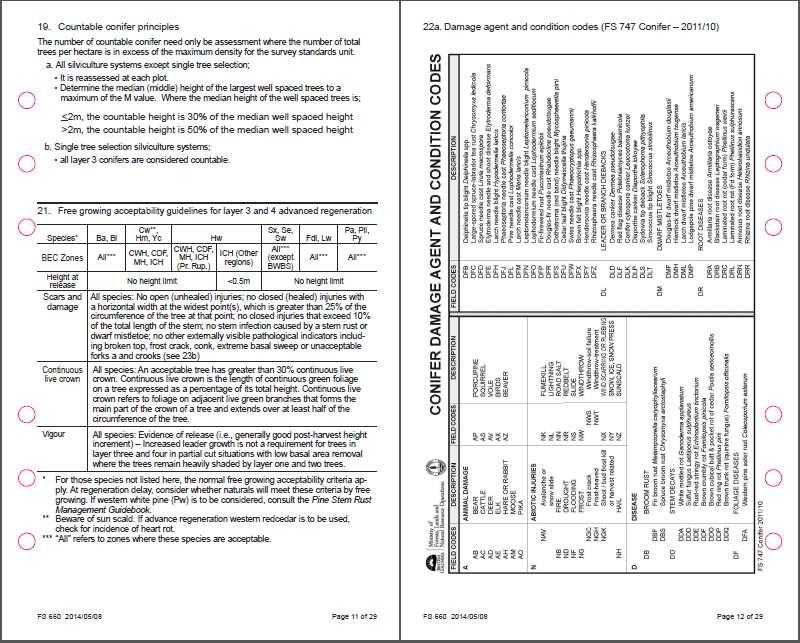
243 243
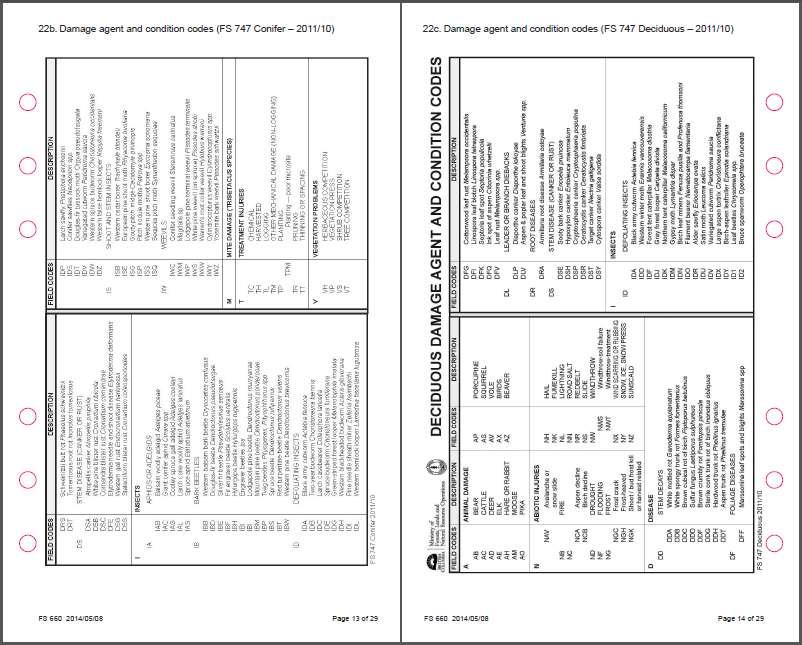
244 244
245 245
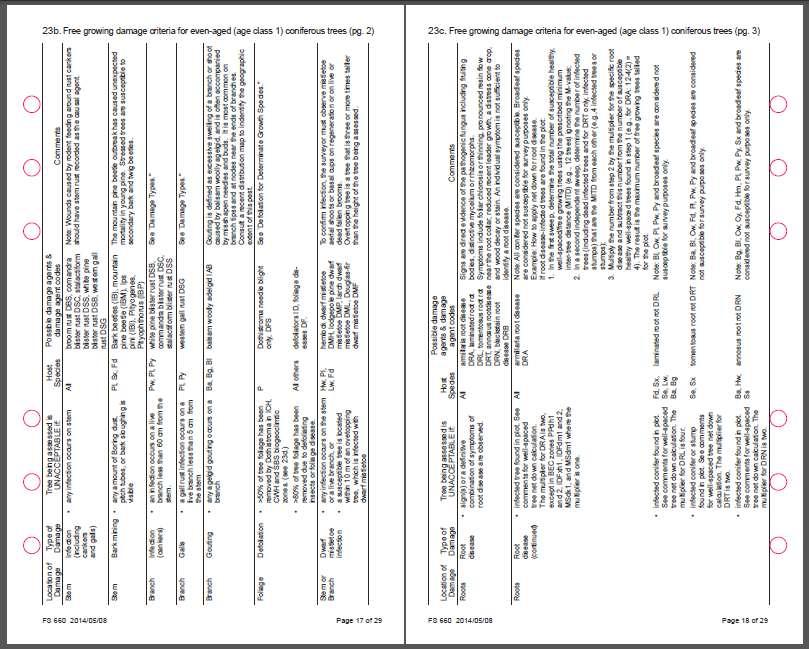
246 246
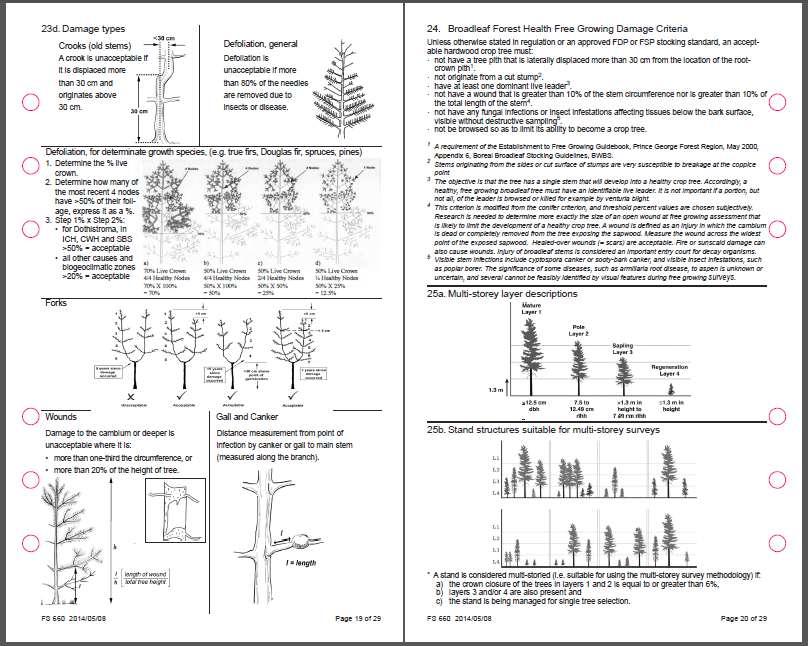
247 247
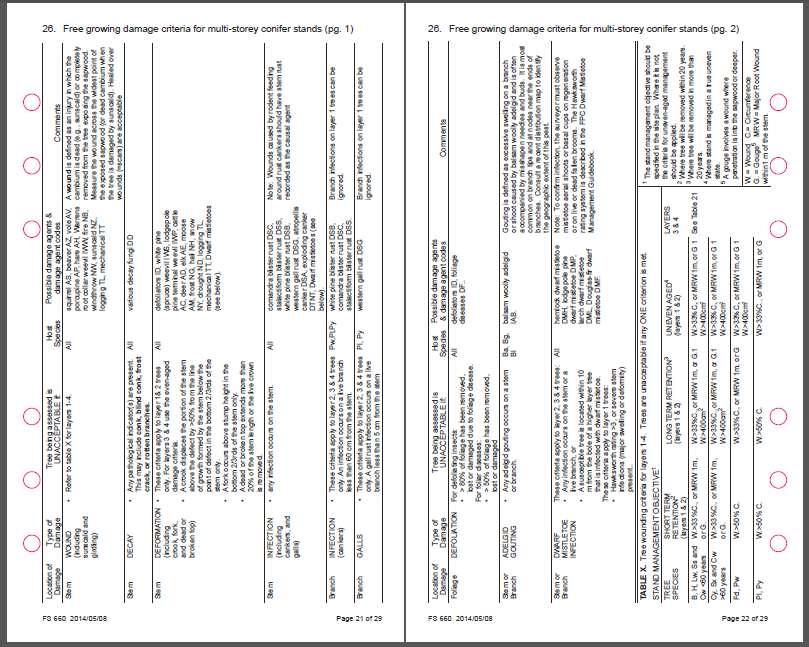
248 248
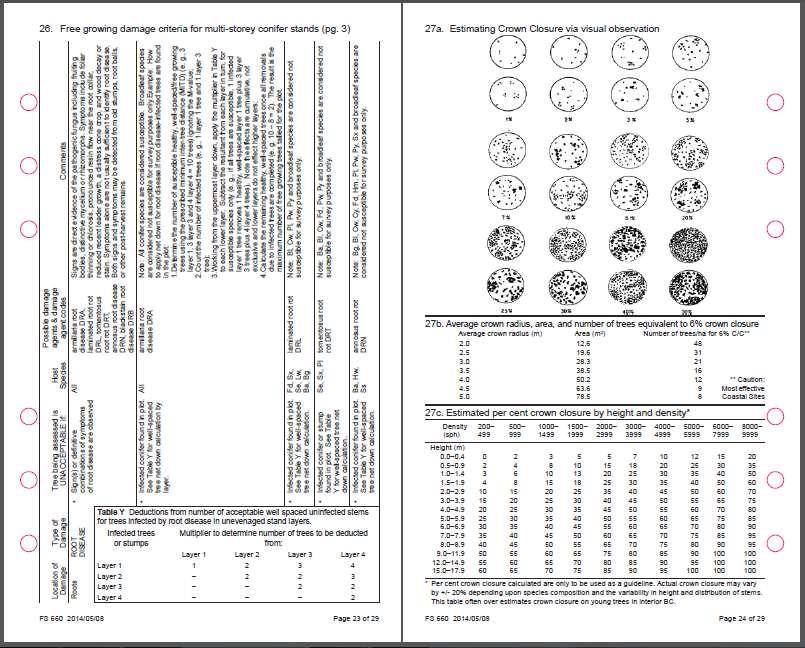
249 249
250 250
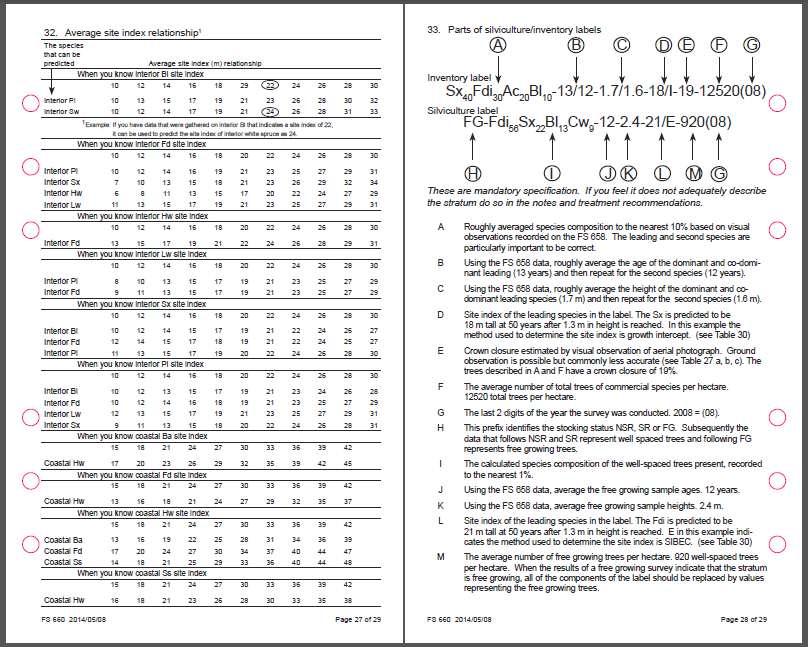
251 251
252 252
253 Appendix 10a: Stand Development Monitoring (SDM) Damage Criteria for Even-aged (Age Class 2 and 3) Coniferous Trees INTRODUCTION (Revision 6: 11 June, 2010) SDM damage criteria are based on the free-growing damage criteria, but they have been tailored for determining the health status of stands at a later stage of development (i.e., even aged, age class 2 & 3). These damage criteria are designed to determine the damage to, and acceptability of, individual conifers across the province. These criteria do not apply to broadleaf species. SDM damage criteria, in general, are more lenient than freegrowing damage criteria as there is more confidence in a tree s continued survival than there is at age when stands are declared free-growing. The SDM damage criteria are based on the most current knowledge of forest-damaging agents, and are provided to help users exercise their professional judgment in identifying the "healthy" part of healthy, well-spaced trees. The table below lists various types of damage, causal agents and species of trees. Agents and damage are often referred to by their codes listed on the Ministry of Forests Integrated Data Dictionary Pest_Species_Code list (partly listed on the Silviculture Damage Agent and Condition Codes (FS 747) field form). Tree species abbreviations are listed in the Forest Productivity Council publication Minimum Standards for the Establishment and Remeasurement of Permanent Sample Plots in British Columbia (1999). These criteria have been developed with a consideration to both future merchantability and survivorship in mind. These criteria are expected to be revised as SDM matures and as we learn more about the health and productivity of managed stands post free-growing. At the same time, climate change will increase host stress in many areas making trees more susceptible to pests and pathogens. Forest health agents previously considered benign may increase in incidence and severity, warranting their inclusion in these damage criteria. 253
254 SDM DAMAGE CRITERIA FOR EVEN-AGED (AGE CLASS 2 & 3) CONIFEROUS TREES (Revision 5). PLEASE READ the preceding introduction before using the following table and figures. LOCATION OF DAMAGE STEM STEM STEM TYPE OF DAMAGE Wound (including sunscald and girdling) Insect mining at root collar Deformation (including crook, fork, browse, and dead or broken top) TREE BEING ASSESSED IS UNACCEPTABLE IF: the tree has a girdling wound which is greater than 33% of the stem circumference, or the tree has a wound which is equal to or greater than 1m in length. the tree is currently attacked by a barkmining insect such as a weevil or a beetle and exhibits symptoms such as foliage discoloration, thinning and/or reduced height growth increments the pith is horizontally displaced more than 30 cm from the point of defect and originates above 30 cm from the point of germination, or HOST SPECIES All Pl, Sx All the tree has a fork in the lower 2/3 of the All stem and the smaller of the stems is >¼ the diameter of the main stem, note forks below 1.3 m are considered as two trees, or the tree has a dead or broken top at a point that is >5 cm in diameter. STEM Lean and sweep the tree leans >30 from the vertical with or without growth correction (sweep) STEM Suppressed the tree has a height to diameter ratio > 100 or, tree has < 20% Live Crown STEM Infection (including cankers any infection occurs on the stem, except DSG DSG stem gall affects >25% of stem All All Pl, Py, Pw, Fd, Sx, Lw All Pl, Py LIKELY DAMAGE AGENTS & DAMAGE AGENT CODES Biotic causes: bear AB, cattle AC, hare AH, moose AM, porcupine AP, squirrel AS, beaver AZ, atropellis canker DSA Abiotic causes: sunscald NZ, logging TL, mechanical TM,fire NB, windthrow NW root collar weevil IWW, red turpentine beetle, IBT, lodgepole pine beetle IBL Biotic causes: Bear AB, cattle AC, deer AD, elk AE, moose AM, defoliators ID, spruce leader weevil IWS, lodgepole pine terminal weevil IWP, sequoia pitch moth ISQ, Abiotic causes: frost NG, hail NH, snow NY, drought ND, logging TL, mechanical TM, Deep planting TP flooding NF, snow NY, slides NS, wind NW, mechanical TM Suppressed light environment, leading to high potential for competition induced mortality VT comandra blister rust DSC, stalactiform blister rust DSS white pine blister rust DSB, COMMENTS A wound is defined as an injury in which the cambium is dead (e.g., sunscald) or completely removed from the tree exposing the sapwood. Measure the wound across the widest point of the exposed sapwood (or dead cambium when the tree is damaged by sunscald). Healed over wounds (=scars) are acceptable. Only trees that are symptomatic should be checked for insect infestation or mining damage. Non-symptomatic trees are presumed to be unaffected by insect mining. For horizontal displacement see Figure 1. For a crook of unknown cause, use damage code UCR. For forking, see Figure 2. If unable to determine cause of fork, record as damage code UF. If cause of fork is clear, record under appropriate damage code. Note: forks below 1.3 m are considered as two trees and both stems should be measured for dbh. For broken top of unknown cause, use damage code UBT. For sweep or lean of unknown cause, record using damage code USW Note: Only trees that are clearly not expected to reach rotation should be deemed unacceptable Note: Wounds caused by rodent feeding around rust cankers should have stem rust recorded as the causal agent. 254
255 and galls) circumference western gall rust DSG, LOCATION OF DAMAGE TYPE OF DAMAGE TREE BEING ASSESSED IS UNACCEPTABLE IF: STEM Bark mining Any of the following signs are visible: pitch tubes, boring dust, exit holes on bark surface, galleries under the bark HOST SPECIES Pl, Sx, Fd LIKELY DAMAGE COMMENTS AGENTS & DAMAGE AGENT CODES Douglas-fir beetle IBD, Note: pitch tubes can be associated with trees mountain pine beetle IBM, that have successfully repelled bark beetles, spruce bark beetle IBS, Ips pini bark must be removed above pitch tube to IBI, Pityogenes & Pityophthorus confirm successful attack (successful galleries IBP will be filled with frass and not pitch, contain adult beetles and/or larval galleries). BRANCH Infection (cankers) an infection occurs on a live branch less than 20 cm from the stem. Pw, Pl, Py white pine blister rust DSB, comandra blister rust DSC, stalactiform blister rust DSS Stressed trees are susceptible to secondary bark and twig beetles. BRANCH Gouting any adelgid gouting occurs on a branch. Ba, Bg, Bl balsam woolly adelgid IAB. Gouting is defined as excessive swelling of a branch or shoot caused by balsam woolly adelgid, and is often accompanied by misshapen needles and buds. It is most common on branch tips and at nodes near the ends of branches. Consult a recent distribution map to identify the geographic extent of this pest. FOLIAGE Dothistroma > 50% of tree foliage has been removed by Dothistroma in ICH, CWH, and SBS biogeoclimatic zones. All P Dothistroma needle blight, DFS See Figure 3 FOLIAGE FOLIAGE FOLIAGE Douglas-fir tussock moth and hemlock looper Other defoliating insects and disease Elytroderma needle cast systemic infection STEM OR BRANCH Dwarf mistletoe infection >60% of tree foliage has been removed due to hemlock looper of Douglas-fir tussock moth. >80% of tree foliage has been removed due to foliage disease. The top 2/3 s of the tree is affected and the growth is clearly stunted. Any layer 1 and 2 tree with a Hawksworth rating >3 (Figure 4). any infection occurs on the stem or a live branch of layer 3 trees. a susceptible tree is located within 2 times the height of the infection on an overtopping tree, which is infected with dwarf mistletoe. Fd, Hw All other conifers Note: Lw Douglas-fir tussock moth (IDT), hemlock looper (IDL) foliage diseases DF, defoliating insects ID Note: Lw is a deciduous tree so defoliation has less impact, Repeated defoliation attacks will result in dead branches, apply the >80% rule to obviously dead branches, not just defoliated branches as with other conifer species See Figure 3 Pl, Py Elytroderma needle cast DFE Note: To confirm infection the surveyor must observe signs of the pathogen as small dark streaks on dead foliage Hw, Pl, Lw, Fd Douglas-fir dwarf mistletoe DMF,hemlock dwarf mistletoe DMH, larch dwarf mistletoe DML, lodgepole pine dwarf mistletoe DMP, Note: To confirm infection, the surveyor must observe mistletoe aerial shoots or basal cups on regeneration or on live or dead fallen brooms. Overtopping tree is a tree that is in an overtopping layer. 255
256 LOCATION OF DAMAGE TYPE OF DAMAGE TREE BEING ASSESSED IS UNACCEPTABLE IF: ROOTS Root disease sign(s) or a definitive combination of symptoms of root disease are observed. HOST SPECIES All LIKELY DAMAGE AGENTS & DAMAGE AGENT CODES armillaria root disease DRA, blackstain root disease DRB laminated root rot DRL, annosus root disease DRN tomentosus root rot DRT, COMMENTS Signs are direct evidence of the pathogenic fungus including fruiting bodies, distinctive mycelium or rhizomorphs. Symptoms include foliar chlorosis or thinning, pronounced resin flow near the root collar, reduced recent leader growth, a distress cone crop, and wood decay or stain. An individual symptom is not sufficient to identify a root disease. infected tree found in plot. See comments for well-spaced tree net down calculation. The multiplier for all root disease infected trees is 1. The well-spaced tree that is netted down is the susceptible species that is closest to the infected tree. Note that the WS tree that is netted down may vary depending on the species acceptability rules being followed, those currently used or those used at the time of declaration. All Fd Bg,Hw,Sx, Se, Lw Fd, Pl, Pw, Sx armillaria root disease DRA, laminated root rot DRL. black stain root disease DRB. Note: All conifer species are considered susceptible. All broadleaf species are considered not susceptible for survey purposes only. Note: Cw, Pl, Pw, Py, and all broadleaf species are considered not susceptible for survey purposes only. Note: All other conifers and broadleaf species are considered not susceptible for survey purposes only Se, Sx, Fd, Pl Ba, Hw, Ss, Fd tomentosus root rot DRT. annosus root rot DRN Note: Bg, Bl, Cw, Cy, Pw, Py, and all broadleaf species are considered not susceptible for survey purposes only. Note: Cw, Cy, Pw, Pl, Py, and all broadleaf species are considered not susceptible for survey purposes only. Example: How to apply net down for all root diseases. If root disease-infected trees are found in the plot: 1. In the first sweep, determine the total number of healthy, well-spaced trees using the prescribed minimum intertree distance (MITD) (e.g., 12 trees); 2. In a second independent sweep, determine the number of well-spaced infected trees using MITD (e.g., 1 infected tree); 3. From the number of susceptible healthy well-spaced trees found in step 1, subtract the number of well spaced infected trees. The result (e.g., 11 trees) is the adjusted number of healthy, well-spaced trees tallied for the plot. 256
257 Figure 1. Determining horizontal displacement when assessing stem deformation. This is only done when the tree has five seasons' growth after damage occurs. 257

. Figure 3. Calculating defoliation for Dothistroma-afflicted conifers.")
258 Acceptable Fork in top 1/3 Acceptable Fork in lower 2/3 but < 1/4 diameter of main stem Unacceptable Fork in lower 2/3 and > ¼ diameter of main stem Figure 2. Acceptable and unacceptable forking in age class 2 & 3 conifers (damage code K). Figure 3. Calculating defoliation for Dothistroma-afflicted conifers. 258
259 Definitions Figure 4. The Hawksworth six-class dwarf mistletoe rating system. basal resinosis (pitching): copious exudation of pitch at the base of the stem at or below the root collar. This symptom often is associated with armillaria root disease or attack by Warren s root collar weevil. decay: the disintegration of plant tissue. The process by which sound wood is decomposed by the action of wood-destroying fungi and other microorganisms. fork: two or more leaders have originated from the loss of a leader or apical shoot. At free-growing age, a fork is considered persistent if it has not differentiated in height between competing leaders by more than 5 cm after five years of growth since the leader damage occurred. Forks may provide entry points for decay fungi, are points of weakness during felling, and may create waste in the highest value first log. gall: nodule or lump of malformed bark or woody material caused by a variety of damaging agents, such as western gall rust and some insects. 259
260 gouting: excessive swelling of a branch or shoot, often accompanied by misshapen needles and buds. Most common at nodes on branches and frequently caused by balsam woolly adelgid on true firs (Abies spp). Height to diameter ratio: height in meters divided by dbh in meters. infection: characterized by a lesion or canker on stem or branches or by swelling around the entrance point of a pathogen. injury: damage to a tree by a biological, physical or chemical agent. scar: a wound completely healed-over by callus tissue wound: an injury where cambium is dead (e.g., sunscald) or completely removed. Wounds often serve as entry points for decay fungi 260
261 Appendix 10b: Free-Growing Damage Criteria for Even-Aged (Age Class 1) Coniferous Trees (rev. 6, July 2014) **Additions to this version identified in red in the text** INTRODUCTION Before a stand can be declared free growing it must have an adequate stocking of healthy, well-spaced trees of a preferred or acceptable species. These free-growing damage criteria can help users employ their professional judgement in identifying healthy trees. The criteria are based on professional opinion, and on the most current knowledge of forest-damaging agents. The criteria are designed to determine the acceptability of individual trees (conifers only) across the province. Acceptability of a stand depends on thresholds of damage ( and on stocking standards agreed to in the applicable Forest Stewardship Plans. The criteria list various types of damage, causal agents and species of trees. Damage and casual agents are referred to by their codes ( - on the Conifer Damage Agent and Condition Codes [FS 747 Conifer] field form). Tree species abbreviations are found here ( There are several points to keep in mind when using these criteria: 1. They apply only at the time the free-growing survey is conducted and are specific to even-aged, age class 1 stands that are being regenerated primarily to coniferous species for the production of timber. The assumptions made on the impact of pest damage to potential crop trees are founded on these factors. 2. Broadleaf species are noted in these criteria (usually as non-susceptible host species) but damage criteria are not listed since the characteristics of most broadleaf species (e.g., pests, growth habits, etc.) are sufficiently different from those of conifers. (Damage criteria for broadleaf species can be found here ec%209.pdf. 3. A Delegated Decision Maker (DDM) may allow or require deviations from these criteria, as long as the legal requirement to produce a healthy tree is met. These free growing damage criteria are not legislated regulations. The free-growing damage criteria are expected to be revised in the future as knowledge and information becomes available. 261
262 Location of damage Stem Stem Type of damage Wound (including sunscald and girdling) Insect mining at root collar Tree being assessed is UNACCEPTABLE if: The tree has any wound which is greater than 1/3 of the stem circumference, or The tree has a wound which is greater than 20% of the total length of the stem, or The tree has a wound centred on an infection caused by a stem rust, canker, or dwarf mistletoe (See Note under Stem: Infection and Stem or Branch: Dwarf mistletoe infection). The tree is enclosed within a seedling protector. Any amount of girdling or damage to the stem caused by seedling protectors. The tree is currently attacked by a bark-mining insect such as a weevil or a beetle and exhibits symptoms such as foliage discoloration, thinning, and/or reduced height growth increments Stem Bark mining Boring dust, pitch tubes, or bark sloughing is visible Stem Deformation (including crook, sweep, fork, browse, and dead or broken top) The pith is horizontally displaced more than 30 cm from the point of defect and originates above 30 cm from the point of germination. The tree leader has been killed three or more times in the last five years (weevil only). Host Species All Damage agent codes & damage agents AC, cattle; AH, hare; AP, porcupine; AS, squirrel; AV, vole; AZ, beaver; ISQ, sequoia pitch moth; IWW, Warren s root collar weevil; NB, fire; NW, wind-throw; NZ, sunscald; TL, logging; TM, mechanical. Comments A wound is defined as an injury in which the cambium is dead (e.g., sunscald) or completely removed from the tree exposing the sapwood. Measure the wound across the widest point of the exposed sapwood (or dead cambium when the tree is damaged by sunscald). Healed over wounds (=scars) are acceptable. See Figure 1 Girdling can be caused by seedling protectors. Pl, Sx IWW, Warren s root collar weevil. Only trees that are symptomatic should be checked for insect infestation or mining damage. Non-symptomatic trees are presumed to be unaffected by insect mining. Fd, Pl, Sx For sweep, All except Cw and Hw Pl, Ss, Sx IB, bark beetles; IBM, mountain pine beetle; IBI, Ips pini; IBP, Pityogenes and Pityophthorus spp. ID, defoliators; ISP, northern pitch twig moth; IWP, lodgepole pine terminal weevil; IWS, white pine (spruce) weevil; AC, cattle; AD, deer; AE, elk; AM, moose; ND, drought; NG, frost; NH, hail; NY, snow; TL, logging; TM, mechanical. IWP, lodgepole pine terminal weevil; IWS, white pine (spruce) weevil. The mountain pine beetle outbreak has caused unexpected mortality in young pine. Stressed trees are also susceptible secondary bark and twig beetles. For horizontal displacement. See Figure 2. This criterion applies only for terminal weevil damage. The tree has two or more leaders with no dominance expressed after five years growth and the fork originates above30 cm from the point of germination. All A, animal damage; IWP, lodgepole pine terminal weevil; IWS, white pine (spruce) weevil; NG, frost. Leader dominance occurs when the tallest leader is at least 5 cm taller than the second tallest leader. See Figure 3 Stem Branch Infection (including cankers and galls) Infection (cankers) The tree has a dead or broken top at a point that is >2 cm (>3 cm for the coast) in diameter. All A, animal damage; UBT, unknown broken top Any infection occurs on the stem. Pl, Pw, Py DSB, white pine blister rust; Note: Wounds caused by rodent feeding around rust cankers should have stem rust recorded as the causal agent. DSC, comandra blister rust; DSG, western gall rust; DSS, stalactiform blister rust. An infection occurs on a live branch less than Pl, Py DSC, comandra blister rust; See Figure cm from the stem. An infection occurs on a live branch less than Pl, Pw, Py DSB, white pine blister rust. See Figure cm from the stem. DSS, stalactiform blister rust. Pl, Py DSG, western gall rust. See Figure 4. Branch Galls A gall rust infection occurs on a live branch less than 5 cm from the stem. 262
263 Branch Gouting Any adelgid gouting occurs on a branch. Ba, Bg, Bl IAB, balsam woolly adelgid. Gouting is defined as excessive swelling of a branch or shoot caused by balsam woolly adelgid, and is often accompanied by misshapen needles and buds. It is most common on branch tips and at nodes near the ends of branches. Consult a recent distribution map to identify the geographic extent of this pest. Stem or Branch Dwarf mistletoe infection Any infection occurs on the stem or a live branch, or A susceptible tree is located within 10 m of an overtopping tree, which is infected with dwarf mistletoe. Foliage Defoliation >50% of tree foliage has been removed by Dothistroma in ICH, CWH and SBS biogeoclimatic zones. >80% of tree foliage has been removed due to defoliating insects or foliage disease. Roots Root disease Sign(s) or a definitive combination of symptoms of root disease is observed. Infected tree found in plot. The multiplier for DRA is two; except in BEC zones PPdh1 and 2, IDFxh1, IDFdm1 and 2, MSdk1, and MSdm1 - the multiplier is one. Except for Cw (in all BEC zones) the multiplier is one. See comments for well-spaced tree net down (multiplier) calculation. Fd, Hw, Lw, Pl DMF, douglas-fir dwarf mistletoe; DMH, hemlock dwarf mistletoe; DML, larch dwarf mistletoe; DMP, lodgepole pine dwarf mistletoe. B, F, P, S DFS, dothistroma needle blight. See Figure 5. Note: To confirm infection, the surveyor must observe mistletoe aerial shoots or basal cups on regeneration or on live or dead fallen brooms. Overtopping tree is a tree that is three or more times taller than the height of the tree being assessed. All others DF, foliage diseases; ID, defoliators. See Figure 5. All DRA, armillaria root disease; Signs are direct evidence of the pathogenic fungus including fruiting bodies, distinctive mycelium or rhizomorphs. DRB, blackstain root disease; Symptoms include foliar chlorosis or thinning, pronounced resin flow near the root collar, reduced recent leader growth, a DRL, laminated root rot; distress cone crop, and wood decay or stain. An individual symptom is not sufficient to identify a root disease. DRN, annosus root disease; DRT, tomentosus root rot. All DRA, armillaria root disease. Note: All conifer species are considered susceptible. Broadleaf species are considered not susceptible for survey purposes only. Example: How to apply net down for root disease. If root disease-infected trees are found in the plot: In the first sweep, determine the total number of healthy, well-spaced /free growing trees using the prescribed minimum inter-tree distance (MITD) (e.g., 12 trees) ignoring the M-value; 2. In a second independent sweep, determine the number of infected trees (including dead infected trees and for DRT only, infected stumps) that are the MITD from each other (e.g.,4 infected trees or stumps); 3. Multiply the number from step 2 by the multiplier for the specific root disease and subtract this number from the number of susceptible healthy well-spaced /free growing trees found in step 1 (e.g., for DRA: 12-4(2) = 4). The result is the maximum number of free growing trees tallied for the plot. Infected conifer found in plot. The multiplier for DRL is four. Ba, Bg, Fd, Lw, Se, Sx DRL, laminated root rot. Note: Bl, Cw, Pl, Pw, Py and broadleaf species are considered not susceptible for survey purposes only. Infected conifer found in plot. The multiplier for DRN is two. Infected conifer or stump found in plot. The multiplier for DRT is two. Ba, Hw, Ss DRN, annosus root rot. Note: Ba, Bl, Cw, Fd, Pl, Pw, Py and broadleaf species are considered not susceptible for survey purposes only. Se, Sx DRT, tomentosus root rot. Note: Bg, Bl, Cw, Cy, Fd, Hm, Pl, Pw, Py, Sx and broadleaf species are considered not susceptible for survey purposes only. 263
264 WOUND A tree is unacceptable where damage to the cambium is more than 1/3 of the circumference of the stem, or the wound is greater than 20% of the total length of the stem. Figure 1 HORIZONTAL DISPLACEMENT (CROOKS) A tree is unacceptable if a crook displaces the pith more than 30 cm from the point of defect, and it must occur 30 cm above the point of germination. Figure 2 264
265 FORKS The tree is unacceptable if it has two or more leaders with no dominance expressed after five years growth and the fork originates above30 cm from the point of germination. Figure 3 GALL or CANKER ON A BRANCH A tree is unacceptable if the gall occurs less than 5 cm from the stem for DSG, or if the canker occurs less than 20 cm from the stem for DSC or DSS, or if the canker occurs less than 60 cm on the stem for DSB. Figure 4 265

266 DEFOLIATION General Defoliation - A tree is unacceptable if more than 80% of teh leaves of needles are removed becasueo f insects or disease. If defoliation is wide-spread, it might be a one off insect or disease occurrence; consider a resurvey at a later date. Figure 5 Definitions basal resinosis (pitching): copious exudation of pitch at the base of the stem at or below the root collar. This symptom often is associated with Armillaria root disease or attack by Warren s root collar weevil. decay: the disintegration of plant tissue. The process by which sound wood is decomposed by the action of wood-destroying fungi and other microorganisms. fork: two or more leaders have originated from the loss of a leader or apical shoot. At free-growing age, a fork is considered persistent if it has not differentiated in height between competing leaders by more than 5 cm after five years of growth since the leader damage occurred. Forks may provide entry points for decay fungi, are points of weakness during felling, and may create waste in the highest value first log. gall: nodule or lump of malformed bark or woody material caused by a variety of damaging agents, such as western gall rust and some insects. girdling: A transversal cut across the phloem in a stem so that downward transport of substances is unable to occur within the plant. 266
267 gouting: excessive swelling of a branch or shoot, often accompanied by misshapen needles and buds. Most common at nodes on branches and frequently caused by balsam woolly adelgid on true firs (Abies spp). infection: characterized by a lesion or canker on stem or branches or by swelling around the entrance point of a pathogen. injury: damage to a tree by a biological, physical or chemical agent. scar: a wound completely healed-over by callus tissue wound: an injury where cambium is dead (e.g., sunscald) or completely removed. Wounds often serve as entry points for decay fungi. (July 2013) 267
268 Appendix 11: Broadleaf Forest Health Free-Growing Damage Criteria as a supplement to the FS 660 (Oct 2011) BROADLEAF FOREST HEALTH FREE-GROWING DAMAGE CRITERIA Introduction Broadleaves are a common component of the forest landscape and recognition of their role in maintaining biodiversity and habitat values, as well as concerns about timber supply, have stimulated interest in their management (Chief Forester memo on Incorporation of mixedwood and broadleaves into Forest Stewardship Plan stocking standards, Hardwood Management in the Coast Forest Region SP amendments and TSR regeneration assumptions, May 01, 2008). Since the growth habits and pests of broadleaves are different than conifers, they require a separate set of damage criteria. The free-growing damage criteria outlined in the attached table are based on the best available data and professional opinion, and are expected to be revised in the future when new knowledge or information becomes available. The goal of these damage criteria is to establish forest health threshold tolerances that will help users exercise their professional judgment in identifying healthy and merchantable broadleaf trees. Note: The following are guidelines only and are not embedded in regulation. The broadleaf damage criteria apply to, Red Alder (Dr), Birch (Ep), Big Leaf Maple (Mb), Poplar (Cottonwood [Act], Balsam poplar [Acb], Aspen [At], of even-aged, age class 1 stands at the time of a free-growing assessment, province-wide. Unless otherwise stated in regulation or an approved Forest Development Plan (FDP) or Forest Stewardship Plan (FSP) stocking standard, a broadleaf tree is unacceptable for the following issues; 268
269 Condition Unacceptable if; Broadleaf host species Comments Regeneration Stems originate from the sides or cut surface of a stump Applies to all species except Maple (Mb) Stems originating from the sides or cut surface of a stump are susceptible to breakage (Coppice is at this time an acceptable form of regeneration for all species where it occurs) Dead branches At least one major dead branch exists in the live crown all species Broken stems, torn branches Sapwood penetration; (frost crack, broken stems, gouges, torn branches) a branch is torn from the point of attachment to the main stem. The main stem is broken anywhere along its length. Applies to all species Stem Wounds(Cambial damage; Exposed wood, sunscald a wound occupies more than 10% the circumference of the stem, or is longer than 15 centimeters. Applies to all species. Bark removal 269
270 Condition Unacceptable if; Broadleaf host species Comments Stem damage from diseases or insects cankers or fungal infections or insect damage is present Applies to all species There are many different types of cankers; refer to Diseases of Populus in British Columbia by B Callan - a/publications?id=51 19 Examples of visible disease damage includes swellings or depressions on stems. Some cankers can have liquid discharge. Insect damage includes signs of insect frass. Animal damage the main stem has been repeatedly browsed. the main stem has been abraded from antler rubbing or claw marks over half the circumference of the stem and greater than 50 cm in length. Applies to all species Browsing damage by animals can affect growth rate and form of trees. A main stem if repeatedly browsed it would have multiple leader or growing tips. the trees are trampled by an animal. 270
271 Condition Unacceptable if; Broadleaf host species Comments Sweep a stem is displaced more than 30 cm from the center of the root crown pith, within 1 m of the ground Applies to all species Sweep is not an issue in merchantable hardwood provided an 8 to 10 ft length can be cut from the tree. Forks If the tree has two or more leaders with no dominance expressed Applies to bigleaf Maple Poplar displays more apical dominance than other broadleaves and therefore less readily develops multiple stems 271
272 Appendix 12: GPS Application in Silviculture Surveys This section has been included as a best practices suggestion. The use of Global Positioning Systems (GPS) is completely optional within the field of silviculture surveys. Recent reductions in price and technological advances that have significantly improved both the reception and accuracy of recreational grade GPS receivers, have made them an invaluable tool for forestry professionals. The fact that silviculture surveys are conducted under limited canopy further supports this. This appendix is provided as an opportunity to open the discussion on the topic and provide a starting point for wide spread use of GPS. What is GPS GPS employs a constellation of satellites in orbit around the earth and the user receivers. Each satellite has a very accurate clock and a radio transmitter. Each satellite transmits repeatedly something like satellite #1 is sending this beep at exactly 12:34:45.678, BEEP. The speed of that radio signal traveling toward earth is a known constant, the speed of light. The GPS receiver hears the messages from multiple satellites simultaneously and uses this data to trilaterate (to calculate a position based on three distances) its position on the earth. The system was originally developed by the US military in the 1960s. It was opened to public use in the late 1980s and early 1990s. At that time there was a randomly induced error called selective availability (SA) that made the system intentionally inaccurate to limit the system from being used by enemies of the developers. Positional data could be collected in the field and brought back to the office where correction data could be applied to reverse the induced error as well as the results of atmospheric distortion. This is a data analysis stage called post processing. In 2000 selective availability was turned off, removing that induced error making it practical for consumer use. Post processing is still recommended where high levels of accuracy are required, such as boundary traversing with industrial grade units. Post processing is not practical for data collected by recreational grade units. The satellite constellation is the group of satellites present overhead at any one time. This arrangement and number of satellites is constantly changing as they orbit around the earth. A minimum of four satellites are required to calculate a three dimensional position. GPS receivers provide the surveyors their current position at all times and therefore the ability to navigate to some new location. The GPS is repeatedly recalculating the current position as new data is received. As a result, the current position coordinates continually change even when you are not moving. This is known as position drift or creep. More information about the Global Positioning System can be found at Wikipedia. 272
273 Differential GPS Although selective availability is no longer in effect there are still other significant sources of error, most of which can be corrected by applying differential correction (DGPS). DGPS utilizes a base GPS receiver which continuously records positions at a known location. Differences between the calculated positions and the known surveyed location are due to a combination of errors commonly referred to as the error budget. Differential correction is the process of removing the errors identified at the base station from the data recorded by the surveyor in the field. This can be done after the survey when you return to office (postprocessing), or while you are recording the data in the field (real-time). Post-processing is primarily used in applications such as block boundary traversing where it s not necessary to know your position accurately while you are in the field. Although postprocessing is standard procedure when using industrial grade GPS equipment, recreational grade GPS receivers do not store the necessary data for post-processing. Applications requiring accurate GPS navigation, such as establishing silviculture plots, require the use of real-time differential correction (RTDGPS). RTDGPS involves the transmission of the differential correction information from the base station to the surveyors GPS receiver via satellite or radio link. WAAS (Wide Area Augmentation System) is the most common RTDGPS system in use and is supported by many GPS receivers currently on the market. It requires no extra equipment and is a free service. Differential correction data is relayed using geostationary communications satellites and received using one of the standard channels on the GPS receiver. Other sources of RTDGPS such as the Canadian based CDGPS ( OmniSTAR, and the Canadian Coast Guard operated marine radio beacons require additional equipment and/or subscriptions and are not commonly used with recreational grade receivers. GPS Data Management Features are surveyed using GPS as either points or lines. Some receivers allow lines to be closed to create polygons. Point features are typically referred to as Waypoints and linear features as Tracks. Waypoints Waypoints are used to survey point features such as plot locations which are best represented by a single set of coordinates. They can usually be assigned a short name, a more detailed description, and a symbol. Waypoints are stored in a list on your receiver and can be displayed on your screen, recalled at any time for navigation purposes, or downloaded to a computer using a software program. There are numerous methods to create waypoints depending on your receiver and software 273
274 capabilities. Some of the common methods include: Surveying your current location; Projecting a waypoint from your current location by applying a distance and azimuth; Picking a location on your background map; and Creating a list of waypoints in a software program on a computer and uploading. (Refer to your GPS receiver manual for detailed instructions). Tracks Tracks are used to map linear features such as the path taken between plots. It is important to configure your GPS receiver s track logging function and learn to manage track data properly. Tracks are made up of track points which are the individual GPS fixes that are connected together to make the track line. You can configure track points to be collected at specific time or distance intervals or use the Auto setting which is based on both time and distance. It is recommended that you collect as much detail possible within the memory limitations of your GPS unit. Recreation GPS have a certain amount of memory reserved for the active track. Track points recorded to the active track can then be saved as a saved track and given a descriptive name. The usual steps required to map a feature as a track are: Check your track logging configuration; Turn track logging off; Clear your active track log; Turn track logging on and survey the linear feature; When you reach the end of the feature, turn track logging off; Save the active track as a saved track and give it a suitable name (i.e. Blk12 walkthrough); and Clear your active track before surveying the next feature. Software The use of a software program to enable the upload, download and management of waypoint and track data and export to GIS and database formats is highly recommended. The individual GPS receiver manufacturers have software to facilitate the transfer of data from the receiver to the desktop computer and back to the receiver. Further, software like OziExplorer, Fugawi, Mapwel, cgpsmapper, Microsoft MapPoint, Microsoft Streets & Trips, Topographix Expert GPS and others have features to assist with data transfer. Preloading Data GPS receivers can be preloaded with the opening boundaries allowing the surveyor a backup method for locating the target opening. While it may not replace the access map, it is a great addition. 274
275 Internal line work such as stratum boundaries can also be preloaded ensuring any plot established is correctly identified into the correct stratum. Loading opening and standards unit boundaries into the GPS receiver requires software and the data file, often available in shape file (*.shp family format) or similar. Sampling designs such as the grid pattern can be efficiently created in the office and transferred to the GPS receiver by creating waypoints at the intended plot locations. Some industrial grade receivers allow for importing very detailed background maps and even digital aerial photographs to underlie the current positional data. Field Applications and Functions The GPS receiver continually answers the question where am I. With background maps and/or preloaded opening and strata boundaries the surveyor continually knows where I am in relation to the unit being surveyed. The GPS receivers can be configured to record their current location repeatedly, at specified time or distance intervals, or at major changes in direction; somewhat like an electronic trail of bread crumbs. This makes it extremely valuable for surveyors as a means to document the path traveled during the walk-through. When using the representative sampling or visual assessment sampling methods the walk-through path can be documented using the GPS. This will provide some confidence that the whole of the stratum has been assessed. When using vector or grid sampling methods, GPS can also provide documentation of the path walked between plots. This line feature data is often referred to as a track log. This feature alone makes the GPS an invaluable tool to survey project administrators. The GPS receiver can save its current location at any time as a waypoint. This becomes especially useful to capture the location of point features found while completing the walkthrough or during the survey. As with the opening boundaries, GPS receivers can be preloaded with plot locations allowing the surveyor to navigate from one plot to the next, in any order without following straight strip lines or leaving hip chain thread trailing through the forest. The surveyor has the freedom to wander as they choose and investigate anomalies like forest health factors located off the strip line with minimal loss in productivity. When features such as strata boundaries are located, waypoints can be created. When using the representative sampling method, a waypoint can be created to document the actual location of the sample plots. Datums and Projections Datums are coordinate systems based on a reference point. NAD83 is the standard datum for use in British Columbia. Ensure your GPS receivers are configured to use this datum. UTM Universal Transverse Mercator Projections are means of displaying the curved surface of the earth on a flat map. The UTM (Universal Transverse Mercator) projection is a commonly used, orthogonal, metric coordinate 275

276 system. It is divided into numbered UTM zones 6 degrees longitude wide. BC is covered by portions of five UTM zones, from UTM zone 7 in the far NW corner of the province to UTM zone 11 covering the SE corner of the province. Coordinate pairs consist of a seven digit northing representing the distance in meters north of the equator, and a six digit easting with the line of longitude at the center of the UTM zone (central meridian) being assigned 500,000m E m m Appendix 12, Figure 3: UTM Zones in British Columbia 276

277 100,000 E 500,000 E 540,000 E 1,000,000 E Silviculture Survey Procedures Manual April 1, 2015 The northern limit of each zone is 9,200,000 m north of the equator where each zone is only 80,000 m wide. 80,000 m } 460,000 E 9,200,000 N At the equator each UTM zone is 1,000,000m wide 500,000m on each side of the c entral meridian 0,000,000 N Appendix 12, Figure 4: UTM Detail The systematic format of grid sampling can be maintained in two methods, pre-established waypoints as described earlier, or 00 UTM coordinates method. This method requires the establishment of procedures or conventions to maintain the systematic pattern. The following is proposed for use with 1 plot per hectare, 100 x 100m, grid sampling as an example. Set a convention that the plots will be established at UTM coordinates ending in 00 to the left of the decimal point (if your receiver shows decimals). There are many ways to do this in the field depending on the particular hardware selected. With both of the above methods use the go to function to navigate from your current location to the desired plot location. Some GPS receivers have an audible warning to notify you as you approach the desired location. The user would continue to travel toward the intended plot location and watch the GPS receiver display indicates the surveyor s current position is equal to or less than the allowable tolerance from the target location. This can also be done by watching the UTM display until the easting or northing indicate the current position is less than the acceptable tolerance. This raises a question of integrity and professionalism. As with conventional hip chain and hand compass methods, the plot placement can easily be manipulated by an unethical surveyor. Unlike with representative sampling, the surveyor must establish the plot center without consideration for the data that will be gathered from within the plot to be established. 277
278 Hardware Selection There is no wish to recommend any one or more manufacturer of software or hardware over others. The intent is to provide some guidance to assist the survey community in taking advantage of the opportunities GPS technology offers to their survey program. To learn more about this topic the document British Columbia Standards, Specification and guidance for Resource Surveys Using Global Positioning System (GPS) Technology is available. Although these standards were developed for industrial grade GPS, many of the concepts can also be applied to the use of recreational GPS. There is a wide range of hardware and software options available. Here are some examples available within each of the general types: General Type Purchase Price Range of Accuracy Recreational or Consumer Grade Manufacturers $150 to $ to 20m Garmin Lowrance Magellan Bushnell Low to Medium Industrial Grade (DGPS) $1000 to $ to 5m Leica Trimble Navigation Software, a third party GPS and Personal Digital Assistant (PDA) $120 to $1200 plus hardware 0.5 to 20m dependent on the selected GPS OziExplorer Fugawi ESRI ArcpadTrimble TerraSync Softmap for Palm Trimble is the most prolific industrial GPS manufacturers, therefore, additional description is therefore warranted. 1: Field Computers Ranger, Recon, Juno, Nomad, Yuma running Windows software and TerraSync or Arcpad & GPSCorrect extension. Can connect to external industrial grade submeter GPS receivers such as the ProXT & ProXH via cable or Bluetooth. Alternately, many of them can be ordered with built-in 2-5m GPS or have GPS capability added via a GPS card. 2: GPS Receivers such as the ProXT and ProXH (medium and high industrial grade) and Pathfinder XC (low industrial grade) are stand-alone GPS receivers that must be used with an external datalogger/field computer. 3: All-In-One GPS Units combine a ruggedized field computer and a GPS receiver. Examples include the industrial grade GeoXT and GeoXH and the low industrial grade Juno (SiRFStar III chip) Industrial grade GPS units can be configured to filter the data they receive based on the strength of the signal and the elevation of each satellite above the horizon. An estimate of accuracy (DOP = dilution of precision) is calculated based on the number of satellites in view and the geometric strength of the constellation. The receiver is configured to log data only 278
279 when acceptable accuracy is achieved. Recreational grade GPS receivers do not allow the user to set filters to control data quality. Unlike industrial grade GPS where positional accuracy is of primary importance, the primary goal of recreational GPS units is to generate a position quickly, and in almost any environment. Positional accuracy is of secondary importance. The onus is therefore on the recreational GPS user to be aware of the GPS environment they are operating in to ensure suitable accuracy is achieved. Recreational grade GPS receivers frequently include an estimate of positional error (EPE). This error is commonly expressed in meters. The meaning and reliability of this figure differs by manufacturer and model. Most commonly this number represents circular error probable (CEP). Therefore an EPE of 8m means that there is a 50% chance that the GPS position is within a circle of radius 8m. Elevations generated by GPS are on average 50% less accurate than the horizontal coordinates. The low to medium grade industrial GPS receivers are far superior to the recreational grade in terms of accuracy, signal acquisition under tree canopy, filtering of signal quality, compatibility with GIS software, memory capacity, background map data quality and flexibility. Some of them have the ability to run survey data collection software at the same time as the GPS software. This does however come at a price. They are preferred but not essential. Aspects that cannot be controlled by the user: Number of satellites available in the constellation the more satellites visible to the receiver the more data it has to calculate it s position Distribution of the constellation the wider the distribution of the satellites across the sky the better but with consideration of a minimum elevation angle above the horizon The angle of each satellite above the horizon the lower on the horizon a satellite is the more atmosphere the signal is passing through and therefore the higher the level of interference. Slope of the opening steep slopes effectively reduce the amount of visible sky and therefore reduce the number of potential satellites in view Aspect since there are generally fewer satellites over the northern sky the GPS receiver used on north aspects will see fewer satellites because the more satellite rich southern sky is obscured Position drift/creep - As current data is received from the various satellites the receiver recalculates the current position of the receiver. The computer is using the new data to reconsider your position. You are here no, you are here no, you are here. You can see this in action by standing still holding your GPS receiver with an open view of the sky and the page selected to view your current location in UTM coordinates. You will see the digits on the right side changing as if you were moving. 279

280 Aspects that can be controlled by the user: WAAS ensure that your GPS receiver is configured to use WAAS corrections. Antenna orientation consult your receiver manual to determine the optimum orientation of your GPS antenna. Consider using an external antenna mounted on a pole. Positional Delay - Recreational grade GPS are subject to delay move smoothly while navigating and surveying, slowing your pace as you re near your target. Let the GPS position settle before recording a waypoint. Point Averaging use point averaging when recording waypoints. Averaging for 2 minutes will approximately double your accuracy. Time of day there is software available that can calculate periods of the day when the GPS constellation is better than another. It uses the known flight path of each satellite, for a selected day and ones position on the earth. It is useful to be aware of periods of the day when the level of error is anticipated to be poor. This sample graph from GPS planning software indicates a high level of error at 3:00 to 4:00 am and then again near 6:00 pm on this particular day and at this particular location. The surveyor should plan to finish their work day near 5:30 pm or at least schedule a dinner break around the 6:00 pm problem period. Appendix 12, Figure 1: Sample GPS Planning Graph Multipath error resulting from the signal being reflected or bounced off objects. Multipath errors can be limited by not using the GPS under significant canopy cover. Alternatively, record your waypoint in an open area and project it to it s true location. Comparison of Conventional Methods to GPS Methods Some resource managers have expressed a concern regarding the accuracy and precision of recreational grade GPS receivers for silviculture surveys. One should consider the relative accuracy of the conventional methods for navigation and plot positioning. In the 1970s 280
281 silviculture survey methodologies employed pacing with the hand compass. Hip chains later became an alternative to pacing. The question at hand is can GPS receivers be a suitable alternative to hand compass and hip chain? The common hand compass has at least +- 1 error and the hip chain has at least +-0.2% error under perfect conditions. Over a distance of 100m this angular error means the plot could be located 3.49 left or right of the correct location, or a range of 6.98m. The length measurement from the hip chain could be as short as 99.8m or as long as 100.2m, a 0.4m range of the desired location. Further, these measurement errors may become cumulative, or corrective, but which is unknown. If they are cumulative, after 6 plots, the plot center is somewhere within an area of 50 m 2, an area as large as the sample plot itself. Terrain, vegetation, weather, accuracy of the declination determination, the precision to which the declination has been adjusted and surveyor diligence are but a few of the reasons these errors are grossly conservative. A tabular analysis of conventional method error values result in the table below. (Note: The GPS positional data is not cumulative.) Number of Plots Cumulative Strip Line Length m Cumulative Lateral Error m Cumulative Linear Error m Cumulative Error Area m A recreational GPS receiver has a wide range of accuracy depending on the model and conditions under which it is operating; from 1m to over 100m. The research documented in British Columbia Standards, Specification and guidance for Resource Surveys Using Global Positioning System (GPS) Technology suggests 10 m is a reasonable expectation. For the industrial grade, 7 m is realistic. The resource mapping specialists at GeoBC have a well-founded concern for the appropriate use of GPS receivers and the data collected. They are responsible for data integrity and have found that it is far easier to restrict the entry to only data that is accurate enough than it is to question and qualify every subsequent use of this data in future uses. Plot and strip line data is not uploaded into the TRIM database but the strata boundaries are. Anyone concerned for the conformity of the strata boundary lines to TRIM needs to remember that the conventional 281
282 method for determining strata boundaries is by visual estimate. GPS adds to the accuracy of these estimated lines. GPS Established Strip and Plot Marking With GPS navigation the surveyor is traveling between plots without the need for carefully following a bearing in a straight line. They will travel where the brush, slash and other obstacles are at a minimum thus reducing travel time between plots. The plot locations are determined by coordinate location and the GPS is documenting the route traveled, therefore there is no need to mark the route traveled by hanging flagging tape. This is another cost saving of time and supplies and a reduction of environmental debris. The plots on the other hand must be marked more thoroughly than with conventional methods. Anyone wishing to travel back to a previously established plot has no strip line ribbon to follow. The only option is to use the previously collected coordinates to relocate the plots. The coordinates of the original plots would be loaded into a GPS receiver as waypoints. The surveyor or survey inspector uses the go to function to navigate to the plot. Consider that there was some error in the accuracy of the original coordinates. There will also be some error in the data position in the returning navigation. For example if the original coordinates indicate the plot is 5 m north of the actual location and the current position of the returning surveyor is indicating a position 5 m to the south of the actual position, then the plot could, in this extreme case, be as much as 10 m away. The returning surveyor will have a difficult time relocating the plot. For this reason plots must be marked more thoroughly. The goal of plot marking is to make the plot center easier to find. Two additional pairs of ribbon, tied as high as the available vegetation allows are recommended. These ribbons should be located near the edge of the plot boundary and preferable on opposite sides of the plot. However, remember the intent of these additional ribbons is to allow the plot to be found when a GPS is used to navigate to the vicinity of the plot. 282
283 Appendix 12, Figure 2: Example of plot marking methods with GPS use Recommendations for GPS Use in Silviculture Surveys If one chooses to use GPS receivers as part of a silviculture survey program the following topics should be addressed at the planning stage. Surveyors should discuss with their employers or project administration a number of issues to ensure compatibility and efficiency. In the selection of recreational grade versus industrial grade GPS receivers, industrial would be preferred, but recreational grade is acceptable. Preloading opening and standards unit boundaries is preferred. Use the GPS receivers track function to document the walk-through path for all surveys methods. This provides assurance that the walk-through is completed, as well as aids in the efficiency and accuracy of determining strata boundaries. Select hardware with waypoint averaging and use this function when creating waypoints. If using recreational grade receivers, select receivers with SiRFStar III or similar technology. Use WAAS or an alternative source or real-time differential correction. 283
284 Adjust the GPS receiver position format to UTM (Universal Transverse Mercator). Create waypoints for strata boundary reference to assist with accurate mapping strata edges. Create waypoints where noteworthy anomalies are identified (e.g. patches too small to stratify). Consideration should be given to selecting receivers capable of point averaging. This will increase the accuracy of the initial plot location. Collecting individual GPS fixes over a period of one to two minutes and averaging to determine final waypoint coordinates can significantly improve accuracy. The surveyor should provide digital data files for point, line and any area features, in particular plot locations and path of travel. Select one or more data file formats for the point, line and polygon features that are compatible with the various hardware and software to be used throughout the project. Consider conventions for a file naming format. Consider whether the files will be cumulative or individual. One point file and one line file per opening, or all points related to the project into one file and all the lines for the project in another. Many other variations are also acceptable. Tabular documentation of the plot center coordinates in printed reports or maps are recommended. Recreational grade receivers are not acceptable for surveys under significant canopy such as multi storey surveys. Industrial grade units with an external antenna may be acceptable. When using these GPS methods, there is no need for a point of commencement, subject to survey contract specifications. Mark the plot center location more thoroughly with two or more additional ribbon pairs and as high as possible to assist in them being found in the future. Only the ribbon at the center need be marked with the plot number etc. Select NAD83 as it is the standard datum used in British Columbia resource management. Select an acceptable tolerance value to be used where position drift/creep occurs. Two (2) m is suggested at this time but higher or lower values may also be suitable. Do not use recreational grade GPS receivers to determine payment area for treatments or reporting treatments into RESULTS. 284
285 Details particular to the various Survey Methods: Grid Sampling Two methods are proposed: pre-establishment of plot locations via computer software then loading in the GPS, or field establishment at systematically selected UTM coordinates with the acceptable tolerance value. 1 plot per hectare = UTM 00E 00N Other plot placement intervals become more complicated. We suggest the first plot be located at UTM 00E 00N, (or other standard arbitrary starting point), followed by the remaining eastings and northings of the remaining plots at the interval indicated by the formula, table or spreadsheet below. (50 x number of plots planned for the stratum) (stratum area in ha x 10000) 50 1 Plot Per X Hectares Distance Between Plots and Strips on a Square Pattern Number of Plots Per Hectare Distance Between Plots and Strips on a Square Pattern
286 The Microsoft Excel spreadsheet below shows a sample calculation and the formulae below used to create it. 2 B C D E F G H Plot Size in m Plot Size in m 2 Stratum Area in ha Planned Number of Plots Number of Plots Per Hectare Number of Hectares Per Plot Distance Between Plots and Strips on a Square Pattern =B3*B3*PI() 11 7 =E3/D3 =D3/E3 =SQRT(B3/((B3*D3)/(C3*10000))) 3 00E125N E125N 250E125N 2 875E00N 1 00E00N 6 125E00N 7 875E875N Appendix 12, Figure 5: Example of plot UTM digits Vector Sampling Plan the proposed vector sampling on a paper map in the field as usual then use the pan map function and create waypoint function to create the plot locations and finally, use the go to function to navigate to the plot. The tolerance is applied in a similar fashion. Example: If the plot is planned to be located at 10 U E N then either the easting should display 77 or the northing should display 43, and the other should be within an acceptable tolerance, (75 to 79 E, or 41 to 45 N) Representative Sampling Use the track log to provide a documentation of the assessment route. Select the plot locations as usual, create a waypoint at the selected plot center. Visual assessments Use the track log to provide a documentation of the assessment route. 286

287 Appendix 13: Local Geographic Free Growing Competition Assessment Criteria Figure 1: Map of 3 Geographic Areas Coast, North, and South 287
288 A 13.1 Coast Area FG Guidance 1) Coast Area Description The following TSA's are assessed according to guidelines described in Figure 2 (including all area based tenures within the gross areas of these TSA s, regardless of Forest District boundaries): Queen Charlotte TSA; Kingcome TSA; Strathcona TSA; Arrowsmith TSA; Fraser TSA; Soo TSA; Sunshine TSA; Mid-Coast TSA; North Coast TSA; Kalum TSA (Note: Additions from administrative Coastal Area.) 288
289 Must: 1) be Well Spaced 2) be Preferred or Acceptable Species per SP, FDP or FSP 3) meet Damage Criteria 4) meet Minimum Height if in SP, FDP or FSP No Is the site in BEC zone CDF, CWH or IDFww? Yes Yes Is the Herb and/or Shrub vegetation taller than the crop tree in more than 1 quadrant? No FG Not FG Yes Does the crop tree meet the Conifer/Brush Ratio for any Broadleaf (including Mb and Act) vegetation? Not FG No Yes Yes Potentially FG 1) Determine all Potentially Free Growing crop trees & calculate Median Height; 2) Count the Dr, Ep, & Vb in 3.99 m. radius plot that are taller than the Median Height of the Potentially Free Growing crop trees. Yes Is there any Herb and/or Shrub vegetation taller than the crop tree in more than 1 quadrant? Not FG No Does more than 1 quadrant contain any Broadleaf Dr, Ep, and/or Vb vegetation that is taller than the allowable Conifer/Brush Ratio? Is the site in BEC subzone CDFmm/01, CWHdm/01/03, CWHds/01/03, CWHms/01/03, CWHvm1/03, CWHxm/01/03 or IDFww/01? No Does the crop tree meet the Conifer/Brush Ratio for any Mb and /or Act vegetation? No Yes Yes Is there any Dr, Ep or Vb vegetation taller than the allowable Conifer/Brush Ratio? No FG Does the crop tree meet the Conifer/Brush Ratio for any Broadleaf, Herb and/or Shrub vegetation (including Mb and Act)? Yes No No Not FG Crop Tree Species Fdc. Hw, Cw, Ba, Yc, Ss, Pw, Plc Biogeoclimatic subzone/variant Sites Series Allowable countable broadleaf trees per 50 m2 plot (3.99 m. radius) CWH dm,ds,ms, xm 01 1 Dr, Ep, or 2 Vb CWH dm,ds,ms, xm 03 2 Dr, Ep, or 4 Vb CWH vm Dr, Ep, or 2 Vb CDF mm, IDFww 01 2 Dr, Ep, or 4 Vb Al other 0 Note: When a survey unit contains more than one subzone or site series, use the lower countable broadleaf limit. When a plot contains more than the allowable red alder, birch, and/or bitter cherry trees for a given species and biogeoclimatic subzone/site series, only the potentially free growing trees of that species will become not free growing. A crop tree that meets the required SP crop tree-to-brush ratio (and all other free growing criteria) is free growing regardless of the number of broadleaf trees in the 50 m2 plot. Figure 2.Coast Vegetation Competition Decision Key for a Free Growing Crop Tree Is the number of Dr, Ep & Vb > the allowable from the table? Yes Not FG FG No 289
290 A 13.2 North (Northern Interior) Area FG Guidance 1) North Area Description The following TSA's are assessed according to guidelines described in Figure 3 (including all area based tenures within the gross areas of these TSA s, regardless of Forest District boundaries): Cassiar TSA; Nass TSA; Kispiox TSA; Bulkley TSA; Morice TSA; Lakes TSA; Prince George TSA; Mackenzie; Robson Valley TSA; Dawson Creek TSA; Fort St. John TSA; Fort Nelson TSA. 290
291 Must: 1) be Well Spaced 2) be Preferred or Acceptable Species - per SP, FDP or FSP 3) meet Damage Criteria 4) meet Minimum Height if in SP, FDP or FSP 1# Test Shrub/Herb Is the Herb and/or Shrub vegetation taller than the crop tree in more than 1 quadrant? Yes Not FG No 2# Test Broadleaf At,Ep,Act No Is there Broadleaf Ep, At and/or Act vegetation within 1.0 m. of the crop tree (branches and/or foliage)? Yes Is ANY vegetation taller than the crop tree in more than one quadrant? No Yes FG Yes Does the crop tree meet the Conifer/Brush Ratio (considering Ep, At and/or Act only)? No Potentially FG 1) Determine all Potentially Free Growing crop trees & calculate Median Height; 2) Count the Ep, At, & Act in 3.99 m. radius plot that are taller than the Median Height of the Potentially Free Growing crop trees. Not FG Crop Tree Species Biogeoclimatic subzone/variant Sites Series Allowable countable broadleaf trees per 50 m2 plot (3.99 m. radius) Pli, Lw SBPS dc, mk, xc 5 SBS dw 1,2 Subxeric and drier 5 All other 2 Fdi, Pa, Pw All 3 Is the number of Ep, At & Act > the allowable from the table? Sw, Se, Sb, Sx BWBS mw 01,03,10,11 2 At, Act or 5 Ep Al other 5 All Other All 5 Yes No Note: When a survey unit contains more than one subzone or site series, use the lower countable broadleaf limit. When a plot contains more than the allowable aspen, birch, and/or cottonwood trees for a given species and biogeoclimatic subzone/site series, only the potentially free growing trees of that species will become not free growing. A crop tree that meets the required SP crop tree-to-brush ratio (and all other free growing criteria) is free growing regardless of the number of broadleaf trees in the 50 m2 plot. Figure 3.North Vegetation Competition Decision Key for a Free Growing Crop Tree Not FG FG 291
292 A 13.3 South (Southern Interior) Area FG Guidance 1) South Area Description The following TSA's are assessed according to guidelines described in Figure 4 (including all area based tenures within the gross areas of these TSA s, regardless of Forest District boundaries): Kamloops TSA; Merritt TSA; Lillooet TSA; Okanagan TSA; Golden TSA; Revelstoke TSA; Invermere TSA; Cranbrook TSA; Kootenay Lake TSA; Arrow TSA; Boundary TSA; Williams Lake TSA; Quesnel TSA; and 100 Mile TSA Approved Alternative for Williams Lake TSA; Quesnel TSA; 100 Mile TSA: o For sites in the SBPSmk, SBPSdc, SBSdw1, SBSdw2, IDFdk3, and IDFdk1 where NO brushing or broadleaf tree spacing activities have previously been carried out, the alternative guidance in Section A may be used. 292
293 Must: 1# Test Shrub/Herb 1. be Well Spaced 2. be Preferred or Acceptable Species - per SP, FDP or FSP 3. meet Damage Criteria 4. meet Minimum Height if in SP, FDP or FSP Is the Herb and/or Shrub vegetation taller than the crop tree in more than 1 quadrant? Yes Not FG No 2# Test Broadleaf At,Ep,Act No Is there Broadleaf Ep, At and/or Act vegetation within 1.0 m. of the crop tree (branches and/or foliage)? Yes Is ANY vegetation taller than the crop tree in more than one quadrant? No Yes FG Yes Does the crop tree meet the Conifer/Brush Ratio (considering Ep, At and/or Act only)? No Potentially FG 1) Determine all Potentially Free Growing crop trees & calculate Median Height; 2) Count the Ep, At, & Act in 3.99 m. radius plot that are taller than the Median Height of the Potentially Free Growing crop trees. Not FG Crop Tree Species Biogeoclimatic subzone/variant Sites Series Allowable countable broadleaf trees per 50 m2 plot (3.99 m. radius) Pli, Py, Lw IDF dk 1,2,3 Mesic and drier 5 SBPS dc, mk MSxv All 5 SBPS xc, IDF dk 4 All Non-deleterious(no cap) SBS dw 1,2 Subxeric and drier 5 All other All 2 Fdi, Pa, Pw All All 3 All Other All All 5 Ye s Is the number of Ep, At & Act > the allowable from the table? No Note: When a survey unit contains more than one subzone or site series, use the lower countable broadleaf limit. When a plot contains more than the allowable aspen, birch, and/or cottonwood trees for a given species and biogeoclimatic subzone/site series, only the potentially free growing trees of that species will become not free growing. A crop tree that meets the required SP crop tree-to-brush ratio (and all other free growing criteria) is free growing regardless of the number of broadleaf trees in the 50 m 2 plot. Figure 4.South Vegetation Competition Decision Key for a Free Growing Crop Tree Standard Guidance Not FG FG 293
294 A South Area Williams Lake, Quesnel and 100 Mile TSA's (SBPSmk, SBPSdc, SBSdw1, SBSdw2, IDFdk3, and IDFdk1 only) Alternative FG Guidance Acceptable alternative FG guidance, applied using a new survey procedure, is presented in this section for the following subzones/variants in the Williams Lake, 100 Mile, and Quesnel TSA's: SBPSmk, SBPSdc, SBSdw1, SBSdw2, IDFdk3, and IDFdk1 This alternative FG guidance (described in Figure 5) may be applied only on sites where there has been NO previous brushing or broadleaf tree spacing activity. The alternative FG guidance and survey procedure were developed by the Cariboo Region silviculture research section. All BEC subzones/variants and site series included in this section represent ecosystems where research and/or expert opinion have been used to revise thresholds for broadleaf retention to levels that are more biologically appropriate to conifer tolerances (and not in conflict with conifer growth objectives) than those used in previous guidelines. The new survey procedure is intended to simplify the current approach by eliminating the "potential free growing tree" concept. Significant changes to individual FG criteria used in the previous standard South Area guidelines are: The Conifer/Brush Ratio expressed as a percentage has been replaced with a Brush/Conifer Ratio expressed as a decimal. In the former guidelines, conifers meeting the Conifer/Brush Ratio had to be 150% or 125% (depending on BEC variant) taller than surrounding vegetation within a 1-m cylinder. With the new Brush/Conifer Ratio, broadleaf trees must be > 1.25 times the height of pine or > 1.5 times the height of other conifer species before they are counted as occupying quadrants within the 1-m cylinder or as countable stems. Previously, only one quadrant within the 1-m cylinder was allowed to be occupied by overtopping broadleaf trees. Now, 0, 1, or 2-adjacent quadrants are allowed to be occupied (2-opposite quadrants, 3 quadrants, and 4 quadrants are not acceptable). Allowable numbers of countable broadleaves have been adjusted, but are now assessed within a 1.8 m radius of individual crop conifers rather than within the 3.99 m plot (as described below). Using the new survey procedure (presented in Figure 5): Well-spaced trees are still selected in a 3.99 m plot using the same spacing, preferred or acceptable species, minimum height, and damage criteria used in the standard guidelines. Test #1 regarding overtopping Shrub and Herb vegetation is unchanged. The new survey procedure uses a neighbourhood concept as opposed to the potentially FG concept used in other Decision Keys in this Appendix. There are two tests included in the new survey procedure, and a well-spaced tree must meet BOTH criteria to be FG: o Occupied Quadrant Test within a 1.0 m radius around each crop conifer, the number of quadrants occupied by broadleaf vegetation exceeding the new Brush/Conifer Ratio is assessed. It is allowable for 0, 1 or 2-adjacent quadrants to be occupied. It is not acceptable for 2-opposite quadrants, 3 quadrants, or 4 quadrants to be occupied. 294
295 o Countable Broadleaf Test within a 1.8 m radius around each crop conifer, the number of countable broadleaf stems is tallied and must not exceed allowable densities (as defined by BEC subzone/variant, site series, and conifer species). The 1.8 m radius is measured horizontally outward from the conifer stem-centre at a height of 20 cm above ground. Making judgement calls for broadleaf trees at the periphery of the 1.8 m radius: For single broadleaf (At, Ep, Act) stems: the stem is considered to be "in" when its centre at ground level is visually judged, based on the horizontally held plot cord or tape, to fall within the 1.8 m radius. For broadleaf clumps, the number of countable stems is defined as described in Section , Figure 6c. For At stems that fork above the ground, the stem is considered to be "in" if the centre of the fork is visually judged, based on the horizontally held plot cord or tape, to fall within the 1.8 m radius. For Ep clumps originating from cut stumps, the clump is considered to be "in" if the centre of the cut stump is visually judged, based on the horizontally held plot cord or tape, to fall within the 1.8 m radius. The number of countable stems in the clump is defined in Section Table 1a. Countable broadleaf trees within 1.8 m of well-spaced conifers may fall outside the 3.99 m plot radius, and a single countable broadleaf tree may affect the status of more than one crop conifer where the 1.8 m radius circles overlap. If a well-spaced conifer meets BOTH the quadrant test and the countable broadleaf test it is FG. If it fails either test, it is NOT FG. A decision as to FG or not FG can therefore be made quickly, on a tree-by-tree basis. Explanatory notes With the new survey procedure, countable broadleaves are assessed only within a 1.8 m radius of each candidate well-spaced conifer. They are not assessed in the 3.99 m plot and there are no "potentially free growing trees". This eliminates the problem of having a clump of broadleaf trees on one side of the plot resulting in failure of trees as much as 7-8 m away. A 1.8 m radius circle covers approximately 10 m 2 and six well-spaced 1.8 m circles occupy approximately the same area as a 3.99 m plot (Figure 6). IMPORTANT: It is advisable for survey contractors to receive training prior to using the alternate FG guidance and the new survey procedure described in Section A
296 Must: 1. be Well Spaced 2. be Preferred or Acceptable Species - per SP, FDP or FSP 3. meet Damage Criteria 4. meet Minimum Height if in SP, FDP or FSP 1# Test Shrub/Herb Within 1-m of crop tree, is the Herb and/or Shrub vegetation taller than the crop tree in more than 1 quadrant? Yes Not FG No 2# Test Broadleaf At,Ep,Act Within 1.0 m of the crop tree, are 2 - opposite quadrants, 3 quadrants, or 4 quadrants occupied by broadleaf tree vegetation (branches and/or foliage)? For Pl: An occupied quadrant has broadleaf vegetation >1.25 times the crop tree height. For Sx, Fd, Bl, Sb: An occupied quadrant has broadleaf vegetation >1.5 times the crop tree height. Yes Not FG No Within a 1.8 m radius of the crop tree (measured horizontally from the conifer stem-centre at a height of 20 cm), is the # of countable broadleaf stems > the maximum allowed? (Using the table below per crop tree species) Yes No Not FG Crop Tree Species Pli (A countable broadleaf stem is >1.25 times the crop tree height) All Others (A countable broadleaf stem is >1.5 times the crop tree height) Biogeoclimatic subzone/variant Sites Series Allowable countable broadleaf trees per 1.8 m. radius around the crop tree 1 IDF dk 3 01, 02, 03, 04, 05, , 08, 09 1 IDF dk1 01,02,03,04, 3 05,06 1 SBPS dc, mk SBS dw 1,2 All 1 IDF dk 3 01, 02, 03, 04, 05, , 08, 09 1 IDF dk1 01,02,03,04 3 SBPS dc, mk SBS dw 1,2 05,06 1 All 1 Note: When a survey unit contains more than one subzone or site series, use the lower countable broadleaf limit. 1 For the countable stem assessment this definition applies to broadleaf stems within 1.8 m (measured horizontally from the crop conifer-stem centre at a height of 20 cm). The 1.8 m radius may extend beyond the perimeter of the 3.99 m radius plot and a single broadleaf tree may be countable within more than one 1.8 m radius. Figure 5: Williams Lake, Quesnel, and 100 Mile TSAs Vegetation Competition Decision Key for a Free Growing Crop Tree using alternative guidelines for SBPSmk, SBPSdc, SBSdw1, SBSdw2, IDFdk3, and IDFdk1 (only on sites where there has been NO previous brushing or broadleaf tree spacing activity). 296 FG
297 1.8 m PL PL 3.99 m PL PL PL PL Figure 6: Example of what six 1.8 m radius neighborhoods around well-spaced trees in a 3.99 m radius plot look like. 297
298 Appendix 14: Guidance Matrix for reporting Retention Openings into RESULTS RETENTION OPENINGS with > 5 m 2 / ha. Basal Area Retention Silviculture Survey Manual Guidance Section referenced below in red Treed Retention Submission into RESULTS Guidance (ii) Section referenced below in red Steps a or 4b 1a Conifer Management Regime Obligation Timber Priority i) Single Entry Even Aged Multiple Entry Uneven-Aged ii) Single Tree Selection Planned &/or Resultant Stand Structure Sec 1.2 Complex Vertical Structure Dispersed Retention 3 - Low BA only < 10m 2 Interior Complex Vertical Structure Dispersed Retention IDF only iii) Group Selection Complex Horizontal Structure Group Retention 4 Clear Cut Openings 1 Stand Structure Example Illustrations Photo Images 1 Photo Images 2 Recommended Survey Methodology Layered Sec Multi-storey Sec Clearcut Method Sec 7 & 8 Long Term Retention 5 Reserves Sec 4.1 Dispersed Sec & Short Term Retention 6 part of a Silv System Sec 4.2 Unharvested Stems Sec Single Tree Sec Group Selection Sec
299 iv) Group Selection Complex Horizontal Structure Group Retention Small Patch Edge Effect 2 Photo Images 3 1b Obligation Non-Timber Priority i) Single Entry Even -Aged Multiple Entry Uneven-Aged ii) Single Tree Selection Complex Vertical Structure Dispersed Retention < 20 m 2 Interior < 40 m 2 Coast Complex Vertical Structure Dispersed Retention (IDF only iii) Group Selection Complex Horizontal Structure Group Retention 1c No Regen Obligation 20 m 2 Interior 40 m 2 Coast i) Intermediate Cut, (WF Interface & Ecosystem Restoration) ii) Commercial Thin Complex Horizontal Structure Dispersed Retention Complex Horizontal Structure Dispersed Retention Photo Images 4 Photo Images 5 Photo Images 6 Small Scale Openings Method Sec SEDRSS or DFP Sec Multi-storey Sec Clearcut Method Sec 7 & 8 OR Small Scale Opening Sec Commercial Thin Sec Commercial Thin Sec Dispersed Sec & Group Selection Sec Unharvested Stems Sec Single Tree Sec Group Selection No Regen Objectives Sec No Regen Objectives Sec Photo Images 7 299
300 Footnotes: 1) Definition of Clearcut: Openings are at least two tree heights in width (i). 2) Definition of Edge Effect: Is the forest influence (where openings are less than two tree heights in width, but > 10 m in wide) that occurs along the forest edge and produces an intermediate (or modified) microclimate (i). 3) Definition of Dispersed Retention: Residual treed portions with usually individually separated stems and are not independently mapped (< 0.25 ha. If aggregated)(ii). 4) Definition of Grouped Retention: Unharvested residual treed patches of aggregated individuals that are mappable ( 0.25 ha.) (ii). 5) Definition of Long term Residuals: Residual trees with a reserve objective code other than Timber (i.e. WTP or CMT) and not available for a subsequent harvest entry until after the next rotational planning cycle referred to as reserves (ii). 6) Definition of Short term Residuals: Residual trees with a reserve objective code of only Timber and available for a subsequent harvest entry prior to the end of the current rotational planning cycle (whether or not they are actually harvested) referred to as retention (ii). (i) Silviculture Systems Handbook of BC - MoF


301 Photo Images 1 Obligation Timber Priority Single Entry Even Aged Complex Vertical Structure - Dispersed Retention 301
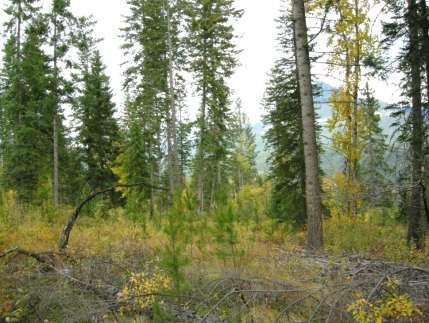
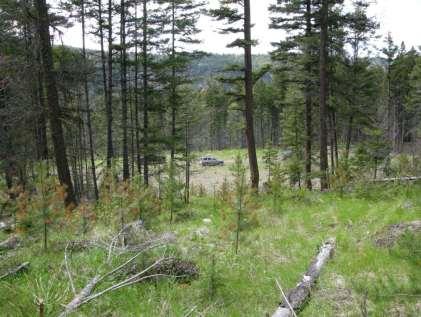

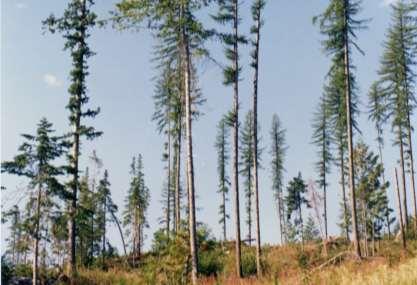
302 302


303 Photo Images 2 Obligation Timber Priority Multiple Entry Uneven-Aged Single Tree Selection Complex Vertical Structure - Dispersed Retention - IDF only 303


304 Photo Images 3 Obligation Timber Priority Multiple Entry Uneven-Aged Group Selection Complex Horizontal Structure - Group Retention Small Patch Edge Effect 304


305 Photo Images 4 Obligation Non-Timber Priority Single Entry Even-Aged Complex Vertical Structure - Dispersed Retention Coastal SEDRSS 305


306 Interior DFP 306


307 Photo Images 5 Obligation Non-Timber Priority Multiple Entry Uneven-Aged Group Selection Complex Horizontal Structure - Group Retention - Clear Cut Openings 307


308 Photo Images 6 No Regen Obligation Intermediate Cut Complex Horizontal Structure - Dispersed Retention 308


309 Photo Images 7 No Regen Obligation Commercial Thinning Complex Horizontal Structure - Dispersed Retention 309
Basic Silviculture Survey Training Dave Weaver RPB. Live Meeting Course May 31, 2011
 Basic Silviculture Survey Training Dave Weaver RPB Live Meeting Course May 31, 2011 Summer 2008 Silviculture Survey Training Session Topics A. SURVEY FUNDAMENTALS 1. Survey Definition & Legal Context Strat.
How the use of the term free growing in British Columbia is linked to harvest date and assessment date
 How the use of the term free growing in British Columbia is linked to harvest date and assessment date Prepared by Allan Powelson, Forest Practices and Investment Branch The term free growing in British
Rocky Mountain Forest District Partial Cutting Stocking Standards
 Rocky Mountain Forest District Partial Cutting Stocking Standards vember 5, 2004 Table Of Contents Table Of Contents...i List Of Tables...i List Of Figures...i 1. Preamble...1 2. Additional Partial Cutting
Last Updated Spring 2015 Resource Practices Branch Ministry of Forests, Lands& Natural Resource Operations
 The Silviculture Survey Accreditation Process Last Updated Spring 2015 Resource Practices Branch Ministry of Forests, Lands& Natural Resource Operations For more information on silviculture surveys; http://www.for.gov.bc.ca/hfp/silviculture/silviculture_surveys.html
Instructions for Printing the Final Copy of the WLP without Hidden Text. HIDDEN TEXT FORMATTING 1 View or Hide Hidden Text viewed on the screen only.
 Woodlot Licence Plan Template November 15 2007 Version Instructions: (Delete this page before submitting the WLP) This Woodlot Licence Plan (WLP) template has been prepared in Word / XP. Blue italicized
Executive Summary C Province of British Columbia
 FOREST PRACTICES BRANCH 2002 Summary of Backlog NSR, Impeded, and Free Growing Forest Land Total area of B.C. 96 million hectares Productive forest land 45 million hectares Pre-1987 NSR 0.10 million hectares
2 Cruise Design. April 15, 2015 Amendment No
 Timber Pricing Branch Quality Assurance 2 Cruise Design April 15, 2015 Amendment No. 3 2-1 Cruising Manual Ministry of Forests, Lands and NRO 2.1 Cruise Objective The objective of the timber cruise is
Fort St. John Pilot Project. December 20, Page 1 of 14
 Fort St. John Pilot Project Management Strategy December 20, 2005 Page 1 of 14 TABLE OF CONTENTS I. STRATEGY OBJECTIVES 3 II. BACKGROUND 3 III. CLASSIFYING AND TRACKING FOREST TYPES 6 A. Initial Cutblock
FRPA GENERAL BULLETIN
 Forest and Range Practices Act FRPA GENERAL BULLETIN Number 9 October 3, 2005 Introduction Managing Visual Resources The purpose of this bulletin is to provide District Managers and resource professionals
Timber Harvesting and Fishing Lodge Interests near Morrison Arm
 Timber Harvesting and Fishing Lodge Interests near Morrison Arm Complaint Investigation 000284 FPB/IRC/59 January 2002 Table of Contents The Investigation... 1 Background... 1 Relevant Legislation... 2
5 Ministry of FLNR Map Area
 Timber Pricing Branch Ministry of FLNR Map Area Statement 5 Ministry of FLNR Map Area Statement (FS 121) The Map Area Statement consists of required and optional information to be entered into the compilation
Multi-Storey Silviculture Survey COURSE WORKBOOK MARCH 2008
 Multi-Storey Silviculture Survey COURSE WORKBOOK MARCH 2008 ACKNOWLEDGEMENTS This version of the Multi-Storey Silviculture Survey Course Workbook was updated by John Wallis, RPF, Wallis Environmental Consultants
South Island District Woodlot Woodlot Licence W1632 FPB/ARC/162
 Audit of Forest Planning and Practices South Island District Woodlot Woodlot Licence W1632 FPB/ARC/162 February 2014 Table of Contents Board Commentary...1 Audit Results...3 Background...3 Audit Approach
Audit of Forest Planning and Practices
 Audit of Forest Planning and Practices TimberWest Forest Corporation Tree Farm Licence 47 FPB/ARC/174 February 2015 Table of Contents Audit Results...1 Background...1 Audit Approach and Scope...2 Planning
RESOURCES PRACTICES BRANCH
 RESOURCES PRACTICES BRANCH Silviculture Facts Summary Charts and Graphs March 216 Data Sources This publication s sourced data is based on primarily Reporting Silviculture Updates and Land Status Tracking
Explanation of the Forest Planning and Practices Regulation Amendments to Protect Secondary Structure
 Explanation of the Forest Planning and Practices Regulation Amendments to Protect Secondary Structure Background Research in Kootenay National Park (Shrimpton, 1994), has documented that where mountain
STOCKING STANDARDS DISCUSSION PAPER
 STOCKING STANDARDS DISCUSSION PAPER THIS MATERIAL ACCOMPANIES THE WFP FSP COVERING PORTIONS OF WEST ISLAND AND CAMPBELL RIVER TIMBERLAND REGIONS, BUT DOES NOT FORM A PART OF THE FSP DECEMBER 20-2006 Supporting
Species Composition and Regeneration in Cutblocks in Mountain Pine Beetle Areas
 Species Composition and Regeneration in Cutblocks in Mountain Pine Beetle Areas Special Investigation FPB/SIR/15 October 2006 Acknowledgements The Board acknowledges the work of Steve Chatwin, Bryce Bancroft
Lillooet Forest District. Inventory Plan
 Lillooet Forest District Inventory Plan MINISTRY OF FORESTS RESOURCES INVENTORY BRANCH JUNE 1998 Table of Contents 1. INTRODUCTION...1 1.1 Background...1 1.2 Objectives...2 2. BUSINESS CONSIDERATIONS...3
FRPA GENERAL BULLETIN
 Forest and Range Practices Act FRPA GENERAL BULLETIN Number 8 Updated December, 2011 Wildlife Tree Retention: Guidance for District and Licensee staff Introduction This document provides guidance regarding
Ndazkhot en Forest Management Ltd. Forest Licences A65926 and A81934 FPB/ARC/159
 Audit of Forest Planning and Practices Ndazkhot en Forest Management Ltd. Forest Licences A65926 and A81934 FPB/ARC/159 December 2013 Table of Contents Audit Results...1 Background...1 Audit Approach and
Species Composition and Regeneration in Cutblocks in Mountain Pine Beetle Areas
 Species Composition and Regeneration in Cutblocks in Mountain Pine Beetle Areas Special Investigation FPB/SIR/15 October 2006 Acknowledgements The Board acknowledges the work of Steve Chatwin, Bryce Bancroft
SD409.E '56' C
 This Forest Practices Code Guidebook is presented for information only. It is not cited in regulation. The Forest and Range Practices Act and its regulations took effect on Jan. 31, 2004. This replaced
SUBMITTING FOREST COVER TO RESULTS FOR OPENINGS WITH TREED RETENTION
 Ministry of Forests, Lands and Natural Resource Operations SUBMITTING FOREST COVER TO RESULTS FOR OPENINGS WITH TREED RETENTION Edition 1.4 May 5, 2016 Acknowledgments The assistance of the following individuals
5 Ministry of FLNR Map Area
 Timber Pricing Branch Ministry of FLNR Map Area Statement 5 Ministry of FLNR Map Area Statement (FS 121) The Map Area Statement consists of required and optional information to be entered into the compilation
Draft Report. Innovative Silviculture Surveys in the Fort St John Code Pilot Project. March 31, 2004
 Draft Report Innovative Silviculture Surveys in the Fort St John Code Pilot Project March 31, 2004 1 Introduction The Fort St. John (FSJ) TSA is a Forest Practices Code Pilot Project Area. In the fall
FFT Ministry Survey Standard March 4, 2009
 Ministry of Forests and Range FFT Ministry Survey Standard March 4, 2009 These standards apply, in addition to the General Standards for Ministry Funded Programs (FS 1001), to all survey activities funded
Trends in Silviculture in B.C. ( )
") Forests Trends in Silviculture in B.C. (1970-2012) Silviculture is the practice of growing and cultivating trees in forests to meet certain objectives, such as timber production, biodiversity, wildlife
Forests Trends in Silviculture in B.C. (1970-2012) Silviculture is the practice of growing and cultivating trees in forests to meet certain objectives, such as timber production, biodiversity, wildlife
Audit of Forest Planning and Practices Community Forest Agreement K4B and Audit of Silviculture Obligations Tree Farm Licence 42. Tanizul Timber Ltd.
 Audit of Forest Planning and Practices Community Forest Agreement K4B and Audit of Silviculture Obligations Tree Farm Licence 42 Tanizul Timber Ltd. FPB/ARC/187 April 2016 Table of Contents Audit Results...
LAND BASED INVESTMENT STRATEGY. Current Reforestation Assessment Maintenance of Existing Investments in the Forests for Tomorrow Program
 LAND BASED INVESTMENT STRATEGY Current Reforestation Assessment Maintenance of Existing Investments in the Forests for Tomorrow Program SUMMARY Introduction The Ministry of Forests, Lands and Natural Resource
Windthrow of Trees in the Walbran Valley
 Windthrow of Trees in the Walbran Valley Complaint Investigation 020425 www.fpb.gov.bc.ca FPB/IRC/95 April 2004 Table of Contents The Investigation... 1 The Complaint...1 Background... 1 Discussion...
Executive Summary SD146.B7S C Province of British Columbia
 Executive Summary National Library of Canada Cataloguing in Publication Data Main entry under title: Summary of backlog NSR and impeded forest land. 2001 Irregular. Title from cover. Co-published by: Forest
Woodlot Licence Site Plan Template
 Woodlot Licence Site Plan Template Template Availability Copies of this template on paper or in electronic formats (Word for Windows v. 7.0 or lower) can be obtained from the Woodlot Staff at Ministry
Vegetation Resources Inventory Localization Procedures
 Vegetation Resources Inventory Localization Procedures Prepared by Resource Information Branch Ministry of Sustainable Resource Management For the Resources Information Standards Committee March 2005 Version
A Review and Analysis of the Effect of BC s Current Stocking Standards on Forest Stewardship
 A Review and Analysis of the Effect of BC s Current Stocking Standards on Forest Stewardship Commissioned Paper April 2009 Prepared for: ABCFP Stewardship Advisory Committee Prepared by: Jeff McWilliams,
RESULTS INFORMATION SUBMISSION SPECIFICATIONS. Form and Manner of Reporting
 Ministry of Forests, Lands and Natural Resource Operations RESULTS INFORMATION SUBMISSION SPECIFICATIONS Form and Manner of Reporting (Woodlot Licensee Submissions) 3nd Edition February 24, 2016 2 Foreword
of BRITISH COLUMBIA Green-up Guidebook Second edition
 of BRITISH COLUMBIA Green-up Guidebook Second edition January 1999 of BRITISH COLUMBIA Green-up Guidebook Second edition January 1999 Authority Forest Practices Code of British Columbia Act Operational
Sample design for the 2002 pilot of Riverside s new approach to silviculture obligations
 Sample design for the 2002 pilot of Riverside s new approach to silviculture obligations To successfully pilot Riverside s proposed approach to regulating silviculture obligations on the TFL 49 Results-based
2014 Managed Forest Inspection Program
 2014 Managed Forest Inspection Program BACKGROUND The Managed Forest Council (Council) has a policy to inspect all managed forests at least once every five years, as well as to inspect new managed forests
ORDER UNGULATE WINTER RANGE U NORTHERN CARIBOU AND STONE S SHEEP Fort St John and Fort Nelson Timber Supply Area
 ORDER UNGULATE WINTER RANGE U-9-005 NORTHERN CARIBOU AND STONE S SHEEP Fort St John and Fort Nelson Timber Supply Area This order is given under the authority of sections 9(2) and 12(1) of the Government
Outdoor Recreation and the Forests & Range Practices Act.
 Outdoor Recreation and the Forests & Range Practices Act. Forest Practices Branch Range and Integrated Resources Section March 2005 Outdoor Recreation and the Forest and Range Practices Act - March 17,
Baseline Datasets for Evaluating Wildlife Tree Patches
 FRPA Resource Evaluation Program Scientifically Valid Evaluations of Forest Practices under the Forest and Range Practices Act Baseline Datasets for Evaluating Wildlife Tree Patches Introduction In November
Sustainable Forest Management Plan. Appendix 6: Reforestation Strategy Stocking Standards and Crop Tree Requirements
 Appendix 6: Reforestation Strategy Stocking Standards and Crop Tree Requirements Appendix 6- Reforestation Strategy Stocking Standards and Crop Tree Requirements 1.1 Introduction The Landscape Level Reforestation
Sunshine Coast Timber Supply Area
 Sunshine Coast Timber Supply Area Vegetation Resources Inventory Photo Interpretation Project Implementation Plan PREPARED BY: GERRY SOMMERS & WARREN NIMCHUK ISSUED: AUGUST 2005 REVISED: MARCH 2006 1.
Harvesting of Young Stands in BC
 Harvesting of Young Stands in BC SPECIAL INVESTIGATION MAY 2018 FPB/SIR/48 TABLE OF CONTENTS GLOSSARY OF TERMS i EXECUTIVE SUMMARY 1 INTRODUCTION 3 BACKGROUND 4 How are minimum harvest criteria determined?...
Forest Health Program
 Forest Health Program June 2007 www.for.gov.bc.ca/ hfp/health/ Library and Archives Canada Cataloguing in Publication Data British Columbia. Forest Health Program. Forest Health Program ISBN 978-0-7726-5814-2
Growth Intercept Method for Silviculture Surveys
 Growth Intercept Method for Silviculture Surveys AUGUST 1995 Canada CANADA-BRITISH COLUMBIA PARTNERSHIP AGREEMENT ON FOREST RESOURCE DEVELOPMENT: FRDA II BC Growth Intercept Method for Silviculture Surveys
Forest Stewardship Action Plan for Climate Change Adaptation
 Forest Stewardship Action Plan for Climate Change Adaptation 2012-2017 February 27, 2012 Forest Stewardship Action Plan for Climate Change Adaptation 2012 2017 Table of Contents Executive Summary... 1
FOREST STEWARDSHIP PLAN 2016
 FOREST STEWARDSHIP PLAN 2016 Forest Operations of A&A Trading Ltd. and Klahoose Forestry Limited Partnership Sunshine Coast Timber Supply Areas Forest License A19229, A80590 & A84120 Version 1.1 November
Using Stand Development Monitoring to Develop Hazard Ratings and Inform Stocking Decisions in the Thompson Okanagan and Cariboo Regions.
 Using Stand Development Monitoring to Develop Hazard Ratings and Inform Stocking Decisions in the Thompson Okanagan and Cariboo Regions David Rusch Hazard Ratings Forrex SEDAs Forest Health Strategies
Vegetation Resources Inventory
 Vegetation Resources Inventory Guidelines for Preparing a Project Implementation Plan for Ground Sampling Prepared by Ministry of Sustainable Resource Management Resource Information Branch For the Terrestrial
Annual Status of Reforestation in Alberta Report 2016
 2016 November 6,2017 Agriculture and Forestry 2015-2016 Table of Contents What is this report about? 3 What is reforestation? 4 Why reforest? 5 What does the law require? 5 How is the status of reforestation
Preamble. Objectives October 20, 2004 page 1 of 13
 Preamble This order establishes landscape biodiversity objectives, across the Prince George Timber Supply Area, for: A. old forest retention; B. old interior forest; and, C. young forest patch size distribution.
The Forest Resources Management (Saskatchewan Environmental Code Adoption) Regulations
 Regulations") FOREST RESOURCES MANAGEMENT 1 CODE ADOPTION) F-19.1 REG 11 The Forest Resources Management (Saskatchewan Environmental Code Adoption) Regulations being Chapter F-19.1 Reg 11 (effective January 5, 2015).
FOREST RESOURCES MANAGEMENT 1 CODE ADOPTION) F-19.1 REG 11 The Forest Resources Management (Saskatchewan Environmental Code Adoption) Regulations being Chapter F-19.1 Reg 11 (effective January 5, 2015).
Possible Partial Cut Stocking Standards Examples with Application to Salvage areas. Ken Zielke and Bryce Bancroft, Symmetree Consulting Group Ltd.
 Possible Partial Cut Stocking Standards Examples with Application to Salvage areas Ken Zielke and Bryce Bancroft, Symmetree Consulting Group Ltd. Scenario #1 Proposed Overstory Standard : Min. - 16 m 2
South Island District Woodlots Woodlot Licences W0011, W0020, W1479, W1526, W1713, W1902, W1903, W1906 FPB/ARC/158
 Audit of Forest Planning and Practices South Island District Woodlots Woodlot Licences W0011, W0020, W1479, W1526, W1713, W1902, W1903, W1906 FPB/ARC/158 December 2013 Table of Contents Audit Results...1
Tactical Plan 100 Mile House TSA
 Tactical Plan 100 Mile House TSA Version 2.0 Prepared by: Forest Ecosystem Solutions Ltd 227 998 Harbourside Drive North Vancouver, BC V7P 3T2 604-998-2222 amakitalo@forestecosystem.ca Prepared for: BC
Policy and Administration
 Timber Pricing Branch 1 July 15, 2011 Amendment No. 19 1-1 Provincial Logging Residue & Waste Measurement Procedures Manual FLNRO 1.1 Waste Assessment Policy Figure 1-1 Waste Assessment Policy. 1-2 Amendment
Preamble. Objectives October 20, 2004 page 1 of 13
 Preamble This order establishes landscape biodiversity objectives, across the Prince George Timber Supply Area, for: A. old forest retention; B. old interior forest; and, C. young forest patch size distribution.
Mule Deer Winter Range Planning. Current And Future Forest Condition Pilot Project. Submitted to:
 Mule Deer Winter Range Planning Current And Future Forest Condition Pilot Project Submitted to: Ministry of Sustainable Resource Management Cariboo Region March, 2003 FIRS Project # 1029-16 Professional
Values, Objectives, Indicators and Targets
 Values, Objectives, Indicators and Targets 2007 2017 Forest Management Plan for FMA 0200041 May 31, 2007 Prepared by: The Forestry Corp. May 31, 2007 Values, Objectives, Indicators and Targets 2007 2017
Provincial Wildlife Tree Policy and Management Recommendations
 Provincial Wildlife Tree Policy and Management Recommendations This document was compiled by Forest Practices Branch of the Ministry of Forests and Habitat Branch of the Ministry of Environment, Lands
An Example of Long-Form Audit Reporting
 An Example of Long-Form Audit Reporting Special Report www.fpb.gov.bc.ca FPB/SR/15 May 2003 Introduction The Forest Practices Board is changing its approach to compliance audits of certified forest licensees.
2.0 APPLICATION, TERM AND COMMENCEMENT OF TERM OF THIS FSP...
 TABLE OF CONTENTS TABLE OF CONTENTS... 1 1.0 INTRODUCTION... 3 1.1 FOREST STEWARDSHIP PLAN... 3 2.0 APPLICATION, TERM AND COMMENCEMENT OF TERM OF THIS FSP... 5 2.1 APPLICATION OF THIS FSP (FRPA SECTION
Reforestation Standard of Alberta
 Effective to April 30, 2018 Effective: 1 May, 2017 Page 1 of 315 Alberta Agriculture and Forestry Forestry Division Forest Management Branch 7th Floor, Great West Life Building 9920 108 Street Edmonton,
Forest Stewardship Plan Tree Farm License 58
 2017 2022 Tree Farm License 58 A&A Trading (Haida Gwaii) Ltd. 1210-1111 Melville Street Vancouver, British Columbia, V6E 3V6 Authorized Licensee Signature: Name: Marty Locker, R.P.F. Operations Manager
KOOTENAY-BOUNDARY HIGHER LEVEL PLAN ORDER
 KOOTENAY-BOUNDARY HIGHER LEVEL PLAN ORDER ORDER ESTABLISHING RESOURCE MANAGEMENT ZONES AND RESOURCE MANAGEMENT ZONE OBJECTIVES WITHIN THE AREA COVERED BY THE KOOTENAY-BOUNDARY LAND USE PLAN AS A HIGHER
Implementation of Biodiversity Measures under the Forest Practices Code
 Implementation of Biodiversity Measures under the Forest Practices Code Implications for the Transition to the Forest and Range Practices Act Special Report www.fpb.gov.bc.ca FPB/SR/17 March 2004 Executive
Silviculture Treatments for Ecosystem Management in the Sayward
 Silviculture Treatments for Ecosystem Management in the Sayward Progress Report: STEMS 2 Elk Bay Regeneration and Windthrow after 3 Years Louise de Montigny Research Branch BC Ministry of Forests and Range
Forest Stewardship Plan Tree Farm License 58, Forest License A16870 and Timber License T0184
 A & A TRADING LTD Forest Stewardship Plan 2018-2023 Tree Farm License 58, Forest License A16870 and Timber License T0184 Consolidated version for communication purposes only 1 1210-1111 Melville Street
Skeena Region. Small Scale Salvage Guidelines
 Small Scale Salvage Guidelines September 2017 Ministry of Forests, Lands and Natural Resource Operations Small Scale Salvage Guidelines Provincial Guidelines... 1 Purpose... 1 Professional Applications...
Forest Management Branch Directive
 SUSTAINABLE RESOURCE DEVELOPMENT Forest Management Branch Directive Directive No. 2005-1 Date April 7, 2006 Subject Regeneration Stratum Declarations and Allowable Cut Adjustments Purpose To provide procedures
The hectares spaced have increased by more than two and one-half times since 1981/82.
 2.2 Stand Tending 2.2.1 Spacing Spacing (ha) on Crown land from 81/82 to 97/98, by region Year Cariboo Kamloops Nelson P. George P. Rupert Vancouver TOTALS 81/82 2 110 1 269 1 157 795 1 323 12 017 18 671
AAFMP Reforestation Webinar March 26, Reforestation. Created by: Lee Martens, MSc RPF (#885) Presented by: Andy Shandro RPF (#561)
 Presented by: Andy Shandro RPF (#561)") AAFMP Reforestation Webinar March 26, 2018 1 Reforestation Created by: Lee Martens, MSc RPF (#885) Presented by: Andy Shandro RPF (#561) Overview 2 Reforestation obligation (TMR) 1 Reforestation standard
AAFMP Reforestation Webinar March 26, 2018 1 Reforestation Created by: Lee Martens, MSc RPF (#885) Presented by: Andy Shandro RPF (#561) Overview 2 Reforestation obligation (TMR) 1 Reforestation standard
RESULTS BUSINESS VIEW OVERVIEW. Version 1
 RESULTS BUSINESS VIEW OVERVIEW Version 1 November 29, 2008 Table of Contents 1. RESULTS Business Views... 1 1.1 Outline of RESULTS Views... 1 2. Scope of RESULTS... 4 2.1 Major Licensee & BCTS... 4 2.2
FRPA ADMINISTRATION BULLETIN
 Forest and Range Practices Act FRPA ADMINISTRATION BULLETIN Number 16 January 4, 2016 Interpretive Guidance Respecting the Extension of Woodlot Licence Plans Forest and Range Practices Act (FRPA) bulletins
Regional Mule Deer Winter Range Strategy
 1 Cariboo-Chilcotin Land Use Plan Regional Mule Deer Winter Range Strategy INFORMATION NOTE #2 Prepared by: Mule Deer Winter Range Strategy Committee Guidance for MDWR General Wildlife Measure Exemption
Timber Salvage Harvesting and Fisher Management in the Nazko Area. Complaint Investigation #16037
 Timber Salvage Harvesting and Fisher Management in the Nazko Area Complaint Investigation #16037 FPB/IRC/217 October 2018 Table of Contents Board Commentary... i Executive Summary... ii Introduction...
Atco Wood Products Ltd. SFI Surveillance Audit July 2015
 Atco Wood Products Ltd. SFI Surveillance Audit July 2015 On July 6 & 7, 2015 an audit team from KPMG Performance Registrar Inc. (KPMG PRI) carried out an SFI surveillance audit of the Atco Wood Products
TABLE OF CONTENTS 5.0 FOREST MANAGEMENT PLANNING...
 TABLE OF CONTENTS 5.0 FOREST MANAGEMENT PLANNING... 1 5.1 Planning Framework... 1 5.1.1 Sustainable Forest Management Planning... 1 5.1.2 Five-Year Operating Plan... 1 5.1.3 Annual Operating Plans... 3
Table and Column Definitions Report
 Table and Column Definitions Report Filename: C:\Documents and Settings\tmurray\DAQR0005.pdf Run by: TPMURRAY Report Date: June 26, 2008 09:50 AM Total Pages: 49 Total Tables / Views / Materialized Views:
Forest Appeals Commission
 Forest Appeals Commission Fourth Floor 747 Fort Street Victoria British Columbia Telephone: (250) 387-3464 Facsimile: (250) 356-9923 Mailing Address: PO Box 9425 Stn Prov Govt Victoria BC V8W 9V1 APPEAL
6 Stump Cruising. April 1,
 Timber Pricing Branch Stump Cruising 6 Stump Cruising April 1, 2017 6-1 Cruising Manual Ministry of Forests, Lands and NRO 6.1 Introduction The methods described in this chapter are prioritised by safety
UPDATE NOTE # 9 Strategy for Management of Mature Seral Forest and Salvage of Mountain Pine Beetle- Killed Timber Within TFLs in the Cariboo
 Carriiboo--Chiillcottiin Land Usse P llan Regional Biodiversity Conservation Strategy Prepared by: Biodiversity Conservation Strategy Committee UPDATE NOTE # 9 Strategy for Management of Mature Seral Forest
Chief Forester s Standards for Seed Use Training Session
 Chief Forester s Standards for Seed Use Training Session Date: April 20, 2011 Time: 1:30 to 3:30 pm Video: via Live Meeting Audio: Conference Call: 1-877-353-9184 ID: 8975849# What are the Chief Forester
Provincial Timber Management Goals, Objectives & Targets Management Unit Targets GBR North TSA
 Volume (m 3 ) Overview Timber Volume Flow Over Time Provincial Timber Management Goals, Objectives & Targets Management Unit Targets To make provincial goals and objectives a reality, local timber management
Resource Stewardship Monitoring Framework
 Scientifically Valid Evaluations of Forest Practices under the Forest and Range Practices Act Resource Stewardship Monitoring Framework For the most current version of this document, please consult the
Scope of Practice for Registered Forest Technologists. November GUIDELINEs
 Scope of Practice for Registered Forest Technologists November 2010 GUIDELINEs Contents Background 3 Overview 4 Legislative Framework 5 The Roles of Registered Forest Technologists in the Forestry Team
Audit of Forest Planning and Practices. Small Business Forest Enterprise Program Sunshine Coast Forest District FPB/ARC/28
 Audit of Forest Planning and Practices Small Business Forest Enterprise Program Sunshine Coast Forest District FPB/ARC/28 October 2000 Table of Contents A. Report from the Board B. Report from the Auditor
Block Planning and Plot Layout 4
 Block Planning and Plot Layout 4 A good survey plan is essential to an efficient waste survey. April 1, 2007 Amendment No. 7 4-1 Prov. Log. Residue & Waste Measure. Proced. Manual Ministry of Forests and
Extension Note. Clumpy Spacing Juvenile Spacing Douglas-fir into Clumps to Imitate Natural Stand Structure. February 1999.
 32 Extension Note February 1999 Clumpy Spacing Juvenile Spacing Douglas-fir into Clumps to Imitate Natural Stand Structure Ministry contact: Harold Armleder B.C. Ministry of Forests Cariboo Forest Region
WOODLOT LICENCE W1900 WOODLOT LICENCE PLAN TERM 10 YEARS. August, 2007 to August, 2017
 WOODLOT LICENCE W1900 WOODLOT LICENCE PLAN TERM 10 YEARS August, 2007 to August, 2017 Campbell River Indian Band 1400 Weiwaikum Road Campbell River, B.C. V9W 5W8 Phone: (250) 286-6949 Fax: (250) 286-8838
Coast Region FRPA Implementation Team Forest Stewardship Plan Extension Business Process and Guidance
 Coast Region FRPA Implementation Team Forest Stewardship Plan Extension Business Process and Guidance File: ARCS-00202-20/61408F Objective Provide clear understanding of steps to be taken in preparing,
Sustainable Volume Grade 4 Credit Limit Guidebook
 FOREST TENURES BRANCH Sustainable Volume Grade 4 Credit Limit June 1, 2015 Version 1.0 Ministry of Forests, Lands and Natural Resource Operations Disclaimer This document contains material to assist with
Vegetation Resources Inventory
 Vegetation Resources Inventory Ground Sampling Quality Assurance Procedures Prepared by Ministry of Forests Resources Inventory Branch for the Terrestrial Ecosystem Task Force Resources Inventory Committee
This Notice applies to the Squamish Forest District. Schedule 1. 1) Marbled Murrelet (Brachyramphus marmoratus) Amount:
 Marbled Murrelet (Brachyramphus marmoratus) Amount:") December 30, 2004 NOTICE INDICATORS OF THE AMOUNT, DISTRIBUTION AND ATTRIBUTES OF WILDLIFE HABITAT REQUIRED FOR THE SURVIVAL OF SPECIES AT RISK IN THE SQUAMISH FOREST DISTRICT This Notice is given under
December 30, 2004 NOTICE INDICATORS OF THE AMOUNT, DISTRIBUTION AND ATTRIBUTES OF WILDLIFE HABITAT REQUIRED FOR THE SURVIVAL OF SPECIES AT RISK IN THE SQUAMISH FOREST DISTRICT This Notice is given under
Stand Management Prescription Guidebook
 of BRITISH COLUMBIA Stand Management Prescription Guidebook Second edition March 1999 Authority B.C. Ministry of Forests Act Forest Act Forest Practices Code of British Columbia Act Operational Planning
Armstrong Forest Independent Forest Audit. Management Unit Action Plan
 Armstrong Forest 2006-2011 Independent Forest Audit Management Unit Action Plan P a g e 1 Table of Contents Action Plan Submission Signature Page... 3 Prepared by:... 3 Reviewed by:... 3 Submitted by:...
SIBEC First and Second-generation Approximation Estimates: backgrounder
 SIBEC First and Second-generation Approximation Estimates: backgrounder Shirley Mah and Gord Nigh Province of British Columbia 2015 Contents 1 INTRODUCTION... 2 2 SITE INDEX EXPLAINED... 3 3 RELATIONSHIPS
Wildlife and Wildlife Habitat Inventory Planning to Meet Land-Based Program Planning Needs in British Columbia
 Wildlife and Wildlife Habitat Inventory Planning to Meet Land-Based Program Planning Needs in British Columbia Dennis A. Demarchi Wildlife Inventory Section, Resources Inventory Branch British Columbia