Report on Performance of ET Based Irrigation Controller. Prepared for the Cities of: Boulder, Greeley, and Longmont, Colorado
|
|
|
- Hector Atkins
- 5 years ago
- Views:
Transcription
 786-9691 (33) 786-8337 (fax) www.")
1 Report on Performance of ET Based Irrigation Controller Prepared for the Cities of: Boulder, Greeley, and Longmont, Colorado Analysis of Operation of WeatherTRAK Controller in Field Conditions During 22 April 23, 23 Submitted by: Aquacraft, Inc. Water Engineering and Management 279 Pine Street Boulder, CO 832 (33) (33) (fax)
2 ii
3 TABLE OF CONTENTS EXECUTIVE SUMMARY... iv INTRODUCTION... 1 STUDY DESCRIPTION... 1 Participants... 1 Overview of WeatherTRAK System... 3 Irrigation Study Sites... 4 Irrigated Area and Historical Water Use... 5 RESULTS... 7 Comparison of Irrigation Applications... 7 Cumulative Application Comparisons... 8 Percent of Potential Savings Captured... 9 Water and Cash Savings... 9 WeatherTRAK and Water Restrictions... 1 Problems SUMMARY Appendix A: Cumulative Applications vs. ET o s Appendix B: 3 Years Tracking Application versus ET o LIST OF TABLES Table 1: Irrigated area and landscape... 4 Table 2: Historical irrigation application rates for study sites... 6 Table 3: 22 Irrigation application with WeatherTRAK... 8 Table 4: Results from sites showing savings... 9 LIST OF FIGURES Figure 1: Summary of irrigation applications during vi Figure 2: Location of study sites... 2 Figure 3: Application rate at nine WeatherTRAK sites as percent of ETo... 5 Figure 4: Historical irrigation applications of eight sites as percent of ET o... 7 Figure 5: Irrigation application rates before and after WeatherTRAK installation... 8 Figure 6: Net water savings for seven study sites... 1 Figure 7: Historical usage versus drought restriction application rates iii
4 iv
5 EXECUTIVE SUMMARY The WeatherTRAK ET based irrigation controller consists of an irrigation controller unit linked to a network of local weather stations via pager technology. During this study the ET o data were downloaded by Aquacraft and then faxed to HydroPoint Data Systems in California. They then sent a signal to the individual controllers on a periodic basis and the controller adjusted the irrigation schedule, as appropriate, in order to insure the correct applications for the specific plant types in each zone of the system. In normal operations the data collection will be automated and future modifications will allow it to net out rainfall as well. Between 2 and 22, the cities of Boulder, Longmont, and Greeley, Colorado conducted a three year field study of the performance of the WeatherTRAK system in actual field use. There were 1 sites in the original study group; over the course of the study some dropped out and others were added. The study had two main goals: To determine whether the controllers functioned reliably, and whether the ET o control system could accurately match irrigation applications against ET o. Incidentally, we were able to determine how the system could use its communications facilities to send rain interrupts, percent reductions in applications and deal with the drought restrictions imposed during 22. In 22 the Colorado Front Range was in its third consecutive year of drought. With the 22 year being the most extreme year of the drought to date, all the cities in the study were on voluntary or mandatory watering restrictions during most of the irrigation season. In cases where the city required reduction of irrigation to a specific application target, either as a depth or percent of ET o, the WeatherTRAK was able to respond with no field adjustments. In the case where irrigation was limited to specific irrigation days it was necessary to reprogram the controller, but it was still able to water using ET o data. Figure 1 shows the results for the 7 full season accounts during 22. The first bar in this graph show the historical irrigation application for each customer, the second shows the application allowed by the WeatherTRAK, and the third shows the ET o. Of note is the fact that that five of the seven customers were historical under-irrigators. The WeatherTRAK was capable of watering less than ET o and meeting the historical operations in most cases. In only one site (SVS) did it apply more than the ET o, and we know at that site the occupants used the percent adjustment feature to provide a wetter environment, but even with their adjustments their application were still drastically lower than their historical pattern. v
6 9 8 7 Application (inches) ADA KER LEW SVS SOU CER SAR Historical Average Outdoor Use WeatherTRAK 22 ETo 22 (inches) Figure 1: Summary of irrigation applications during 22 Other important findings of the 22 study were: As a group, in 22, the nine active sites applied 66% of the ET o. The seven sites that were in operation the entire irrigation season applied 27.2 inches of water to their landscapes or 71% of ET o. As a group, the seven sites saved an average of 35, gal of water per site compared to their historical use. If only the four participants who saved significant amounts of water were included, their average annual savings were 64, gallons per site. This shows the greater savings potential if the program focuses on high users. The four participants that saved water with the WeatherTRAK system also saved an average of $19 per year in water charges. This was based on the weighted average water rates of $2.4 per kgal in effect in the three cities during 22. Some of the volunteer participants in the study were historically under irrigating. Consequently, it was not possible for the system to save them water. But, the WeatherTRAK system matched their historical performance. Most importantly, the system delivered the appropriate ET o information to the controllers with a high degree of reliability and with little or no user programming. The WeatherTRAK irrigation controller was able to respond to the different drought restrictions imposed by each individual city. As was the case during 21 the WeatherTRAK ET controller system operated with a high degree of reliability. The consultants made no routine visits to any of the sites to check them, so they were operating on their own. Only a single problem was reported that required a field visit. Also, the system for obtaining and transmitting the ET o data to the units in the field worked well. The field units successfully converted the ET o data into irrigation programs that matched applications to ET o based requirements. Finally, the system showed that with some modifications vi
7 it could meet the locally imposed drought restrictions. However, it worked best in systems that set application targets as a percentage of ET o rather than requiring specific scheduling of irrigation. In these cases the systems were able to respond precisely to the requests with no field modifications. vii
8 viii
9 INTRODUCTION In the spring of 2 the cities of Boulder, Longmont, and Greeley, Colorado began a small pilot study of the reliability and effectiveness of the WeatherTRAK ET signal controller. The purpose of this study was to document the performance of the system in actual field conditions at homes of volunteer customers. Due to delays in receiving the controllers, little data were collected during the 2 irrigation season and the test was extended through the 21 and 22 seasons. A total of ten customers had a WeatherTRAK unit installed by the middle of June 21, and water use data were collected throughout the 21 irrigation season. For the 22 irrigation season nine customers participated in the study. During the 22 irrigation season one of the study participants moved and dropped out of the study and one business participant was added. Historical analysis of the 22 irrigation year is based on a sample of seven participants where the WeatherTRAK irrigation controller was in operation the entire season. When possible the data from the nine participants was utilized. The purpose of this report is to provide the results of this study. STUDY DESCRIPTION Participants In 2 three Colorado cities: Boulder, Greeley and Longmont began the WeatherTRAK irrigation controller study. In 22 seven of the nine participants were single family residential customers. The St. Vrain Valley School District administration building and Boulder Public Radio, KGNU, were the institutional customers in the study. The City of Boulder had three residential customers and an institutional customer in the study; Greeley had three residential customers and Longmont had one residential customer and an institutional customer. A map showing the three study cities is shown in Figure 2. 1


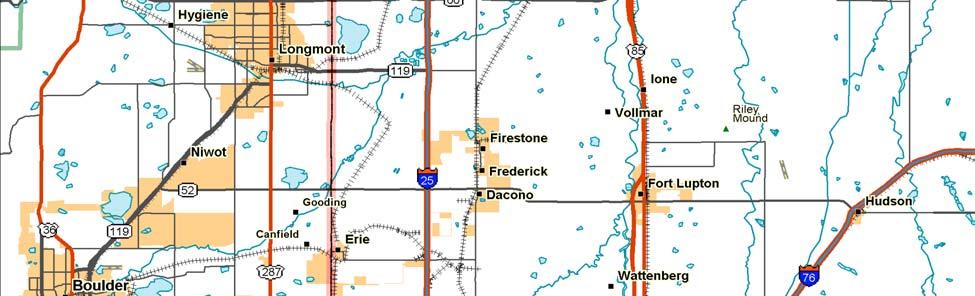
10 Figure 2: Location of study sites 2
11 Overview of WeatherTRAK System The WeatherTRAK system consists of three elements: a network of weather stations that can be remotely down-loaded, a central data processor and communications hub, and the WeatherTRAK field controllers (ET o signal controllers). These controllers are capable of receiving evapotranspiration (ET o ) data via satellite. The network utilizes pager-like technology to send a signal pulse that can be broadcast to any number of WeatherTRAK controllers. Each controller can be addressed in several ways. All controllers in the same utility, or linked to the same weather station, or zip code can be sent the same message. Specific messages can also be sent to individual controllers by their serial number. The information typically transmitted to the field units in this study was the ET o for the past 7 days, which was used by the controller to develop an irrigation schedule for the current week. The WeatherTRAK controllers have crop coefficients built in to modify the ET o for the predominant vegetation in each irrigation zone. In this way, the controllers are continuously replenishing the soil moisture depletion from the previous time period in current time. In addition, signals can be sent out to initiate a rain pause, to apply a percent increase or decrease in applications, or to update the date and time information on the controller. The Northern Colorado Water Conservancy District (NCWCD) operates a network of remote, solar powered, automated weather stations throughout its service area. The weather station network is currently composed of 16 stations, 1 in alfalfa fields and six on urban turf grass. The urban turf grass stations are located in large, well-irrigated areas. Stations are approximately 25 to 3 miles apart to provide the best practical coverage for the District's 1.5 million-acre service area. The three stations used for the study were turf grass sites and each was located in one of the participating cities (Boulder, Greeley, and Longmont). Each station recorded air temperature, relative humidity, wind speed and solar radiation. The data were used daily to calculate standardized reference evapotranspiration (ET o ) using the 2 standardized ASCE Penman-Monteith equation for turf grass. Stations automatically transmitted data via modem and cell phone twice daily to district headquarters. This ET o information was downloaded by Aquacraft from the NCWCD s web pages and then faxed to the signal processing company, HydroPoint Data Systems 1. HydroPoint Data Systems, located in Petaluma, California, designed and maintains the software, builds the controllers and operates the network used to operate the WeatherTRAK system. In normal operations the data acquisition is an automated process, and in the near future the system will include rainfall data from Nexrad stations, and net this out of the ET o. The Colorado Front Range region has numerous microclimates that can dramatically affect the calculation of ET o from one city to another. To account for this, Aquacraft created a distinct ET o zone for each city in the study and there was at least one weather station in each ET o zone. All WeatherTRAK controllers were coded to receive signals for the appropriate ET o zone. This allowed individual WeatherTRAK irrigation controllers to receive an ET o signal that closely represented the specific local microclimate. 1 Formerly known as Network Services, Inc. 3
12 The specific ET o data used to adjust the ET o signals for the WeatherTRAK irrigation controllers were faxed to Petaluma initially on a tri-weekly basis. Tri-weekly signals were sent from April 1 to Oct 31, 22. The ET o signals were transmitted three days a week, on Monday, Wednesday and Friday. If local weather conditions changed dramatically between these periods, a signal was sent, adjusting the ET o or initializing the rain pause feature of the WeatherTRAK irrigation controller. Irrigation Study Sites Table 1 shows the locations and installation dates for all nine of the WeatherTRAK controllers that were active during the 22 irrigation season. The KGNU site was installed at the end of 21, but the landscaping there was not completed until the beginning of 22. Over the course of the 22 irrigation season the water use at each the nine sites was tracked so that the application rate of the system as controlled by the WeatherTRAK units could be compared to the ET o. This comparison is displayed in Figure 3, which shows applications as a percentage of ET o. Table 1: Irrigated area and landscape Site # City Weather # of TRAK Irrigation Install Date Zones Total Landscape Area (sf) Approximate Areas Cool Season Grass (sf) Shrubs, Trees Flowers and Garden (sf) ADA Boulder 6/5/1 5 4,5 3, KER Boulder 9/12/ 6 8,23 4,527 3,74 LEW Boulder 8/7/ 6 5,86 4,395 1,465 CER Greeley 9/11/ 7 4, 3,8 2 SAR Greeley 9/18/ 1 13, 9,75 3,25 SOU Longmont 4/27/1 9 17,5 1,5 7, SVS Longmont 5/11/1 7 6,665 5,665 1, AND Greeley 4/27/1 7 11, 6,5 4,95 KGNU Boulder 1/1/1 1 6,99 6,99 Total 77,745 48,512 29,233 4
13 14% 12% 1% ETo% 8% 6% 4% 2% % ADA KER LEW SVS SOU CER SAR AND KGNU Application Rates 22 Figure 3: Application rate at nine WeatherTRAK sites as percent of ETo Irrigated Area and Historical Water Use The 9 study participants had an average irrigated area of 8,638 square feet (sf). The maximum irrigated area in the study was 17,5 sf and the minimum irrigated area was 4, sf. The total irrigated area for the nine study sites was 77,745 sf and of this irrigated area approximately 48,512 sf or 62% percent was cool season grass and 29,233 sf or 38% percent was shrubs, trees, flowers, low to moderate water use plants and gardens. Table 1 shows the information on the landscaped areas for each of the 9 sites. The historical water use and application rate data for the sites are shown in Table 2. It is important to note that this table shows that many of the participants in this study were irrigating well below ET o before the installation of the WeatherTRAK controller. In fact, while the average application rate was 99% of ET o, three of the nine sites were applying significantly less than ET o. The 95% confidence interval of the data was 2% so the true average could lie anywhere between 79% and 119% of ET o. The wide range in historical applications is shown graphically in Figure 4 which is a histogram showing the number of sites falling into 1% bins ranging from 3% to 25% of ET o. 5
14 Table 2: Historical irrigation application rates for study sites Site City Irrigated Area (sf) Historical Outdoor Use kgal Historical (inches) ADA Boulder 4, % KER Boulder 8, % LEW Boulder 5, % SVS Longmont 6, % SOU Longmont 17, % CER Greeley 4, % SAR Greeley 13, % AND Greeley 11, % KGNU Boulder 699 New Acct. Average (±95%Conf. Int.) Percent of ET o 99% ± 2% It is fairly typical for volunteers in water efficiency studies to be people who are already concerned about irrigation and efficient use of water. It is not surprising then that so many of these people were efficient irrigators to begin with. On the other hand, some of the persons who had higher application rates were requested to join the study, so in a sense they could be called conscripts, and their motivation may have been mainly to please the utility rather than a desire to take advantage of this technology. The exact attitudes and motivations of the participants, while important, were not a critical element for this study. The primary goal was to determine whether or not the technology works. From this perspective, then, the real critical elements were: To observe how the WeatherTRAK units performed with the citys' different drought management water restrictions. To measure the actual application rate of the WeatherTRAK controller and to compare this to the ET o requirement. 6
15 2.5 2 Number of Sites Percent of ETo RESULTS Figure 4: Historical irrigation applications of eight sites as percent of ET o Comparison of Irrigation Applications Evapotranspiration (ET o ) gives a measurement of the amount of water (in inches) required to replace evaporation and transpiration for maximum plant growth. The reference ET o is for 12 cm (4.7 inches) high, cool season turf grass. ET o is calculated by measuring the energy from various sources that impact plant growth. These energy sources are solar radiation, wind, and air temperature as moderated by relative humidity. Standard instruments on weather stations measure these parameters, and the energy equation converts them into inches of evapotranspiration. ET o includes rainfall only indirectly through its effect on relative humidity. It also does not include water requirements for flushing salts from the soil and irrigation system inefficiencies. During the primary irrigation season, from April through October, for the years , the average ET o for Boulder, Longmont, and Greeley was 34.4 inches. In 22 the average ET o for Boulder, Longmont, and Greeley was 38.5 inches. As shown in Table 2, during the irrigation seasons, the participants averaged 34.4 inches of irrigation application, while, as shown in Table 3, in 22 the application rates for the 7 sites dropped to 27.2 inches, a reduction of 21%. Results varied considerably from site to site as are shown in Figure 5, but it is evident that the 22 application rates were closer to the ET o values than were the historical application rates. In addition, it can be seen that those customers who historically over-irrigated tended to make adjustments to the WeatherTRAK that increased their application rate and those that were under- 7
16 irrigators made the opposite changes. As shown in Table 3 the post WeatherTRAK applications were 71% of ETo with a margin of error of ± 23% Application (inches) ADA KER LEW SVS SOU CER SAR Historical Average Outdoor Use WeatherTRAK 22 ETo 22 (inches) Figure 5: Irrigation application rates before and after WeatherTRAK installation Table 3: 22 Irrigation application with WeatherTRAK Site Precipitation during Irrigation Application with Irrigation Season (in) WeatherTRAK (in) ADA % KER % LEW % SVS % SOU % CER % SAR % Average (± 95% Confidence Interval) Irrigation Application as Percent of ET o 27.2 ± 9 71% ± 23% Cumulative Application Comparisons Appendix A shows graphs for each of the nine participants that compare the cumulative irrigation applications of each site against the ET o and historical applications for the 22 irrigation season. Appendix B has eight graphs that track each participant s irrigation application rates versus the ET o from the installation date until the completion of the study. The nine graphs 8
17 in Appendix A show how well the system tracked ET o during the irrigation season. In some cases the applications lie above or below the ET o line, but in all cases they tend to mirror the shape of the ET o line from the beginning to the end of the season. It can be noted that in most cases the drought restrictions curtailed irrigation usage to levels well below ET o. The most likely explanation for consistently over or under irrigating by the WeatherTRAK controllers is that the precipitation rates programmed into the controller are not accurate. In cases where the precipitation rates are under estimated the systems will run too long and use more water than desired. The opposite effect occurs if the precipitation rates are overestimated. Then the system will not run long enough and too little water will be applied. With two minor exceptions (sites CER and SVS), all of the irrigation application lines lie below the ET o line and run parallel to it. The SVS site started out just below the line but was adjusted to a slightly higher position in order to maintain a more lush appearance desired by the staff. At the CER site irrigation began above ET o and tailed off sharply in July, most likely due to stricter water restrictions that were imposed during the drought. The remainder of the sites showed applications that parallel and run at 4-85% of ET o. Percent of Potential Savings Captured The applications with the WeatherTRAK decreased from 34.4 inches for the 1998 to 2 period to an average of 27.2 inches in 22 a 21% reduction. A full turf landscape should be able to do well with an application of 3 after effective rainfall and plant coefficients are considered, and with mixed landscapes the overall applications should easily decrease to 25 inches. Using these guidelines, the WeatherTRAK system appears to have captured around 92% of the potential savings on the seven sites that were active during the entire 22 irrigation season. Water and Cash Savings The WeatherTRAK system clearly was able to regulate irrigation in order to match ET o. But how does the system perform in terms of simple water and money savings? Figure 6 shows the net savings for each of the seven sites. Savings for the group as a whole averaged 3 kgal for the year, including both increased and decreased uses. The data show that three of the sites used more water in 22 than they did historically. The KER and LEW sites used more water in 22, but this was compared to very sparse historical irrigation practices. The ADA site used slightly more water, but their historical use was right at ET o as was their WeatherTRAK use, so their numbers are essentially a break-even situation. If we look just at the sites where savings were achieved, and if we assume these sites could be targeted for participation in large-scale projects, then the potential savings appear more favorable. All of the sites with savings were in either Longmont or Greeley. Table 4 shows that for those customers that achieved water savings their average savings amounted to 64 kgal. At the water rates shown in Table 4 this resulted in savings of $19 per site, on average. At higher water rates these savings would be greater. Table 4: Results from sites showing savings 9
18 Site City Water Rate ($/kgal) Savings (kgal) Savings ($) SVS Longmont $668 SOU Longmont $ 89 CER Greeley $ 69 SAR Greeley $ 51 Average 64 $ K G A L 1 5 ADA KER LEW SVS SOU CER SAR -5 SITE Figure 6: Net water savings for seven study sites WeatherTRAK and Water Restrictions An important finding of the study during 22 was that the Weather TRAK controller was able to adapt to local drought restrictions with more or less effort, depending on the type of restrictions favored by the local utility staff. In Boulder, where strict irrigation schedules were required the WeatherTRAK units needed to be programmed for manual irrigation with ET o. This meant that specific days were set up for watering, and run times were entered for each zone. In the cases of Longmont and Greeley, however, the schedules were much more flexible. These cities gave target applications in terms of inches of application or percent of ET o. In these cases the WeatherTRAK units could meet the goals by simply sending the necessary ET o signal. Boulder s goal was to achieve a 25% reduction in outdoor water use during the summer of 22. However, they didn t believe that most of their customers could translate a goal of this kind to a watering schedule, so they used a system where watering was limited to 15 minutes, twice a week, for each zone, as a short cut approach, and they applied this to all customers. In order to come as close as possible to meeting these requirements the WeatherTRAK controllers in Boulder were programmed to irrigate only on the days allowed, and their run times were set so 1
19 that the actual applications would be no more than 5% of the actual ET o. We reasoned that the average customer normally irrigates at around 8% of ET o, and programming for a 5% application we would achieve an actual 25% reduction in water use for the customers. The results in Boulder were very good. The four sites applied an average of 51% of ET o with a maximum application of 7% and a minimum application of 42%. As a whole the Boulder group tracked ET o very well and the participants application rates were within the goals set by Boulder s mandatory watering restrictions. The City of Longmont 22 drought response plan called for residents and businesses to voluntarily implement water conservation measures that would reduce water consumption by 1%. This 1% water use reduction was programmed into the WeatherTRAK irrigation controllers in the Longmont area using the percent reduction feature. The two WeatherTRAK sites in Longmont had an average application rate of 9% of ET o compared to historic application rates of 157%. Thus, in Longmont the WeatherTRAK controller was able reduce the irrigation application rates by more than the desired 1%. In 22 the City of Greeley had mandatory water restrictions that limited watering to two days a week an application of 1.5 inches of water per week for the months of June, July, and August. In September, 1.25 inches of application were allowed. Greeley, however, allowed the study participants an exemption from the watering day requirements on the condition that the application rate was still met. In order to meet these limits the WeatherTRAK irrigation controllers were programmed to the lower of the prescribed limits or the actual ET o. During future droughts, if ETo signal controllers are in more general use, this would be a good approach to enforcing restrictions. There were three WeatherTRAK sites in the City of Greeley. Two of the sites were in operation the entire irrigation season and one participant moved in July. For the period when the three sites were operational the average application rate was 7% of ET o. The average application rate for the two sites that were operational the entire irrigation season was 77% of ET o. In 22 both sites were below their historical application rate and tracked ET o better than in previous years. In addition they met the City of Greeley s 15% water reduction goal. Each city in the study had different drought measures that limited outdoor water use. The WeatherTRAK irrigation controller was able to adapt to each of the drought measures and produce water savings. The results are displayed in Figure 7. For two of the citys programs it was just a matter of modifying the signal to the units within the area. When the WeatherTRAK controller was in an area that had specified watering days it was necessary to manually adjust the controller using the manual user programmed ET o function. For the study, the installer returned to the participant s homes and reprogrammed the controller. However, using the WeatherTRAK instruction manual, many of the participants could have reprogrammed the controller themselves. 11
20 18% 16% 14% 12% ETo% 1% 8% 6% 4% 2% % Boulder Longmont Greeley Historicial Application Application Figure 7: Historical usage versus drought restriction application rates 22 Problems Only one user reported a problem with the WeatherTRAK controller during 22. The problems were loss of signal and having a wrong ET o value or date appear on the controller. This problem was successfully resolved by contacting HydroPoint Data Services and then having a representative of Aquacraft talk the participant through the process as a series of new signals were sent to the units. None of the controllers needed replacement for operational reasons in 22. SUMMARY The results of this study offer useful information about the performance of the WeatherTRAK system. Technically, the system appeared to perform quite well. Not only did the WeatherTRAK receive signals, it made good translation of these ET o data into actual irrigation schedules. The WeatherTRAK irrigation controller adapted to each of the drought measures and produced water savings. From the standpoint of water savings, for the group as a whole, savings averaged 3 kgal per year. When accounts that saved no water were excluded, savings of 64 kgal per year were observed. Monetary savings on those sites, which reduced their water use, ranged from $51 to $668, and averaged $19 per site. Since these savings were based on relatively low water rates even greater savings could be expected as water rates increase. 12
21 Appendix A: Cumulative Applications vs. ET o s 22 ADA 4 Cumulative Application & ETo(inches) Mar-2 Apr-2 May-2 Jun-2 Jul-2 Aug-2 Sep-2 Oct-2 Nov-2 Application ETo Average Application 98- AND 25 Cumulative Application & ETo (inches) Mar-2 Apr-2 May-2 Jun-2 Application ETo Average Application 99-13
22 CER 6 Cumulative Application & ETo (inches) Mar-2 Apr-2 May-2 Jun-2 Jul-2 Aug-2 Sep-2 Oct-2 Nov-2 Application ETo Average Application 99- KER 4 Cumulative Application & ETo (inches) Mar-2 Apr-2 May-2 Jun-2 Jul-2 Aug-2 Sep-2 Oct-2 Nov-2 Application Eto Average Application 98-14
23 KGNU 4 Cumulative Application & ETo (Inches) Mar-2 Apr-2 May-2 Jun-2 Jul-2 Aug-2 Sep-2 Oct-2 Nov-2 ETo Application LEW 4 Cumulative Application & ETo (inches) Mar-2 Apr-2 May-2 Jun-2 Jul-2 Aug-2 Sep-2 Oct-2 Nov-2 Application ETo Average Application 98-15
24 SAR Cumulative Application & ETo (inches) Mar-2 Apr-2 May-2 Jun-2 Jul-2 Aug-2 Sep-2 Oct-2 Nov-2 Application ETo Average Application & ETo (inches) SOU 4 Cumulative Application & ETo (inches) Apr-2 May-2 Jun-2 Jul-2 Aug-2 Sep-2 Oct-2 Nov-2 Dec-2 Application ETo Average Application 98-16
25 SVS Cumulative Application & ETo (inches) Apr-2 May-2 Jun-2 Jul-2 Aug-2 Sep-2 Oct-2 Nov-2 Dec-2 Application ETo Average Application Rate 98-17
26 18
27 Appendix B: 3 Years Tracking Application versus ET o ADA 9 8 WeatherTrak Installed 6/5/1 Application & ETo (inches) Apr- Jul- Oct- Jan-1 Apr-1 Jul-1 Oct-1 Jan-2 Apr-2 Jul-2 Oct-2 Application ETo AND 9 8 WeatherTRAK Installed 4/27/1 Application & ETo (inches) /1/ 6/1/ 8/1/ 1/1/ 12/1/ 2/1/1 4/1/1 6/1/1 8/1/1 1/1/1 12/1/1 2/1/2 4/1/2 6/1/2 Application ETo 19
28 CER WeatherTRAK Installed 9/11/ Application & ETo (Inches) /1/ 6/1/ 8/1/ 1/1/ 11/2/ 5/1/1 7/1/1 9/1/1 11/1/1 12/1/1 1/28/2 3/27/2 5/3/2 7/3/2 1/1/2 12/5/2 Application ETo KER 9 8 WeatherTRAK Installed 9/12/ Application & ETo (inches) Apr- Jun- Aug- Oct- Nov- May-1 Jul-1 Sep-1 Nov-1 Dec-1 Jan-2 Mar-2 May-2 Jul-2 Sep-2 Nov-2 Application Eto 2
29 KGNU 8 7 Landscaping Completed Application & ETo (inches) Mar-2 Apr-2 May-2 Jun-2 Jul-2 Aug-2 Sep-2 Oct-2 Nov-2 Dec-2 Application ETo LEW 8 7 WeatherTRAK Installed 8/7/ `Application & ETo (inches) Apr- Jun- Aug- Oct- Nov- May-1 Jul-1 Sep-1 Oct-1 Dec-1 Feb-2 Apr-2 Jun-2 Aug-2 Oct-2 Dec-2 ETo Application 21
30 SAR 9 8 WeatherTRAK Install 5/11/1 7 Application & ETo (inches) /1/ 8/1/ 11/1/ 2/1/1 5/1/1 8/1/1 11/1/1 2/1/2 5/1/2 8/1/2 11/1/2 Application ETo SOU WeatherTRAK Installed 4/27/1 Appication & ETo (Inches) /1/ 7/1/ 1/1/ 4/1/1 6/6/1 9/5/1 11/1/1 2/5/2 5/3/2 8/6/2 11/4/2 ETo Application 22
31 SVS 25 2 WeatherTRAK Installed 5/11/1 Application & ETo (Inches) /1/ 7/1/ 1/1/ 4/1/1 7/1/1 1/1/1 12/2/1 3/2/2 6/17/2 9/17/2 12/17/2 Application ETo 23
PREDICTING WATER SAVINGS WITH WEATHER-BASED IRRIGATION CONTROLLERS
 PREDICTING WATER SAVINGS WITH WEATHER-BASED IRRIGATION CONTROLLERS Leslie Martien, and William B. DeOreo, P.E., Aquacraft, Inc Water Engineering and Management, Boulder Colorado Introduction Much of the
What s all the Fuss About ET Controllers? The Current State of Landscapes. Why the Need Public Agency Studies What s s Next.
 What s all the Fuss About ET Controllers? Why the Need Public Agency Studies What s s Next The Current State of Landscapes 36 States will have water shortages even with average rainfall within 5 years.
SANTA MARGARITA WATER DISTRICT LARGE LANDSCAPE LUNCHEON
 SANTA MARGARITA WATER DISTRICT LARGE LANDSCAPE LUNCHEON DECEMBER 16, 2015 OPENING REMARKS: DAN FERONS, SMWD GENERAL MANAGER PRESENTER: NATE ADAMS, SMWD WATER EFFICIENCY ADMINISTRATOR WE RE IN THIS TOGETHER...
Initial Evaluation of Smart Irrigation Controllers: Year Two (2009) Results
 Results") COLLEGE OF AGRICULTURE AND LIFE SCIENCES TR-364 2010 Initial Evaluation of Smart Irrigation Controllers: Year Two (2009) Results By: Charles Swanson and Guy Fipps, P.E. Department of Biological and Agricultural
COLLEGE OF AGRICULTURE AND LIFE SCIENCES TR-364 2010 Initial Evaluation of Smart Irrigation Controllers: Year Two (2009) Results By: Charles Swanson and Guy Fipps, P.E. Department of Biological and Agricultural
July By Charles Swanson, Extension Associate Guy Fipps, Professor and Extension Agricultural Engineer
 COLLEGE OF AGRICULTURE AND LIFE SCIENCES TR-354 2009 Evaluation of Smart Irrigation Controllers: Initial Bench Testing Results July 2009 By Charles Swanson, Extension Associate Guy Fipps, Professor and
Conservation Strategies for Lawn Irrigation During Drought A Colorado Experience
 Conservation Strategies for Lawn Irrigation During Drought A Colorado Experience Brent Q. Mecham 1 CID, CIC, CLIA, CGIA Background: Colorado experienced its worst drought in recorded history during 2002.
EVALUATION OF SMART IRRIGATION CONTROLLERS: YEAR 2010 RESULTS 1. By Charles Swanson and Guy Fipps, PhD, P.E 2. July 15, 2011
 TR-401 EVALUATION OF SMART IRRIGATION CONTROLLERS: YEAR 2010 RESULTS 1 By Charles Swanson and Guy Fipps, PhD, P.E 2 July 15, 2011 A Report Prepared for Task 2 of the Rio Grande Basin Initiative Irrigation
Evaluation of Smart Irrigation Controllers: Year 2010 Results
 COLLEGE OF AGRICULTURE AND LIFE SCIENCES TR-401 2011 Evaluation of Smart Irrigation Controllers: Year 2010 Results By Charles Swanson and Guy Fipps, PhD, P.E. Texas AgriLife Extension Service Department
Evaluation of smart irrigation controllers: Year 2013 results
 Evaluation of smart irrigation controllers: Year 2013 results Texas Water Resources Institute TR-469 November 2014 Charles Swanson and Guy Fipps, Ph.D., P.E. Irrigation Technology Program Texas A&M AgriLIfe
Tempering the Thirst Of America s Driest City
 Tempering the Thirst Of America s Driest City Prepared for: Rocky Mountain Land Use Institute 2 March 2012 Colorado River Serves about 30 million people in 7 states and Mexico Irrigates about 1.8M acres
Rainwater Harvesting
 Rainwater Harvesting A strategy for water conservation, stormwater management and sustainable development in the City of Tucson Ann Audrey, Environmental Projects Coordinator Tucson Office of Conservation
Residential Outdoor Watering Restrictions: A Closer Look at Assigned Days
 Residential Outdoor Watering Restrictions: A Closer Look at Assigned Days Anita Castledine Klaus Moeltner Michael K. Price Shawn Stoddard Presented at the workshop Understanding Residential Water Use:
EVALUATION OF SMART IRRIGATION CONTROLLERS: YEAR 2012 RESULTS 1
 TR-443 EVALUATION OF SMART IRRIGATION CONTROLLERS: YEAR 2012 RESULTS 1 By Charles Swanson and Guy Fipps, PhD, P.E 2 June 5, 2013 A Report Prepared for Task 2 of the Rio Grande Basin Initiative Irrigation
IRRIGATION CONTROLLERS
 IRRIGATION CONTROLLERS TIMERS FOR THE HOMEOWNER Recommended Water Saving Features Water too precious to waste! IRRIGATION CONTROLLERS TIMERS FOR THE HOMEOWNER Recommended Water Saving Features While controllers
SIMPLE IRRIGATION WITH ETo
 SIMPLE IRRIGATION WITH ETo Dennis Pittenger Area Environmental Horticulturist University of California Cooperative Extension Los Angeles County/UC Riverside Presentation 2013 Dennis Pittenger Dennis Pittenger
Drip Irrigation Efficiency. Fact or Fiction?
 Drip Irrigation Efficiency Fact or Fiction? Why do We use Drip? It saves water! How does it save water? Because it s very efficient Is it? Sadly in the real world it often has very poor efficiency What
Evaluation of ET Based Smart Controllers During Droughts
 Evaluation of ET Based Smart Controllers During Droughts Charles Swanson, Extension Program Specialist-Landscape Irrigation Texas Agrilife Extension Service-Biological & Agricultural Engineering Unit 2117
IRRIGATION SCHEDULING OF ALFALFA USING EVAPOTRANSPIRATION. Richard L. Snyder and Khaled M. Bali 1 ABSTRACT
 IRRIGATION SCHEDULING OF ALFALFA USING EVAPOTRANSPIRATION Richard L. Snyder and Khaled M. Bali 1 ABSTRACT This paper describes the Irrigation Scheduling Alfalfa (ISA) model, which is used to determine
CITY OF BEVERLY HILLS PUBLIC WORKS DEPARTMENT MEMORANDUM
 CITY OF BEVERLY HILLS PUBLIC WORKS DEPARTMENT MEMORANDUM TO: FROM: PUBLIC WORKS COMMISSION Debby Figoni, Water Conservation Administrator DATE: May 10, 2018 SUBJECT: Water Efficiency Update ATTACHMENTS:
Crop Water Requirement. Presented by: Felix Jaria:
 Crop Water Requirement Presented by: Felix Jaria: Presentation outline Crop water requirement Irrigation Water requirement Eto Penman Monteith Etcrop Kc factor Ks Factor Total Available water Readily available
California Independent System Operator Corporation. California ISO. Import resource adequacy. Department of Market Monitoring
 k California Independent System Operator Corporation California ISO Import resource adequacy September 10, 2018 Department of Market Monitoring Summary This report provides an update of analysis and trends
Nutrition of Horticultural Crops Measurements for Irrigation. Lincoln Zotarelli Horticultural Sciences Department University of Florida Spring 2015
 Nutrition of Horticultural Crops Measurements for Irrigation Lincoln Zotarelli Horticultural Sciences Department University of Florida Spring 2015 Principles of plant nutrition Principle 1. Plants take
Sustaining Our Buildings & Grounds
 Sustaining Our Buildings & Grounds The Next 100 Years University of Alberta June 1 3 2008 Located Edmonton Alberta 3rd largest University in Canada 32,000 undergrads 6,000 grad students 13.9 million sq.
Electric Forward Market Report
 Mar-01 Mar-02 Jun-02 Sep-02 Dec-02 Mar-03 Jun-03 Sep-03 Dec-03 Mar-04 Jun-04 Sep-04 Dec-04 Mar-05 May-05 Aug-05 Nov-05 Feb-06 Jun-06 Sep-06 Dec-06 Mar-07 Jun-07 Sep-07 Dec-07 Apr-08 Jun-08 Sep-08 Dec-08
Update on Conservation and Executive Order B Erik Ekdahl Director Office of Research, Planning, and Performance
 Update on Conservation and Executive Order B-40-17 Erik Ekdahl Director Office of Research, Planning, and Performance May 18, 2017 Background 5 years of Drought Mandatory Conservation Framework Report
Take a closer look at your Direct Debit. Your questions answered
 Take a closer look at your Direct Debit Your questions answered Set up an online account to keep in touch with your Direct Debit If you want to keep up-to-date more regularly, register for an online account.
Residential Weather-Based Irrigation Scheduling: Evidence from the Irvine ET Controller Study
 Residential Weather-Based Irrigation Scheduling: Evidence from the Irvine ET Controller Study June 2001 Agency Representatives and Study consultants Theodore Hunt and Dale Lessick Irvine Ranch Water District
Scott Valley Siskiyou County, California: Voluntary Private Well Water Level Monitoring Program Spring 2006 January 2016
 Scott Valley Siskiyou County, California: Voluntary Private Well Water Level Monitoring Program Spring 2006 January 2016 (Data collected monthly except January 2011) University of California Davis 2016
Advancing Stormwater Beneficial Uses: ET Mapping in Urban Areas. Ryan Bean 1 and Robert Pitt 2
 Advancing Stormwater Beneficial Uses: ET Mapping in Urban Areas Ryan Bean 1 and Robert Pitt 2 1Graduate Student, Department of Civil, Construction, and Environmental Engineering, The University of Alabama,
Blaine Hanson Dept. of Land, Air and Water Resources University of California, Davis
 Blaine Hanson Dept. of Land, Air and Water Resources University of California, Davis Other participants Steve Orloff Farm Advisor, Siskiyou County Blake Sanden Farm Advisor, Kern County Khaled Bali Farm
Illinois in Drought. June 19, 2012, Updated June 21, 2012
 June 19,, Updated June 21, Illinois in Drought The ISWS now considers central and southern Illinois to be fully in drought based on several impacts including the early season onset of reservoir drawdown
Welcome to the MWON Advanced Webinar Series
 Welcome to the MWON Advanced Webinar Series Today s presentation: The Importance of Forests to Streams and Groundwater You will need to have speakers attached to your computer to hear the presenter. You
Water Supply & Demand Management Policy Update. Website Presentation December 12, 2011
 Water Supply & Demand Management Policy Update Website Presentation December 12, 2011 1 Purpose Make you aware of policy update and the process Highlight potential changes to policy Provide supporting
2017 KEY INSIGHTS ON. Employee Attendance and Tardiness
 2017 KEY INSIGHTS ON Employee Attendance and Tardiness THE AVERAGE NUMBER OF MINUTES THAT EMPLOYEES IN THE XIMBLE SYSTEM ARE LATE IS MINUTES. 114.2 MINUTES Statistical sample of 263258 clock-in records,
Session Description: smart irrigation technologies saving water on the weather ET-based smart controllers soil moisture sensors
 Trends in Smart Irrigation Technologies by Dr. Steven C. Carlin, Ph.D., CID, CLIA Teufel Landscape For Oregon Landscape Contractors Association (OLCA) December 1, 2011 Trends in Smart Irrigation Technologies
SOLANO COUNTY WATER AGENCY
 SOLANO COUNTY WATER AGENCY Grant E-67020 Evapotranspiration Controller System Project P.O. Box 349 6040 Vaca Station Road, Building 84 Elmira, California 95625-0349 Phone (707) 451-6090 FAX (707) 451-6099
GET AHEAD OR GET PARCHED: SIX WAYS TO SURVIVE THE DROUGHT
 GET AHEAD OR GET PARCHED: SIX WAYS TO SURVIVE THE DROUGHT July 29, 2014 Northern Sierra LAA 0.25 MAF 10 yr avg Upper Colorado River Basin SWP 1.33 MAF 10 yr avg MWD Service Area Southern Sierra CRA 0.73
Almond Drought Management. David Doll UCCE Merced
 Almond Drought Management David Doll UCCE Merced Irrigation Considerations Climate Contribution Rainfall Snowpack Season s temperatures Distribution uniformity (DU) Frost protection/pre-irrigating Ground
Water Use and Yield Response of Potatoes
 172 Water Use and Yield Response of Potatoes Carl Shaykewich, Department of Soil Science, University of Manitoba, Winnipeg, MB R3T 2N2 shaykew@ms.umanitoba.ca Richard Raddatz, Meteorological Service, Environment
Actions Taken. Implementation Comments. Qualification. State Water Resources Control Board Office of Research, Planning & Performance
 Hello Caitlin Sims, Thank you for your Monitoring Report. Below is the information you have submitted for the month of 1115. If this information is incorrect, please re-submit your report for the month
Ananda Village 2014 Water Conservation and Groundwater Management
 Appendix 3-D Ananda Village 2014 Water Conservation and Groundwater Management Memorandum prepared by: Ananda Village Planning and Water Department December 2014 Ananda Village 2014 Water Conservation
AGENDA ITEM C9 TAMPA WATER
 TAMPA WATER Supplying Water To The Region AGENDA ITEM C9 DATE: June 3, 28 TO: Gerald J. Seeber, General Manager FROM: Donald J. Polmann, Director of Science and Engineering SUBJECT: Regional Water Supply
Santa Cruz Water Department: Water Resources, Conservation, and Water Shortage Contingency Plan. Santa Cruz Neighbors February 18, 2009
 Santa Cruz Water Department: Water Resources, Conservation, and Water Shortage Contingency Plan Santa Cruz Neighbors February 18, 2009 Presentation Overview Overview of City s Water Supply System Challenges
WaterSmart Workshops Strategies for Water-Efficient Landscapes
 WaterSmart Workshops Strategies for Water-Efficient Landscapes San Diego Gas & Electric, Energy Innovations Center May 13-14, 2015 Carlos Michelon Principal Water Resources Specialist Overview 1. Drought
LANDSCAPE WATER CONSERVATION STATEMENT
 Maximum Applied Water Allowance (MAWA) MAWA = (Eto x 0.62 x 0.45 x LA) + ( Eto x 0.62 x 0.55 x SLA) MAWA = Maximum Applied Water Allowance (gallon per year) Eto = Reference Evapotranspiration (inches per
City of San Clemente Water Usage Report
 Monthly Usage (AF) ACRE FEET City of San Clemente Overview of Usage FY 217-18 Monthly Water Use Type of Supply Total MWDOC 723 722 657 629 - - - - - - - - 2,731 Local Groundwater 33 23 69 84 - - - - -
City of Portsmouth Water Efficiency Efforts. updated: March 2017
 City of Portsmouth Water Efficiency Efforts updated: March 2017 Portsmouth Regional Water System Service Area Newington ~ 8,000 Accounts Portsmouth New Castle & New Castle Water District Rye & Rye Water
Investigating the Start of the Rainy Season and the Best Sowing Dates for St. George, Antigua
 Investigating the Start of the Rainy Season and the Best Sowing Dates for St. George, Antigua By Dale Destin Climatologist Antigua and Barbuda Meteorological Service Climate Section Email: dale_destin@yahoo.com
RCAC. Estimating Landscape Irrigation Requirements
 Estimating Landscape Irrigation Requirements Four Factors Determining Landscape Water Use Climate Plants Landscape Size Irrigation System Efficiency The Climate Factor EVAPOTRANSPIRATION or ET: The amount
Smart Irrigation Making Every Drop Count Master Gardner State Conference Oct , 2013
 Smart Irrigation Making Every Drop Count Master Gardner State Conference Oct. 21-23, 2013 Michael D. Dukes, PhD., P.E., C.I.D. Agricultural & Biological Engineering University of Florida/IFAS clce.ifas.ufl.edu
..Title Receive Report on Salinas Valley Water Conditions for the Third Quarter of Water Year
 ..Title Receive Report on Salinas Valley Water Conditions for the Third Quarter of Water Year 2016-2017..Report RECOMMENDATION: It is recommended that the Monterey County Water Resources Agency Board of
A Simple Irrigation Scheduling Approach for Pecan Irrigation in the Lower Rio Grande Valley
 ABSTRACT A Simple Irrigation Scheduling Approach for Pecan Irrigation in the Lower Rio Grande Valley Zhorab Samani, Salim Bawazir, Max Bleiweiss, Rhonda Skaggs, John Longworth, Aldo Piñon,Vien Tran Submitted
Estimating water needs of alfalfa and using ET to schedule Irrigation
 Estimating water needs of alfalfa and using ET to schedule Irrigation D. Zaccaria, R. Snyder, D. Putnam, A. Montazar, C. Little DWR-Funded Project (2014-2017) aiming at Developing updated information on
CITY OF MANTECA WATER CONSERVATION APRIL 7, 2015 TO JANUARY 19, 2016
 CITY OF MANTECA WATER CONSERVATION APRIL 7, 2015 TO JANUARY 19, 2016 WATER CONSERVATION - APRIL 2015 ADOPTED RECOMMENDATIONS 1. Restrict Front Yard Turf 2. One Full-Time Water Resource Coordinator 3. Two
Table of Contents Class 3 - Controller Programming
 California Friendly Landscape Training Irrigation Course Controller Programming Course originally developed by California Polytechnic State University, San Luis Obispo Irrigation Training & Research Center
PROGRESS WITH MEASURING AND UTILIZING CROP EVAPOTRANSPIRATION (ETc) IN WALNUT
 IN WALNUT") PROGRESS WITH MEASURING AND UTILIZING CROP EVAPOTRANSPIRATION (ETc) IN WALNUT Allan Fulton, Cayle Little, Richard Snyder, Richard Buchner, Bruce Lampinen, and Sam Metcalf ABSTRACT Since 1982 when the California
PROGRESS WITH MEASURING AND UTILIZING CROP EVAPOTRANSPIRATION (ETc) IN WALNUT Allan Fulton, Cayle Little, Richard Snyder, Richard Buchner, Bruce Lampinen, and Sam Metcalf ABSTRACT Since 1982 when the California
Continued Extreme Drought Conditions. April 1, 2015 Snowpack was lowest ever recorded. Impacts and Risk to People and Nature
 Eric Oppenheimer May 19, 2015 http://saveourwater.com Background Continued Extreme Drought Conditions April 1, 2015 Snowpack was lowest ever recorded Impacts and Risk to People and Nature Unemployment
Monterey Salinas Transit Water Use Analysis for the Monterey Operations and Maintenance (TDA) Facility Renovation and Expansion Project
 Facility Renovation and Expansion Project") 9699 Blue Larkspur Lane Suite 105 Monterey, California 93940 831 649-5225 Fax 831 373-5065 MEMORANDUM Job No.: 3055.05 DATE: March 27, 2015 TO: FROM: Cc: SUBJECT: Lisa Rheinheimer MST Nathaniel Milam,
9699 Blue Larkspur Lane Suite 105 Monterey, California 93940 831 649-5225 Fax 831 373-5065 MEMORANDUM Job No.: 3055.05 DATE: March 27, 2015 TO: FROM: Cc: SUBJECT: Lisa Rheinheimer MST Nathaniel Milam,
Michael Cahn and Barry Farrara, UC Cooperative Extension, Monterey Tom Bottoms and Tim Hartz, UC Davis
 Water Use of Strawberries on the Central Coast Michael Cahn and Barry Farrara, UC Cooperative Extension, Monterey Tom Bottoms and Tim Hartz, UC Davis As acreage of strawberries has steadily increased in
Legislative Committee on Public Lands
 Legislative Committee on Public Lands EXHIBIT D2 May 28, 2004 EXHIBIT D2 Committee Name Lands Document consists of 74 Slides Entire document provided. Due to size limitations, pages provided. A copy of
HILLS CITY OF BEVERLY HILLS BEVERLY PUBLIC WORKS SERVICES DEPARTMENT MEMORANDUM TO: PUBLIC WORKS COMMISSION FROM:
 BEVERLY HILLS CITY OF BEVERLY HILLS PUBLIC WORKS SERVICES DEPARTMENT MEMORANDUM TO: FROM: PUBLIC WORKS COMMISSION Trish Rhay, Assistant Director of Public Works Services, Infrastructure & Field Operations
Overview. Regional District of Nanaimo Team WaterSmart Drip / Micro Workshop. Water Source WATER METER. Backflow Prevention Devices
 Regional District of Nanaimo Team WaterSmart Drip / Micro Workshop June 2009 Overview Irrigation System Anatomy (controllers, backflow, valves, sprinklers) Items Required (pipe & fittings) Pressure and
A Case Study on Integrated Urban Water Modelling using Aquacycle NTUA, 2007
 A Case Study on Integrated Urban Water Modelling using Aquacycle NTUA, 2007 Contents Motivation Input Data Requirements Case Study - Greater Athens Area Model calibration and validation Formulation and
WATER MANAGEMENT AND CONSERVATION PLAN FOR THE BEAVER DAM VILLAGE SPECIAL SERVICE DISTRICT FINAL. September 14, 2004 Job Number:
 WATER MANAGEMENT AND CONSERVATION PLAN FOR THE BEAVER DAM VILLAGE SPECIAL SERVICE DISTRICT FINAL September 14, 2004 Job Number: 0352-05-01 PWS ID Number: 09093 PREPARED FOR: Beaver Dam Village Special
Managing fertilization and irrigation for water quality protection
 Managing fertilization and irrigation for water quality protection Nitrogen budget in coastal vegetable production : lb N / acre Pepper Lettuce Celery Typical seasonal N application 250 190 275 Crop uptake
SMART Irrigation Controllers How smart are they?
 SMART Irrigation Controllers How smart are they? Loren Oki Dept. of Plant Sciences and Dept. Human Ecology UC Davis Make Every Drop of Water Count USGBC CC Fresno, CA June 28, 2017 Topics Irrigation objectives
Conservation Success & Challenges
 conservation Conservation Success & Challenges Karen Guz Director - Conservation Rates Advisory Committee Helping communities flourish Conservation Goals Reduce the need for water by looking at ALL of
Evaluation of Irrigation Smart Controller for Salinity Control
 Evaluation of Irrigation Smart Controller for Salinity Control Abstract Ram Dhan Khalsa 1 PE, CAIS, CIC, CID, CGIA, CLIA, CWCM-L The purpose of this paper is to summarize the results of an investigation
SMART Irrigation Controllers How smart are they?
 SMART Irrigation Controllers How smart are they? Loren Oki Dept. of Plant Sciences and Dept. Human Ecology UC Davis Get A Grip On Drip Concord, CA October 12, 2017 Topics Irrigation objectives What are
White Paper. HVLS Fans and Energy Savings. Dubai Case Study. Featuring Altra-Air Fans with WhalePower Technology from Envira-North Systems
 HVLS Fans and Energy Savings Dubai Case Study White Paper This paper is designed to provide insight into a case study of a manufacturing facility in Dubai, UAE. At the 2,500m² air conditioned site, one
Comprehensive Water Conservation Plan Las Virgenes Municipal Water District Fiscal Years
 Comprehensive Water Conservation Plan Las Virgenes Municipal Water District Fiscal Years 2018-20 1. Background On April 7, 2017, Governor Brown announced that California s most recent and severe drought
Sizing Irrigation Fields
 GRAYWATER CURRICULUM Sizing Irrigation Fields Class 3 Objectives 1. Soil composition 2. Evapotranspiration 3. Determine Graywater Irrigation Fields Graywater production Determine water budget Calculating
TheHelper, A User-Friendly Irrigation Scheduling Tool In Florida and Hawaii A. Fares 1, M. Zekri 2 and L.R. Parsons 2. Abstract
 TheHelper, A User-Friendly Irrigation Scheduling Tool In Florida and Hawaii A. Fares 1, M. Zekri 2 and L.R. Parsons 2 1 University of Hawaii-Manoa; 2 University of Florida. Abstract Efforts are being made
Water Planning and Stewardship Committee Item 6a February 8, 2016
 Water Planning and Stewardship Committee Item 6a February 8, 2016 Hydrologic Conditions State Water Project Allocation 2016 Water Supply Demand Balances Statewide Conservation Regulations WSDM Tracking
Song Lake Water Budget
 Song Lake Water Budget Song Lake is located in northern Cortland County. It is a relatively small lake, with a surface area of about 115 acres, and an average depth of about 14 feet. Its maximum depth
Water Budgeting in California - MWELO
 Water Budgeting in California - MWELO 1 What Is a Water Budget? A budget is generally a list of all planned expenses and revenues. It is a plan for saving and spending. A water budget is a plan for managing
Green California Schools Summit Metropolitan Water District of Southern California
 Green California Schools Summit 2014 Metropolitan Water District of Southern California November 5, 2014 Metropolitan Water District of Southern California Regional water wholesaler Includes 6 counties
NSPM Rate Design Pilot
 NSPM Rate Design Pilot Stakeholder Meeting May 5, 2017 Agenda and Purpose Agenda Introduction of MN Pilot Development A. Liberkowski Concept and Goals Pilot Development Timeline MN Time of Use Rate Option
Stanford University Water Efficiency Program Marty Laporte Jennifer Fitch Thomas Bartleman
 Pilot Testing New Wi-Fi Weather-Based Irrigation Controller Technology at Stanford University February 2014 October 2015 Initial Pilot Study Findings for Water Conservation College Group Stanford University
Irrigating Efficiently: tools, tips & techniques. Steve Castagnoli, OSU Extension Service
 Irrigating Efficiently: tools, tips & techniques Steve Castagnoli, OSU Extension Service Tonight s class: Why plants need water When plants need water How much water plants need Soil as a reservoir of
ET and Deficit Irrigation Approaches in Cotton
 ET and Deficit Irrigation Approaches in Cotton Daniel Munk University of California Cooperative Extension Fresno dsmunk@ucdavis.edu Current Issues State water supply- increasing water for environmental,
Report of the Working Group on Reducing Peak Water Demand
 Report of the Working Group on Reducing Peak Water Demand Peter Beckmann, Doug Engfer, Sue Holt, Rick Longinotti, Sarah Mansergh Contents Why Reduce Water Demand? Reducing Peak Season Use Residential Outdoor
Evaluating Vegetation Evapotranspiration (VegET) Modeling Results in South Dakota
 Modeling Results in South Dakota") Evaluating Vegetation Evapotranspiration (VegET) Modeling Results in South Dakota Gabriel Senay 1 and Geoffrey Henebry 2 1 SAIC, contractor to the U.S. Geological Survey (USGS) Center for Earth Resources
Evaluating Vegetation Evapotranspiration (VegET) Modeling Results in South Dakota Gabriel Senay 1 and Geoffrey Henebry 2 1 SAIC, contractor to the U.S. Geological Survey (USGS) Center for Earth Resources
Drought Irrigation Strategies for Alfalfa
 Making a Difference for California University of California Agriculture and Natural Resources http://anrcatalog.ucdavis.edu Publication 8448 June 211 Drought Irrigation Strategies for Alfalfa BLAINE HANSON,
Rainwater tank study of new homes
 Rainwater tank study of new homes Helena Amaro UWSRA Science & Stakeholder Engagement Forum #4 The objectives Determine the quantity of water savings from rainwater tanks Identify opportunities to improve
Commercial Business Welcome Packet
 Commercial Business Welcome Packet Mission of Arapahoe County Water and Wastewater Authority: To provide sustainable water/wastewater services by optimizing our resources to ensure quality and value while
SUGARCANE IRRIGATION SCHEDULING IN PONGOLA USING PRE-DETERMINED CYCLES
 SUGARCANE IRRIGATION SCHEDULING IN PONGOLA USING PRE-DETERMINED CYCLES N L LECLER 1 and R MOOTHILAL 2 1 South African Sugar Association Experiment Station, P/Bag X02, Mount Edgecombe, 4300, South Africa.
SUSTAINABILITY: Principles, Techniques, Design, and Regulations
 SUSTAINABILITY: Principles, Techniques, Design, and Regulations Ann Audrey City of Tucson Office of Conservation and Sustainable Development January 2009 6 Steps to creating a sustainable site 1. Describe
EVALUATING WATER REQUIREMENTS OF DEVELOPING WALNUT ORCHARDS IN THE SACRAMENTO VALLEY
 EVALUATING WATER REQUIREMENTS OF DEVELOPING WALNUT ORCHARDS IN THE SACRAMENTO VALLEY Allan Fulton ABSTRACT Most of the research on irrigation of walnuts has primarily focused on plant water relations and
EVERY WET YEAR IS A MIRACLE
 EVERY WET YEAR IS A MIRACLE Drought, Climate, and Water Use in Colorado Cat Shrier Colorado State University/Colorado Climate Center Little Thompson Water District Water Forum March 15, 2003 Presentation
Water Supply Board Briefing. Water Operations Department March 22, 2016
 Water Supply Board Briefing Water Operations Department March 22, 2016 Water Supply Briefing California Water Supply District Water Supply Water Supply Projections Water Supply Schedule 2 California Water
From planting to pollination, which is typically the period between October and February, the weather
 ZAR/USD 02 November 2018 South African Agricultural Commodities Weekly Wrap From planting to pollination, which is typically the period between October and February, the weather becomes an important factor
Media Planning and Strategy
 The Traditional Landscape Planning and Strategy Satellite radio stations 2 Broadcast networks (TV and cable) 100 TV stations 3,510 Prof. Pierre Xiao LU, Fudan University Consumer magazines 5,340 Newspapers
SMART Irrigation Controllers How smart are they?
 SMART Irrigation Controllers How smart are they? Loren Oki Dept. of Plant Sciences and Dept. Human Ecology UC Davis Get A Grip On Drip Sacramento, CA October 10, 2017 Topics Irrigation objectives What
Water Requirements and Irrigation Scheduling of Maize Crop using CROPWAT Model
 International Journal of Current Microbiology and Applied Sciences ISSN: 2319-7706 Volume 6 Number 11 (2017) pp. 1662-1670 Journal homepage: http://www.ijcmas.com Original Research Article https://doi.org/10.20546/ijcmas.2017.611.199
Agence Nationale de la Météorologie du Sénégal
 Using INSTAT software with daily rainfall data to estimate best sowing dates for farmers in Saint Louis of Senegal By Elarion Sambou Agence Nationale de la Météorologie du Sénégal (A.N.A.M.S.) BP 8257,
Energy Report - February 2008
 Energy Report - February 28 Glossary Ampere - The unit of measurement of electrical current produced in a circuit by 1 volt acting through a resistance of 1 Ohm. British thermal unit (Btu) - The quantity
Exploring the Possibilities At Prado Dam
 Exploring the Possibilities At Prado Dam Greg Woodside, P.G., C.HG. Executive Director of Planning & Natural Resources December 5, 2017 The Orange County groundwater basin lies at the base of the Santa
Drought/Conservation Update
 Drought/Conservation Update 2016, 2017 and Where We re Going February 27, 2018 Jeff Ulrich Director of Supply Operations TM 2 Bargh Reservoir Fall 2016 3 Regional Water Demands Fall 2016 4 Aquarion Actions
Understanding Your Orchard s Water Requirements
 reducing runoff from irrigated lands PUBLICATION 8212 Understanding Your Orchard s Water Requirements Lawrence J. Schwankl, UC Cooperative Extension Irrigation Specialist; Terry L. Prichard, UC Cooperative