SAMPLING YOUR ESTUARY Level IIB WHAT S IN THE WATER?
|
|
|
- Geraldine Suzanna Campbell
- 6 years ago
- Views:
Transcription

1 SAMPLING YOUR ESTUARY Level IIB WHAT S IN THE WATER? GOAL Students will understand that an estuary is made up of different microenvironments whose plants and animals are dependent on its water quality. OBJECTIVES, students will 1. Conduct research to determine differences between the general habitat and water quality in different sections of the estuary. 2. Investigate the cause of habitat and water quality differences and hypothesize their impact on the estuary. 3. Understand the importance of gathering long-term accurate data; will learn how to display the data; and will learn methods of analyzing the data to determine relationships between different parts of the estuary. SETTING Field Tour to the estuary MATERIALS Materials need for each sampling activity description. The WATER QUALITY SAMPLING RESULTS form is attached to this unit. OTHER RESOURCES A fun resource that allows students to check biological health of US watersheds can be found at For more information about other water quality sampling procedures: New York Sportfishing and Aquatic Resources Education Program (SAREP) Instructor Manual, Cornell Cooperative Extension Service, A great searchable list of water quality activities: Units Level IIB and C work together to guide students in collecting research that will allow them to assess the health of the estuary. These units may be done concurrently or during separate field trips.
 estuarine river or stream as it enters the estuary, 2) the shallow, slow water sloughs or backwaters where the river and lake water mix, and")
2 Background An estuary is comprised of different microenvironments whose plants and animals are dependent on the estuary s water quality. Three easily identified microenvironments include the 1) estuarine river or stream as it enters the estuary, 2) the shallow, slow water sloughs or backwaters where the river and lake water mix, and 3) the mouth of the estuary dominated by the Lake. Example of sampling points used in the These locations have been selected as sampling points in Fish Creek Estuary programs Level II units because they typically have different water quality and habitat parameters and therefore support different plants and wildlife. Teachers need to help students evaluate if differences in water quality parameters are characteristic for each of the three sampling locations or if they point to potential water quality problems impacting the estuary. Sampling results at these points, especially if sampling has been conducted over time, can show important changes in the estuary s water quality. Again, teachers will need to help students hypothesize if these changes are due to natural fluctuations or indicate a water quality issue. Not all estuaries may have water quality problems. Students should understand reasons why sampling and monitoring the estuary is important, even if it there are no current problems. Baseline monitoring overtime can indicate if changes are taking place within the estuary, indicate the source of change, and the potential impact on the estuary. Discuss who would benefit from the data collected in this effort. (Data collection contributes to understanding the ecosystem and data collection contributes to the analysis of long-term trends.) Reinforce that the data collected in Level IIB and C activities will be used to support hypothesis and solutions students will develop in Level III. ACTIVITIES Using the MASTER ESTUARY MAP created in Level I Activities, students should select a minimum of 3 sampling sites within the estuary. These micro-environments within the estuary must be included as sampling points: 1) Along the bank of the estuarine river/stream before it enters the estuary. 2) At the water s edge within the estuary s wetlands or sloughs. 3) At the mouth of the estuary where it enters & mixes with the Lake. Other sampling points may be added to this list


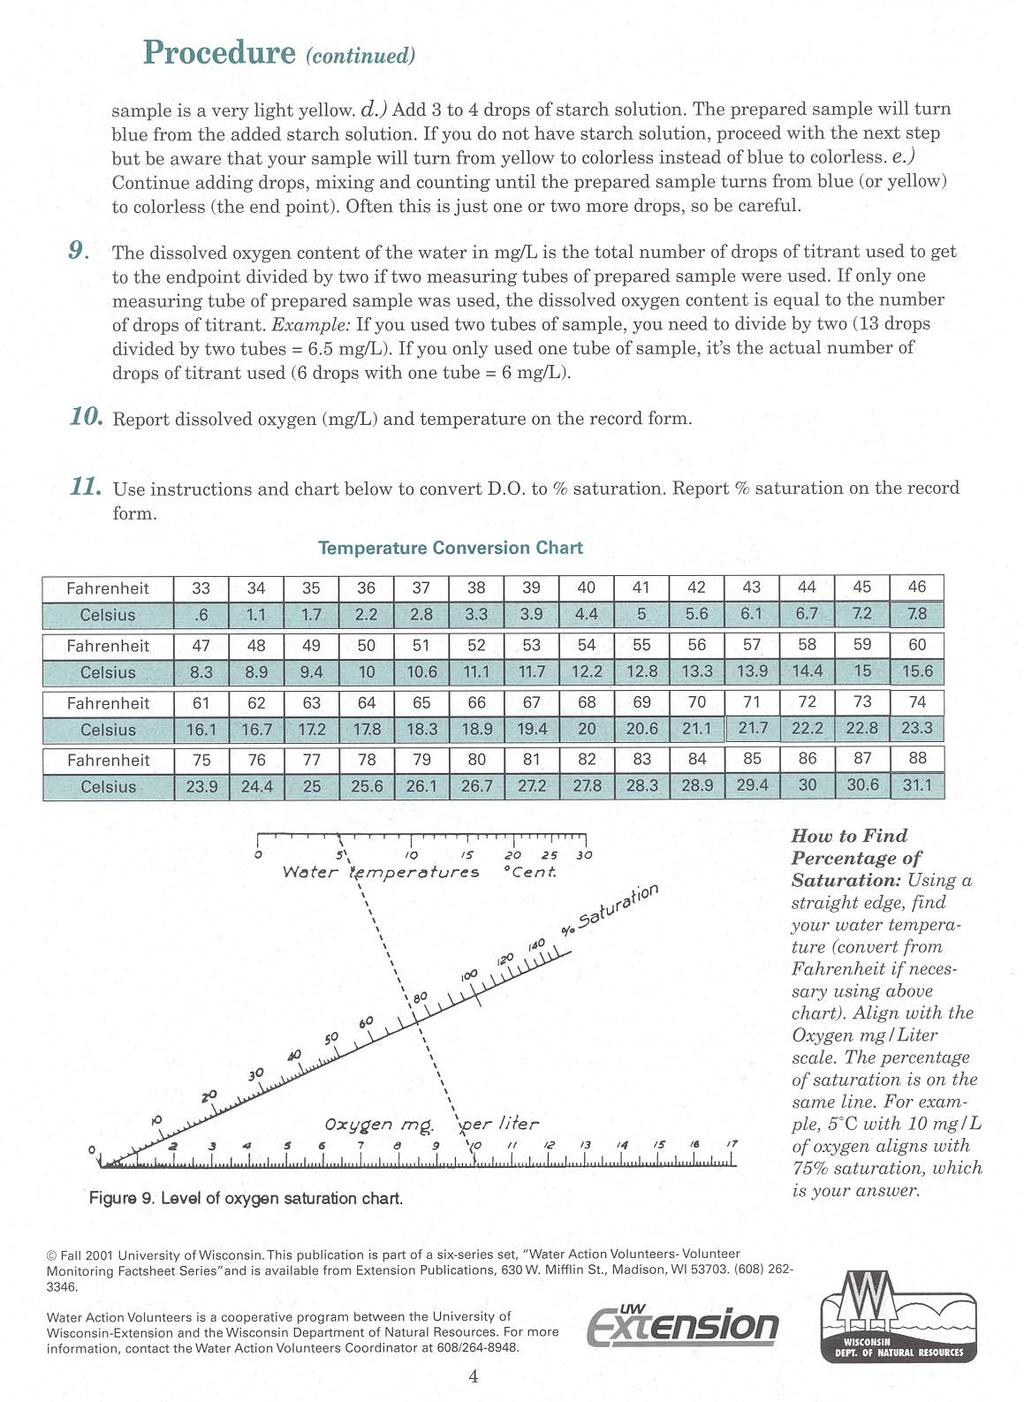
3 Students will be sampling each of these sites for the following water quality parameters: General Habitat Water velocity Turbidity Temperature Dissolved Oxygen I. GENERAL HABITAT ASSESSMENT The following observations will be recorded on page 2 of the WATER QUALITY SURVEY The estuary s habitat functions holistically. This means that any changes to one part can affect the entire system. Certain land uses affect habitat, water quality, and estuary health. This assessment is a visual evaluation of your observations at the sampling point. An estuary is a healthy, dynamic place. Wildlife find shelter and food near and in its water. Vegetation grows along its banks and in its water. Some plants may shade the estuary, cooling its waters. Others grow on its bottom and help filter pollutants and sediments. Within the estuary s waters fish, insects, and other tiny creatures that need certain water temperatures, velocity, and dissolved oxygen to survive. Many land use activities can alter the estuary s characteristics, changing its habitat and the plants and animals that can live there. Measuring Habitat To conduct a Habitat Assessment, you will be making observations within the riparian zone -- the land between the water s edge and the land. Habitat Assessment Materials Needed: Habitat Check List see Water Quality Survey Pens/pencils Observe the following characteristics of the riparian zone at your sampling point and record them on the WATER QUALITY SURVEY. Refer to the survey for choices for these habitat measurements: A. Riparian Zone Vegetation: Trees, bushes, shrubs, tall grasses, sedges, characterize a healthy riparian zone and other plants that help stop pollution from flowing into the estuary. They also provide food and shelter for wildlife. The characteristics of the riparian zone will vary between different parts of the estuary. What is the dominant form of vegetation growing in the riparian zone at each sample site? Natural riparian zones include trees, shrubs, grasses or other native plants that help filter pollutants. Unnatural vegetation in riparian zones, such as cultivated lawns, do little to filter pollutants and sediment from running into the estuary


 slopes at more than a 45-degree angle.")


4 B. Bank Characteristics The shape and condition of the bank between the land and water can give clues to the types of land uses within the watershed. It also indicates if water velocity is high and causes erosion. What shape is the estuary s bank at this sampling point? BANK CHARACTERISTICS An Undercut Bank (above) rises vertically or overhangs the river/stream. This type of bank generally provides good cover for aquatic invertebrates and fish. It is resistant to erosion. This bank usually has good vegetative cover to help stabilize the bank and prevent erosion. However, if the bank is seriously undercut from flooding, it can collapse. A Steeply Sloping Bank (middle) slopes at more than a 45-degree angle. It is very vulnerable to erosion. Gradually Sloping Bank (lower) has a slope of 30- degrees or less. It is very resistant to erosion, but provides little cover for fish or aquatic insects. Artificial Banks (not shown) include ditches, concrete embankments, and other man-made structures. Most are extremely susceptible to erosion. The gradually sloping riparian zone of the lower Kakagon/Bad River Sloughs is more resistant to erosion. The steeply sloping banks along the Sioux River are vulnerable to erosion that can lead to sediment deposits in the Sioux River Estuary. The mouth of the Whittlesey Creek Estuary was channelized or straightened in the 1940 s. This is an example of an artificial stream bank modification. Changing natural bank structure often results in increased erosion. Note the plume of sediment deposited at the mouth of the estuary.
5 C. Bottom Characteristics Observe that the bottom of the estuary is composed of at the sampling point and record your findings. Characteristic types are listed on the survey. D. General Water Characteristics Observe and record the following observations at your sampling point: Water Velocity: The speed or velocity that water flows through the estuary determines which plants and animals will live there. If water flows too quickly, some organisms can t hold on to rocks and plants and will be flushed downstream. If the water flows too slowly, it will warm up and there will not be enough oxygen mixed into it to allow many organisms to live. Presence of pools, riffles, runs: Differences in water depths offer a greater variety of habitats for a greater number of species. Presence of rooted aquatic plants: Rooted aquatic plants provide food and shelter for aquatic organisms. They can also indicate if there is water quality problem, too. Excessive or unnatural amounts of plants may indicate that too many nutrients are being flushed into the estuary. Presence or absence of algae: Algae are simple plants that live mainly on the water. They provide food for animals low on the food chain. Algae may be green, brown, or other colors. It may grow on submerged roots and logs or float on the surface. Excessive algae growth may indicate that pollutants, such as fertilizers, are entering the estuary. Water Appearance: Note any the colors and odors of the water at the sampling point. II. WATER QUALITY PARAMETERS The following observations will be recorded on page 2 of the WATER QUALITY SURVEY A. WATER VELOCITY Water velocity is the speed that water moves over a designated point. It is usually expressed as feet per second. Velocity is directly affected by the amount of water running off the watershed and flowing into the estuary. It can be influenced by weather, changing each season as rainfall or snowmelt increases run-off into the estuary. It also can be affected by diversion of water from a river for irrigation, power generation, or industrial purposes. Different parts of the estuary will have different water velocity rates.
6 Water velocity is important because it influences water quality and the living organisms that inhabit the estuary. The speed that water flows through each part of the estuary influences the following characteristics of it: What kinds of organisms live there Some organisms are adopted to faster flowing water than others The amount of sediment or silt that is deposited or flushed downstream Faster moving water flushes sediments downstream. The faster a stream flows, the more sediment it can carry. The amount of oxygen in the water Faster flowing water generally has higher levels of oxygen than slower moving water Measuring Water Velocity: 1. Put a marker at your sampling point. This will be the starting point. Water Velocity Materials Needed: An orange or tennis ball Tape measure Stopwatch and calculator 2. Mark off second point 10 feet downstream from the first marker. Make this the finish line. In some places within an estuary, it may be difficult to determine which direction is downstream without careful observation. 3. Designate someone as the timekeeper. 4. Place (don t throw) the orange in the water, in line with the first marker. The timekeeper starts the watch as soon as the orange is released. 5. Record the time (to the nearest 1/10 th second) that it takes for the orange to pass the second marker. 6. Calculate the water velocity using this formula: Distance/Time = Velocity 7. Repeat the velocity test 3 times. Average the results of the velocity experiments and record the average velocity for your sampling point on your Water Sampling Form. B. TURBIDITY Turbidity is a measure of water clarity. Turbid means murky. Turbidity is a useful indicator that runoff from non-point sources like construction sites, farm fields, logging, industrial discharge or other natural or non-natural activities is entering the estuary.

7 Soil that enters and mixes with the water is called sediment. It is the chief culprit in making the water turbid. Turbidity can also be caused by suspended materials like small particles of algae floating in the water. Excessive algae growth may indicate that nutrients from farm fields, lawns/gardens, or even natural sources are running into the stream and fertilizing the growth of too much algae in the estuary. All streams and estuaries have some level of turbidity. Fish and aquatic life have evolved over time to adapt to different levels of turbidity. What causes problems is when unusual changes in turbidity happen AND when these changes last for long periods of time. Fish are especially stressed when they have to live in highly turbid water for a long period of time. Fish eggs are ten times more sensitive to turbidity than adult fish. Water turbidity also influences what fish are present. Bass and other species that depend upon good vision to capture their food may be replaced by bullhead and other fish that feed by touch and odor if waters are constantly murky from sedimentation. Turbidity, caused by excess algae, may indicate that oxygen levels are depleted. In this low-oxygen environment only fish, like carp and members of the catfish family, can survive. In zebra mussel-infested waters, the clarity of the water may be improved dramatically due to the capacity of these organisms to filter huge amounts of water. Unfortunately zebra mussels filter out beneficial microorganisms and create a clear, but sterile aquatic environment. The turbidity of the water within the estuary influences it in the following ways: Turbid water keeps sunlight from reaching aquatic plants Sediment and suspended materials can block sunlight from reaching down into the water, interfering with photosynthesis of aquatic plants. Turbid water is warmer than clear water and has less oxygen in it Sediment and suspended materials in the water absorb the sun s heat and warm the water. The warmer the water, the less oxygen it can hold. This directly affects the numbers and types of plants and animals that can live in turbid waters.


8 Measuring Turbidity Turbidity Materials Needed: Secchi Disk and rope Yardstick There are several ways of measuring turbidity. Using a Secchi Disk is the most common. Instructions on how to make a Secchi Disk, if one is not available to your class, are included in this unit. Secchi disks are often available to loan from Wisconsin Dept. of Natural Resource Offices, University water quality labs and field stations. Using the Secchi Disk 1. Hold onto the stick and rope, and lower the Secchi disk into the water until you can no longer see the painted surface. 2. Using the marks on the rope, determine how deep the Secchi disk is when you lose sight of the black and white pattern, or the depth at which it reappears as you bring it back up. This depth in inches is your measure of turbidity. If the water is very shallow and it is impossible to lower disk to the point where the pattern disappears, record the maximum depth (in inches) to which you can lower the Secchi Disk. This depth is your measure of turbidity. Secchi Disk Record the turbidity measurement for your sampling point on the WATER QUALITY SAMPLING RESULTS form C. TEMPERATURE You can measure water temperature easily in shallow water or at the surface using a weather thermometer tied to a string. However, water temperature in deeper water generally differs from that of surface water. Temperature Materials Needed: Thermometer or weighted thermometer Yardstick or heavy string attached to the thermometer If the class will be measuring the temperature of deeper water, consider building a weighted thermometer using the instructions included in this unit. Measuring Temperature 1. Lower the thermometer weighted thermometer into the water and let it remain there for five minutes, at the depth that you wish to measure. A Weighted Thermometer
9 2. While waiting to bring the weighted thermometer out of the water, one of the club members can record the depth at which the temperature is being taken. 3. Bring the can to the surface quickly and read the thermometer. Make sure that the tip of the thermometer is in the water in the can when you measure the temperature. 4. Record the temperature of the water on the WATER QUALITY SAMPLING RESULTS form. Be sure to convert all temperatures to Celsius. A conversion chart is printed attached to this unit. Temperature Tolerance Levels of Selected Aquatic Organisms Greater than 68-degrees F: Upper Range (55-68-degrees F) Lower Range (Less than 55-degrees F) Much plant life, many warm water fish diseases, bass, crappie, bluegill, carp, catfish present Some plant life, some fish disease. Salmon, trout, stonefly nymphs, mayfly nymphs, caddisfly larvae, water beetles, water striders Trout, caddis fly larvae, stonefly nymphs, mayfly nymphs D. DISSOLVED OXYGEN (DO) Oxygen is a gas that is important to all life. The air that we breathe contains about 20% oxygen. Fish and other aquatic life also need oxygen to live, but they don't breathe air like we do. The kind of oxygen that they use is dissolved in the water, and is in a much smaller concentration than is in the air. Fish use their gills to take this oxygen from the water and pass it into their bloodstreams where it can be used by muscles and other organs. Some insects have a type of gills that do this, too. Other insects can absorb the oxygen in the water directly through their body surfaces. There are several ways that oxygen gets dissolved in water. Green plants in the water produce oxygen in a process called photosynthesis. Photosynthesis requires sunlight, so plants produce oxygen only during the day. Oxygen also gets into water as it mixes with the air, or when oxygen is tossed into the water as it tumbles over stones or down a river s rapids. The amount of oxygen that is dissolved in water varies a great deal, depending on the size and depth of the river or lake or stream, the flow rate and temperature of the water, the time of year, and the levels of pollutants that are in the water. The oxygen content of water can change over the course of the day, especially in estuary backwaters. There are two major causes for this natural fluctuation. Water warms up as the sun shines on it. Warmer water holds less DO. However, something


10 else is happening. Microscopic green plants, or plankton, produce oxygen through photosynthesis during sunny days. By late in the afternoon, levels may be extremely high. At night, photosynthesis stops. Plants stop adding oxygen to the water. DO levels tend to crash because plants, bacteria, and aquatic organisms now must use up the DO that the photosynthesis process put into the water during the day in order to survive. Effects of Temperature on DO The maximum amount of oxygen that water can hold depends on the water temperature. The cooler the water, the more oxygen it can hold. The warmer the water is, the less oxygen it will hold. Dissolved oxygen can be also be depleted by these types of pollutants: Pollutants that contain high levels of organic matter (manure, sewage) Bacteria in the water decompose organic matter, such as manure or inadequately treated wastewater. Decomposition cleans up the water, but also-uses up dissolved oxygen in the process. Pollutants that are high in nutrients (fertilizers, phosphorus based soaps) These pollutants promote the excessive growth of plants by fertilizing them. The plants may produce oxygen during the day but use up large amounts at night, causing dramatic variations in DO levels. When the plants die, they sink to the bottom and decompose. The decomposition process depletes DO. Effect of DO on Estuary Species Each type of aquatic organism has a threshold dissolved oxygen level below which it cannot survive. Because these levels vary from species to species, the types of organisms found in a particular body of water provide a living index of water quality. A simple chemistry test for dissolved oxygen (DO) can give you clues about the health of an estuary. In general, the higher the DO, the more different species of plant and animal life the water can support. Low dissolved oxygen levels indicate pollution, either from an organic source such as manure or insufficiently treated wastewater, or from a nutrient (fertilizer) source that causes excess growth of aquatic plants. Dissolved oxygen concentrations in lakes and wetlands normally range from 0 to 18 parts per million (ppm). Young fish and fish eggs, as well as insect life, are especially Manure entering waterways is flushed downstream and can fertilize an estuary.
11 sensitive to dissolved oxygen levels. Many adult fish like salmon and trout cannot survive unless DO levels are above 7 parts per million. Levels below 4 parts per million indicate that there is likely a pollution problem. A difference of two or three parts per million of oxygen can mean the difference between life and death to many aquatic creatures. Immature developing aquatic insects such as stonefly nymphs, water pennies and many mayfly nymphs need high levels of dissolved oxygen for survival. These insects make up part of the diet of some fish. If the insects cannot survive in a stream or pond, what happens to the fish that would eat them? Measuring Dissolved Oxygen Dissolved Oxygen Materials needed: Dissolved oxygen test kit. If available, use a Hach Kit for DO tests. Thermometer, watch to record time Plastic gloves and safety goggles Hach Kits can be ordered from Hach Water Sampling Kit This unit includes a factsheet that gives procedures for testing DO levels using a Hach Kit and a Level of Oxygen Saturation Chart. After completing DO tests, write results on the WATER QUALITY SAMPLING RESULTS form for the sampling site. The sampling protocol for this unit was taken from the UW-Wisconsin, Water Action Volunteer Program. For more information visit or call and ask for publication #GWQ026- Volunteer Monitoring Factsheet Series for a complete guide to water quality sampling.
 TESTING")
12 LEVEL IIB DISOLVED OXYGEN (D0) TESTING PROCEDURE
13
Applicable TEKS. Procedure. Duration. Objectives. Prerequisites. Materials. Temperature Station. ph Station
 L E S S O N LESSON 7 Survey: Physical Properties Applicable TEKS Grade 4 4.1 A 4.2 A, B, D, E, F 4.3 A 4.4 A, B Grade 4 4.1 A, C 4.8 C Duration Two 40-minute lessons Grade 5 5.1 A 5.2 A, C, D, E, F 5.3
BACKGROUND: The following is adapted from the Watershed Cruzin Guide:
 GOALS: To introduce students to the Watsonville Wetlands water system To help students identify sources of water pollution and learn how they can avoid polluting the environment To discuss the importance
Introduction to Water Quality Parameters
 Introduction to Water Quality Parameters Directions: Your group will be assigned one or two Water Quality (WQ) parameters to read about and present to the class. 1. Read the explanations for your assigned
Detective on the case of the...
 Detective on the case of the... River Kid Mystery Allie, the equipment manager, packed the ph kit, thermometer, and bug pan for the hike to the creek. She placed the objects in three of the backpacks.
Water Quality: The Basics
 Water Quality: The Basics Environmental Science Why is Water Quality Important? Effects all humans Safe drinking water Allows for food productions and SAFE food products Effects Wildlife Health domestic
Activity 1: Using the Level of Oxygen- Saturation Chart graph Dissolved Oxygen vs. Temperature at 100% saturation. Start by making a 2 column table.
 Activity 1: Using the Level of Oxygen- Saturation Chart graph Dissolved Oxygen vs. Temperature at 100% saturation. Start by making a 2 column table. Number the first column with temperatures from 0 to
My Stream s Temperatures
 My Stream s Temperatures Temperature Adapted from: An original Creek Connections activity. Creek Connections, Box 10, Allegheny College, Meadville, Pennsylvania 16335. Grade Level: basic, all Duration:
Water Quality Testing
 Field Experience Water Quality Testing How s the Water? Overview Students will use chemical tests to determine the water quality of a local pond. Teacher Background: Water Quality In 1972 the Clean Water
Habitat Assessment: Why are we concerned? The Parts Equal the Whole. Overview of Stream Habitat. Volunteer Monitoring Factsheet Series
 Volunteer Monitoring Factsheet Series 2006 Habitat Assessment: The Parts Equal the Whole Why are we concerned? Time Needed: Equipment Needed: 30 minutes measuring tape markers/flags/ties for trees The
Izaak Walton League Creek Freaks Physical Observations and Measurements Procedures
 Izaak Walton League Creek Freaks Physical Observations and Measurements Procedures Materials o Boots o Rope o Tape Measure o Yard stick o Clothes pins o Timer o Data sheet on clip board with pencil o GPS
Watershed Investigations: How to Assess the Health of a Stream
 Watershed Investigations: How to Assess the Health of a Stream By Joan Chadde, Western UP Center for Science, Mathematics & Environmental Education. All photos by author, unless otherwise noted. Why Monitor
Transparency A Water Clarity Measure
 Volunteer Monitoring Factsheet Series 2010 Transparency A Water Clarity Measure Why are we concerned? Water clarity is one of the most obvious measures of water quality. Water clarity can be a useful indicator
Lakes and Ponds. Questions to consider. Ponds breathe. Sinkhole pond. Oxbow lake. Farm pond. Reservoir
 8 Lakes and Ponds dane johnson / visuals unlimited Oxbow lake Farm pond Sinkhole pond Reservoir albert copley / visuals unlimited Questions to consider 1 2 3 4 5 6 7 How do oxygen levels in ponds change
Missouri Streams. Fact Sheet. What factors affect stream habitat? Stream Habitat Affects Aquatic Communities
 Missouri Streams Fact Sheet Written by Del Lobb & Suzanne Femmer Edited by Sarah Wolken When most people think of habitat, they usually picture places where fish or wildlife live, like a hollow log or
A Claytor Nature Center Stream Monitoring Experience
 A Claytor Nature Center Stream Monitoring Experience Conduct field investigations in which distinctions are made among observations, hypotheses, results and conclusions Perform a visual habitat assessment
Riparian Ecology Station OBJECTIVES
 Riparian Ecology Station OBJECTIVES Students learn The basic definition of a riparian area. The condition of any riparian area greatly affects the water quality and aquatic habitat of the water body it
Water Quality indicators and How Human Activities Affect Water Quality
 Water Quality indicators and How Human Activities Affect Water Quality Name: Online Assignment: Period: Date: Purpose: to learn how to evaluate water quality and how pollution can make water unavailable
When Things Heat Up. To relate the physical and chemical properties of water to a water pollution issue.
 Purpose: Summary: To relate the physical and chemical properties of water to a water pollution issue. In this exercise, students will measure the temperature and dissolved oxygen of a stream (or use their
Reading the River Water A Unit for 3 rd Grade. Lisa Handlon Taylor Mill Elementary Kenton County
 Reading the River 2004 Water A Unit for 3 rd Grade Lisa Handlon Taylor Mill Elementary Kenton County Grade Level: 3 rd Objectives In this lesson, students will: 1) identify aquatic organisms 2) assess
When the Oxygen is Gone
 When the Oxygen is Gone Need for Oxygen Adapted from: Activity 24 "When the oxygen is gone" in Living in Water. The National Aquarium in Baltimore. 1997 Grade Level: Intermediate Duration: 1 class period
Water Chemistry Monitoring
 Chicago River Fieldtrip Activity Summary Students use basic to advanced water quality monitoring kits and probes to assess the water quality of the Chicago River. Water chemistry kits available for loan
Freshwater Ecosystems
 Freshwater Ecosystems The types of organisms in an aquatic ecosystem are mainly determined by the water s salinity. As a result, aquatic ecosystems are divided into freshwater and marine ecosystems. Freshwater
Name. Your Handbook and Journal of. Lake name. Lake Water Quality
 Your Handbook and Journal of Name Lake name Lake Water Quality Table of Contents Page # Section 1 Why do we care about clean water?... 4 How do lakes work?... 5 Section 2 How do we measure the health of
This article is provided courtesy of the American Museum of Natural History.
 Zebra Mussels and the Hudson River This article is provided courtesy of the American Museum of Natural History. Zebra Mussels and the Hudson River A team of scientists at the Cary Institute of Ecosystem
Microhabitats #1: Quantitative Study of Microhabitats
 Microhabitats #1: Quantitative Study of Microhabitats Adapted from: Microhabitats in Environmental Science Activities Kit by Michael Roa. The Center for Applied Research in Education, 1993. Microhabitats
Science Enhanced Scope and Sequence Grade 6. Water Quality
 Water Quality Strand Topic Living Systems Investigating water quality Primary SOL 6.7 The student will investigate and understand the natural processes and human interactions that affect watershed systems.
Resource. ph must be measured in the field. The ph will change if the water is collected and stored, and will not reflect the true value at the site.
 Resource ph What is ph? ph is a measurement of how acidic or alkaline (basic) the water is. ph is measured on a scale of 0 to 14, with 0 being the most acidic, and 14 being the most basic. Distilled water,
INTERMEDIATE BMI ASSESSMENT TIER 2 FIELD SHEET
 INTERMEDIATE BMI ASSESSMENT TIER 2 FIELD SHEET PHYSICAL PARAMETERS ASSESSMENT FIELD SHEET ALL TIERS NAME: DATE: TIME: STREAM OR RIVER NAME: WATERSHED NAME: TOWN: WEATHER PRESENT PAST 48 HOURS SITE DESCRIPTION
The Importance of Riparian Forests
 The Importance of Riparian Forests By Jean Llewellyn Monroe County is the second fastest growing county in Pennsylvania. This rapid growth can be problematic because uncontrolled and unregulated growth
What s in the Water?
 Purpose: Summary: Background: To observe and list abiotic factors in specific ecosystems. In this exercise, students will observe and list abiotic factors in an aquatic system and measure four of them
Supplement A: Dragonfly Adaptations
 Supplement A: Dragonfly Adaptations 1. Double Wings a. With two sets of wings, the dragonfly does not have to beat its wings as rapidly as other insects, enabling it to conserve energy. b. The two sets
Living Lakes. Stage 4 Science Fieldwork at Penrith Lakes. Name : Interesting Facts SIZE: WATER: USES:
 Living Lakes Stage 4 Science Fieldwork at Penrith Lakes Name : Interesting Facts SIZE: WATER: USES: Station 1: Water Tests Test 1: Temperature Test 2: Turbidity Test 3: Phosphate Place the thermometer
What is it? Why is it important? What impacts it?
 Supplement C: Water Quality Information Sheet Water Quality Information SheetMeasure Water Temperature What is it? Why is it important? What impacts it? The level of heat in the degrees Fahrenheit ( F).
Aquatic Science Unit 2. Water Quality and Water Pollution
 Aquatic Science Unit 2 Water Quality and Water Pollution What is a healthy water body? In your own words, take a moment to describe what you believe are some of the characteristics of a healthy stream
Chapter 3 Stream Discharge
 Chapter 3 Stream Discharge - Introductory Level Volunteer Water Quality Monitoring Training Notebook - What is Discharge (Flow)? Discharge, also called flow, is the amount of water that flows past a given
Water Quality and Macroinvertebrates By Teresa Matteson and Heath Keirstead Benton Soil & Water Conservation District
 Water Quality and Macroinvertebrates By Teresa Matteson and Heath Keirstead Benton Soil & Water Conservation District Learning Objectives: Identify aquatic macroinvertebrate pictures Relate insect species/group
2015 State Envirothon
 *Disclaimer: These tests do not reflect the information that will be on tests at the upcoming competitions.* 2015 State Envirothon Aquatics Test (75 Points Total) MULTIPLE CHOICE: Select the best possible
Measure of how much stuff (aka suspended solids) is mixed into the water (i.e., cloudy vs clear) Suspended solids = clay, silt, plankton, industrial
 is mixed into the water (i.e., cloudy vs clear) Suspended solids = clay, silt, plankton, industrial") Measure of how much stuff (aka suspended solids) is mixed into the water (i.e., cloudy vs clear) Suspended solids = clay, silt, plankton, industrial wastes, sewage Should not be confused with color, since
Measure of how much stuff (aka suspended solids) is mixed into the water (i.e., cloudy vs clear) Suspended solids = clay, silt, plankton, industrial wastes, sewage Should not be confused with color, since
Dissolved Oxygen. LabQuest INTRODUCTION
 Dissolved Oxygen LabQuest 5 INTRODUCTION Oxygen gas dissolved in water is vital to the existence of most aquatic organisms. Oxygen is a key component in cellular respiration for both aquatic and terrestrial
WATER QUALITY; WHY IS IT SO IMPORTANT?
 WATER QUALITY; WHY IS IT SO IMPORTANT? by Debra Veeder 62 OBJECTIVES: Students will be able to describe the relationship between chemical changes in a stream and the reasons these changes take place. METHOD:
Ellis Pond Productivity Lab
 Name Per. Ellis Pond Productivity Lab Purpose: In this lab, you will have the opportunity to study the health of an aquatic ecosystem. We will measure the dissolved oxygen concentration and temperature
Water Quality Temperature
 Water Quality Computer 10 The temperature of a body of water influences its overall quality. Water temperatures outside the normal range for a stream or river can cause harm to the aquatic organisms that
Lesson 2-2: Riparian Zones
 2-14 Lesson 2-2: Riparian Zones Time of Lesson: 1 hour Rationale: The purpose of this lesson is to define what a riparian zone is and link its importance for fish and other animals, and humans, and the
Summary. River. 5 th 8 th. about the. Chemical. anteceden. Grade Level: 5 th. 12 th. Objectives: instructions to. determine the. Chicago River Field
 Water Chemistry Monitoring Chicago River Field Trip Activity Summary Students use basic to advanced water quality monitoring kits and probes to assess the water quality of the Chicago River. Water chemistry
Activity 1 Instruction Sheet: Turbidity
 Activity 1 Instruction Sheet: Turbidity Equipment: turbidity tube, measuring cup, waders or boots, life jacket Turbidity is the cloudiness of water. Turbidity is caused by things suspended in the water,
He eia Fishpond Water Monitoring Project Due:
 He eia Fishpond Water Monitoring Project Due: While on your field trip to He eia Fishpond, you will be using a water monitoring kit. This kit was designed to provide a simple, affordable, non-hazardous
EUTROPHICATION. Student Lab Workbook
 EUTROPHICATION Student Lab Workbook THE SCIENTIFIC METHOD 1. Research Background literature research about a topic of interest 2. Identification of a problem Determine a problem (with regards to the topic)
2017 Agricultural Water Quality Workshop
 2017 Agricultural Water Quality Workshop Focus Area Lower Lewis and Clark Clatsop SWCD has identified this area as one that needs much improvement This does not mean we can t do projects in other areas
How Sensitive Are They?
 Pollution Tolerance Levels How Sensitive Are They? Adapted from: An original Creek Connections activity. Creek Connections, Box 10, Allegheny College, Meadville, Pennsylvania 16335. Grade Level: intermediate
Reporting Period: 01/01/2010 to 12/31/2010. Understanding the Level 2 Stream Monitoring Data Report
 Squaw Creek, 10030147 Squaw Creek Latitude: 45.32639, Longitude: -88.945564 Jim Waters, Wolf River Trout Unlimited Andy Killoren, Wolf River Trout Unlimited Reporting Period: 01/01/2010 to 12/31/2010 Understanding
Freshwater ecosystems
 Aquatic Ecosystems Aquatic Ecosystems The types of organisms in an aquatic ecosystem are determined by the water s salinity. Salinity - Amount of salt in the water. Freshwater ecosystems do not have any
Reporting Period: 01/01/2008 to 12/31/2008. Understanding the Level 2 Stream Monitoring Data Report
 Panther Creek, 10010222 Panther Creek Latitude: 44.6216, Longitude: -90.568054 Carol Vedra, Beaver Creek Science Center Steven Hemersbach, Beaver Creek Citizen Science Center Reporting Period: 01/01/2008
Effects of Turbulence on Dissolved Oxygen
 Effects of Turbulence on Dissolved Oxygen Lesson Focus: This lesson focuses on the importance of dissolved oxygen to a healthy aquatic ecosystem and how dissolved oxygen in water can be increased. This
Dirty Water. Adapted from: Dirty Water in Living in Water. National Aquarium in Baltimore, Grade Level: all. Duration: 1-2 class periods
 Dirty Water Adapted from: Dirty Water in Living in Water. National Aquarium in Baltimore, 1997. Nitrogen and Phosphorus Grade Level: all Duration: 1-2 class periods Setting: classroom or laboratory Summary:
Temperature: Air vs. Water vs. More Water
 Temperature: Air vs. Water vs. More Water Temperature Adapted from: A Change in the Weather? in Living in Water. National Aquarium in Baltimore, 1997. Grade Level: basic Duration: 1 class Setting: classroom
State of the Lake Environment Report Black Lake
 State of the Lake Environment Report 2011 Black Lake Black Lake Why Watershed Watch? The Ribbon of Life is the shallow waters and first 10 metres of shore land around our lakes where the land meets the
In 1854, hundreds of people living in London died during a cholera epidemic. The disease spread from India to London.
 The Epidemic (Intro for Poison Pump) In 1854, hundreds of people living in London died during a cholera epidemic. The disease spread from India to London. Cholera is characterized by rapid dehydration
Part I: Salish Sea Introduction. Review:
 Part I: Salish Sea Introduction Review: The Salish Sea The Salish Sea was formed about 20,000 years ago during the last ice age by the carving action of glaciers. There are 3 major parts of the Salish
Land Use Activities Potential Pollution Problems. Land Disposal septic system bacteria, nitrate, phosphate
 If Bugs Could Talk PURPOSE: To describe and identify the link between land use activities within a watershed and water quality. Students will also understand the link between aquatic macroinvertebrates
CHAPTER 4: CHARACTERISTICS IN ECOSYSTEMS
 1 CHAPTER 4: CHARACTERISTICS IN ECOSYSTEMS 4.3. FACTORS AFFECTING ECOSYSTEMS Pages 101-107 Nelson 1. ABIOTIC FACTORS IN TERRESTRIAL ECOSYSTEMS 2 abiotic factors are the non-living components of an ecosystem
Reporting Period: 01/01/2008 to 12/31/2008. Understanding the Level 2 Stream Monitoring Data Report
 St Croix River at Old HWY 53 At Gordon, 163118 Saint Croix River Latitude: 46.252617, Longitude: -91.79963 Susan Peterson, Friends of the Saint Croix Headwaters James Heim, Friends of the Saint Croix Headwaters
SECTION 1 FRESHWATER SYSTEMS UNIT 4: AQUATIC ECOLOGY
 SECTION 1 FRESHWATER SYSTEMS UNIT 4: AQUATIC ECOLOGY CENTRAL CASE STUDY: STARVING THE LOUISIANA COAST OF SEDIMENT LOUISIANA IS LOSING 25MI2 OF COASTAL WETLANDS ANNUALLY WETLANDS SUPPORT A DIVERSITY OF
River of Ashe County, NC
 Running Head: Annual Variations in Mayfly Populations and Relations to Water Quality Annual Variations in Mayfly Populations and Relations to Water Quality in the New River of Ashe County, NC Benjamin
. SECTION 4: STUDENT WORKBOOK
 Exploring Streams: Stream Monitoring Curriculum Guide. SECTION 4: STUDENT WORKBOOK STUDENT NAME Contents Transparency... p. 4-2 to 4-9 Temperature... p. 4-10 to 4-15 Dissolved Oxygen... p. 4-16 to 4-24
POND MUCKING Environmental Education Lesson Plan Edwards Camp and Conference Center
 POND MUCKING Environmental Education Lesson Plan Edwards Camp and Conference Center Summary Using the boat bay as an example of a pond, the students will compare it to Lake Beulah to learn the differences
Interpreting Lake Data
 Interpreting Lake Data Indiana Clean Lakes Program The Indiana Clean Lakes Program was created in 1989 as a program within the Indiana Department of Environmental Management's (IDEM) Office of Water Management.
Fact Sheet. Chesapeake Bay Water Quality
 Fact Sheet Chesapeake Bay Water Quality Water quality is a critical measure of the Chesapeake Bay s health. For the Bay to be healthy and productive, the water must be safe for people and must support
Primer on Pond & Lake Ecology & Watershed Dynamics
 Primer on Pond & Lake Ecology & Watershed Dynamics The water quality of a lake is often described as a reflection of its surrounding watershed. The term lake collectively refers to reservoirs (man-made
Little Bay Water Quality Report Card Spring 2014
 Little Bay Water Quality Report Card Spring 2014 Little Bay is a small, semi-enclosed estuary located in the heart of Rockport, Texas. Estuaries, where freshwater from rivers and streams mixes with salt
Using the Seine Net. Step 1. Two students carefully unroll the seine net so the weighted side is in contact with the river bottom.
 Supplement A: Using the Seine Net Step 1. Two students carefully unroll the seine net so the weighted side is in contact with the river bottom. Step 2. Students walk out to hip-deep water, bumping poles
Stream Health. Stream Bugs Our Stream Health Communicators. Upper Nottawasaga River Stream Health. NVCA Science & Stewardship
 NVCA Science & Stewardship Stream Health Upper Nottawasaga River, 2015 Stream Bugs Our Stream Health Communicators Stream bugs (benthic macroinvertebrates) are organisms that spend much or all of their
Ponds: Careful of the Fish!
 Ponds: Careful of the Fish! Dr. Chuck Cichra Extension Fisheries Specialist University of Florida / IFAS SFRC - Program of Fisheries & Aquatic Sciences All Plants Need Water, Light, and Nutrients Aquatic
Water Monitoring in Spa Creek: A Summary
 Water Monitoring in Spa Creek: A Summary Written by: Alexis Jones & Blake Harden Edited by: Hannah Krauss Water monitoring is very important in order to determine the health of the Chesapeake Bay and its
Turbid Vision. Adapted from: An original Creek Connections activity. Creek Connections, Box 10, Allegheny College, Meadville, Pennsylvania
 Turbid Vision Turbidity Adapted from: An original Creek Connections activity. Creek Connections, Box 10, Allegheny College, Meadville, Pennsylvania 16335. Grade Level: all Duration: 15 minutes Setting:
Pollution Tolerance Index Bag of Bugs
 Pollution Tolerance Index Bag of Bugs Adapted from: An original Creek Connections activity. Creek Connections, Box 10, Allegheny College, Meadville, Pennsylvania 16335. Aquatic Macroinvertebrates - Pollution
Interpreting Lake Data
 Interpreting Lake Data Indiana Clean Lakes Program The Indiana Clean Lakes Program was created in 1989 as a program within the Indiana Department of Environmental Management's (IDEM) Office of Water Management.
3.2 Living in Water. A) VENN diagram - a type of knowledge organizer
 VENN diagram - a type of knowledge organizer") 3.2 Living in Water A) VENN diagram - a type of knowledge organizer 1. 2. 3. 4. 5. Read pages 90 to 91. Compare and contrast rivers and lakes. List points on the river side that apply only to rivers. List
3.2 Living in Water A) VENN diagram - a type of knowledge organizer 1. 2. 3. 4. 5. Read pages 90 to 91. Compare and contrast rivers and lakes. List points on the river side that apply only to rivers. List
Think About It (not on notes)
") Aquatic Ecosystems Think About It (not on notes) We call our planet Earth, yet nearly three-fourths of Earth s surface is covered with water. Despite the vital roles aquatic ecosystems play in the biosphere,
Aquatic Ecosystems Think About It (not on notes) We call our planet Earth, yet nearly three-fourths of Earth s surface is covered with water. Despite the vital roles aquatic ecosystems play in the biosphere,
CBF Water Quality Interactive Map
 CBF Water Quality Interactive Map Student and adult groups that take part Often, they measure the water chemistry to evaluate the be doing it when you come out with us! By compiling these points on a map
Succession Notes. Example of succession: 1) Primary Succession: What is ecological succession? Why does an ecosystem change?
 Primary Succession: What is ecological succession? Why does an ecosystem change?") Succession Notes 1 Topic: Succession What is ecological succession? The process where plants & animals of a particular area are replaced by different more complex species over time. The natural aging of
Succession Notes 1 Topic: Succession What is ecological succession? The process where plants & animals of a particular area are replaced by different more complex species over time. The natural aging of
River Monitoring and Water Resource Terms
 River Monitoring and Water Resource Terms Baseflow: River discharge or flow composed of ground water drainage and delayed surface drainage. Baseflow is typically characterized as that portion of river
Name Hour AP Biology Lab: Dissolved Oxygen in Aquatic Ecosystem: The Relationship between Temperature, DO, and Respiration Rates
 Name Hour AP Biology Lab: Dissolved Oxygen in Aquatic Ecosystem: The Relationship between Temperature, DO, and Respiration Rates Although water is composed of oxygen and hydrogen atoms, biological life
Methods: Record the date and time in the data book.
 Chemical Station Materials & Methods Materials: 3 Tall Plastic Vials with Caps 1 Small Glass Vial with Cap 1 Nitrate Tablet #1 1 ph Tablet 1 Nitrate Tablet #2 1 Phosphate Tablet 2 Dissolved Oxygen (DO)
Ecosystems. 6.L.2.2 Explain how plants respond to external stimuli (including dormancy and forms of tropism) to enhance survival in an environment.
 to enhance survival in an environment.") Ecosystems Date: 6.L.2 Understand the flow of energy through ecosystems and the responses of populations to the biotic and abiotic factors in their environment. 6.L.2.1 Summarize how energy derived from
Ecosystems Date: 6.L.2 Understand the flow of energy through ecosystems and the responses of populations to the biotic and abiotic factors in their environment. 6.L.2.1 Summarize how energy derived from
This section contains terms that are bolded throughout the manual as well as other terms associated with streams and stream rehabilitation.
 1 SECTION 16.0. GLOSSARY OF TERMS This section contains terms that are bolded throughout the manual as well as other terms associated with streams and stream rehabilitation. 2 ADULT - Fish that is mature,
Lesson 4: Biodiversity in a Leaf Pack
 SMILE Program Winter Teachers Workshop 2015 Lesson 4: Biodiversity in a Leaf Pack Lesson Summary: Students will make artificial leaf packs to create a model habitat for freshwater macroinvertebrates. Students
Stream Watch Visual Survey Instructions
 Stream Watch Visual Survey Instructions The Stream Watch Visual Survey is based on assessment parameters from the EPA's Rapid Bioassessment Protocol Habitat Assessment, Georgia Adopt a Stream Visual Survey,
Santa Rosa Creek Water Quality Results 2004
 Santa Rosa Creek Water Quality Results 24 Community Clean Water Institute Site Description: SRC4: Off 3rd Street in downtown Santa Rosa. Behind the Vineyard Hotel just West of Highway 11 along the Prince
Lesson Overview 4.5 Aquatic Ecosystems
 Lesson Overview 4.5 Conditions Underwater What factors affect life in aquatic ecosystems? Aquatic organisms are affected primarily by the water s depth, temperature, flow, and amount of dissolved nutrients.
Jackson Lake Analysis
 Jackson Lake Analysis Lake Zones Lake Zones Limnetic Zone- open water far from shore Light penetrates shallow, allowing photosynthesis Supports phytoplankton (algae, protists, cyanobacteria) which then
Turbidity and Sediment. The Activity
 Turbidity and Sediment Turbidity- an indication the presence of dirt and other particulate matter in water- is an important variable in the health of a stream. The biggest contributor to turbidity is erosion.
Biotic Factors Abiotic factors Plants (producers or autotrophs) Animals (consumers or heterotrophs) Water Fungi (decomposers) Soil
 Animals (consumers or heterotrophs) Water Fungi (decomposers) Soil") Lab # 18 Experiment Title: Biotic and Abiotic components of the Hudson River Aim: What are some of the biotic and abiotic factors that are found in the Hudson River? Background Information: Please read
Lab # 18 Experiment Title: Biotic and Abiotic components of the Hudson River Aim: What are some of the biotic and abiotic factors that are found in the Hudson River? Background Information: Please read
STREAM EROSION. The Activity
 1 STREAM EROSION Erosion is an ongoing process on all bodies of water, especially moving water. Both natural and humancaused factors affect the amount of erosion a stream may experience. Natural factors
Reporting Period: 01/01/2010 to 12/31/2010. Understanding the Level 2 Stream Monitoring Data Report
 Eau Claire River at Outlet Bay Rd, 10029003 Upper Eau Claire Lake Latitude: 46.302803, Longitude: -91.50336 Susan Peterson, Friends of the Saint Croix Headwaters John Kudlas, Friends of the St.Croix Headwaters
Live Foods from the Wild Part II Where to Find Wild Foods. A presentation for The Angelfish Society October 17, 2010 by Tamar Stephens
 Live Foods from the Wild Part II Where to Find Wild Foods A presentation for The Angelfish Society October 17, 2010 by Tamar Stephens About this presentation This is the second in a series of presentations
CHAPTER 15 WATER POLLUTION. INTO THE GULF Researchers try to pin down what s choking the Gulf of Mexico
 CHAPTER 15 WATER POLLUTION INTO THE GULF Researchers try to pin down what s choking the Gulf of Mexico SAVING THE BAY Teams of researchers try to pin down what s choking the Chesapeake Water pollution
WATER QUALITY TESTING STATION
 WATER QUALITY TESTING STATION Today, the students at your station are citizen scientists! Objectives Students will understand the importance and techniques of water quality sampling by: 1) Performing stream
Lake Washington. Water Quality Assessment Report. Copyright 2012 PLM Lake & Land Management Corp.
 Lake Washington 2012 Water Quality Assessment Report Copyright 2012 PLM Lake & Land Management Corp. Water Quality Report On May 22nd, June 18th, July 30th, August 29th, and September 27 th, 2012, PLM
Student Data Sheet 1
 Student Data Sheet 1 Name Date Latitude (e.g. 75 o N) Longitude (e.g.18 o W) Recent weather conditions: Current weather (circle one) Clear Partly Cloudy Fog Overcast Rain Snow Air Temperature C or F Wind
The Science of Maryland Agriculture
 Edition 3 (2016) GOAL STATEMENT: Students will understand how Maryland farmers and developers can use conservation techniques to reduce environmental damage. OBJECTIVES: Students will identify ways agriculture