A Claytor Nature Center Stream Monitoring Experience
|
|
|
- Esmond Augustus Webster
- 5 years ago
- Views:
Transcription
1 A Claytor Nature Center Stream Monitoring Experience Conduct field investigations in which distinctions are made among observations, hypotheses, results and conclusions Perform a visual habitat assessment of Big Otter River Perform chemical monitoring tests Perform biological monitoring /pollution tolerance index (PTI) and learn to id macroinvertebrates Gain understanding of how human activities influence the distribution and quality of freshwater Gain experience using a variety of field equipment


2 Major Tributaries of the Chesapeake Bay Chesapeake Bay Foundation:

3 Heavy rains lead to more sedimentation and nutrient loading into bay- suburban wastewater and farmland fertilizer increased algal blooms leading to decreased dissolved oxygen harming fish, etc Chesapeake Bay s dead zone, is the area in which dissolved oxygen drops below 0.2 milligrams/liter of water. /docs/briefs/chesbay906.pdf
4 Stream Ecology Vocabulary Stream monitoring- to watch and care for a stream or river on a regular basis, including visual, chemical, and biological assessments Watershed- an area of land that drains into a specific body of water like a river, stream, or lake Riparian zone- area of vegetation next to the stream composed of some leafy plants, shrubs, and trees Canopy- portion of riparian area that provides overhead cover (trees) which helps determine shade and temperature for organisms
5 Visual Habitat Vocabulary Abiotic- any parameter of a stream or ecosystem that is nonliving - temp, dissolved oxygen, nutrients (nitrogen, phosphate), ph, substrate, flow, stream velocity Habitat- area in which plants or animals, including aquatic organisms live. Includes food, water, shelter, and space Substrate- stream bottom, bedrock, silt, cobble stones, etc. Cobble stone- 2 to 10 size stone, under which benthic organisms can be found
6 Visual Habitat Vocabulary Smothering- evidence of sands and silts covering substrate Sediments- sand/silt found in freshwater systems often exacerbated by erosion and human activities Erosion- movement of surface sediments into a water body, more in areas of land development Sinuousity- curviness of a stream, often altered by humans Riffles- area in-between the pools where rocks break the surface of the water Runs- relatively fast moving water in a stream
7 Visual Habitat Vocabulary Pools- relatively slow moving or stagnant water in a stream Point source pollution- a known direct discharge of pollutants into a water body, such as industrial source or wastewater treatment plant Non-point source pollution- source of pollution not directly known, however numerous human activities typically cause non-point source discharges into a water body from runoff. Human activities include fertilizers, pesticides, oil and gas, animal wastes, etc. Runoff- water, including rain or snow, which is not absorbed into the ground, flows across land carrying materials into streams and rivers
8 Chemical Monitoring Temperature- water temp controls freshwater systems and affects biological and chemical processes ph- concentration of hydrogen ions (H+) or hydroxide ions (OH-) determines the ph of the freshwater system, and affects biological and chemical processes Dissolved oxygen (DO)- oxygen as a dissolved gas in a freshwater system, critical to aquatic life Nitrates/nitrites/ ammonia- generally enters a freshwater system from fertilizers and/or animal wastes
9 Chemical Monitoring Turbidity- water clarity is deremined by the amount of suspended solids including sand, silt, and organic material turbid water can be the result of erosion Phosphates- while phosphates are naturally occurring in freshwater systems, high concentrations may be from faulty septics, fertilizers, or industrial/construction or household sources
10 Biological Monitoring Macroinvertebrate- animals without backbones which you can see without a microscope Benthic- bottom dwelling organisms that tend to cling under cobble stones in a stream Biotic- living organisms including trees, shrubs, herbaceous plants, algae, wildlife, fish, and macroinvertebrates, plankton, etc Kick seine- rectangular net used to sample a 1 meter by 1 meter area of a riffle area, particularly under the substrate Dip net- or D net, is used to jab at the bottom in other habitats around the stream
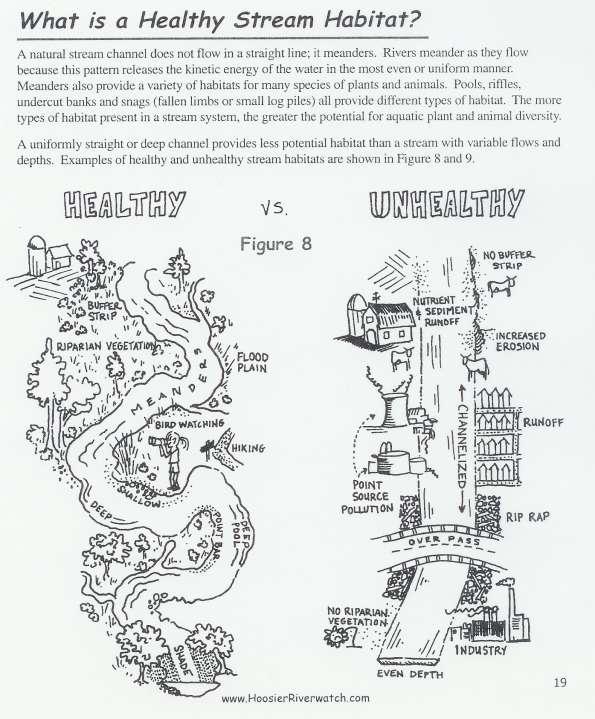
11 Visual Habitat Assessment Substrate (stream bottom) Habitat (fish cover, suitable envir for macroinv) Stream shape/human alterations Land use (riparian zone, forest, agricultural, recreational) Depth and velocity of the stream Riffle/runs/pools in the monitoring site Visual assessment may help form a hypothesis about water quality and to begin biological and chemical research
12 Habitat Assessment

13 Riparian Zone Areas of vegetation adjacent to stream channels Bank support and stabilization, erosion and flood control, water quality protection, fish and wildlife habitat, scenic beauty, keeps water cool by providing shade, plant litter that falls into water is source of food

14 Citizens Qualitative Habitat Evaluation Index (CQHEI)

15 Citizens Qualitative Habitat Evaluation Index (CQHEI)

16 Citizens Qualitative Habitat Evaluation Index (CQHEI)

17 Draw a Site Map 200 foot stream segment
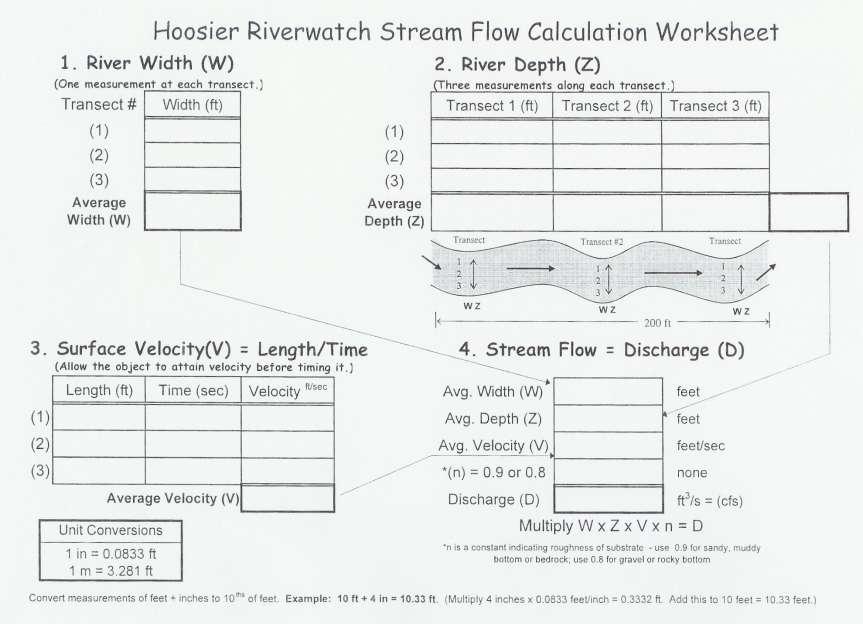
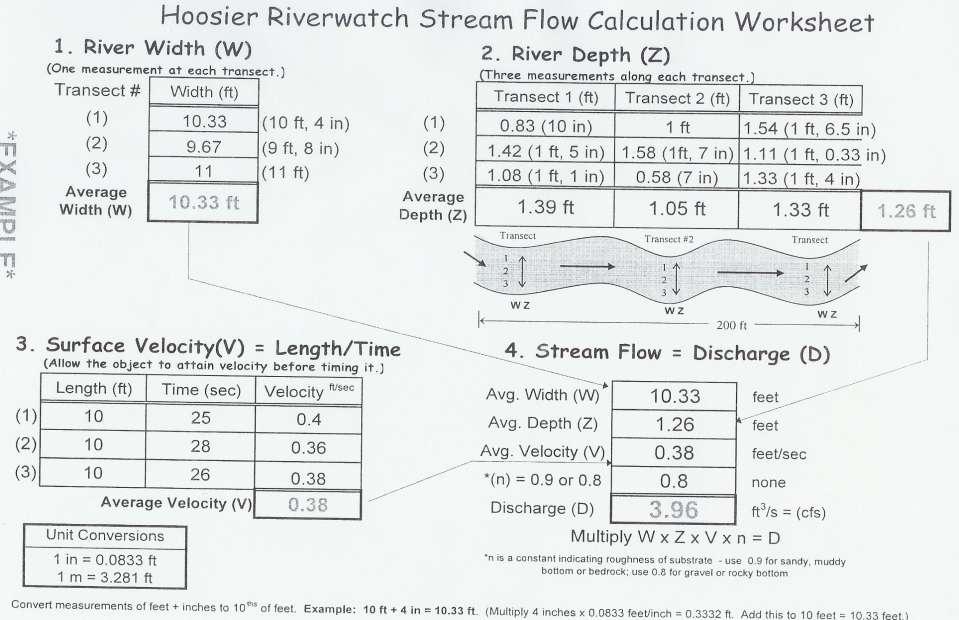
18 Stream Flow Calculations Discharge rate is the amount or volume of water flowing in the stream per second Influences other physical, chemical, and biological factors in the stream (all of our other tests) High discharge rate may indicate recent rainfall Low discharge rate may indicate drought conditions, affect water quality and aquatic life Discharge rate is obtained by multiplying the average width, depth, and velocity of stream All measurements converted into feet Avg width (W)- stream bank to stream bank-3 readings Avg depth (Z)- 3 readings with yardstick across stream on three transects- 9 total measurements Avg velocity (V)- speed of water, measure distance and time it takes an apple to float the distance, 3 readings Roughness coefficient (n)- 0.8 for gravel/rocky bottom; 0.9 for sandy, muddy, or bedrock
19 Stream Flow Calculations
20 Stream Flow Calculations

21 Aquatic Food Web
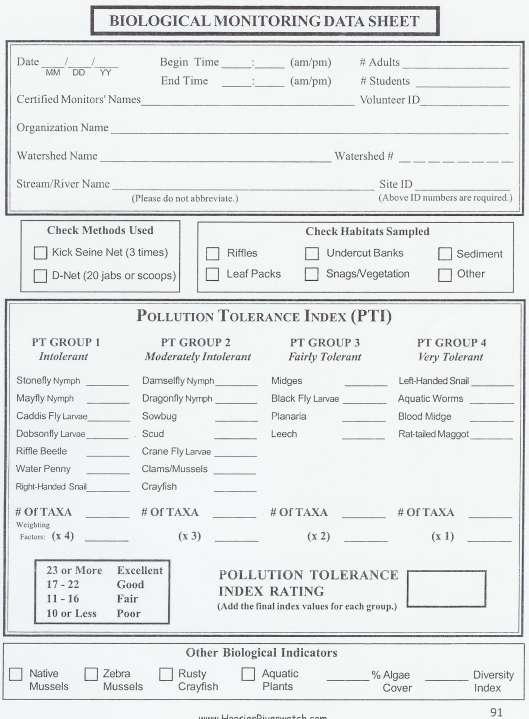
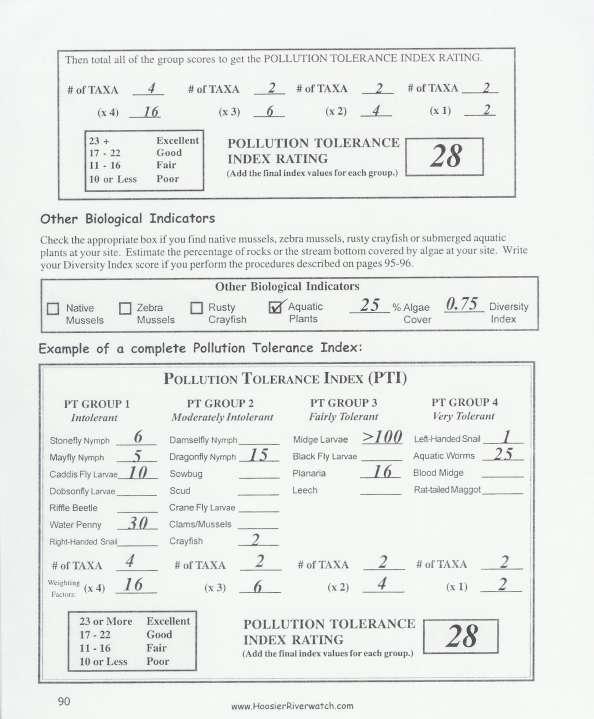
22 Biological Monitoring of Big Otter River Researchers use macroinvertebrates to determine water quality Some are tolerant and can live in harsh conditions and some are very sensitive and cannot live in harsh conditions Pollution Tolerance Index (PTI) to record and interpret data Kick seine and dip net for sampling and collecting data (organisms) Change in number and types of organisms can determine richness of biodiversity

23 How Do We Collect Them?

24 How Do We Collect Them?
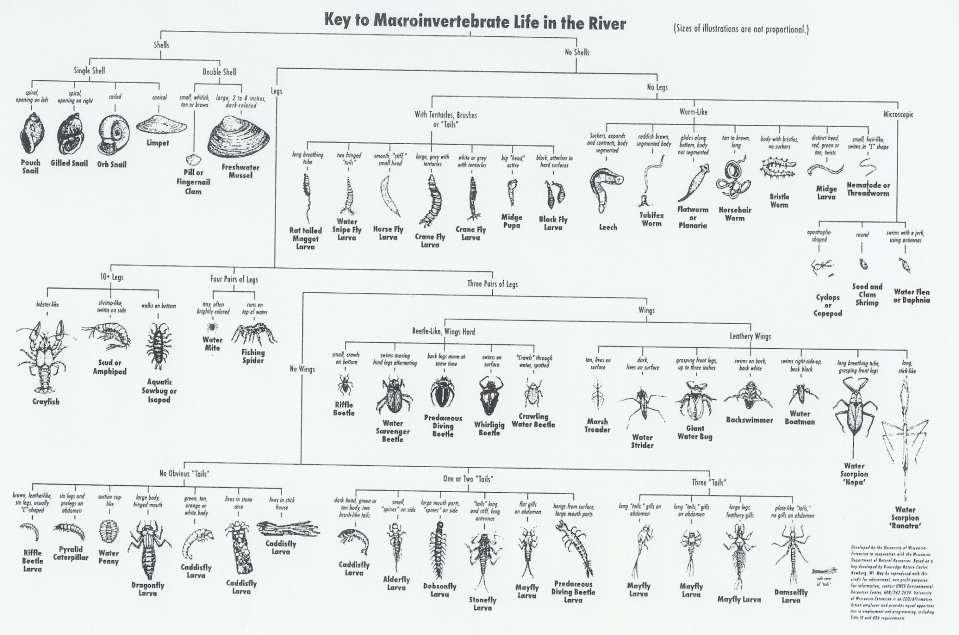
25 Key to Macroinvertebrates

26 ID Key and Pollution Detection Pollution-sensitive: mayflies, stoneflies, caddisflies- indicators of the absence of pollutants Pollution-tolerant: midges and wormsabsence or presence of them is an indirect measure of pollution


27 Other Organisms You Might See hellgrammite
28
29
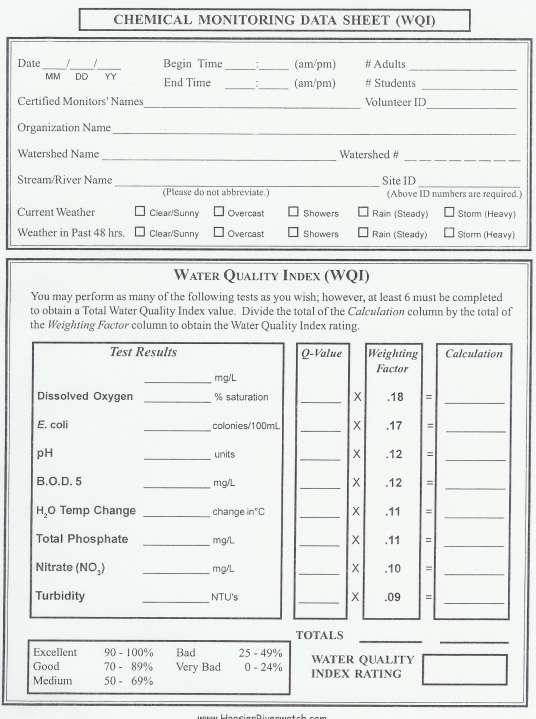
30 Chemical Monitoring of Big Otter River Temperature ph Dissolved oxygen Nitrates/nitrites Phosphates Alkalinity Turbidity These affect organisms and it is important for us to monitor they
31 Hints for performing chemical tests Do not wear sunglasses when performing tests Rinse collection tubes or bottles with sample water before collecting sample Rinse collection tubes or bottles with distilled water after completing each test Obtain water sample from the stream s main flow (middle usually). Take sample 3-5 inches under the surface. You may have to discard chemical waste in a specially labeled container Ppm- Parts Per Million (one minute in two years or one inch in sixteen miles) Same as mg/l

32 Water Watering Parameters are Interrelated

33 Units of Measurement and Indices
34
Water Quality Testing
 Field Experience Water Quality Testing How s the Water? Overview Students will use chemical tests to determine the water quality of a local pond. Teacher Background: Water Quality In 1972 the Clean Water
Mock Stream Habitat Assessment: Bringing the outside in!
 Mock Stream Habitat Assessment: Bringing the outside in! Objectives: At the end of this activity, youth should be able to: Assess the overall health of a stream habitat Apply the terms abiotic and biotic
Watershed Investigations: How to Assess the Health of a Stream
 Watershed Investigations: How to Assess the Health of a Stream By Joan Chadde, Western UP Center for Science, Mathematics & Environmental Education. All photos by author, unless otherwise noted. Why Monitor
River Monitoring and Water Resource Terms
 River Monitoring and Water Resource Terms Baseflow: River discharge or flow composed of ground water drainage and delayed surface drainage. Baseflow is typically characterized as that portion of river
Biotic Factors to Monitor Water Quality
 Biotic Factors to Monitor Water Quality Parts of a Stream or River Riffles white water area usually with rock substrate protruding through the surface of the water Runs area in between white water, without
CHAPTER 15 WATER POLLUTION. INTO THE GULF Researchers try to pin down what s choking the Gulf of Mexico
 CHAPTER 15 WATER POLLUTION INTO THE GULF Researchers try to pin down what s choking the Gulf of Mexico SAVING THE BAY Teams of researchers try to pin down what s choking the Chesapeake Water pollution
Impact of an Agricultural Point Source on Macroinvertebrate Communities and Water Quality on the Lamoille River
 Impact of an Agricultural Point Source on Macroinvertebrate Communities and Water Quality on the Lamoille River Fundamentals of Ecology 12/2/05 Introduction The purpose of this study was to determine if
The Snapshot CONODOGUINET CREEK WATERSHED SNAPSHOT
 CONODOGUINET CREEK WATERSHED SNAPSHOT ABOVE: CONODOGUINET CREEK AT RT 74 BRIDGE FACING DOWNSTREAM The Snapshot The Conodoguinet Watershed Snapshot was a collaborative effort to engage local citizens in
BACKGROUND: The following is adapted from the Watershed Cruzin Guide:
 GOALS: To introduce students to the Watsonville Wetlands water system To help students identify sources of water pollution and learn how they can avoid polluting the environment To discuss the importance
LOCATION: Circle Your Location
 SSU WATERS COLLABORATIVE - COPELAND CREEK WATER QUALITY PROJECT WATER QUALITY DATA SHEET Student Names (no name, no credit!): Date: Tests on This DataSheet: Time: Conductivity/TDS Temperature Discharge
EUTROPHICATION. Student Lab Workbook
 EUTROPHICATION Student Lab Workbook THE SCIENTIFIC METHOD 1. Research Background literature research about a topic of interest 2. Identification of a problem Determine a problem (with regards to the topic)
Buffered Stream, Healthy Stream
 Buffered Stream, Healthy Stream Adapted from: An original Creek Connections activity. Creek Connections, Allegheny College, Meadville, Pennsylvania, 16335 Riparian Buffers Enhance Water Quality Grade Level:
Today s Webinar: Types of Monitoring and Assessment Data and What They Mean
 Welcome to the 1 st Webinar in the Series Monitoring & Assessment for Watershed Plans: Identifying, Accessing, and Using Data to Protect and Restore Indiana s Waters Each Monday in May at noon Today s
Carp Creek 2013 Summary Report
 Monitoring Activity in the Carp River Watershed In 2012, Mississippi Valley Conservation Authority (MVCA) worked with Friends of the Carp River (FCR) on a preliminary assessment of the Carp River. This
Resource. ph must be measured in the field. The ph will change if the water is collected and stored, and will not reflect the true value at the site.
 Resource ph What is ph? ph is a measurement of how acidic or alkaline (basic) the water is. ph is measured on a scale of 0 to 14, with 0 being the most acidic, and 14 being the most basic. Distilled water,
Ellen Bailey. UWW Educator training January 13,
 Ellen Bailey UWW Educator training January 13, 2017 ellen.bailey@usu.edu 801-536-4432 Utah Water Watch Partnership between USU Extension and the DWQ Started in 2012 Trained 750+ volunteers, monitoring
itself is a stream disturbance and too heavy a monitoring cycle can negatively impact macroinvertebrate populations.
 Virginia Save Our Streams Eastern Biomonitoring Method for Muddy Bottom Streams Stream Quality Survey Instructions Standard Operating Procedures for Macroinvertebrate Population Surveys Background The
Acidity and Alkalinity:
 Evaluation of Pollution Sources to Lake Glenville Quarterly Report December 2018 Kimberlee K Hall, PhD Environmental Health Program, Western Carolina University Summary Chemical and microbial analysis
Water Quality: The Basics
 Water Quality: The Basics Environmental Science Why is Water Quality Important? Effects all humans Safe drinking water Allows for food productions and SAFE food products Effects Wildlife Health domestic
Aquatic Science Unit 2. Water Quality and Water Pollution
 Aquatic Science Unit 2 Water Quality and Water Pollution What is a healthy water body? In your own words, take a moment to describe what you believe are some of the characteristics of a healthy stream
Riffle Beetles to Riparian Buffers
 We care about WateR. it S What We do. Riffle Beetles to Riparian Buffers Exploring Methods of Assessing Surface Water Quality Grade level: 7-12 objective: Students will evaluate the quality of two water
BMP 5.4.2: Protect /Conserve/Enhance Riparian Areas
 BMP 5.4.2: Protect /Conserve/Enhance Riparian Areas The Executive Council of the Chesapeake Bay Program defines a Riparian Forest Buffer as "an area of trees, usually accompanied by shrubs and other vegetation,
Anthropogenic Impacts on Bays and Watersheds. HI-MOES Presentation 2009 The Kohala Center Kohala Watershed Partnership
 Anthropogenic Impacts on Bays and Watersheds HI-MOES Presentation 2009 The Kohala Center Kohala Watershed Partnership Some Common Terms Watershed = An area of land that drains into a common destination
National Science Content Standards: A: Science as Inquiry E: Science and Technology
 National Science Content Standards: A: Science as Inquiry E: Science and Technology To develop an understanding of water quality monitoring and an appreciation of the methods used to keep water safe and
The Importance of Riparian Forests
 The Importance of Riparian Forests By Jean Llewellyn Monroe County is the second fastest growing county in Pennsylvania. This rapid growth can be problematic because uncontrolled and unregulated growth
Otonabee Region WATERSHED
 Otonabee Region WATERSHED Report Card 2018 Otonabee Conservation has prepared this report card as a summary of the state of your forests, wetlands, and water resources using data from 2012 to 2016. WHERE
Agawam River Project - 10 Years Later
 Bridgewater State University Virtual Commons - Bridgewater State University Watershed Access Lab Projects Watershed Access Lab 2013 Agawam River Project - 10 Years Later Recommended Citation St. Margaret
Water Chemistry Monitoring
 Chicago River Fieldtrip Activity Summary Students use basic to advanced water quality monitoring kits and probes to assess the water quality of the Chicago River. Water chemistry kits available for loan
Missouri Streams. Fact Sheet. What factors affect stream habitat? Stream Habitat Affects Aquatic Communities
 Missouri Streams Fact Sheet Written by Del Lobb & Suzanne Femmer Edited by Sarah Wolken When most people think of habitat, they usually picture places where fish or wildlife live, like a hollow log or
Science Enhanced Scope and Sequence Grade 6. Water Quality
 Water Quality Strand Topic Living Systems Investigating water quality Primary SOL 6.7 The student will investigate and understand the natural processes and human interactions that affect watershed systems.
Izaak Walton League Creek Freaks Physical Observations and Measurements Procedures
 Izaak Walton League Creek Freaks Physical Observations and Measurements Procedures Materials o Boots o Rope o Tape Measure o Yard stick o Clothes pins o Timer o Data sheet on clip board with pencil o GPS
Background. AEM Tier 2 Worksheet Stream & Floodplain Management. Glossary
 AEM Tier 2 Worksheet Stream & Floodplain Management Glossary Bankfull Stage: The stage at which water starts to flow over the flood plain; the elevation of the water surface at bankfull discharge. (This
Appendix D: Visual aids and handouts for graphing lessons
 Appendix D: Visual aids and handouts for graphing lessons Macroinvertebrate Graphing Activity Amount Stonefly Caddisfly Beetle Cranefly Midge Leech 41 Water Pollution Graphing Activity Amount Sediment
My Stream s Temperatures
 My Stream s Temperatures Temperature Adapted from: An original Creek Connections activity. Creek Connections, Box 10, Allegheny College, Meadville, Pennsylvania 16335. Grade Level: basic, all Duration:
Biofilter Wetland at Harrow Run Water Quality Evaluation of Pollutant Removal Efficiency from a Tailwater Recovery System
 Objective and Scope Biofilter Wetland at Harrow Run Water Quality Evaluation of Pollutant Removal Efficiency from a Tailwater Recovery System In November of 2004, a biofilter wetland was installed to treat
INTERMEDIATE BMI ASSESSMENT TIER 2 FIELD SHEET
 INTERMEDIATE BMI ASSESSMENT TIER 2 FIELD SHEET PHYSICAL PARAMETERS ASSESSMENT FIELD SHEET ALL TIERS NAME: DATE: TIME: STREAM OR RIVER NAME: WATERSHED NAME: TOWN: WEATHER PRESENT PAST 48 HOURS SITE DESCRIPTION
HYDROSPHERE EOG REVIEW
 HYDROSPHERE EOG REVIEW 1 Why is fresh water in short supply on Earth? A. Most of it is frozen B. Most of it is polluted C. Most of it is in the atmosphere D. Most of it is trapped underground A. About
VIDEO: Riparian Forest Buffers: The Link Between Land & Water
 VIDEO: Riparian Forest Buffers: The Link Between Land & Water Introduction to Riparian Buffers Adapted from: Riparian Forest Buffers: The Link Between Land & Water. Maryland Cooperative Extension. Wye
Aquatic Species Diversity and Water Quality
 Aquatic Species Diversity and Water Quality Reference: Wagner & Sanford. Environmental Science. Wiley & Sons, 2005 Introduction: Freshwater is only a small part of the Earth s supply of water, yet it is
SUMMARY OF INDIAN MILL CREEK WATERSHED ASSESSMENT KENT, MICHIGAN
 SUMMARY OF INDIAN MILL CREEK WATERSHED ASSESSMENT KENT, MICHIGAN INTRODUCTION BY: MARY SIEVERT, STUDENT ASSISTANT AND JANICE TOMPKINS, SENIOR WATER QUALITY ANALYST FIELD OPERATION SECTION WATER DIVISION
Maitland Valley WATERSHED
 Maitland Valley WATERSHED Report Card 2018 Maitland Conservation has prepared this report card as a summary of the state of your forests, wetlands, and water resources. WHERE ARE WE? We are one of 36 Conservation
Activity 1: Using the Level of Oxygen- Saturation Chart graph Dissolved Oxygen vs. Temperature at 100% saturation. Start by making a 2 column table.
 Activity 1: Using the Level of Oxygen- Saturation Chart graph Dissolved Oxygen vs. Temperature at 100% saturation. Start by making a 2 column table. Number the first column with temperatures from 0 to
BIOASSESSMENT OF STREAMS
 OBJECTIVES The student will do the following: 1. Work as a team to gather organisms from a stream to evaluate if the water quality is excellent, good, or fair to poor. BACKGROUND INFORMATION The quality
Watts Creek 2014 Summary Report
 Monitoring Activity in the City of Ottawa In 2012, Mississippi Valley Conservation Authority (MVCA) and the Friends of the Carp River (FCR) collaborated to undertake a broad scale assessment of potential
Starting Your Own Water Monitoring Program
 Starting Your Own Water Monitoring Program By initiating your own citizen-based watershed group, you can serve your community by leading and taking part in activities to protect and restore your local
Redwood Shores Lagoon November 2016 Monthly Water Quality Monitoring Report
 Redwood Shores Lagoon November 2016 Monthly Water Quality Monitoring Report Prepared for Redwood City Public Works Services Department 1400 Broadway Redwood City, CA 94063-2594 Prepared by Clean Lakes,
Redwood Shores Lagoon February 2019 Monthly Water Quality Monitoring Report
 Redwood Shores Lagoon February 2019 Monthly Water Quality Monitoring Report Prepared for Redwood City Public Works Services Department 1400 Broadway Redwood City, CA 94063-2594 Prepared by Clean Lakes,
Chapter 5: Water Quality Buffer Requirements
 Chapter 5: Water Quality Buffer Requirements 5.1 Introduction Water quality buffer requirements apply to all new land development or redevelopment containing streams or other water bodies such as ponds,
AP Environmental Science
 AP Environmental Science Types of aquatic life zones MARINE Estuaries coral reefs mangrove swamps neritic zone pelagic zone FRESHWATER lakes and ponds streams and rivers wetlands Distribution of aquatic
Impacts to Aquatic Habitats from Land-Use or Is It Polluted?
 Impacts to Aquatic Habitats from Land-Use or Is It Polluted? Water Pollution is: The addition of excessive carbon to a system The addition of large amounts of materials to water that causes adverse changes
REPORT. Report No: 2013/0958 Prepared For: Natural Resources Committee Prepared By: Dean Olsen, Environmental Resource Scientist Date: 11 July 2013
 REPORT Document Id: A544088 Report No: 2013/0958 Prepared For: Natural Resources Committee Prepared By: Dean Olsen, Environmental Resource Scientist Date: 11 July 2013 Subject: Waianakarua River Water
Redwood Shores Lagoon May 2017 Monthly Water Quality Monitoring Report
 Redwood Shores Lagoon May 2017 Monthly Water Quality Monitoring Report Prepared for Redwood City Public Works Services Department 1400 Broadway Redwood City, CA 94063-2594 Prepared by Clean Lakes, Inc.
Santa Rosa Creek Water Quality Results 2004
 Santa Rosa Creek Water Quality Results 24 Community Clean Water Institute Site Description: SRC4: Off 3rd Street in downtown Santa Rosa. Behind the Vineyard Hotel just West of Highway 11 along the Prince
Reading the River 2006 Water Study Sixth Grade Science Mindy Fry Kenton County
 Reading the River 2006 Water Study Sixth Grade Science Mindy Fry Kenton County Curriculum Plan Lesson Context: To kick off this unit of study, I will have Jamie Egglemeyer from Sanitation District No.
Eutrophication: Tracing Nutrient Pollution Back to Penns Creek
 Eutrophication: Tracing Nutrient Pollution Back to Penns Creek Nutrients are substances that life depends on for growth and reproduction. However, when these nutrients enter our planets waterways in excess,
Habitat Assessment: Why are we concerned? The Parts Equal the Whole. Overview of Stream Habitat. Volunteer Monitoring Factsheet Series
 Volunteer Monitoring Factsheet Series 2006 Habitat Assessment: The Parts Equal the Whole Why are we concerned? Time Needed: Equipment Needed: 30 minutes measuring tape markers/flags/ties for trees The
ECOSYSTEMS, WATERSHEDS AND POLLUTION CONTROL REVIEW
 ECOSYSTEMS, WATERSHEDS AND POLLUTION CONTROL REVIEW ECOSYSTEMS: (6 th grade content) How biotic and abiotic factors make an ecosystem: https://www.youtube.com/watch?v=mdlwptkg-vi 1. A/An ecosystem is a
Lake Washington. Water Quality Assessment Report. Copyright 2012 PLM Lake & Land Management Corp.
 Lake Washington 2012 Water Quality Assessment Report Copyright 2012 PLM Lake & Land Management Corp. Water Quality Report On May 22nd, June 18th, July 30th, August 29th, and September 27 th, 2012, PLM
Summary. River. 5 th 8 th. about the. Chemical. anteceden. Grade Level: 5 th. 12 th. Objectives: instructions to. determine the. Chicago River Field
 Water Chemistry Monitoring Chicago River Field Trip Activity Summary Students use basic to advanced water quality monitoring kits and probes to assess the water quality of the Chicago River. Water chemistry
Stream Observation Data Sheet School: Charleroi Middle School Date 9/24/15 Stream Study Site: Maple Creek. Macroinvertebrate Survey
 Stream Observation Data Sheet School: Charleroi Middle School Date 9/2/15 Stream Study Site: Maple Creek Teacher: Mr. Johnson Latitude_210 7 degrees NORTH Yesterday Group Members: Period 7 th Longitude_79
2015 State Envirothon
 *Disclaimer: These tests do not reflect the information that will be on tests at the upcoming competitions.* 2015 State Envirothon Aquatics Test (75 Points Total) MULTIPLE CHOICE: Select the best possible
NJ Watershed Ambassadors Program Getting Things Done
 NJ Watershed Ambassadors Program Getting Things Done 8th Water Monitoring Summit Kimberly Cenno,, Supervising Environmental Specialist, NJDEP Division of Water Monitoring & Standards Lauren Smith Watershed
Water Quality indicators and How Human Activities Affect Water Quality
 Water Quality indicators and How Human Activities Affect Water Quality Name: Online Assignment: Period: Date: Purpose: to learn how to evaluate water quality and how pollution can make water unavailable
ELK RAPIDS TOWNSHIP WATER QUALITY ACTION PLAN
 ELK RAPIDS TOWNSHIP WATER QUALITY ACTION PLAN Elk-River-Chain-of-Lakes Gaps Analysis Project The Watershed Center Grand Traverse Bay Tip of the Mitt Watershed Council Michigan Department of Natural Resources
Riparian Ecology Station OBJECTIVES
 Riparian Ecology Station OBJECTIVES Students learn The basic definition of a riparian area. The condition of any riparian area greatly affects the water quality and aquatic habitat of the water body it
How Sensitive Are They?
 Pollution Tolerance Levels How Sensitive Are They? Adapted from: An original Creek Connections activity. Creek Connections, Box 10, Allegheny College, Meadville, Pennsylvania 16335. Grade Level: intermediate
Lesson 2-2: Riparian Zones
 2-14 Lesson 2-2: Riparian Zones Time of Lesson: 1 hour Rationale: The purpose of this lesson is to define what a riparian zone is and link its importance for fish and other animals, and humans, and the
What s in the Water?
 Purpose: Summary: Background: To observe and list abiotic factors in specific ecosystems. In this exercise, students will observe and list abiotic factors in an aquatic system and measure four of them
Envirothon Aquatics. Mike Archer, NE Dept. of Environmental Quality. Katie Pekarek, Nebraska Extension Jeff Blaser, Nebraska Game and Parks
 Envirothon Aquatics Mike Archer, NE Dept. of Environmental Quality Katie Pekarek, Nebraska Extension Jeff Blaser, Nebraska Game and Parks Lake Watersheds Watershed = area contributing water to pond Surface
Little Bay Water Quality Report Card Spring 2014
 Little Bay Water Quality Report Card Spring 2014 Little Bay is a small, semi-enclosed estuary located in the heart of Rockport, Texas. Estuaries, where freshwater from rivers and streams mixes with salt
Water Pollution. Chapter 20
 Water Pollution Chapter 20 Water Pollution Comes from Point and Nonpoint Sources Water pollution Any chemical, biological, or physical change in water quality that harms living organisms or makes water
Redwood Shores Lagoon August Monthly Water Quality Monitoring Report
 Redwood Shores Lagoon August Monthly Water Quality Monitoring Report Prepared for Redwood City Public Works Services Department 1400 Broadway Redwood City, CA 94063-2594 Prepared by Clean Lakes, Inc. P.
EUTROPHICATION. Teacher s Manual
 EUTROPHICATION Teacher s Manual Preface The following is a, hands on, and inquiry based lesson plan developed by COSEE Mid-Atlantic for teaching eutrophication. The National Education Science Standards
WATERSHED. Maitland Valley. Report Card 201
 Maitland Valley WATERSHED Report Card 201 The Maitland Valley Conservation Authority has prepared this report card as a summary on the state of our forests, wetlands, surface water, and ground water resources.
WASA Quiz Review. Chapter 2
 WASA Quiz Review Chapter 2 Question#1 What is surface runoff? part of the water cycle that flows over land as surface water instead of being absorbed into groundwater or evaporating Question #2 What are
City of Texarkana, Arkansas. Storm Water Pollution
 City of Texarkana, Arkansas Storm Water Pollution STORM WATER GUIDE What is Storm Water Pollution? Stormwater can provide a toxic discharge which can enter into a lake, river or coastal water system. As
Gray s Creek. Gray s Creek
 Gray s Creek 1 Grades F + Forest Conditions B Wetland Conditions C - Surface Water Quality This Watershed Report Card outlines the environmental information for the Gray s Creek watershed as of 2017. The
Methods: Record the date and time in the data book.
 Chemical Station Materials & Methods Materials: 3 Tall Plastic Vials with Caps 1 Small Glass Vial with Cap 1 Nitrate Tablet #1 1 ph Tablet 1 Nitrate Tablet #2 1 Phosphate Tablet 2 Dissolved Oxygen (DO)
LabQuest INTRODUCTION
 LabQuest 2 INTRODUCTION Water contains both hydrogen ions, H +, and hydroxide ions, OH. The relative concentrations of these two ions determine the value. 1 Water with a of 7 has equal concentrations of
Reporting Period: 01/01/2010 to 12/31/2010. Understanding the Level 2 Stream Monitoring Data Report
 Eau Claire River at Outlet Bay Rd, 10029003 Upper Eau Claire Lake Latitude: 46.302803, Longitude: -91.50336 Susan Peterson, Friends of the Saint Croix Headwaters John Kudlas, Friends of the St.Croix Headwaters
Phase III Watershed Implementation Plans
 Phase III Watershed Implementation Plans Including programmatic outcomes in your planning to provide co-benefits for your community and reduce pollution Rachel Felver Chesapeake Bay Program Director of
Reporting Period: 01/01/2010 to 12/31/2010. Understanding the Level 2 Stream Monitoring Data Report
 Squaw Creek, 10030147 Squaw Creek Latitude: 45.32639, Longitude: -88.945564 Jim Waters, Wolf River Trout Unlimited Andy Killoren, Wolf River Trout Unlimited Reporting Period: 01/01/2010 to 12/31/2010 Understanding
Reporting Period: 01/01/2008 to 12/31/2008. Understanding the Level 2 Stream Monitoring Data Report
 Panther Creek, 10010222 Panther Creek Latitude: 44.6216, Longitude: -90.568054 Carol Vedra, Beaver Creek Science Center Steven Hemersbach, Beaver Creek Citizen Science Center Reporting Period: 01/01/2008
Palmer River Water Discharge and Nutrient Study
 Bridgewater State University Virtual Commons - Bridgewater State University Watershed Access Lab Projects Watershed Access Lab 2007 Palmer River Water Discharge and Nutrient Study Recommended Citation
404(b)(1) EVALUATION
(1) EVALUATION") 404(b)(1) EVALUATION SECTION 404(b)(1) EVALUATION DETAILED PROJECT REPORT AND ENVIRONMENTAL ASSESSMENT POMEROY SECTION 14 EMERGENCY STREAMBANK PROTECTION PROJECT POMEROY, OH I. INTRODUCTION As required
404(b)(1) EVALUATION SECTION 404(b)(1) EVALUATION DETAILED PROJECT REPORT AND ENVIRONMENTAL ASSESSMENT POMEROY SECTION 14 EMERGENCY STREAMBANK PROTECTION PROJECT POMEROY, OH I. INTRODUCTION As required
Benthic Macroinvertebrate Monitoring
 Benthic Macroinvertebrate Monitoring "In the end, we will conserve only what we love, we will love only what we understand, we will understand only what we are taught." - Bada Dioum, Senegalese conservationist
Reporting Period: 01/01/2008 to 12/31/2008. Understanding the Level 2 Stream Monitoring Data Report
 St Croix River at Old HWY 53 At Gordon, 163118 Saint Croix River Latitude: 46.252617, Longitude: -91.79963 Susan Peterson, Friends of the Saint Croix Headwaters James Heim, Friends of the Saint Croix Headwaters
Water Quality and Macroinvertebrates By Teresa Matteson and Heath Keirstead Benton Soil & Water Conservation District
 Water Quality and Macroinvertebrates By Teresa Matteson and Heath Keirstead Benton Soil & Water Conservation District Learning Objectives: Identify aquatic macroinvertebrate pictures Relate insect species/group
When Things Heat Up. To relate the physical and chemical properties of water to a water pollution issue.
 Purpose: Summary: To relate the physical and chemical properties of water to a water pollution issue. In this exercise, students will measure the temperature and dissolved oxygen of a stream (or use their
Osher Course. What Lies Beneath the Inland Bays?
 Osher Course What Lies Beneath the Inland Bays? Objectives for Course Describe the Delaware Inland Bays and their tributaries Illustrate the ecology and importance of estuaries Demonstrate the threats
BANKS TOWNSHIP WATER QUALITY ACTION PLAN
 BANKS TOWNSHIP WATER QUALITY ACTION PLAN Elk-River-Chain-of-Lakes Gaps Analysis Project The Watershed Center Grand Traverse Bay Tip of the Mitt Watershed Council Michigan Department of Natural Resources
CBF Water Quality Interactive Map
 CBF Water Quality Interactive Map Student and adult groups that take part Often, they measure the water chemistry to evaluate the be doing it when you come out with us! By compiling these points on a map
Site Sketch Sheet. SITE ID #: STREAM: DATE: COUNTY: WATERSHED: RIVERWATCH TEAM: (if applicable)
") Site Sketch Sheet SITE ID #: STREAM: DATE: COUNTY: WATERSHED: _ RIVERWATCH TEAM: (if applicable) Sketch an aerial view of your 200 foot stream site every year. Indicate the direction of North and the direction
Site Sketch Sheet SITE ID #: STREAM: DATE: COUNTY: WATERSHED: _ RIVERWATCH TEAM: (if applicable) Sketch an aerial view of your 200 foot stream site every year. Indicate the direction of North and the direction
Stream Observation Data Sheet School CMS Date 12/16/2015 Stream Study Site Mingo Creek. Macroinvertebrate Survey
 Stream Observation Data Sheet School CMS Date 2/6/205 Stream Study Site Mingo Creek Teacher Johnson Group Members: Latitude degrees NORTH Yesterday Longitude degrees WEST Weather Today Air Temperature
Dirty Water. Adapted from: Dirty Water in Living in Water. National Aquarium in Baltimore, Grade Level: all. Duration: 1-2 class periods
 Dirty Water Adapted from: Dirty Water in Living in Water. National Aquarium in Baltimore, 1997. Nitrogen and Phosphorus Grade Level: all Duration: 1-2 class periods Setting: classroom or laboratory Summary:
River of Ashe County, NC
 Running Head: Annual Variations in Mayfly Populations and Relations to Water Quality Annual Variations in Mayfly Populations and Relations to Water Quality in the New River of Ashe County, NC Benjamin
Streamside Management. How the area around your pond effects the water.
 Streamside Management Zones and Water Quality How the area around your pond effects the water. Stream(pond)side Management Zone A streamside management zone (SMZ) is a strip of land immediately adjacent
S.R. 4007, Section 14B PADEP Environmental Assessment Form. Enclosure C Description of Aquatic Habitat
 S.R. 4007, Section 14B PADEP Environmental Assessment Form Description of Aquatic Habitat Cresheim Creek is the only water resource that exists within the project area. No jurisdictional wetlands were
Florida Watersheds Video Southwest Florida Water Management District
 Teacher s Guide Florida Watersheds Video Download at: http://www.watermatters.org/watershedvideo Middle School Video Length: 11 minutes Lesson Time: One block or class period (approximately 45 minutes)
Riparian Round Up. Adapted from: An original Creek Connections activity. Creek Connections, Allegheny College, Meadville, Pennsylvania, 16335
 Riparian Round Up Adapted from: An original Creek Connections activity. Creek Connections, Allegheny College, Meadville, Pennsylvania, 16335 Riparian Functions, Wildlife, and Cycles Grade Level: Basic