The 2010 English Indices of Deprivation
|
|
|
- Myles Bell
- 6 years ago
- Views:
Transcription
1 Overview This report looks at results from the Index of Deprivation 2010 (ID 2010) released on the 24 th March 2011 and compares them with the IDs published in 2004 and It examines data for the overall index and its domains to determine how deprivation has changed within the county. It also looks at how these changes compare to those which have occurred nationally to determine to what extent deprivation may have reduced or increased. Introduction The 2010 English Indices of Deprivation What does it mean for Lincolnshire? The 2010 Indices of Deprivation was commissioned by the Department of Communities and Local Government (DCLG) from the Social Disadvantage Research Centre at Oxford University, and updates the previous indices released in 2007, 2004 and It replaces the Indices of Deprivation 2007 as the official measure of deprivation in England, updating the ID indicators with data relating to 2008 wherever possible, though a single indicator drawing on Census 2001 data does remain. The ID uses a statistical geography called Lower Super Output Areas (LSOAs). LSOAs are homogenous small areas of relatively even population size and these geographies have been maintained as part of the 2010 ID release, enabling ease of comparison with 2004 and 2007 ID results. 3 2 Other documents in this series: 1. Indices of Multiple Deprivation 2010 Information Sheet 2. Gaining Value from the 2007 Indices of Multiple Deprivation in Lincolnshire Publish date: April 2011 T: E: lro@lincolnshire.gov.uk W: More information on LSOAs can be found at Please note that comparisons with 2000 ID data is not possible due to differences in indicators used and the geographies the data is supplied at. What is the Indices of Deprivation? Deprivation covers a broad range of issues and refers to unmet needs caused by a lack of resources of all kinds, not just financial. The Indices of Deprivation attempt to measure deprivation using a number of indicators across several domains (detailed on page 2) and, as a result, is a valuable source of data for evaluating the various measures of deprivation existing in small areas across the country. It is through the results of this study that many areas are identified as a priority for funding to improve the quality of life of their various populations.
2 How do the Indices work? The Indices of Deprivation 2010 is the collective name for a group of 10 indices which all measure different aspects of deprivation. They are as follows: - The Index of Multiple Deprivation (IMD) - Income Domain - Employment Domain - Health and Disability Domain - Education, Skills and Training Domain - Barriers to Housing and Other Services Domain - Crime Domain - Living Environment Domain - Indices of Deprivation Affecting Older People (IDAOPI) - Indices of Deprivation Affecting Children Index (IDACI) The most commonly used of these is the Index of Multiple Deprivation (IMD), which is a combination of all the seven domains and provides an indicator of general deprivation levels across England. Between them the seven domains of income, employment, health, education, crime, housing, and living environment contain 38 indicators in total. Each of these domains has their own score and rank which enables areas to be ranked based on their Index of Multiple Deprivation score. In turn this means that the most and least deprived areas in England can be identified and comparisons between areas can be made as to whether one is more or less deprived than the other. A number of the domains also have sub domains and information on these is presented later on in the report. In order to provide an opportunity for comparison between individual domains the scores for each domain are ranked according to their position against all other LSOAs in England, with a rank of 1 being the most deprived area. The indices also provide information on the proportion of LSOAs within a local authority which fall within the top 10% of nationally deprived areas (concentration of deprivation) and the proportion of England s most deprived LSOAs which fall within each district (extent of deprivation). The Income and Employment domains can also be used to identify the absolute numbers of people affected by these types of deprivation. For a full list of the indicators and their domains and sub domains please refer to the following page on the Lincolnshire Research Observatory (LRO) website For further information on the methodologies used to score and rank areas in England please refer to the technical report on the Department for Communities and Local Government website at nicalreport Page 2
3 Limitations of the Indices of Deprivation There are a number of caveats that need to be taken into account when using and interpreting ID data: - The ID is not a direct measure of deprivation in the way that the unemployment rate is a real measure of the proportion of people out-of-work. This means it can tell you if one area is more deprived than another but not by how much. Therefore, an area with a score of 100 is not twice as deprived as an area with a score of The ID is a measure of deprivation, not affluence. Therefore the area ranked as the least deprived is not necessarily the most affluent. - Not every person living in a deprived area will themselves be deprived. Equally, there will be some deprived people living in the least deprived areas. - Whilst the IMD 2010 can be compared with 2004 and 2007 IMD datasets to identify how areas are changing over time relative to other areas across England, it is not a direct measure of whether areas are improving or closing the gap against the average. The differences between 2004, 2007 and 2010 ID show how an area has fared compared to areas across England with similar levels of deprivation. An area could well have improved in real-terms (e.g. unemployment has fallen, incomes and skills higher, a fall in crime rates etc.), and may have improved faster than the average. However, if other areas with similar levels of deprivation have done slightly better, the area will score as more deprived in 2010 than say Whilst the ID is useful in understanding an area relative to others it needs to be used alongside other direct measures to understand how it has changed over time. - The majority of data used in the ID 2010 is from 2008 (with one indicator using 2001 Census data). This means that the data used is pre-recession and therefore the ID 2010 will not show the effects of the recession on areas. Comparing Results from the 2004, 2007 and 2010 Indices of Multiple Deprivation Putting the above caveats of ID usage to one side, one of the main aims of the IMD has been to make results comparable as much as possible across the different releases. As a result the domains and methodology are the same in the ID 2010 as in the ID 2004 and ID 2007 and as far as possible most indicators are equivalent to their counterparts. Therefore, results from the ID 2004, 2007 and 2010 are directly comparable and most change is likely to reflect real relative change between the time periods. Page 3


4 An Overview of Deprivation In addition to the information available on the LRO website we have provided some useful maps below to illustrate results from the 2010 Index of Multiple Deprivation for England. Map 1: 2010 Index of Multiple Deprivation in England Contains Ordnance Survey data Copyright. Lincolnshire County Council Map 1 above shows that nationally deprivation is a particular issue for coastal areas. If we put to one side the south west corner of the country, a clear north / south divide is also apparent. Major areas of deprivation across the country include London, the north east around Newcastle and Sunderland, and the coal mining areas around Sheffield and Wakefield. Page 4


5 Map 2: 2010 Index of Multiple Deprivation in and around Lincolnshire Contains Ordnance Survey data Copyright. Lincolnshire County Council Map 2 above shows deprivation in Lincolnshire and in those neighbouring areas around the county with a net commuter flow of 500 plus people. It shows that levels of deprivation are also an issue on the coast going into Norfolk and further inland. The urban areas of Peterborough in the South, and Hull, Grimsby and Scunthorpe in the North are highlighted with higher levels of deprivation (with Grimsby in particular having an area that is the second most deprived in the country). To the North West, the unitary authority of Doncaster and Bassetlaw district both have large areas which are deprived. Page 5

6 2010 Index of Multiple Deprivation in Lincolnshire Referring to map 3 below we can see that in line with previous ID the east of the county appears to be suffering greater levels of deprivation than the west. In the east of the county, levels of deprivation are at their greatest on the coast and in Boston with areas further inland being less deprived. In the west of the county, the more deprived areas are by and large confined to the urban areas of Lincoln, Grantham and Gainsborough. Map 3: 2010 Index of Multiple Deprivation in Lincolnshire Just over 4% of Lincolnshire s population (approximately 30,500 people) live in areas that are in the top 10% most deprived areas nationally. These areas are shown on map 3 in dark blue. The most deprived Lower Super Output Area (LSOA) in the county is in Lincoln in Moorland Ward. This area has consistently been ranked as the most deprived in the county and has this year risen to 132 nd out of the 32,482 LSOAs in England. The least deprived area of the county is in Cranwell and Byard s Leap Ward, north of Sleaford. It is currently ranked 32,450 having fallen over 400 places since Contains Ordnance Survey data Copyright. Lincolnshire County Council For an area that is classed as being predominantly rural it is perhaps surprising that there are only two LSOAs (in and around Skegness) in the top 10% most deprived in Lincolnshire that are classed as rural. It is though in line with national trends with 98% of the most deprived LSOAs being urban areas. Looking below the overall IMD measure at the individual domains and sub domains shows us where the county is most and least deprived relative to other areas on certain issues. For more information regarding the domain, sub domains and their underlying indicators please refer to Page 6


7 Employment Deprivation Domain The employment and health domain maps show similar pictures with the south west of the county being generally the least deprived, relative to other areas of the country based on these measures. The crime domain map on the other hand illustrates the relatively low levels of crime in the county compared to the rest of England, with most areas classed as being amongst those least deprived. There are though hot spots of crime deprivation in all the main urban areas in the county. Contains Ordnance Survey data Copyright. Lincolnshire County Council Health Deprivation and Disability Domain Crime Domain Page 7


8 Education, Skills and Training Deprivation Domain This domain captures the extent of deprivation in terms of education, skills and training in a local area. The indicators are structured into two sub domains: one relating to education deprivation for children / young people in the area, and one relating to lack of skills and qualifications among a sub-set of the working age adult population. The skills sub domain map highlights a particular issue in terms of lack of skills amongst the working age population on the coast, down through Boston and into South Holland District. Contains Ordnance Survey data Copyright. Lincolnshire County Council Sub Domain: Children / Young People Sub Domain: Skills Page 8


9 Living Environment Deprivation Domain This domain focuses on deprivation with respect to the characteristics of the living environment. It comprises two subdomains: the 'indoors' living environment which measures the quality of housing and the 'outdoors' living environment which contains two measures about air quality and road traffic accidents. The overall living environment deprivation domain highlights issues for the main urban areas in the county along with Market Rasen. The sub domain maps below suggest that is as a result of quality of housing in the Market Rasen area. Contains Ordnance Survey data Copyright. Lincolnshire County Council Sub Domain: The indoors living environment Sub Domain: The outdoors living environment Page 9


10 Barriers to Housing and Services Domain The purpose of this domain is to measure barriers to housing and key local services. The indicators are structured into two sub-domains: 'geographical barriers' and 'wider barriers' which includes issues relating to access to housing, such as affordability. The overall domain map is dominated by the geographical barriers sub domain which is unsurprising given the rural and sparse nature of the county. Contains Ordnance Survey data Copyright. Lincolnshire County Council Sub Domain: Geographical Barriers Sub Domain: Wider Barriers Page 10


11 IMD 2010: Income Deprivation Domain The income deprivation domain captures the proportion of the population experiencing income deprivation in an area. In addition, an Income Deprivation Affecting Children Index and an Income Deprivation Affecting Older People Index were created. These two indices represent the proportion of children aged 0-15 living in income deprived households and the proportion of older people aged 60 and over living in income deprived households respectively. All three maps for this domain show a similar picture in that income deprivation is more of an issue for all ages in coastal and urban areas. Contains Ordnance Survey data Copyright. Lincolnshire County Council IMD 2010: Indices of Deprivation Affecting Children Index (IDACI) IMD 2010: Indices of Deprivation Affecting Older People (IDAOPI) Page 11


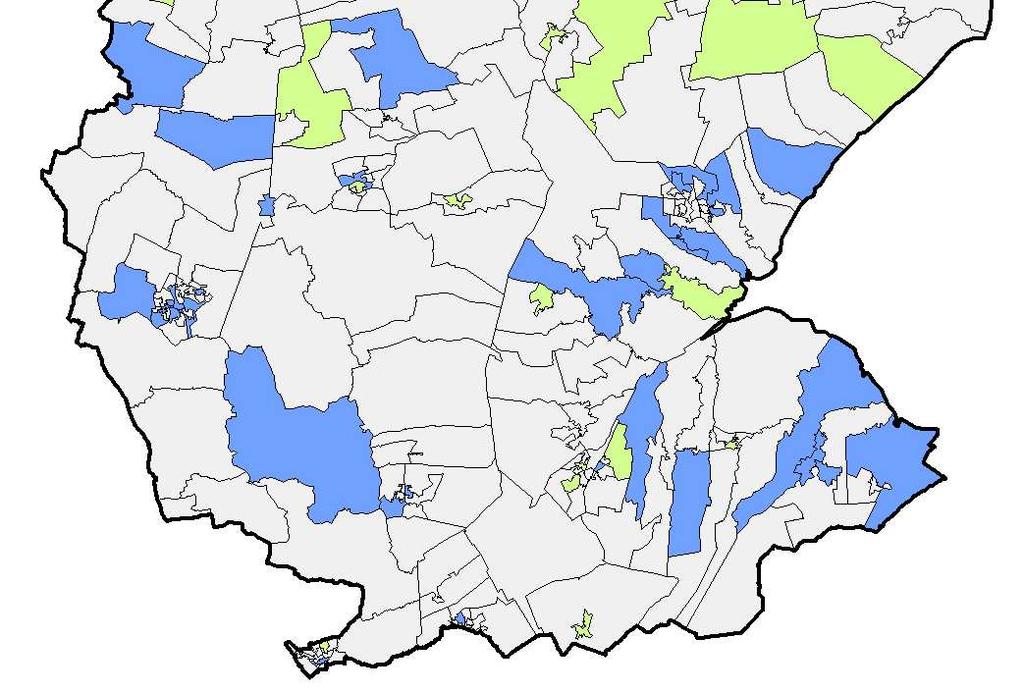
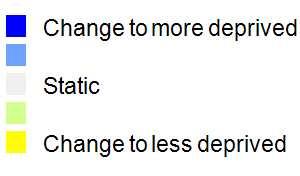
12 Map 4 below shows the changes in rank for each LSOA in Lincolnshire since the 2007 data release. The LSOAs in dark blue have experienced the largest rises in rank since 2007 and as a result are now more deprived in 2010 relative to other areas nationally. Map 4: Change in Index in Multiple Deprivation The LSOAs in yellow on map 4 have experienced the largest falls in rank since 2007 and as a result are now less deprived in 2010 relative to other areas nationally. Overall it shows that those LSOAs which have experienced the largest falls in rank, and as a result are now less deprived relative to other areas, are predominantly in the western half of the county. Contains Ordnance Survey data Copyright. Lincolnshire County Council The LSOA which has risen the most in terms of its rank, and is now more deprived relative to other areas, is in East Lindsey, in St. Michael s Ward, which is south of Louth. This area has risen over 5,000 places in England and is currently ranked 20,368 th nationally. At the opposite end of the scale a LSOA in North Kesteven, in Bassingham Ward which contains South Hykeham, Thurlby and Witham St Hughs, has fallen by over 4,500 places in the deprivation ranks in England and 81 places in Lincolnshire. Lincolnshire now has an additional five LSOAs ranked in England s top 10% most deprived areas. Two of these areas are in East Lindsey (LSOAs in Central Ward in Mablethorpe, and in Scarborough Ward in Skegness), a further two are in Lincoln (in Glebe and Birchwood Wards), and one is in South Kesteven (in Earlesfield Ward in Grantham). Page 12
13 Figure 1 below refers to the 19 LSOAs in the county which are in the top 10% most deprived nationally based, on their overall IMD ranking, and looks at how many of the Indices domains they are also in the top 10% most deprived nationally. It demonstrates that the most deprived areas face multiple issues with the majority of these LSOAs (95%) amongst the most deprived in at least three of the seven domains, and just over half (53%) are amongst the most deprived in at least four of the domains. Figure 1: Number of domains in which Lincolnshire LSOAs in the top 10% deprived nationally are in the most deprived decile Number of domains Number of LSOAs Percentage of LSOAs Cumulative Percentage of LSOAs % 0.0% % 0.0% % 15.8% % 52.6% % 94.7% % 100.0% % 100.0% % 100.0% Total % In order to better understand the changes that LSOAs have undergone, the following maps on page 14 present changes in rank for LSOAs for selected domains that make up the overall IMD calculation. Maps for the domains of living environment, income, and education have not been reproduced here as they in fact show very little change for the vast majority of LSOAs between 2007 and The IMD 2010 crime domain measures the rate of recorded crime for four major crime types, representing the risk of personal and material victimisation at a small area level. The map of the crime domain shows that there has been large movement in ranks for areas on the coast, in South Holland district and that these areas are now more deprived based on the measures in the crime domain. Conversely there are a small number of areas around Boston and Spalding that have seen large improvement in their ranking in the crime domain and are now less deprived based on these measures. In terms of the health domain (which measures rates of poor health, early mortality and disability in an area and covers the entire age range) a large number of areas in the North East of the county around Louth, Market Rasen and Horncastle have become more deprived along with a patch of areas in the South East and in and around the urban areas of Lincoln, Grantham and Gainsborough. Health deprivation has been an issue on the coast for a number of years and the lack of change shown in the map means that this is an issue that remains. Those areas on the health domain map where we are seeing change suggests that amongst other things, these are also potentially areas where the changing Page 13


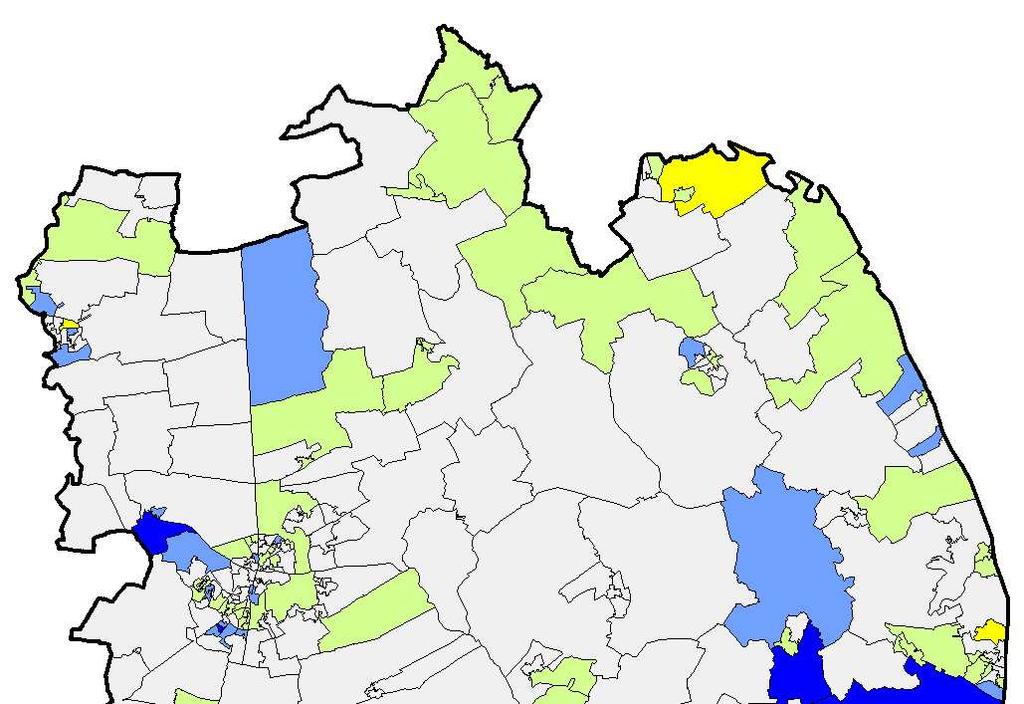
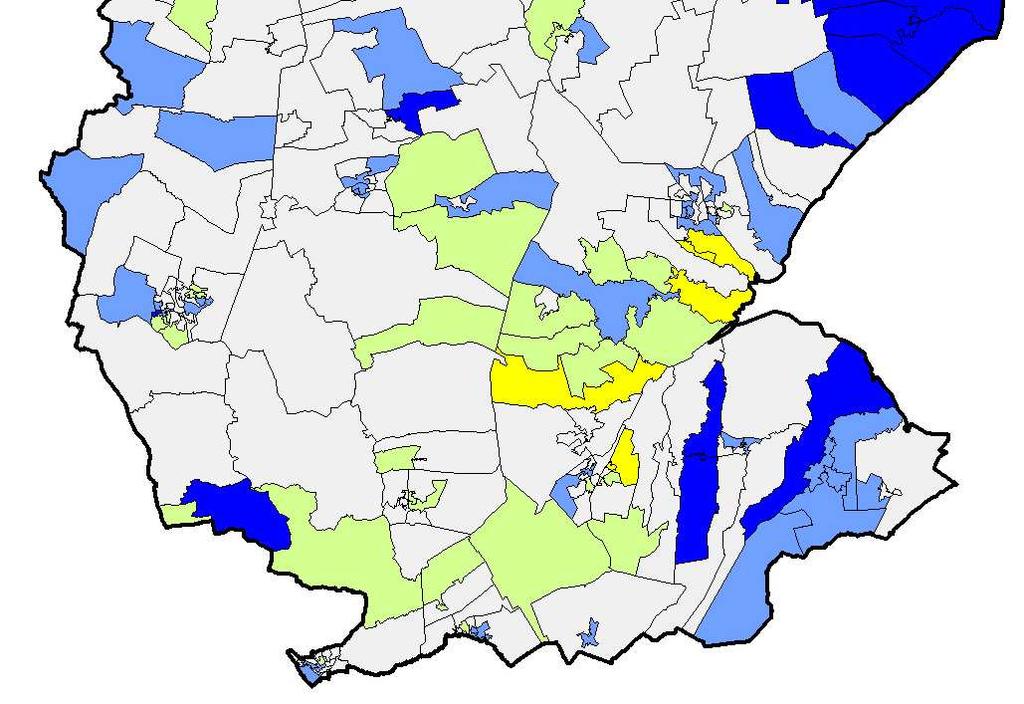
14 IMD 2010: Crime Domain IMD 2010: Health Domain IMD 2010: Barriers Domain IMD 2010: Employment Domain Contains Ordnance Survey data Copyright. Lincolnshire County Council Page 14
15 and ageing demographic and resulting health issues, are more acute than in other areas of the county. Moving on to the barriers domain map (which measure barriers to housing such as affordability, and geographical barriers such as access to key local services) there are a small number of areas across the county, though particularly around Louth, that have had large rises in their ranking and as a result are relatively more deprived based on this measure compared to other areas. This could point to the removal of a key local service in these areas. Finally the employment domain map (which measures involuntary exclusion of the working age population from the world of work), which shows again a small number of areas have become relatively more deprived particularly in the South East corner of the county around Boston, Spalding and Holbeach. These areas have historically had low levels of unemployment though over time unemployment levels have been observed to be on the increase. Whilst movement in ranks has been experienced by Lincolnshire LSOAs between 2007 and 2010, if we split all 32,428 LSOAs nationally into 10 equal parts, or deciles, we see that there has been fairly limited movement between deciles. Overall only 128 of Lincolnshire LSOAs (31%) moved decile between 2007 and 2010, compared with 34% nationally. Figure 2: Proportion of LSOAs in the same decile of the Index of Multiple Deprivation in 2007 and 2010 % IMD Decile Referring to figure 2 above, most of this movement can be seen in the middle deciles. Conversely, it is the most and least deprived LSOAs (i.e. those in IMD deciles 1 and 10 respectively) that have experienced the least amount of change between 2007 and In fact all of Lincolnshire s LSOAs which were in the top 20% most deprived nationally in 2007 remain within the top 20% in Page 15
16 Local Authority District Level Summaries The Department for Communities and Local Government (DCLG) calculate an average score for each district based on their LSOA results, and then rank the districts against each other based on their average score. This measure describes the district as a whole, taking into account the full range of LSOA scores across a district. The advantage of this measure is that it describes the LSOA by retaining the fact that more deprived LSOAs may have more extreme scores, which is not revealed to the same extent if the ranks are used. Figure 3: District IMD Rankings 2007 and Rank Lincoln East Lindsey Boston West Lindsey South Holland South Kesteven North Kesteven Figure 3 above shows how the districts in Lincolnshire fare based on this measure of rank of average score with all apart from North Kesteven more deprived in 2010 relative to all other areas. Lincoln remains the most deprived district in Lincolnshire with North Kesteven the least deprived. Please note that the above analysis uses 2007 IMD data that takes into account post 2009 boundary changes and hence the 2007 ranks will not be the same as those presented in the report Gaining Value from the 2007 ID in Lincolnshire. A further measure of deprivation at local authority district level is that of extent. The extent of deprivation is equal to the proportion of a local authority district s population living in the most deprived LSOAs in the country. The aim of this measure is to portray how widespread high levels of deprivation are in a district. It only includes districts containing LSOAs which fall within the most deprived 30% of LSOAs in England. Page 16
17 Figure 4: Extent of District Deprivation District Proportion of population living in most Change in % deprived areas (%) since 2007 Boston East Lindsey Lincoln North Kesteven South Holland South Kesteven West Lindsey Referring to figure 4 above which shows the extent of deprivation in each of Lincolnshire s districts, all of districts in the county have had an increase in the proportion of their population living in the most deprived LSOAs in the country between 2007 and 2010, with Lincoln showing the most marked difference. Figure 5: Proportion of LSOAs in each district by IMD 2010 decile West Lindsey South Kesteven South Holland North Kesteven Lincoln East Lindsey Boston 0% 10% 20% 30% 40% 50% 60% 70% 80% 90% 100% Most deprived Least deprived Despite this uniformity across the districts in terms of increased populations living in the most deprived areas, figure 5 above illustrates that the pattern of deprivation across the districts is markedly different. Boston, East Lindsey and Lincoln all have high percentages of their LSOAs amongst the most deprived in the country. The districts of North Kesteven and South Kesteven have the largest proportions of their LSOAs amongst the least deprived in the country. Page 17
18 The Lincolnshire Research Observatory Partnership The Lincolnshire Research Observatory (LRO) is a partnership of public and voluntary sector organisations from across the county and region who aim to share, and improve both access to and use of, quality data and information, facilitating a better understanding of the economic, social, health and environmental issues impacting on the county. The general remit of the LRO partnership is to enable partner organisations to fulfil their respective duties and responsibilities in the commissioning and delivery needs and evidence based interventions. It will do this by: - Acting as the Shared Evidence Base (SEB), a central repository of quality data and information on the county, making it readily and appropriately accessible to all. - Serving as a source of expertise in analysis and interpretation of data and information - Supporting the dissemination of information and findings via the production of reports and documents ensuring their availability in appropriate formats - Identifying the data/information needs, availability and gaps in the county and establishing the means for addressing them - Raising levels of expertise and capacity amongst the partner organisations The LRO website can be accessed using the following web address: For further information on the LRO partnership or on accessing and using the LRO, please contact the Research and Information Team on or on lro@lincolnshire.gov.uk Indexing 2010 D. Drivers for Change 6. Environment 1. Business and Industry 7. Health and Care 2. Crime & Safety 8. Housing 3. Deprivation 9. Labour Market 4. Economy 10. Population 5. Education, Skills and Training 11. Unemployment 3 2 Using the reference system to the left, readers can identify how this document fits into sequence. The blue number/letter in the circle relates to the indexing reference. The white number in the blue square is the document edition number. Page 18
Deprivation in Bristol 2015
 Deprivation in Bristol 2015(October 2015) Page 1 Performance, Information and Intelligence Deprivation in Bristol 2015 Briefing Note October 2015 Webpage: www.bristol.gov.uk/statistics Deprivation in Bristol
Fuel Poverty in Norfolk 2014 data
 Fuel Poverty in Norfolk 2014 data July 2016 version 4.0 Page 1 of 16 Contents 1 Key issues 3 2 Statement on data and methodology 4 3 Background 5 3.1 What is fuel poverty? 5 3.2 National context 6 4 Fuel
SEVERN ROAD RESOURCE RECOVERY CENTRE CHAPTER 15 SOCIO ECONOMIC IMPACT APPRAISAL. September 2009 SLR REF
 SEVERN ROAD RESOURCE RECOVERY CENTRE CHAPTER 15 SOCIO ECONOMIC IMPACT APPRAISAL September 2009 SLR REF 402.0036.00374 CONTENTS INTRODUCTION... 1 STUDY AREA... 1 Community Consultation... 1 Methodology...
Manufacturing in Greater Lincolnshire
 Business LRO Lincolnshire Research Observatory Manufacturing in Greater Lincolnshire Introduction Manufacturing has been identified by the Greater Lincolnshire Local Enterprise Partnership as a priority
Lincolnshire East CCG & Localities 'Local Health' Profile
 Lincolnshire East CCG & Localities 'Local Health' Profile April 2014 This health profile has been created using Public Health England's 'Local Health' tool, an online mapping and data tool available to
Business Plan for the Greater Lincolnshire LEP to P a g e
 Business Plan for the Greater Lincolnshire 2013 to 2015 1 P a g e Table of Contents Foreword by the Chair... 3 Greater Lincolnshire in Context... 4 Our Ambitions for Growth... 5 Ambition Area 1 - Infrastructure...
WAT E R FOR GROWTH WATER MANAGEMENT PLAN
 WAT E R FOR GROWTH WATER MANAGEMENT PLAN 2015-2040 THE GREATER LINCOLNSHIRE LEP CONSIDERS THE EFFECTIVE MANAGEMENT OF FLOOD RISK AND WATER RESOURCES TO BE A CRITICAL FACTOR IN ENABLING ECONOMIC GROWTH
THE ANNUAL STATE OF THE ECONOMY REPORT 2018
 THE ANNUAL STATE OF THE ECONOMY REPORT 2018 Since 2011 when the Greater Lincolnshire Local Enterprise Partnership (LEP) began it has been successful in drawing down 307m of external investment funding
District Profile: An Economic, Social and Environmental Summary Profile of Wolverhampton. May 2016
 District Profile: An Economic, Social and Environmental Summary Profile of About Place Profiles Place Profiles are computer generated reports that provide a high-level analysis of an area, telling a 'story
Developing inclusive growth metrics: examples from comparative indicator sets August Inclusive Growth Analysis Unit
 Developing inclusive growth metrics: examples from comparative indicator sets August 2017 Inclusive Growth Analysis Unit CONTENTS Introduction... 3 Inclusive Growth Monitor, Joseph Rowntree Foundation...
Lincolnshire Coastal Vision
 Lincolnshire Coastal Vision Draft for discussion version 1.1: 22 nd May 2015 A Vision for Lincolnshire's Coast by 2030 We will sustain and grow coastal businesses and the economy We will sustain and develop
About Ross-on-Wye locality
 About Ross-on-Wye locality This document contains a summary of the key facts and figures for the Ross-on-Wye locality (see map on following page). Localities have been developed by Herefordshire Public
Lincolnshire Coastal Vision
 APPENDIX A Lincolnshire Coastal Vision Draft for discussion version 1.1: 22 nd May 2015 A Vision for Lincolnshire's Coast by 2030 We will sustain and grow coastal businesses and the economy We will sustain
ARE WE ACCESSIBLE TO YOU? IF NOT - ASK US!
 Equality and Diversity Strategy 2017 to 2019 ARE WE ACCESSIBLE TO YOU? IF NOT - ASK US! We want everyone to be able to understand us. We want everyone to be able to read our written materials. We aim to
Potential impacts of the Proposed Development on socio-economic aspects are mainly made up of the following: investment of approximately 500 million;
 12 SOCIO-ECONOMIC CHARACTERISTICS 12.1 INTRODUCTION 12.1.1 Terms of Reference for this Chapter This chapter presents an assessment of the likely significant socio-economic effects from construction, operation
Changing Labour Market Context: the space for Talent Match
 Introduction This briefing paper reflects on the main findings from the Talent Match evaluation as at Autumn 2015. It draws on a suite of reports published at the same time as this one. We set out the
Mid-sized cities: Their role in England s economy. Tom Bolton and Paul Hildreth June 2013
 Mid-sized cities: Their role in England s economy Tom Bolton and Paul Hildreth June 2013 The Centre for Cities is a research and policy institute, dedicated to improving the economic success of UK cities.
Long Term Rail Strategy Key Messages. Based on updated draft strategy January 2018
 Long Term Rail Strategy Key Messages Based on updated draft strategy January 2018 The North of England plays a vital role in powering the UK economy. It is home to 16 million people and 7.2 million jobs
Warwickshire County Council: DRAFT Position Statement on Skills Priorities (April 2010)
") Warwickshire County Council: DRAFT Position Statement on Skills Priorities (April 2010) 1. Existing Skills Priorities The strategic approach to skills within Warwickshire is currently guided by the Sub-
Warwickshire County Council: DRAFT Position Statement on Skills Priorities (April 2010) 1. Existing Skills Priorities The strategic approach to skills within Warwickshire is currently guided by the Sub-
GC001: Lambert s Transport/Europa Tyres, Station Road, Gosberton Risegate
 GC001: Lambert s Transport/Europa Tyres, Station Road, Gosberton Risegate Sustainability Objective 1. To provide a mix of sustainably designed new housing to provide everybody in South East Lincolnshire
Business Case for Modernising Local Government in Buckinghamshire
 Agenda Item 6 Appendix 1 Business Case for Modernising Local Government in Buckinghamshire Executive Summary Buckinghamshire Council September 2016 Business Case for Modernising Local Government in Buckinghamshire
Report into Estates Strategy Optimisation and Modelling for East Midlands Ambulance Service
 Report into Estates Strategy Optimisation and Modelling for East Midlands Ambulance Service Rob Parsons, Mark Bryant, Peter Loader Process Evolution Limited 6 th November 2012 Ref: pl/emas/estates Published
Third Sector Overview of Devon
 Third Sector Overview of Devon 2016 Devon Voluntary Action Third Sector Overview of Devon 2016 1 Foreword I am delighted to introduce an update to our Third Sector Overview of Devon, first issued in September
Lincolnshire Community Safety Partnership Community Safety Agreement 2013/14
 Lincolnshire Community Safety Partnership Community Safety Agreement 2013/14 Page 11 Contents Foreword 3 Introduction & Context to Agreement Introduction to Lincolnshire 4 Legislative Background and Purpose
As one of our greatest assets there is a need to take collective action to protect, enhance and value our environment for now and for future
 1 As one of our greatest assets there is a need to take collective action to protect, enhance and value our environment for now and for future generations, ensuring that the Vale of Glamorgan is globally
North Lincolnshire CLLD LDS. North Lincolnshire Community Led Local Development (CLLD) Local Action Group. Local Development Strategy
 Local Action Group. Local Development Strategy") North Lincolnshire CLLD LDS North Lincolnshire Community Led Local Development (CLLD) Local Action Group Local Development Strategy 1 North Lincolnshire CLLD LDS Contents Foreword... 5 Section 1: The North
North Lincolnshire CLLD LDS North Lincolnshire Community Led Local Development (CLLD) Local Action Group Local Development Strategy 1 North Lincolnshire CLLD LDS Contents Foreword... 5 Section 1: The North
Update on Productivity in Greater Lincolnshire
 Update on Productivity in Greater Lincolnshire Introduction This paper provides an update to the original Productivity in Greater Lincolnshire paper (http://www.research-lincs.org.uk/lep-evidence-productivity.aspx)
Education Catering: Trend analysis 2014/15
 Briefing 15-67 December 2015 Education Catering: Trend analysis 2014/15 This briefing provides details on the performance information available from APSE s performance networks service looking at performance
Cost savings and service improvement strategies in the Public Sector: Shared services
 white paper Cost savings and service improvement strategies in the Public Sector: Shared services In the paper We explore the drivers for Local Government organisations to become involved in sharing services
Social Impacts and Equity in Transport
 Social Impacts and Equity in Transport Policy Briefing Note 2: Workshop 1 - Transport and Social Exclusion: Employment, Education and Training Perspectives Key issues Trends in changing places of work
Swindon Workforce Analysis. A Report by Regeneris Consulting
 Swindon Workforce Analysis A Report by Regeneris Consulting September 2016 Regeneris Consulting Ltd www.regeneris.co.uk Contents Page Summary i 1. Introduction 1 2. Defining Catchments 4 3. The Swindon
Mapping broadband in the UK Q4 2013:
 Mapping broadband in the UK Q4 2013: Broadband take-up estimates for every UK postcode Prepared by: Oliver Johnson Date: 25 May 2014 Version: 1.1 Point Topic Ltd 73 Farringdon Road London EC1M 3JQ, UK
Strategic Guidance for Community Planning Partnerships: Community Learning and Development
 Strategic Guidance for Community Planning Partnerships: Community Learning and Development COMMUNITY LEARNING AND DEVELOPMENT: STRATEGIC GUIDANCE FOR COMMUNITY PLANNING PARTNERSHIPS EXECUTIVE SUMMARY This
Health Profiles Frequently Asked Questions (FAQs) Last updated July 2016
 Last updated July 2016") Health Profiles Frequently Asked Questions (FAQs) Last updated July 2016 Contents About the Health Profiles 3 Why do the Health Profiles include these particular indicators? 3 Who are Health Profiles designed
Health Profiles Frequently Asked Questions (FAQs) Last updated July 2016 Contents About the Health Profiles 3 Why do the Health Profiles include these particular indicators? 3 Who are Health Profiles designed
LGIU Local Government Information Unit
 Page 1 of 7 LGIU Local Government Information Unit Independent Intelligent Information Positively charged: Audit Commission report (LGiU) 28/1/2008 Author: Janet Sillett Reference No: PB 1724/08L This
An ESRC Secondary Data Analysis Initiative Project. Life Transitions and Travel Behaviour
 An ESRC Secondary Data Analysis Initiative Project Life Transitions and Travel Behaviour Study team Centre for Transport & Society, University of the West of England Kiron Chatterjee, Ben Clark, Steve
MOU001: Land to the west of Eaugate Road, Moulton Chapel Sustainability Objective
 MOU001: Land to the west of Eaugate Road, Moulton Chapel Sustainability Objective Indicative development scenario: Total site area: 0.24ha Potential open space: 0.03ha Development area: 0.21ha Potential
Location Review Atlantic Park, Liverpool
 Location Review Atlantic Park, Liverpool 2007 Introduction The following report provides a thorough assessment of the demographic profile, local labour market and extent of recruitment potential applicable
Volunteers a way of encouraging active community participation?
 Volunteers a way of encouraging active community participation? Noeleen Cookman The author Noeleen Cookman is a consultant with David Haynes Associates and provides management consultancy services specialising
FIS001: Land to the east of Lindis Road, Boston Sustainability Objective
 FIS001: Land to the east of Lindis Road, Boston Sustainability Objective Indicative development scenario: Total site area: 7.46ha Potential open space: 0.75ha Development area: 6.71ha Potential no of dwellings:
Background to a Joint Strategic Needs Assessment of Health and Wellbeing of the Norfolk population
 Background to a Joint Strategic Needs Assessment of Health and Wellbeing of the Norfolk population 1. Policy Context The Department of Health White Paper Our health, our care, our say (2006) identified
Mark Deakin School of Engineering and the Built Environment Edinburgh Napier University, UK
 Demonstrating How Urban Morphology Matters: Reaching Beyond the Geometry of Building Design, Construction Systems and Occupational Behaviours and Towards Broader Context-Specific Transformations Mark Deakin
LINCOLNSHIRE S EVOLVING OPPORTUNITIES
 LINCOLNSHIRE S EVOLVING OPPORTUNITIES WHO WE ARE AND WHAT WE DO The Greater Lincolnshire LEP works with the public, private and voluntary sectors to drive sustainable economic growth. We help our businesses
Beyond the High Street: Wakefield Analysis
 Beyond the High Street: Wakefield Analysis by Ed Clarke, Paul Swinney & Dmitry Sivaev, October 2013 Figure 1: Wakefield Definition of areas Wakefield Inner Wakefield Outer Pontefract This work contains
1 Executive Summary. 1.9 Our findings from analysis of sector and occupational data have revealed:
 The Active Essex CSP and Creative Sport and Leisure Sport Skills Strategy 2018 1 Contents 1 Executive Summary... 3 2 Top line messages for strategic partners, and sport stakeholders... 6 3 Introduction...
Wisbech Community Led Local Development Programme: Local Development Strategy
 Wisbech Community Led Local Development Programme: Local Development Strategy August 2016 Note on funding the development of this Strategy The development of this Strategy was funded via 12,179 from the
Tackling Worklessness: Work & Skills Plan
 West of England Partnership Partnership Board 31 August 2010 Agenda item 7 Tackling Worklessness: Work & Skills Plan Background This plan was developed as a shared strategy across the partnership area
1. Are young people obtaining the right skills at the right qualification level?
 29-35 Farringdon Road London EC1M 3JF T: 020 7186 9500 F: 020 7186 9501 The Work and Pensions Committee, House of Commons, 7 Millbank, London SW1P 3JA Patron: Her Majesty The Queen President: The Most
Regional Profile Lincoln. Cordant People Be Integral
 Regional Profile Lincoln Cordant People Be Integral Overview of Building on the County s Strengths Investment & Major Projects Workforce Skills Summary Overview of History of The Anglo-Saxon nobility of
BUT001: Land to the east of Benington Road, Butterwick Sustainability Objective
 BUT001: Land to the east of Benington Road, Butterwick Sustainability Objective 1. Provide a miture of sustainably designed new housing to provide everybody in South East Lincolnshire with the opportunity
A Balance Sheet for Rural America: Assets, Challenges and Opportunities
 A Balance Sheet for Rural America: Assets, Challenges and Opportunities Presented at: Rural Communities: The Challenges of Meeting Veterans Needs Workshop Washington, DC September 8, 2006 Mark Partridge
Labour demand is based on
 Economic & Labour Market Review Vol 3 No February 9 FEATURE Gareth Clancy Labour demand: The need for workers SUMMARY This article looks at the labour input actually employed by private fi rms and public
East Lindsey Economic Baseline 2010 EXECUTIVE SUMMARY
 East Lindsey Economic Baseline 2010 EXECUTIVE SUMMARY 1 Introduction Employment and Business Base This report presents a thorough and wide-ranging assessment of the East Lindsey economy, set within the
Pobal Strategic Plan
 Pobal 2018 2021 Strategic Plan Foreword 1 Our Work & Operating Environment 2 Vision and Mission 5 Operating Principles 6 Strategic Goals & Objectives 8 Resources 13 Strategic Implementation & Performance
Air Quality. April Produced by. Correspondence to: Tom Bourne
 Air Quality April 2018 Produced by Tom Bourne: Senior Public Health Intelligence Analyst (tom.bourne@kent.gov.uk) Trudi Godfrey: Public Health Information Officer (trudi.godfrey@kent.gov.uk) Correspondence
West Yorkshire Community Transport Audit. Executive Summary. Produced for. Metro & Yorkshire Forward. by CTA UK
 West Yorkshire Community Transport Audit Executive Summary Produced for Metro & Yorkshire Forward by CTA UK September 2007 Chapter 1 Executive Summary 1.1 Introduction Metro, Yorkshire Forward and the
Executive Summary THE A10 / M11 GROWTH AREA ECONOMY. 11 June Hertfordshire A10 M11 Growth Corridor PAGE 1
 Executive Summary THE A10 / M11 GROWTH AREA ECONOMY 11 June 2015 Hertfordshire A10 M11 Growth Corridor PAGE 1 EXECUTIVE SUMMARY AN ANALYSIS OF THE A10/M11 GROWTH AREA ECONOMY This report presents a brief
An Employability Policy for Wales
 An Employability Policy for Wales Within the context of our new legislative backdrop, the Wellbeing of Future Generations Act, it is critical we do all we can to improve the social, economic, environmental
Commuter Survey Report Business or personal? Current trends in managing commuter assignments
 Commuter Survey Report Business or personal? Current trends in managing commuter assignments Contents Executive summary 1 1. Introduction 3 Participant demographics 3 2. Survey findings 5 Defining commuters
People and Economy. Last updated: March 2016
 Throughout this document Devon refers to the administrative area of Devon County Council and Torbay refers to the administrative area of Torbay Council. Economic Prosperity, Health and Wellbeing An increasing
Leicestershire Rural Economy Evidence Base June 2014
 Leicestershire Rural Economy Evidence Base June 2014 1 Contents Executive Summary 3 Introduction 6 Rural Economy Description 7 Rural Leicestershire Population 8 Qualifications 10 Incomes 11 Employment
GREATER LINCOLNSHIRE LEP STRATEGIC ECONOMIC PLAN
 GREATER LINCOLNSHIRE LEP STRATEGIC ECONOMIC PLAN 2014-2030 REFRESH SPRING 2016 CONTENTS The following partners endorse and support delivery of the economic growth ambitions for Greater Lincolnshire outlined
PLACE TYPOLOGIES AND THEIR POLICY APPLICATIONS
 PLACE TYPOLOGIES AND THEIR POLICY APPLICATIONS A report prepared for the Department of Communities and Local Government CASEreport 65 February 2011 Ruth Lupton, Alex Fenton, Rebecca Tunstall and Rich Harris
Leeds Adult Social Services Workforce Strategy. Better Lives for people in Leeds
 Leeds Adult Social Services Workforce Strategy 02 Adult Social Services Workforce Strategy Adult Social Services Workforce Strategy 03 A compassionate and caring workforce that is supported by different
Nottingham City Growth Plan 2.0
 Nottingham City Growth Plan 2.0 a renewed strategy for economic growth in Nottingham Chris Henning Spring 2017 1. The Nottingham Growth Plan set out to strengthen economic resilience Focused on restructuring
Position Paper for Germany
 Position Paper for Germany Position of the Commission Services on the development of the Partnership Agreement and Programmes in Germany for the period 2014-2020 Berlin, 27.11.2012 2 Contents Introduction:
Scottish Funding Council staff equality information as at April 2011
 Scottish Funding Council staff equality information as at April 2011 Version published April 2013 Introduction This is our first report under the public sector equality duty. Although the Scottish Funding
Updating the careers Cold Spots. Updating The Careers & Enterprise Company prioritisation indicators
 Updating the careers Cold Spots Updating The Careers & Enterprise Company prioritisation indicators The Careers & Enterprise Company 018 II About this report This short report updates The Careers & Enterprise
Executive Summary. Introduction
 Executive Summary 01 Introduction The City of Southampton lies at the western end of the South Hampshire sub-region. The wider urban South Hampshire area, consisting of Southampton, Eastleigh, Fareham,
Version 1 Last Revision Date February Workforce Development Strategy
 Version 1 Last Revision Date February 2009 Workforce Development Strategy 1 DOCUMENT CONTROL POLICY NAME Workforce Development Strategy Department Human Resources Telephone Number 01443 424103 01443 424159
LEEDS CITY REGION LABOUR MARKET ANALYSIS 2018: HEADLINE MESSAGES
 LEEDS CITY REGION LABOUR MARKET ANALYSIS 2018: HEADLINE MESSAGES Outline of the presentation Background to the labour market analysis Selected key messages around: Economic and labour market context Raising
Beyond 2011: Public Consultation on User Requirements - Report
 Beyond 2011 Beyond 2011 Public Consultation on User Requirements - Report August 2012 Background The Office for National Statistics is currently taking a fresh look at options for the production of small-area
JOB DESCRIPTION. To actively encourage family participation in Children s Centre and partner services.
 JOB DESCRIPTION Job Title: Section: Children s Centre Manager Locality Team Directorate: Children, Families & Adults Service Reports to: District Manager Grade: Location: Hours: MB1 Ely Children s Centre
Talent Match Humber - Executive Summary
 Talent Match Humber - Executive Summary Our vision is that, over 5 years, Talent Match Humber will support 1,500 young people with multiple needs, aged 18-24, who are long-term unemployed, or economically
Human Needs Index. Executive Summary. A timely, multidimensional view of poverty-related need. Report prepared by:
 Human Needs Index A timely, multidimensional view of poverty-related need Report prepared by: Executive Summary In this report, we introduce the Human Needs Index (HNI), the statistically-tested and validated
DETERMINING THE WELFARE EFFECTS OF INTRODUCING A CAP- AND-SHARE SCHEME ON RURAL COMMUTERS
 DETERMINING THE WELFARE EFFECTS OF INTRODUCING A CAP- AND-SHARE SCHEME ON RURAL COMMUTERS David McNamara PhD Candidate Department of Civil, Structural and Environmental Engineering, Trinity College Dublin
INTERIM EVALUATION OF NEW TARGETING SOCIAL NEED (NEW TSN) A METHODOLOGY DOCUMENT FOR CONSULTATION
 A METHODOLOGY DOCUMENT FOR CONSULTATION") INTERIM EVALUATION OF NEW TARGETING SOCIAL NEED (NEW TSN) A METHODOLOGY DOCUMENT FOR CONSULTATION Minister s Foreword We made clear in our Programme for Government how determined we, and all Ministers,
INTERIM EVALUATION OF NEW TARGETING SOCIAL NEED (NEW TSN) A METHODOLOGY DOCUMENT FOR CONSULTATION Minister s Foreword We made clear in our Programme for Government how determined we, and all Ministers,
Equality and Diversity Impacts for the West of England Strategic Economic Plan
 WE ARE A PARTNERSHIP FOR GROWTH STRATEGIC ECONOMIC PLAN Equality and Diversity Impacts for the West of England Strategic Economic Plan 2013-30 Equality and Diversity Impacts for the West of England Strategic
centreforcities mind the enterprise gap is enterprise policy working to help businesses in deprived areas? discussion paper no.
 centreforcities discussion paper no. 4 December 2005 mind the enterprise gap is enterprise policy working to help businesses in deprived areas? Tracy Kornblatt and Liz Troni Abstract Building enterprise
Beyond Greenspace Research: Beaches, Biodiversity and Bats. Ben Wheeler Research Fellow
 Beyond Greenspace Research: Beaches, Biodiversity and Bats Ben Wheeler Research Fellow Introduction Natural environment and health Existing evidence indicates exposure to the natural environment may be
EUROPEAN SOCIAL FUND ENGLAND
 EUROPEAN SOCIAL FUND ENGLAND 2014-2020 NW Network for Europe European Funding 2014-2020 Event - 4 July 2013 James Ritchie: DWP - ESF Policy Team ESF 2014-2020: Key points Familiar overall objectives: employment,
Labour market coverage of existing assistance provision in accessing labour market opportunities: Mapping and gapping exercise
 Labour market coverage of existing assistance provision in accessing labour market opportunities: Mapping and gapping exercise Summary report prepared for: Devon County Council Prepared by: Transform Research
Membership Development Strategy
 1. Introduction Membership Development Strategy 2014-2017 Nottinghamshire Healthcare provides integrated healthcare services, including mental health, learning disability and community health services.
Pound Plus / Value for Money
 Pound Plus / Value for Money What is Pound Plus? 1. Pound Plus is a new term that we re using to describe how learning providers can show how they are maximising the value of public investment. Generating
An overview of the local government settlements in the devolved governments in the United Kingdom
 Briefing 11/0 6 February 2011 An overview of the local government settlements in the devolved governments in the United Kingdom To: -All APSE contacts in the United Kingdom This briefing paper provides
CANADA-NEWFOUNDLAND AND LABRADOR LABOUR MARKET AGREEMENT Annual Plan
 CANADA-NEWFOUNDLAND AND LABRADOR LABOUR MARKET AGREEMENT 2010-11 Annual Plan October 13, 2010 Purpose This annual plan defines the priorities, objectives and program and service investments under the Canada-Newfoundland
Community Empowerment (Scotland) Act Part 2 Community Planning Guidance
 Act Part 2 Community Planning Guidance") Community Empowerment (Scotland) Act 2015 Part 2 Community Planning Guidance December 2016 Contents page number Part 1 Strategic overview of community planning 3 Foreword 4 Purpose of community planning
Community Empowerment (Scotland) Act 2015 Part 2 Community Planning Guidance December 2016 Contents page number Part 1 Strategic overview of community planning 3 Foreword 4 Purpose of community planning
Guide to the LEADER Resource Allocation Model
 Guide to the LEADER Resource Allocation Model The LEADER Resource Allocation Model (LEADER-RAM) has been jointly developed by Pobal and Trutz Haase Social & Economic Consultant. It aims at providing an
ANNEX C. Economic Assessment. Parking Proposals Comments of the Economic Development Team
 ANNEX C Economic Assessment Parking Proposals Comments of the Economic Development Team This report summaries the views of the Economic Development Team on the proposed changes to parking charges in Milton
North Lincolnshire ECONOMIC GROWTH PLAN
 North Lincolnshire ECONOMIC GROWTH PLAN Foreword We are pleased to introduce the North Lincolnshire Economic Growth Plan, which sets out our vision to deliver increased prosperity for the area. Although
Health vulnerability to heat stress in rural communities of the semi-arid regions of Maharashtra, India
 Health vulnerability to heat stress in rural communities of the semi-arid regions of Maharashtra, India May 2018 www.assar.uct.ac.za Written by Adithya Pradyumna, Ramkumar Bendapudi, Dipak Zade, Marcella
The views of the European Anti Poverty Network EAPN
 Cohesion policy and cities: the urban contribution to growth and jobs in the regions Commission staff working paper The views of the European Anti Poverty Network EAPN 17 February 2006 The European Commission
Environment and Social Justice. SDRN briefing two. SDRN briefing two. Introduction
 Introduction This briefing summarises the key messages from Environment and Social Justice, the second in an ongoing series of rapid research and evidence reviews undertaken by the Sustainable Development
Spatial mapping tools for district heating (DH): helping local authorities tackle fuel poverty Executive Summary.
: helping local authorities tackle fuel poverty Executive Summary.") Spatial mapping tools for district heating (DH): helping local authorities tackle fuel poverty Executive Summary. Executive Summary Ruth Bush and Dr Catherine Bale CENTRE FOR INTEGRATED ENERGY RESEARCH,
Spatial mapping tools for district heating (DH): helping local authorities tackle fuel poverty Executive Summary. Executive Summary Ruth Bush and Dr Catherine Bale CENTRE FOR INTEGRATED ENERGY RESEARCH,
Linking repairs and asset management to neighbourhoods
 Linking repairs and asset management to neighbourhoods Dave Smethurst Senior Associate: CIH consultancy Date: 19 th May 2016 @CIHconsultancy What I want to look at today We think that linking the impact
The UK Innovation Survey: Headline Findings 2014 to 2016
 This release provides a measure of innovation activity in UK businesses in 2014-16. Figure 1: Proportion of enterprises which are innovation active, 2012-14 and 2014-16 60% 50% 40% 30% 20% 10% 0% Unweighted
SAICM/RM/CEE.6/3. Distr.: General 25 January English only
 SAICM/RM/CEE.6/3 Distr.: General 25 January 2018 English only 6 th Central and Eastern Europe regional meeting on the Strategic Approach to International Chemicals Management Lodz, Poland, 19-21 February
Dorset s economy is PROSPEROUS
 Appendix 1 Dorset s economy is PROSPEROUS Outcome Sponsor Mike Harries Outcomes Focused Monitoring Report - October 217 PAGE 1 The following pages have been provided to summarise the current position against
In October 2014 the Operations sub-committee of The Scout Association Board of Trustees approved a Future Leaders Strategy for Scouting.
 In October 2014 the Operations sub-committee of The Scout Association Board of Trustees approved a Future Leaders Strategy for Scouting. The Future Leaders Strategy has five strands of development, each
Quality adjusted labour input: new quarterly estimates for 1993 to 2009 and annual estimates from 1970
 Quality adjusted labour input: new quarterly estimates for 1993 to 2009 and annual estimates from 1970 Jean Acheson and Mark Franklin Office for National Statistics Summary Quality adjusted labour input