Final Report. Water Use Accountability
|
|
|
- Christian Caldwell
- 6 years ago
- Views:
Transcription


1 MWDOC Water Loss Management Program Assessment Final Report Water Use Accountability March 2007 Project
2 Acknowledgements The Project Team appreciates the opportunity afforded it through funding of this project by the United States Bureau of Reclamation Southern California Area Office under its Water Conservation Field Services Program and equal financial participation by the Municipal Water District of Orange County (MWDOC). The project representative from the Municipal Water District of Orange County was Mr. Joe Berg, Water use Efficiency Program Manager. Primary representatives from the City of Tustin Water Services Division included Mr. Fred Adjarian, Water Services Manager, Mr. Art Valenzuela, Water Treatment Supervisor, Mr. Jose Diaz, Acting Water Construction/Maintenance Supervisor, and Mr. Kunal Mittal, Associate Engineer. City of Tustin staff graciously collected information requested by the Consultant Project Team required to perform a simplified American Water Works Association (AWWA) Water Audit using newlydeveloped public domain spreadsheet software from the AWWA Water Loss Control Committee. The Project Team appreciates the efforts of MWDOC and Tustin in the collection of critical field information. The Mesa Consolidated Water District collaborated with MWDOC and the City of Tustin in assembling and installing appropriate field water metering data logging equipment to characterize residential water use. The City of Tustin identified, extracted, and tested a sample of in-service residential water meters for accuracy testing. The Malcolm Pirnie Consultant Project Team consisted of Reenu Kaur, Nina Jazmadarian, Roxana Silva-Cobbs, and Steve Davis (Project Manager).
3 Table of Contents Page Executive Summary ES-1 Section 1.0 Introduction Project Overview Purpose of Final Report 2 Section 2.0 Utility Questionnaire Description Questionnaire Responses 3 Section 3.0 Telephone Follow-Up MWDOC Member Agency Screening Recommended MWDOC Member Agency Audit 8 Section 4.0 Urban Water Management Plans Introduction MWDOC 2005 Urban Water Management Plan MWDOC Service Population and Water Demand MWDOC Service Area Population MWDOC Water Use Efficiency Program Tustin 2005 Urban Water Management Plan 16 Section 5.0 Retail Member Agency Water Audit Introduction Task Objectives AWWA/IWA Spreadsheet Water Audit Software Water Loss Management Recommendations made by AWWA Water Loss Control Committee Water Audit Results Estimation of Average Residential Bi-monthly Bill for the City of Tustin Cost of Water Review of the Audit Results 35 Section 6.0 Retail Member Agency Field Data Collection Introduction Residential Water Use Distribution Meter Accuracy Tests 41 Section 7.0 Findings, Conclusions, and Recommendations Study Findings Conclusions Recommendations 51
4 List of Figures 5-1 Map of the Service Area of Municipal Water District of Orange County Map of the Service Area of the City of Tustin The IWA Best Practice Standard Water Balance The four basic methods of managing Real Losses The four basic methods of managing Apparent Losses Graphical presentation of Percentage of Residential Flow Volume at Low, Medium, and High Flows Meter Accuracy versus Cumulative Flow for Low Flow tests (5/8" by 3/4" Positive Displacement Residential Water Meters) Meter Accuracy versus Cumulative Flow for Medium Flow tests (5/8" by 3/4" Positive Displacement Residential Water Meters) Meter Accuracy versus Cumulative Flow for High Flow tests (5/8" by 3/4" Positive Displacement Residential Water Meters) Meter Accuracy versus Cumulative Flow-Summary of Data Trend Lines 46 Page
5 List of Tables Page 1 General Information on Utilities Submitting Questionnaires 4 2 Detailed Questionnaire Statistics Historical and Projected MWDOC Population Historical MWDOC Service Area Water Demand (Acre-Feet) MWDOC Service Area Projected M & I Water Demand Water Production Report for the City of Tustin for FY 2005 (AF) Schedule of Water Pumped and Purchased for City of Tustin Water Services (Acre-Feet and Percentage of Total) Total Annual Water Consumption for each Meter Size for FY Commodity Rates and Fixed Charges for the City of Tustin for FY Financial Information for the City of Tustin for FY Data Reporting Interface of AWWA Water Audit Spreadsheet for the City of Tustin Water balance Calculations based on the information provided in reporting spreadsheet Guidance on Target Infrastructure Leakage Index (ILI) Percentage of Residential Cumulative Flow Volume at Low, Medium, and High Flows Results of Meter Accuracy Tests at Three Different Flow Rates 42
6 List of Appendices Appendix A Appendix B Appendix C Appendix D Appendix E Completed Utility Questionnaires AWWA/IWA Spreadsheet Water Audit Software Water Meter Consumption Report for the City of Tustin Flow Reports for the City of Tustin Accuracy Test Results for the City of Tustin
7 Acronyms and Abbreviations AB Assembly Bill ACT Urban Water Management Planning Act of 1983 AF Acre-Feet (325,851 gallons) AFY Acre-Feet per Year AWWA American Water Works Association AwwaRF AWWA Research Foundation BMP Best Management Practices CALSIM California Water Allocation and Reservoir Operations Model CCF Hundred Cubic Feet (748 gallons) CEQA California Environmental Quality Act CII Commercial, Industrial and Institutional CIP Capital Improvement Program CRA Colorado River Aqueduct CUWCC California Urban Water Conservation Council CVP Central Valley Project DWR Department of Water Resources EOCWD East Orange County Water District EPA Environmental Protection Agency GPCD Gallons Per Capita Per Day GPM Gallons Per Minute In Inches ILI Infrastructure Leakage Index IRP Integrated Resources Plan IRWM Integrated Regional Water Management ISO Insurance Service Organization IWA International Water Association M&I Municipal and Industrial MAF Million Acre-Feet MCWD Mesa Consolidated Water District MGD Million Gallons per Day MOU Memorandum Of Understanding MWD Metropolitan Water District of Southern California MWDOC Municipal Water District of Orange County NRW Non-Revenue Water OC Orange County OCSD Orange County Sanitation District OCWA Orange County Water Association OCWD Orange County Water District SB Senate Bill SWP State Water Project SWRCB State Water Resources Control Board TAF Thousand Acre-Feet TWS Tustin Water Services
8 UARL USBR UWMP WLCC Unavoidable Annual Real Losses U.S. Bureau of Reclamation (Reclamation) Urban Water Management Plan AWWA Water Loss Control Committee
9 Executive Summary This report has been prepared to document results of a study jointly funded by the U.S. Bureau of Reclamation Southern California Area Office (Reclamation) and the Municipal Water District of Orange County (MWDOC). The study focus was a Water Loss Management Program Assessment of MWDOC retail member agencies. The three major study elements included the preparation and distribution of a water utility questionnaire, and the analysis and screening of questionnaire responses through follow up telephone interviews, a water utility questionnaire, and the performance of a demonstration water audit, using the American Water Works Association Water Loss Control Committee authored free water audit software. The study was performed under a professional services contract agreement between MWDOC and Malcolm Pirnie, Inc. The following represent major study findings of the MWDOC and Malcolm Pirnie, Inc. The following represent major study findings of the MWDOC Water Loss Management Program Assessment: ten of 29 MWDOC retail member agencies responded to a 94-question survey prepared in Microsoft Excel spreadsheet format. utility population for the ten reporting utilities varies from 3,000 to 200,000. reported water loss varies from 2 percent of supply to almost 20 percent. in many cases, questionnaire information was not consistent with data reported in MWDOC s Orange County Water Rates Survey. four of the ten reporting agencies conduct annual water audits. -ES-1-
10 Follow-up telephone interviews took from a few minutes to an hour, depending on knowledge and interest of staff. Many contacted felt their water loss monitoring programs were excellent and effective. the City of Tustin was very interested in the details of the project and recognized the value in performing the demonstration audit. Based on Tustin s interest and reported water loss, they were selected for audit. this report responds to Best Management Practice (BMP) No. 3 in the CUWCC Memorandum of Understanding relating to water conservation. field data collection for one week in September on sample residential water meters in Tustin indicated 5.19% of total use was at low flow, 11.95% at medium flow, and 82.86% at high flow. ten residential meter accuracy tests were performed by Measurement Control Systems on meters having in-service cumulative flow of 1-3 million gallons. average meter accuracy was 89.7% for low flow, 95.2% for medium flow, and 97.0% for high flow. the weighted meter accuracy for Tustin residential meters was percent, reflecting an average under-registration of 1.88 percent. the AWWA/IWA water audit software identifies two water loss categories as real water losses and apparent water losses. the AWWA/IWA water audit for Tustin for fiscal year indicated the following: -total water supplied was 4,303.2 MG -non-revenue water was MG -ES-2-
11 -water loss was 11.0 percent -annual cost of real losses = $306,842 -annual cost of apparent losses = $133,939 -Infrastructure Leakage Index = 3.73 AWWA recommends a minimum of 70 water meter accuracy tests to be statistically significant, but Tustin results are more typical of a much larger database. The following represent major study conclusions: the level of water loss in MWDOC retail water agencies varies significantly, and reported losses aren t consistent among report references. there is significant staff and consultant effort required to collect, organize, and format water supply and demand information for an AWWA/IWA water audit. the CUWCC BMP No. 3 on System Water Audit, Leak Detection, and Repair applies most to this report on MWDOC water loss management. MWDOC projected population and water demand growth requires continued focus on water conservation and water use efficiency. with existing and projected MWDOC member agency water losses at 40,000 acrefeet per year, there is substantial room for water-use efficiency by member agencies. the new AWWA/IWA water audit methodology and spreadsheet software provide an excellent tool for assessing a utility s water balance and potential value of water saved through loss management. field data collection of residential time-of-day water use indicated only 5.2 percent at low flow. This result was surprisingly low to the Consultant Team. -ES-3-
12 Plots of meter accuracy versus cumulative flow were consistent with results from other western U.S. utilities showing reduced accuracy at low flow with increased cumulative volume through the meter. Based on the above mentioned findings and conclusions, the following are recommendations for further consideration by MWDOC and its member retail water agencies: 1. MWDOC should enhance the accuracy of audit work for the City of Tustin by conducting additional field investigations on calibration and validity testing of water supply meters and on leak detection surveys. 2. Water audits in the AWWA/IWA spreadsheet software format should be prepared for additional MWDOC retail member agencies to characterize water loss issues throughout its service area. 3. Additional grant applications to the U.S. Bureau of Reclamation and the California Department of Water Resources should be prepared and submitted in pursuit of follow-up funding of water audit work. 4. Results of this study should be shared with the CUWCC to advocate the extended application of the AWWA/IWA Water Audit methodology to other signatories to the MOU. 5. MWDOC retail member agencies and other California conservation-conscious water utilities should begin collecting and organizing the necessary water supply and customer demand information to conduct a standard annual water audit using AWWA/IWA methodology and to perform periodic updates. -ES-4-
13 6. Upon collection of multiple utility audits, a database should be developed to compare audit results, utility standard performance indicators, and water loss reduction methodologies and successes. -ES-5-
14 1.0 Introduction 1.1 Project Overview Malcolm Pirnie was retained by the Municipal Water District of Orange County (MWDOC) to perform a Water Loss Management Program Assessment of its 29 retail member agencies. The project was jointly funded equally by the US Bureau of Reclamation (Reclamation) under its Water Conservation Field Services Grants program and MWDOC. The project objectives were to develop a retail member agency water utility questionnaire, based on responses to conduct follow up interviews with five member agencies, to select one member agency for a demonstration water audit using available information and the American Water Works Association (AWWA)/ International Water Association (IWA) audit methodology, and to extrapolate results to all MWDOC member agencies to determine potential non-revenue water (formerly unaccounted-for water) reductions. The project was accomplished through seven scope of work tasks, as indicated below: 1. Kickoff Meeting and Data Collection. 2. MWDOC Water Use Accountability. 3. Leakage Management Program and System Operations Review. 4. MWDOC Water Management Plan (WMP). 5. Retail Member Agency Water Audit. 6. Retail Member Agency Field Data Collection. 7. Project Management and Reporting. 1
15 1.2 Purpose of Final Report This Final Report for the project documents the results of Scope of Work tasks 1-7. Task 2 included the preparation, distribution, and analysis of responses to a comprehensive retail member agency utility questionnaire. The questionnaire was based on a survey previously developed for the AwwaRF (American Water Works Association Research Foundation) Project 2928 on Water Loss Control Technology and restructured specifically for MWDOC member agencies by consultant and staff. Section 2 of this report describes the questionnaire and presents results for the responding agencies. Of those agencies responding to the questionnaire, five were selected for follow-up telephone interviews to better determine and assess individual water audit and water loss management practices that currently result in favorable low amounts of non-revenue water or may benefit from a more detailed evaluation. Section 3 of this report discusses the results of the telephone interviews and recommends a single member agency for a demonstration water audit. Section 4 describes the MWDOC and City of Tustin Urban Water Management Plans and implications of water loss management for MWDOC and its member agencies in achieving utility water conservation targets. Section 5 discusses the approach and results of an AWWA water audit for the City of Tustin using the AWWA Water Loss Control Committee Spreadsheet software. Section 6 presents results of field investigations of residential water demand and meter accuracy testing in Tustin. Section 7 presents findings, conclusions, and recommendations. 2
16 2.0 Utility Questionnaire 2.1 Description A 94-question survey was prepared in Microsoft Excel spreadsheet format to solicit input from MWDOC retail member agencies. A definition section was included in the utility questionnaire table of contents sheet to guide the responders. There were five specific work sheet categories, including utility information, pipe materials, delivery pressures and modeling; customer metering; water supply auditing; and leakage management. Questionnaires were sent to 29 MWDOC member agencies in December It took approximately six weeks to receive questionnaires back from ten member agencies. This represents a participation rate of approximately 35 percent. 2.2 Questionnaire Responses The following ten MWDOC retail member agencies responded to the Utility Questionnaire: City of Brea City of Fountain Valley City of Huntington Beach City of San Clemente City of Tustin City of Westminster East Orange County Laguna Beach Moulton Niguel City of Newport Beach 3
17 Fully-completed questionnaires for the ten water utility member agencies are provided in Appendix A found at the end of this Report. Table 1 provides a summary of specific information supplied by the ten utilities. Simple comparative information includes service population, number of service connections, annual water supply volume, and reported water loss as a percent of supply. Utility population varies from about 3,000 to 200,000. Number of service connections varies from about 1,200 to 53,000. Annual supply volume varies from 1,000 acre-feet to 36,000 acre-feet. Reported water loss varies from about 2 percent to almost 20 percent. Table 1: General Information on Utilities Submitting Questionnaires MWDOC Utility Population Service Connections Annual Supply Volume Reported Annual Loss City of Brea 39,584 City of Fountain Valley 57,495 City of Huntington Beach 196,954 City of Newport Beach 76,382 City of San Clemente 43,900 City of Tustin 65,000 City of Westminster 92,270 East Orange Co. Water District 3,195 Laguna Beach Co. Water District 24,500 Moulton Niguel Water District 165,398 11,645 11,068 AF/YR 8.0% 17,506 11, % 52,185 30, % 26,361 17, % 17,070 11, % 14,509 12, % 20,024 12,860 missing 1, % 8,520 4, % 53,298 36, % Table 2 presents more detailed questionnaire statistics and comparisons for the ten utilities, which responded. Percent of MWDOC supply varies from 16 to 100 percent. Average static water pressure in the distribution system varies from 60 to 100 psi. Percent of metallic pipeline varies from 0 to 100. Average residential water meter replacement varies from 10 to 20 years. Four of the ten agencies conduct annual water audits. Reported sources of water loss were leaks, flushing, reservoirs, and water meters. 4
18 Table 2: Detailed Questionnaire Statistics Percent MWDOC Supply Percent Ground Water Static Pressure (PSI) Percent Metal Pipe Residential Meter Replacement Conduct Annual Audit Sources of Water Loss Leak Detection Methods MWDOC Utility City of Brea 50% 50% % 15 years No Leaks Passive City of Fountain Valley 28% 66% 72 3% 20 years No Flushing Passive City of Huntington Beach 64% 36% % 15 years Yes Reserv. Leaks Active City of Newport Beach 34% 66% 75 20% 15 years No Flush/Leaks Active City of San Clemente 94% 5% 70 20% 10 years No Not Reported Active City of Tustin 16% 84% % 15 years No Meters/Leaks Passive City of Westminster 34% 66% years Yes Not Reported Passive East Orange Co. Water District 37% 63% 80 34% 10 years No Meters/Leaks Passive Laguna Beach Co. Water District 100% % 20 years Yes Meters/Leaks Active Moulton Niguel Water District 83% % 20 years Yes Meters/Leaks Active 5
19 Half of the ten utilities use some method of active leak detection in addition to visual identification of leaks. Information presented in Table 1 and Table 2, as well as perceptions of utility water audit data availability and potential benefit of performing a water audit, were used to select five member agencies for follow-up telephone discussions and collection of additional information regarding the perceived need for and benefits of performing a water audit. 6
20 3.0 Telephone Follow-Up 3.1 MWDOC Member Agency Screening Five of the ten responding member agencies were selected through collaboration with MWDOC staff. These utilities were: City of Brea City of Huntington Beach City of Tustin Laguna Beach County Water District Moulton Nigel Water District Pre-arranged appointments were made with individuals identified on the utility questionnaire as the water use efficiency point of contact. In some cases, the utility desired the participation of multiple utility staff having multiple levels of responsibility and levels of expertise. A typical telephone agenda included the following discussion items: 1. Introductions and purpose of the USBR grant project 2. Discussion and clarification of the Utility Questionnaire 3. Potential for water distribution system corrosion 4. Existing system water quality issues 5. Predominant water meter sizes and manufacturers 6. Meter accuracy testing frequency and methods 7. Residential water meter replacement criteria 8. Recent water audit experience 9. Desire and usefulness of a simplified water audit 7
21 10. Availability of required audit data and staff assistance 11. Open discussion about the audit process and schedule 3.2 Recommended MWDOC Member Agency Audit Based on telephone discussions, some of which were mere short clarifications of the questionnaire and one of which lasted about an hour, the City of Tustin was recommended to MWDOC for conducting a utility water audit. The next step was scheduling a meeting with utility staff to discuss details of the AWWA/IWA audit approach and recently developed spreadsheet-based software. Staff assistance in collecting the required water supply and demand information was solicited from the City of Tustin. 8
22 4.0 Urban Water Management Plans Urban water management plans provide the context for conducting water conservation demonstration projects such as the one reported herein. This section discusses the background and requirements for urban water management plans and relevant provisions of the MWDOC and Tustin specific 2005 Urban Water Management Plans that relate to water conservation and utility- specific water loss management. 4.1 Introduction The Urban Water Management Planning Act (Act), adopted in 1983, requires every urban water supplier providing water to more than 3,000 customers or supplying more than 3,000 acre-feet of water annually to prepare and adopt an Urban Water Management Plan every five years. The Municipal Water District of Orange County, a water wholesaler and regional planning agency, fits the defined criteria and has prepared an Urban Water Management Plan to address the requirements set forth in the State of California Water Code Section through Over the last 20 years, Urban Water Management Plans have evolved to become: sources of information for Water Supply Assessments and Written Verifications of Water Supply; long-range planning documents for water supply; source data for development of regional water plans; key components of Integrated Regional Water Management Plans; and a condition to qualify for receipt of certain State grant funds, such as Proposition 50. 9
23 4.2 MWDOC 2005 Urban Water Management Plan MWDOC has used its latest five-year Urban Water Management Plan (2005) to: Evaluate supply-reliability goals for the region and provide a comprehensive assessment of water resource needs in its service area; Provide a regional perspective on current and proposed water use efficiency programs and identify measures that can be accomplished in a cost-effective manner; Provide assistance to maximize the beneficial use of local resource supplies that reduce the need for imported supplies; and Provide information that will allow the public to gain a better understanding of the region s comprehensive water planning. Consistent with the above objectives, MWDOC s plan documents its water use efficiency efforts. In 1991, MWDOC signed a Memorandum of Understanding (MOU) monitored by the California Urban Water Conservation Council (CUWCC), which outlines 14 Best Management Practices for urban water conservation. The urban water conservation practices are intended to reduce long-term urban demands and are in addition to programs that may be instituted during occasional water supply shortages. As a wholesaler, MWDOC is committed to developing and implementing regional conservation programs on behalf of its retail water agencies and their customers. This regional approach enables economies of scale, ensures a consistent message to the public, and assists in the acquisition of grant funding of program implementation. To facilitate the implementation of Best Management Practices (BMPs) throughout Orange County, MWDOC focuses its effort on the following three areas: 10
24 Regional Program Implementation: MWDOC develops, obtains funding for, and implements regional BMP programs on behalf of all retail water agencies in its service area. Local Program Assistance: Upon request, MWDOC assists retail agencies in developing and implementing local programs within their individual service areas. Research and Evaluation: In the past five years, MWDOC has conducted research that allows agencies to measure the water-savings benefits of a specific program and then compare those benefits to the costs of implementing the program. This water conservation demonstration project jointly funded by the US Bureau of Reclamation and MWDOC is consistent with the third bullet above in testing new water audit methodologies in MWDOC retail agencies to assess cost-effectiveness. MWDOC s Mission Statement is To provide reliable, high-quality supplies from Metropolitan Water District of Southern California and other sources to meet present and future needs, at an equitable and economical cost for all Orange County, and to promote water use efficiency. Related water conservation goals and objectives include: Guide Metropolitan in its planning efforts and act as a resource of information and advocacy for member agencies; Work together with Orange County water agencies and others to focus on solutions and priorities for improving Orange County s future water supply reliability; 11
25 Cooperate with and assist OCWD and other agencies in coordinating the balanced use of the area s imported water to its member agencies; As a regional wholesaler of imported water, MWDOC s most significant roles are broadly applicable to all of its member agencies. A key goal of MWDOC is to provide services that the retail agencies cannot reasonably provide as single entities MWDOC Service Area Population According to the California Department of Finance, the MWDOC service area had a population of 1 million in 1970 and 2.2 million in This represents an average growth of 2.3 percent per year. According to the SCAG Regional Transportation Plan, the now 30-agency MWDOC service area population will grow to 2.64 million by Table 4.1 below indicates the five-year historical and projected MWDOC population from 1970 through Table 4-1 Historical and Projected MWDOC Population Year Population (Millions) MWDOC Service Area Water Demand Historical water demand has increased from 285,200 acre-feet in 1970 to to 521,400 acre-feet in 2000 for the MWDOC Service Area. Municipal and Industrial uses have more than doubled, whereas Agricultural use has declined significantly as shown in Table 4.2 below. 12
26 Table 4-2 Historical MWDOC Service Area Water Demand (Acre-Feet) Demand Municipal & Industrial 220, , , , , , ,800 Agricultural 64,700 53,700 40,800 41,900 20,800 10,700 20,600 Total 285, , , , , , ,400 Over the period 1970 to 2000, per capita water use has varied between 180 gallons per capita per day to 230 gallons per capita per day. Recently, per capita use has averaged about 200 gallons per person per day for all municipal and industrial uses. To project future water demands, the MWDOC Urban Water Management Plan presented two different methodologies. Whereas the Plan adopted the method reported in the MWDOC Annual 25-Year Survey using individual member agency projections for years in five-year increments, this study finds the Metropolitan MWD-Main forecast of M & I water use in the service area with conservation more useful. This is due to the itemization of projected water system losses at about 7.4 percent of total projected demand. 13
27 Table 4-3 MWDOC Service Area Projected M & I Water Demand MWD-Main Single Family 249, , , , , ,652 Multi-Family 67,474 72,055 75,661 77,455 78,643 79,979 Non-Residential 147, , , , , ,313 System Losses 37,182 39,341 40,294 41,389 42,118 42,827 Total 501, , , , , ,771 Individual Agencies 504, , , , , ,757 All member agencies have water system losses in terms of real water loss due to transmission system, distribution system, reservoir, fire hydrant and service connection leakage. Since municipal and industrial demand in MWDOC is projected to increase, and water system losses are projected to increase, MWDOC is concerned about demonstrating and implementing successful methodologies to help its member agencies become more water efficient MWDOC Water Use Efficiency Program Along with groundwater, recycled water, and imported water, MWDOC recognizes that water use efficiency is a low-cost source of new supply for its service area. MWDOC demonstrated its commitment to improving its efficiency by signing a Memorandum of Understanding (MOU) with the California Urban Water Conservation Council (CUWCC) in The MOU commits MWDOC to implementing conservation Best Management Practices (BMPs) which are cost effective. BMPs are policies, programs, 14
28 rules, regulations, ordinances, and technologies that have been accepted by the water industry as providing a reduction in water demand. The CUWCC has adopted 14 BMPs that include technologies and methodologies demonstrated to result in more efficient water use. This demonstration project is consistent with CUWCC BMP No. 3 relating to System Water Audits, Leak Detection, and Repair. All retail water agencies in Orange County are actively implementing BMP-based programs. However, not all retail water agencies are signatories to the MOU. While implementation of most BMPs is the responsibility of retail water agencies, wholesale water agencies, such as MWDOC, are responsible for BMP 10 Wholesale Agency Assistance Programs and develop and implement regional programs on behalf of their retail member agencies and customers. Since MWDOC does not own and operate a distribution system, implementation of BMP No. 3 is not applicable. However, to assist its retail agencies, MWDOC publishes an annual report called The Orange County Water Agencies Water Rates, Water System Operations, and Financial Information. This survey estimates volume and percent of unaccounted-for-water for each retail water agency in Orange County. In 2004, the range of retail water agency unaccountedfor-water was 1.2 percent to 10.7 percent. The average was 5.1 percent. This is a little lower than the 7.4 percent predicted by the Metropolitan MWD-Main model in Table 4.3. Since most agencies have not performed 15
29 official water audits, individual agency estimates require validation applying industry audit best management practices. 4.3 Tustin 2005 Urban Water Management Plan The Tustin 2005 Urban Water Management Plan is discussed herein, since this study recommended Tustin for a demonstration AWWA/IWA standard water audit using new spreadsheet software from the AWWA Water Loss Control Committee. Results of the Audit are presented in Section 5.0 of this report. The City of Tustin Water Services Division (CTWS) provides potable water service to most of the incorporated area of the City of Tustin and some unincorporated county areas north of the City. CTWS water service area is 8.4 square miles and is predominantly residential, with over 90 percent of water services being single-family and multi-family residences. Tustin s service area population was 62,131 in Since the area is essentially built-out, the projected population for 2030 remains at 62,100. Based on 2000 and 2005 water supply and metered demand comparisons for CTWS, Tustin s Urban Water Management Plan 2005 projects Unaccounted-for Water losses at 11.3 percent through 2030, or about 1,330 acre-feet per year. The purpose of the demonstration water audit reported herein is to define sources of this water loss and recommend methods to reduce the amount. CTWS maintains an emergency response program that aggressively repairs main breaks, hydrant leaks or breaks, and meter leaks. Staff is available to repair main and hydrant breaks and promptly restore water service. All reported water meter leaks are investigated and repaired the same day. 16
30 5.0 Retail Member Agency Water Audit 5.1 Introduction In accordance with Task 5 of the Scope of Work, a retail member agency water audit was conducted by the Consultant Team. A water audit for the City of Tustin was performed for fiscal year using the American Water Works Association (AWWA) / International Water Association (IWA) adopted water audit methodology. CTWS provides potable water service to a population of approximately 60,000. To serve this population, the City of Tustin supplies approximately 84 percent of its water from wells extracting from the underlying groundwater aquifer, and the remaining 16 percent consists of imported treated surface water purchased from MWDOC. The City of Tustin currently utilizes twelve groundwater wells (Beneta, Columbus Tustin, Main Street No. 3 and No. 4, Newport, Prospect, 17th Street No. 1 and No. 2, Tustin, Vandenberg, Walnut and Yorba.). Seven wells pump directly into the distribution system without treatment. The remaining five wells receive treatment at two treatment facilities. Water is pumped from the two treatment plants to three pressure zones in the distribution system. The distribution system covers an area of 8.4 square miles having a service area elevation range between 0 and 480 feet. The Tustin distribution system consists of 172 miles of water mains and 14,048 active and inactive service connections. There are three pressure zones in the distribution system with an average static pressure of 65 pounds per square inch (psi). The CTWS s water distribution system piping consists primarily of asbestos cement, polyvinyl chloride (PVC), and ductile iron mains. 17

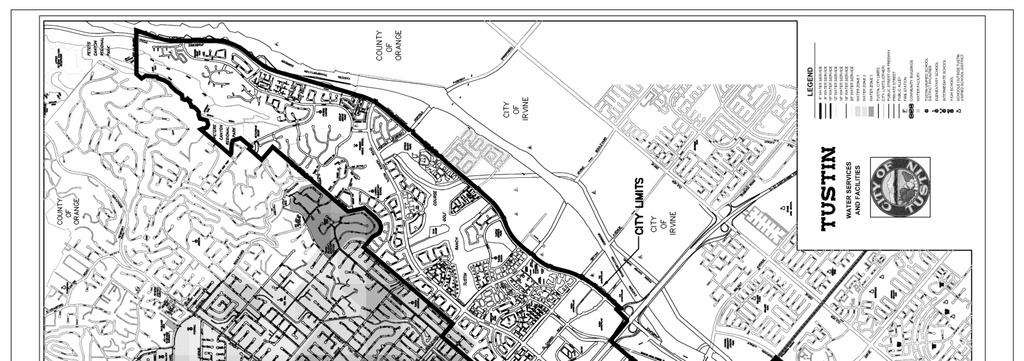
31 Figure 5-1: Map of the Service Area of the Municipal Water District of Orange County 18
32 19
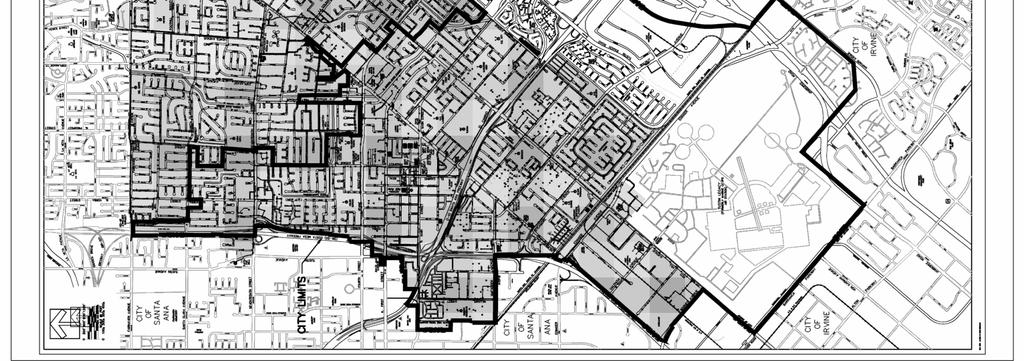
33 A map of the service area for MWDOC is shown in Figure 5-1, and the map of service area of the City of Tustin is shown in Figure Task Objectives The major objective of Task 5 is to perform a water system audit for the City of Tustin using AWWA/IWA water audit spreadsheet populated with the data provided by the CTWS utility staff for FY The water audit includes a calculated water balance table to compare water produced with metered consumption and to estimate real and apparent water losses. The major goals of performing the Tustin water audit are: To quantify the amount and percentage of non-revenue water for FY 2005 based on the authorized uses and the estimated unauthorized uses associated with unmetered water. To determine the water supply efficiency of the system by accurately determining the quantities of water produced and accounting for all water that reaches its intended or unintended destinations. To develop a water balance, which compares water produced with metered consumption. The difference is an estimation of real and apparent water loss. To determine the technical performance indicators for real losses due to system leakage. To evaluate the potential for modifying system pressure during certain periods of the day to reduce distribution system leakage without affecting delivery of domestic and fire protection needs. 20
34 To prepare a water audit report which includes the standard audit spreadsheet for MWDOC management team and retail member agency review. 5.3 AWWA/IWA Spreadsheet Water Audit Software A Microsoft Excel spreadsheet software has been developed by the AWWA Water Loss Control Committee for performing a comprehensive water utility audit. The major objective behind the development of this software is to bring the best practice water audit methodology developed by the International Water Association and the AWWA to all utilities, to make the water audit terms and definitions standardized throughout the industry to assess water supply efficiency in a standard reliable manner, and to give utilities a user-friendly way to compile and compare their water audit data with other utilities. This spreadsheet-based software helps to quantify, as well as track, the water losses, which may occur in water distribution systems. It also helps in identifying areas where efficiency can be improved, and cost can be recovered. Since the AWWA/IWA water audit methodology gives consistent definitions for the major forms of water consumption and water losses encountered in drinking water utilities, it is considered universally applicable. In order for water utilities to make a meaningful assessment of their water loss, this software consists of a set of performance indicators (financial and operational) that evaluate utilities on system-specific features, such as average pressure in the distribution system and total length of water mains. The term unaccounted-for water is no longer used in the international water community and has been replaced by the term non-revenue water. The AWWA Water Audit Software is a Microsoft Excel spreadsheet workbook consisting of five worksheets. The five worksheets contain the following: 21
35 The First worksheet provides instructions on the use of the software and allows the user to input the general information about the water audit being performed. The Second worksheet is the reporting worksheet, which acts as an input data screen prompting the user to enter all of the required information about the water supply, such as the volume of water supplied, customer consumption, and various quantities of losses in the distribution system in order to perform the waterbalancing calculations. It also prompts for the utility-specific information, such as average distribution system pressure, length of mains, etc. for calculating the performance indicators. The Third worksheet is a water balance worksheet, which shows summarized totals of each component of the water audit in columns. The table format balances all of the water entering the system with all of the water leaving the system by performing a top down water audit to determine real water losses. All of the values entered by the user on the Reporting Worksheet are utilized for calculating the components of the water balance sheet. In Figure 5-3, the summation of water from own sources and water imported is the total system input volume. It can be clearly seen that all of the losses, which used to fall under the category of so-called unaccounted-for water have been replaced by nonrevenue water per the AWWA/IWA methodology. 22

36 Figure 5-3: The IWA Best Practice Standard Water Balance The Fourth worksheet consists of definitions and guidelines for use of all the terms established in the AWWA/IWA methodology. It is extremely easy to switch between the reporting worksheet to the definitions worksheet to have access to the meaning of each term for entering the appropriate data into the reporting worksheet. The Fifth worksheet determines the Water Loss Standing value, which helps in the interpretation of the results for the performance indicators. This worksheet provides the calculation of the ILI (Infrastructure Leakage Index) and its use as an approximate leakage reduction tool. The ILI is calculated by dividing the Calculated Average Real Leakage by the Unavoidable Annual Real Losses (UARL). The value of ILI acts as a good operational benchmark for real water loss control. A table showing the general guidelines for establishing a target ILI 23
37 range has been provided in this sheet. The availability of water resources to the utility is a determinant to setting a target ILI range. The five worksheets have been attached as Appendix B to this Report. 5.4 Water Loss Management Water losses in a distribution system may be divided into two categories - namely, real losses and apparent losses. Apparent losses are the paper losses that occur in utility operations due to customer meter inaccuracies, data errors in the billing process, and unauthorized consumption or water theft. In other words, this water is consumed, but it is unaccounted for, improperly measured, or un-paid. These losses reduce utility revenue and lead to distortion of data on customer consumption patterns. Real losses are the physical losses of water from the distribution system, including leakage and storage overflows. These losses inflate the water utility's production costs and put a stress on water resources, since they represent water that is extracted and treated but never reaches customers for a beneficial use. In order to make the water distribution system more efficient, utmost importance must be placed on water loss management. Independent of the type of method being used for performing a water audit, there will always be an uncertainty while calculating non-revenue water, apparent losses, and real losses. The relationship shared by real losses from the IWA water balance and UARL (Unavoidable Annual Real Losses) is clearly shown in Figure 5-4. The UARL calculation is based on length of mains, number of services, customer meter location, and average pressure in the distribution system. There are four methods of managing real losses, which are indicated by the four arrows in Figure 5-4. Putting a focus on these four management methods can reduce real losses, but, at a given average system operating 24

38 pressure, the total real losses cannot be economically reduced any further than the value of UARL. Figure 5-4: The four basic methods of managing Real Losses Figure 5-5 shows the four basic methods for managing apparent losses. Dependent upon the amount of attention given to each component related to apparent losses in Figure 5-5, the losses will increase or decrease. A primary purpose of the utility is to keep real and apparent losses at a minimum to minimize use of water resources and maximize revenue. 25

39 Figure 5-5: The four basic methods of managing Apparent Losses 5.5 Recommendations made by the AWWA Water Loss Control Committee The water auditing methodology developed by the AWWA and IWA and associated performance indicators are recognized as the current best practice methodology for quantitatively monitoring water consumption and water loss in water distribution systems. The term unaccounted-for-water does not hold any consistent meaning, and, thus, should be eliminated in all the industry references. For controlling real losses and apparent losses occurring in the distribution system, the four controlling components shown in Figure 5-4 and Figure 5-5 should be used, which will further help to improve the overall efficiency of the system. 5.6 Water Audit Results This Section presents the results of the annual water audit performed on the CTWS by using American Water Works Association (AWWA)/ International Water Association (IWA) Water Audit Software Version 2.0 along with the water balance sheet. All of the 26
40 data, which have been used in performing the Water Audit, have been either provided by CTWS staff or have been estimated based on the utility information provided in the initial project questionnaire and the Year 2005 edition of The Orange county Water Agencies Water Rates, Water System Operations, and Financial Information report prepared by MWDOC. All of the units for the data provided in the water audit spreadsheet have been converted to million gallons per year. As per the information provided in the questionnaire by CTWS staff, 84 percent of water introduced into the distribution system is provided by the Tustin s twelve groundwater wells, and 16 percent of the water is purchased from MWDOC. Table 5-1 shows the annual volume of water pumped from these twelve groundwater wells for the Fiscal Year
41 Table 5-1: Water Production Report for City of Tustin for FY 2005 (AF) Table 5-2 shows a schedule of the amount of water pumped from Tustin s groundwater wells and amount of water purchased from MWDOC. The totals from Table 5-2 were applied to the total water supplied to the distribution system from the own sources and the total volume of imported water introduced into the distribution system in the AWWA/IWA water audit spreadsheet section for utility usage analysis. Note that data in the two tables are different for groundwater pumped due to imported water counted as groundwater in Table
42 Table 5-2: Schedule of Water Pumped and Purchased for the City of Tustin Water Services (Acre-Feet and Percentage of Total) 29
43 For calculating the total billed metered water, which is considered as an authorized consumption, the CTWS Water Billing information report prepared on a monthly basis, grouped by the different meter sizes for FY 2005, was used. This report is attached as Appendix C to this report. Monthly usage is reported in CCF Total annual billed metered water in million gallons per year was calculated to be 3,830.8 for The unbilled unmetered water, which is considered as authorized consumption, typically consists of water consumed in firefighting, flushing of mains and sewers, street cleaning etc. The quantity of unbilled unmetered water for the City of Tustin s water distribution system is 468 AF per year or million gallons. The units for all of the given or available data were converted into million gallons before entering into the AWWA spreadsheet software Estimation of Average Residential Bi-Monthly Bill for the City of Tustin The AWWA spreadsheet requires the average retail unit cost. Table 5-3 provides the information about the total volume of water consumed based on different meter sizes for FY Annual average residential water use per customer, which is calculated by dividing the average annual water consumption (Table 5-3) recorded by all of the residential water meters (A) by the total number of residential connections (Table 5-3), is 153,320 gallons, i.e. 205 CCF (One Hundred Cubic Feet = 748 gallons). Bi-monthly average residential water consumption per customer is 34 CCF. 30

44 Table 5-3: Total Annual Water Consumption for each Meter Size for FY
45 Based on the commodity rates per CCF and fixed charges for residential service for a bimonthly period for 5/8 X ¾ residential water meters (A) for the City of Tustin provided in Table 5-4, the average bi-monthly bill for a single residential meter was calculated to be $ Based on the average bi-monthly water use for a residential meter, the customer retail unit cost per 1000 Gallons is $ Table 5-4: Commodity Rates and Fixed Charges for the City of Tustin for FY
46 5.6.2 Cost of Water In order to determine the cost-effectiveness of the Best Management Practices to be applied to reduce Non-revenue water in a distribution system, it is important to know the current cost of water, and, more importantly, the current production unit cost of supply. The current production unit cost of supply of water is calculated as: Total Amount Spent on Production of Total number of Units Water The Financial Information for the City of Tustin for FY 2005 is given in Table 5-5. The total cost of production of water calculated from Table 5-5 is $ 5,326,473 (Expense categories: Source of Supply, Pumping, and Treatment). Total volume of water supplied to the water distribution system including the imported water is 4,303.2 million gallons. Thus, the current unit cost of producing 1 million gallons of water supply is calculated to be $ 1, At the time of reporting, the total water supplied for was thought to be the treated water supplied to the distribution system and, thus, the retail water customers. Based on a more-thorough review of data sources provided by the City, the 4,303.2 million gallons may include the volume of water produced through desalters. Excluding this water would reduce the total water supplied to the distribution system and reduce the calculated water loss. Follow up audits for a subsequent fiscal year should confirm or dispute this potential conclusion
47 Table 5-5: Financial Information for the City of Tustin for FY
48 5.6.3 Review of the Audit Results Malcolm Pirnie staff has utilized water supply and usage data provided by the City of Tustin and MWDOC for FY 2005 to populate the reporting sheet of the AWWA WLCC Water Audit Spreadsheet Software. The resultant calculations are indicated in Table 5-6. Based on the data entered into the spreadsheet, the software calculates and generates output in the form of performance indicators, which are shown in the lower portion of Table 5-6. The AWWA calculations of Performance Indicators include leakage allowances based upon the total length of water mains, number of customer service connections, length of service connection piping between the curb stop or property line and the customer meter, and average system pressure applied in all pressure zones. All of these system parameters are key factors in estimating the rate of real losses (active leakage) in the water distribution system. Meter accuracy tests were performed at three flows (low flow, medium flow, and high flow) on ten residential water meters, which were pulled from the field by City of Tustin staff. Based on the accuracy results, calculated water loss incurred by the City of Tustin due to under registration of residential water meters (customer metering inaccuracy) was 72 million gallons for FY indicated in Table 5-6 as apparent losses due to customer metering inaccuracies, based on extrapolation of residential meter accuracy tests. The details of these accuracy tests, results, and analysis are provided in Section 6. Consistent with the software, the total non-revenue water for City of Tustin for Fiscal Year 2005 is calculated to be million gallons (water losses: unbilled plus unmetered water use), which is 11% of the total water supplied to the City of Tustin s water distribution system


49 Table 5-6: Data reporting interface of AWWA water audit spreadsheet for the City of Tustin
.")
50 The total annual value of real losses to the City of Tustin water distribution system for FY 2005 is $ 306,842, and the total annual value of apparent losses is $ 133,939. One of the performance indicators calculated in the software for the distribution system is the Infrastructure Leakage Index (ILI). Infrastructure Leakage Index is defined as a ratio of the Current Annual Real Losses to the Unavoidable Annual Real Losses (UARL). For the City of Tustin, the value of ILI is calculated in the spreadsheet software to be 3.73, which falls in the middle target range specified by AWWA/IWA guidance, given in Table 5-8. If water resources for the City become more costly or scarce, it may be costeffective for the City to reduce its ILI to below 3.0 through further reduction of its real water losses. Table 5-7: Water balance Calculations based on the information provided in reporting spreadsheet
51 Table 5-8: Guidance on Target Infrastructure Leakage Index (ILI) TARGET RANGE ILI WATER RESOURCES CONSIDERATIONS OPERATIONAL CONSIDERATIONS FINANCIAL CONSIDERATIONS Available resources are very limited and/or environmentally unsound to develop It is believed that sufficient water resources are available for long term needs, using good leakage control Water resources are plentiful, reliable and easily extracted Leakage above this level requires expansion to existing infrastructure and/or new water resources Existing water supply infrastructure capability is sufficient to meet long-term demand, with good leakage control Superior reliability, capacity and integrity of infrastructure Water resources are costly to develop or purchase; ability to raise revenue(rates) is limited Water Resources can be developed or purchased at reasonable expense; rates can be increased Low water purchase cost; customer affordability is not the issue
52 6.0 Retail Member Agency Field Data Collection 6.1 Introduction Task 6 of Malcolm Pirnie`s contract Scope of Work, Retail Member Agency Field Data Collection, was accomplished through the combined efforts of the Mesa Consolidated Water District, MWDOC, City of Tustin staff, and Malcolm Pirnie, Inc. The objectives of this task were as follows: To obtain residential demand information for ten representative single-family homes for analysis. To perform accuracy tests on ten water meters pulled from the field. Incorporate the results of these field data collection activities into the AWWA water audit software. This Task was conducted simultaneously with Task Residential Water Use Distribution The Mesa Consolidated Water District installed ten Meter Master Data Loggers on ten typical single-family residential homes within the City of Tustin to study the water consumption pattern for a seven-day period. The major intent of conducting this field data collection activity was to obtain the percentage of the total weekly water use for each residential meter (5/8 by 3/4 inch) that is in the low flow range ( gpm), medium flow range ( gpm), and high flow range (greater than 2.0 gpm). Residences were selected on the basis of having relatively new water meters and representative of typical water service in the City of Tustin. Residential flow reports were generated for these homes based on the flow data recorded by the Meter Master Data Loggers. For analyzing the data, flow reports consisting of Cumulative Volume,
53 Maximum Volume, Maximum Flow Rate, Average Flow Rate, and Minimum Flow Rate were provided to the Consultant Team. The results of flow reports are included as Appendix D to this Report. Results for one of the ten meters were discarded, since this meter size was larger than 5/8 by 3/4-inch. Table 6-1 provides the percentage of individual single-family residential cumulative flow volume passing through the 5/8 by 3/4-inch meters at low, medium and high flows. The graphical representation of this data has been provided in Figure 6-1. Table 6-1: Percentage of Residential Cumulative flow Volume at Low, Medium, and High Flows Meter Location City of Tustin Percentage of Cumulative Residential Flow Measured for one week Percentage of Flow Volume Total Meter Size Low Flow Med Flow High Flow Percentage gpm gpm gpm of Flow 1 Model % 7.51% 87.67% % 2 Model % 11.72% 83.68% % 3 Model % 46.22% 39.49% % 4 Model % 8.99% 86.68% % 5 Model % 5.59% 90.67% % 6 Model % 10.95% 86.81% % 7 Model % 4.48% 87.81% % 8 Model % 9.38% 86.53% % 9 Model % 2.75% 96.41% % Average 5.19% 11.95% 82.86% % Table 6-1 shows that, on an average, 5.19 percent of the total weekly measured flow was used at the low flow range, percent was used at the medium flow range, and percent was used at the high flow range. Based on these water usage figures, it can be concluded that about 95 percent of the consumption is at the medium and high flow rates, for which small residential water meters typically have a higher accuracy
54 Percentage of Weekly Residential Flow for 9 Locations Percentage of Flow Volume % 90.00% 80.00% 70.00% 60.00% 50.00% 40.00% 30.00% 20.00% 10.00% 0.00% Low Flow Med Flow High Flow Meter Locations Figure 6-1: Graphical presentation of Percentage of Residential Flow Volume at Low, Medium, and High Flows 6.3 Meter Accuracy Tests Ten single-family residential water meters were pulled from the field by City of Tustin staff, upon which the accuracy tests were performed by Measurement Control Systems. These residential water meters were selected from the active Tustin water distribution system on the basis of total in-service cumulative flow of 1-3 million gallons. Typically, this could mean a service of 6 to 20 years depending upon per service water use. The results of accuracy tests at low, medium, and high flow ranges for the ten 5/8 by ¾- inch domestic residential water meters were then provided to the Consultant Team for analysis. The results of accuracy tests conducted by Measurement Control Systems are provided in Appendix E at the end of this Report. Table 6-2 shows the calculated meter accuracies expressed as a percentage at three different flow rates

55 Table 6-2: Results of Meter Accuracy Tests at Three Different Flow Rates Data plots of the meter accuracy versus cumulative flow for each of the low, medium, and high flow test rates are indicated in Figure 6-2, Figure 6-3, and Figure 6-4, respectively. On each graph, a trend line indicating the best linear data, fit calculated by Microsoft Excel is also indicated. The slope of the trend line in each figure clearly indicates that the meter accuracy for a specific flow range decreases with an increase in the cumulative flow volume measured by the meters
56 Trendline for Meter Accuracy Versus Cumulative Flow for Low Flow tests (5/8" by 3/4" Positive Displacement Residential Water meter) 100% 95% Meter Accuracy 90% 85% 80% 75% 70% 65% Cumulative Flow (Gallons) Figure 6-2: Meter Accuracy versus Cumulative Flow for Low Flow tests (5/8" by 3/4" Positive Displacement Residential Water Meters)
57 Trend line for Meter Accuracy Versus Cumulative Flow for Medium Flow tests (5/8" by 3/4" Positive Displacement Residential Water meter) 100% 95% Meter Accuracy 90% 85% 80% 75% 70% 65% Cumulative Flow (Gallons) Figure 6-3: Meter Accuracy versus Cumulative Flow for Medium Flow tests (5/8" by 3/4" Positive Displacement Residential Water Meters) Trendline for Meter Accuracy Versus Cumulative Flow for High Flow tests (5/8" by 3/4" Positive Displacement Residential Water meter) 100% 95% Meter Accuracy 90% 85% 80% 75% 70% 65% Cumulative Flow (Gallons) Figure 6-4: Meter Accuracy versus Cumulative Flow for High Flow tests (5/8" by 3/4" Positive Displacement Residential Water Meters)
58 Average age of the water meters in the Tustin water distribution system is stated as ten years in the questionnaire. The volume of water passing through a meter and its corresponding service life are key determinants of its accuracy. Using the average residential water usage, the total average residential amount of water consumed in ten years per meter was calculated to be 1,533,201 gallons. The average accuracies at this cumulative flow volume were calculated from the trend lines for the low, medium, and high flow test ranges as shown in Figure 6-5. The average annual weighted average for the percentage of time the average residential customer uses water at low, medium and high flow rates was used to calculate the average Tustin-specific percentage of underregistration of the water meters. In this case, the weighted average of the accuracy of residential water meters is percent or 1.88 percent, under-registration. This percentage of meter under-registration is low for a typical water utility. These results were used to estimate Tustin s apparent water losses due to meter inaccuracy in the AWWA Water Audit Spreadsheet discussed in the previous chapter. Based on this limited data set, this study concludes that the majority of Tustin s water losses are coming from water system leakage, defined as Real Losses in the water audit software
59 Meter Accuracy versus Cumulative Flow-Summary of Data Trend Lines 103% 101% Meter Accuracy 99% 97% 95% 93% 91% 89% Linear (Linear (Low Flow)) Linear (Linear (Medium Flow)) Linear (Linear (High Flow)) 87% Cumulative Flow (Gallons) Figure 6-5: Meter Accuracy versus Cumulative Flow-Summary of Data Trend Lines
60 7.0 Findings, Conclusions, and Recommendations This section of the MWDOC Water Loss Management Program Assessment Report presents the findings, conclusions, and recommendations of the study. The findings of the jointly funded study are based on the limited available project funding provided by the U.S. Bureau of Reclamation Southern California Area Office under its Water Conservation Field Services Grants program and MWDOC ($50,000), results of a member-agency utility questionnaire, and a demonstration water audit for the City of Tustin. The demonstration water audit used public domain software available from the American Water Works Association and developed by their Water Loss Control Committee. 7.1 Study Findings The following are major findings of the MWDOC Water Loss Management Program Assessment Project: ten of 29 MWDOC retail member agencies responded to a 94-question survey prepared in Microsoft Excel spreadsheet format. it took about six weeks for 35 percent of retail agencies to respond to the questionnaire. utility population for the ten reporting utilities varies from 3,000 to 200,000. service connections for reporting utilities varies from 1,200 to 53,000. reported water loss varies from 2 percent of supply to almost 20 percent. in many cases, questionnaire information was not consistent with data reported in MWDOC s Orange County Water Rates Survey. percent of MWDOC supply varied from 16 to
61 average static pressure in utility distribution systems varied from 60 to 100 psi. residential meter replacement varied from 10 to 20 years. four of the ten reporting agencies conduct annual water audits. reported sources of water loss were leaks, flushing, reservoirs, and water meters. half of the reporting agencies use some method of active leak detection. Follow-up telephone interviews took from a few minutes to an hour, depending on knowledge and interest of staff. Many contacted felt their water loss monitoring programs were excellent and effective. the City of Tustin was very interested in the details of the project and recognized the value in performing the demonstration audit. Based on Tustin s interest and reported water loss, they were selected for audit. the MWDOC 2005 Urban Water Management Plan has a goal of identifying water use efficiency measures that can be accomplished in a cost-effective manner. this report responds to Best Management Practice (BMP) No. 3 in the CUWCC Memorandum of Understanding relating to water conservation. the unaccounted-for-water average for Orange County water agencies was 5.1 percent as reported in the MWDOC Orange County Water Agencies Water Rates, Water System Operations, and Financial Information report for the Metropolitan MWD-Main model predicts water losses at 7.4 percent of supply. the Tustin 2005 Urban Water Management Plan forecasts Tustin water loss at 11.3 percent of supply or 1,330 acre-feet per year
62 the AWWA/IWA water audit software identifies two water loss categories as real water losses and apparent water losses. there are four different methods of managing each type of real and apparent water losses. the AWWA/IWA water audit for Tustin for fiscal year indicated the following: -total water supplied was 4,303.2 MG -non-revenue water was MG -water loss was 11.0 percent -annual cost of real losses = $306,842 -annual cost of apparent losses = $133,939 -Infrastructure Leakage Index = 3.73 field data collection for one week in September on sample residential water meters in Tustin indicated 5.19% of total use was at low flow, 11.95% at medium flow, and 82.86% at high flow. ten residential meter accuracy tests were performed by Measurement Control Systems on meters having in-service cumulative flow of 1-3 million gallons. AWWA recommends a minimum of 70 water meter accuracy tests to be statistically significant, but results more typical of a much larger database. average meter accuracy was 89.7% for low flow, 95.2% for medium flow, and 97.0% for high flow. the weighted meter accuracy for Tustin residential meters was percent, reflecting an average under-registration of 1.88 percent
63 7.2 Conclusions Based on the above primary findings, the following can be concluded from this study: the level of water loss in MWDOC retail water agencies varies significantly, and reported losses aren t consistent among report references. there is significant staff and consultant effort required to collect, organize, and format water supply and demand information for an AWWA/IWA water audit. Urban Water Management Plans are excellent sources of information about historical and projected water supplies and demands. the CUWCC BMP No. 3 on System Water Audit, Leak Detection, and Repair applies most to this report on MWDOC water loss management. MWDOC projected population and water demand growth requires continued focus on water conservation and water use efficiency. with existing and projected MWDOC member agency water losses at 40,000 acre-feet per year, there is substantial room for water-use efficiency by member agencies. the new AWWA/IWA water audit methodology and spreadsheet software provide an excellent tool for assessing a utility s water balance and potential value of water saved through loss management
64 Tustin s water audit showed that there is a potential for saving water and money by additional identifying and reducing real water losses through system leak detection, location, and repair. field data collection of residential time-of-day water use indicated only 5.2 percent at low flow. This result was surprisingly low to the Consultant Team. Meter accuracy testing for Tustin residential water meters indicated excellent service after 1-3 million gallons of cumulative flow. Plots of meter accuracy versus cumulative flow were consistent with results from other western U.S. utilities showing reduced accuracy at low flow with increased cumulative volume through the meter. 7.3 Recommendations Based on the foregoing findings and conclusions of this assessment of MWDOC s Water Loss Management Program, the following are recommendations for further consideration by MWDOC and its member retail water agencies: 1. MWDOC should enhance the accuracy of audit work for the City of Tustin by conducting additional field investigations on calibration and validity testing of water supply meters and on leak detection surveys. 2. Water audits in the AWWA/IWA spreadsheet software format should be prepared for additional MWDOC retail member agencies to characterize water loss issues throughout its service area
65 3. Additional grant applications to the U.S. Bureau of Reclamation and the California Department of Water Resources should be prepared and submitted in pursuit of follow-up funding of water audit work. 4. The City of Tustin Water Services Division should investigate the feasibility and cost-effectiveness of enhancing its pro-active leak detection activities and repair response time. 5. Results of this study should be shared with the CUWCC to advocate the extended application of the AWWA/IWA Water Audit methodology to other signatories to the MOU. 6. MWDOC retail member agencies and other California conservation-conscious water utilities should begin collecting and organizing the necessary water supply and customer demand information to conduct a standard annual water audit using AWWA/IWA methodology and to perform periodic updates. 7. Upon collection of multiple utility audits, a database should be developed to compare audit results, utility standard performance indicators, and water loss reduction methodologies and successes
66 APPENDIX A Completed Utility Questionnaires
67 Appendix A Brea.xls 4- Water Supply Auditing 4/3/ Water Supply Auditing Back to TOC Question Number Response (Please fill in the following cells) 53 Do you currently compile a potable water supply audit on a regular basis? (Yes No or No) 53a If Yes, at what frequency? (Monthly, Annually, Semi-Annually, Every five years, etc) 54 What is the approximate cost to purchase each AF of MWDOC water that is placed into the distribution system? ($/AF) 55 What is the approximate cost to collect, treat, and deliver each AF of other N/A surface water that is placed into the distribution system? ($/AF) 56 What is the approximate cost to produce each AF of potable groundwater that is N/A placed into the distribution system? ($/AF) 57 What is the approximate cost to produce each AF of colored groundwater that is N/A placed into the distribution system? ($/AF) 58 What is the approximate average residential rate charged to customers per CCF 1.80 of billed usage? ($/CCF) 59 What is the approximate average ICI rate charged to customers per CCF of billed 1.8 usage? ($) 60 Has your system experienced supply constraints for meeting peak demands No (withdrawal restrictions, system capacity limitations or other conditions, excluding drought) (Yes or No)? 61 Is the water input to the distribution system metered? (Yes or No) Yes 61a If Yes, how often are input meters tested (yrs)? Once a year 61b If Yes, list approximate composite input meter error for all meters (%): 5% 61c If Yes, what is the nature of the composite input meter error? wear Question Number Please provide all the following water supply audit data for your most recent year. Calculated Response (Please fill in the following cells) 62 Water volume input to distribution (produced and purchased) ( AF) 11, Billed authorized consumption volume (CCF) 10, Unbilled authorized consumption volume (internal uses: flushing, cleaning, irrigation, etc)( CCF) Total authorized consumption volume (sum of 63 and 64) (CCF) 10, Water losses (water volume input to distribution in question 62 minus total authorized consumption in question 65 converted to AF) (AF) 67 List approximate percentage of water losses believed to exist as apparent losses 4% (%) 68 Volume of apparent losses (water losses in question 66 multiplied by the percentage of apparent losses in question 67) (AF) List what you believe to be the greatest source of apparent losses. Leaks 70 List approximate percentage of water losses believed to exist as real losses (%) 4% 71 Volume of real losses (water losses in question 66 multiplied by the percentage of real losses in question 70) (AF) List what you believe to be the greatest source of real losses. Leaks 73 Calculated water volume input to distribution (sum of total authorized consumption in question 65 converted to AF, and water losses in question 66) 0 11,076
68 Appendix A East Orange.xls 2- Pipe Mat., Pres., Modeling 4/3/ Pipe Materials, Delivery Pressures, and Modeling Back to TOC Please enter the length in miles of each pipe material type. If you do not keep an inventory of pipe materials, please estimate this number. Question Number Pipe Material Type Percent in Place Miles* (Calculated) 27 Asbestos Cement 50% Cast Iron (Unlined) 0% 29 Cast Iron (Cement-Mortar Lined) 0% 30 Concrete Pressure 0% 31 Ductile Iron (Unlined) 12% Ductile Iron (Cement Mortar Lined) 0% 33 Polyethylene 0% 34 Polyvinyl Chloride (PVC) 15% Steel 22% 5.2 Description of "Other" 36 Other 1 0% 37 Other 2 0% 38 Other 3 0% Total (Calculated ) 23.4 Question Response ( Please fill in the following cells) Number 39 Average static water pressure (PSI) Low static water pressure (PSI) High static water pressure (PSI) Please list software used for water distribution BoyleNet system modeling 43 When was your water distribution system model 1985 last updated? (approximate date) 44 What planning horizon was used in your water 30 distribution system model (20 yrs, 50 yrs, etc.)? (yrs) 45 Does your software for water distribution system modeling interface with a GIS? Yes or No No 46 Does your billing system interface with a GIS? Yes or No No
69 Appendix A Fountain Valley.xls 5- Leakage Management 4/3/ Leakage Management Back to TOC Question Number 74 Number of main breaks per year. 3 to 5 75 Annual expenditures on break repairs ($/yr). N/A 76 Average hours out-of-service per break (time customers are out of water service) (hrs). 4 to 12 Response (Please fill in the following cells ) 77 Annual number of reported customer service line leaks - water main to curb stop box Annual number of reported customer service line leaks - curb stop box to customer 39 meter (or premises if no meter). 79 Annual number of leak repairs on customer service lines - water main to curb stop box Annual number of leak repairs on customer service lines - curb stop box to customer 0 customer's responsibility meter (or premises if no meter). 81 Annual number of leak repairs on water mains. 3 to 5 82 Annual number of leak repairs on fire hydrants, valves and other appurtenances Annual expenditures on all leak repairs ($/yr). $67, Does your utility have a water loss reduction target? (Yes or No) no 84a If Yes, please describe. 85 Does any state or other agency require you to address water losses and loss reduction? (Yes or No) YES 85a If Yes, please describe. 86 Annual expenditure for all other leakage management activities ($/yr). See NOTE below for details. None NOTE for Question 86: The annual expenditure for all leakage management activities EXCEPT for repair (question 83). These costs will include 1 Sonic leak detection (including leak noise loggers) 2 Leak correlator pinpointing 3 District metered area nightflow measurements 4 Installation and operation of pressure control equipment 5 Other techniques to measure or control leakage Please answer Yes to all leak detection and location survey methods used regularly, and No to methods not used. Question Yes or No Number 87 Passive Only (Only locate/repair reported visible leaks) Yes 88 Listening Sticks no 89 Ground Microphones no 90 Noise Loggers no 91 District Metered Areas no 92 Leak Noise Correlation no 93 Is water pressure regulated at various times during the day strictly as a means of leakage reduction? no Question Number Response (Please fill in the following cells ) 94 How often are the leak detection methods asked in questions 87 to 93 used? 0
70 Appendix A HuntingtonBeach.xls 5- Leakage Management 4/3/ Leakage Management Back to TOC Question Number Response (Please fill in the following cells ) 74 Number of main breaks per year. 25 (Average) 75 Annual expenditures on break repairs ($/yr). $85K - $100K 76 Average hours out-of-service per break (time customers are out of water service) (hrs). 4-6 Hours 77 Annual number of reported customer service line leaks - water main to curb stop box Annual number of reported customer service line leaks - curb stop box to customer meter (or premises if no meter). N/A 79 Annual number of leak repairs on customer service lines - water main to curb stop box Annual number of leak repairs on customer service lines - curb stop box to customer N/A meter (or premises if no meter). 81 Annual number of leak repairs on water mains. 25 (Average) 82 Annual number of leak repairs on fire hydrants, valves and other appurtenances. N/A 83 Annual expenditures on all leak repairs ($/yr). $228, Does your utility have a water loss reduction target? (Yes or No) YES 84a If Yes, please describe. under 10% based on AW 85 Does any state or other agency require you to address water losses and loss reduction? (Yes or No) NO 85a If Yes, please describe. 86 Annual expenditure for all other leakage management activities ($/yr). See NOTE below for details. N/A NOTE for Question 86: The annual expenditure for all leakage management activities EXCEPT for repair (question 83). These costs will include 1 Sonic leak detection (including leak noise loggers) 2 Leak correlator pinpointing 3 District metered area nightflow measurements 4 Installation and operation of pressure control equipment 5 Other techniques to measure or control leakage Please answer Yes to all leak detection and location survey methods used regularly, and No to methods not used. Question Yes or No Number 87 Passive Only (Only locate/repair reported visible leaks) Yes 88 Listening Sticks Yes 89 Ground Microphones Yes 90 Noise Loggers No 91 District Metered Areas No 92 Leak Noise Correlation No 93 Is water pressure regulated at various times during the day strictly as a means of leakage reduction? No Question Number Response (Please fill in the following cells ) 94 How often are the leak detection methods asked in questions 87 to 93 used? As necessary
71 Appendix A HuntingtonBeach.xls 5- Leakage Management 4/3/2007 WWA standards
72 Appendix A Laguna Beach Co W D.xls 5- Leakage Management 4/3/ Leakage Management Back to TOC Question Number Response (Please fill in the following cells ) 74 Number of main breaks per year Annual expenditures on break rep airs ( $/yr). x 76 Average hours out-of-service per break (time customers are out of water service) (hrs) Annual number of reported customer service line leaks - water main to curb stop box Annual number of reported customer service line leaks - curb stop box to customer 5 meter (or premises if no meter). 79 Annual number of leak repairs on customer service lines - water main to curb stop box Annual number of leak repairs on customer service lines - curb stop box to customer 5 meter (or premises if no meter). 81 Annual number of leak repairs on water mains Annual number of leak repairs on fire hydrants, valves and other appurtenances Annual expenditures on all leak rep airs ( $/yr). x 84 Does your utilit y have a water loss reduction targ et? ( Yes or No) No 84a If Yes, please describe. x 85 Does any state or other agency require you to address water losses and loss reduction? (Yes or No) No 85a If Yes, please describe. x 86 Annual expenditure for all other leakage management activities ($/yr). See NOTE below for details. $500,000 Pipeline Repl. NOTE for Question 86: The annual expenditure for all leakage management activities EXCEPT for repair (question 83). These costs will include 1 Sonic leak detection (including leak noise loggers) 2 Leak correlator pinpointing 3 District metered area nightflow measurements 4 Installation and operation of pressure control equipment 5 Other techniques to measure or control leakage Please answer Yes to all leak detection and location survey methods used regularly, and No to methods not used. Question Yes or No Number 87 Passive Only (Only locate/repair reported visible leaks) Yes 88 Listening Sticks Yes 89 Ground Microphones No 90 Noise Loggers No 91 District Metered Areas No 92 Leak Noise Correlation Yes 93 Is water pressure regulated at various times during the day strictly as a means of leakage reduction? No Question Number Response (Please fill in the following cells ) 94 How often are the leak detection methods asked in questions 87 to 93 used? 10 Times/year
73 Appendix A Moulton Niguel.xls 4- Water Supply Auditing 4/3/ Water Supply Auditing Back to TOC Question Number Response (Please fill in the following cells) 53 Do you currently compile a potable water supply audit on a regular basis? (Yes Yes or No) 53a If Yes, at what frequency? (Monthly, Annually, Semi-Annually, Every five years, etc) Annually 54 What is the approximate cost to purchase each AF of MWDOC water that is placed into the distribution system? ($/AF) 55 What is the approximate cost to collect, treat, and deliver each AF of other N/A surface water that is placed into the distribution system? ($/AF) 56 What is the approximate cost to produce each AF of potable groundwater that is N/A placed into the distribution system? ($/AF) 57 What is the approximate cost to produce each AF of colored groundwater that is N/A placed into the distribution system? ($/AF) 58 What is the approximate average residential rate charged to customers per CCF 91 of billed usage? ($/CCF) 59 What is the approximate average ICI rate charged to customers per CCF of billed N/A usage? ($) 60 Has your system experienced supply constraints for meeting peak demands No (withdrawal restrictions, system capacity limitations or other conditions, excluding drought) (Yes or No)? 61 Is the water input to the distribution system metered? (Yes or No) Yes 61a If Yes, how often are input meters tested (yrs)? N/A 61b If Yes, list approximate composite input meter error for all meters (%): N/A 61c If Yes, what is the nature of the composite input meter error? N/A Question Number Please provide all the following water supply audit data for your most recent year. Calculated Response (Please fill in the following cells) 62 Water volume input to distribution (produced and purchased) ( AF) 39, Billed authorized consumption volume (CCF) 36, Unbilled authorized consumption volume ( internal uses: flushing, cleaning, irrigation, etc) ( CCF) 1, Total authorized consumption volume (sum of 63 and 64) (CCF) 38, Water losses (water volume input to distribution in question 62 minus total 1670 authorized consumption in question 65 converted to AF) (AF) 67 List approximate percentage of water losses believed to exist as apparent losses 4.2% (%) 68 Volume of apparent losses (water losses in question 66 multiplied by the percentage of apparent losses in question 67) (AF) List what you believe to be the greatest source of apparent losses. Meters 70 List approximate percentage of water losses believed to exist as real losses (%) 4.5% 71 Volume of real losses (water losses in question 66 multiplied by the percentage of real losses in question 70) (AF) List what you believe to be the greatest source of real losses. Line Breaks 73 Calculated water volume input to distribution (sum of total authorized consumption in question 65 converted to AF, and water losses in question 66) 0 39,884
74 Appendix A Newport Beach.xls 1- Utility Information 4/3/ Utility Information Back to TOC Question Response (Please fill in the following cells) Number 1 Water Agency Name City of Newport Beach 2 Address 3300 Newport Boulevard 3 City Newport Beach 4 State California 5 Zip Code Country USA 7 General Phone Number (949) Water Agency Homepage 9 Ownership 10 Manager/Director: Last Name Bludau 10a First Name Homer 10b Phone Number (949) c Address 11 Water Use Efficiency Point of Contact: Last Name Moritz 11a First Name Teresa 11b Phone Number (949) c Address tmoritz@city.newport-beach.ca.us 12 Utility Operations Point of Contact: Last Name Deutsch 12a First Name Tim 12b Phone Number (949) c Address 13 Number of Supply Sources 14 Population Served 76, Service Area in Square Miles (mi 2 ) 16 Total Number of Connections/ Customers 26, Total Number of Retail Connections 18 Average Annual Water Volume Delivered to Customers (AF/yr) 17,075 18a Supply Capacity (AF/yr) 18b Percent Imported (MWDOC) Water Supply (%) 34 18c Percent Surface Water Supply (%) 18d Percent Potable Groundwater Supply (%) 66 18e Percent Colored Groundwater Supply (%) 19 Most Recent Water Department ISO Rating 20 Most Recent Fire Department ISO Rating 21 Number of Fire Hydrants 22 Service Area Elevation Range (ft) 23 Total Number of Pressure Zones in Service Area 24 Approximate Elevation Range in each Pressure Zone (ft) 25 Average Number of Customer Connections per Pressure Zone 26 Average Static Pressure Delivered to Pressure Zones (PSI)
75 Appendix A San Clemente.xls 1- Utility Information 4/3/ Utility Information Back to TOC Question Response (Please fill in the following cells) Number 1 Water Agency Name City of San Clemente 2 Address 380 Ave Pico, Building N 3 City San Clemente 4 State California 5 Zip Code Country USA 7 General Phone Number (949) Water Agency Homepage 9 Ownership (public or private) Public 10 Manager/Director: Last Name Lund 10a First Name David 10b Phone Number (949) c Address Lundd@san-clemente.org 11 Water Use Efficiency Point of Contact: Last Name Clatfelter 11a First Name Elizabeth 11b Phone Number (949) c Address clatfeltere@san-clemente.org 12 Utility Operations Point of Contact: Last Name Howard 12a First Name A.J. 12b Phone Number (949) c Address howarda@san-clemente.org 13 Number of Supply Sources 2 14 Population Served 43, Service Area in Square Miles (mi 2 ) Total Number of Connections/ Customers 17, Total Number of Retail Connections 845 (commercial accounts) 18 Average Annual Water Volume Delivered to Customers (AF/yr) 11,341 18a Supply Capacity (AF/yr) 17,222 18b Percent Imported (MWDOC) Water Supply (%) 94 18c Percent Surface Water Supply (%) 0 18d Percent Potable Groundwater Supply (%) 5 18e Percent Colored Groundwater Supply (%) 0 19 Most Recent Water Department ISO Rating X 20 Most Recent Fire Department ISO Rating X 21 Number of Fire Hydrants Service Area Elevation Range (ft) 10 to Total Number of Pressure Zones in Service Area 14 w/average 2 subzones in each zone 24 Approximate Elevation Range in each Pressure Zone (ft) Average Number of Customer Connections per Pressure Zone Average Static Pressure Delivered to Pressure Zones (PSI) 70
76 Appendix A Tustin.xls 4- Water Supply Auditing 4/3/ Water Supply Auditing Back to TOC Question Number Response (Please fill in the following cells) 53 Do you currently compile a potable water supply audit on a regular basis? (Yes No or No) 53a If Yes, at what frequency? (Monthly, Annually, Semi-Annually, Every five years, etc) X 54 What is the approximate cost to purchase each AF of MWDOC water that is placed into the distribution system? ($/AF) 55 What is the approximate cost to collect, treat, and deliver each AF of other X surface water that is placed into the distribution system? ($/AF) 56 What is the approximate cost to produce each AF of potable groundwater that is 305 placed into the distribution system? ($/AF) 57 What is the approximate cost to produce each AF of colored groundwater that is X placed into the distribution system? ($/AF) 58 What is the approximate average residential rate charged to customers per CCF 61 of billed usage? ($/CCF) 59 What is the approximate average ICI rate charged to customers per CCF of billed X usage? ($) 60 Has your system experienced supply constraints for meeting peak demands No (withdrawal restrictions, system capacity limitations or other conditions, excluding drought) (Yes or No)? 61 Is the water input to the distribution system metered? (Yes or No) yes 61a If Yes, how often are input meters tested (yrs)? X 61b If Yes, list approximate composite input meter error for all meters (%): X 61c If Yes, what is the nature of the composite input meter error? X Question Number Please provide all the following water supply audit data for your most recent year. Calculated Response (Please fill in the following cells) 62 Water volume input to distribution (produced and purchased) ( AF) Billed authorized consumption volume (CCF) 5,898, Unbilled authorized consumption volume (internal uses: flushing, cleaning, irrigation, etc) ( CCF) 196, Total authorized consumption volume (sum of 63 and 64) (CCF) ,094, Water losses (water volume input to distribution in question 62 minus total authorized consumption in question 65 converted to AF) (AF) 67 List approximate percentage of water losses believed to exist as apparent losses 4 (%) 68 Volume of apparent losses (water losses in question 66 multiplied by the percentage of apparent losses in question 67) (AF) List what you believe to be the greatest source of apparent losses. theft/bad metrs 70 List approximate percentage of water losses believed to exist as real losses (%) 5 71 Volume of real losses (water losses in question 66 multiplied by the percentage of real losses in question 70) (AF) List what you believe to be the greatest source of real losses. leaks/brine 73 Calculated water volume input to distribution (sum of total authorized consumption in question 65 converted to AF, and water losses in question 66) 17437
77 Appendix A Westminster.xls 5- Leakage Management 4/3/ Leakage Management Back to TOC Question Number Response (Please fill in the following cells ) 74 Number of main breaks per year Annual expenditures on break repairs ($/yr) Average hours out-of-service per break (time customers are out of water service) (hrs) Annual number of reported customer service line leaks - water main to curb stop box Annual number of reported customer service line leaks - curb stop box to customer 99 meter (or premises if no meter). 79 Annual number of leak repairs on customer service lines - water main to curb stop box Annual number of leak repairs on customer service lines - curb stop box to customer 99 meter (or premises if no meter). 81 Annual number of leak repairs on water mains Annual number of leak repairs on fire hydrants, valves and other appurtenances Annual expenditures on all leak repairs ($/yr) Does your utility have a water loss reduction target? (Yes or No) No 84a If Yes, please describe. 85 Does any state or other agency require you to address water losses and loss No reduction? (Yes or No) 85a If Yes, please describe. 86 Annual expenditure for all other leakage management activities ($/yr). See NOTE NA below for details. NOTE for Question 86: The annual expenditure for all leakage management activities EXCEPT for repair (question 83). These costs will include 1 Sonic leak detection (including leak noise loggers) 2 Leak correlator pinpointing 3 District metered area nightflow measurements 4 Installation and operation of pressure control equipment 5 Other techniques to measure or control leakage Please answer Yes to all leak detection and location survey methods used regularly, and No to methods not used. Question Yes or No Number 87 Passive Only (Only locate/repair reported visible leaks) Yes 88 Listening Sticks no 89 Ground Microphones no 90 Noise Loggers no 91 District Metered Areas no 92 Leak Noise Correlation no Is water pressure regulated at various times during the day strictly as a means of no 93 leakage reduction? Question Number Response (Please fill in the following cells ) 94 How often are the leak detection methods asked in questions 87 to 93 used? Daily
78 APPENDIX B AWWA/IWA Spreadsheet Water Audit Software
79 AWWA WLCC Water Audit Software: Reporting Worksheet Back to Instructions? Click to access definition Water Audit Report for: Reporting Year: Please enter data in the white cells below. Where possible, metered values should be used; if metered values are unavailable please estimate a value. Indicate this by selecting a choice from the gray box to the left, where M = measured (or accurately known value) and E = estimated. ALL VOLUMES TO BE ENTERED AS ANNUAL QUANTITIES WATER SUPPLIED Please choose reporting units from the instructions sheet Volume from own sources: Master meter error adjustment: Water Imported:??? under-registered Water Exported:?. WATER SUPPLIED: 0.0. AUTHORIZED CONSUMPTION. Billed metered: Billed unmetered: Unbilled metered: Unbilled unmetered:????. AUTHORIZED CONSUMPTION: WATER LOSSES (Water Supplied - Authorized Consumption). 0.0 Apparent Losses. Unauthorized consumption: Customer metering inaccuracies: Data handling errors:??? Apparent Losses:. 0.0 Real Losses. Real Losses (Water Losses - Apparent Losses):. 0.0 WATER LOSSES: NON_REVENUE WATER. NON-REVENUE WATER: SYSTEM DATA. Length of mains: Number of active AND inactive service connections:?? Connection density:. Average length of private pipe:? 0.0. Average operating pressure:? (pipe length between curbstop and customer meter or property boundary). COST DATA. Total annual cost of operating water system:? Customer retail unit cost (applied to apparent losses):? Variable production cost (applied to real losses):? $/Year $/1000 gallons (US) DATA REVIEW - Please review the following information and make changes above if necessary: - Input values should be indicated as either measured or estimated. You have entered: 0 as measured values 0 as estimated values 18 without specifying measured or estimated - It is important to accurately measure the master meter - you have entered the measurement type as: unspecified #N/A PERFORMANCE INDICATORS Financial Indicators Non-revenue water as percent by volume: Non-revenue water as percent by cost: Annual cost of Apparent losses: Annual cost of Real Losses: Operational Efficiency Indicators Apparent losses per service connection per day: #N/A Real losses per service connection per day*: Real losses per length of main per day*: Real losses per service connection per day per meter (head) pressure:? Unavoidable Annual Real Losses (UARL):? Infrastructure Leakage Index (ILI) [Real Losses/UARL]: * only the most applicable of these two indicators will be calculated AWWA Water Loss Control Committee Reporting Worksheet 1
80 APPENDIX C Water Meter Consumption Report For the City of Tustin
81
82
83
84
85
86
87
88
89
90
91
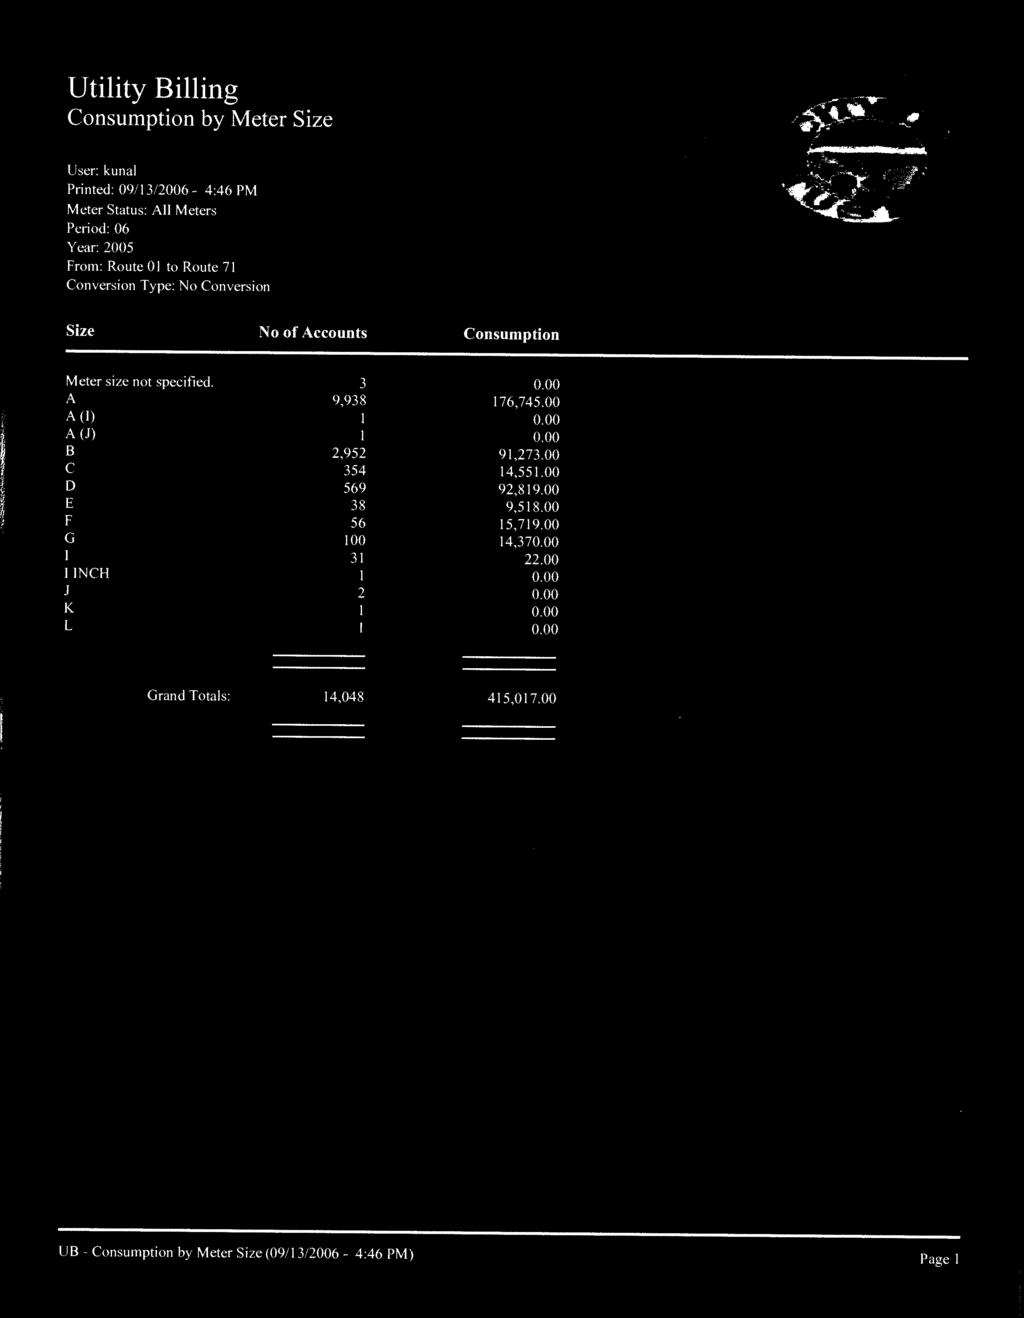
92
93 APPENDIX D Flow Reports for the City of Tustin
94
95
96
97
98
99
100
101
102
103
104
105
106
107
108
109
110
111
112
113
114
115
116
117
118
119
120
121
122
123
124
125
126
127
128
129
130
131
132
133
134
135
136
137
138
139
140
141
142
143
144
145
146
147
148
149
150
151
152
153
154
155 APPENDIX E Accuracy Test Results for the City of Tustin
156
157
158
159
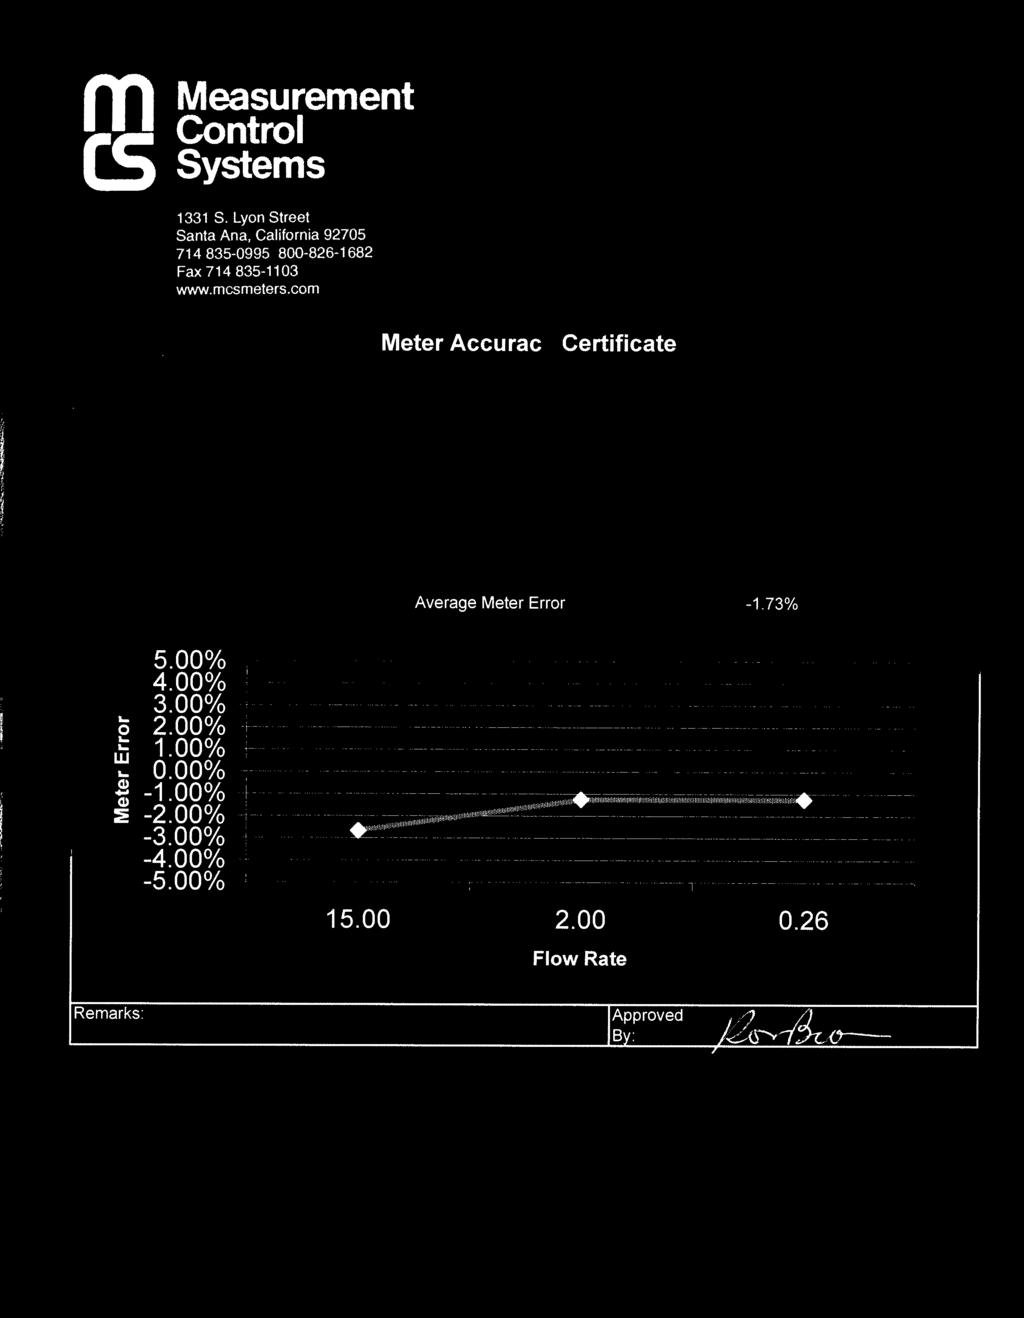
160
161
162
163
164
165

166 Malcolm Pirnie, Inc River Plaza Drive Suite 164 Sacramento, CA T:
Notice of Public Hearing. Notice of Public Hearing
 2015 URBAN WATER MANAGEMENT PLAN Table 8-2: Notification to Cities and Counties Retail: Notification to Cities and Counties City Name 60 Day Notice Notice of Public Hearing Dana Point Mission Viejo County
URBAN WATER MANAGEMENT PLAN
 2015 URBAN WATER MANAGEMENT PLAN FINAL DRAFT APRIL 2016 2015 URBAN WATER MANAGEMENT PLAN City of Brea FINAL DRAFT [Signature 1 Name] [Title] Prepared for: Ron Krause Project Manager City of Brea 1 Civic
WATER USES PROJECTED WATER USES THROUGH Table 4 2: 2015 Water Customers
 4.2.3 2015 WATER USES As of December 2015, the City serves approximately 53,193 water customers. Of those customers, 89% serve residential land uses while approximately 5% serve commercial land uses. The
Analysis of Calendar Year 2016 Water Audit Data from Public Water Supply Systems in the Delaware River Basin DELAWARE RIVER BASIN COMMISSION
 Analysis of Calendar Year 2016 Water Audit Data from Public Water Supply Systems in the Delaware River Basin DELAWARE RIVER BASIN COMMISSION February 2018 Acknowledgements This report was prepared by the
Illinois Water Audit and Loss Control Training Workshop
 Illinois Water Audit and Loss Control Training Workshop Fall 2014 IWA/AWWA Standard Water Balance Own Sources Water Imported Total System Input ( allow for known errors ) Water Exported Water Supplied
URBAN WATER MANAGEMENT PLAN
 2015 URBAN WATER MANAGEMENT PLAN FINAL May 2016 2015 URBAN WATER MANAGEMENT PLAN 2015 URBAN WATER MANAGEMENT PLAN City of Buena Park FINAL Prepared for: Francisco Gutierrez Associate Engineer City of Buena
URBAN WATER MANAGEMENT PLAN
 2015 URBAN WATER MANAGEMENT PLAN FINAL JUNE 2016, 2015 URBAN WATER MANAGEMENT PLAN 2015 URBAN WATER MANAGEMENT PLAN City of Santa Ana FINAL Prepared for: City of Santa Ana Public Works Agency Water Resources
Water Loss. Water Research Foundation How to use the Free Water Loss Audit Software v 5.0
 Water Loss Water Research Foundation How to use the Free Water Loss Audit Software v 5.0 2 What we will be covering Getting a handle on water loss How much How risky How to calculate Determining the cost
CHAPTER 4 Water Demand
 CHAPTER 4 4.1 OVERVIEW OF WATER USE As described in Chapter 2, the City s water service area consists of one large contiguous service area and several outlying non-contiguous service areas. The City is
The City and MID adopted this 2010 UWMP in Copies of the adoption resolutions are included in Appendix B. ES-1
 ES.1 INTRODUCTION This (UWMP) has been prepared for the City of Modesto (City) and the Modesto Irrigation District (MID) by West Yost Associates (West Yost) as a joint UWMP. This 2010 UWMP for the City
CHAPTER 2 Water Demands
 CHAPTER 2 Water Demands This chapter provides an overview of the City s water service area and describes the City s historical annual water use. Subsequent sections of this chapter examine projected water
Orange County Water Loss Control Program
 Orange County Water Loss Control Program A New Model for Regional Collaboration Striving to Achieve an Economically Optimized Level of Water Loss North American Water Loss Conference 2017 Who Is MWDOC?
TWDB Description, Summary & Example of Agency Reports
 TWDB Description, Summary & Example of Agency Reports These are the guidelines for developing a water conservation plan for entities that are applying for financial assistance of $500,000 or more form
Metropolitan Water District. July 25, 2013
 Metropolitan Water District July 25, 2013 The Mission of the Metropolitan Water District is to provide its service area with adequate and reliable supplies of high-quality water to meet present and future
Implementing SB 555: Validated Water Loss Audits and Reporting
 Implementing SB 555: Validated Water Loss Audits and Reporting November 3, 2016 California Water Association 2016 Annual Conference Sue Mosburg Program Manager Sweetwater Authority California Water Loss
CHART EXAMPLES OF WATER RATES AND CHARGES OF MWD MEMBER AGENCIES AND THEIR SUBAGENCIES
 1 CHART EXAMPLES OF WATER RATES AND CHARGES OF MWD MEMBER AGENCIES AND THEIR SUBAGENCIES MWD Member Agencies shown: MWDOC, SDCWA, Calleguas, Las Virgenes, West Basin, LADWP, Eastern and Foothill Member
WATER LOSS CONTROL PROGRAMS
 WATER LOSS CONTROL PROGRAMS EPD Guidance Document August 2007 TABLE OF CONTENTS PART 1: Overview of Water Loss Control Programs 3 SUMMARY 3 BASIC DATA AND INFRASTRUCTURE REQUIREMENTS 3 ACTIVITIES TO REDUCE
URBAN WATER MANAGEMENT PLAN
 2015 URBAN WATER MANAGEMENT PLAN FINAL JUNE 2016 2015 URBAN WATER MANAGEMENT PLAN 2015 URBAN WATER MANAGEMENT PLAN City of Anaheim FINAL Prepared for: Thomas McCarthy Water Planning and Resources Manager
Adopt the Long-Term Conservation Plan and revised policy principles on water conservation
 Board of Directors Water Planning and Stewardship Committee 8/16/2011 Board Meeting Subject Adopt the Long-Term Conservation Plan and revised policy principles on water conservation Description In February,
CHAPTER 2 POPULATION, LAND USE & WATER USE TRENDS
 Population CHAPTER 2 POPULATION, LAND USE & WATER USE TRENDS 2.1 PAST POPULATION IEUA s service area experienced rapid growth over the past ten years (see Figure 2-1). In 2000, the population within the
Santa Margarita Water Audit and Water Loss Control Program Audit Period: Fiscal Year Water Loss Control Program Development
 Santa Margarita Water Audit and Water Loss Control Program Audit Period: Fiscal Year 2013-2014 Water Loss Control Program Development TECHNICAL MEMO MAY 2016 Contents 1 Executive Summary... 9 1.1 Background...
Water Audit and Water Loss Abatement Program
 Water Audit and Water Loss Abatement Program Background Every gallon of water lost or wasted due to system inefficiencies comes at an increasing cost to our communities and natural resources. Water audits
APPENDIX D CUWCC Best Management Practices Annual Reporting
 APPENDIX D CUWCC Best Management Practices Annual Reporting California Urban Water Conservation Council Annual Reports CUWCC BMP Retail Coverage Report 2009-2010 GPCD Compliance GPCD Worksheet Base Year
DRAFT. Recycled Water Cost of Service and Rate Study Report. Napa Sanitation District
 DRAFT Recycled Water Cost of Service and Rate Study Report Napa Sanitation District December 2011 DRAFT Executive Summary Recycled Water Cost of Service and Rate Study Report 2 The Napa Sanitation District
ONTARIO CENTRE FOR MUNICIPAL BEST PRACTICES 200 University Ave., Suite 801, Toronto, Ontario, M5H 3C6. BEST PRACTICE SUMMARY REPORT February, 2008
 ONTARIO CENTRE FOR MUNICIPAL BEST PRACTICES 200 University Ave., Suite 801, Toronto, Ontario, M5H 3C6 BEST PRACTICE SUMMARY REPORT February, 2008 Water and Sewer GENERAL WATER LOSS MANAGEMENT The 2007
NOTICE OF PREPARATION OF THE CITY OF SAN JUAN CAPISTRANO 2015 URBAN WATER MANAGEMENT PLAN
 NOTICE OF PREPARATION OF THE CITY OF SAN JUAN CAPISTRANO 2015 URBAN WATER MANAGEMENT PLAN May 12, 2016 Attn: Planning Department City of Dana Point 33282 Golden Lantern Dana Point, CA 92629 The City of
2018 OC Reliability Study Draft Report
 Item No. 1 2018 OC Reliability Study Draft Report P&O Committee Municipal Water District of Orange County October 1, 2018 Today s Goals Overview Presentation 1) Describe the Study Methodology 2) Present
OCSD Urban Runoff Program SCAP Collection Systems in Motion
 OCSD Urban Runoff Program SCAP Collection Systems in Motion Tom B. Meregillano Regulatory Specialist Orange County Sanitation District, CA OCSD Service Area Los Angeles Santa Ana San Diego Orange County,
Table of Contents Part Title Page
 Table of Contents Part Title Page 1 System Information 1 2 Rate Structure 1 3 Conservation Goals 2 4 Implementation and Tracking 3 5 Conservation Measures 4 Appendix A Appendix B Appendix C Utility Profile
Elsinore Valley Municipal Water District
 Elsinore Valley Municipal Water District Drought Surcharge Study Final Report July 2, 2015 City of Thousand Oaks Water and Wastewater Financial Plan Study Report This page intentionally left blank to facilitate
A MODEL FOR THE NATION: Georgia s Statewide Water Loss Management Program
 A MODEL FOR THE NATION: Georgia s Statewide Water Loss Management Program Presented by Steve Cavanaugh, P.E. Cavanaugh & Associates, P.A. NYAWWA 2015 Saratoga Springs, NY gawp.org a4we.org 3 Training Drivers
The functional population of the Tampa
 Reducing Non-Revenue Water: A Myriad of Challenges Brian D. Pickard, Jeff Vilagos, Glenn K. Nestel, Rudy Fernandez, Stephen Kuhr, and Daniel Lanning The functional population of the Tampa Water Department
Marin Municipal Water District 2015 Urban Water Management Plan Water Demand Analysis and Water Conservation Measures Update FINAL
 2015 Urban Water Management Plan Water Demand Analysis and Water Conservation Measures Update FINAL July 1, 2015 TABLE OF CONTENTS LIST OF FIGURES...4 LIST OF TABLES...4 LIST OF ACRONYMS...5 EXECUTIVE
Water Accountability and Loss Control Improvements in North America: A Progress Report
 The Old ---- Water Accountability and Loss Control Improvements in North America: A Progress Report The New! Growing Pressure to Manage Water More Efficiently 1 AWWA Water Loss Control Committee Initiatives
2015 Urban Water Management Plan
 2015 Urban Water Management Plan DRAFT Temescal Valley Water District 22646 Temescal Canyon Road Corona, California 92883 (951) 277-1414 December 2017 Prepared by: 2015 Urban Water Management Plan Page
July 31, 2014 Get Ahead or Get Parched: Six Ways to Survive the Drought. Joe Berg Water Use Efficiency Programs Manager
 July 31, 2014 Get Ahead or Get Parched: Six Ways to Survive the Drought Joe Berg Water Use Efficiency Programs Manager Water Supply Agencies Metropolitan Water District of Southern California (MET) Serves
FINAL JUNE 2016 CITY OF WOODLAND Urban Water Management Plan
 FINAL JUNE 2016 CITY OF WOODLAND 2015 Urban Water Management Plan (THIS PAGE LEFT BLANK INTENTIONALLY) 2015 Urban Water Management Plan Prepared for City of Woodland June 2016 204-12-15-53 Project Manager
Illinois Water Audit and Loss Control Training Workshop
 Illinois Audit and Loss Control Training Workshop Fall 2014 Intro Welcome 1. Introductions 2. Instructor, Students 3. How many of you have performed an audit? 4. What do you want to get out of today s
Las Virgenes Municipal Water District 2010 Urban Water Management Plan Contact Sheet
 2010 Urban Water Management Plan Contact Sheet Date plan submitted to the Department of Water Resources: June 29, 2011 Name of person(s) preparing this plan: Mr. David Lippman, P.E., Director, Facilities
URBAN WATER MANAGEMENT PLAN
 2015 URBAN WATER MANAGEMENT PLAN FINAL DRAFT JULY 2016 2015 URBAN WATER MANAGEMENT PLAN City of San Juan Capistrano DRAFT [Signature 1 Name] [Title] Prepared for: Eric Bauman Utilities Department City
Redesigning Water Loss Standards in California Using the New IWA Methodology
 Leakage 2005 - Conference Proceedings Page 1 Redesigning Loss Standards in California Using the New IWA Methodology M A Dickinson CUWCC, 455 Capitol Mall, Suite 703, Sacramento, CA USA; maryann@cuwcc.org
Water Supply Report May 4, 2018
 Water Supply Report May 4, 218 BASIN SUPPLIES INFLOWS & OUTFLOWS Total for Year to Date - (acre-feet) Month This Year Last Year Water Purchases from MWD (excludes In Lieu) 42,737 32,92 Water into MWD Storage
2015 Urban Water Management Plan
 East Niles Community Services District 2015 Urban Water Management Plan June 2016 Prepared for: East Niles Community Services District 1417 Vale Street Bakersfield, CA 93306 Prepared by: MKN & Associates
Water Conservation Plan
 Water Conservation Plan Adopted April 21, 2014 Town Manager: Mike Slye Town of Trophy Club 100 Municipal Drive Trophy Club, TX 76262 (682) 831-4610 Town of Trophy Club Public Improvement District Public
1.1 Introduction
 Table of Contents Executive Summary ES.1 Introduction... ES-1 ES.2 Plan Adoption... ES-1 ES.3 Plan Overview... ES-2 ES.3.1 Service Area... ES-2 ES.3.2 Water Demand... ES-3 ES.3.3 Projected Water Supply...
City of Philadelphia Water Accountability Committee Fiscal Year 2012 Water Audit
 City of Philadelphia Water Accountability Committee Fiscal Year 2012 Water Audit Source: George Kunkel, PWD Total Withdrawal, MGD Total Population Served Water Withdrawn from the Rivers Philadelphia Water
Overview of Local Facilities. Integrated Resource Planning Advisory Committee
 Overview of Local Facilities Integrated Resource Planning Advisory Committee City of Henderson Utility Services System Overview 2 CITY OF HENDERSON Department of Utility Services The Department of Utility
UWMP Standardized Tables. Livermore District Urban Water Management Plan Appendix H
 UWMP Standardized Tables Livermore District 2015 Urban Water Management Plan Appendix H Table 2-1 Retail Only: Public Water Systems Public Water System Number Public Water System Name Number of Municipal
Georgia Statewide Water Loss Program
 Georgia Statewide Water Loss Program Presented by: Steve Cavanaugh, PE Principal in Charge, Georgia Water Loss Program Member IWA, Water Loss Specialist Group Member, Georgia Water Loss Control Committee
UWMP Standardized Tables. Kern River Valley District Urban Water Management Plan Appendix H
 UWMP Standardized Tables Kern River Valley District 2015 Urban Water Management Plan Appendix H Table 2-1 Retail Only: Public Water Systems Public Water System Number Public Water System Name Number of
Less Loss is our Gain Water Loss Control in Los Angeles
 Less Loss is our Gain Water Loss Control in Los Angeles December 5, 2017 Peter Dugan, Water Loss Task Force Project Engineer Reynold Wong, Water Loss Task Force Project Engineer LADWP California s Largest
WATER AND WASTEWATER RATE STUDY
 WATER AND WASTEWATER RATE STUDY B&V PROJECT NO. 176244.0100 PREPARED FOR Camrosa Water District MARCH 20, 2013 Black & Veatch Holding Company 2011. All rights reserved. Camrosa Water District WATER AND
Eastern Municipal Water District 2015 Urban Water Management Plan
 FINAL Prepared by June 2016 Table of Contents EXECUTIVE SUMMARY ES-1 PLAN PURPOSE AND OVERVIEW... XI ES-2 SERVICE AREA AND WATER SUPPLIES... XII ES-3 WATER DEMANDS... XIII ES-4 WATER SUPPLY FORECAST...
2011 RETAIL WATER CONSERVATION PLAN
 SAN FRANCISCO PUBLIC UTILITIES COMMISSION 2011 RETAIL WATER CONSERVATION PLAN FINAL JUNE 2011 Prepared by RMC Water and Environment San Francisco Public Utilities Commission Water Enterprise Prepared
CITY OF LAGRANGE, GEORGIA UTILITY DEPARTMENT WATER CONSERVATION AND DROUGHT CONTINGENCY PLANS
 CITY OF LAGRANGE, GEORGIA UTILITY DEPARTMENT WATER CONSERVATION AND DROUGHT CONTINGENCY PLANS Modified: May 2012 WATER CONSERVATION PLAN SYSTEM MANAGEMENT AND SALES Permit Information. The City of LaGrange
DRAFT MEMORANDUM OF UNDERSTANDING BETWEEN THE SAN FRANCISCO PUBLIC UTILITIES COMMISSION AND THE SAN FRANCISCO RECREATION AND PARK DEPARTMENT
 DRAFT MEMORANDUM OF UNDERSTANDING BETWEEN THE SAN FRANCISCO PUBLIC UTILITIES COMMISSION AND THE SAN FRANCISCO RECREATION AND PARK DEPARTMENT FOR THE APPLICATION AND MANAGEMENT OF WATER USE EFFICIENCY PROGRAMS
Section 3 - Land Use, Population, and Water Demands. Section 3
 Section 3 - Land Use, Population, and Water Demands Section 3 SECTION 3 DEMANDS LAND USE, POPULATION, AND WATER This section describes the existing water demands, the population projections, and the projected
Evaluation of Water Demand Management and Water Loss Control in Sanford, FL
 Evaluation of Water Demand Management and Water Loss Control in Sanford, FL Final Report December 2013 Prepared for: The City of Sanford and St. Johns River Water Management District Cost Share Project
2015 Urban Water Management Plan
 2015 Urban Water Management Plan FINAL June 2016 Prepared by Page intentionally left blank. 2015 Urban Water Management Plan Final Prepared By: June 27, 2016 Sweetwater Authority 2015 Urban Water Management
Executive Summary for the CII Task Force Water Use Best Management Practices
 0//0 Executive Summary for the CII Task Force Water Use Best Management Practices Formatted 0 0 0 Background and History California s water demands have begun to reach and, at some times in some places,
Water Conservation Plan
 Water Conservation Plan Page 1 of 11 1 Water Conservation Plan for the City of Lawrence TABLE OF CONTENTS INTRODUCTION 3 WATER CONSERVATION PLAN. 4 LONG TERM WATER USE EFFICIENCY 4 Water Use Conservation
ADOPT A RESOLUTION OF THE CITY COUNCIL IN SUPPORT OF THE CALIFORNIA WATERFIX AND CALIFORNIA ECO RESTORE
 ADOPT A RESOLUTION OF THE CITY COUNCIL IN SUPPORT OF THE CALIFORNIA WATERFIX AND CALIFORNIA ECO RESTORE Presented by Gary Takara City Council September 18, 2017 Agenda Item 12 Recommendations Find that
City of Stockton. Final Report Delta Water Supply Project: Water Rate and Financing Study. HDR Engineering, Inc. June 2009.
 City of Stockton Final Report Delta Water Supply Project: Water Rate and Financing Study June 2009 Prepared by HDR Engineering, Inc. June 8, 2009 Ms. Melissa Price Program Manager III City of Stockton
URBAN WATER MANAGEMENT PLAN JUNE Prepared By
 2015 URBAN WATER MANAGEMENT PLAN F I N A L JUNE 2016 Prepared By This page intentionally left blank. Final Prepared by: June 2016 This page intentionally left blank. Page ii Table of Contents Executive
General Rate Case Application Information
 General Rate Case Application Information I. About San Jose Water Company II. III. IV. General Information About Rates Summary of San Jose Water Company s 2015 General Rate Case Application Frequently
Approval of Shortage Management Actions in Response to MWD Supply Cutbacks and SWRCB Emergency Regulation
 Approval of Shortage Management Actions in Response to MWD Supply Cutbacks and SWRCB Emergency Regulation Lake Oroville May 14, 2015 Special Board Meeting Presentation by: Dana Friehauf, Water Resources
UTILITIES AND SERVICE SYSTEMS
 UTILITIES AND SERVICE SYSTEMS This section describes existing utilities and service systems serving John Wayne Airport ( JWA or Airport ) and identifies and addresses potential impacts related to the following
URBAN WATER MANAGEMENT PLAN
 CITY OF POMONA URBAN WATER MANAGEMENT PLAN 2010 Final City of Pomona 2010 Urban Water Management Plan Prepared by: July 2011 City of Pomona 2010 Urban Water Management Plan FINAL Table of Contents Section
REQUEST FOR QUOTES. for. Water Distribution System Leak Detection Equipment
 REQUEST FOR QUOTES for Water Distribution System Leak Detection Equipment RFQ Release Date: January 22, 2018 Quote Due Date: February 5, 2018 I. Introduction Request for Quotes Water Distribution System
Water Use Efficiency Program 2019 Update
 Water Use Efficiency Program 2019 Update INTRODUCTION The City of Enumclaw recognizes that water is a valuable and essential natural resource that needs to be used wisely. This program provides an approach
Benchmarking Water Loss Performance: The Death of Unaccounted For Water
 Benchmarking Water Loss Performance: The Death of Unaccounted For Water Presented by: Tory N. Wagoner, P.E./P.L.S. Director of Operations, Cavanaugh tory.wagoner@cavanaughsolutions.com M36: Water Audits
Date: Wednesday, October 4, Location: Western Municipal Water District Board Room Meridian Parkway, Riverside, 92518
 Date: Wednesday, October 4, 2017 Time: 6 p.m. WESTERN MUNICIPAL WATER DISTRICT NEW DATE SCHEDULED FOR PUBLIC HEARING Proposed Increases in Water Rates and Service Charges Location: Western Municipal Water
20. UTILITIES AND SERVICE SYSTEMS
 June 28, 2018 Page 20-1 20. UTILITIES AND SERVICE SYSTEMS This EIR chapter describes existing conditions for and distribution, collection and, and solid waste disposal and recycling in the planning area.
Exhibit 1 City of Lake Oswego WMCP Progress Report Progress Report for Benchmarks Listed in the 2007 WMCP (Appendix E: Matrix 1 and 2)
") Exhibit 1 Progress Report for Benchmarks Listed in the 2007 WMCP (Appendix E: Matrix 1 and 2) Item Status 1. Water Audit Results of the annual water audit can be found in exhibits 3 and 4. The City records
Exhibit 1 Progress Report for Benchmarks Listed in the 2007 WMCP (Appendix E: Matrix 1 and 2) Item Status 1. Water Audit Results of the annual water audit can be found in exhibits 3 and 4. The City records
Integrated Resources Planning Committee Item 7a December 12, 2016
 Integrated Resources Planning Committee Item 7a December 12, 2016 Long history encouraging local resource development Integrated Resources Plan Policy principles IRP Committee Item 7a Slide 3 12/12/2016
The focus of this article is methodologies
 Water Loss Management: Conservation Option in Florida s Urban Water Systems Kenneth R. Friedman and James P. Heaney The focus of this article is methodologies to estimate water loss in public water supply
4.2 Step 2 Profile of Water Demands and Historical Demand Management
 4.2 Step 2 Profile of Water Demands and Historical Demand Management Step 2 involves an overview of the historical water demand trends as well as the influence of historical water demand management on
City of Guelph. IWA / AWWA Water Audit and Water Balance & 2007 Reports. June 18 th, Prepared by: City of Guelph IWA Report
 City of Guelph IWA / AWWA Water Audit and Water Balance 2006 & 2007 Reports June 18 th, 2008 Prepared by: TABLE OF CONTENTS 1.0 Operations Department... 8 (b) Non-revenue Water Unbilled Authorised... 8
OC Water Reliability Study
 OC Water Reliability Study South Orange County (SOC) Update June 2016 Municipal Water District of Orange County 1 Where South Orange County (SOC) Gets Its Water = 90% Import & 10% Local Bay Delta Area
FINAL - MAY 2016 CITY OF ROSEVILLE Urban Water Management Plan
 FINAL - MAY 2016 CITY OF ROSEVILLE 2015 Urban Water Management Plan (THIS PAGE LEFT BLANK INTENTIONALLY) Final 2015 Urban Water Management Plan Prepared for The City of Roseville May 2016 415-12-15-26
Appendix D: Public Meeting Notice
 California Water Service 2015 Urban Water Management Plan Kern River Valley District Appendix D: Public Meeting Notice Notice of Intent Proof of Publication Public Meeting Agenda Public Meeting Comment
UWMP Standardized Tables. Chico-Hamilton City District Urban Water Management Plan Appendix H
 UWMP Standardized Tables Chico-Hamilton City District 2015 Urban Water Management Plan Appendix H Table 2-1 Retail Only: Public Water Systems Public Water System Number Public Water System Name Number
Notice of Public Hearing
 Rancho Division Notice of Public Hearing Proposed Rate Changes for District Water, Recycled Water, and Wastewater Service Charges WHEN: WHERE: Thursday, June 14, 2018, 8:30 a.m. Rancho California Water
UWMP Standardized Tables. King City District Urban Water Management Plan Appendix H
 UWMP Standardized Tables King City District 2015 Urban Water Management Plan Appendix H Table 2-1 Retail Only: Public Water Systems Public Water System Number Public Water System Name Number of Municipal
2015 Urban Water Management Plan
 Final for the San Lorenzo Valley Water District Prepared by 12/2/2016 Table of Contents TABLE OF CONTENTS Table of Contents... i List of Tables... v List of Figures... vi List of Terms and Acronyms...
Notice of Public Hearing on Proposed Water Service Rates, Fees and Charges. How to Submit a Protest
 220 Nellen Ave. Corte Madera, CA 94925 Notice of Public Hearing on Proposed Water Service Rates, Fees and Charges The Marin Municipal Water District (MMWD) Board of Directors will hold a public hearing
Overview and Background Information. Tualatin Valley Water District
 Overview and Background Information Introduction The ( TVWD or the District ) is in the process of conducting a comprehensive rate study. As a part of the process, TVWD has formed a Rate Advisory Committee
FONTANA WATER COMPANY A : General Rate Case Frequently Asked Questions (FAQs)
") FONTANA WATER COMPANY A.16-01-002: General Rate Case Frequently Asked Questions (FAQs) Q. Why did Fontana Water Company file this application requesting rate changes? A. Fontana Water s rates are set by
FONTANA WATER COMPANY A.16-01-002: General Rate Case Frequently Asked Questions (FAQs) Q. Why did Fontana Water Company file this application requesting rate changes? A. Fontana Water s rates are set by
Unit 3. Performance Indicators of Water Losses in Distribution System
 Unit 3. Performance Indicators of Water Losses in Distribution System Contents: 1. Component of water loss 2. Unaccounted for water 3. Unavoidable Annual Real Losses 4. The Infrastructure Leakage Index
Will Jernigan, P.E., Chair Cavanaugh & Associates, P.A. Jason Bodwell Georgia Environmental Finance Authority. Dan Carter Eco-Tech Inc.
 The Illinois Section AWWA and Illinois Rural Water Association have been granted permission by the GAWWA/GAWP Water Loss Control Committee (WLCC) to reproduce the Georgia Water System Audits and Water
Doheny Ocean Desalination Project Alternative Power Supply Analysis
 Doheny Ocean Desalination Project Alternative Power Supply Analysis CalDesal Conference - February 2018 South Coast Water District Created in 1932 Five-member Board of Directors Serves 40,000 residents
Irvine Ranch Water District s Groundwater Banking Program
 Irvine Ranch Water District s Groundwater Banking Program National Water Research Institute Drought Response Workshop October 8, 2013 1 Today s Discussion Introduction to IRWD Drought Preparedness at IRWD:
Engineer s Report on the groundwater conditions, water supply and basin utilization in the. Orange County Water District
 Engineer s Report on the groundwater conditions, water supply and basin utilization in the Orange County Water District 2005 2006 2005-2006 ENGINEER S REPORT ON GROUNDWATER CONDITIONS, WATER SUPPLY AND
UWMP Standardized Tables. Salinas District Urban Water Management Plan Appendix H
 UWMP Standardized Tables Salinas District 2015 Urban Water Management Plan Appendix H Table 2-1 Retail Only: Public Water Systems Public Water System Number Public Water System Name Number of Municipal
Agua Special Utility District (Agua SUD) Water Conservation Plan
 Water Conservation Plan") Agua Special Utility District (Agua SUD) Prepared by Agua Special Utility District 3201 North Abram Palmview, Texas 78572 TABLE OF CONTENTS 1. INTRODUCTION Brief Description of the Project and Planning
Agua Special Utility District (Agua SUD) Prepared by Agua Special Utility District 3201 North Abram Palmview, Texas 78572 TABLE OF CONTENTS 1. INTRODUCTION Brief Description of the Project and Planning
UWMP Standardized Tables. Palos Verdes District Urban Water Management Plan Appendix H
 UWMP Standardized Tables Palos Verdes District 2015 Urban Water Management Plan Appendix H Table 2-1 Retail Only: Public Water Systems Public Water System Number Public Water System Name Number of Municipal
County Service Area 16 Shandon Water Rate Analysis
 County Service Area 16 Shandon Water Rate Analysis Prepared By: County Public Works December 2014 December 2014 Water Rate Analysis County Service Area (CSA) 16 Shandon, Water System Purpose The purpose
UWMP Standardized Tables. Dominguez District Urban Water Management Plan Appendix H
 UWMP Standardized Tables Dominguez District 2015 Urban Water Management Plan Appendix H Table 2-1 Retail Only: Public Water Systems Public Water System Number Public Water System Name Number of Municipal
MONTE VISTA WATER DISTRICT 2015 URBAN WATER MANAGEMENT PLAN
 MONTE VISTA WATER DISTRICT 2015 URBAN WATER MANAGEMENT PLAN PUBLIC REVIEW DRAFT MAY 2016 Prepared by Monte Vista Water District Staff: General Manager Public Affairs Director/ Water Use Efficiency Practitioner
City of Escondido 2010 Urban Water Management Plan. July 2011
 City of Escondido 2010 Urban Water Management Plan July 2011 City of Escondido 2010 Urban Water Management Plan July 2011 Project No. 139583 9665 Chesapeake Drive, Suite 201 San Diego, California 92123