FINAL JUNE 2016 CITY OF WOODLAND Urban Water Management Plan
|
|
|
- Juliet Copeland
- 5 years ago
- Views:
Transcription


1 FINAL JUNE 2016 CITY OF WOODLAND 2015 Urban Water Management Plan
2 (THIS PAGE LEFT BLANK INTENTIONALLY)

3 2015 Urban Water Management Plan Prepared for City of Woodland June Project Manager Brenda J. Estrada, PE Date QA/QC Review Charles T. Duncan, PE Date
4 (THIS PAGE LEFT BLANK INTENTIONALLY)

5 Table of Contents Executive Summary ES.1 Introduction... ES-1 ES.2 Water Code Requirements... ES-1 ES.3 Legislative Changes from 2010 UWMP... ES-2 ES.4 Plan Organization... ES-2 ES.5 Plan Review and Adoption... ES-3 Chapter 1. Introduction and Overview 1.1 Background and Purpose Urban Water Management Planning and the California Water Code Applicable Changes to the Water Code Since 2010 UWMPs UWMP Organization Chapter 2. UWMP Preparation 2.1 Basis for Preparing an UWMP Regional Planning Individual or Regional Planning and Compliance Fiscal or Calendar Year and Units of Measure Coordination and Outreach Wholesale and Retail Coordination Coordination with Other Agencies and the Community Coordination with Other Agencies Coordination with the Community Notice to Cities and Counties Chapter 3. System Description 3.1 General Description Service Area Boundary Maps Service Area Climate Service Area Population and Demographics Service Area Population Other Demographic Factors Chapter 4. System Water Use 4.1 Recycled Versus Potable and Raw Water Demand Water Uses by Sector Distribution System Water Losses Estimating Future Water Savings Water Use for Lower Income Households Climate Change Impacts to Demand June 2016 n\c\669\ \wp\uwmp\012616_toc i City of Woodland 2015 Urban Water Management Plan
6 Table of Contents Chapter 5. SB X7-7 Baselines and Targets 5.1 Updating Calculations from 2010 UWMP Baseline Periods Service Area Population Gross Water Use Baseline Daily Per Capita Water Use and 2020 Targets Compliance Daily Per Capita Water Use (GPCD) Regional Alliance Chapter 6. System Supplies 6.1 Purchased or Imported Water Groundwater Basin Description Aquifer Formations Tehama Formation Riverbank and Modesto Formations Holocene Stream Channel and Basin Deposits Groundwater Management Sustainable Groundwater Management Act Overdraft Conditions Historical Groundwater Pumping Surface Water Aquifer Storage and Recovery Stormwater Wastewater and Recycled Water Recycled Water Coordination Wastewater Collection, Treatment, and Disposal Recycled Water System Recycled Water Beneficial Uses Actions to Encourage and Optimize Future Recycled Water Use Desalinated Water Opportunities Exchanges or Transfers Future Water Projects Surface Water Treatment Plant Continued Groundwater Use ASR Wells Summary of Existing and Planned Sources of Water Climate Change Impacts to Supply June 2016 n\c\204\ \wp\uwmp\112315_toc ii City of Woodland 2015 Urban Water Management Plan
7 Table of Contents Chapter 7. Water Supply Reliability Assessment 7.1 Constraints on Water Sources Physical Legal Environmental Water Quality Climate Reliability by Type of Year Supply and Demand Assessment Normal Year Single Dry Year Multiple Dry Years Regional Supply Reliability Chapter 8. Water Shortage Contingency Planning 8.1 Stages of Action Prohibitions on End Uses Penalties, Charges, Other Enforcement of Prohibitions Consumption Reduction Methods Determining Water Shortage Reductions Revenue and Expenditure Impacts Resolution or Ordinance Catastrophic Supply Interruption Minimum Supply Next Three Years Chapter 9. Demand Management Measures 9.1 Demand Management Measures Water Waste Prevention Ordinances Metering Conservation Pricing Public Education and Outreach Rebates Communicating Water Use via Water Bills School Education Programs Information Booths at Fairs and Public Events Newsletters Informative Websites, Online Tools, and Social Media Newspaper Advertisements Other Activities Programs to Assess and Manage Distribution System Real Loss Water Conservation Program Coordination and Staffing Support Water Conservation Program Funding June 2016 n\c\204\ \wp\uwmp\112315_toc iii City of Woodland 2015 Urban Water Management Plan
8 Table of Contents 9.2 Other Demand Management Measures Conferences and Trainings Memberships and Groups Planned Implementation to Achieve Water Use Targets Members of the California Urban Water Conservation Council Chapter 10. UWMP Adoption, Submittal, and Implementation 10.1 Inclusion of all 2015 Data Notice of Public Hearing Notice to the Public Public Hearing and Adoption Adoption UWMP Submittal Public Availability UWMP Implementation Amending an Adopted UWMP List of Tables Table 2-1. Retail Only: Public Water Systems (DWR Table 2-1) Table 2-2. Plan Identification (DWR Table 2-2) Table 2-3. Agency Identification (DWR Table 2-3) Table 2-4. Retail: Water Supplier Information Exchange (DWR Table 2-4) Table 3-1. Climate Data Summary Table 3-2. Retail: Population Current and Projected (DWR Table 3-1) Table 4-1. Historical Water Use by Customer Type, AFY Table 4-2. Retail: Demands for Potable and Raw Water Actual (DWR Table 4-1) Table 4-3. Retail: Demands for Potable and Raw Water Projected (DWR Table 4-2) Table 4-4. Retail: Total Water Demands (DWR Table 4-3) Table 4-5. Retail: 12 Month Water Loss Reporting (DWR Table 4-4) Table 4-6. Projected Water Demand for Low Income Households Table 4-7. Retail Only: Inclusion in Water Use Projections (DWR Table 4-5) June 2016 n\c\204\ \wp\uwmp\112315_toc iv City of Woodland 2015 Urban Water Management Plan
9 Table of Contents Table 5-1. Baselines and Targets Summary (DWR Table 5-1) Table Compliance (DWR Table 5-2) Table 6-1. Sustainable Groundwater Management Act Implementation Steps and Deadlines Table 6-2. Groundwater Basin Prioritization for Sustainable Groundwater Management Act Table 6-3. Retail: Groundwater Volume Pumped (DWR Table 6-1) Table 6-4. Retail: Wastewater Collected Within Service Area in 2015 (DWR Table 6-2) Table 6-5. Retail: Wastewater Treatment and Discharge within Service Area in 2015 (DWR Table 6-3) Table 6-6. Retail: Current and Projected Recycled Water Direct Beneficial Uses Within Service Area (DWR Table 6-4) Table 6-7. Retail: 2010 UWMP Recycled Water Use Projection Compared to 2015 Actual (DWR Table 6-5) Table 6-8. Retail: Methods to Expand Future Recycled Water Use (DWR Table 6-6) Table 6-9. Retail: Expected Future Water Supply Projects or Programs (DWR Table 6-7) Table Retail: Water Supplies Actual (DWR Table 6-8) Table Retail: Water Supplies Projected (DWR Table 6-9) Table 7-1. Retail: Basis of Water Year Data (DWR Table 7-1) Table 7-2. Retail: Normal Year Supply and Demand Comparison (DWR Table 7-2) Table 7-3. Retail: Single Dry Year Supply and Demand Comparison (DWR Table 7-3) Table 7-4. Retail: Multiple Dry Years Supply and Demand Comparison (DWR Table 7-4) Table 8-1. Retail: Stages of Water Shortage Contingency Plan (DWR Table 8-1) Table 8-2. Retail Only: Restrictions and Prohibitions on End Uses (DWR Table 8-2) Table 8-3. Retail Only: Stages of Water Shortage Contingency Plan Consumption Reduction Methods (DWR Table 8-3) Table 8-4. Retail: Minimum Supply Next Three Years (DWR Table 8-4) June 2016 n\c\204\ \wp\uwmp\112315_toc v City of Woodland 2015 Urban Water Management Plan
10 Table of Contents Table 9-1. Current Water Rate Structure Table 9-2. History of Current and Past Year Water Conservation Program Budgets Table Retail: Notification to Cities and Counties (DWR Table 10-1) List of Figures Figure 3-1. City of Woodland Water Service Area Figure 6-1. Groundwater Basins Figure 6-2. Generalized Sacramento Valley Geologic Cross Section List of Appendices Appendix A: Legislative Requirements Appendix B: DWR UWMP Tables Appendix C: DWR UWMP Checklist Appendix D: Agency and Public Notices Appendix E: AWWA Water Audit Appendix F: SB X7-7 Compliance Tables Appendix G: DWR Bulletin 118: Sacramento Groundwater Basin Yolo Subbasin Appendix H: Draft Water Reliability Evaluation TM April 15, 2016 Appendix I: Recycled Water Opportunities Evaluation Appendix J: Water Conservation Ordinance Appendix K: UWMP Adoption Resolution June 2016 n\c\204\ \wp\uwmp\112315_toc vi City of Woodland 2015 Urban Water Management Plan
11 Table of Contents List of Acronyms and Abbreviations AB Assembly Bill 1-1 Act Urban Water Management Planning Act 1-1 AF Acre-Feet 2-1 AFY Acre-Feet Per Year 4-2 AMI Advanced Metering Infrastructure 9-3 AMR Automated Meter Reading 9-2 ASR Aquifer Storage and Recovery 6-1 AWWA American Water Works Association 4-5 Baseline GPCD Baseline Gallons Per Capita Per Day 5-2 CDoF California Department of Finance 3-2 CF Cubic Feet 9-4 CIMIS California Irrigation Management Information System T3-1 City City of Woodland 1-1 CPG Conaway Preservation Group 6-17 Cr 6 Chromium VI 6-1 CUWA California Urban Water Agencies 6-17 CUWCC California Urban Water Conservation Council 9-11 CVP Central Valley Project 7-1 CWC California Water Code 1-1 Davis City of Davis 6-6 DMMs Demand Management Measures 9-1 DPW Department of Public Works 6-8 DWR Department of Water Resources 1-2 DWR 2015 Guidebook 2015 Urban Water Management Plans Guidebook for Urban Water Suppliers 1-3 DWWSP Davis-Woodland Water Supply Project 6-13 EC Electrical Conductivity 6-9 ETo Reference Evapotranspiration T3-1 FY Fiscal Year 9-10 GMP Groundwater Management Plan 6-3 GPCD Gallons Per Capita Per Day 4-3 GSA Groundwater Sustainability Agency 6-4 GSP Groundwater Sustainability Plan 6-4 IPCC Intergovernmental Panel on Climate Change 6-15 IRWM Integrated Regional Water Management 2-3 MCL Maximum Contaminant Level 6-1 MGD Million Gallons Per Day 6-1 MOU Memorandum of Understanding 9-11 msl Mean Sea Level 6-5 MWELO Model Water Efficient Landscape Ordinance 4-5 June 2016 n\c\204\ \wp\uwmp\112315_toc vii City of Woodland 2015 Urban Water Management Plan
12 Table of Contents my Million Years 6-3 NAICS North American Industry Classification System 4-2 NPDES National Pollutant Discharge Elimination System 6-8 PHG Public Health Goal 6-1 PWS Public Water System 2-1 RHNP Regional Housing Needs Plan 4-6 RWTF Regional Water Treatment Facility 6-6 SACOG Sacramento Area Council of Governments 4-6 SB Senate Bill 1-1 SB X7-7 Water Conservation Act of SGMA Sustainable Groundwater Management Act 6-3 SWP State Water Project 7-1 SWRCB State Water Resources Control Board 7-1 UCD University of California at Davis 6-6 UWMP Urban Water Management Plan 1-1 WDCWA Woodland-Davis Clean Water Agency 2-1 West Yost West Yost Associates 1-1 WPCF Woodland Water Pollution Control Facility 6-7 WSCP Water Shortage Contingency Plan 8-1 WTP Water Treatment Plant 6-8 June 2016 n\c\204\ \wp\uwmp\112315_toc viii City of Woodland 2015 Urban Water Management Plan
13 EXECUTIVE SUMMARY ES.1 INTRODUCTION Over the last several years, Urban Water Management Plans (UWMPs) have assumed a very important role in water supply planning and management for communities in California. UWMPs have become the foundational documents which cities and water agencies use to develop water supply assessments and other key water supply reliability documents in support of providing water service to existing customers and future development in accordance with adopted General Plans and established Spheres of Influence. With the current unprecedented water supply conditions in California, development of the 2015 UWMPs comes at a pivotal time. Current drought conditions have resulted in unprecedented State mandates for water conservation and have led to the passage of the Sustainable Groundwater Management Act of These actions will impact all water suppliers and all water users in the State. With the improving economy statewide, the need for reliable water supplies to serve existing customers, as well as new development, is more critical than ever. Also, 2015 is the first compliance year for the interim water use targets required by the Water Conservation Act of 2009 (SB X7-7). As described in this 2015 UWMP, the City of Woodland (City s) residents and businesses have responded positively to the call for water conservation and the City continues to be committed to the implementation of good water management practices to ensure that adequate, reliable water supplies are available to meet existing and projected demands. The City has met its interim 2015 per capita water use target and is well positioned to meet the final 2020 water use target per capita water demand. ES.2 WATER CODE REQUIREMENTS The Urban Water Management Planning Act (UWMP Act) requires water suppliers that provide over 3,000 acre feet per year or have over 3,000 connections to prepare and submit to the State Department of Water Resources (DWR) an Urban Water Management Plan every 5 years. The UWMP Act has been modified over the years in response to the State s water shortages, droughts and other factors. A significant amendment was made in 2009, after the 2007 to 2009 drought, and as a result of the Governor s call for a statewide 20 percent reduction in urban water use by the year This was the Water Conservation Act of 2009, also known as SB X7-7. This act required agencies to establish water use targets for 2015 and 2020 that would result in statewide water savings of 20 percent by The primary objective of the UWMP Act is to direct urban water suppliers to develop an UWMP which provides a framework for long-term water supply planning and documents how urban water suppliers are carrying out their long-term resource planning responsibilities to ensure adequate water supplies are available to meet existing and future water demands. In 2015, the City supplied approximately 8,650 acre-feet (AF) of water to approximately 15,635 residential and non-residential connections located within its water service area. The City is therefore considered an urban water supplier and is required to submit an UWMP. This 2015 UWMP describes the City water system, historical and projected water use, water supply sources, and a comparison of projected water supply to water demands during normal, single dry, and June 2016 n\c\204\ \wp\uwmp\112315_es ES-1 City of Woodland 2015 Urban Water Management Plan
14 Executive Summary multiple dry years in five-year increments from 2020 to As required by SB X7-7, this 2015 UWMP also confirms the City s 2015 and 2020 water use targets, verifies the City s compliance with the interim 2015 water use target, and describes the City s implementation plan for meeting the City s final 2020 water use target. The City s 2015 UWMP (or Plan) has been prepared in accordance with the UWMP Act, as defined by the California Water Code, Division 6, Part 2.6, Sections through (Urban Water Management Planning), and the Water Conservation Act of 2009 (WC Act, also known as SB X7-7), as defined by California Water Code, Division 6, Part 2.55, Section (Sustainable Water Use and Demand Reduction). A copy of the relevant sections of the Water Code are included in Appendix A of this document. A brief summary of this 2015 UWMP s contents and the public review and adoption process is provided below, following a discussion of the legislative changes that have been enacted since the 2010 UWMPs were prepared and adopted. ES.3 LEGISLATIVE CHANGES FROM 2010 UWMP The legislative changes to the UWMP Act are described in Chapter 1. Some highlighted changes include: Demand Management Measures: Address the nature and extent of each water demand management measure implemented over the past 5 years in narrative form UWMP Submittal Date to DWR: Changed from December 31, 2015 to July 1, Water Loss: Requires water suppliers to quantify and report on distribution system water loss using the AWWA Water Audit methodology. Voluntary Reporting of Passive Savings due to new water codes and requirements. Voluntary Reporting of Energy Intensity: Describe the water/energy nexus. Defining Water Features: Water Shortage Contingency Plans must distinguish between water features that are artificially supplied with water (including ponds, lakes, waterfalls, and fountains) and swimming pools and spas. ES.4 PLAN ORGANIZATION This 2015 UWMP contains the appropriate sections and tables required per California Water Code Division 6, Part 2.6 (Urban Water Management Planning Act), included in Appendix A of this 2015 UWMP, and has been prepared based on guidance provided by the California Department of Water Resources (DWR) in their January Urban Water Management Plans, Guidebook for Urban Water Suppliers (DWR 2015 Guidebook). DWR s Urban Water Management Plan Checklist, as provided in the DWR 2015 Guidebook, has been completed to demonstrate the Plan s compliance with applicable requirements. A copy of the completed checklist is included in Appendix C. June 2016 n\c\204\ \wp\uwmp\112315_es ES-2 City of Woodland 2015 Urban Water Management Plan
15 Executive Summary This 2015 UWMP is organized into the following chapters: Chapter 1: Introduction and Overview Chapter 2: Plan Preparation Chapter 3: System Description Chapter 4: System Water Use Chapter 5: SB X7-7 Baselines and Targets Chapter 6: System Supplies Chapter 7: Water Supply Reliability Chapter 8: Water Shortage Contingency Planning Chapter 9: Demand Management Measures Chapter 10: Plan Adoption, Submittal and Implementation Appendices (listed in Chapter 1) provide relevant supporting documents, including the 2015 UWMP tables and SB X7-7 Verification Form. ES.5 PLAN OVERVIEW ES.5.1 Service Area The City and water service area encompass an area of approximately 14.5 square miles. The City serves the entire area within its City Limits including residential, commercial, industrial, and fire use. In 2015, the City provided water supplies to 15,635 connections, and supplied 8,650 AF of water. ES.5.2 Water Supply The City pumps groundwater for municipal supply from wells that it owns and operates. The City does not currently purchase or import water from any other water supply or entity. However, in mid-2016, the City, as a member of the Woodland Davis Clean Water Agency (WDCWA), will purchase and receive up to 18 million gallons per day (MGD) (55 AF/day) of treated surface water from the Sacramento River. Some of this treated surface water will be distributed directly to customers, and a portion will be stored in the aquifer during low water demand months and recovered and distributed to customers during high water demand months under the City s aquifer storage and recovery (ASR) program. In the future, the City intends to use recycled water as a supply source to serve industrial customers and is evaluating the feasibility of serving additional customers, such as park irrigation, with recycled water. The impacts of climate change on future water supply is an important issue that the City is actively addressing by diversifying its supply portfolio to include surface water, ASR water, and recycled water in addition to native groundwater. The City s future planning ensures flexibility in addressing climate change to minimize impacts to its customers. June 2016 n\c\204\ \wp\uwmp\112315_es ES-3 City of Woodland 2015 Urban Water Management Plan
16 Executive Summary ES.5.3 SB X7-7 Baselines and Targets As part of the City s compliance with SB X7-7, the City has established its baseline per capita water use, interim (2015) per capita water use target, and final (2020) per capita water use target. The development of the City s baseline and per capita water use are described in Chapter 5 and Appendix F, and are summarized as follows: Base Daily Per Capita Water Use (10-year): 290 gallons per capita per day (GPCD); 2015 Interim Per Capita Water Use Target: 261 GPCD, and 2020 Final Per Capita Water Use Target: 232 GPCD. The City has calculated its actual 2015 water use for the 2015 calendar year as 133 GPCD, which is well below the 2015 interim water use target of 261 GPCD. Therefore, the City has met its interim 2015 water use target. ES.5.4 Water Supply Availability and Reliability In 2015, the City relied completely on native groundwater to meet demands. Starting in mid-2016, the City s water supply will rely on surface water, ASR water, native groundwater, and recycled water to meet demands. The City s future demands are based on projected population growth rate developed in the City s Draft 2035 General Plan Update for the anticipated development within the City s approved urban limit line. As described in Chapter 7, based on the City s planning for diversifying water supply sources, the anticipated availability and reliability of the City s water supplies during normal, single dry, and multiple dry years, the City has adequate water supplies to meet projected water demands during all hydrologic conditions through The need for future water conservation during dry periods will continue to be a priority for the City. The City s customers response to recent drought conditions show the City may significantly reduce its water use in accordance with the City s Drought Contingency Plan (summarized below), further improving the ability to provide water in all hydrologic conditions. ES.5.5 Drought Contingency Plan The City s Water Shortage Contingency Plan (WSCP) was adopted by City Council July 1, 2014 (Appendix J) and notes that long and short-term shortages are handled through implementation of a drought contingency plan. The City s WSCP includes four water conservation stages. The four water conservation stages of action respond to progressively decreasing water supplies, including greater than 50 percent reduction. These stages would be appropriate responses to a drought, emergency supply outage condition, or other water shortages. The WSCP is further described in Chapter 8 of this 2015 UWMP. June 2016 n\c\204\ \wp\uwmp\112315_es ES-4 City of Woodland 2015 Urban Water Management Plan
17 Executive Summary ES.5.6 Demand Management The City s compliance with the established SB X7-7 targets is achieved with the implementation of demand management measures (DMM). As described in Chapter 9, even though the City is not a member of the California Urban Water Conservation Council (CUWCC) Memorandum of Understanding (MOU), the City has implemented water conservation and water recycling programs to maximize sustainability in meeting future water needs for its customers. The City actively looks for opportunities to educate the public and encourage using available water resources wisely. ES.6 PLAN REVIEW AND ADOPTION The UWMP Act requires the water supplier to coordinate the preparation of its Plan with other appropriate agencies, including other water suppliers that share a common source, water management agencies, and relevant public agencies. These agencies, as well as the public, participated in the coordination and preparation of this 2015 UWMP. The coordination and outreach are described in Chapter 2. A public hearing to discuss the Draft 2015 UWMP was held on June 7, Public hearings provide an opportunity for all City water users and the general public to become familiar with the Plan and to ask questions about its water supply and the City s continuing plans for providing a reliable, safe, high-quality water supply. The adoption, implementation and economic impact of revised per capita water use targets (described in Chapter 5) was also discussed. Copies of the draft Plan were made available for public inspection at the City Manager s office, and at Woodland Public Library. Water Code (b) requires agencies to notify the cities and counties to which they serve water that the Plan is being updated and reviewed. This notification must be sent out at least 60 days in advance of the public hearing. In early 2016, a notice of preparation was sent to the cities and counties, and other stakeholders, to inform them of the UWMP update process and schedule and to solicit input for the Plan update. The notifications to cities and counties, the public hearing notifications, and the public hearing and adoption are discussed in Chapter 10 and provided in Appendix D. This Plan was adopted by the City Council on June 7, A copy of the adoption resolution is provided in Appendix K. Within 30 days of Plan adoption, a copy of the Plan was submitted to DWR, the California State Library and the cities and counties to which the urban water supplier provides water. Within 30 days of submitting the adopted Plan to DWR, copies of this Plan will be made available during normal business hours at the following locations: Woodland Public Library, and City Manager s Office. June 2016 n\c\204\ \wp\uwmp\112315_es ES-5 City of Woodland 2015 Urban Water Management Plan
18 Executive Summary A copy of the adopted Plan will also be available for review and download on the City s website: Should this Plan be amended or changed, copies of amendments or changes to the Plan shall be submitted to DWR, the California State Library, and any city or county within which the City provides water supplies within 30 days after adoption of the amendment(s). June 2016 n\c\204\ \wp\uwmp\112315_es ES-6 City of Woodland 2015 Urban Water Management Plan
19 CHAPTER 1 Introduction and Overview This chapter provides an introduction and overview of the City of Woodland (City) 2015 Urban Water Management Plan (UWMP) including the importance and extent of the City s water management planning efforts, changes since the preparation of the City s 2010 UWMP, and organization of the City s 2015 UWMP. This 2015 UWMP has been prepared jointly by City staff and West Yost Associates (West Yost). 1.1 BACKGROUND AND PURPOSE The Urban Water Management Planning Act (Act) was originally established by Assembly Bill 797 (AB 797) on September 21, Passage of the Act was recognition by state legislators that water is a limited resource and a declaration that efficient water use and conservation would be actively pursued throughout the state. The primary objective of the Act is to direct urban water suppliers to develop an UWMP which provides a framework for long-term water supply planning and documents how urban water suppliers are carrying out their long-term resource planning responsibilities to ensure adequate water supplies are available to meet existing and future water demands. A copy of the current version of the Act, as incorporated in Sections through of the California Water Code (CWC), is provided in Appendix A of this document. 1.2 URBAN WATER MANAGEMENT PLANNING AND THE CALIFORNIA WATER CODE The purpose of the UWMP is to provide a planning tool for the City for developing and delivering municipal water supplies to the City s water service area. The City has a long history of providing clean and reliable water to its residential, commercial, and industrial customers. Expanding local groundwater sources of water have historically met the needs for water in the community. To continue to meet the water needs of the community, the City will carefully manage its groundwater supply and begin utilizing treated Sacramento River water through the Davis Woodland Water Supply Project in The City s UWMP is a comprehensive guide for planning for a safe and adequate water supply Applicable Changes to the Water Code Since 2010 UWMPs The Act has been modified over the years in response to the State s water shortages, droughts and other factors. A significant amendment was made in 2009, after the 2007 to 2009 drought, and as a result of the Governor s call for a statewide 20 percent reduction in urban water use by the year This was the Water Conservation Act of 2009, also known as Senate Bill (SB) X7-7. This act required agencies to establish water use targets for 2015 and 2020 that would result in statewide water savings of 20 percent by There have been several additions and changes to the CWC since the City s 2010 UWMP was prepared. These are summarized below: June 2016 n\c\204\ \wp\uwmp\112315_1ch1 1-1 City of Woodland 2015 Urban Water Management Plan
20 Chapter 1 Introduction and Overview AB 2067 (Weber 2014) CWC Section (f)(1) and (2): Demand Management Measures Requires water suppliers to provide narratives describing their water demand management measures, as provided. Requires retail water suppliers to address the nature and extent of each water demand management measure implemented over the past five years and describe the water demand management measures that the supplier plans to implement to achieve its water use targets. See Chapter 9 of this 2015 UWMP for a description of the City s Demand Management Measures. CWC Section (d): Submittal Date Requires each urban water supplier to submit its 2015 UWMP to the Department of Water Resources (DWR) by July 1, SB 1420 (Wolk 2014) CWC Section 10644(a)(2): Submittal Format Requires the UWMP, or amendments to the UWMP, to be submitted electronically to the department. CWC Section 10644(a)(2): Standardized Forms Requires the UWMP, or amendments to the UWMP, to include any standardized forms, tables, or displays specified by the department. CWC (e)(1)(j) and (e)(3)(a) and (B): Water Loss Requires an UWMP to quantify and report on distribution system water loss. See Chapter 4 of this 2015 UWMP for a description of the City s distribution system water losses. CWC (e)(4): Voluntary Reporting of Passive Savings Provides for water use projections to display and account for the water savings estimated to result from adopted codes, standards, ordinances, or transportation and land use plans, when that information is available and applicable to an urban water supplier. See Chapter 4 of this 2015 UWMP for a description of the City s passive water savings. SB 1036 (Pavley 2014) CWC (a) and (b): Voluntary Reporting of Energy Intensity Provides for an urban water supplier to include certain energy-related information, including, but not limited to, an estimate of the amount of the energy used to extract or divert water supplies. The City has opted to not report on energy intensity in this 2015 UWMP. June 2016 n\c\204\ \wp\uwmp\112315_1ch1 1-2 City of Woodland 2015 Urban Water Management Plan
21 Chapter 1 Introduction and Overview CWC 10632: Defining Water Features Commencing with the UWMP update due July 1, 2016, for purposes of developing the water shortage contingency analysis, requires urban water suppliers to analyze and define water features that are artificially supplied with water, including ponds, lakes, waterfalls, and fountains, separately from swimming pools and spas. See Chapter 8 of this 2015 UWMP for a discussion of water features that are artificially supplied with water. 1.3 UWMP ORGANIZATION This 2015 UWMP contains the appropriate sections and tables required per CWC Division 6, Part 2.6 (Urban Water Management Planning Act), included in Appendix A of this 2015 UWMP, and has been prepared based on guidance provided by DWR in their March Urban Water Management Plans Guidebook for Urban Water Suppliers (DWR 2015 Guidebook). The required tables are included in the relevant sections and in Appendix B. DWR s Urban Water Management Plan Checklist, as provided in the DWR 2015 Guidebook, has been completed by West Yost to demonstrate the UWMP s compliance with applicable requirements. A copy of the completed checklist is included in Appendix C. This 2015 UWMP is organized into the following chapters: Chapter 1: Introduction and Overview Chapter 2: UWMP Preparation Chapter 3: System Description Chapter 4: System Water Use Chapter 5: SB X7-7 Baselines and Targets Chapter 6: System Supplies Chapter 7: Water Supply Reliability Chapter 8: Water Shortage Contingency Planning Chapter 9: Demand Management Measures Chapter 10: UWMP Adoption, Submittal and Implementation June 2016 n\c\204\ \wp\uwmp\112315_1ch1 1-3 City of Woodland 2015 Urban Water Management Plan
22 Chapter 1 Introduction and Overview This 2015 UWMP also contains the following appendices of supplemental information and data related to the City s 2015 UWMP: Appendix A: Legislative Requirements Appendix B: DWR UWMP Tables Appendix C: DWR UWMP Checklist Appendix D: Agency and Public Notices Appendix E: AWWA Water Audit Appendix F: SB X7-7 Compliance Tables Appendix G: DWR Bulletin 118: Sacramento Groundwater Basin Yolo Subbasin Appendix H: Draft Water Reliability Evaluation TM April 15, 2016 Appendix I: Recycled Water Opportunities Evaluation Appendix J: Water Conservation Ordinance Appendix K: UWMP Adoption Resolution June 2016 n\c\204\ \wp\uwmp\112315_1ch1 1-4 City of Woodland 2015 Urban Water Management Plan
23 CHAPTER 2 UWMP Preparation This chapter describes the preparation of the City s 2015 UWMP, including the basis for the preparation of the UWMP, individual or regional planning, fiscal or calendar year reporting, units of measure, and UWMP coordination and outreach. 2.1 BASIS FOR PREPARING AN UWMP The UWMP Act requires every urban water supplier to prepare and adopt an UWMP, to periodically review its UWMP at least once every five years, and make any amendments or changes indicated by the review. An urban water supplier is defined as a supplier, either publicly or privately owned, providing water for municipal purposes either directly or indirectly to more than 3,000 customers or supplying more than 3,000 acre-feet (AF) of water annually. A Public Water System (PWS) is a system that provides drinking water for human consumption. The City manages CA As shown in Table 2-1 (Table 2-1), in 2015, the City provided water supplies to 15,635 connections, and supplied 8,650 AF of water. Therefore, the City is required to prepare an UWMP. The City s last UWMP, the 2010 UWMP, was adopted by the City Council in July Table 2-1. Retail Only: Public Water Systems (DWR Table 2-1) Public Water System Number Public Water System Name Number of Municipal Connections 2015 Volume of Water Supplied 2015 CA City of Woodland 15,635 8,650 TOTAL 15,635 8,650 NOTES: Volumes are in AF. The City estimates in the AWWA Water Audit that master meters underestimate supply to the system by approximately 1-percent. Therefore, supply shown includes a 1-percent increase from the actual metered supply amount. 2.2 REGIONAL PLANNING The City is a member and participant in several regional groups that do water planning in the region. These groups include the Westside Sacramento River Integrated Regional Water Management Group, the Water Resources Association of Yolo County, and the Woodland-Davis Clean Water Agency (WDCWA). Although the City is closely involved with each of these regional organizations, the City is not engaging in a cooperative regional UWMP with any of these entities. June 2016 n\c\204\ \wp\uwmp\112315_2ch2 2-1 City of Woodland 2015 Urban Water Management Plan
24 Chapter 2 UWMP Preparation 2.3 INDIVIDUAL OR REGIONAL PLANNING AND COMPLIANCE Water Code (d)(1) An urban water supplier may satisfy the requirements of this part by participation in area-wide, regional, watershed, or basin-wide urban water management planning where those plans will reduce preparation costs and contribute to the achievement of conservation and efficient water use. This 2015 UWMP has been prepared on an Individual Reporting basis, covering only the City s service area as shown in Table 2-2 (DWR Table 2-2). As described in Section 2.5, the City has notified and coordinated with appropriate regional agencies and constituents, including the Water Resources Association of Yolo County, as well as several local agencies. Table 2-2. Plan Identification (DWR Table 2-2) Select Only One Type of Plan Name of RUWMP or Regional Alliance if applicable Individual UWMP Regional Urban Water Management Plan (RUWMP) 2.4 FISCAL OR CALENDAR YEAR AND UNITS OF MEASURE The City is a water retailer and the UWMP has been prepared on a calendar year basis with the calendar year starting on January 1 and ending on December 31 of each year. The City s 2015 UWMP includes planning data for the calendar year of The City s reporting of water volumes in this 2015 UWMP is reported in AF. Table 2-3 (DWR Table 2-3) summarizes the City s reporting methods for this 2015 UWMP. Table 2-3. Agency Identification (DWR Table 2-3) Type of Agency (select one or both) Agency is a wholesaler Agency is a retailer Fiscal or Calendar Year (select one) UWMP Tables Are in Calendar Years UWMP Tables Are in Fiscal Years Units of Measure Used in UWMP Unit AF June 2016 n\c\204\ \wp\uwmp\112315_2ch2 2-2 City of Woodland 2015 Urban Water Management Plan
25 Chapter 2 UWMP Preparation 2.5 COORDINATION AND OUTREACH This section includes a discussion of the City s inter-agency coordination and coordination with the general public. The UWMP Act requires the City to coordinate the preparation of its Plan with other appropriate agencies and all departments within the City, including other water suppliers that share a common source, water management agencies, and relevant public agencies. These agencies, as well as the public, participated in the coordination and preparation of this 2015 UWMP, and are summarized below Wholesale and Retail Coordination Water Code (j) An urban water supplier that relies upon a wholesale agency for a source of water shall provide the wholesale agency with water use projections from that agency for that source of water in five-year increments to 20 years or as far as data is available. The wholesale agency shall provide information to the urban water supplier for inclusion in the urban water supplier s plan that identifies and quantifies, to the extent practicable, the existing and planned sources of water as required by subdivision (b), available from the wholesale agency to the urban water supplier over the same five-year increments, and during various water-year types in accordance with subdivision (c). An urban water supplier may rely upon water supply information provided by the wholesale agency in fulfilling the plan informational requirements of subdivisions (b) and (c). The City currently has autonomy of its own supplies. However, future projections assume use of wholesale water from the WDCWA beginning in As a retailer and in accordance with CWC 10631, the City has informed the WDCWA of its projected water use as is shown in Table 2-4 (DWR Table 2-4). Table 2-4. Retail: Water Supplier Information Exchange (DWR Table 2-4) The retail supplier has informed the following wholesale supplier(s) of projected water use in accordance with CWC Wholesale Water Supplier Name Woodland-Davis Clean Water Agency Coordination with Other Agencies and the Community The City coordinated its UWMP preparation with other local agencies and the community Coordination with Other Agencies The City is a member of the Water Resources Association of Yolo County, Westside Sacramento Region Integrated Regional Water Management (IRWM) Group, and the WDCWA. Although the City cooperates much within the region, the City is not part of a Regional Alliance for preparing a cooperative UWMP. June 2016 n\c\204\ \wp\uwmp\112315_2ch2 2-3 City of Woodland 2015 Urban Water Management Plan
26 Chapter 2 UWMP Preparation Coordination with the Community The City has actively encouraged community participation in water management activities and specific water-related projects. The City s public participation program includes both active and passive means of obtaining input from the community, such as mailings, public meetings, and web-based communication. The City s website describes on-going projects and posts announcements of planned rate increases to fund these water projects. As part of development of this 2015 UWMP update, the City allowed a public review period following noticing and prior to adoption to allow ample time for public comments to be developed and received. Public noticing, pursuant to Section 6066 of the Government Code, was conducted prior to commencement of the public comment period. Public hearing notices are included in Appendix D of this document. During the public comment period, a hard copy of the Draft UWMP update was made available at the City s offices during normal business hours and at the Woodland Public Library and an electronic copy was posted on the City s website. The public hearings provided an opportunity for all City water users and the general public to become familiar with the UWMP and ask questions about its water supply in addition to the City s continuing plans for providing a reliable, safe, high-quality water supply. The organizations that were notified and solicited for input in the UWMP preparation include: City of Woodland County of Yolo City of Davis City of West Sacramento Reclamation District 2035 University of California, Davis Water Resources Association of Yolo County Westside IRWM Group Woodland Chamber of Commerce, Water Task Force WDCWA Yolo County Farm Bureau Yolo County Flood Control Water Conservation District Notice to Cities and Counties CWC (b) requires agencies to notify the cities and counties to which they serve water at least 60 days in advance of the public hearing that the plan is being updated and reviewed. In early 2016, a notice of preparation was sent to the cities and counties, and other stakeholders, to inform them of the UWMP update process and schedule and to solicit input for the Plan update. The notifications to cities and counties, the public hearing notifications, and the public hearing and adoption are discussed in Chapter 10. June 2016 n\c\204\ \wp\uwmp\112315_2ch2 2-4 City of Woodland 2015 Urban Water Management Plan
27 CHAPTER 3 System Description This chapter provides a description of the City s water system and service area. This includes a description of the water system facilities, climate, population, and housing within the City s service area. 3.1 GENERAL DESCRIPTION The City, incorporated in 1871, is located in the Sacramento Valley, approximately six miles west of the Sacramento River and about 20 miles northwest of the City of Sacramento at the intersection of Interstate 5 and State Route 113. Located within an important agricultural region, the City is completely surrounded by agricultural lands. The City water system is responsible for delivering treated water to residential, commercial, and landscape customers. As of 2015, the system serves about 15,635 connections within the City boundaries. 3.2 SERVICE AREA BOUNDARY MAPS The City and water service area encompass an area of approximately 14.5 square miles. The City serves the entire area encompassed by its City Limits including residential, commercial, industrial, and fire use. Figure 3-1 provides a location map of the service area. Municipal water supply for the City is currently based solely on groundwater. However, a joint project between the City of Woodland, the City of Davis, and the University of California, Davis is currently under way to incorporate surface water as a primary water supply source. (Please see additional discussion about the Davis Woodland Water Supply Project in Chapter 6). 3.3 SERVICE AREA CLIMATE Woodland has a Mediterranean climate. Summers are mild to hot and dry, and winters are cool and rainy, with an annual average precipitation of approximately 18.5 inches. The local annual average of maximum daily temperature is 76 degrees Fahrenheit. Average rainfall over the last six years ( ) was 16.4 inches. The region is subject to wide variations in annual precipitation. Water year 2011 (October 2010 through September 2011) was a relatively wet year with 26.1 inches of rainfall while water year 2014 was relatively dry with only 10.7 inches of rain. The following table presents climatic data for the Woodland area. June 2016 n\c\204\ \wp\uwmp\112315_3ch3 3-1 City of Woodland 2015 Urban Water Management Plan

28 Chapter 3 System Description June 2016 n\c\204\ \wp\uwmp\112315_3ch3 3-2 City of Woodland 2015 Urban Water Management Plan
29 Chapter 3 System Description Table 3-1. Climate Data Summary Average Eto, inches (a) Average Max Temperature, F (b) Average Min Temperature, F (b) Average Rainfall, inches (b) (a) (b) Jan Feb Mar Apr May Jun Jul Aug Sep Oct Nov Dec Total Source: CIMIS Website: Station 226 Woodland, California (May 2011 to December 2015), Monthly Average Et o Report, Printed January Source: Western Regional Climate Center (WRCC) website: Station Woodland 1 WNW, California. Period of record: 3/1/1906 to 12/31/2014. These climate characteristics highly influence the City s water use. As described in Chapter 4, the City s water use in the summer months is significantly higher than that in the winter, reflecting increased water use for irrigation purposes during the hot, dry summers. 3.4 SERVICE AREA POPULATION AND DEMOGRAPHICS Service Area Population The City s current (2015) service area population is derived from Unites States Census Bureau data. Because the City s water service area boundary is the same as the City s limits, California Department of Finance (CDoF) population data for the City is used. The CDoF uses an analysis of 2010 census data to update city population estimates for Service area population is used to determine per capita water as described in Chapter 5. Current and projected service area population is summarized in Table 3-2. CDoF estimates the City s 2015 population to be 57,525. Household size within the City is estimated at about 2.96 persons per household with approximately 20,160 total households in 2015 per CDoF estimates. Land use planning within the City is undertaken by the City s Community Development Department of the Planning Division. The City is in the process of developing a comprehensive update of its General Plan, which was last updated in 1996 with a technical update in The General Plan Update 2035 will provide guidelines for the City on how development will occur in the future. The City s population projections used in the UWMP are based on draft population projections used for the General Plan Update The population projections represent the assumed growth that will occur by the year These projections are the most current available projections and represent an anticipated growth rate of approximately 1.3 percent per year. To obtain population projections for the year 2040, an assumption of a continued 1.3 percent per year growth was assumed. Population June 2016 n\c\204\ \wp\uwmp\112315_3ch3 3-3 City of Woodland 2015 Urban Water Management Plan
30 Chapter 3 System Description projections are summarized in Table 3-2 (DWR Table 3-1). Figure 3-1 shows the City s approved urban limit line used in the General Plan Update Table 3-2. Retail: Population Current and Projected (DWR Table 3-1) Population Served (opt) 57,525 61,226 65,510 70,095 75,000 80,160 NOTES: 2015 population was obtained from the Department of Finance population projections are obtained from the City's draft General Plan Update population projection are extrapolated based on a 1.34% growth rate which is consistent with the assumptions used in the Draft General Plan Update Other Demographic Factors The City serves a primarily residential and commercial area. The City completed implementation of its Water Metering Program in 2014 and thus water customers are billed based on consumptive water use. The City s single family residential and commercial users have been fully metered since 2012 and multi-family and parks since This awareness in water use has led to more individual water conservation. The City has substantial agriculture basis in its economy. The City is surrounded on all sides by agricultural land producing corn, tomatoes, alfalfa, sugar beets, safflower, and wheat. Also, several companies in the City carry out significant seed research and development work. The local groundwater basin s natural recharge is supplemented by percolating irrigation water imported for farming surrounding the City s service area. June 2016 n\c\204\ \wp\uwmp\112315_3ch3 3-4 City of Woodland 2015 Urban Water Management Plan
31 CHAPTER 4 System Water Use This chapter describes and quantifies the City s past, current, and projected water use. Water demand projections are based on the selected SBX 7-7 water use targets combined with the population projections from the City s draft General Plan. Accurately tracking and reporting current water demands allows the City to properly analyze the use of their resources and conduct good resource planning. As described in Chapter 3, the City s water service area is mostly residential, metered accounts. 4.1 RECYCLED VERSUS POTABLE AND RAW WATER DEMAND The City currently provides only potable water to its customers. Potable water is water that is safe to drink and which typically has had various levels of treatment and disinfection. Raw water is untreated water that is used in its natural state or with minimal treatment. The City does not deliver raw water to any customers in its service area. However, the City plans on implementing raw water use for park irrigation in the future. Recycled water is municipal wastewater that has been treated to a specified quality to enable it to be used again. Because recycled water demand is highly dependent on its level of treatment, recycled water demand is more selective than potable or raw water demand. The City does not currently deliver recycled water to any customers in its service area. However, the City is planning to implement a recycled water program in the future to ease demand on potable water for uses that do not require a drinking standard of water. Further discussion of the recycled water program can be found in Chapter 6. A complete description of the City s water supplies is provided in Chapter WATER USES BY SECTOR This section describes the City s past, current and projected water use by sector through the year 2040 in five-year increments. Water demand projections are based on the selected SB X 7-7 water use targets combined with City s draft General Plan projected population for the service area. Demand projections provide the basis for sizing and staging future water facilities to ensure adequate supply. This section identifies the usage among water use sectors including single-family residential, multifamily residential, commercial, industrial, institutional/governmental, and landscape. These classifications were used to analyze current consumption patterns among various types of customers. The City uses the same definitions for each sector as outlined in the DWR 2015 Guidebook: Single-Family Residential: A single-family dwelling unit A lot with a free-standing building containing one dwelling unit that may include a detached secondary dwelling. Multi-Family: Multiple dwelling units contained within one building or several buildings within one complex. Commercial: A water user that provides or distributes a product or service. June 2016 n\c\204\ \wp\uwmp\112315_4ch4 4-1 City of Woodland 2015 Urban Water Management Plan
32 Chapter 4 System Water Use Industrial: A water user that is primarily a manufacturer or processor of materials as defined by the North American Industry Classification (NAICS) code sectors 31 to 33, inclusive, or an entity that is a water user primarily engaged in research and development. Institutional/Governmental: A water user dedicated to public service. Landscape: Water connections supplying water solely for landscape irrigation. Groundwater Recharge: Water used for groundwater replenishment, banking or storage. Distribution System Losses: Distribution system water losses (also known as real losses ) are the physical water losses from the water distribution system and the supplier s storage facilities, up to the point of customer consumption. Actual water use by the City s customers, by water use sector, in 2005 and 2010 is summarized in Table 4-1. Because the metering program was not yet complete in 2010, past water use is based on groundwater well production records. These are the same values reported in the City s 2010 UWMP. Table 4-1. Historical Water Use by Customer Type, AFY Water Use Type 2005 Actual Volume 2010 Actual Volume Single-Family 3 1,651 Multi-Family 753 1,147 Commercial 952 1,345 Industrial Institutional/ Governmental Landscape 3,759 1,088 Unmetered Production (a) 9,316 8,194 Total 15,257 13,922 AFY = acre feet per year (a) The City became fully metered in Therefore, water use in 2005 and 2010 include a category for unmetered production. Actual water use by the City s customers, by water use sector, in 2015 is summarized in Table 4-2 (DWR Table 4-1). Currently there are no existing uses of saline barriers, groundwater recharge, conjunctive use, or raw water within the City s service area. June 2016 n\c\204\ \wp\uwmp\112315_4ch4 4-2 City of Woodland 2015 Urban Water Management Plan
33 Chapter 4 System Water Use Table 4-2. Retail: Demands for Potable and Raw Water Actual (DWR Table 4-1) Use Type 2015 Actual Additional Description (as needed) Level of Treatment When Delivered Volume Single Family Drinking Water 3,959 Multi-Family Drinking Water 1,315 Commercial Drinking Water 1,321 Industrial Drinking Water 596 Institutional/Governmental Drinking Water 344 Landscape Drinking Water 623 Losses Drinking Water 485 Other Metered unbilled and unmetered unbilled Drinking Water 7 TOTAL 8,650 NOTES: Volumes are in AF. Use type Other accounts for metered unbilled and unbilled unmetered water use in the City's system for Water demand projections are based on population projections and the SB X7-7 targets for the City s service area. Given that the City is dominated by residential/commercial water use, the rate of City population growth is a good measure for assessing future water use. Population projections for the City s service area were obtained from the draft General Plan (described in Chapter 3). The water use projections for 2020 through 2040 assume that the City will achieve its 2020 water use target (232 gallons per capita per day (GPCD)). The projected water use by the City s customers is based on the best available information. The City tracked actual water use by sector in 2015 through its metering program. It is expected that the distribution of water by water user type will not change significantly in the future and, therefore, the percentage of each customer classification that existed in 2015 was assumed to remain constant through However, the projected industrial water use was reduced by 800 AFY to account for anticipated recycled water use. The City is in the process of planning delivery of recycled water to an industrial water use customer. The preliminary estimate of 800 FY was removed from the projected demands since the 2020 water use target does not include a recycled water component. Table 4-3 (DWR Table 4-2) reports the projected water demands, by use type, through the year June 2016 n\c\204\ \wp\uwmp\112315_4ch4 4-3 City of Woodland 2015 Urban Water Management Plan
34 Chapter 4 System Water Use Table 4-3. Retail: Demands for Potable and Raw Water Projected (DWR Table 4-2) Use Type opt Single Family 7,355 7,870 8,421 9,010 9,630 Multi-Family 2,443 2,614 2,797 2,993 3,199 Commercial 2,454 2,625 2,809 3,006 3,212 Industrial Additional Description (as needed) Reduced due to recycled water Institutional/Governmental Landscape 1,158 1,239 1,326 1,419 1,517 Losses TOTAL Projected Water Use Report To the Extent that Records are Available 15,111 16,224 17,417 18,692 20,033 NOTES: Volumes are in AF. Industrial demands have been reduced by 800 AF based on planned recycled water supply to the Woodland BioMass customer. Table 4-4 (DWR Table 4-3) summarizes the actual and projected total water demands reported in Tables 4-2 and 4-3 (DWR Tables 4-1 and 4-2) and the recycled water demands reported in Table 6-6 (DWR Table 6-4). Table 4-4. Retail: Total Water Demands (DWR Table 4-3) Potable and Raw Water From Tables 4-1 and 4-2 Recycled Water Demand* From Table (opt) 8,650 15,111 16,224 17,417 18,692 20, TOTAL WATER DEMAND 8,650 15,911 17,024 18,217 19,492 20,833 NOTES: Volumes are in AF. Recycled water demands are based on projected water use for Woodland BioMass customer and park irrigation needs. Potable and raw water demand projections are calculated based on projected population and 2020 target GPCD as calculated using DWR methodologies for SBX DISTRIBUTION SYSTEM WATER LOSSES System losses are the difference between the actual volume of water treated and delivered into the distribution system and the actual metered consumption. Such apparent losses are always present in a water system due to pipe leaks, unauthorized connections or use; faulty meters; unmetered services such as fire protection and training, and system and street flushing. June 2016 n\c\204\ \wp\uwmp\112315_4ch4 4-4 City of Woodland 2015 Urban Water Management Plan
35 Chapter 4 System Water Use The City uses the American Water Works Association (AWWA) method to annually evaluate its distribution system losses. For the 2015 calendar year, the City s water losses were estimated to be approximately 485 AF, or approximately 5.6 percent of their demand. A copy of the City s 2015 Water Audit worksheet is provided in Appendix E. Table 4-5 (DWR Table 4-4) summarizes the monthly system losses for the most recent 12-month period available. The most recent 12 month period began on January 1, Table 4-5. Retail: 12 Month Water Loss Reporting (DWR Table 4-4) Reporting Period Start Date Volume of Water Loss* 01/ * Taken from the field "Water Losses" (a combination of apparent losses and real losses) from the AWWA worksheet. NOTES: Volumes are in AF. 4.4 ESTIMATING FUTURE WATER SAVINGS The DWR 2015 Guidebook suggests that urban water suppliers consider the passive savings from codes, standards, ordinances, or transportation and land use plans. Such water savings decrease the water use for new and future customers. For the purposes of this 2015 UWMP, the City has opted not to include analysis of passive savings, as indicated in Table 4-7 (DWR Table 4-5). However, the City s Municipal Code requires energy efficient water heaters, which indirectly helps save water, and updated water-efficient water fixtures when bathroom or kitchen remodels occur. The City also anticipates future water savings by implementing its landscape ordinance which includes complying with the state's Model Water Efficient Landscape Ordinance (MWELO) enacted pursuant to California Code of Regulations Title 23, Waters, Division 2, DWR, Chapter 2.7, Model Water Efficient Landscape Ordinance. MWELO is intended to reduce water consumption of landscapes while also enhancing aesthetic appearances and protecting the public by minimizing visual pollution and soil erosion. Examples of features that can reduce the demand for water include: low water using plants, nonliving ground cover, permeable paving, and updated water conserving irrigation techniques. The City will continue to update the City s Municipal Code to comply with state ordinances in the future. 4.5 WATER USE FOR LOWER INCOME HOUSEHOLDS SB 1087 (approved on October 7, 2005 added certain provisions to the Government Code and amended a portion of the UWMP Act. As it relates to the UWMP Act, SB 1087 requires the water use projections of an UWMP to include the projected demands for single-family and multi-family residential housing needed for lower income households as identified in the housing element of any city or county in the service area of the supplier (CWC 10631(a).) A low income household is any household that has an income below 80 percent of the area median income, adjusted for family size. June 2016 n\c\204\ \wp\uwmp\112315_4ch4 4-5 City of Woodland 2015 Urban Water Management Plan
36 Chapter 4 System Water Use The City is a member of Sacramento Area Council of Governments (SACOG) and participates in the Regional Housing Needs Plan (RHNP) which allocates participating cities and counties their fair share of the region s projected housing needs. The RHNP is updated every five years and provides the housing units that a city or county must plan for within a 7.5-year time period. The SACOG RHNP was adopted September 20, This information is used by cities and counties to update their General Plan Housing Elements. The City adopted its 2013 Housing Element Update on October 15, 2013, and the number of existing lower income households within the City is a part of the update. Table 4-6 shows projected demands for low income housing based on estimates by the adopted RHNP. Table 4-6. Projected Water Demand for Low Income Households Low Income Water Demands Single-Family Residential 1,052 1,685 1,803 1,929 2,064 Multi-Family Residential (a) Volumes are in AF Total 1,168 1,871 2,002 2,142 2,292 (b) 2013 SACOG RHNP estimates 35.4 percent of Woodland's population has either Low or Very Low Income. This percentage was applied directly to the projected water demands for an estimation. Table 4-7 (DWR Table 4-5) addresses whether or not future water savings estimates and lower income residential demands are included in water demand projections. Table 4-7. Retail Only: Inclusion in Water Use Projections (DWR Table 4-5) Are Future Water Savings Included in Projections? (Refer to Appendix K of UWMP Guidebook) Are Lower Income Residential Demands Included In Projections? No Yes 4.6 CLIMATE CHANGE IMPACTS TO DEMAND DWR 2015 Guidebook suggests that urban water suppliers consider the potential effects related to climate change in their 2015 UWMPs, though it should be noted that there are currently no specific requirements related to addressing the potential impacts of climate change. Because the City has not completed any studies regarding the impacts of climate change on system water demands, the City has decided to not complete this section for this 2015 UWMP. June 2016 n\c\204\ \wp\uwmp\112315_4ch4 4-6 City of Woodland 2015 Urban Water Management Plan
37 CHAPTER 5 SB X7-7 Baselines and Targets In November 2009, SB X7-7, The Water Conservation Act of 2009, was signed into law by Governor Arnold Schwarzenegger as part of a comprehensive water legislation package. The Water Conservation Act addresses both urban and agricultural water conservation. The legislation sets a goal of achieving a 20 percent statewide reduction in urban per capita water use by the year 2020 (i.e., 20 by 2020 ), and directs urban retail water suppliers to establish an interim per capita water use target to be met by 2015 and a final per capita water use target to be met by The City s compliance with SB X7-7 was first addressed in the City s 2010 UWMP. The City s baseline per capita water use was determined, and urban water use targets for 2015 and 2020 were established and adopted. SB X7-7 included a provision that an urban water supplier may update its 2020 urban water use target in its 2015 UWMP, and may use a different target method than was used in Also, the SB X7-7 methodologies developed by DWR in 2011 noted that water suppliers may revise population estimates for baseline years when the 2010 Census information became available (as described below, the 2010 Census data was not finalized until 2012). The DWR 2015 Guidebook indicates that there were significant discrepancies between the CDoF estimated 2010 population (based on 2000 U.S. Census data) and the actual 2010 population (based on 2010 U.S. Census data). Therefore, if a water supplier did not use 2010 Census data for their baseline population calculations in the 2010 UWMP, DWR has determined that these water suppliers must recalculate their baseline population for the 2015 UWMP using 2000 and 2010 Census data, and baseline and 2015 and 2020 urban water use targets must be modified accordingly. This chapter provides a review and update of the City s baseline per capita water use, 2015 interim per capita water use target, and 2020 final per capita water use target in accordance with the requirements described in the DWR 2015 Guidebook and based on the 2010 Census population data. The City calculated baselines and targets on an individual reporting basis in accordance with SBx7-7 legislation requirements and Methodologies for Calculating Baseline and Compliance Urban Per Capita Water Use (DWR, 2016). The City has achieved compliance with its 2015 interim target, as discussed below, and is well positioned to achieve its 2020 final target. Regional Alliance baselines and targets are discussed in Section 5.8. The SB X7-7 Verification Forms are included in Appendix F. 5.1 UPDATING CALCULATIONS FROM 2010 UWMP CWC (g) An urban retail water supplier may update its 2020 urban water use target in its 2015 urban water management plan required pursuant to Part 2.6 (commencing with Section 10610). Methodologies DWR 2011, Methodology 2 Service Area Population Page 27 - Water suppliers may revise population estimates for baseline years between 2000 and 2010 when 2010 census information becomes available. DWR will examine discrepancy between the actual population estimate and DOF s projections for 2010; if significant discrepancies are discovered, DWR may require some or all suppliers to update their baseline population estimates. DWR 2015 Guidebook, Required Use of 2010 U.S. Census Data page 5-5 if an agency did not use 2010 Census data for their baseline population calculations in the 2010 UWMP DWR has determined that these agencies must recalculate their baseline populations for the 2015 UWMPs using 2000 and 2010 Census data. This may affect the baseline and target GPCD values calculated in the 2010 UWMP, which must be modified accordingly in the 2015 UWMP. June 2016 n\c\204\ \wp\uwmp\112315_5ch5 5-1 City of Woodland 2015 Urban Water Management Plan
38 Chapter 5 SB X7-7 Baselines and Targets Population data from the 2010 United States Census were not made available until 2012, after the City submitted its 2010 UWMP. Therefore, the City updated population, baselines, and targets for this 2015 UWMP to reflect 2010 Census data. The following sections describe these updates. 5.2 BASELINE PERIODS SB X7-7 requires each urban water retailer to determine their baseline daily per capita water use, measured in gallons per capita per day (Baseline GPCD), over a 10-year or 15-year baseline period. The 10-year baseline period is defined as a continuous 10 year period ending no earlier than December 31, 2004 and no later than December 31, SB X7-7 also defines that for those urban water retailers that met at least 10 percent of their 2008 water demand using recycled water, the urban water retailer can extend the Baseline GPCD calculation for a maximum of a continuous 15 year baseline period, ending no earlier than December 31, 2004 and no later than December 31, In 2008, the City met 0 percent of demand using recycled water. SB X7-7 also requires each urban water retailer to determine a 5 year baseline per capita water demand, which DWR calls the Target Confirmation, calculated over a continuous 5 year period ending no earlier than December 31, 2007 and no later than December 31, Based on these requirements, the City has selected the following baseline periods: 10-year Baseline Period: year Baseline Period: These baseline periods are listed in SB X7-7 Table 1 in Appendix F. It should be noted that the 10-year and 5-year periods are the same as reported in the City s 2010 UWMP. 5.3 SERVICE AREA POPULATION DWR 2015 Guidebook, Required Use of 2010 U.S. Census Data page 5-5 if an agency did not use 2010 Census data for their baseline population calculations in the 2010 UWMP DWR has determined that these agencies must recalculate their baseline populations for the 2015 UWMPs using 2000 and 2010 Census data. This may affect the baseline and target GPCD values calculated in the 2010 UWMP, which must be modified accordingly in the 2015 UWMP. This section includes a discussion of the City s service area population including 2000 and 2010 U.S. Census data. Population reported in the City s 2010 UWMP did not include 2010 U.S. Census data because the full Census data set was not available until The CDoF uses U.S. Census data, combined with changes to the housing stock, estimated occupancy of housing units, and the number of persons per household to estimate annual population within jurisdictional boundaries. CDoF population estimates, corrected to account for 1990, 2000, and 2010 Census data, were used to estimate service area population. The City s service is completely within the City limits and therefore, CDoF population estimates are used. The population estimate is included in the SB X7-7 Verification Tables in Appendix F. June 2016 n\c\204\ \wp\uwmp\112315_5ch5 5-2 City of Woodland 2015 Urban Water Management Plan
39 Chapter 5 SB X7-7 Baselines and Targets 5.4 GROSS WATER USE Annual gross water use is the water that enters the City s distribution system over a 12-month period (calendar year) with certain exclusions. This section discusses the City s annual gross water use for each year in the baseline periods, as well as 2015, in accordance with Methodology 1: Gross Water of DWR s Methodologies document. CWC (g) Gross Water Use means the total volume of water, whether treated or untreated, entering the distribution system of an urban retail water supplier, excluding all of the following: (1) Recycled water that is delivered within the service area of an urban retail water supplier or its urban wholesale water supplier (2) The net volume of water that the urban retail water supplier places into long term storage (3) The volume of water the urban retail water supplier conveys for use by another urban water supplier (4) The volume of water delivered for agricultural use, except as otherwise provided in subdivision (f) of Section California Code of Regulations Title 23 Division 2 Chapter 5.1 Article Section 596 (a) An urban retail water supplier that has a substantial percentage of industrial water use in its service area is eligible to exclude the process water use of existing industrial water customers from the calculation of its gross water use to avoid a disproportionate burden on another customer sector Annual gross water use for the baseline periods and 2015 are summarized in SB X7-7 Table 4 in Appendix F. The baseline gross water use values reported in Appendix F are the same as documented in the City s 2010 UWMP. 5.5 BASELINE DAILY PER CAPITA WATER USE As indicated above, daily per capita water use is reported in GPCD. Annual gross water use is divided by annual service area population to calculate the annual per capita water use for each year in the baseline periods. As discussed above, the City has used updated population data in this 2015 UWMP. The City s baseline daily per capita use has been calculated as follows: 10-year Base Daily Per Capita Water Use 290 GPCD (for the period from 1995 to 2004) This value is 1 GPCD greater than the value calculated in the 2010 UWMP (289 GPCD) 5-year Base Daily Per Capita Water Use 277 GPCD (for the period from 2003 to 2007) This value is 5 GPCD greater than the value calculated in the 2010 UWMP (272 GPCD) These values are shown in SB X7-7 Table 5 in Appendix F. June 2016 n\c\204\ \wp\uwmp\112315_5ch5 5-3 City of Woodland 2015 Urban Water Management Plan
40 Chapter 5 SB X7-7 Baselines and Targets AND 2020 TARGETS SB X7-7 requires a state-wide average 20 percent reduction of urban per capita water use by the year Therefore, the City must set an interim (2015) water use target and a final (2020) water use target using one of four methods defined by SB X7-7 and DWR. Three of these methods are defined in CWC Section (a)(1), and the fourth method was later developed by DWR. The 2020 water use target is calculated using one of the following four methods: Method 1: 80 percent of the City s base daily per capita water use; Method 2: Per capita daily water use estimated using the sum of performance standards applied to indoor residential use; landscaped area water use; and commercial, industrial, and institutional uses; Method 3: 95 percent of the applicable State hydrologic region target as stated in the State s Draft 20x2020 Water Conservation Plan (April 30, 2009); and Method 4: An approach that considers the water conservation potential from (1) indoor residential savings, (2) metering savings, (3) commercial, industrial and institutional savings, and (4) landscape and water loss savings. Analysis of Methods 1 and 3 were completed. The calculated 2020 target using Method 1 is 232 GPCD. The 2020 target using Method 3 is 167 GPCD (100 percent of Hydrologic Region 5 - Sacramento River 2020 Target of 176 GPCD). Methods 2 and 4 require specific data which were not available, so those two methods were not considered. Target Method 1 results in the highest allowable SB X7-7 final (2020) target (232 GPCD by 2020), and would therefore be most favorable to the City. The 2015 interim targets for each of the target methods are calculated based on the midpoint of the City s 10-year Base Daily Per Capita Water Use and the 2020 targets calculated for each of the respective target methods. The 2015 interim target is the midpoint between the City s 10-Year Base Daily Per Capita Water Use (290 GPCD) and the final 2020 target (232 GPCD). Therefore, the City s interim 2015 target is 261 GPCD. Urban water suppliers must verify that their 2020 final water use target is at least a 5 percent reduction from the 5-year baseline GPCD. As shown in SB X7-7 Table 7F in Appendix F, the City s maximum 2020 target is 264 GPCD (95 percent of the City s 5-year base daily per capita water use of 277 GPCD). The City s Method target of 232 GPCD complies with the minimum reduction. The City s interim and final targets are summarized in Table 5-1 (DWR Table 5-1). June 2016 n\c\204\ \wp\uwmp\112315_5ch5 5-4 City of Woodland 2015 Urban Water Management Plan
41 Chapter 5 SB X7-7 Baselines and Targets Table 5-1. Baselines and Targets Summary (DWR Table 5-1) Baseline Period Start Year End Year Average Baseline GPCD* 2015 Interim Target * Confirmed 2020 Target* year Year *All values are in Gallons per Capita per Day (GPCD) For this 2015 UWMP, the City has selected Target Method 1, as was used in the 2010 UWMP. The confirmed final 2020 target of 232 GPCD is only one GPCD greater than the final 2020 target included in the 2010 UWMP. Therefore, the confirmed interim 2015 target of 261 GPCD is also one GPCD greater than the interim 2015 target reported in the 2010 UWMP. The City understands that the target method and resulting targets may not be changed in any amendments to the 2015 UWMP or in the 2020 UWMP COMPLIANCE DAILY PER CAPITA WATER USE (GPCD) The City has calculated its actual 2015 water use for the 2015 calendar year in accordance with Methodology 4 of DWR s Methodologies document. As shown in Table 5-2 (DWR Table 5-2), urban per capita water use in 2015 was 133 GPCD, which is below the 2015 interim water use target of 261 GPCD. Therefore, the City has met its interim 2015 water use target. The complete set of SB X7-7 verification tables used to document this compliance is included in Appendix F. Table Compliance (DWR Table 5-2) Actual 2015 GPCD* 2015 Interim Target GPCD* Extraordinary Events* Optional Adjustments to 2015 GPCD From Methodology 8 Economic Adjustment* Weather Normalization* TOTAL Adjustments* Adjusted 2015 GPCD* 2015 GPCD* (Adjusted if applicable) Did Supplier Achieve Targeted Reduction for 2015? Y/N Yes *All values are in Gallons per Capita per Day (GPCD) As detailed in DWR s Methodologies document, there are allowable adjustments that can be made to an agency s gross water use in 2015 for unusual weather, land use changes, or extraordinary institutional water use. The City has elected not to make the adjustments allowed by CWC Section because these exceptions are not needed to demonstrate compliance with SB X REGIONAL ALLIANCE The City has chosen to comply with the requirements of SB X7-7 on an individual basis. The City has elected not to participate in a regional alliance. June 2016 n\c\204\ \wp\uwmp\112315_5ch5 5-5 City of Woodland 2015 Urban Water Management Plan
42 (THIS PAGE LEFT BLANK INTENTIONALLY)
43 CHAPTER 6 System Supplies This chapter describes the water supplies currently available to the City, as well as future anticipated water supplies. The City currently only utilizes local groundwater. Projected future supplies include surface water from the Sacramento River, aquifer storage and recovery (ASR), and recycled water. 6.1 PURCHASED OR IMPORTED WATER The City pumps groundwater for municipal supply from wells that it owns and operates. The City does not currently purchase or import water from any other water supply or entity. However, the City, as a member of the WDCWA, will receive up to 18 million gallons per day (MGD) (55 AF/day) of treated surface water from the Sacramento River. The City will begin receiving this purchased surface water in mid Some of this treated surface water will be distributed directly to customers and a portion will be stored in the aquifer during low water demand months and recovered and distributed to customers during high water demand months under the City s ASR program. 6.2 GROUNDWATER The City currently relies entirely on groundwater to meet all system water demands. The City currently maintains 19 municipal supply wells. Three wells have recently been taken out of service to ensure continued compliance with drinking water quality requirements for nitrate. In addition, the groundwater from many of the City s wells does not meet the new standard for chromium VI (Cr 6). Cr 6 concentrations in the City s wells have ranged from 1 to 29 µg/l and averaged of approximately 17 µg/l. The current public health goal (PHG) for Cr 6 is 0.02 µg/l and the California Maximum Contaminant Level (MCL) is 10 µg/l. The Cr 6 MCL became effective on July 1, Senate Bill 385, requires compliance with the Cr 6 MCL at the earliest feasible date prior to January 1, 2020 (State Water Resources Control Board, 2016). Naturally-occurring salinity, boron, and selenium in groundwater also present the City with challenges in complying with wastewater discharge requirements. The introduction of surface water addresses the compliance issues associated with groundwater. The City is in the process of transferring to surface water as its primary supply, with ASR being used to supplement direct delivery of treated surface water to customers. Native groundwater will be blended with the surface water supply on a limited basis. Groundwater will also be used as an emergency supply source Basin Description The City of Woodland is located in the Yolo Sub-basin (Sub-basin ) of the Sacramento Valley Groundwater Basin as defined in the California DWR Bulletin 118 update (DWR, 2003). The DWR Bulletin 118 description of the Yolo Subbasin is provided in Appendix G and summarized in the following sections. Figure 6-1 shows the location of the City in relation to the boundaries of other local agencies overlying the groundwater basin areas. The Yolo Sub-basin is bounded by Cache Creek on the north; the Sacramento River on the east; Putah Creek on the south; and the Coast Range on the west (DWR, 2004). June 2016 n\c\204\ \wp\uwmp\112315_6ch6 6-1 City of Woodland 2015 Urban Water Management Plan

44 Chapter 6 System Supplies June 2016 n\c\204\ \wp\uwmp\112315_6ch6 6-2 City of Woodland 2015 Urban Water Management Plan
45 Chapter 6 System Supplies Land surface elevations within the Yolo Subbasin range from approximately 0 feet above sea level along the southeastern edge to approximately 400 feet along the western edge. Except near the western edge of the basin, where land surface elevations increase with proximity to the Coast Range, the topographic relief is low. Land surface elevations within the City service area range from approximately 30 to 80 feet. The Plainfield Ridge, the topographic expression of the Dunnigan Hills anticline, is an area of slightly elevated rolling hills located approximately four miles west of Woodland. The Yolo Basin, the flood basin of the Sacramento River, is located approximately three miles east of Woodland (Figure 6-1). The Yolo Subbasin, which includes the groundwater basin underlying the City, has documented groundwater issues, including inelastic land subsidence due to groundwater withdrawal and water quality concerns, as described above Aquifer Formations The Sacramento Valley in the vicinity of the City of Woodland is filled by a thick sequence of marine sedimentary rock of Late Jurassic (159 million years (my) before present) to Eocene (34 my) age, unconformably overlain by a relatively thin sequence of continental sedimentary deposits of Pliocene (5 my) and younger age (Harwood and Helley, 1987). A generalized geologic cross section for the Sacramento Valley is shown in Figure 6-2. Figure 6-2. Generalized Sacramento Valley Geologic Cross Section Coast Range West Woodland Tehama Formation Base of Fresh Water Shallow marine deposits Sacramento River Sierra Nevada Pleistocene and Holocene deposits Laguna Formation Igneous and Metamorphic rocks East 0 Miles Sea Level Elevation, ft Source: California Department of Water Resources, 1978 The older, deeper marine rocks contain saline water. The freshwater aquifers in the vicinity of the City occur in the overlying continental sedimentary deposits. Shallow groundwater in the Woodland area occurs under unconfined conditions in the Holocene stream channel deposits, except where these units are overlain by Holocene Basin Deposits, creating confined conditions (DWR, 1978). At greater depths, groundwater occurs under mostly semiconfined to confined conditions in a single heterogeneous aquifer system, composed of predominantly fine-grained sediments enclosing discontinuous lenses of sand and gravel. The aquifer properties, including hydraulic conductivity, vertical leakance and degree of confinement are dependent on the properties of the fine grained units (Williamson, et. al., 1989; Bertoldi, et. al., 1991). The geologic formations comprising the freshwater aquifer are discussed from oldest to youngest in the following sections. June 2016 n\c\204\ \wp\uwmp\112315_6ch6 6-3 City of Woodland 2015 Urban Water Management Plan
46 Chapter 6 System Supplies Tehama Formation The Tehama Formation consists of up to 2,500 feet of moderately compacted silt, clay, and silty fine sand enclosing thin, discontinuous lenses of sand and gravel, silt and gravel deposited in a fluvial (river-borne) environment. The permeability of the Tehama Formation is highly variable but generally less than the overlying Quaternary alluvium. Because of the relatively large thickness, wells can yield up to several thousand gpm (DWR, 2004). The majority of irrigation and public supply wells in the Woodland area are completed in the Tehama Formation (DWR, 2004) Riverbank and Modesto Formations The Tehama Formation is overlain by the late Pleistocene age Riverbank and Modesto Formations. These formations consist of up to 200 feet of loose to moderately compacted silt, silty clay, sand and gravel deposited in alluvial depositional environments during periods of world-wide glaciation (Lettis, 1988; Weissmann, et. al., 2002; DWR, 2004). Wells penetrating the sand and gravel units of the Riverbank and Modesto Formations produce up to about 1,000 gpm (DWR, 2004). The majority of the domestic wells in the Woodland area are completed in the Riverbank and Modesto Formations (DWR, 2004) Holocene Stream Channel and Basin Deposits Holocene stream channel and basin deposits are the youngest sediments in the region, with ages of 10,000 years or less. The stream channel deposits consist of up to 80-foot sections of unconsolidated clay, silt, sand and gravel reworked from older formations by streams. Because of their low permeability, limited extent, and general poor water quality, Holocene flood basin deposits are typically not used for groundwater production (DWR, 2004) Groundwater Management The City adopted a Groundwater Management Plan (GMP) on March 15, 2011 (West Yost, 2011). This GMP was developed in coordination with the other local agencies with adopted plans and other basin stakeholders. Public participation was sought during the development of this plan, and the adopted version of the GMP reflects input received from members of the public. An Executive Summary of the GMP is available through the City s website: filebank/blobdload.aspx?blobid=9881) Sustainable Groundwater Management Act The Sustainable Groundwater Management Act of 2014 (SGMA) was passed in September 2014 as a three-bill legislative package composed of AB 1739 (Dickinson), SB 1168 (Pavley), and SB 1319 (Pavley). The legislation provides a framework for sustainable management of groundwater supplies by local authorities, with a limited role for state intervention when necessary to protect the resource. The legislation lays out a process and a timeline for local authorities to achieve sustainable management of groundwater basins. It also provides tools, authorities and deadlines to take the necessary steps to achieve the goal. For local agencies involved in implementation, the requirements are significant and can be expected to take years to accomplish. The State Water Resources Control Board may intervene if local agencies do not form a June 2016 n\c\204\ \wp\uwmp\112315_6ch6 6-4 City of Woodland 2015 Urban Water Management Plan
47 Chapter 6 System Supplies Groundwater Sustainability Agency (GSA) and/or fail to adopt and implement a Groundwater Sustainability Plan (GSP). The SGMA implementation steps and deadlines are shown in Table 6-1. Table 6-1. Sustainable Groundwater Management Act Implementation Steps and Deadlines Implementation Step Step One Step Two Step Three Implementation Measure Local agencies must form local GSAs within two years Agencies in basins deemed high- or medium-priority must adopt GSPs within five to seven years, depending on whether a basin is in critical overdraft Once plans are in place, local agencies have 20 years to fully implement them and achieve the sustainability goal June 30, 2017 Deadlines January 31, 2020 for critically overdrafted basins January 31, 2022 for high- and medium-priority basins not currently in overdraft January 31, 2040 for critically overdrafted basins January 31, 2042 for high- and medium-priority basins not currently in overdraft SGMA applies to basins or subbasins designated by the DWR as high or medium priority basins, based on a statewide ranking that uses criteria including population and extent of irrigated agriculture dependent on groundwater. The final Basin Prioritization findings indicate that 127 of California's 515 groundwater basins and subbasins are high and medium priority basins. These high and medium priority basins account for 96 percent of California s annual groundwater pumping and supply 88 percent of the population which resides over the groundwater basins. The ranking for the Yolo sub-basin of the Sacramento Valley groundwater basin is shown in Table 6-2. As shown, the Yolo basin has been ranked as a high priority basin. Table 6-2. Groundwater Basin Prioritization for Sustainable Groundwater Management Act (a) Rank (b) Basin Number Basin Name Sacramento Valley/Yolo Sub-basin (a) CASGEM Groundwater Basin Prioritization Results, run version May 26, (b) Out of a total of 515 basins, of which 127 were high- or medium-priority basins. Overall Basin Ranking Score Overall Basin Priority 22.3 High New requirements for groundwater management under SGMA do not apply to this 2015 UWMP, but will be addressed in the 2020 UWMP. June 2016 n\c\204\ \wp\uwmp\112315_6ch6 6-5 City of Woodland 2015 Urban Water Management Plan
48 Chapter 6 System Supplies Overdraft Conditions The Yolo Sub-basin is neither adjudicated nor in overdraft. Generally, groundwater flow is from the margins of the Sacramento Valley toward the Sacramento River and then southward towards the Sacramento-San Joaquin Delta. Groundwater pumping in several areas has created cones of depression that disrupt this pattern. Historically, groundwater elevations in the region have ranged from roughly -20 feet to 50 feet above mean sea level (msl). In the vicinity of Woodland, the base of fresh groundwater occurs at a depth of approximately 2,500 feet below msl, implying that the fresh water aquifer is about 2,500 feet thick (DWR, 1978). Groundwater elevation measurements have been recorded in the Woodland area for over 50 years and are available through the DWR Water Data Library at The historical records show that groundwater elevations declined through the 1950s and 1970s. Groundwater elevations increased thereafter, in response to regional water supply projects implemented by Yolo County Flood Control and Water Conservation District. Groundwater elevations have also fluctuated in response to changes in precipitation. The area experienced multiple years of below normal precipitation in 1976 through 1977 and 1987 through 1991 and more recently in 2007 through 2008 and 2011 through Groundwater elevations in the fall of these drought years dropped significantly in relation to the average measurements. The maximum groundwater elevation measurements were recorded in spring 1983, the same year that the maximum annual precipitation was recorded. Inelastic land subsidence has been documented in the Woodland area, but the impacts since at least 1999 have been limited. Based on surveys conducted by the Yolo County Subsidence Monitoring Network, approximately one inch of subsidence occurred in the City service area between 1999 and 2008, the last year a repeat land subsidence benchmark survey was performed (West Yost, 2015). Adverse effects associated with inelastic land subsidence include reductions in groundwater aquifer storage capacity, modified surface drainage patterns, reduced flood protection, and damage to the City s facilities and other infrastructure. The City s efforts to implement the surface water supply project will substantially reduce its groundwater extractions and enhance regional efforts to maintain sustainable groundwater yield Historical Groundwater Pumping Groundwater pumping by the City over the last five years is summarized in Table 6-3 (DWR Table 6-1). As shown, the City currently relies 100 percent on groundwater. As described in this 2015 UWMP, the City will begin using treated surface water supplemented by ASR beginning in A limited amount of groundwater from three existing City wells will be blended with the surface water. The City will also maintain wells for emergency use and for landscape irrigation in City parks. June 2016 n\c\204\ \wp\uwmp\112315_6ch6 6-6 City of Woodland 2015 Urban Water Management Plan
49 Chapter 6 System Supplies Table 6-3. Retail: Groundwater Volume Pumped (DWR Table 6-1) Groundwater Type Location or Basin Name Alluvial Basin NOTES: Volumes are in AF. Yolo Subbasin of the Sacramento Valley Groundwater Basin TOTAL ,757 15,160 13,531 10,501 8, SURFACE WATER The City currently does not use surface water supplies to meet demands. However, the City is part of a joint powers authority along with the City of Davis (Davis) and the University of California at Davis (UCD) (referred to as the WDCWA) for a joint project that will provide surface water supply for use within each of their service areas to meet a portion of their respective water supply needs. The new surface water supply will be integrated into a conjunctive use program, with surface water serving as the City s primary water supply beginning in mid-2016, and groundwater being used to help meet summer peak and emergency demands. The new surface water supply will be limited during dry periods, and ASR and native groundwater pumping will be used in these periods to provide a larger portion of the water supply. The surface water supply will be conveyed from a Sacramento River intake shared with RD 2035, through untreated and treated-water conveyance pipelines, and delivered to a new regional water treatment plant (RWTF). Surface water diverted from the Sacramento River would consist of water appropriated for use by the WDCWA. The first phase of the surface RWTF is expected to be able to treat up to 33,600 AFY, with 20,160 AFY allocated to the City, beginning in mid Ultimately, the RWTF will be expanded to deliver 38,100 AFY, with 24,650 AFY allocated to the City. The expansion of the RWTF capacity to the ultimate size is expected to occur in The WDCWA water rights are described in more detail in Appendix H. The City s projected future surface water supplies in normal years are expected to be available in mid Additional discussion about the Davis Woodland Water Supply Project can be found in Chapter AQUIFER STORAGE AND RECOVERY With an objective of creating a reliable water system to meet the needs to the community, the City has developed an ASR program that will utilize constructed water infrastructure along with future surface water supplies to increase reliability. ASR wells include features that allow injection of treated surface water from the distribution system into the groundwater aquifer. This injection capability allows the City to take surface water sources that are available, treat it and then inject it into the aquifer for later use. June 2016 n\c\204\ \wp\uwmp\112315_6ch6 6-7 City of Woodland 2015 Urban Water Management Plan
50 Chapter 6 System Supplies The primary purpose of the ASR program is to provide a supplement to the surface water supply. The appropriative water right that enables diversion of water from the Sacramento River is limited by permit Term 91. Term 91 prohibits diversions whenever satisfaction of in basin entitlements requires releases of supplemental Project water by the Central Valley Project or the State Water Project. The State Board provides notification of curtailments under Term 91 as far in advance of the curtailment as practicable, based on information provided to the State Board by the Central Valley Project and State Water Project operators. Whether, and to what extent, Term 91 curtailments are imposed in a given year depends on hydrologic conditions, water demands of water right holders, water demands supporting environmental needs and water quality objectives in the Delta, and other factors. The ASR program enables storage of treated surface water in the aquifer during low-demand winter months, when Term 91 is typically not imposed, and recovery of the treated surface water during high demand summer months when Term 91 is more likely to be imposed. In 2014, the City received a permit from the Central Valley Regional Water Quality Control Board for testing of the ASR program. Since then, the City has constructed one ASR well and two more ASR wells are under construction (West Yost, 2015). 6.5 STORMWATER The City does not currently employ any active stormwater recovery measures, and does not have plans to do so. 6.6 WASTEWATER AND RECYCLED WATER For the purposes of this UWMP, recycled water is defined as municipal wastewater that has been treated and discharged from a wastewater facility for beneficial reuse. This section describes the City s projected collection, treatment, and distribution of recycled water. At the time of publication of this UWMP, the City was planning water facilities to deliver water to their first recycled water customer. Recycled water is expected to be delivered inside the service area by Recycled Water Coordination The Woodland Water Pollution Control Facility (WPCF) is responsible for the treatment and disposal of the City s municipal wastewater. The WPCF is owned and operated by the City. The City coordinates with departments and agencies in its recycled water planning Wastewater Collection, Treatment, and Disposal The City WPCF is located east of County Road 102 and Gibson Road. The WPCF was originally built in 1988 and was expanded in 1997, in 1999, and in The 2007 project upgraded the plant to provide tertiary level treatment. The site includes the WPCF, an overflow pond, and a series of ponds to the south receiving sludge and effluent. The area to the north of the WPCF used to be occupied by other treatment ponds. In 2010 these ponds were cleaned and re-purposed for a stormwater detention basin, the new WDCWA water treatment plant, and an area used for stockpiling stabilized biosolids prior to disposal. The WPCF is currently going through a retrofit project consists of replacing the existing aeration brushes with more energy efficient fine bubble diffusers and high-speed turbo blowers to convert the ditches to modified Ludzack-Ettinger June 2016 n\c\204\ \wp\uwmp\112315_6ch6 6-8 City of Woodland 2015 Urban Water Management Plan
51 Chapter 6 System Supplies process. The modified process requires adding selector zones, baffling, and mixers. These modifications will improve secondary process performance and settleability. The retrofit is anticipated to be complete in The WPCF serves all residential, commercial, and industrial users within the City s service area with the exception of a tomato processing plant which treats and discharges tomato wastes on lands directly to the east of the WPCF site. Operation of the WPCF must comply with treated effluent, receiving water, groundwater, and pond disposal limitations required under its existing National Pollutant Discharge Elimination System (NPDES) permit Number CA Under this permit, the plant is authorized to discharge up to 10.4 MGD average dry weather flow and an instantaneous peak flow of 15.6 MGD to the Tule Canal. Current flows are about half of this value (5 MGD). The permit was renewed in October of The City s Department of Public Works (DPW) Wastewater Operations group manages wastewater collection and treatment for the City s service area. The City s DPW owns 271 miles of sanitary sewer piping which service approximately 15,457 lateral connections. The WPCF collection system service area covers only areas within the City from a combination of residential and non-residential sources. A summary of the volume of wastewater processed at and discharged from the WPCF is provided in Table 6-4 (DWR Table 6-2) and Table 6-5 (DWR Table 6-3). Table 6-4. Retail: Wastewater Collected Within Service Area in 2015 (DWR Table 6-2) Name of Wastewater Collection Agency Wastewater Volume Metered or Estimated? Volume of Wastewater Collected from UWMP Service Area 2015 Name of Wastewater Treatment Agency Receiving Collected Wastewater City of Woodland Estimated 5,601 City of Woodland NOTES: Volumes are in AF. Percentage of 2015 service area covered by wastewater collection system (optional) Percentage of 2015 service area population covered by wastewater collection system (optional) Wastewater Collection Total Wastewater Collected from Service Area in 2015: 5,601 Recipient of Collected Wastewater Treatment Plant Name Water Pollution Control Facility Is WWTP Located Within UWMP Area? Yes Is WWTP Operation Contracted to a Third Party? (optional) No Table 6-5. Retail: Wastewater Treatment and Discharge within Service Area in 2015 (DWR Table 6-3) Wastewater Treatment Plant Name Water Pollution Control Facility Discharge Location Name or Identifier Tule Canal NOTES: Volumes are in AF. Discharge Location Description Large, unimproved channel Wastewater Discharge ID Number (optional) Method of Disposal River or creek outfall Does This Plant Treat Wastewater Generated Outside the Service Area? Treatment Level Wastewater Treated 2015 volumes Discharged Treated Wastewater Recycled Within Service Area Recycled Outside of Service Area No Tertiary 5,601 5, Total 5,601 5, June 2016 n\c\204\ \wp\uwmp\112315_6ch6 6-9 City of Woodland 2015 Urban Water Management Plan
52 Chapter 6 System Supplies Recycled Water System Currently, the tertiary treated wastewater is not being used as recycled water. Historically the treated wastewater has had high Electrical Conductivity (EC) in the effluent, which makes it unsuitable for beneficial agricultural or other beneficial use. EC indicates the amount of dissolved salts or salinity of water. An excess EC level can impact plant growth rate. A report titled City of Woodland Salinity Control and Minimization Workplan (NexGen Utilities Management, May 2009) examined the sources of salinity in City wastewater and determined salinity enters the system from three major sources: groundwater supplies; self-regenerating water softeners; and consumptive use. The DWWSP is expected to improve the quality of effluent by providing treated drinking water with a very low EC content and, thus, reducing the need for groundwater supplies and self-regenerating water softeners in the system. The City completed a Recycled Water Opportunities Evaluation in April 2014 to evaluate potential recycled water uses, regulatory issues, approximate costs, and benefits for areas near the WPCF and along the southwest water transmission pipeline routes. The evaluation with the detailed description is provided in Appendix I. The evaluation concluded that after the completion of the RWTF, effluent from the WPCF would be a good quality source of water for irrigation and industrial uses. The recycled water should be competitive in cost with potable water for irrigation use within City limits and with groundwater or surface water for agricultural irrigation reuse east and northeast of the WPCF. The recycled water would not be cost competitive with dedicated wells for properties west of the WPCF, but would provide higher quality water for crops and plants that are sensitive to boron. The City s first planned recycled water project includes an industrial user, Woodland Biomass, on the northeast side of town. The Woodland Biomass power generating plant is the City s largest potable water user. The power plant uses cooling water as part of its power generation operation. The City designed facilities needed to deliver recycled water to this customer for the cooling water process and reduce the amount of potable water used. This first phase is planned to begin delivering recycled water in late Recycled Water Beneficial Uses As stated above, the first planned recycled water project includes an industrial user on the northeast side of town with the first phase planned to begin delivering recycled water in late The City did not deliver any recycled water in However, the City does anticipate delivering recycled water in the future. The estimated amount of future recycled water use is summarized in Table 6-6 (DWR Table 6-4). June 2016 n\c\204\ \wp\uwmp\112315_6ch City of Woodland 2015 Urban Water Management Plan
53 Chapter 6 System Supplies Table 6-6. Retail: Current and Projected Recycled Water Direct Beneficial Uses Within Service Area (DWR Table 6-4) Name of Agency Producing (Treating) the Recycled Water: Name of Agency Operating the Recycled Water Distribution System: Supplemental Water Added in 2015 Source of 2015 Supplemental Water Woodland Water Pollution Control Facility (WPCF) The City of Woodland None Not Applicable Beneficial Use Type General Description of 2015 Uses Level of Treatment (opt) Agricultural irrigation 0 Landscape irrigation (excludes golf courses) 0 Golf course irrigation 0 Commercial use 0 Industrial use 0 Geothermal and other energy production Tertiary Seawater intrusion barrier 0 Recreational impoundment 0 Wetlands or wildlife habitat 0 Groundwater recharge (IPR)* 0 Surface water augmentation (IPR)* Direct potable reuse Other (Provide General Description) Total: *IPR - Indirect Potable Reuse NOTES: Volumes are in AF. Recycled water was not used in 2010 nor projected for use in Therefore, Table 6-7 (DWR Table 6-5) is blank. Table 6-7. Retail: 2010 UWMP Recycled Water Use Projection Compared to 2015 Actual (DWR Table 6-5) Recycled water was not used in 2010 nor projected for use in The supplier will not complete the table below. Use Type 2010 Projection for Actual Use Agricultural irrigation 0 0 Landscape irrigation (excludes golf courses) 0 0 Golf course irrigation 0 0 Commercial use 0 0 Industrial use 0 0 Geothermal and other energy production 0 0 Seawater intrusion barrier 0 0 Recreational impoundment 0 0 Wetlands or wildlife habitat 0 0 Groundwater recharge (IPR) 0 0 Surface water augmentation (IPR) 0 0 Direct potable reuse 0 0 Other Type of Use 0 0 Total 0 0 NOTES: Volumes are in AF. June 2016 n\c\204\ \wp\uwmp\112315_6ch City of Woodland 2015 Urban Water Management Plan
54 Chapter 6 System Supplies Actions to Encourage and Optimize Future Recycled Water Use As discussed above, the high EC of the current WPCF influent makes the use of recycled water unsuitable for agricultural and other beneficial uses within the City. However, once surface water has been integrated into the City s water supply sources, the EC levels are expected to decrease. The City has performed evaluations to look at the opportunities within their service area to deliver recycled water. The evaluation identified several potential recycled water users including industrial users, City parks, public schools, and agricultural users inside and outside the City Limits. To encourage and support future recycled water use, the City may consider the following future policies and programs with regard to recycled water use: Require new developments City-wide to install purple pipe for recycled water use on parks, common areas, roadway medians, etc.; Look for opportunities to install purple pipe near existing landscaped areas (e.g., parks, sports fields) (i.e., piggyback on other pipeline installation/replacement projects); Allow new development to create new supplies by participation in the implementation of recycled water facilities; and, Provide additional staff and program-specific financial resources required to implement/manage the future recycled water use program. On a long-term basis, the City will continue to explore recycled water use opportunities. The City s currently identified actions to deliver recycled water within their service area is summarized in Table 6-8 (DWR Table 6-6). Table 6-8. Retail: Methods to Expand Future Recycled Water Use (DWR Table 6-6) Name of Action Parks/ Landscape irrigation 2020 Industrial Customers Demand NOTES: Volumes are in AF. Description Retro-fit/new recycled water pipeline for landscape and parks Add industrial customer's based need/proximity to the recycled water pipeline Planned Implementation Year Expected Increase in Recycled Water Use Case Dependent Total DESALINATED WATER OPPORTUNITIES Because the City is not located in a coastal area, seawater desalination is not applicable to the City and is not considered a technically or economically feasible opportunity to explore. In addition, the groundwater that underlies the City is not brackish in nature and does not require desalination. As such, the City does not have any plans to incorporate desalinated or treated brackish water into its supply portfolio. June 2016 n\c\204\ \wp\uwmp\112315_6ch City of Woodland 2015 Urban Water Management Plan
55 Chapter 6 System Supplies 6.8 EXCHANGES OR TRANSFERS The City historically has not had the opportunity for transfer or exchanges of water supplies. The City and partners for the WDCWA are exploring options for future water transfer and exchange opportunities to supplement potential surface water reductions discussed in Chapter FUTURE WATER PROJECTS Future water supply project opportunities, including purchasing or importing water, further development of groundwater resources, and expansion of the City s ASR program are discussed below Surface Water Treatment Plant The City is a participant in the Davis-Woodland Water Supply Project (DWWSP), which is managed by the WDCWA. The DWWSP will deliver treated surface water to the City, and to two other participants (the City of Davis and the University of California, Davis) with water from the RWTF, which is scheduled to begin full-scale operations in June The City is entitled to no more than 20,160 AFY of RWTF capacity in Phase 1. The RWTF is anticipated to be expanded to full capacity in Phase 2 in 2035 which will provide the City with approximately 24,650 AFY. The City has provided WDCWA with these water use projections. The two main water rights the City will obtain surface water are the WDCWA water right permit and a set of secondary water rights obtained from the Conaway Preservation Group. Additional information on constraints for this water supply are included in Chapter Continued Groundwater Use The City plans to use groundwater as an emergency supply in the future and plans to maintain and replace groundwater wells as needed to meet all future demands for the near-term and provide a minimum emergency supply capacity in the future. The City will determine which wells provide the greatest benefit based on location, water quality, age, and reliability, and will maintain a minimum number of wells in order to supplement surface water for peak and emergency demand conditions. Groundwater supply well maintenance is ongoing, and the City will continue to monitor and evaluate its wells for water quality, production, and structural and operational reliability to ensure that near-term and future demands for groundwater are capable of being met ASR Wells As discussed previously, the City has invested in development of an ASR program that will utilize constructed water infrastructure along with future surface water supplies to increase reliability. ASR wells include features that allow injection of treated surface water from the distribution system into the groundwater aquifer. This allows the City to take surface water sources that are available, treat it and then inject it into the aquifer for later use. The primary purpose of the ASR program is to provide a supplement to the surface water supply. June 2016 n\c\204\ \wp\uwmp\112315_6ch City of Woodland 2015 Urban Water Management Plan
56 Chapter 6 System Supplies In 2014, the City received a permit from the Central Valley Regional Water Quality Control Board for testing of the ASR program. Since then, the City has constructed one ASR well and two more ASR wells are under construction (West Yost, 2015). The City has plans to build an additional two ASR wells in the future. Table 6-9 (DWR Table 6-7) summarizes the City s future water supply projects. Table 6-9. Retail: Expected Future Water Supply Projects or Programs (DWR Table 6-7) Name of Future Projects or Programs Joint Project with other agencies? Description (if needed) Planned Implementation Year Planned for Use in Year Type Expected Increase in Water Supply to Agency Woodland-Davis Clean Water Agency - Phase 1 Woodland-Davis Clean Water Agency - Phase 2 ASR Wells - Phase 1 ASR Wells - Phase 2 NOTES: Volumes are in AF. Yes Yes No No City of Davis, UC Davis City of Davis, UC Davis Surface water treatment plant Surface water treatment plant expansion Development of 3 ASR wells Development of 2 ASR wells 2016 All Year Types 20, All Year Types 24, Single-Dry and Multi-Dry Year Single-Dry and Multi-Dry Year 6.10 SUMMARY OF EXISTING AND PLANNED SOURCES OF WATER Table 6-10 (DWR Table 6-8) summarizes the City s actual water supplies from 2015 while Table 6-11 (DWR Table 6-9) summarizes the City s projected supplies for 2020 through Table Retail: Water Supplies Actual (DWR Table 6-8) Water Supply 2015 Additional Detail on Water Supply Actual Volume Water Quality Total Right or Safe Yield (optional) Groundwater 8,650 Raw Water Total 8,650 0 NOTES: Volumes are in AF. June 2016 n\c\204\ \wp\uwmp\112315_6ch City of Woodland 2015 Urban Water Management Plan
57 Chapter 6 System Supplies Table Retail: Water Supplies Projected (DWR Table 6-9) Water Supply Reasonably Available Volume Total Right or Safe Yield (optional) Reasonably Available Volume Total Right or Safe Yield (optional) Reasonably Available Volume Total Right or Safe Yield (optional) Reasonably Available Volume Total Right or Safe Yield (optional) Reasonably Available Volume Surface water 20,160 20,160 20,160 24,650 24,650 Groundwater Purchased or Imported Water Recycled Water NOTES: Volumes are in AF. Additional Detail on Water Supply Total Projected Water Supply Report To the Extent Practicable (opt) Total Right or Safe Yield (optional) 20, , , , , CLIMATE CHANGE IMPACTS TO SUPPLY National and international research over the last several decades has led to landmark scientific advancements and thus a universal consensus that the global climate is changing, in large part, due to human activities related to the generation of greenhouse gasses such as carbon dioxide. The Intergovernmental Panel on Climate Change (IPCC) was established to provide the decision-makers and others interested in climate change with an objective source of information about climate change. It was set up by the World Meteorological Organization and the United Nations Environment Programme, and has served since 1988 as a clearinghouse for research and policy discussions related to climate change. The role of the IPCC is to assess on a comprehensive, objective, open and transparent basis the latest scientific, technical and socio-economic literature produced worldwide relevant to the understanding of the risk of human-induced climate change, its observed and projected impacts and options for adaptation and mitigation.. Agencies of the United States government have provided major input to both research and discussion, particularly through the U.S. Geological Survey. The IPCC has issued five major assessments of the status of climate change research, current levels of understanding, and potential policy implications. The Fifth Assessment Report was finalized and made available in November The historical and projected continued warming of the earth has and will continue to cause changes to our climate. While such induced climate change has implications to a number of environmental factors, relevant to this discussion are potential effects on water supply reliability. The State of California has provided major focus and funding on climate change research and impacts, with particular focus on developing both adaptation and mitigation strategies. In the context of climate change and its impacts to water resources, adaptation is simply the identification and development of strategies to cope with the expected impacts to water supply reliability. Mitigation is the identification and development of actions that will reduce the drivers for climate change; for the most part this translates into programs to reduce greenhouse gas emissions and lower the carbon footprint of activities associated with water supply and use. The State s research and continuing recommendations are readily available. The State s Climate Action Team has noted a clear connection between water use and energy consumption, and consequently also with greenhouse gas production (see California Climate Change Portal for the June 2016 n\c\204\ \wp\uwmp\112315_6ch City of Woodland 2015 Urban Water Management Plan
58 Chapter 6 System Supplies most recent technical and policy information: The 2005 California Water Plan Update addressed climate change and water in a general way, noting the many potential interconnections as well as the potentially serious effects of ongoing climate change on water supply reliability. The 2009 Update to the California Water Plan addresses this topic in a more substantive way, and includes recommendations and advice on how to incorporate climate change considerations into long-term water resources planning. It also recommends specific actions in the areas of adaptation and mitigation as discussed above. The 2013 California Water Plan Update includes a financial plan for implementing the water plan strategies including a focus on integrated management. This plan also focuses more on individual hydrologic regions including unique conditions, objectives, efforts, priorities, and available solutions. Other updates to the plan include an ongoing and improved discussion of climate change and its effects to California water management. The full report can be found at: DWR maintains an updated web site on climate change and California s water resources ( That web site notes, in part: Climate change is having a profound impact on California water resources, as evidenced by changes in snowpack, sea level, and river flows. These changes are expected to continue in the future and more of our precipitation will likely fall as rain instead of snow. This potential change in weather patterns will exacerbate flood risks and add additional challenges for water supply reliability. Among more recent reports, in 2014 DWR released California Water Plan Update 2013 which focuses on climate change information pertaining to hydrologic impacts at the state and regional levels, adaptation strategies, and the energy intensity of water supplies. Collectively this State information provides the most updated information related to the potential effects of climate change on water supply reliability in California. DWR and others have done studies to model potential future changes at the regional level on both streamflow and temperature. The focus has been on the Sacramento River system since it is a major source of water for much of California. The different models are split on whether future annual average runoff will be wetter or drier. Other studies make it clear, however, that we are likely to see more extreme hydrology: more floods and droughts, regardless of the average hydrology. However, these same regional models agree that the future will likely be warmer than it is today. Other potential changes include less snowpack, earlier runoff from snowmelt, more precipitation as rain than snow, changes in the amount and timing of stream flows, changes in water resources system operations, and rising sea levels. In turn, these changes could have serious implications for water supply reliability, including water quality. DWR has confirmed that some changes have been underway for many years. For example, a report in 2013 (Indicators of Climate Change in California) indicates that over the past century, spring runoff to the Sacramento River decreased by 9 percent. This is an indication of a long-term decrease in snowpack, with earlier springtime warming. Lower flows to the Sacramento River will also result in greater demand on groundwater resources and affect fall Chinook salmon runs. June 2016 n\c\204\ \wp\uwmp\112315_6ch City of Woodland 2015 Urban Water Management Plan
59 Chapter 6 System Supplies The potential impacts to surface water resources within California have been discussed and included in several documents. Concerns noted in connection with the SWP and CVP include the following: 1. Pumping less water south of the Delta. 2. Having less surplus in reservoirs that can be used during shortages. 3. Pumping more groundwater to augment reductions in surface water supplies. 4. Increased risk that insufficient water availability could interrupt SWP and CVP operations. There are few published examples of water supply adaptation and mitigation strategies. In August 2012 the water user organization, California Urban Water Agencies (CUWA), published a summary report of how its 11 large urban water agencies were demonstrating water management to achieve a reliable water supply. CUWA agencies are major urban water utilities throughout the state, and include such agencies as the Metropolitan Water District of Southern California, East Bay Municipal Utility District, and the San Francisco Public Utilities Commission. This report, California Urban Water Agencies Water Supply Reliability Report, identifies a number of adaptation and mitigation strategies currently being employed to address climate change. This and other reports are available on their web site: Despite the high level of attention both in California and internationally, there is very little information developed on the potential impacts of climate change on groundwater. The principal concern is rising sea level and potential salinity intrusion into coastal groundwater aquifers. While this is a concern for coastal areas of California, it is not a concern in the portion of Yolo groundwater subbasin near the City. While not addressed specifically in IPCC reports, there are potential impacts to groundwater resources that have been discussed over the past few years. These include the following concerns: 1. Decreased reliability of surface water supplies could lead to increased reliance on groundwater, further stressing such supplies. 2. Changes to surface water hydrology increased winter flood flows, reduced spring and summer snowmelt runoff could decrease groundwater recharge. 3. Increased landscape and irrigation water demands due to increased temperatures could further increase pressures on groundwater supplies. The implementation of the DWWSP in 2016, along with the ASR conjunctive use program, both described in previous sections, are adaptations to climate change that the City is implementing to avoid the potential adverse effects from climate change listed above on the City s groundwater supply. By adding surface water as a primary drinking water source, the City is diversifying its water supply portfolio which provides flexibility to the City for adjusting to changing weather and hydrology. Patterns resulting from climate change. As an adaption to the fluctuating reliability of surface water supplies, and to maintain a base amount of surface water in the City s supply through summer months when the WDCWA water right will often be restricted, the WDCWA has purchased water rights from the Conaway Preservation Group (CPG). The CPG water right offers June 2016 n\c\204\ \wp\uwmp\112315_6ch City of Woodland 2015 Urban Water Management Plan
60 Chapter 6 System Supplies a base supply of 10,000 AFY between the months of April and October in normal years, limited from July through September to no more than 7,500 AFY. The CPG right, however, is subject to the Lake Shasta Critical Year Reduction which results in a 25 percent reduction of the permitted diversion when inflow to Shasta falls below specific minimum levels. To further drought-proof the City s water supply, the ASR program is being implemented which offers flexibility for the City to use and bank surface water when it s plentiful and use recovered ASR water when surface water is not available. The City will also continue to review scientific and policy updates related to climate change as they become available through the IPCC, State, CUWA, and other climate change authorities. In addition, the City will continue to implement the components of its GMP and this 2015 UWMP. The City will also continue to include adaptive management principals in its water supply and infrastructure planning. As part of the mitigation and adaptive measures, the City will consider the amount of energy and greenhouse gases required in moving water throughout the system. The effects from increased water conservation on the amount of energy required on new facilities will be reviewed in future water supply planning to minimize energy use impacts. June 2016 n\c\204\ \wp\uwmp\112315_6ch City of Woodland 2015 Urban Water Management Plan
61 CHAPTER 7 Water Supply Reliability Assessment This chapter describes the long term reliability and vulnerability of the City s water supplies. The City s implemented or planned to be implemented, water management tools for increasing the reliability of water supplies are also addressed. Shorter term reliability planning that may require immediate action, such as drought or a catastrophic supply interruption, is addressed in Chapter CONSTRAINTS ON WATER SOURCES Constraints on water resources for specific communities are addressed by CWC Section (c)(2) and Section 10634, which state the following: CWC 10631(c)(2) For any water source that may not be available at a consistent level of use, given specific legal, environmental, water quality, or climatic factors, describe plans to supplement or replace that source with alternative sources or water demand management measures, to the extent practicable. CWC The plan shall include information, to the extent practicable, relating to the quality of existing sources of water available to the supplier over the same five-year increments as described in subdivision (a) of Section 10631, and the manner in which water quality affects water management strategies and supply reliability. There are a variety of constraints that can impact water supply reliability. This section describes potential physical, legal, environmental, water quality, and climatic effects constraints on the reliability of water supply sources as identified by the City at the time of preparation of this 2015 UWMP. A detailed evaluation on the reliability of the City s water supplies are detailed in Appendix H Physical A fundamental factor that affects water supply reliability is the hydraulic capacity of supply and distribution system facilities. The current supply and distribution system is considered sufficient for the current demands. The City has been planning for and updating their distribution system for the start of the DWWSP in mid The RWTF is being constructed with an initial capacity of 20,160 AF (18 MGD) dedicated to serve the City. The WDCWA anticipates the RWTF will be expanded to full capacity around 2035 which will increase the City s allocation capacity to 24,650 AF (22 MGD). With the new surface water supply source, the City has constructed several new transmission pipelines to convey the surface water into their service area. The improvements to the distribution system and supply facilities are expected to be adequate for the City s future demands Legal The WDCWA received approval of their Water Right Application (Permit 30358) from the State Water Resources Control Board (SWRCB) on March 1, 2011 (primary water right); and on April 14, 2011 the SWRCB issued water-right Permit to WDCWA. This permit is subject to Term 91, which results in curtailment of diversion under specific hydrologic conditions. The SWRCB evaluates the hydrologic conditions and the operation of the Central Valley Project (CVP) and State Water Project (SWP) each year to determine if and when Term 91 conditions will begin and end. The average annual curtailment over the 32-year history of Term 91 regulations is 82 days. The most severe Term 91 curtailment on record occurred during 2014, when there was a June 2016 n\c\204\ \wp\uwmp\112315_7ch7 7-1 City of Woodland 2015 Urban Water Management Plan
62 Chapter 7 Water Supply Reliability Assessment total curtailment of 233 days. During curtailment, WDCWA is not allowed to divert any of their water right. In an effort to plan for the potential curtailment of surface water due to Term 91 conditions, the WDCWA entered into a Water Purchase Agreement with Conaway Preservation Group (to purchase post-1914 appropriative water rights of 10,000 AFY of Base Supply water from the Sacramento River for diversion from April through October (secondary water right). Diversion of this water supply is limited from July through September to no more than 7,500 AFY. The remaining 2,500 AF can be diverted in the period from April June, or in October. This water will be diverted under a Bureau of Reclamation Settlement Contract, and is subject to the Lake Shasta Critical Year Reduction which results in a 25 percent reduction of the permitted diversion when inflow to Lake Shasta falls below specific minimum levels. In addition to the WDCWA water right and the secondary water rights, the City reserves the option to purchase supplemental surface water supplies during critically dry periods. The details of such purchases will be determined on an as-needed basis in the future if and when the need arises to undertake such purchases. As discussed in Section 6.2, the Yolo Sub-basin is not adjudicated and is not in overdraft. Groundwater pumping is not currently regulated within Yolo County, except to the extent that exports of groundwater outside of the County boundaries require a permit per Yolo County Code of Ordinances, Chapter 10, Section 7. The City s pumping and use of groundwater is exclusively within its service area, which is wholly contained within Yolo County. Therefore, it is assumed that there are no legal constraints on the City s pumping and use of groundwater. The City s future ASR operations will be permitted by the Central Valley Regional Water Quality Control Board under SWRCB Quality Order , General Waste Discharge Requirements for Aquifer Storage and Recovery Projects that Inject Drinking Water into Groundwater. On behalf of the City, the WDCWA is planning to petition the SWRCB to modify the appropriative rights used to divert water from the Sacramento River. This will be accomplished by filing an Underground Storage Supplement to Application to Appropriate Water by Permit with SWRCB. When authorized by the SWRCB, this modification will enable the relatively longer-term storage of treated surface water in the aquifer necessary for the City s planned ASR operations. The City s future recycled water supply is not anticipated to be impacted by legal factors Environmental The City s surface water, groundwater and recycled water supplies have not been impacted by environmental factors, and the City does not anticipate future disruption of supplies as a result of environmental factors Water Quality The City does not anticipate water quality factors to affect the reliability of recycled water or purchased water within the planning horizon of this UWMP. June 2016 n\c\204\ \wp\uwmp\112315_7ch7 7-2 City of Woodland 2015 Urban Water Management Plan
63 Chapter 7 Water Supply Reliability Assessment The City has relied on shallow and intermediate-depth native groundwater wells as its primary water supply throughout its history. Increasingly stringent drinking water quality and wastewater discharge regulations have obligated the City to seek other supplies, which resulted in the City s participation in the DWWSP. The potential for wastewater discharge exceedances for such constituents as selenium, boron, and salinity (measured as electrical conductivity, or EC) is expected to be eliminated through the addition of surface water supplies under the DWWSP. However, drinking water regulations and concerns remain a constraint on native groundwater usage. Constituents that place the greatest constraints on the City s native groundwater supply are nitrate and Cr 6. Appendix H provides more details on the water quality constraints on the native groundwater supply. When the RWTF comes online in mid-2016, the City plans to significantly reduce the use of its native groundwater wells to reduce the water quality impacts on the water system Climate Climatic factors affecting the reliability of a given water supply system generally are a function of seasonal precipitation and runoff characteristics. During dry years, the City s primary and secondary water rights will be curtailed. How much the City s surface water will be curtailed depends on the severity of the drought conditions. More details on the impacts to surface water based on climatic conditions are discussed in Appendix H. The City plans to implement a long-term ASR program to address the times when surface water is curtailed. When surface water availability is severely curtailed, the ASR water would be withdrawn to meet customer demands that cannot be met by direct treated surface water deliveries or by native groundwater supplies. The ASR water available for use will be impacted by climatic conditions based on the availability of surface water for injection during the months of November through April. The City s future recycled water supply is not anticipated to be impacted by climate factors. 7.2 RELIABILITY BY TYPE OF YEAR This section addresses the reliability of the City s water supply in average, single dry, and multiple dry water years. Water supply reliability by type of year is addressed in CWC Section 10631(c)(1), which states the following: (c) (1) Describe the reliability of the water supply and vulnerability to seasonal or climatic shortage, to the extent practicable, and provide data for each of the following: (A) An average water year (B) A single-dry water year (C) Multiple-dry water years June 2016 n\c\204\ \wp\uwmp\112315_7ch7 7-3 City of Woodland 2015 Urban Water Management Plan
64 Chapter 7 Water Supply Reliability Assessment The City uses the following water year definitions from the DWR 2015 Guidebook: Average year: a year, or an averaged range of years, that most closely represents the average water supply available to the agency. For the purposes of this UWMP, the terms normal and average are used interchangeably. Single-dry year: the year that represents the lowest water supply available to the agency. Multiple-dry year period: the period that represents the lowest average water supply availability to the agency for a consecutive multiple year period (three years or more). As described in the previous section of this chapter, the key constraints on surface water supplies are governed by Term 91 curtailments and Lake Shasta normal/critical year status. The single-dry and multiple-dry year periods were determined by looking at the historical 32-year record of when and how often Term 91 curtailments were implemented. The City base water years for historical average year, single driest year, and driest multiple-year period are summarized in Table 7-1 (DWR Table 7-1). Table 7-1. Retail: Basis of Water Year Data (DWR Table 7-1) Available Supplies if Year Type Repeats Year Type Base Year Quantification of available supplies is not compatible with this table and is provided elsewhere in the UWMP. Location Quantification of available supplies is provided in this table as either volume only, percent only, or both. Volume Available % of Average Supply Average Year , % Single-Dry Year ,990 71% Multiple-Dry Years 1st Year ,360 76% Multiple-Dry Years 2nd Year ,990 71% Multiple-Dry Years 3rd Year ,120 71% NOTES: Volumes in AF. Volume available for average year reflects the historical supply of groundwater. Single dry and multiple dry year available volume reflect anticipated surface water, ASR, and groundwater supplies. June 2016 n\c\204\ \wp\uwmp\112315_7ch7 7-4 City of Woodland 2015 Urban Water Management Plan
65 Chapter 7 Water Supply Reliability Assessment 7.3 SUPPLY AND DEMAND ASSESSMENT This section includes a summary of the reliability of the City s water supplies for various types of years in five-year increments through Normal Year The City s normal year supply, once the DWWSP is active, is anticipated to be 20,960 AFY from a combined surface water, native groundwater, and ASR water through The RWTF is anticipated to be expanded to full capacity and additional ASR wells constructed once the RWTF is expanded which increases the anticipated normal year supply to 25,450 AFY. As shown in Table 7-2 (DWR Table 7-2), the City s normal year supplies are adequate to meet projected normal year demands. Table 7-2. Retail: Normal Year Supply and Demand Comparison (DWR Table 7-2) (Opt) Supply totals 20,960 20,960 20,960 25,450 25,450 Demand totals 15,911 17,024 18,217 19,492 20,833 Difference 5,049 3,936 2,743 5,958 4,617 NOTES: Volumes are in AF. Supply totals for normal year projections reflects anticipated surface water and recycled water supply sources Single Dry Year As described above, the City s single dry year supply is anticipated to be 19,990 AFY from a combined surface water, native groundwater, and ASR water through The RWTF is anticipated to be expanded to full capacity and additional ASR wells constructed once the RWTF is expanded in 2035 which increases the anticipated single dry year supply to 25,080 AFY for 2035 and As shown in Table 7-3 (DWR Table 7-3), the City s single dry year supplies are adequate to meet projected single dry year demands. June 2016 n\c\204\ \wp\uwmp\112315_7ch7 7-5 City of Woodland 2015 Urban Water Management Plan
66 Chapter 7 Water Supply Reliability Assessment Table 7-3. Retail: Single Dry Year Supply and Demand Comparison (DWR Table 7-3) (Opt) Supply totals 19,990 19,990 19,990 25,080 25,080 Demand totals 15,911 17,024 18,217 19,492 20,833 Difference 4,079 2,966 1,773 5,588 4,247 NOTES: Volumes are in AF. If necessary, the City may also initiate a water shortage emergency stage to extend available water supplies, as described in Chapter Multiple Dry Years As described above, the City s multiple dry years supply is anticipated to range from 19,990 AFY to 21,360 AFY from a combined surface water, native groundwater, and ASR water through The RWTF is anticipated to be expanded to full capacity and additional ASR wells constructed once the RWTF is expanded in 2035 which increases the anticipated multiple dry year supply to 25,080 AFY for 2035 and As shown in Table 7-4 (DWR Table 7-4), the City s multiple dry years supplies are adequate to meet projected multiple dry years demands. Table 7-4. Retail: Multiple Dry Years Supply and Demand Comparison (DWR Table 7-4) (Opt) Supply totals 21,360 21,360 21,360 25,080 25,080 First year Demand totals 15,911 17,024 18,217 19,492 20,833 Difference 5,449 4,336 3,143 5,588 4,247 Supply totals 19,990 19,990 19,990 25,080 25,080 Second year Demand totals 15,911 17,024 18,217 19,492 20,833 Difference 4,079 2,966 1,773 5,588 4,247 Supply totals 20,120 20,120 20,120 25,080 25,080 Third year Demand totals 15,911 17,024 18,217 19,492 20,833 NOTES: Volumes are in AF. Difference 4,209 3,096 1,903 5,588 4,247 June 2016 n\c\204\ \wp\uwmp\112315_7ch7 7-6 City of Woodland 2015 Urban Water Management Plan
67 Chapter 7 Water Supply Reliability Assessment If necessary, the City may also initiate a water shortage emergency stage to extend available water supplies, as described in Chapter REGIONAL SUPPLY RELIABILITY Requirements for water supply and demand assessment are addressed in section 10620(f), which states the following: An urban water supplier shall describe in the plan water management tools and options used by that entity that will maximize resources and minimize the need to import water from other regions. The City is both currently and has plans to implement a variety of water management tools/activities to reduce reliance on imported water. These include extensive demand management measures (documented in Chapter 9 of this report), increased use of recycled water (documented in Section 6.5 of this report), and possible conversion of existing shallow/intermediate aquifer supply wells to dedicated landscape irrigation use after the DWWSP comes online. June 2016 n\c\204\ \wp\uwmp\112315_7ch7 7-7 City of Woodland 2015 Urban Water Management Plan
68 (THIS PAGE LEFT BLANK INTENTIONALLY)
69 CHAPTER 8 Water Shortage Contingency Planning This chapter describes the City s strategic planning process to prepare for and respond to water shortages. This description includes the estimated three-year minimum water supply, the actions and stages described in the water conservation ordinance that will be implemented in the event of a water supply shortage, and the emergency preparedness and plans for catastrophic events. The purpose of a water shortage emergency plan, also known as a water shortage contingency plan, is to help the City maintain reliable supplies and reduce the impacts of supply interruptions. The City s Water Shortage Contingency Plan was adopted by City Council July 1, 2014 (Appendix J) and notes that long and short-term shortages are handled through implementation of a drought contingency plan. 8.1 STAGES OF ACTION The City s Water Shortage Contingency Plan (WSCP) includes four water conservation stages as shown in Table 8-1 (DWR Table 8-1). The four water conservation stages of action respond to progressively decreasing water supplies, including greater than 50 percent reduction. These stages would be appropriate responses to a drought, emergency supply outage condition, or other water shortages. Table 8-1. Retail: Stages of Water Shortage Contingency Plan (DWR Table 8-1) Stage Percent Supply Reduction 1 Numerical value as a percent Water Supply Condition (Narrative description) I 10% II 25% III 50% IV >50% Stage 1 shall exist when the City s reliable water supply is adequate to meet no more than ninety percent (90%) of projected demands. Stage 2 shall exist when the City s reliable water supply is adequate to meet no more than seventy-five percent (75%) of projected demands Stage 3 shall exist when the City s reliable water supply is adequate to meet no more than fifty percent (50%) of projected demands. Stage 4 shall exist when there is major failure of a reliable water supply, storage, or distribution system, and the water shortage is greater than 50% of Projected demands. 1 One stage in the Water Shortage Contingency Plan must address a water shortage of 50%. NOTES: Projected demands are determined by the Public Works Director or his or her designee. June 2016 n\c\204\ \wp\uwmp\112315_8ch8 8-1 City of Woodland 2015 Urban Water Management Plan
70 Chapter 8 Water Shortage Contingency Planning 8.2 PROHIBITIONS ON END USES CWC Section (a)(4) requires mandatory prohibitions against specific water use practices that may be considered excessive during water shortages. Water wasting is prohibited by the City. Particular water uses are considered wasteful depending on the water conservation stage. The water uses stated in the City Code (Exhibit A of the Water Shortage Contingency Ordinance, Appendix J) and summarized in Table 8-2 (DWR Table 8-2), are considered wasteful at all times or during different stages of water shortages. Table 8-2 (DWR Table 8-2) lists a selection of the City s Restrictions and Prohibitions on End Uses for all stages of action. Each progressively restrictive stage includes the restrictions shown for that stage as well as all restrictions for the previous stages of restriction. June 2016 n\c\204\ \wp\uwmp\112315_8ch8 8-2 City of Woodland 2015 Urban Water Management Plan
71 Chapter 8 Water Shortage Contingency Planning Table 8-2. Retail Only: Restrictions and Prohibitions on End Uses (DWR Table 8-2) Stage Restrictions and Prohibitions on End Users Additional Explanation or Reference (optional) Penalty, Charge, or Other Enforcement? 0 Landscape - Restrict or prohibit runoff from landscape irrigation Sec. 23C-11-3.J.1 Yes 0 Other - Customers must repair leaks, breaks, and malfunctions in a timely manner Sec. 23C-11-3.J.2 Yes 0 Other water feature or swimming pool restriction Sec. 23C-11-3.J.3 Yes 0 Landscape - Other landscape restriction or prohibition Sec. 23C-11-3.J.4 Yes 0 Landscape - Other landscape restriction or prohibition Sec. 23C-11-3.J.5 Yes 0 Landscape - Other landscape restriction or prohibition Sec. 23C-11-4.A.2 Yes 1 Other Sec. 23C-11-4.B.2 Yes 1 Other - Prohibit use of potable water for washing hard surfaces Sec. 23C-11-4.B.3 Yes 1 Other - Require automatic shut of hoses Sec. 23C-11-4.B.4 Yes 1 CII - Restaurants may only serve water upon request Sec. 23C-11-4.B.5 Yes 2 Other Sec. 23C-11-4.C.2 Yes 2 Landscape - Other landscape restriction or prohibition Sec. 23C-11-4.C.3 Yes 2 Other - Prohibit use of potable water for washing hard surfaces Sec. 23C-11-4.C.4 Yes 2 Landscape - Other landscape restriction or prohibition Sec. 23C-11-4.C.5 Yes 2 Other - Prohibit vehicle washing except at facilities using recycled or recirculating water Sec. 23C-11-4.C.6 Yes 2 CII - Other CII restriction or prohibition Sec. 23C-11-4.C.7 Yes 2 Water Features - Restrict water use for decorative water features, such as fountains Sec. 23C-11-4.C.8 Yes 3 Other Sec. 23C-11-4.D.2 Yes 3 Other Sec. 23C-11-4.D.3 Yes 3 Landscape - Prohibit certain types of landscape irrigation Sec. 23C-11-4.D.4 Yes 3 Other - Prohibit vehicle washing except at facilities using recycled or recirculating water Sec. 23C-11-4.D.5 Yes 3 Pools - Allow filling of swimming pools only when an appropriate cover is in place. Sec. 23C-11-4.D.6 Yes 4 Other Sec. 23C-11-4.E.2 Yes NOTES: Each progressively restrictive stage includes the restrictions shown for that stage as well as all restrictions for the previous stages of restriction. For example, the restrictions during Stage 4 include all of the restrictions shown in the table. June 2016 n\c\204\ \wp\uwmp\112315_8ch8 8-3 City of Woodland 2015 Urban Water Management Plan
72 Chapter 8 Water Shortage Contingency Planning 8.3 PENALTIES, CHARGES, OTHER ENFORCEMENT OF PROHIBITIONS Section (6) of the CWC requires a water supplier to penalize or charge for excessive water use, where applicable. The City may determine a violation of the restrictions and prohibitions detailed in the Water Conservation Ordinance to be a nuisance, resulting in a notice to abate or an administrative citation. Fines imposed for an administrative citation shall be (i) $100 for a first violation, (ii) $200 for a second violation of the same provision within one year, and (iii) $500 for each additional violation of the same provision within one year. Any person who has not abated the nuisance within the time prescribed by the City or, failed to appeal the notice to abate or administrative citation, may be subject to any or all of the following enforcement actions, in addition to any remedies the City may require: Installing a flow-restriction device or other water conservation device at such person's premises at that person's expense; Requiring a commercial, industrial, or institutional user who does not currently have a separate landscape meter to install a landscape meter at the sole cost and expense of the user; Recording the violations on the property title provided the water customer is the property owner; Placing liens on the property to recover any costs incurred by the City provided the water customer is the property owner; and/or Issuing a criminal citation charged as either an infraction or misdemeanor. 8.4 CONSUMPTION REDUCTION METHODS Each urban water supplier may use any type of consumption reduction methods in its water shortage contingency analysis that would reduce water use, are appropriate for its area, and have the ability to achieve a water use reduction consistent with up to a 50 percent reduction in water supply. CWC Section (a)(5) requires the water supplier to provide consumption reduction methods in the most restrictive stages of a water shortage. Water consumption reduction methods for each water conservation stage used by the City are listed in Table 8-3 (DWR Table 8-3). Refer to Appendix J for the complete list of consumption reduction methods. June 2016 n\c\204\ \wp\uwmp\112315_8ch8 8-4 City of Woodland 2015 Urban Water Management Plan
73 Chapter 8 Water Shortage Contingency Planning Table 8-3. Retail Only: Stages of Water Shortage Contingency Plan Consumption Reduction Methods (DWR Table 8-3) Stage Consumption Reduction Methods by Water Supplier Additional Explanation or Reference (optional) All Stages All Stages All Stages All Stages All Stages All Stages All Stages Increase Frequency of Meter Reading Provide Rebates for Landscape Irrigation Efficiency Expand Public Information Campaign Reduce System Water Loss Improve Customer Billing Decrease Line Flushing Other The City installed meters for all customers and implemented Advance Metering Infrastructure for all meters by The City provides rebate for weather-based irrigation controllers, rain sensors, rain barrels, and mulch. It has expanded its funding for rebates. From , the City has expanded the Water Conservation Program s public information campaign to include social media, more online resources, at least 10 press releases per year, and at least 6 water conservation and efficiency workshops per year. The City has conducted audits to identify system water loss and has a Capital Improvement Program in place to fund system repairs. Introduced graphic representation of past 13 month water consumption on utility bill. The City changed from unidirectional flushing of the water system in 2015 to NO-DES (Neutral Output Discharge Elimination System) a flushing, filtering, and recirculation of water to reduce water waste. The City has made it a priority to reduce municipal water consumption. For example, parks irrigation was reduced by around 40%. June 2016 n\c\204\ \wp\uwmp\112315_8ch8 8-5 City of Woodland 2015 Urban Water Management Plan
74 Chapter 8 Water Shortage Contingency Planning 8.5 DETERMINING WATER SHORTAGE REDUCTIONS CWC Section (a)(9) requires the water supplier to develop a mechanism for determining actual reductions in water use in the course of carrying out the urban water supply shortage contingency analysis. The City evaluates the effectiveness of its water shortage contingency plan based on metered water use data. The City completed installing meters for single family residential and commercial customers in Multi-family and park meter installation was completed in Monitoring involves determining the per capita water use for residential users and the water use per account for non-residential customer categories. The City determines if the water customers are achieving the required demand reductions by comparing historical metered water use without a water shortage emergency to the metered water use under the declared water shortage stage. 8.6 REVENUE AND EXPENDITURE IMPACTS Section (7) of the CWC requires an analysis of the impacts of each of the actions taken for conservation and water restriction on the revenues and expenditures of the water supplier. The level of revenues collected through the fixed and consumption charge is a policy decision that allows the rate structure to meet the City s goals and objectives. The City s most recent water rate study was published in February 2012 and points out that because City customers are still transitioning to a metered rate, a higher fixed charge allows for a smoother transition to metered rates and revenue stability during the time of transition. The 2012 rate study stated that the City currently collected approximately 46 percent of its metered residential revenue through the fixed meter base rate charges. The percentage of revenue from the fixed charges was set primarily to minimize rate impacts and for the transition to metered rates. The City plans to conduct its next water rate study in 2016, which will focus on reevaluating the tiered pricing structure and the impacts of extended drought and determine if the rate structure still meets the current rate design goals and objectives. The City maintains reserve funds that can be used in case of a water shortage, although the water shortage contingency plan does not call out specifically when the reserve funds can be utilized. Although the maintenance of reserve funds is not specifically done to fill in revenue gaps related to conservation, the presence of the reserve fund offers the City a backup source of funding in case conservation causes a dramatic drop in revenue. At the same time, the City does not expect much negative financial impact to occur as a result of implementing the first two stages of water shortage for a defined time period. 8.7 RESOLUTION OR ORDINANCE In 2014, the City adopted Ordinance Number 1564 which amended the City s Municipal Code to ensure consistency with state legislation and address water shortage situations in addition to drought conditions. The City s Water Shortage Contingency Ordinance can be found in Appendix J. June 2016 n\c\204\ \wp\uwmp\112315_8ch8 8-6 City of Woodland 2015 Urban Water Management Plan
75 Chapter 8 Water Shortage Contingency Planning 8.8 CATASTROPHIC SUPPLY INTERRUPTION Section (3) of the CWC requires actions to be undertaken by the water supplier to prepare for and implement during a catastrophic interruption of water supplies. As stated previously, the City does not yet maintain any treated water interties with any agencies. However, once the DWWSP is operational in mid-2016, the City will have access to surface water from the Sacramento River and can possibly purchase additional water from the City of Davis if the City is short on supplies and the City of Davis has excess surface water capacity available. The DWWSP facilities will be able to be called upon during a catastrophic supply interruption to provide emergency water in order to maintain normal distribution. 8.9 MINIMUM SUPPLY NEXT THREE YEARS All water agencies are required to provide an estimate of the minimum water supply available during each of the next three water years, 2016, 2017, and 2018 (Table 8-4 (DWR Table 8-4)). This estimate reflects the combined availability of all water sources and assumes the same hydrology that was noted in the historical multiple-dry year period (Section 7.2). Table 8-4. Retail: Minimum Supply Next Three Years (DWR Table 8-4) Available Water Supply 32,100 32,100 32,100 NOTES: Volumes in AF. The City is transitioning from groundwater only to surface water primarily over the next three years. During this time, it is assumed groundwater will still be available as a supply. June 2016 n\c\204\ \wp\uwmp\112315_8ch8 8-7 City of Woodland 2015 Urban Water Management Plan
76 (THIS PAGE LEFT BLANK INTENTIONALLY)
77 CHAPTER 9 Demand Management Measures This chapter describes the City s historical and existing water conservation program, status of implementation of Demand Management Measures (DMMs), and projected future conservation implementation. The CWC requires that UWMPs include a comprehensive description of historical, current, and projected water conservation programs. CWC (f) Provide a description of the supplier's water demand management measures. This description shall include all of the following: (1) (A) a narrative description that addresses the nature and extent of each water demand management measure implemented over the past five years. The narrative shall describe the water demand management measure that the supplier plans to implement to achieve its water use targets pursuant to Section (B)The narrative pursuant to this paragraph shall include descriptions of the following water demand management measures: (i) Water waste prevention ordinances. (ii) Metering. (iii) Conservation pricing. (iv) Public education and outreach. (v) Programs to assess and manage distribution system real loss. (vi) Water conservation program coordination and staffing support. (vii) Other demand management measures that have a significant impact on water use as measured in gallons per capita per day, including innovative measures, if implemented. In previous UWMPs, a substantial amount of data were required to document a water supplier s progress in implementing fourteen specific DMMs. In 2014, Assembly Bill 2067 simplified, clarified, and updated reporting requirements for DMMs. Starting with this 2015 UWMP, focus has turned away from detailed descriptions of each of the fourteen DMMs and has turned to key water conservation measures that are being implemented to achieve compliance with SB X7-7. For retail agencies, the number of DMMs has been reduced from fourteen to six (plus an other category). 9.1 DEMAND MANAGEMENT MEASURES The six DMMs required to be discussed in the 2015 UWMP include the following: Water waste prevention ordinances; Metering; Conservation pricing; Public education and outreach; Programs to assess and manage distribution system real loss; and Water conservation program coordination and staffing support. For each DMM, the current program is described, followed by a description of how the DMM was implemented over the previous five years and the planned implementation to achieve the water use targets required by SB X7-7 (see Chapter 5 SB X7-7 Baselines and Targets). June 2016 n\c\204\ \wp\uwmp\112315_9ch9 9-1 City of Woodland 2015 Urban Water Management Plan
78 Chapter 9 Demand Management Measures Water Waste Prevention Ordinances The City established a No-Waste ordinance in This was amended in 2014 with the City s adoption of Ordinance No. 1564, as shown in Appendix J, to ensure compliance with all federal, state, and local requirements, including but not limited to, SBx7-7 and MWELO (23 CCR 490 et seq.). The ordinance was incorporated into the City s Municipal Code Section 23C-7-10 and Section 23C, Article XI. Primary changes to the No-Waste ordinance included establishing water shortage stages and defining terms like conservation, drought-tolerant and water waste. Water waste, which includes excessive leaks, irrigating impervious surfaces, irrigating during rainfall, and watering excessively to the point of runoff, is prohibited at all times. Water use becomes more restricted as water supply decreases, as demonstrated in Chapter 8. Enforcement for this ordinance is detailed in Section The City will continue to revise the ordinance as needed to incorporate new federal, state, and local laws regarding water conservation and to adapt to changing water supply and demand needs. For leaks on customer s property, the City has provided leak detection assistance by alerting the top 20 continuous water users each month of potential leaks. A report is generated using the City s automated meter reading (AMR) database and then checked by staff. Letters are sent to the addresses notifying the account holders of high, continuous use. Also included is a chart with the account s meter reads, a leak detection brochure, and a leak adjustment form. The leak adjustment form incentivizes the customer to fix leaks by informing the customer that the City will back pay the customer once the leak is repaired. The back pay covers the cost of the water lost due to the leak for up to six months before the repair. As additional support to customers with large leaks, Water Conservation and Finance staff members often assist customers to find and fix common leaks on the phone. In addition, the City has enacted requirements in the City Code to require energy efficient water heaters, which indirectly helps save water, and updated water-efficient water fixtures when bathroom or kitchen remodels occur. The City has enacted the state's MWELO to reduce water consumption of landscapes while also enhancing aesthetic appearances and protecting the public by minimizing visual pollution and soil erosion. As stated in the City s Municipal Code Section 23C-7-10 (Appendix J), the City may respond to violations first by notice to abate or an administrative citation. The City currently has two code enforcement officers whose responsibilities include addressing water use violations. These violations are found through analysis of water meter data, visible violations, and reported violations from the public, which are then investigated. If the water user is found to be in violation, the violator is given a written warning along with appropriate water conservation information. The City resolves most of its water use violations at this warning stage; however, if the violation persists the City can impose the following fines: (i) one hundred dollars for a first violation, (ii) two hundred dollars for a second violation of the same provision within one year, and (iii) five hundred dollars for each additional violation of the same provision within one year. If the violation June 2016 n\c\204\ \wp\uwmp\112315_9ch9 9-2 City of Woodland 2015 Urban Water Management Plan
79 Chapter 9 Demand Management Measures is not abated within the time prescribed by the City, the City may take any or all of the following additional enforcement actions: Installing a flow-restriction device or other water conservation device at such person's premises at that person's expense; Requiring a commercial, industrial, or institutional user who does not currently have a separate landscape meter to install a landscape meter at the sole cost and expense of the user; Recording the violations on the property title provided the water customer is the property owner; Placing liens on the property to recover any costs incurred by the City provided the water customer is the property owner; and/or Issuing a criminal citation charged as either an infraction or misdemeanor. Implementation of this DMM is expected to help the City achieve its water use targets by minimizing the nonessential uses of water so that water is available to be used for human consumption, sanitation, and fire protection Metering Water meter installations were complete for single family residential and commercial customers in 2012 and multi-family and park customers in The water meters are all connected to an Advanced Metering Infrastructure (AMI) which remotely reads the water meters and collects real-time water use data. Meter installations have made it possible for the City to charge customers based on their volumetric water use and provide customers with more accurate water use information, both of which will help the City achieve its water use targets. The City plans to offer a web-based water account portal called AquaHawk through American Conservation and Billing Solutions for water utility customers in This service will allow residential and commercial customers to view their real-time water use, see historical use, compare use to similar users, view projected bills, set water budgets, and get alerts when a potential leak is detected. The City will also be able to generate a variety of customizable reports. Per capita use declined significantly between 2008 and 2013 likely due to the installation of water meters and the associated implementation of usage-based fees which is described in the following section. Implementation of this DMM is expected to help the City achieve its water use targets by providing accurate water use information to the customer and the City Conservation Pricing The City adopted a consumption-based rate structure in 2012, along with the implementation of water meters for all customers. The rate structure, which is tiered into three residential categories and one non-residential category, is always in place and is not dependent upon water shortage for implementation. Approximately 50 percent of the revenue generated from the tiered rate structure is received from the fixed monthly rate, which is based on the meter size. The remaining revenue is generated from monthly consumption. Per capita use declined significantly between 2008 and June 2016 n\c\204\ \wp\uwmp\112315_9ch9 9-3 City of Woodland 2015 Urban Water Management Plan
80 Chapter 9 Demand Management Measures 2013 likely due to the installation of water meters and the associated implementation of usage-based fees. The current water rate structure is provided in Table 9-1. If water is used in excess, as described in the earlier water waste prevention section, the City can impose fines. Table 9-1. Current Water Rate Structure Base Rate Meter Size (a) January 2013 January 2014 January 2015 January " or smaller $28.75 $33.00 $38.75 $ " $54.00 $62.00 $72.80 $ " $89.95 $ $ $ " $ $ $ $ Residential Consumption 1 CF = 7.48 gallons Each CF Each CF Each CF Each CF 0-1,200 CF (b) $ $ $ $ ,201-3,600 CF $ $ $ $ Above 3,601 CF $ $ $ $ Non-Residential Consumption 1 CF = 7.48 gallons Each CF Each CF Each CF Each CF Multi-family, Commercial, Institutional, Industrial $ $ $ $ Large User $ $ $ $ Landscape $ $ $ $ (a) Most residential properties have a 2 meter or smaller. (b) CF = cubic feet Source: The City plans to conduct a water rate study in 2016, which will focus on reevaluating the tiered pricing structure and the impacts of extended drought. Implementation of this DMM is expected to help the City achieve its water use targets by ensuring water customers pay the true cost of water and to adequately fund water system operations and maintenance, including repair and replacement programs, and water conservation programs. This DMM also helps the City achieve its water use targets by providing an incentive for customers to reduce their water consumption. June 2016 n\c\204\ \wp\uwmp\112315_9ch9 9-4 City of Woodland 2015 Urban Water Management Plan
81 Chapter 9 Demand Management Measures Public Education and Outreach The City regularly interacts with the public through its website ( social media (Facebook, Twitter, and Instagram at EnviroWoodland), customer phone calls and s, radio ads, press releases, print ads, utility bill inserts, community events, City-hosted water conservation workshops and events, monthly e-newsletters, school presentations, leak detection notices, distribution of informational material, and giveaways and rebates. All of the City s public education and outreach services are offered free of charge to City water customers Rebates The City started offering water conservation rebates in 2003 with a grant-funded high efficiency toilet rebate program. Since then, the program has grown to an annual, City-funded program that includes both residential and commercial water customers. The City has offered and continues to offer the following rebates; $150 for a Weather-Based Irrigation Controller, $100 for mulch, $75 for rain barrels (up to two per house), and $25 for rain sensors. The City also actively promotes water conservation rebates that the State has available. From 2010 to 2015, the City provided a total of 348 water conversation rebates to Woodland residents. This amounts to an estimated water savings of approximately 3.3 million gallons with a total cost of $30,322 to the City Communicating Water Use via Water Bills When the City switched to consumption-based billing for water beginning in 2010, the format for the utility bill was also changed. Customers can now see their base meter charge as well as their consumption base charge, how many cubic feet and gallons they used in the billing cycle, and a graph showing their usage for the past 13 months. This information allows customers to compare their usage with the same month of the previous year and gives them clear information about their water use. Also, beginning in 2010, a paragraph was added to all customer water bills about water conservation, including the City s conservation target and contact information for the City s Water Conservation Program. The City also often distributes important water conservation messages to its customers through bill insert flyers and newsletters. For example, when the City enacted the Stage Two Water Warning in May 2015, all City of Woodland water customers received a flyer explaining the emergency water conservation regulations with their bill. The City offers these announcements in both English and Spanish. Starting in 2016, the City will be implementing AquaHawk, a web-based water account portal. In addition to adding many other demand management features, customers will be able to set water utility budgets (by dollars or gallons), receive alerts when they are close to exceeding their budget, view projected bills, and have access to their billing history. June 2016 n\c\204\ \wp\uwmp\112315_9ch9 9-5 City of Woodland 2015 Urban Water Management Plan
82 Chapter 9 Demand Management Measures School Education Programs The City has ongoing contracts with environmental educators to provide free school assemblies to Woodland schools. Since 2011, the City has contracted with ZunZun, an engaging musical assembly program about recycling, stormwater, and water conservation. Water conservation topics include the drought, the City s water source, water conservation tips for both indoors and outdoors, how to help trees survive the drought, rainwater retention, and more. ZunZun holds nine assemblies in Woodland each school year, reaching over 2,000 students. The City plans to continue to provide environmental assemblies for Woodland elementary schools in the future. The City also offers about five workshops per year at the Woodland Community College. Often, students at the college receive credit for attending water conservation workshops. In addition, the City s Water Conservation Coordinator visits schools approximately five times a year to give presentations and host an educational table at school events to teach children and their parents about water conservation. The City is currently working to expand the school education program to reach more high school students. Future programs may include a water-themed community mural organized by students at Pioneer High School, rainwater harvesting at school gardens, and contests to promote water conservation Information Booths at Fairs and Public Events The City s Environmental Services Division, of which the Water Conservation Program is a part, is an active participant in community events, particularly when they pertain to sustainability. The City has had booths at the Yolo County Fair, Earth Day Festivals, multiple landscaping and gardening events, plant sales, school fairs, public city events, tree plantings and more. City staff reaches the public through informational booths at 10 or more events annually. City conservation staff members tailor booths to the expected audience and have many ways of engaging all ages. The City has organized games, asked water conservation questions, led kids craft activities, and asked for conservation pledges. The City has a wide variety of giveaways that are used as incentives for the public to engage with City staff. Giveaways include shower timers, soil moisture meters, drip gauges, toilet flapper replacements, hose nozzles, sprinkler fixing screw drivers, shower heads, toilet dye tabs, children leak detective kits, as well as informational materials. The City regularly re-examines the most effective and most popular rebates and giveaways in order to best provide the community with water saving devices that will have the greatest impact of water use. When possible and appropriate, the City partners with local groups, such as Girl Scouts, to table at events Newsletters The Water Conservation Coordinator organizes a monthly newsletter for the Environmental Services Division titled EnviroWoodland News. The newsletter includes information from the City s conservation programs; recycling, solid waste, climate action, energy, water and stormwater. Water Conservation topics include, information about upcoming events, opportunities to get involved like the Wyland Foundation s Mayor Water Conservation Challenge, larger June 2016 n\c\204\ \wp\uwmp\112315_9ch9 9-6 City of Woodland 2015 Urban Water Management Plan
83 Chapter 9 Demand Management Measures projects like the City s change of water source to surface water, advertising City services like the new Customer Water-Use Portal, and the City water conservation standings. As of February 2016, the City s EnviroWoodland newsletter had 1,155 subscribers. With every interaction with the public, whether by phone or at events, the City advertises the EnviroWoodland newsletter Informative Websites, Online Tools, and Social Media The Water Conservation Program continuously works to provide up-to-date information on the City s website and social media platforms. Water conservation staff members manage a City Water Conservation webpage with seven subpages with topics such as conservation tips, drought updates, and resources. This webpage has grown substantially since 2010, receiving over 20,000 views from 2010 through 2014 and 19,000 views in 2015 alone. The City updates the water conservation webpages at least monthly, but often more frequently. The City provides many online resources for water customers, including landscape designs for water-efficient median strips, a home water use calculator, presentations, leak detection information, news updates, and links to other sites for more information. The Water Conservation Program staff posts four times a week on Facebook, Twitter, and Instagram. As of February 2016, the City s EnviroWoodland Facebook page had 2,938 likes and reached an average of 2,500 people per week. In addition, the City recently started a YouTube page and will begin to upload informational videos in Anticipated video subjects include workshop demonstrations, water conservation tips, and how to fix leaks Newspaper Advertisements The City purchases advertisement space in the local newspaper, The Daily Democrat, and writes press releases for all public water conservation events. The City also regularly writes press releases to update the public about water issues and conservation standings. Each year, the City publishes 12 or more water conservation press releases in local newspapers that are often picked up by newspapers in other jurisdictions and by television and radio stations. Staff has found that the majority of people who attend events learn of them through these local news outlets. Starting in 2016, the City began the Woodland s Water-Wise Landscape of the Month outreach campaign. In the Sacramento region, around 65 percent of a household s water is used outdoors. To generate the largest gains in conservation, the City promotes reductions in residents outdoor water use. One of the most effective, proven ways to do this is to convert lawns to drought-tolerant landscapes. The Woodland s Water-Wise Landscape of the Month campaign increases awareness of low water use landscapes in the City. It consists of monthly newspaper articles that highlight the landscape s water conservation features and provides tips and resources from the owners. These articles are featured monthly in The Daily Democrat and are also announced on the Water Conservation website, on social media, and in the EnviroWoodland Newsletter Other Activities The City has produced a large number of informational materials, such as brochures and flyers, to aid water customers in reducing their water consumption. Topics of informational materials include leak detection, landscaping to save water, water saving tips for pools, water and energy, June 2016 n\c\204\ \wp\uwmp\112315_9ch9 9-7 City of Woodland 2015 Urban Water Management Plan
84 Chapter 9 Demand Management Measures fall water conservation tips, a tree selection and planting guide for Woodland, a home improvement guide to protecting waterways and Woodland-specific water information. These materials are available online, often in English and Spanish, and are distributed at City facilities and events. The Water Conservation Program holds approximately six events each year. The most popular event is the Annual Water-Wise Landscape Tour, which began in The tour commences with a presentation on an outdoor water conservation topic and then visits up to 10 residences in Woodland with drought -tolerant landscapes. In 2015, over 200 people attended the event. The City also hosts workshops on rainwater harvesting, leak repair, and a four-part water-wise landscaping series. The City collects surveys at every event in order to improve each year and provide topics of interest to the public. Bill inserts Workshops/tours Contests Leak/high water use alerts Making in-house promotional material Public banners, digital signs, flyers Implementation of this DMM is expected to help the City achieve its water use targets by getting the public involved with conservation efforts. This is done by providing incentives in the form of rebates, enabling customers to compare their current water use to their previous use, providing information on drought severity through social media, newsletters, bill inserts, information booths and pubic events, and by teaching customers what they can do to help the environment Programs to Assess and Manage Distribution System Real Loss A water audit is a process of accounting for water use throughout a water system in order to quantify the unaccounted-for water. Unaccounted-for water is the difference between metered production and metered consumption on a system-wide basis. In 2011, the City conducted a city-wide water line leak detection audit. This study identified several leaks in the City s distribution system which amounted to an average of 1.2 million gallons of water loss per year. This 2011 audit only evaluated water loss in the City s distribution system while the more recent audits evaluate the entire system, including hydrant use and water loss through customer s water systems. The 2015 AWWA Water Audit reported that 158 million gallons (about 485 AF) of water were lost per day, which was 5.6 percent of the total production. The City has created a prioritized list based on known leaks and previous repairs in its distribution system pipes and implemented a 10-year system maintenance plan which is continually re-assessed. Each year, 5,000 to 15,000 feet of pipe are replaced. The City has also developed a map of leak and repair locations, in order to better manage the programs aimed to assess and manage distribution system real loss. The pipeline repairs and replacements are funded through an ongoing Capital Investment Program. June 2016 n\c\204\ \wp\uwmp\112315_9ch9 9-8 City of Woodland 2015 Urban Water Management Plan
85 Chapter 9 Demand Management Measures In 2014, an updated map was developed that noted leak and repair locations. The City continues to update this document. Implementation of this DMM is expected to help the City achieve its water use targets by reducing the amount of water that is lost from the distribution system Water Conservation Program Coordination and Staffing Support The City has had its Water Conservation Program since In total, the Water Conservation Budget pays for all or portions of three permanent staff positions for a total of 1.77 permanent FTEs and one part-time staff position. The Environmental Resource Analyst oversees the program and devotes 45 percent of time to the Water Conservation Program. There is one full-time Water Conservation Coordinator and one temporary, part-time Water Conservation Coordinator, both spending 100 percent of their time on water conservation. In addition, 32 percent of a full-time Code Compliance Officer position is dedicated to water conservation issues. Current Water Conservation Program Staff and their contact information is included below: Roberta Childers Environmental Resource Analyst Roberta.Childers@CityofWoodland.org (530) Jordan Power Water Conservation Coordinator Jordan.Power@CityofWoodland.org (530) Wayne Blanchard Water Conservation Coordinator Wayne.Blanchard@CityofWoodland.org (530) Pam Lial Code Compliance Officer Pam.Lial@CityofWoodland.org (530) Address: Water Conservation Program County Road 24 Woodland, CA June 2016 n\c\204\ \wp\uwmp\112315_9ch9 9-9 City of Woodland 2015 Urban Water Management Plan
86 Chapter 9 Demand Management Measures Water Conservation Program Funding The Water Conservation Program is funded through the City s Water Enterprise Fund in which revenues originate from water utility fees. The Water Conservation Program budgets are based on the fiscal year (FY) from July 1 June 31. Table 9-2 shows the history of the total budget allotted to the Water Conservation Program. Table 9-2. History of Current and Past Year Water Conservation Program Budgets FY FY FY FY FY FY Personnel Expenditures 189, , , , , , Discretionary (a) 54, , , , , , Non-Discretionary 24, , , , , , Total 268, , , , , , (a) In addition to typical office expenses, Discretionary Items include funding for rebates, advertising, contract services, training, and memberships. Implementation of this DMM is expected to help the City achieve its water use targets by ensuring that there is enough funding and staffing to support the operation of all the other DMMs. 9.2 OTHER DEMAND MANAGEMENT MEASURES In addition to the six DMMs described above, the City supports demand management through funding conferences and trainings for its Water Conservation Program staff and participating in relevant local and regional water groups. These programs are described below Conferences and Trainings The City encourages and funds Water Conservation staff to attend conferences and workshops to encourage collaboration and information sharing. The City also encourages and funds technical advancement of Water Conservation staff. Specifically, Water Conservation Coordinators become certified in American Water Works Association s Water Use Efficiency Practitioner program Memberships and Groups The City is a member of national water conservation groups including American Water Works Association and the Alliance for Water Efficiency. These groups offer the City grant funding and idea sharing opportunities. The City also participates in regional water groups like the Regional Water Authority and the Water Resources Association of Yolo County. Recently, the City was one of the founding members of a Water Conservation Coordinators group of Yolo County which comprises Water Conservation Coordinators from each of the cities in Yolo County and meets monthly. The City also began a citizen s group for input on water utility issues called the Water Utility Advisory Committee. This committee also meets monthly and weighs in on water utility issues including water conservation. The City also provides monthly water June 2016 n\c\204\ \wp\uwmp\112315_9ch City of Woodland 2015 Urban Water Management Plan
87 Chapter 9 Demand Management Measures conservation updates to the Sustainability Committee with members from the City Council, City staff, businesses, and the community. 9.3 PLANNED IMPLEMENTATION TO ACHIEVE WATER USE TARGETS In most instances, helping customers understand the savings that can be achieved and methods available to achieve these savings is enough to motivate change. Through the above DMMs, the City can help customers identify these savings, which in turn helps the City to achieve its water use targets. 9.4 MEMBERS OF THE CALIFORNIA URBAN WATER CONSERVATION COUNCIL In 1991 (amended September 16, 1999), a Memorandum of Understanding (MOU) regarding urban water conservation in California was made that formalizes an agreement between DWR, water utilities, environmental organizations, and other interested groups to implement Best Management Practices and make a cooperative effort to reduce the consumption of California s water resources. This MOU is administered by the California Urban Water Conservation Council (CUWCC). The City is not currently a signatory of the MOU and is therefore not a member of CUWCC. However, the City realizes the importance of the BMPs to ensure a reliable future water supply. The City is committed to implementing water conservation and water recycling programs to maximize sustainability in meeting future water needs for its customers. June 2016 n\c\204\ \wp\uwmp\112315_9ch City of Woodland 2015 Urban Water Management Plan
88 (THIS PAGE LEFT BLANK INTENTIONALLY)
89 CHAPTER 10 UWMP Adoption, Submittal, and Implementation This chapter provides information regarding the notification, public hearing and adoption of the UWMP INCLUSION OF ALL 2015 DATA Because 2015 is the first compliance year for SB X7-7, the 2015 UWMPs must contain data through the end of If the water supplier bases its accounting on a calendar year, the data must be through the end of the 2015 calendar year (December 2015). As indicated in Chapter 2, the City uses a calendar year for water supply and demand accounting, and therefore this 2015 UWMP includes data through December NOTICE OF PUBLIC HEARING The City provided 60-day notice of the preparation of its 2015 UWMP, and notice of the 2015 UWMP Public Hearing to the cities and County listed in Table 10-1 (DWR Table 10-1). Table Retail: Notification to Cities and Counties (DWR Table 10-1) City Name 60 Day Notice Notice of Public Hearing City of Davis City of West Sacramento City of Woodland County Name Yolo County 60 Day Notice Notice of Public Hearing Other agencies notified included the following: Reclamation District 2035 University of California, Davis Water Resources Association of Yolo County Westside IRWM Group Woodland Chamber of Commerce, Water Task Force WDCWA Yolo County Farm Bureau Yolo County Flood Control Water Conservation District June 2016 n\c\204\ \wp\uwmp\112315_10ch City of Woodland 2015 Urban Water Management Plan
90 Chapter 10 UWMP Adoption, Submittal, and Implementation Notice to the Public Public hearing notifications for adopting the UWMP were published in the local newspaper (The Daily Democrat) and on the City s website. Copies of the published Notice of Public Hearing are included in Appendix D PUBLIC HEARING AND ADOPTION The City has encouraged community and public interest involvement in the UWMP update through the use of mailings, public meetings, and web-based communication. Copies of the City s outreach efforts are included in Appendix D. The public hearing was held on June 7, The public hearings provided an opportunity for all City water users and the general public to become familiar with the UWMP and ask questions about the City s continuing plans for providing a reliable, safe, high-quality water supply. Hard copies of the draft UWMP were made available for public inspection at the City s offices during normal business hours and at the Woodland Public Library. An electronic copy was also posted on the City s website Adoption This UWMP was adopted by the City Council on June 7, A copy of the adopted resolution is provided in Appendix K UWMP SUBMITTAL A copy of this 2015 UWMP will be submitted to DWR within 30 days of adoption and by July 1, The adopted 2015 UWMP will be submitted electronically to DWR using the WUEdata submittal tool. A CD or hardcopy of the adopted 2015 UWMP will also be submitted to the California State Library. No later than 60 days after adoption, a copy of the adopted 2015 UWMP, including the Water Shortage Contingency Plan, will be provided to the cities and counties to which the City provides water PUBLIC AVAILABILITY No later than 30 days after submittal to DWR, hard copies of this UWMP will be available for public review at the City s offices during normal business hours and at the Woodland Public Library. An electronic copy of this UWMP will also be available for review and download on the City s website: June 2016 n\c\204\ \wp\uwmp\112315_10ch City of Woodland 2015 Urban Water Management Plan
91 Chapter 10 UWMP Adoption, Submittal, and Implementation 10.6 UWMP IMPLEMENTATION This UWMP will be the source document for any Senate Bill 610 Water Supply Assessments or Senate Bill 221 Water Supply Verifications required for any proposed projects between 2016 and 2020 that are subject to the California Environmental Quality Act and would demand an amount of water equivalent or greater than the amount of water required by a 500 dwelling unit project. This UWMP will also be used for regulatory compliance and provide guidance on development of new local supplies and implementation of water conservation programs and recycled water expansion to meet the requirements of the Act AMENDING AN ADOPTED UWMP If the City amends its 2015 UWMP, copies of amendments or changes to the plans will be submitted to DWR, the California State Library, and any city or county within which the supplier provides water supplies within 30 days after adoption. June 2016 n\c\204\ \wp\uwmp\112315_10ch City of Woodland 2015 Urban Water Management Plan
92 (THIS PAGE LEFT BLANK INTENTIONALLY)
93 APPENDIX A Legislative Requirements California Water Code Urban Water Management Planning California Water Code Sustainable Water Use and Demand Reduction
94 (THIS PAGE LEFT BLANK INTENTIONALLY)
95 AppendixAUrbanWaterManagementPlanningActFinalDraft A1 Appendix A California Water Code Urban Water Management Planning
96 AppendixAUrbanWaterManagementPlanningActFinalDraft CaliforniaWaterCodeDivision6,Part2.6. Chapter1.GeneralDeclarationandPolicy Chapter2.Definitions Chapter3.UrbanWaterManagementPlans Article1.GeneralProvisions Article2.ContentsofPlans Article2.5.WaterServiceReliability Article3.AdoptionAndImplementationofPlans Chapter4.MiscellaneousProvisions Chapter 1. General Declaration and Policy SECTION This part shall be known and may be cited as the "Urban Water Management Planning Act." (a) The Legislature finds and declares all of the following: (1) The waters of the state are a limited and renewable resource subject to everincreasing demands. (2) The conservation and efficient use of urban water supplies are of statewide concern; however, the planning for that use and the implementation of those plans can best be accomplished at the local level. (3) A long-term, reliable supply of water is essential to protect the productivity of California's businesses and economic climate. (4) As part of its long-range planning activities, every urban water supplier should make every effort to ensure the appropriate level of reliability in its water service sufficient to meet the needs of its various categories of customers during normal, dry, and multiple dry water years. (5) Public health issues have been raised over a number of contaminants that have been identified in certain local and imported water supplies. (6) Implementing effective water management strategies, including groundwater storage projects and recycled water projects, may require specific water quality and salinity targets for meeting groundwater basins water quality objectives and promoting beneficial use of recycled water. (7) Water quality regulations are becoming an increasingly important factor in water agencies' selection of raw water sources, treatment alternatives, and modifications to existing treatment facilities. A2
97 AppendixAUrbanWaterManagementPlanningActFinalDraft (8) Changes in drinking water quality standards may also impact the usefulness of water supplies and may ultimately impact supply reliability. (9) The quality of source supplies can have a significant impact on water management strategies and supply reliability. (b) This part is intended to provide assistance to water agencies in carrying out their long-term resource planning responsibilities to ensure adequate water supplies to meet existing and future demands for water The Legislature finds and declares that it is the policy of the state as follows: (a) The management of urban water demands and efficient use of water shall be actively pursued to protect both the people of the state and their water resources. (b) The management of urban water demands and efficient use of urban water supplies shall be a guiding criterion in public decisions. (c) Urban water suppliers shall be required to develop water management plans to actively pursue the efficient use of available supplies. Chapter 2. Definitions SECTION Unless the context otherwise requires, the definitions of this chapter govern the construction of this part Demand management" means those water conservation measures, programs, and incentives that prevent the waste of water and promote the reasonable and efficient use and reuse of available supplies "Customer" means a purchaser of water from a water supplier who uses the water for municipal purposes, including residential, commercial, governmental, and industrial uses "Efficient use" means those management measures that result in the most effective use of water so as to prevent its waste or unreasonable use or unreasonable method of use "Person" means any individual, firm, association, organization, partnership, business, trust, corporation, company, public agency, or any agency of such an entity "Plan" means an urban water management plan prepared pursuant to this part. A plan shall describe and evaluate sources of supply, reasonable and practical efficient uses, A3
98 AppendixAUrbanWaterManagementPlanningActFinalDraft reclamation and demand management activities. The components of the plan may vary according to an individual community or area's characteristics and its capabilities to efficiently use and conserve water. The plan shall address measures for residential, commercial, governmental, and industrial water demand management as set forth in Article 2 (commencing with Section 10630) of Chapter 3. In addition, a strategy and time schedule for implementation shall be included in the plan "Public agency" means any board, commission, county, city and county, city, regional agency, district, or other public entity "Recycled water" means the reclamation and reuse of wastewater for beneficial use "Urban water supplier" means a supplier, either publicly or privately owned, providing water for municipal purposes either directly or indirectly to more than 3,000 customers or supplying more than 3,000 acre-feet of water annually. An urban water supplier includes a supplier or contractor for water, regardless of the basis of right, which distributes or sells for ultimate resale to customers. This part applies only to water supplied from public water systems subject to Chapter 4 (commencing with Section ) of Part 12 of Division 104 of the Health and Safety Code. Chapter 3. Urban Water Management Plans Article1.GeneralProvisions SECTION (a) Every urban water supplier shall prepare and adopt an urban water management plan in the manner set forth in Article 3 (commencing with Section 10640). (b) Every person that becomes an urban water supplier shall adopt an urban water management plan within one year after it has become an urban water supplier. (c) An urban water supplier indirectly providing water shall not include planning elements in its water management plan as provided in Article 2 (commencing with Section 10630) that would be applicable to urban water suppliers or public agencies directly providing water, or to their customers, without the consent of those suppliers or public agencies. (d) (1) An urban water supplier may satisfy the requirements of this part by participation in areawide, regional, watershed, or basinwide urban water management planning where those plans will reduce preparation costs and contribute to the achievement of conservation and efficient water use. (2) Each urban water supplier shall coordinate the preparation of its plan with other appropriate agencies in the area, including other water suppliers that A4
99 AppendixAUrbanWaterManagementPlanningActFinalDraft share a common source, water management agencies, and relevant public agencies, to the extent practicable. (e) The urban water supplier may prepare the plan with its own staff, by contract, or in cooperation with other governmental agencies. (f) An urban water supplier shall describe in the plan water management tools and options used by that entity that will maximize resources and minimize the need to import water from other regions (a) Each urban water supplier shall update its plan at least once every five years on or before December 31, in years ending in five and zero, except as provided in subdivision (d). (b) Every urban water supplier required to prepare a plan pursuant to this part shall, at least 60 days before the public hearing on the plan required by Section 10642, notify any city or county within which the supplier provides water supplies that the urban water supplier will be reviewing the plan and considering amendments or changes to the plan. The urban water supplier may consult with, and obtain comments from, any city or county that receives notice pursuant to this subdivision. (c) The amendments to, or changes in, the plan shall be adopted and filed in the manner set forth in Article 3 (commencing with Section 10640). (d) Each urban water supplier shall update and submit its 2015 plan to the department by July 1, Article2.ContentsofPlan SECTION It is the intention of the Legislature, in enacting this part, to permit levels of water management planning commensurate with the numbers of customers served and the volume of water supplied A plan shall be adopted in accordance with this chapter that shall do all of the following: (a) Describe the service area of the supplier, including current and projected population, climate, and other demographic factors affecting the supplier's water management planning. The projected population estimates shall be based upon data from the state, regional, or local service agency population projections within the service area of the urban water supplier and shall be in five-year increments to 20 years or as far as data is available. (b) Identify and quantify, to the extent practicable, the existing and planned sources of water available to the supplier over the same five-year increments described in subdivision (a). If groundwater is identified as an existing or planned source of A5
100 AppendixAUrbanWaterManagementPlanningActFinalDraft water available to the supplier, all of the following information shall be included in the plan: (1) A copy of any groundwater management plan adopted by the urban water supplier, including plans adopted pursuant to Part 2.75 (commencing with Section 10750), or any other specific authorization for groundwater management. (2) A description of any groundwater basin or basins from which the urban water supplier pumps groundwater. For basins that a court or the board has adjudicated the rights to pump groundwater, a copy of the order or decree adopted by the court or the board and a description of the amount of groundwater the urban water supplier has the legal right to pump under the order or decree. For basins that have not been adjudicated, information as to whether the department has identified the basin or basins as overdrafted or has projected that the basin will become overdrafted if present management conditions continue, in the most current official departmental bulletin that characterizes the condition of the groundwater basin, and a detailed description of the efforts being undertaken by the urban water supplier to eliminate the long-term overdraft condition. (3) A detailed description and analysis of the location, amount, and sufficiency of groundwater pumped by the urban water supplier for the past five years. The description and analysis shall be based on information that is reasonably available, including, but not limited to, historic use records. (4) A detailed description and analysis of the amount and location of groundwater that is projected to be pumped by the urban water supplier. The description and analysis shall be based on information that is reasonably available, including, but not limited to, historic use records. (c) (1) Describe the reliability of the water supply and vulnerability to seasonal or climatic shortage, to the extent practicable, and provide data for each of the following: (A) An average water year. (B) A single-dry water year. (C) Multiple-dry water years. (2) For any water source that may not be available at a consistent level of use, given specific legal, environmental, water quality, or climatic factors, describe plans to supplement or replace that source with alternative sources or water demand management measures, to the extent practicable. A6
101 AppendixAUrbanWaterManagementPlanningActFinalDraft (d) Describe the opportunities for exchanges or transfers of water on a short-term or long-term basis. (e) (1) Quantify, to the extent records are available, past and current water use, over the same five-year increments described in subdivision (a), and projected water use, identifying the uses among water use sectors, including, but not necessarily limited to, all of the following uses: (A) Single-family residential. (B) Multifamily. (C) Commercial. (D) Industrial. (E) Institutional and governmental. (F) Landscape. (G) Sales to other agencies. (H) Saline water intrusion barriers, groundwater recharge, or conjunctive use, or any combination thereof. (I) Agricultural. (J) Distribution system water loss. (2) The water use projections shall be in the same five-year increments described in subdivision (a). (3) (A) For the 2015 urban water management plan update, the distribution system water loss shall be quantified for the most recent 12-month period available. For all subsequent updates, the distribution system water loss shall be quantified for each of the five years preceding the plan update. (B) The distribution system water loss quantification shall be reported in accordance with a worksheet approved or developed by the department through a public process. The water loss quantification worksheet shall be based on the water system balance methodology developed by the American Water Works Association. (4) (A) If available and applicable to an urban water supplier, water use projections may display and account for the water savings estimated to result from adopted codes, standards, ordinances, or transportation and land use plans identified by the urban water supplier, as applicable to the service area. A7
102 AppendixAUrbanWaterManagementPlanningActFinalDraft (B) To the extent that an urban water supplier reports the information described in subparagraph (A), an urban water supplier shall do both of the following: (i) Provide citations of the various codes, standards, ordinances, or transportation and land use plans utilized in making the projections. (ii) Indicate the extent that the water use projections consider savings from codes, standards, ordinances, or transportation and land use plans. Water use projections that do not account for these water savings shall be noted of that fact. (f) Provide a description of the supplier's water demand management measures. This description shall include all of the following: (1) (A) For an urban retail water supplier, as defined in Section , a narrative description that addresses the nature and extent of each water demand management measure implemented over the past five years. The narrative shall describe the water demand management measures that the supplier plans to implement to achieve its water use targets pursuant to Section (B) The narrative pursuant to this paragraph shall include descriptions of the following water demand management measures: (i) Water waste prevention ordinances. (ii) Metering. (iii) Conservation pricing. (iv) Public education and outreach. (v) Programs to assess and manage distribution system real loss. (vi) Water conservation program coordination and staffing support. (vii) Other demand management measures that have a significant impact on water use as measured in gallons per capita per day, including innovative measures, if implemented. (2) For an urban wholesale water supplier, as defined in Section , a narrative description of the items in clauses (ii), (iv), (vi), and (vii) of subparagraph (B) of paragraph (1), and a narrative description of its distribution system asset management and wholesale supplier assistance programs. (g) Include a description of all water supply projects and water supply programs that may be undertaken by the urban water supplier to meet the total projected water A8
103 AppendixAUrbanWaterManagementPlanningActFinalDraft use, as established pursuant to subdivision (a) of Section The urban water supplier shall include a detailed description of expected future projects and programs that the urban water supplier may implement to increase the amount of the water supply available to the urban water supplier in average, single-dry, and multiple-dry water years. The description shall identify specific projects and include a description of the increase in water supply that is expected to be available from each project. The description shall include an estimate with regard to the implementation timeline for each project or program. (h) Describe the opportunities for development of desalinated water, including, but not limited to, ocean water, brackish water, and groundwater, as a long-term supply. (i) For purposes of this part, urban water suppliers that are members of the California Urban Water Conservation Council shall be deemed in compliance with the requirements of subdivision (f) by complying with all the provisions of the "Memorandum of Understanding Regarding Urban Water Conservation in California," dated December 10, 2008, as it may be amended, and by submitting the annual reports required by Section 6.2 of that memorandum. (j) An urban water supplier that relies upon a wholesale agency for a source of water shall provide the wholesale agency with water use projections from that agency for that source of water in five-year increments to 20 years or as far as data is available. The wholesale agency shall provide information to the urban water supplier for inclusion in the urban water supplier's plan that identifies and quantifies, to the extent practicable, the existing and planned sources of water as required by subdivision (b), available from the wholesale agency to the urban water supplier over the same five-year increments, and during various water-year types in accordance with subdivision (c). An urban water supplier may rely upon water supply information provided by the wholesale agency in fulfilling the plan informational requirements of subdivisions (b) and (c) (a) The water use projections required by Section shall include projected water use for single-family and multifamily residential housing needed for lower income households, as defined in Section of the Health and Safety Code, as identified in the housing element of any city, county, or city and county in the service area of the supplier. (b) It is the intent of the Legislature that the identification of projected water use for single-family and multifamily residential housing for lower income households will assist a supplier in complying with the requirement under Section of the Government Code to grant a priority for the provision of service to housing units affordable to lower income households. A9
104 AppendixAUrbanWaterManagementPlanningActFinalDraft (a) In addition to the requirements of Section 10631, an urban water management plan may, but is not required to, include any of the following information: (1) An estimate of the amount of energy used to extract or divert water supplies. (2) An estimate of the amount of energy used to convey water supplies to the water treatment plants or distribution systems. (3) An estimate of the amount of energy used to treat water supplies. (4) An estimate of the amount of energy used to distribute water supplies through its distribution systems. (5) An estimate of the amount of energy used for treated water supplies in comparison to the amount used for nontreated water supplies. (6) An estimate of the amount of energy used to place water into or withdraw from storage. (7) Any other energy-related information the urban water supplier deems appropriate. (b) The department shall include in its guidance for the preparation of urban water management plans a methodology for the voluntary calculation or estimation of the energy intensity of urban water systems. The department may consider studies and calculations conducted by the Public Utilities Commission in developing the methodology (a) (1) Beginning January 1, 2009, the terms of, and eligibility for, a water management grant or loan made to an urban water supplier and awarded or administered by the department, state board, or California Bay-Delta Authority or its successor agency shall be conditioned on the implementation of the water demand management measures described in Section 10631, as determined by the department pursuant to subdivision (b). (2) For the purposes of this section, water management grants and loans include funding for programs and projects for surface water or groundwater storage, recycling, desalination, water conservation, water supply reliability, and water supply augmentation. This section does not apply to water management projects funded by the federal American Recovery and Reinvestment Act of 2009 (Public Law 111-5). (3) Notwithstanding paragraph (1), the department shall determine that an urban water supplier is eligible for a water management grant or loan even though the supplier is not implementing all of the water demand management measures described in Section 10631, if the urban water supplier has A10
105 AppendixAUrbanWaterManagementPlanningActFinalDraft submitted to the department for approval a schedule, financing plan, and budget, to be included in the grant or loan agreement, for implementation of the water demand management measures. The supplier may request grant or loan funds to implement the water demand management measures to the extent the request is consistent with the eligibility requirements applicable to the water management funds. (4) (A) Notwithstanding paragraph (1), the department shall determine that an urban water supplier is eligible for a water management grant or loan even though the supplier is not implementing all of the water demand management measures described in Section 10631, if an urban water supplier submits to the department for approval documentation demonstrating that a water demand management measure is not locally cost effective. If the department determines that the documentation submitted by the urban water supplier fails to demonstrate that a water demand management measure is not locally cost effective, the department shall notify the urban water supplier and the agency administering the grant or loan program within 120 days that the documentation does not satisfy the requirements for an exemption, and include in that notification a detailed statement to support the determination. (B) For purposes of this paragraph, "not locally cost effective" means that the present value of the local benefits of implementing a water demand management measure is less than the present value of the local costs of implementing that measure. (b) (1) The department, in consultation with the state board and the California Bay- Delta Authority or its successor agency, and after soliciting public comment regarding eligibility requirements, shall develop eligibility requirements to implement the requirement of paragraph (1) of subdivision (a). In establishing these eligibility requirements, the department shall do both of the following: (A) Consider the conservation measures described in the Memorandum of Understanding Regarding Urban Water Conservation in California, and alternative conservation approaches that provide equal or greater water savings. (B) Recognize the different legal, technical, fiscal, and practical roles and responsibilities of wholesale water suppliers and retail water suppliers. (2) (A) For the purposes of this section, the department shall determine whether an urban water supplier is implementing all of the water demand management measures described in Section based on either, or a combination, of the following: A11
106 AppendixAUrbanWaterManagementPlanningActFinalDraft (i) Compliance on an individual basis. (ii) Compliance on a regional basis. Regional compliance shall require participation in a regional conservation program consisting of two or more urban water suppliers that achieves the level of conservation or water efficiency savings equivalent to the amount of conservation or savings achieved if each of the participating urban water suppliers implemented the water demand management measures. The urban water supplier administering the regional program shall provide participating urban water suppliers and the department with data to demonstrate that the regional program is consistent with this clause. The department shall review the data to determine whether the urban water suppliers in the regional program are meeting the eligibility requirements. (B) The department may require additional information for any determination pursuant to this section. (3) The department shall not deny eligibility to an urban water supplier in compliance with the requirements of this section that is participating in a multiagency water project, or an integrated regional water management plan, developed pursuant to Section of the Public Resources Code, solely on the basis that one or more of the agencies participating in the project or plan is not implementing all of the water demand management measures described in Section (c) In establishing guidelines pursuant to the specific funding authorization for any water management grant or loan program subject to this section, the agency administering the grant or loan program shall include in the guidelines the eligibility requirements developed by the department pursuant to subdivision (b). (d) Upon receipt of a water management grant or loan application by an agency administering a grant and loan program subject to this section, the agency shall request an eligibility determination from the department with respect to the requirements of this section. The department shall respond to the request within 60 days of the request. (e) The urban water supplier may submit to the department copies of its annual reports and other relevant documents to assist the department in determining whether the urban water supplier is implementing or scheduling the implementation of water demand management activities. In addition, for urban water suppliers that are signatories to the Memorandum of Understanding Regarding Urban Water Conservation in California and submit biennial reports to the California Urban Water Conservation Council in accordance with the memorandum, the department may use these reports to assist in tracking the implementation of water demand management measures. A12
107 AppendixAUrbanWaterManagementPlanningActFinalDraft (f) This section shall remain in effect only until July 1, 2016, and as of that date is repealed, unless a later enacted statute, that is enacted before July 1, 2016, deletes or extends that date The department, in consultation with the California Urban Water Conservation Council, shall convene an independent technical panel to provide information and recommendations to the department and the Legislature on new demand management measures, technologies, and approaches. The panel shall consist of no more than seven members, who shall be selected by the department to reflect a balanced representation of experts. The panel shall have at least one, but no more than two, representatives from each of the following: retail water suppliers, environmental organizations, the business community, wholesale water suppliers, and academia. The panel shall be convened by January 1, 2009, and shall report to the Legislature no later than January 1, 2010, and every five years thereafter. The department shall review the panel report and include in the final report to the Legislature the department's recommendations and comments regarding the panel process and the panel's recommendations (a) The plan shall provide an urban water shortage contingency analysis that includes each of the following elements that are within the authority of the urban water supplier: (1) Stages of action to be undertaken by the urban water supplier in response to water supply shortages, including up to a 50 percent reduction in water supply, and an outline of specific water supply conditions that are applicable to each stage. (2) An estimate of the minimum water supply available during each of the next three water years based on the driest three-year historic sequence for the agency's water supply. (3) Actions to be undertaken by the urban water supplier to prepare for, and implement during, a catastrophic interruption of water supplies including, but not limited to, a regional power outage, an earthquake, or other disaster. (4) Additional, mandatory prohibitions against specific water use practices during water shortages, including, but not limited to, prohibiting the use of potable water for street cleaning. (5) Consumption reduction methods in the most restrictive stages. Each urban water supplier may use any type of consumption reduction methods in its water shortage contingency analysis that would reduce water use, are A13
108 AppendixAUrbanWaterManagementPlanningActFinalDraft appropriate for its area, and have the ability to achieve a water use reduction consistent with up to a 50 percent reduction in water supply. (6) Penalties or charges for excessive use, where applicable. (7) An analysis of the impacts of each of the actions and conditions described in paragraphs (1) to (6), inclusive, on the revenues and expenditures of the urban water supplier, and proposed measures to overcome those impacts, such as the development of reserves and rate adjustments. (8) A draft water shortage contingency resolution or ordinance. (9) A mechanism for determining actual reductions in water use pursuant to the urban water shortage contingency analysis. (b) Commencing with the urban water management plan update due July 1, 2016, for purposes of developing the water shortage contingency analysis pursuant to subdivision (a), the urban water supplier shall analyze and define water features that are artificially supplied with water, including ponds, lakes, waterfalls, and fountains, separately from swimming pools and spas, as defined in subdivision (a) of Section of the Health and Safety Code The plan shall provide, to the extent available, information on recycled water and its potential for use as a water source in the service area of the urban water supplier. The preparation of the plan shall be coordinated with local water, wastewater, groundwater, and planning agencies that operate within the supplier's service area, and shall include all of the following: (a) A description of the wastewater collection and treatment systems in the supplier's service area, including a quantification of the amount of wastewater collected and treated and the methods of wastewater disposal. (b) A description of the quantity of treated wastewater that meets recycled water standards, is being discharged, and is otherwise available for use in a recycled water project. (c) A description of the recycled water currently being used in the supplier's service area, including, but not limited to, the type, place, and quantity of use. (d) A description and quantification of the potential uses of recycled water, including, but not limited to, agricultural irrigation, landscape irrigation, wildlife habitat enhancement, wetlands, industrial reuse, groundwater recharge, indirect potable reuse, and other appropriate uses, and a determination with regard to the technical and economic feasibility of serving those uses. A14
109 AppendixAUrbanWaterManagementPlanningActFinalDraft (e) The projected use of recycled water within the supplier's service area at the end of 5, 10, 15, and 20 years, and a description of the actual use of recycled water in comparison to uses previously projected pursuant to this subdivision. (f) A description of actions, including financial incentives, which may be taken to encourage the use of recycled water, and the projected results of these actions in terms of acre-feet of recycled water used per year. (g) A plan for optimizing the use of recycled water in the supplier's service area, including actions to facilitate the installation of dual distribution systems, to promote recirculating uses, to facilitate the increased use of treated wastewater that meets recycled water standards, and to overcome any obstacles to achieving that increased use The plan shall include information, to the extent practicable, relating to the quality of existing sources of water available to the supplier over the same five-year increments as described in subdivision (a) of Section 10631, and the manner in which water quality affects water management strategies and supply reliability. Article2.5.WaterServiceReliability SECTION (a) Every urban water supplier shall include, as part of its urban water management plan, an assessment of the reliability of its water service to its customers during normal, dry, and multiple dry water years. This water supply and demand assessment shall compare the total water supply sources available to the water supplier with the total projected water use over the next 20 years, in five-year increments, for a normal water year, a single dry water year, and multiple dry water years. The water service reliability assessment shall be based upon the information compiled pursuant to Section 10631, including available data from state, regional, or local agency population projections within the service area of the urban water supplier. (b) The urban water supplier shall provide that portion of its urban water management plan prepared pursuant to this article to any city or county within which it provides water supplies no later than 60 days after the submission of its urban water management plan. (c) Nothing in this article is intended to create a right or entitlement to water service or any specific level of water service. A15
110 AppendixAUrbanWaterManagementPlanningActFinalDraft (d) Nothing in this article is intended to change existing law concerning an urban water supplier's obligation to provide water service to its existing customers or to any potential future customers. Article3.AdoptionandImplementationofPlans SECTION Every urban water supplier required to prepare a plan pursuant to this part shall prepare its plan pursuant to Article 2 (commencing with Section 10630). The supplier shall likewise periodically review the plan as required by Section 10621, and any amendments or changes required as a result of that review shall be adopted pursuant to this article An urban water supplier required to prepare a plan may consult with, and obtain comments from, any public agency or state agency or any person who has special expertise with respect to water demand management methods and techniques Each urban water supplier shall encourage the active involvement of diverse social, cultural, and economic elements of the population within the service area prior to and during the preparation of the plan. Prior to adopting a plan, the urban water supplier shall make the plan available for public inspection and shall hold a public hearing thereon. Prior to the hearing, notice of the time and place of hearing shall be published within the jurisdiction of the publicly owned water supplier pursuant to Section 6066 of the Government Code. The urban water supplier shall provide notice of the time and place of hearing to any city or county within which the supplier provides water supplies. A privately owned water supplier shall provide an equivalent notice within its service area. After the hearing, the plan shall be adopted as prepared or as modified after the hearing An urban water supplier shall implement its plan adopted pursuant to this chapter in accordance with the schedule set forth in its plan (a) (1) An urban water supplier shall submit to the department, the California State Library, and any city or county within which the supplier provides water supplies a copy of its plan no later than 30 days after adoption. Copies of amendments or changes to the plans shall be submitted to the department, the California State Library, and any city or county within which the supplier provides water supplies within 30 days after adoption. (2) The plan, or amendments to the plan, submitted to the department pursuant to paragraph (1) shall be submitted electronically and shall include any standardized forms, tables, or displays specified by the department. A A16 -
111 AppendixAUrbanWaterManagementPlanningActFinalDraft (b) (1) Notwithstanding Section of the Government Code, the department shall prepare and submit to the Legislature, on or before December 31, in the years ending in six and one, a report summarizing the status of the plans adopted pursuant to this part. The report prepared by the department shall identify the exemplary elements of the individual plans. The department shall provide a copy of the report to each urban water supplier that has submitted its plan to the department. The department shall also prepare reports and provide data for any legislative hearings designed to consider the effectiveness of plans submitted pursuant to this part. (2) A report to be submitted pursuant to paragraph (1) shall be submitted in compliance with Section 9795 of the Government Code. (c) (1) For the purpose of identifying the exemplary elements of the individual plans, the department shall identify in the report water demand management measures adopted and implemented by specific urban water suppliers, and identified pursuant to Section 10631, that achieve water savings significantly above the levels established by the department to meet the requirements of Section (2) The department shall distribute to the panel convened pursuant to Section the results achieved by the implementation of those water demand management measures described in paragraph (1). (3) The department shall make available to the public the standard the department will use to identify exemplary water demand management measures Not later than 30 days after filing a copy of its plan with the department, the urban water supplier and the department shall make the plan available for public review during normal business hours. Chapter 4. Miscellaneous Provisions SECTION Any actions or proceedings to attack, review, set aside, void, or annul the acts or decisions of an urban water supplier on the grounds of noncompliance with this part shall be commenced as follows: (a) An action or proceeding alleging failure to adopt a plan shall be commenced within 18 months after that adoption is required by this part. A17
112 AppendixAUrbanWaterManagementPlanningActFinalDraft (b) Any action or proceeding alleging that a plan, or action taken pursuant to the plan, does not comply with this part shall be commenced within 90 days after filing of the plan or amendment thereto pursuant to Section or the taking of that action In any action or proceeding to attack, review, set aside, void, or annul a plan, or an action taken pursuant to the plan by an urban water supplier on the grounds of noncompliance with this part, the inquiry shall extend only to whether there was a prejudicial abuse of discretion. Abuse of discretion is established if the supplier has not proceeded in a manner required by law or if the action by the water supplier is not supported by substantial evidence The California Environmental Quality Act (Division 13 (commencing with Section 21000) of the Public Resources Code) does not apply to the preparation and adoption of plans pursuant to this part or to the implementation of actions taken pursuant to Section Nothing in this part shall be interpreted as exempting from the California Environmental Quality Act any project that would significantly affect water supplies for fish and wildlife, or any project for implementation of the plan, other than projects implementing Section 10632, or any project for expanded or additional water supplies The adoption of a plan shall satisfy any requirements of state law, regulation, or order, including those of the State Water Resources Control Board and the Public Utilities Commission, for the preparation of water management plans or conservation plans; provided, that if the State Water Resources Control Board or the Public Utilities Commission requires additional information concerning water conservation to implement its existing authority, nothing in this part shall be deemed to limit the board or the commission in obtaining that information. The requirements of this part shall be satisfied by any urban water demand management plan prepared to meet federal laws or regulations after the effective date of this part, and which substantially meets the requirements of this part, or by any existing urban water management plan which includes the contents of a plan required under this part An urban water supplier may recover in its rates the costs incurred in preparing its plan and implementing the reasonable water conservation measures included in the plan. Any best water management practice that is included in the plan that is identified in the "Memorandum of Understanding Regarding Urban Water Conservation in California" is deemed to be reasonable for the purposes of this section If any provision of this part or the application thereof to any person or circumstances is held invalid, that invalidity shall not affect other provisions or applications of this part which can be given effect without the invalid provision or application thereof, and to this end the provisions of this part are severable An urban water supplier that does not prepare, adopt, and submit its urban water management plan to the department in accordance with this part, is ineligible to receive funding pursuant to Division 24 (commencing with Section 78500) or Division 26 A18
113 AppendixAUrbanWaterManagementPlanningActFinalDraft (commencing with Section 79000), or receive drought assistance from the state until the urban water management plan is submitted pursuant to this article. A19
114 (THIS PAGE LEFT BLANK INTENTIONALLY)
115 AppendixBSustainableWaterUseandDemandReduction(SBX77)FinalDraft B1 Appendix B California Water Code Sustainable Water Use and Demand Reduction A - 20
116 AppendixBSustainableWaterUseandDemandReduction(SBX77)FinalDraft CaliforniaWaterCodeDivision6,Part2.55. Chapter1.GeneralDeclarationsandPolicy Chapter2.Definitions Chapter3.UrbanRetailWaterSuppliers Chapter4.AgriculturalWaterSuppliers Chapter5.SustainableWaterManagement Chapter6StandardizedDataCollection Chapter7FundingProvisions Chapter8QuantifyingAgriculturalWaterUseEfficiency Chapter 1. General Declarations and Policy SECTION The Legislature finds and declares all of the following: (a) Water is a public resource that the California Constitution protects against waste and unreasonable use. (b) Growing population, climate change, and the need to protect and grow California's economy while protecting and restoring our fish and wildlife habitats make it essential that the state manage its water resources as efficiently as possible. (c) Diverse regional water supply portfolios will increase water supply reliability and reduce dependence on the Delta. (d) Reduced water use through conservation provides significant energy and environmental benefits, and can help protect water quality, improve streamflows, and reduce greenhouse gas emissions. (e) The success of state and local water conservation programs to increase efficiency of water use is best determined on the basis of measurable outcomes related to water use or efficiency. (f) Improvements in technology and management practices offer the potential for increasing water efficiency in California over time, providing an essential water management tool to meet the need for water for urban, agricultural, and environmental uses. (g) The Governor has called for a 20 percent per capita reduction in urban water use statewide by (h) The factors used to formulate water use efficiency targets can vary significantly from location to location based on factors including weather, patterns of urban and suburban development, and past efforts to enhance water use efficiency. B2 A - 21
117 AppendixBSustainableWaterUseandDemandReduction(SBX77)FinalDraft (i) Per capita water use is a valid measure of a water provider's efforts to reduce urban water use within its service area. However, per capita water use is less useful for measuring relative water use efficiency between different water providers. Differences in weather, historical patterns of urban and suburban development, and density of housing in a particular location need to be considered when assessing per capita water use as a measure of efficiency It is the intent of the Legislature, by the enactment of this part, to do all of the following: (a) Require all water suppliers to increase the efficiency of use of this essential resource. (b) Establish a framework to meet the state targets for urban water conservation identified in this part and called for by the Governor. (c) Measure increased efficiency of urban water use on a per capita basis. (d) Establish a method or methods for urban retail water suppliers to determine targets for achieving increased water use efficiency by the year 2020, in accordance with the Governor's goal of a 20-percent reduction. (e) Establish consistent water use efficiency planning and implementation standards for urban water suppliers and agricultural water suppliers. (f) Promote urban water conservation standards that are consistent with the California Urban Water Conservation Council's adopted best management practices and the requirements for demand management in Section (g) Establish standards that recognize and provide credit to water suppliers that made substantial capital investments in urban water conservation since the drought of the early 1990s. (h) Recognize and account for the investment of urban retail water suppliers in providing recycled water for beneficial uses. (i) Require implementation of specified efficient water management practices for agricultural water suppliers. (j) Support the economic productivity of California's agricultural, commercial, and industrial sectors. (k) Advance regional water resources management (a) (1) Water use efficiency measures adopted and implemented pursuant to this part or Part 2.8 (commencing with Section 10800) are water conservation measures subject to the protections provided under Section (2) Because an urban agency is not required to meet its urban water use target until 2020 pursuant to subdivision (b) of Section , an urban retail water supplier's failure to meet those targets shall not establish a violation of law for purposes of any state administrative or judicial proceeding prior to B3 A - 22
118 AppendixBSustainableWaterUseandDemandReduction(SBX77)FinalDraft January 1, Nothing in this paragraph limits the use of data reported to the department or the board in litigation or an administrative proceeding. This paragraph shall become inoperative on January 1, (3) To the extent feasible, the department and the board shall provide for the use of water conservation reports required under this part to meet the requirements of Section 1011 for water conservation reporting. (b) This part does not limit or otherwise affect the application of Chapter 3.5 (commencing with Section 11340), Chapter 4 (commencing with Section 11370), Chapter 4.5 (commencing with Section 11400), and Chapter 5 (commencing with Section 11500) of Part 1 of Division 3 of Title 2 of the Government Code. (c) This part does not require a reduction in the total water used in the agricultural or urban sectors, because other factors, including, but not limited to, changes in agricultural economics or population growth may have greater effects on water use. This part does not limit the economic productivity of California's agricultural, commercial, or industrial sectors. (d) The requirements of this part do not apply to an agricultural water supplier that is a party to the Quantification Settlement Agreement, as defined in subdivision (a) of Section 1 of Chapter 617 of the Statutes of 2002, during the period within which the Quantification Settlement Agreement remains in effect. After the expiration of the Quantification Settlement Agreement, to the extent conservation water projects implemented as part of the Quantification Settlement Agreement remain in effect, the conserved water created as part of those projects shall be credited against the obligations of the agricultural water supplier pursuant to this part. Chapter 2 Definitions SECTION Unless the context otherwise requires, the following definitions govern the construction of this part: (a) "Agricultural water supplier" means a water supplier, either publicly or privately owned, providing water to 10,000 or more irrigated acres, excluding recycled water. "Agricultural water supplier" includes a supplier or contractor for water, regardless of the basis of right, that distributes or sells water for ultimate resale to customers. "Agricultural water supplier" does not include the department. (b) "Base daily per capita water use" means any of the following: (1) The urban retail water supplier's estimate of its average gross water use, reported in gallons per capita per day and calculated over a continuous 10- year period ending no earlier than December 31, 2004, and no later than December 31, B4 A - 23
119 AppendixBSustainableWaterUseandDemandReduction(SBX77)FinalDraft (2) For an urban retail water supplier that meets at least 10 percent of its 2008 measured retail water demand through recycled water that is delivered within the service area of an urban retail water supplier or its urban wholesale water supplier, the urban retail water supplier may extend the calculation described in paragraph (1) up to an additional five years to a maximum of a continuous 15-year period ending no earlier than December 31, 2004, and no later than December 31, (3) For the purposes of Section , the urban retail water supplier's estimate of its average gross water use, reported in gallons per capita per day and calculated over a continuous five-year period ending no earlier than December 31, 2007, and no later than December 31, (c) "Baseline commercial, industrial, and institutional water use" means an urban retail water supplier's base daily per capita water use for commercial, industrial, and institutional users. (d) "Commercial water user" means a water user that provides or distributes a product or service. (e) "Compliance daily per capita water use" means the gross water use during the final year of the reporting period, reported in gallons per capita per day. (f) "Disadvantaged community" means a community with an annual median household income that is less than 80 percent of the statewide annual median household income. (g) "Gross water use" means the total volume of water, whether treated or untreated, entering the distribution system of an urban retail water supplier, excluding all of the following: (1) Recycled water that is delivered within the service area of an urban retail water supplier or its urban wholesale water supplier. (2) The net volume of water that the urban retail water supplier places into longterm storage. (3) The volume of water the urban retail water supplier conveys for use by another urban water supplier. (4) The volume of water delivered for agricultural use, except as otherwise provided in subdivision (f) of Section (h) "Industrial water user" means a water user that is primarily a manufacturer or processor of materials as defined by the North American Industry Classification System code sectors 31 to 33, inclusive, or an entity that is a water user primarily engaged in research and development. (i) "Institutional water user" means a water user dedicated to public service. This type of user includes, among other users, higher education institutions, schools, courts, churches, hospitals, government facilities, and nonprofit research institutions. B5 A - 24
120 AppendixBSustainableWaterUseandDemandReduction(SBX77)FinalDraft (j) "Interim urban water use target" means the midpoint between the urban retail water supplier's base daily per capita water use and the urban retail water supplier's urban water use target for (k) "Locally cost effective" means that the present value of the local benefits of implementing an agricultural efficiency water management practice is greater than or equal to the present value of the local cost of implementing that measure. (l) "Process water" means water used for producing a product or product content or water used for research and development, including, but not limited to, continuous manufacturing processes, water used for testing and maintaining equipment used in producing a product or product content, and water used in combined heat and power facilities used in producing a product or product content. Process water does not mean incidental water uses not related to the production of a product or product content, including, but not limited to, water used for restrooms, landscaping, air conditioning, heating, kitchens, and laundry. (m) "Recycled water" means recycled water, as defined in subdivision (n) of Section 13050, that is used to offset potable demand, including recycled water supplied for direct use and indirect potable reuse, that meets the following requirements, where applicable: (1) For groundwater recharge, including recharge through spreading basins, water supplies that are all of the following: (A) Metered. (B) Developed through planned investment by the urban water supplier or a wastewater treatment agency. (C) Treated to a minimum tertiary level. (D) Delivered within the service area of an urban retail water supplier or its urban wholesale water supplier that helps an urban retail water supplier meet its urban water use target. (2) For reservoir augmentation, water supplies that meet the criteria of paragraph (1) and are conveyed through a distribution system constructed specifically for recycled water. (n) "Regional water resources management" means sources of supply resulting from watershed-based planning for sustainable local water reliability or any of the following alternative sources of water: (1) The capture and reuse of stormwater or rainwater. (2) The use of recycled water. (3) The desalination of brackish groundwater. B6 A - 25
121 AppendixBSustainableWaterUseandDemandReduction(SBX77)FinalDraft (4) The conjunctive use of surface water and groundwater in a manner that is consistent with the safe yield of the groundwater basin. (o) "Reporting period" means the years for which an urban retail water supplier reports compliance with the urban water use targets. (p) "Urban retail water supplier" means a water supplier, either publicly or privately owned, that directly provides potable municipal water to more than 3,000 end users or that supplies more than 3,000 acre-feet of potable water annually at retail for municipal purposes. (q) "Urban water use target" means the urban retail water supplier's targeted future daily per capita water use. (r) "Urban wholesale water supplier," means a water supplier, either publicly or privately owned, that provides more than 3,000 acre-feet of water annually at wholesale for potable municipal purposes. Chapter 3 Urban Retail Water Suppliers SECTION (a) The state shall achieve a 20-percent reduction in urban per capita water use in California on or before December 31, (b) The state shall make incremental progress towards the state target specified in subdivision (a) by reducing urban per capita water use by at least 10 percent on or before December 31, (a) (1) Each urban retail water supplier shall develop urban water use targets and an interim urban water use target by July 1, Urban retail water suppliers may elect to determine and report progress toward achieving these targets on an individual or regional basis, as provided in subdivision (a) of Section , and may determine the targets on a fiscal year or calendar year basis. (2) It is the intent of the Legislature that the urban water use targets described in paragraph (1) cumulatively result in a 20-percent reduction from the baseline daily per capita water use by December 31, (b) An urban retail water supplier shall adopt one of the following methods for determining its urban water use target pursuant to subdivision (a): (1) Eighty percent of the urban retail water supplier's baseline per capita daily water use. (2) The per capita daily water use that is estimated using the sum of the following performance standards: B7 A - 26
122 AppendixBSustainableWaterUseandDemandReduction(SBX77)FinalDraft (A) For indoor residential water use, 55 gallons per capita daily water use as a provisional standard. Upon completion of the department's 2016 report to the Legislature pursuant to Section , this standard may be adjusted by the Legislature by statute. (B) For landscape irrigated through dedicated or residential meters or connections, water efficiency equivalent to the standards of the Model Water Efficient Landscape Ordinance set forth in Chapter 2.7 (commencing with Section 490) of Division 2 of Title 23 of the California Code of Regulations, as in effect the later of the year of the landscape's installation or An urban retail water supplier using the approach specified in this subparagraph shall use satellite imagery, site visits, or other best available technology to develop an accurate estimate of landscaped areas. (C) For commercial, industrial, and institutional uses, a 10-percent reduction in water use from the baseline commercial, industrial, and institutional water use by (3) Ninety-five percent of the applicable state hydrologic region target, as set forth in the state's draft 20x2020 Water Conservation Plan (dated April 30, 2009). If the service area of an urban water supplier includes more than one hydrologic region, the supplier shall apportion its service area to each region based on population or area. (4) A method that shall be identified and developed by the department, through a public process, and reported to the Legislature no later than December 31, The method developed by the department shall identify per capita targets that cumulatively result in a statewide 20-percent reduction in urban daily per capita water use by December 31, In developing urban daily per capita water use targets, the department shall do all of the following: (A) Consider climatic differences within the state. (B) Consider population density differences within the state. (C) Provide flexibility to communities and regions in meeting the targets. (D) Consider different levels of per capita water use according to plant water needs in different regions. (E) Consider different levels of commercial, industrial, and institutional water use in different regions of the state. (F) Avoid placing an undue hardship on communities that have implemented conservation measures or taken actions to keep per capita water use low. (c) If the department adopts a regulation pursuant to paragraph (4) of subdivision (b) that results in a requirement that an urban retail water supplier achieve a reduction in daily per capita water use that is greater than 20 percent by December 31, 2020, an urban retail water supplier that adopted the method B8 A - 27
123 AppendixBSustainableWaterUseandDemandReduction(SBX77)FinalDraft described in paragraph (4) of subdivision (b) may limit its urban water use target to a reduction of not more than 20 percent by December 31, 2020, by adopting the method described in paragraph (1) of subdivision (b). (d) The department shall update the method described in paragraph (4) of subdivision (b) and report to the Legislature by December 31, An urban retail water supplier that adopted the method described in paragraph (4) of subdivision (b) may adopt a new urban daily per capita water use target pursuant to this updated method. (e) An urban retail water supplier shall include in its urban water management plan due in 2010 pursuant to Part 2.6 (commencing with Section 10610) the baseline daily per capita water use, urban water use target, interim urban water use target, and compliance daily per capita water use, along with the bases for determining those estimates, including references to supporting data. (f) When calculating per capita values for the purposes of this chapter, an urban retail water supplier shall determine population using federal, state, and local population reports and projections. (g) An urban retail water supplier may update its 2020 urban water use target in its 2015 urban water management plan required pursuant to Part 2.6 (commencing with Section 10610). (h) (1) The department, through a public process and in consultation with the California Urban Water Conservation Council, shall develop technical methodologies and criteria for the consistent implementation of this part, including, but not limited to, both of the following: (A) Methodologies for calculating base daily per capita water use, baseline commercial, industrial, and institutional water use, compliance daily per capita water use, gross water use, service area population, indoor residential water use, and landscaped area water use. (B) Criteria for adjustments pursuant to subdivisions (d) and (e) of Section (2) The department shall post the methodologies and criteria developed pursuant to this subdivision on its Internet Web site, and make written copies available, by October 1, An urban retail water supplier shall use the methods developed by the department in compliance with this part. (i) (1) The department shall adopt regulations for implementation of the provisions relating to process water in accordance with subdivision (l) of Section , subdivision (e) of Section , and subdivision (d) of Section (2) The initial adoption of a regulation authorized by this subdivision is deemed to address an emergency, for purposes of Sections and of the Government Code, and the department is hereby exempted for that purpose from the requirements of subdivision (b) of Section of the B9 A - 28
124 AppendixBSustainableWaterUseandDemandReduction(SBX77)FinalDraft Government Code. After the initial adoption of an emergency regulation pursuant to this subdivision, the department shall not request approval from the Office of Administrative Law to readopt the regulation as an emergency regulation pursuant to Section of the Government Code. (j) (1) An urban retail water supplier is granted an extension to July 1, 2011, for adoption of an urban water management plan pursuant to Part 2.6 (commencing with Section 10610) due in 2010 to allow the use of technical methodologies developed by the department pursuant to paragraph (4) of subdivision (b) and subdivision (h). An urban retail water supplier that adopts an urban water management plan due in 2010 that does not use the methodologies developed by the department pursuant to subdivision (h) shall amend the plan by July 1, 2011, to comply with this part. (2) An urban wholesale water supplier whose urban water management plan prepared pursuant to Part 2.6 (commencing with Section 10610) was due and not submitted in 2010 is granted an extension to July 1, 2011, to permit coordination between an urban wholesale water supplier and urban retail water suppliers Notwithstanding the method adopted by an urban retail water supplier pursuant to Section , an urban retail water supplier's per capita daily water use reduction shall be no less than 5 percent of base daily per capita water use as defined in paragraph(3) of subdivision (b) of Section This section does not apply to an urban retail water supplier with a base daily per capita water use at or below 100 gallons per capita per day (a) Each urban retail water supplier shall meet its interim urban water use target by December 31, (b) Each urban retail water supplier shall meet its urban water use target by December 31, (c) An urban retail water supplier's compliance daily per capita water use shall be the measure of progress toward achievement of its urban water use target. (d) (1) When determining compliance daily per capita water use, an urban retail water supplier may consider the following factors: (A) Differences in evapotranspiration and rainfall in the baseline period compared to the compliance reporting period. (B) Substantial changes to commercial or industrial water use resulting from increased business output and economic development that have occurred during the reporting period. (C) Substantial changes to institutional water use resulting from fire suppression services or other extraordinary events, or from new or expanded operations, that have occurred during the reporting period. (2) If the urban retail water supplier elects to adjust its estimate of compliance daily per capita water use due to one or more of the factors described in B10 A - 29
125 AppendixBSustainableWaterUseandDemandReduction(SBX77)FinalDraft paragraph (1), it shall provide the basis for, and data supporting, the adjustment in the report required by Section (e) When developing the urban water use target pursuant to Section , an urban retail water supplier that has a substantial percentage of industrial water use in its service area may exclude process water from the calculation of gross water use to avoid a disproportionate burden on another customer sector. (f) (1) An urban retail water supplier that includes agricultural water use in an urban water management plan pursuant to Part 2.6 (commencing with Section 10610) may include the agricultural water use in determining gross water use. An urban retail water supplier that includes agricultural water use in determining gross water use and develops its urban water use target pursuant to paragraph (2) of subdivision (b) of Section shall use a water efficient standard for agricultural irrigation of 100 percent of reference evapotranspiration multiplied by the crop coefficient for irrigated acres. (2) An urban retail water supplier, that is also an agricultural water supplier, is not subject to the requirements of Chapter 4 (commencing with Section ), if the agricultural water use is incorporated into its urban water use target pursuant to paragraph (1) (a) In complying with this part, an urban retail water supplier shall conduct at least one public hearing to accomplish all of the following: (1) Allow community input regarding the urban retail water supplier's implementation plan for complying with this part. (2) Consider the economic impacts of the urban retail water supplier's implementation plan for complying with this part. (3) Adopt a method, pursuant to subdivision (b) of Section , for determining its urban water use target. (b) In complying with this part, an urban retail water supplier may meet its urban water use target through efficiency improvements in any combination among its customer sectors. An urban retail water supplier shall avoid placing a disproportionate burden on any customer sector. (c) For an urban retail water supplier that supplies water to a United States Department of Defense military installation, the urban retail water supplier's implementation plan for complying with this part shall consider the conservation of that military installation under federal Executive Order (d) (1) Any ordinance or resolution adopted by an urban retail water supplier after the effective date of this section shall not require existing customers as of the effective date of this section, to undertake changes in product formulation, operations, or equipment that would reduce process water use, but may provide technical assistance and financial incentives to those customers to implement efficiency measures for process water. This section shall not limit B11 A - 30
126 AppendixBSustainableWaterUseandDemandReduction(SBX77)FinalDraft an ordinance or resolution adopted pursuant to a declaration of drought emergency by an urban retail water supplier. (2) This part shall not be construed or enforced so as to interfere with the requirements of Chapter 4 (commencing with Section ) to Chapter 13 (commencing with Section ), inclusive, of Part 7 of Division 104 of the Health and Safety Code, or any requirement or standard for the protection of public health, public safety, or worker safety established by federal, state, or local government or recommended by recognized standard setting organizations or trade associations (a) An urban retail water supplier may meet its urban water use target within its retail service area, or through mutual agreement, by any of the following: (1) Through an urban wholesale water supplier. (2) Through a regional agency authorized to plan and implement water conservation, including, but not limited to, an agency established under the Bay Area Water Supply and Conservation Agency Act (Division 31 (commencing with Section 81300)). (3) Through a regional water management group as defined in Section (4) By an integrated regional water management funding area. (5) By hydrologic region. (6) Through other appropriate geographic scales for which computation methods have been developed by the department. (b) A regional water management group, with the written consent of its member agencies, may undertake any or all planning, reporting, and implementation functions under this chapter for the member agencies that consent to those activities. Any data or reports shall provide information both for the regional water management group and separately for each consenting urban retail water supplier and urban wholesale water supplier All costs incurred pursuant to this part by a water utility regulated by the Public Utilities Commission may be recoverable in rates subject to review and approval by the Public Utilities Commission, and may be recorded in a memorandum account and reviewed for reasonableness by the Public Utilities Commission Urban wholesale water suppliers shall include in the urban water management plans required pursuant to Part 2.6 (commencing with Section 10610) an assessment of their present and proposed future measures, programs, and policies to help achieve the water use reductions required by this part Urban water retail suppliers shall report to the department on their progress in meeting their urban water use targets as part of their urban water management plans B12 A - 31
127 AppendixBSustainableWaterUseandDemandReduction(SBX77)FinalDraft submitted pursuant to Section The data shall be reported using a standardized form developed pursuant to Section (a) The department shall review the 2015 urban water management plans and report to the Legislature by July 1, 2017, on progress towards achieving a 20-percent reduction in urban water use by December 31, The report shall include recommendations on changes to water efficiency standards or urban water use targets to achieve the 20-percent reduction and to reflect updated efficiency information and technology changes. (b) A report to be submitted pursuant to subdivision (a) shall be submitted in compliance with Section 9795 of the Government Code The department, in conjunction with the California Urban Water Conservation Council, by April 1, 2010, shall convene a representative task force consisting of academic experts, urban retail water suppliers, environmental organizations, commercial water users, industrial water users, and institutional water users to develop alternative best management practices for commercial, industrial, and institutional users and an assessment of the potential statewide water use efficiency improvement in the commercial, industrial, and institutional sectors that would result from implementation of these best management practices. The taskforce, in conjunction with the department, shall submit a report to the Legislature by April 1, 2012, that shall include a review of multiple sectors within commercial, industrial, and institutional users and that shall recommend water use efficiency standards for commercial, industrial, and institutional users among various sectors of water use. The report shall include, but not be limited to, the following: (a) Appropriate metrics for evaluating commercial, industrial, and institutional water use. (b) Evaluation of water demands for manufacturing processes, goods, and cooling. (c) Evaluation of public infrastructure necessary for delivery of recycled water to the commercial, industrial, and institutional sectors. (d) Evaluation of institutional and economic barriers to increased recycled water use within the commercial, industrial, and institutional sectors. (e) Identification of technical feasibility and cost of the best management practices to achieve more efficient water use statewide in the commercial, industrial, and institutional sectors that is consistent with the public interest and reflects past investments in water use efficiency Each state agency shall reduce water use at facilities it operates to support urban retail water suppliers in meeting the target identified in Section B13 A - 32
128 AppendixBSustainableWaterUseandDemandReduction(SBX77)FinalDraft Chapter 4 Agricultural Water Suppliers SECTION (a) On or before July 31, 2012, an agricultural water supplier shall implement efficient water management practices pursuant to subdivisions (b) and (c). (b) Agricultural water suppliers shall implement all of the following critical efficient management practices: (1) Measure the volume of water delivered to customers with sufficient accuracy to comply with subdivision (a) of Section and to implement paragraph (2). (2) Adopt a pricing structure for water customers based at least in part on quantity delivered. (c) Agricultural water suppliers shall implement additional efficient management practices, including, but not limited to, practices to accomplish all of the following, if the measures are locally cost effective and technically feasible: (1) Facilitate alternative land use for lands with exceptionally high water duties or whose irrigation contributes to significant problems, including drainage. (2) Facilitate use of available recycled water that otherwise would not be used beneficially, meets all health and safety criteria, and does not harm crops or soils. (3) Facilitate the financing of capital improvements for on-farm irrigation systems. (4) Implement an incentive pricing structure that promotes one or more of the following goals: (A) More efficient water use at the farm level. (B) Conjunctive use of groundwater. (C) Appropriate increase of groundwater recharge. (D) Reduction in problem drainage. (E) Improved management of environmental resources. (F) Effective management of all water sources throughout the year by adjusting seasonal pricing structures based on current conditions. (5) Expand line or pipe distribution systems, and construct regulatory reservoirs to increase distribution system flexibility and capacity, decrease maintenance, and reduce seepage. B14 A - 33
129 AppendixBSustainableWaterUseandDemandReduction(SBX77)FinalDraft (6) Increase flexibility in water ordering by, and delivery to, water customers within operational limits. (7) Construct and operate supplier spill and tailwater recovery systems. (8) Increase planned conjunctive use of surface water and groundwater within the supplier service area. (9) Automate canal control structures. (10) Facilitate or promote customer pump testing and evaluation. (11) Designate a water conservation coordinator who will develop and implement the water management plan and prepare progress reports. (12) Provide for the availability of water management services to water users. These services may include, but are not limited to, all of the following: (A) On-farm irrigation and drainage system evaluations. (B) Normal year and real-time irrigation scheduling and crop evapotranspiration information. (C) Surface water, groundwater, and drainage water quantity and quality data. (D) Agricultural water management educational programs and materials for farmers, staff, and the public. (13) Evaluate the policies of agencies that provide the supplier with water to identify the potential for institutional changes to allow more flexible water deliveries and storage. (14) Evaluate and improve the efficiencies of the supplier's pumps. (d) Agricultural water suppliers shall include in the agricultural water management plans required pursuant to Part 2.8 (commencing with Section 10800) a report on which efficient water management practices have been implemented and are planned to be implemented, an estimate of the water use efficiency improvements that have occurred since the last report, and an estimate of the water use efficiency improvements estimated to occur five and 10 years in the future. If an agricultural water supplier determines that an efficient water management practice is not locally cost effective or technically feasible, the supplier shall submit information documenting that determination. (e) The data shall be reported using a standardized form developed pursuant to Section (f) An agricultural water supplier may meet the requirements of subdivisions (d) and (e) by submitting to the department a water conservation plan submitted to the United States Bureau of Reclamation that meets the requirements described in Section B15 A - 34
130 AppendixBSustainableWaterUseandDemandReduction(SBX77)FinalDraft (g) On or before December 31, 2013, December 31, 2016, and December 31, 2021, the department, in consultation with the board, shall submit to the Legislature a report on the agricultural efficient water management practices that have been implemented and are planned to be implemented and an assessment of the manner in which the implementation of those efficient water management practices has affected and will affect agricultural operations, including estimated water use efficiency improvements, if any. (h) The department may update the efficient water management practices required pursuant to subdivision (c), in consultation with the Agricultural Water Management Council, the United States Bureau of Reclamation, and the board. All efficient water management practices for agricultural water use pursuant to this chapter shall be adopted or revised by the department only after the department conducts public hearings to allow participation of the diverse geographical areas and interests of the state. (i) (1) The department shall adopt regulations that provide for a range of options that agricultural water suppliers may use or implement to comply with the measurement requirement in paragraph (1) of subdivision (b). (2) The initial adoption of a regulation authorized by this subdivision is deemed to address an emergency, for purposes of Sections and of the Government Code, and the department is hereby exempted for that purpose from the requirements of subdivision (b) of Section of the Government Code. After the initial adoption of an emergency regulation pursuant to this subdivision, the department shall not request approval from the Office of Administrative Law to readopt the regulation as an emergency regulation pursuant to Section of the Government Code. Chapter 5 Sustainable Water Management Section (a) The department, in consultation with the board, shall promote implementation of regional water resources management practices through increased incentives and removal of barriers consistent with state and federal law. Potential changes may include, but are not limited to, all of the following: (1) Revisions to the requirements for urban and agricultural water management plans. (2) Revisions to the requirements for integrated regional water management plans. (3) Revisions to the eligibility for state water management grants and loans. B16 A - 35
131 AppendixBSustainableWaterUseandDemandReduction(SBX77)FinalDraft (4) Revisions to state or local permitting requirements that increase water supply opportunities, but do not weaken water quality protection under state and federal law. (5) Increased funding for research, feasibility studies, and project construction. (6) Expanding technical and educational support for local land use and water management agencies. (b) No later than January 1, 2011, and updated as part of the California Water Plan, the department, in consultation with the board, and with public input, shall propose new statewide targets, or review and update existing statewide targets, for regional water resources management practices, including, but not limited to, recycled water, brackish groundwater desalination, and infiltration and direct use of urban stormwater runoff. Chapter 6 Standardized Data Collection SECTION (a) The department, in consultation with the board, the California Bay-Delta Authority or its successor agency, the State Department of Public Health, and the Public Utilities Commission, shall develop a single standardized water use reporting form to meet the water use information needs of each agency, including the needs of urban water suppliers that elect to determine and report progress toward achieving targets on a regional basis as provided in subdivision (a) of Section (b) At a minimum, the form shall be developed to accommodate information sufficient to assess an urban water supplier's compliance with conservation targets pursuant to Section and an agricultural water supplier's compliance with implementation of efficient water management practices pursuant to subdivision (a) of Section The form shall accommodate reporting by urban water suppliers on an individual or regional basis as provided in subdivision (a) of Section Chapter 7 Funding Provisions Section (a) On and after July 1, 2016, an urban retail water supplier is not eligible for a water grant or loan awarded or administered by the state unless the supplier complies with this part. (b) On and after July 1, 2013, an agricultural water supplier is not eligible for a water grant or loan awarded or administered by the state unless the supplier complies with this part. B17 A - 36
132 AppendixBSustainableWaterUseandDemandReduction(SBX77)FinalDraft (c) Notwithstanding subdivision (a), the department shall determine that an urban retail water supplier is eligible for a water grant or loan even though the supplier has not met the per capita reductions required pursuant to Section , if the urban retail water supplier has submitted to the department for approval a schedule, financing plan, and budget, to be included in the grant or loan agreement, for achieving the per capita reductions. The supplier may request grant or loan funds to achieve the per capita reductions to the extent the request is consistent with the eligibility requirements applicable to the water funds. (d) Notwithstanding subdivision (b), the department shall determine that an agricultural water supplier is eligible for a water grant or loan even though the supplier is not implementing all of the efficient water management practices described in Section , if the agricultural water supplier has submitted to the department for approval a schedule, financing plan, and budget, to be included in the grant or loan agreement, for implementation of the efficient water management practices. The supplier may request grant or loan funds to implement the efficient water management practices to the extent the request is consistent with the eligibility requirements applicable to the water funds. (e) Notwithstanding subdivision (a), the department shall determine that an urban retail water supplier is eligible for a water grant or loan even though the supplier has not met the per capita reductions required pursuant to Section , if the urban retail water supplier has submitted to the department for approval documentation demonstrating that its entire service area qualifies as a disadvantaged community. (f) The department shall not deny eligibility to an urban retail water supplier or agricultural water supplier in compliance with the requirements of this part and Part 2.8 (commencing with Section 10800), that is participating in a multiagency water project, or an integrated regional water management plan, developed pursuant to Section of the Public Resources Code, solely on the basis that one or more of the agencies participating in the project or plan is not implementing all of the requirements of this part or Part 2.8 (commencing with Section 10800) (a) It is the intent of the Legislature that funds made available by Section of the Public Resources Code should be expended, consistent with Division 43 (commencing with Section 75001) of the Public Resources Code and upon appropriation by the Legislature, for grants to implement this part. In the allocation of funding, it is the intent of the Legislature that the department give consideration to disadvantaged communities to assist in implementing the requirements of this part. (b) It is the intent of the Legislature that funds made available by Section of the Public Resources Code, should be expended, consistent with Division 43 (commencing with Section 75001) of the Public Resources Code and upon appropriation by the Legislature, for direct expenditures to implement this part. B18 A - 37
133 AppendixBSustainableWaterUseandDemandReduction(SBX77)FinalDraft Chapter 8 Quantifying Agricultural Water Use Efficiency SECTION The department, in consultation with the Agricultural Water Management Council, academic experts, and other stakeholders, shall develop a methodology for quantifying the efficiency of agricultural water use. Alternatives to be assessed shall include, but not be limited to, determination of efficiency levels based on crop type or irrigation system distribution uniformity. On or before December 31, 2011, the department shall report to the Legislature on a proposed methodology and a plan for implementation. The plan shall include the estimated implementation costs and the types of data needed to support the methodology. Nothing in this section authorizes the department to implement a methodology established pursuant to this section. B19 A - 38
134 (THIS PAGE LEFT BLANK INTENTIONALLY)
135 APPENDIX B DWR UWMP Tables
136 (THIS PAGE LEFT BLANK INTENTIONALLY)
137 Table 2-1 Retail Only: Public Water Systems Public Water System Number Public Water System Name Number of Municipal Connections 2015 Volume of Water Supplied 2015 CA City of Woodland 15,635 8,650 TOTAL 15,635 8,650 NOTES: Volumes are in AF. The City estimates in the AWWA Water Audit that master meters underestimate supply to the system by approximately 1-percent. Therefore, supply shown includes a 1-percent increase from the actual metered supply amount.
138 Table 2-2: Plan Identification Select Only One Type of Plan Name of RUWMP or Regional Alliance if applicable Individual UWMP NOTES: Regional Urban Water Management Plan (RUWMP)
139 Table 2-3: Agency Identification Type of Agency (select one or both) Agency is a wholesaler Agency is a retailer Fiscal or Calendar Year (select one) UWMP Tables Are in Calendar Years UWMP Tables Are in Fiscal Years Units of Measure Used in UWMP (select from Drop down) Unit AF NOTES:
140 Table 2-4 Retail: Water Supplier Information Exchange The retail supplier has informed the following wholesale supplier(s) of projected water use in accordance with CWC Wholesale Water Supplier Name Woodland-Davis Clean Water Agency NOTES:
141 Table 3-1 Retail: Population - Current and Projected Population Served (opt) 57,525 61,226 65,510 70,095 75,000 80,160 NOTES: 2015 population was obtained from the Department of Finance population projections are obtained from the City's draft General Plan Update population projection are extrapolated based on a 1.34% growth rate which is consistent with the assumptions used in the Draft General Plan Update.
142 Table 4-1 Retail: Demands for Potable and Raw Water - Actual Use Type 2015 Actual Additional Description (as needed) Level of Treatment When Delivered Volume Single Family Drinking Water 3,959 Multi-Family Drinking Water 1,315 Commercial Drinking Water 1,321 Industrial Drinking Water 596 Institutional/Governmental Drinking Water 344 Landscape Drinking Water 623 Losses Drinking Water 485 Other Metered unbilled and unmetered unbilled Drinking Water 7 TOTAL 8,650 NOTES: Volumes are in AF. Use type Other accounts for metered unbilled and unbilled unmetered water use in the City's system for 2015.
143 Table 4-2 Retail: Demands for Potable and Raw Water - Projected Use Type opt Single Family 7,355 7,870 8,421 9,010 9,630 Multi-Family 2,443 2,614 2,797 2,993 3,199 Commercial 2,454 2,625 2,809 3,006 3,212 Industrial Additional Description (as needed) Reduced due to recycled water Projected Water Use Report To the Extent that Records are Available Institutional/Governmental Landscape 1,158 1,239 1,326 1,419 1,517 Losses TOTAL 15,111 16,224 17,417 18,692 20,033 NOTES: Volumes are in AF. Industrial demands have been reduced by 800 AF based on planned recycled water supply to the Woodland BioMass customer.
144 Table 4-3 Retail: Total Water Demands Potable and Raw Water Tables 4-1 and 4-2 Recycled Water Demand* Table 6-4 From From (opt) 8,650 15,111 16,224 17,417 18,692 20, TOTAL WATER DEMAND 8,650 15,911 17,024 18,217 19,492 20,833 NOTES: Volumes are in AF. Recycled water demands are based on projected water use for Woodland BioMass customer and park irrigation needs. Potable and raw water demand projections are calculated based on projected population and 2020 target GPCD as calculated using DWR methodologies for SBX7-7.
145 Table 4-4 Retail: 12 Month Water Loss Audit Reporting Reporting Period Start Date Volume of Water Loss* 01/ * Taken from the field "Water Losses" (a combination of apparent losses and real losses) from the AWWA worksheet. NOTES: Volumes are in AF.
146 Table 4-5 Retail Only: Inclusion in Water Use Projections NOTES: Are Future Water Savings Included in Projections? (Refer to Appendix K of UWMP Guidebook) Are Lower Income Residential Demands Included In Projections? No Yes
147 Table 5-1 Baselines and Targets Summary Retail Agency or Regional Alliance Only Baseline Period Start Year End Year Average Baseline GPCD* 2015 Interim Target * Confirmed 2020 Target* year Year *All values are in Gallons per Capita per Day (GPCD) NOTES:
148 Table 5-2: 2015 Compliance Retail Agency or Regional Alliance Only Actual 2015 GPCD* 2015 Interim Target GPCD* Extraordinary Events* Optional Adjustments to 2015 GPCD From Methodology 8 Economic Adjustment* Weather Normalization* TOTAL Adjustments* Adjusted 2015 GPCD* 2015 GPCD* (Adjusted if applicable) Did Supplier Achieve Targeted Reduction for 2015? Y/N Yes *All values are in Gallons per Capita per Day (GPCD) NOTES:
149 Table 6-1 Retail: Groundwater Volume Pumped Supplier does not pump groundwater. The supplier will not complete the table below. Groundwater Type Location or Basin Name Alluvial Basin NOTES: Volumes are in AF. Yolo Subbasin of the Sacramento Valley Groundwater Basin TOTAL ,757 15,160 13,531 10,501 8,650
150 Table 6-2 Retail: Wastewater Collected Within Service Area in 2015 There is no wastewater collection system. The supplier will not complete the table below Name of Wastewater Collection Agency Wastewater Volume Metered or Estimated? Volume of Wastewater Collected from UWMP Service Area 2015 Name of Wastewater Treatment Agency Receiving Collected Wastewater City of Woodland Estimated 5,601 City of Woodland NOTES: Volumes are in AF. Percentage of 2015 service area covered by wastewater collection system (optional) Percentage of 2015 service area population covered by wastewater collection system (optional) Wastewater Collection Recipient of Collected Wastewater Total Wastewater Collected from Service Area in 2015: 5,601 Treatment Plant Name Water Pollution Control Facility Is WWTP Located Within UWMP Area? Yes Is WWTP Operation Contracted to a Third Party? (optional) No
151 Table 6-3 Retail: Wastewater Treatment and Discharge Within Service Area in 2015 Wastewater Treatment Plant Name No wastewater is treated or disposed of within the UWMP service area. The supplier will not complete the table below. Discharge Location Name or Identifier Discharge Location Description Wastewater Discharge ID Number (optional) Method of Disposal Does This Plant Treat Wastewater Generated Outside the Service Area? Treatment Level Wastewater Treated 2015 volumes Discharged Treated Wastewater Recycled Within Service Area Recycled Outside of Service Area Water Pollution Control Facility Tule Canal NOTES: Volumes are in AF. Large, unimproved channel River or creek outfall No Tertiary 5,601 5, Total 5,601 5,
152 Table 6-4 Retail: Current and Projected Recycled Water Direct Beneficial Uses Within Service Area Recycled water is not used and is not planned for use within the service area of the supplier. The supplier will not complete the table below. Name of Agency Producing (Treating) the Recycled Water: Name of Agency Operating the Recycled Water Distribution System: Supplemental Water Added in 2015 Source of 2015 Supplemental Water Woodland Water Pollution Control Facility (WPCF) The City of Woodland None Not Applicable Beneficial Use Type General Description of 2015 Uses Level of Treatment (opt) Agricultural irrigation 0 Landscape irrigation (excludes golf courses) 0 Golf course irrigation 0 Commercial use 0 Industrial use 0 Geothermal and other energy production Tertiary Seawater intrusion barrier 0 Recreational impoundment 0 Wetlands or wildlife habitat 0 Groundwater recharge (IPR)* 0 Surface water augmentation (IPR)* Direct potable reuse Other (Provide General Description) Total: *IPR - Indirect Potable Reuse NOTES: Volumes are in AF.
153 Table 6-5 Retail: 2010 UWMP Recycled Water Use Projection Compared to 2015 Actual Recycled water was not used in 2010 nor projected for use in The supplier will not complete the table below. Use Type Agricultural irrigation Landscape irrigation (excludes golf courses) Golf course irrigation Commercial use Industrial use Geothermal and other energy production Seawater intrusion barrier Recreational impoundment Wetlands or wildlife habitat Groundwater recharge (IPR) Surface water augmentation (IPR) Direct potable reuse Other Type of Use Total NOTES: 2010 Projection for Actual Use 0 0
154 Table 6-6 Retail: Methods to Expand Future Recycled Water Use Name of Action Supplier does not plan to expand recycled water use in the future. Supplier will not complete the table below but will provide narrative explanation. Provide page location of narrative in UWMP Description Planned Implementation Year Expected Increase in Recycled Water Use Parks/ Landscape irrigation 2020 Retro-fit/new recycled water pipeline for landscape and parks Industrial Customers Demand Add industrial customer's based need/proximity to the recycled water pipeline Total 50 NOTES: Volumes are in AF. Pipeline for parks and landscape irrigation is expected to increase recycled water use AF. Pipeline for industrial customers is expected to increase recycled water use, but the exact volume will depend on each customer and is unknown at the time of preparation of this UWMP.
155 Table 6-7 Retail: Expected Future Water Supply Projects or Programs No expected future water supply projects or programs that provide a quantifiable increase to the agency's water supply. Supplier will not complete the table below. Some or all of the supplier's future water supply projects or programs are not compatible with this table and are described in a narrative format. Provide page location of narrative in the UWMP Name of Future Projects or Programs Joint Project with other agencies? Description (if needed) Planned Implementation Year Planned for Use in Year Type Expected Increase in Water Supply to Agency Woodland-Davis Clean Water Agency - Phase 1 Woodland-Davis Clean Water Agency - Phase 2 ASR Wells - Phase 1 ASR Wells - Phase 2 NOTES: Volumes are in AF. Yes Yes No No City of Davis, UC Davis City of Davis, UC Davis Surface water treatment plant Surface water treatment plant expansion Development of 3 ASR wells Development of 2 ASR wells 2016 All Year Types 20, All Year Types 24, Single-Dry and Multi-Dry Year Single-Dry and Multi-Dry Year 0 0
156 Table 6-8 Retail: Water Supplies Actual Water Supply 2015 Additional Detail on Water Supply Actual Volume Water Quality Total Right or Safe Yield (optional) Groundwater 8,650 Raw Water Total 8,650 0 NOTES: Volumes are in AF.
157 Table 6-9 Retail: Water Supplies Projected Water Supply Projected Water Supply Report To the Extent Practicable Additional Detail on Water Supply Reasonably Available Volume (opt) Total Right or Safe Yield (optional) Reasonably Available Volume Total Right or Safe Yield (optional) Reasonably Available Volume Total Right or Safe Yield (optional) Reasonably Available Volume Total Right or Safe Yield (optional) Surface water 20,160 20,160 20,160 24,650 24,650 Recycled Water Reasonably Available Volume Total Right or Safe Yield (optional) Total 20, , , , ,450 0 NOTES: Volumes are in AF.
158 Table 7-1 Retail: Basis of Water Year Data Year Type Base Year Available Supplies if Year Type Repeats Quantification of available supplies is not compatible with this table and is provided elsewhere in the UWMP. Location Quantification of available supplies is provided in this table as either volume only, percent only, or both. Volume Available % of Average Supply Average Year , % Single-Dry Year ,990 71% Multiple-Dry Years 1st Year ,360 76% Multiple-Dry Years 2nd Year ,990 71% Multiple-Dry Years 3rd Year ,120 71% NOTES: Volumes in AF. Volume available for average year reflects the historical supply of groundwater. Single dry and multiple dry year available volume reflect anticipated surface water, ASR, and groundwater supplies.
159 Table 7-2 Retail: Normal Year Supply and Demand Comparison (Opt) Supply totals 20,960 20,960 20,960 25,450 25,450 Demand totals 15,911 17,024 18,217 19,492 20,833 Difference 5,049 3,936 2,743 5,958 4,617 NOTES: Volumes are in AF. Supply totals for normal year projections reflects anticipated surface water and recycled water supply sources.
160 Table 7-3 Retail: Single Dry Year Supply and Demand Comparison (Opt) Supply totals 19,990 19,990 19,990 25,080 25,080 Demand totals 15,911 17,024 18,217 19,492 20,833 Difference 4,079 2,966 1,773 5,588 4,247 NOTES: Volumes are in AF.
161 Table 7-4 Retail: Multiple Dry Years Supply and Demand Comparison (Opt) Supply totals 21,360 21,360 21,360 25,080 25,080 First year Demand totals 15,911 17,024 18,217 19,492 20,833 Difference 5,449 4,336 3,143 5,588 4,247 Supply totals 19,990 19,990 19,990 25,080 25,080 Second year Demand totals 15,911 17,024 18,217 19,492 20,833 Difference 4,079 2,966 1,773 5,588 4,247 Supply totals 20,120 20,120 20,120 25,080 25,080 Third year Demand totals 15,911 17,024 18,217 19,492 20,833 NOTES: Volumes are in AF. Difference 4,209 3,096 1,903 5,588 4,247
162 Table 8-1 Retail Stages of Water Shortage Contingency Plan Stage Percent Supply Reduction 1 Numerical value as a percent Water Supply Condition (Narrative description) I 10% II 25% Stage 1 shall exist when the City s reliable water supply is adequate to meet no more than ninety percent (90%) of projected demands. Stage 2 shall exist when the City s reliable water supply is adequate to meet no more than seventy-five percent (75%) of projected demands III 50% Stage 3 shall exist when the City s reliable water supply is adequate to meet no more than fifty percent (50%) of projected demands. IV >50% Stage 4 shall exist when there is major failure of a reliable water supply, storage, or distribution system, and the water shortage is greater than 50% of Projected demands. 1 One stage in the Water Shortage Contingency Plan must address a water shortage of 50%. NOTES: Projected demands are determined by the Public Works Director or his or her designee.
163 Table 8-2 Retail Only: Restrictions and Prohibitions on End Uses Stage Restrictions and Prohibitions on End Users Additional Explanation or Reference (optional) Penalty, Charge, or Other Enforcement? 0 Landscape - Restrict or prohibit runoff from landscape irrigation Sec. 23C-11-3.J.1 Yes 0 Other - Customers must repair leaks, breaks, and malfunctions in a timely manner Sec. 23C-11-3.J.2 Yes 0 Other water feature or swimming pool restriction Sec. 23C-11-3.J.3 Yes 0 Landscape - Other landscape restriction or prohibition Sec. 23C-11-3.J.4 Yes 0 Landscape - Other landscape restriction or prohibition Sec. 23C-11-3.J.5 Yes 0 Landscape - Other landscape restriction or prohibition Sec. 23C-11-4.A.2 Yes 1 Other Sec. 23C-11-4.B.2 Yes 1 Other - Prohibit use of potable water for washing hard surfaces Sec. 23C-11-4.B.3 Yes 1 Other - Require automatic shut of hoses Sec. 23C-11-4.B.4 Yes 1 CII - Restaurants may only serve water upon request Sec. 23C-11-4.B.5 Yes 2 Other Sec. 23C-11-4.C.2 Yes 2 Landscape - Other landscape restriction or prohibition Sec. 23C-11-4.C.3 Yes 2 Other - Prohibit use of potable water for washing hard surfaces Sec. 23C-11-4.C.4 Yes 2 Landscape - Other landscape restriction or prohibition Sec. 23C-11-4.C.5 Yes 2 Other - Prohibit vehicle washing except at facilities using recycled or recirculating water Sec. 23C-11-4.C.6 Yes 2 CII - Other CII restriction or prohibition Sec. 23C-11-4.C.7 Yes 2 Water Features - Restrict water use for decorative water features, such as fountains Sec. 23C-11-4.C.8 Yes 3 Other Sec. 23C-11-4.D.2 Yes 3 Other Sec. 23C-11-4.D.3 Yes 3 Landscape - Prohibit certain types of landscape irrigation Sec. 23C-11-4.D.4 Yes 3 Other - Prohibit vehicle washing except at facilities using recycled or recirculating water Sec. 23C-11-4.D.5 Yes 3 Pools - Allow filling of swimming pools only when an appropriate cover is in place. Sec. 23C-11-4.D.6 Yes 4 Other Sec. 23C-11-4.E.2 Yes NOTES: Each progressively restrictive stage includes the restrictions shown for that stage as well as all restrictions for the previous stages of restriction. For example, the restrictions during Stage 4 include all of the restrictions shown in the table.
164 Table 8-3 Retail Only: Stages of Water Shortage Contingency Plan - Consumption Reduction Methods Stage Consumption Reduction Methods by Water Supplier Additional Explanation or Reference (optional) All Stages All Stages All Stages Increase Frequency of Meter Reading Provide Rebates for Landscape Irrigation Efficiency Expand Public Information Campaign The City installed meters for all customers and implemented Advance Metering Infrastructure for all meters by The City provides rebate for weather-based irrigation controllers, rain sensors, rain barrels, and mulch. It has expanded its funding for rebates. From , the City has expanded the Water Conservation Program s public information campaign to include social media, more online resources, at least 10 press releases per year, and at least 6 water conservation and efficiency workshops per year. All Stages All Stages All Stages All Stages NOTES: Reduce System Water Loss Improve Customer Billing Decrease Line Flushing Other The City has conducted audits to identify system water loss and has a Capital Improvement Program in place to fund system repairs. Introduced graphic representation of past 13 month water consumption on utility bill. The City changed from unidirectional flushing of the water system in 2015 to NO-DES (Neutral Output Discharge Elimination System) a flushing, filtering, and re-circulation of water to reduce water waste. The City has made it a priority to reduce municipal water consumption. For example, parks irrigation was reduced by around 40%.
165 Table 8-4 Retail: Minimum Supply Next Three Years Available Water Supply 32,100 32,100 32,100 NOTES: Volumes in AF. The City is transitioning from groundwater only to surface water primarily over the next three years. During this time, it is assumed groundwater will still be available as a supply.
166 Table 10-1 Retail: Notification to Cities and Counties City Name City of Davis City of West Sacramento City of Woodland County Name Yolo County NOTES: 60 Day Notice 60 Day Notice Notice of Public Hearing Notice of Public Hearing
167 APPENDIX C DWR UWMP Checklist
168 (THIS PAGE LEFT BLANK INTENTIONALLY)
169 Appendix C. Urban Water Management Plan Checklist Checklist Arranged by Subject CWC Section UWMP Requirement Subject 10620(b) Every person that becomes an urban water supplier shall adopt an urban water management plan within one year after it has become an urban water supplier (d)(2) Coordinate the preparation of its plan with other appropriate agencies in the area, including other water suppliers that share a common source, water management agencies, and relevant public agencies, to the extent practicable Provide supporting documentation that the water supplier has encouraged active involvement of diverse social, cultural, and economic elements of the population within the service area prior to and during the preparation of the plan. Guidebook Location UWMP Location Plan Preparation Section 2.1 Section 2.1 (Page 2-1) Plan Preparation Section Section (Page 2-3, 2-4) Plan Preparation Section Section (Page 2-4) 10631(a) Describe the water supplier service area. System Description Section 3.1 Section 3.2 (Page 3-1) 10631(a) Describe the climate of the service area of the supplier (a) Provide population projections for 2020, 2025, 2030, and (a) Describe other demographic factors affecting the supplier s water management planning (a) Indicate the current population of the service area. System Description and Baselines and Targets 10631(e)(1) Quantify past, current, and projected water use, identifying the uses among water use sectors (e)(3)(A) Report the distribution system water loss for the most recent 12-month period available (a) Include projected water use needed for lower income housing projected in the service area of the supplier (b) Retail suppliers shall adopt a 2020 water use target using one of four methods (e) Retail suppliers shall provide baseline daily per capita water use, urban water use target, interim urban water use target, and compliance daily per capita water use, along with the bases for determining those estimates, including references to supporting data Retail suppliers per capita daily water use reduction shall be no less than 5 percent of base daily per capita water use of the 5-year baseline. This does not apply if the suppliers base GPCD is at or below (a) Retail suppliers shall meet their interim target by December 31, (d)(2) If the retail supplier adjusts its compliance GPCD using weather normalization, economic adjustment, or extraordinary events, it shall provide the basis for, and data supporting the adjustment Wholesale suppliers shall include an assessment of present and proposed future measures, programs, and policies to help their retail water suppliers achieve targeted water use reductions Retail suppliers shall report on their progress in meeting their water use targets. The data shall be reported using a standardized form (b) Identify and quantify the existing and planned sources of water available for 2015, 2020, 2025, 2030, and (b) Indicate whether groundwater is an existing or planned source of water available to the supplier (b)(1) Indicate whether a groundwater management plan has been adopted by the water supplier or if there is any other specific authorization for groundwater management. Include a copy of the plan or authorization. System Description Section 3.3 Section 3.3 (Page 3-1, 3-3) System Description Section 3.4 Section (Page 3-3, 3-4) System Description Section 3.4 Section (Page 3-4) Sections 3.4 and 5.4 Section (Page 3-3, 3-4) System Water Use Section 4.2 Section 4.2 (Pages 4-1 to 4-4) System Water Use Section 4.3 Section 4.3 (Page 4-4, 4-5) System Water Use Section 4.5 Section 4.5 (Page 4-5, 4-6) Baselines and Targets Baselines and Targets Baselines and Targets Baselines and Targets Baselines and Targets Baselines and Targets Baselines and Targets Section 5.7 and App E Chapter 5 and App E Section 5.6 (Page 5-4, 5-5) Section 5.6 (Pages 5-4, 5-5) Section Section 5.7 (Page 5-5) Section 5.8 and App E Section 5.7 (Page 5-5) Section N/A: City is not adjusting its compliance GPCD - Section 5.7 (Page 5-5) Section 5.1 N/A: City is not a Wholesale Supplier Section 2.4 (Page 2-2) Section 5.8 and App E Section 5.7 (Page 5-5) System Supplies Chapter 6 Section 6.10 (Page 6-14) System Supplies Section 6.2 Section 6.2 (Page 6-1 to Page 6-7) System Supplies Section Section (Page 6-4) 10631(b)(2) Describe the groundwater basin. System Supplies Section Section (Page 6-1 to 6-4) 10631(b)(2) Indicate if the basin has been adjudicated and include a copy of the court order or decree and a description of the amount of water the supplier has the legal right to pump. System Supplies Section Section (Page 6-6) 1 City of Woodland n\c\204\ \wp\uwmp\112315_appc Appendix C UWMP Checklist
170 Appendix C. Urban Water Management Plan Checklist Checklist Arranged by Subject CWC Section UWMP Requirement Subject 10631(b)(2) For unadjudicated basins, indicate whether or not the department has identified the basin as overdrafted, or projected to become overdrafted. Describe efforts by the supplier to eliminate the long-term overdraft condition (b)(3) Provide a detailed description and analysis of the location, amount, and sufficiency of groundwater pumped by the urban water supplier for the past five years (b)(4) Provide a detailed description and analysis of the amount and location of groundwater that is projected to be pumped (d) Describe the opportunities for exchanges or transfers of water on a short-term or long-term basis (g) Describe the expected future water supply projects and programs that may be undertaken by the water supplier to address water supply reliability in average, single-dry, and multiple-dry years (i) Describe desalinated water project opportunities for long-term supply (j) Retail suppliers will include documentation that they have provided their wholesale supplier(s) if any - with water use projections from that source (j) Wholesale suppliers will include documentation that they have provided their urban water suppliers with identification and quantification of the existing and planned sources of water available from the wholesale to the urban supplier during various water year types For wastewater and recycled water, coordinate with local water, wastewater, groundwater, and planning agencies that operate within the supplier's service area (a) Describe the wastewater collection and treatment systems in the supplier's service area. Include quantification of the amount of wastewater collected and treated and the methods of wastewater disposal (b) Describe the quantity of treated wastewater that meets recycled water standards, is being discharged, and is otherwise available for use in a recycled water project (c) Describe the recycled water currently being used in the supplier's service area (d) Describe and quantify the potential uses of recycled water and provide a determination of the technical and economic feasibility of those uses (e) Describe the projected use of recycled water within the supplier's service area at the end of 5, 10, 15, and 20 years, and a description of the actual use of recycled water in comparison to uses previously projected (f) Describe the actions which may be taken to encourage the use of recycled water and the projected results of these actions in terms of acre-feet of recycled water used per year (g) Provide a plan for optimizing the use of recycled water in the supplier's service area (f) Describe water management tools and options to maximize resources and minimize the need to import water from other regions (c)(1) Describe the reliability of the water supply and vulnerability to seasonal or climatic shortage (c)(1) Provide data for an average water year, a single dry water year, and multiple dry water years 10631(c)(2) For any water source that may not be available at a consistent level of use, describe plans to supplement or replace that source Provide information on the quality of existing sources of water available to the supplier and the manner in which water quality affects water management strategies and supply reliability Guidebook Location UWMP Location System Supplies Section Section (Page 6-6) System Supplies Section Section (Page 6-6, 6-7) System Supplies Sections 6.2 and 6.9 Section 6.10 (Page 6-14) System Supplies Section 6.7 Section 6.8 (Page 6-13) System Supplies Section 6.8 Section 6.9 (Page 6-13, 6-1) System Supplies Section 6.6 Section 6.7 (Page 6-12) System Supplies Section Section (Page 6-13) System Supplies Section N/A: City is not a Wholesale Supplier Section 2.4 (Page 2-2) System Supplies (Recycled Water) System Supplies (Recycled Water) System Supplies (Recycled Water) System Supplies (Recycled Water) System Supplies (Recycled Water) System Supplies (Recycled Water) System Supplies (Recycled Water) System Supplies (Recycled Water) Water Supply Reliability Assessment Water Supply Reliability Assessment Water Supply Reliability Assessment Water Supply Reliability Assessment Water Supply Reliability Assessment Section Section (Page 6-8) Section Section (Page 6-8, 6-9) Section Section (Page 6-8) Section and Section (Page 6-10) Section Section 6.6.3/6.6.5 (Page 6-10, 6-12) Section Section (Page 6-10, 6-11) Section Section (Page 6-12) Section Section (Page 6-12) Section 7.4 Section 7.4 (Page 7-7) Section 7.1 Section 7.2 (Page 7-3, 7-4) Section 7.2 Section 7.2 (Page 7-3, 7-4) Section 7.1 Section 7.1 (Page 7-1 to 7-3) Section 7.1 Section 7.1 (Page 7-1 to 7-3) 2 City of Woodland n\c\204\ \wp\uwmp\112315_appc Appendix C UWMP Checklist
171 Appendix C. Urban Water Management Plan Checklist Checklist Arranged by Subject CWC Section UWMP Requirement Subject 10635(a) Assess the water supply reliability during normal, dry, and multiple dry water years by comparing the total water supply sources available to the water supplier with the total projected water use over the next 20 years (a) and 10632(a)(1) Provide an urban water shortage contingency analysis that specifies stages of action and an outline of specific water supply conditions at each stage (a)(2) Provide an estimate of the minimum water supply available during each of the next three water years based on the driest three-year historic sequence for the agency (a)(3) Identify actions to be undertaken by the urban water supplier in case of a catastrophic interruption of water supplies (a)(4) Identify mandatory prohibitions against specific water use practices during water shortages (a)(5) Specify consumption reduction methods in the most restrictive stages (a)(6) Indicate penalties or charges for excessive use, where applicable (a)(7) Provide an analysis of the impacts of each of the actions and conditions in the water shortage contingency analysis on the revenues and expenditures of the urban water supplier, and proposed measures to overcome those impacts (a)(8) Provide a draft water shortage contingency resolution or ordinance (a)(9) Indicate a mechanism for determining actual reductions in water use pursuant to the water shortage contingency analysis (f)(1) Retail suppliers shall provide a description of the nature and extent of each demand management measure implemented over the past five years. The description will address specific measures listed in code (f)(2) Wholesale suppliers shall describe specific demand management measures listed in code, their distribution system asset management program, and supplier assistance program (j) CUWCC members may submit their CUWCC BMP annual reports in lieu of, or in addition to, describing the DMM implementation in their UWMPs. This option is only allowable if the supplier has been found to be in full compliance with the CUWCC MOU (a) Retail suppliers shall conduct a public hearing to discuss adoption, implementation, and economic impact of water use targets (b) Notify, at least 60 days prior to the public hearing, any city or county within which the supplier provides water that the urban water supplier will be reviewing the plan and considering amendments or changes to the plan (d) Each urban water supplier shall update and submit its 2015 plan to the department by July 1, (b) Provide supporting documentation that Water Shortage Contingency Plan has been, or will be, provided to any city or county within which it provides water, no later than 60 days after the submission of the plan to DWR Provide supporting documentation that the urban water supplier made the plan available for public inspection, published notice of the public hearing, and held a public hearing about the plan The water supplier is to provide the time and place of the hearing to any city or county within which the supplier provides water Provide supporting documentation that the plan has been adopted as prepared or modified (a) Provide supporting documentation that the urban water supplier has submitted this UWMP to the California State Library. Water Supply Reliability Assessment Water Shortage Contingency Planning Water Shortage Contingency Planning Water Shortage Contingency Planning Water Shortage Contingency Planning Water Shortage Contingency Planning Water Shortage Contingency Planning Water Shortage Contingency Planning Water Shortage Contingency Planning Water Shortage Contingency Planning Demand Management Measures Demand Management Measures Demand Management Measures Plan Adoption, Submittal, and Implementation Plan Adoption, Submittal, and Implementation Plan Adoption, Submittal, and Implementation Plan Adoption, Submittal, and Implementation Plan Adoption, Submittal, and Implementation Plan Adoption, Submittal, and Implementation Plan Adoption, Submittal, and Implementation Plan Adoption, Submittal, and Implementation Guidebook Location UWMP Location Section 7.3 Section 7.3 (Page 7-5, 7-6) Section 8.1 Section 8.1 (Page 8-1) Section 8.9 Section 8.9 (Page 8-6) Section 8.8 Section 8.8 (Page 8-6) Section 8.2 Section 8.2 (Page 8-2, 8-3) Section 8.4 Section 8.4 (Page 8-4) Section 8.3 Section 8.3 (Page 8-2) Section 8.6 Section 8.6 (Page 8-5) Section 8.7 Section 8.7 (Page 8-5) Section 8.5 Section 8.5 (Page 8-5) Sections 9.2 and 9.3 Sections 9.1 and 9.3 Section 9.1, 9.2 (Page 9-1 to 9-11) N/A: City is not a Wholesale Supplier Section 2.4 (Page 2-2) Section 9.5 N/A: City is not a member of the CUWCC Section 9.4 (Page 9-11) Section 10.3 Section 10.3 (Page 10-2) Section Section 10.2 (Page 10-1) Sections and 10.4 Section 10.4 (Page 10-2) Section Section 10.4 (Page 10-2), Appendix D Sections , 10.3, and 10.5 Section (Page 10-2), Section 10.3 (Page 10-2), Appendix D Sections Section 10.3 (Page 10-2), Appendix D Section Section (Page 10-2), Appendix I Section Section 10.4 (Page 10-2) 3 City of Woodland n\c\204\ \wp\uwmp\112315_appc Appendix C UWMP Checklist
172 Appendix C. Urban Water Management Plan Checklist Checklist Arranged by Subject CWC Section UWMP Requirement Subject 10644(a)(1) Provide supporting documentation that the urban water supplier has submitted this UWMP to any city or county within which the supplier provides water no later than 30 days after adoption (a)(2) The plan, or amendments to the plan, submitted to the department shall be submitted electronically Provide supporting documentation that, not later than 30 days after filing a copy of its plan with the department, the supplier has or will make the plan available for public review during normal business hours. Plan Adoption, Submittal, and Implementation Plan Adoption, Submittal, and Implementation Plan Adoption, Submittal, and Implementation Guidebook Location UWMP Location Section Section 10.4 (Page 10-2) Sections and Section 10.7 (Page 10-3) Section 10.5 Section 10.5 (Page 10-2) 4 City of Woodland n\c\204\ \wp\uwmp\112315_appc Appendix C UWMP Checklist
173 APPENDIX D Agency and Public Notices
174 (THIS PAGE LEFT BLANK INTENTIONALLY)


175

176

177

178

179

180

181

182

183

184


185

186

187
188


189
190


191
192


193
194

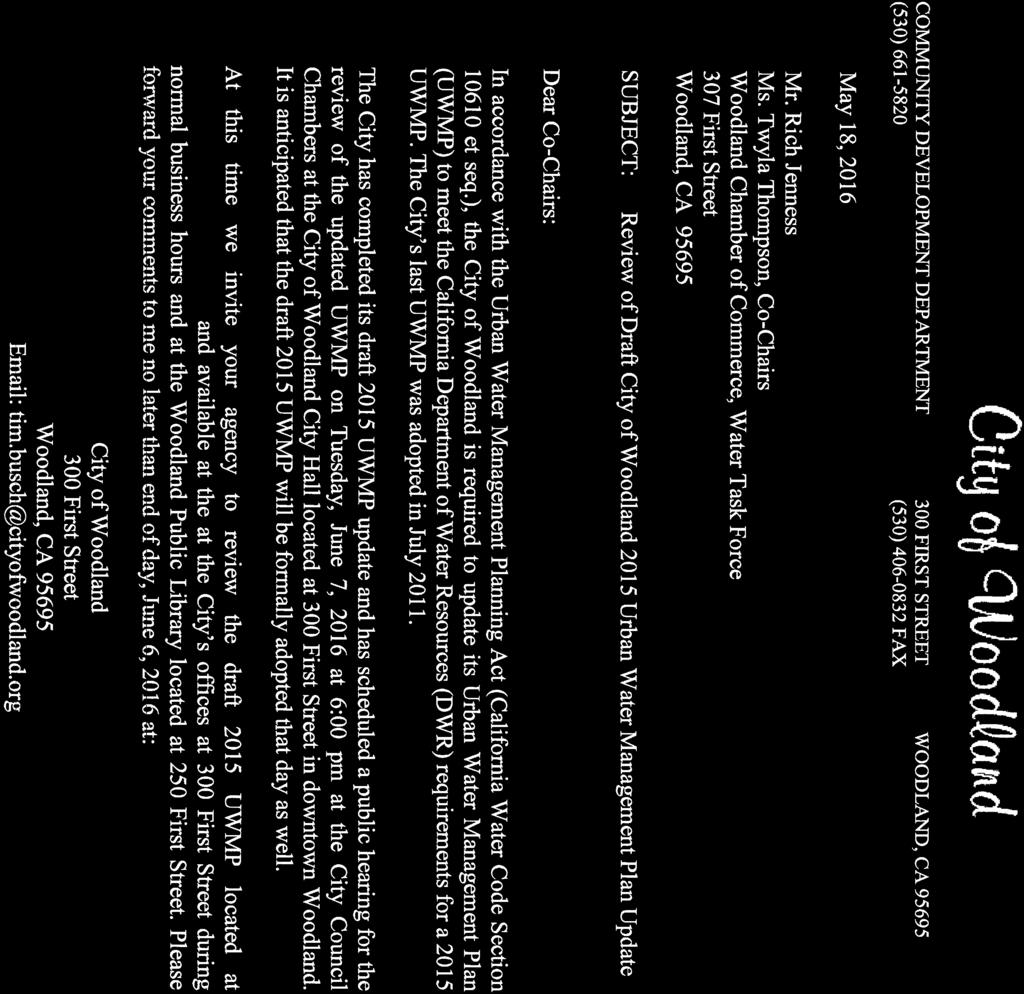
195
196

197
198

199
200

201
202

203
204


205
206

207
208

209
210
211 APPENDIX E AWWA Water Audit
212 (THIS PAGE LEFT BLANK INTENTIONALLY)
213 AWWA Free Water Audit Software: Reporting Worksheet WAS v5.0 American Water Works Association. Copyright 2014, All Rights Reserved.? Click to access definition + Click to add a comment Water Audit Report for: City of Woodland ( ) Reporting Year: / /2015 Please enter data in the white cells below. Where available, metered values should be used; if metered values are unavailable please estimate a value. Indicate your confidence in the accuracy of the input data by grading each component (n/a or 1-10) using the drop-down list to the left of the input cell. Hover the mouse over the cell to obtain a description of the grades All volumes to be entered as: MILLION GALLONS (US) PER YEAR To select the correct data grading for each input, determine the highest grade where the utility meets or exceeds all criteria for that grade and all grades below it. Master Meter and Supply Error Adjustments WATER SUPPLIED < Enter grading in column 'E' and 'J' > Pcnt: Value: Volume from own sources: +? 7 2, MG/Yr +? % MG/Yr Water imported: +? n/a MG/Yr +? n/a MG/Yr Water exported: +? n/a MG/Yr +? MG/Yr Enter negative % or value for under-registration WATER SUPPLIED: 2, MG/Yr Enter positive % or value for over-registration. AUTHORIZED CONSUMPTION Click here:? Billed metered: +? 9 2, MG/Yr for help using option Billed unmetered: +? MG/Yr buttons below Unbilled metered: +? n/a MG/Yr Pcnt: Value: Unbilled unmetered: +? MG/Yr 1.25% MG/Yr AUTHORIZED CONSUMPTION:? 2, MG/Yr Use buttons to select percentage of water supplied OR WATER LOSSES (Water Supplied - Authorized Consumption) MG/Yr value Apparent Losses Pcnt: Value: Unauthorized consumption: +? MG/Yr 0.25% MG/Yr Default option selected for unauthorized consumption - a grading of 5 is applied but not displayed Customer metering inaccuracies: +? MG/Yr 0.00% MG/Yr Systematic data handling errors: +? MG/Yr 0.25% MG/Yr Default option selected for Systematic data handling errors - a grading of 5 is applied but not displayed Apparent Losses:? MG/Yr Real Losses (Current Annual Real Losses or CARL) Real Losses = Water Losses - Apparent Losses: WATER LOSSES:? MG/Yr MG/Yr NON-REVENUE WATER NON-REVENUE WATER:? MG/Yr = Water Losses + Unbilled Metered + Unbilled Unmetered SYSTEM DATA Length of mains: +? miles Number of active AND inactive service connections: +? 10 15,635 Service connection density:? 60 conn./mile main Are customer meters typically located at the curbstop or property line? Yes (length of service line, beyond the property Average length of customer service line: +? ft boundary, that is the responsibility of the utility) Average length of customer service line has been set to zero and a data grading score of 10 has been applied Average operating pressure: +? psi COST DATA Total annual cost of operating water system: +? 8 $14,243,000 $/Year Customer retail unit cost (applied to Apparent Losses): +? 6 $3.57 $/100 cubic feet (ccf) Variable production cost (applied to Real Losses): +? 6 $2, $/Million gallons Use Customer Retail Unit Cost to value real losses WATER AUDIT DATA VALIDITY SCORE: *** YOUR SCORE IS: 70 out of 100 *** A weighted scale for the components of consumption and water loss is included in the calculation of the Water Audit Data Validity Score PRIORITY AREAS FOR ATTENTION: Based on the information provided, audit accuracy can be improved by addressing the following components: 1: Volume from own sources 2: Customer metering inaccuracies 3: Customer retail unit cost (applied to Apparent Losses) AWWA Free Water Audit Software v5.0 Reporting Worksheet 1
214 (THIS PAGE LEFT BLANK INTENTIONALLY)
215 APPENDIX F SB X7-7 Compliance Tables
216 (THIS PAGE LEFT BLANK INTENTIONALLY)
217 SB X7-7 Table 0: Units of Measure Used in UWMP Acre Feet NOTES:
218 SB X7-7 Table-1: Baseline Period Ranges Baseline 10- to 15-year baseline period 5-year baseline period Parameter Value Units 2008 total water deliveries 16,691 Acre Feet 2008 total volume of delivered recycled water - Acre Feet 2008 recycled water as a percent of total deliveries 0.00% Percent Number of years in baseline period 1, 2 10 Years Year beginning baseline period range 1995 Year ending baseline period range Number of years in baseline period 5 Years Year beginning baseline period range 2003 Year ending baseline period range If the 2008 recycled water percent is less than 10 percent, then the first baseline period is a continuous 10-year period. If the amount of recycled water delivered in 2008 is 10 percent or greater, the first baseline period is a continuous 10- to 15-year period. 2 The Water Code requires that the baseline period is between 10 and 15 years. However, DWR recognizes that some water suppliers may not have the minimum 10 years of baseline data. 3 The ending year must be between December 31, 2004 and December 31, The ending year must be between December 31, 2007 and December 31, NOTES:
219 SB X7-7 Table 2: Method for Population Estimates Method Used to Determine Population 1. Department of Finance (DOF) DOF Table E-8 ( ) and ( ) and DOF Table E-5 ( ) when available 2. Persons-per-Connection Method 3. DWR Population Tool NOTES: 4. Other DWR recommends pre-review
220 SB X7-7 Table 3: Service Area Population Year Population 10 to 15 Year Baseline Population Year ,788 Year ,028 Year ,108 Year ,975 Year ,075 Year ,155 Year ,667 Year ,039 Year ,150 Year ,934 5 Year Baseline Population Year ,150 Year ,934 Year ,474 Year ,919 Year , Compliance Year Population ,525 NOTES:
221 SB X7-7 Table 4: Annual Gross Water Use * Deductions Baseline Year Volume Into Distribution System Exported Water Change in Dist. System Storage (+/-) Indirect Recycled Water Water Delivered for Agricultural Use Process Water Annual Gross Water Use 10 to 15 Year Baseline - Gross Water Use Year , ,091 Year , ,765 Year , ,346 Year , ,882 Year , ,166 Year , ,713 Year , ,098 Year , ,885 Year , ,908 Year , , year baseline average gross water use 15,726 5 Year Baseline - Gross Water Use Year , ,908 Year , ,411 Year , ,149 Year , ,880 Year , ,551 5 year baseline average gross water use 16, Compliance Year - Gross Water Use , ,650 * NOTE that the units of measure must remain consistent throughout the UWMP, as reported in Table 2-3. NOTES:
222 SB X7-7 Table 4-A: Volume Entering the Distribution System(s) Complete one table for each source. Name of Source Groundwater This water source is: The supplier's own water source A purchased or imported source Baseline Year Fm SB X7-7 Table 3 Volume Entering Distribution System Meter Error Adjustment* Optional (+/-) Corrected Volume Entering Distribution System 10 to 15 Year Baseline - Water into Distribution System Year ,091 13,091 Year ,765 13,765 Year ,346 15,346 Year ,882 13,882 Year ,166 17,166 Year ,713 16,713 Year ,098 17,098 Year ,885 16,885 Year ,908 15,908 Year ,411 17,411 Year Year Year Year Year Year Baseline - Water into Distribution System Year ,908 15,908 Year ,411 17,411 Year ,149 15,149 Year ,880 15,880 Year ,551 16, Compliance Year - Water into Distribution System ,650 8,650 NOTES: * Meter Error Adjustment - See guidance in Methodology 1, Step 3 of Methodologies Document
223 SB X7-7 Table 4-B: Indirect Recycled Water Use Deduction (For use only by agencies that are deducting indirect recycled water) Baseline Year Fm SB X7-7 Table 3 Volume Discharged from Reservoir for Distribution System Delivery Surface Reservoir Augmentation Percent Recycled Water Recycled Water Delivered to Treatment Plant Transmission/ Treatment Loss Recycled Volume Entering Distribution System from Surface Reservoir Augmentation Recycled Water Pumped by Utility* Groundwater Recharge Transmission/ Treatment Losses Recycled Volume Entering Distribution System from Groundwater Recharge Total Deductible Volume of Indirect Recycled Water Entering the Distribution System Year Baseline - Indirect Recycled Water Use Year Year Year Year Year Year Year Year Year Year Year Year Year Year Year Year Baseline - Indirect Recycled Water Use Year Year Year Year Year Compliance - Indirect Recycled Water Use *Suppliers will provide supplemental sheets to document the calculation for their input into "Recycled Water Pumped by Utility". The volume reported in this cell must be less than total groundwater pumped - See Methodology 1, Step 8, section 2.c. NOTES:
224 SB X7-7 Table 4-C: Process Water Deduction Eligibility (For use only by agencies that are deducting process water) Choose Only One NOTES: Criteria 1- Industrial water use is equal to or greater than 12% of gross water use. Complete SB X7-7 Table 4-C.1 Criteria 2 - Industrial water use is equal to or greater than 15 GPCD. Complete SB X7-7 Table 4-C.2 Criteria 3 - Non-industrial use is equal to or less than 120 GPCD. Complete SB X7-7 Table 4-C.3 Criteria 4 - Disadvantaged Community. Complete SB x7-7 Table 4-C.4
225 SB X7-7 Table 4-C.1: Process Water Deduction Eligibility Criteria 1 Industrial water use is equal to or greater than 12% of gross water use Baseline Year Gross Water Use Without Process Water Deduction Industrial Water Use Percent Industrial Water Eligible for Exclusion Y/N 10 to 15 Year Baseline - Process Water Deduction Eligibility Year ,091 0% NO Year ,765 0% NO Year ,346 0% NO Year ,882 0% NO Year ,166 0% NO Year ,713 0% NO Year ,098 0% NO Year ,885 0% NO Year ,908 0% NO Year ,411 0% NO 5 Year Baseline - Process Water Deduction Eligibility Year ,908 0% NO Year ,411 0% NO Year ,149 0% NO Year ,880 0% NO Year ,551 0% NO 2015 Compliance Year - Process Water Deduction Eligiblity ,650 0% NO NOTES:
226 SB X7-7 Table 4-C.2: Process Water Deduction Eligibility Criteria 2 Industrial water use is equal to or greater than 15 GPCD Baseline Year Industrial Water Use Population 10 to 15 Year Baseline - Process Water Deduction Eligibility Industrial GPCD Eligible for Exclusion Y/N Year ,788 - NO Year ,028 - NO Year ,108 - NO Year ,975 - NO Year ,075 - NO Year ,155 - NO Year ,667 - NO Year ,039 - NO Year ,150 - NO Year ,934 - NO 5 Year Baseline - Process Water Deduction Eligibility Year ,150 - NO Year ,934 - NO Year ,474 - NO Year ,919 - NO Year ,917 - NO 2015 Compliance Year - Process Water Deduction Eligibility ,525 - NO NOTES:
227 SB X7-7 Table 4-C.3: Process Water Deduction Eligibility Criteria 3 Non-industrial use is equal to or less than 120 GPCD Baseline Year Fm SB X7-7 Table 3 Gross Water Use Without Process Water Deduction Fm SB X7-7 Table 4 Industrial Water Use Non-industrial Water Use Population Fm SB X7-7 Table 3 Non- Industrial GPCD Eligible for Exclusion Y/N 10 to 15 Year Baseline - Process Water Deduction Eligibility Year ,091 13,091 43, NO Year ,765 13,765 45, NO Year ,346 15,346 46, NO Year ,882 13,882 46, NO Year ,166 17,166 48, NO Year ,713 16,713 49, NO Year ,098 17,098 50, NO Year ,885 16,885 51, NO Year ,908 15,908 51, NO Year ,411 17,411 51, NO Year NO Year NO Year NO Year NO Year NO 5 Year Baseline - Process Water Deduction Eligibility Year ,908 15,908 51, NO Year ,411 17,411 51, NO Year ,149 15,149 52, NO Year ,880 15,880 51, NO Year ,551 16,551 52, NO 2015 Compliance Year - Process Water Deduction Eligiblity NOTES: ,650 8,650 57, NO
228 SB X7-7 Table 4-C.4: Process Water Deduction Eligibility Criteria 4 Disadvantaged Community Use IRWM DAC Mapping tool California Median Household Income Service Area Median Household Income Percentage of Statewide Average 2015 Compliance Year - Process Water Deduction Eligibility Eligible for Exclusion? Y/N 2010 $53,046 0% YES A Disadvantaged Community is a community with a median household income less than 80 percent of the statewide average. NOTES:
229 SB X7-7 Table 4-D: Process Water Deduction - Volume separate table for each industrial customer with a process water exclusion Name of Industrial Customer Industrial Customer 6 Baseline Year Fm SB X7-7 Table 3 Industrial Customer's Total Water Use Total Volume Supplied by Water Agency % of Water Supplied by Water Agency Customer's Total Process Water Use Complete a Volume of Process Water Eligible for Exclusion for this Customer 10 to 15 Year Baseline - Process Water Deduction Year Year Year Year Year Year Year Year Year Year Year Year Year Year Year Year Baseline - Process Water Deduction Year Year Year Year Year Compliance Year - Process Water Deduction NOTES:
230 SB X7-7 Table 5: Gallons Per Capita Per Day (GPCD) Baseline Year Service Area Population Annual Gross Water Use Daily Per Capita Water Use (GPCD) 10 to 15 Year Baseline GPCD Year ,788 13, Year ,028 13, Year ,108 15, Year ,975 13, Year ,075 17, Year ,155 16, Year ,667 17, Year ,039 16, Year ,150 15, Year ,934 17, Year Average Baseline GPCD 5 Year Baseline GPCD 290 Baseline Year Service Area Population Gross Water Use Daily Per Capita Water Use Year ,150 15, Year ,934 17, Year ,474 15, Year ,919 15, Year ,917 16, Year Average Baseline GPCD 2015 Compliance Year GPCD NOTES: ,525 8,
231 SB X7-7 Table 6: Gallons per Capita per Day Year Baseline GPCD Year Baseline GPCD Compliance Year GPCD 134 NOTES:
232 SB X7-7 Table 7: 2020 Target Method Target Method Method 1 Method 2 Supporting Documentation SB X7-7 Table 7A SB X7-7 Tables 7B, 7C, and 7D NOTES: Method 3 SB X7-7 Table 7-E Method 4 Method 4 Calculator
233 SB X7-7 Table 7-A: Target Method 1 20% Reduction Year Baseline GPCD 2020 Target GPCD NOTES:
234 SB X7-7 Table 7-B: Target Method 2 Landscape Water Use Target Tables for Target Method 2 (SB X7-7 Tables 7-B, 7-C, and 7-D) are not included in the SB X7-7 Verification Form, but are still required for water suppliers using Target Method 2. These water suppliers should contact Gwen Huff at (916) or gwen.huff@water.ca.gov
235 SB X7-7 Table 7-C: Target Method 2 Target CII Water Use Tables for Target Method 2 (SB X7-7 Tables 7-B, 7-C, and 7-D) are not included in the SB X7-7 Verification Form, but are still required for water suppliers using Target Method 2. These water suppliers should contact Gwen Huff at (916) or gwen.huff@water.ca.gov
236 SB X7-7 Table 7-D: Target Method 2 Summary Tables for Target Method 2 (SB X7-7 Tables 7-B, 7-C, and 7-D) are not included in the SB X7-7 Verification Form, but are still required for water suppliers using Target Method 2. These water suppliers should contact Gwen Huff at (916) or gwen.huff@water.ca.gov
237 SB X7-7 Table 7-E: Target Method 3 Agency May Select More Than One as Applicable Percentage of Service Area in This Hydrological Region Hydrologic Region "2020 Plan" Regional Targets Method 3 Regional Targets (95%) North Coast North Lahontan % Sacramento River San Francisco Bay San Joaquin River Central Coast Tulare Lake South Lahontan South Coast Colorado River Target (If more than one region is selected, this value is calculated.) NOTES: 167
238 SB X7-7 Table 7-F: Confirm Minimum Reduction for 2020 Target 5 Year Baseline GPCD From SB X7-7 Table 5 Maximum 2020 Target 1 Calculated Confirmed 2020 Target Target Maximum 2020 Target is 95% of the 5 Year Baseline GPCD Target is calculated based on the selected Target Method, see SB X7-7 Table 7 and corresponding tables for agency's calculated target. NOTES:
239 SB X7-7 Table 8: 2015 Interim Target GPCD Confirmed 2020 Target Year Baseline GPCD 2015 Interim Target GPCD NOTES:
240 SB X7-7 Table 9: 2015 Compliance Actual 2015 GPCD 2015 Interim Target GPCD Extraordinary Events Optional Adjustments (in GPCD) Enter "0" if Adjustment Not Used Weather Normalization Economic Adjustment TOTAL Adjustments Adjusted 2015 GPCD 2015 GPCD (Adjusted if applicable) Did Supplier Achieve Targeted Reduction for 2015? YES NOTES:
241 APPENDIX G DWR Bulletin 118: Sacramento Groundwater Basin Yolo Subbasin
242 (THIS PAGE LEFT BLANK INTENTIONALLY)
243 Sacramento River Hydrologic Region California s Groundwater Sacramento Valley Groundwater Basin Bulletin 118 Sacramento Valley Groundwater Basin Yolo Subbasin Groundwater Basin Number: County: Yolo, Solano Surface Area: 256,000 acres (400 square miles) Boundaries & Hydrology The Yolo Subbasin, located in the southern portion of the Sacramento Valley Basin primarily within Yolo County. It is bounded on the east by the Sacramento River, on the west by the Coast Range, on the north by Cache Creek, and on the south by Putah Creek. The basin is roughly bisected by an anticlinal structure, but otherwise is gently sloping from west to east with elevations ranging from approximately 400 feet at the base of the Coast Range to the west to nearly sea level in the eastern areas. Major cities within the subbasin include Davis, West Sacramento, Winters, and Woodland. Precipitation averages approximately 20 to 24 inches per year in the western portion of the subbasin, and approximately 18 to 20 inches per year in the eastern portion of the subbasin. Hydrogeologic Information Water Bearing Formations The primary water bearing formations comprising the Yolo subbasin are sedimentary continental deposits of Late Tertiary (Pliocene) to Quaternary (Holocene) age. Fresh water-bearing units include younger alluvium, older alluvium, and the Tehama Formation (Olmstead, 1961 and DWR, 1978). The cumulative thickness of these units ranges from a few hundred feet near the Coast Range on the west to nearly 3000 feet near the eastern margin of the basin. Saline water-bearing sedimentary units underlie the Tehama formation and are generally considered the boundary of fresh water (Berkstresser, 1973). Younger alluvium includes flood basin deposits and Recent stream channel deposits. Flood basin deposits occur along the eastern margin of the subbasin in the Yolo Flood Basin. They consist primarily of silts and clays, but along the eastern margin of the subbasin may be locally interbedded with stream channel deposits of the Sacramento River. Thickness of the unit ranges from 0 to 150 feet. The flood basin deposits have low permeability and generally yield low quantities of water to wells. The quality of ground water produced from the basin deposits is often poor. Recent stream channel deposits consist of unconsolidated silt, fine- to medium-grained sand, gravel and occasionally cobbles deposited in and adjacent to active streams in the subbasin. They occur along the Sacramento River, Cache Creek, and Putah Creek. Thickness of the younger alluvium ranges from 0 to 150 feet. Last update 2/27/04
244 Sacramento River Hydrologic Region California s Groundwater Sacramento Valley Groundwater Basin Bulletin 118 The younger alluvium varies from moderately to highly permeable, but often lies above the saturated zone. Where saturated, the younger alluvium yields significant quantities of water to wells. Older alluvium consists of loose to moderately compacted silt, silty clay, sand, and gravel deposited in alluvial fans during the Pliocene and Pleistocene. Thickness of the unit ranges from 60 to 130 feet, about onequarter of which is coarse sand and gravel. Permeability of the older alluvium is highly variable. Wells penetrating sand and gravel lenses of the unit produce between 300 and 1000 gpm. Adjacent to the Sacramento River, wells completed in ancestral Sacramento River stream channel deposits yield up to 4000 gpm. Wells completed in the finer-grained portions of the older alluvium produce between 50 and 150 gpm. The Tehama Formation is the thickest water-bearing unit underlying the Yolo subbasin, ranging in thickness from 1500 to 2500 feet. Surface exposures of the Tehama Formation are limited mainly to the Coast Range foothills along the western margin of the basin, as well as in the Plainfield Ridge. The Tehama consists of moderately compacted silt, clay, and silty fine sand enclosing lenses of sand and gravel, silt and gravel, and cemented conglomerate. Permeability of the Tehama Formation is variable, but generally less than the younger units. Because of its relatively greater thickness, however, wells completed in the unit can yield up to several thousand gallons per minute. Underlying the Tehama Formation are brackish to saline water-bearing sedimentary units, including the somewhat brackish sedimentary rocks of volcanic origin (Pliocene to Oligocene?) underlain by marine sedimentary rocks (Oligocene? to Paleocene) which are typically of low permeability and contain connate water (Olmstead, 1961). The upper contact of these units generally coincides with the fresh/saline water boundary. The contact is found near the Coast Range at depths as shallow as a few hundred feet. Near the eastern margin of the basin it reaches depths of nearly 3000 feet. Subsurface Flow Controls The geologic structure of the groundwater subbasin is dominated by an anticlinal ridge oriented northwest to southeast, which is expressed at the surface as the Dunnigan Hills and Plainfield Ridge. The anticlinal structure impedes subsurface flow from west to east. Subsurface groundwater outflow sometimes occurs from the Yolo subbasin into the Solano subbasin to the south. Subsurface outflow and inflow may also occur beneath the Sacramento River to the east with the South and North American subbasins. Subsurface groundwater inflow may occur from the west out of the Capay Valley Basin. Groundwater Level Trends Groundwater levels are impacted by periods of drought due to increased groundwater pumping and less surface water recharge (e.g. in the late 1970 s and early 1990 s), but recover quickly in wet years. Long term trends do not indicate any significant decline in water levels, with the exception of localized pumping depressions in the vicinity of the Davis, Woodland and Dunnigan/Zamora areas. Past studies (Scott, 1975) have concluded that the Last update 2/27/04
245 Sacramento River Hydrologic Region California s Groundwater Sacramento Valley Groundwater Basin Bulletin 118 Yolo subbasin is subject to overdraft, however the completion of Indian Valley Reservoir in 1976 provided significant relief in the form of additional available surface water (YCFCWCD, 2000). Groundwater Storage Many studies have been conducted to determine the groundwater storage within parts or all of Yolo County. Several of these studies refer to calculations completed by Scott and Scalmanini in their 1975 report, Investigations of Groundwater Resources, Yolo County. Groundwater storage capacity for the entire county for groundwater aquifer depths between 20 and 420 feet was calculated as 14,038,000 acre-feet based on subtotals from six separate study areas. Specific yields were calculated, based on well log information, for three separate depth intervals within six study areas, and ranged from 6.5% to 9.7%. Groundwater Storage Capacity. From the Scott and Scalmanini calculations it can be roughly estimated that the Yolo Subbasin, (defined in this report as a portion of the county) has a total storage capacity of 6,455,940 acre-feet for depths between 20 and 420 feet (see below). Table: Storage capacity was calculated based on Scott (1975) as follows: Groundwater Basin (Scott, 1975) Area (acres) Calculated Gross Storage Capacity (Scott, 1975) Estimated % area within Yolo Subbasin 1 Estimated Storage Capacity within Yolo Subbasin 1 Cache Creek 45,800 1,678,100 20% 335,620 Upper Cache- 70,300 2,017, % 2,017,700 Putah Plainfield 8, , % 240,800 Ridge Lower Cache- 97,300 2,876,900 95% 2,733,055 Putah Colusa 95,700 2,709,800 0% 0 Yolo Bypass 129,100 4,514,700 25% 1,128,765 Totals 447,000 14,038,000 6,455,940 1 Represents the portion of each Groundwater Basin (as defined by Scott, 1975) that is contained within the Yolo Subbasin (as defined by the DWR). Percentages were estimated by DWR staff. Groundwater in Storage. Groundwater storage between the depths of 20 to 420 feet in 1974 for all of Yolo County was calculated to be 13,208,400 acre-feet (Scott, 1975). Based on the Scott report, groundwater storage within the Yolo Subbasin for 1974 is estimated at 6,074,220 acre-feet (see below). Last update 2/27/04
246 Sacramento River Hydrologic Region California s Groundwater Sacramento Valley Groundwater Basin Bulletin 118 Table: 1974 groundwater storage calculations based on Scott (1975): Groundwater Basin (Scott, 1975) Area (acres) 1974 Calculated Storage (Scott, 1975) Estimated % area within Yolo Subbasin 1 Estimated 1974 Storage within Yolo Subbasin 1 Cache Creek 45,800 1,528,700 20% 305,740 Upper Cache- 70,300 1,921, % 1,921,000 Putah Plainfield 8, , % 189,400 Ridge Lower Cache- 97,300 2,677,400 95% 2,543,530 Putah Colusa 95,700 2,433,700 0% 0 Yolo Bypass 129,100 4,458,200 25% 1,114,550 Totals 447,000 13,208,400 6,074,220 1 Represents the portion of each Groundwater Basin (as defined by Scott, 1975) that is contained within the Yolo Subbasin (as defined by the DWR). Percentages were estimated by DWR staff. Groundwater Budget (Type C) Currently no groundwater budget has been calculated for the Yolo Subbasin (see comments below). Groundwater Quality Groundwater found within the subbasin is characterized as a sodium magnesium, calcium magnesium, or magnesium bicarbonate type. The quality is considered good for both agricultural and municipal uses, even though it is hard to very hard overall (generally over 180 mg/l CaCO 3 ). Selenium and boron are found in higher concentrations locally (Evenson, 1985). Total dissolved solids range from a of 107 ppm to 1300 ppm and average 574 ppm, based on Title 22 data obtained from public supply water well samples (DHS, 2000). Localized impairments include elevated concentrations of boron (as high as 2 to 4 ppm) in groundwater along Cache Creek and in the Cache Creek Settling Basin area, increased levels of selenium present in the groundwater supplies for the City of Davis, and localized areas of nitrate contamination (YCFCWCD 1992) (Evenson, 1985). Water Quality in Public Supply Wells Constituent Group 1 Number of Number of wells with a wells sampled 2 concentration above an MCL 3 Inorganics Primary 61 3 Radiological 53 0 Nitrates 67 1 Pesticides 59 0 VOCs and SVOCs 59 1 Inorganics Secondary Last update 2/27/04
247 Sacramento River Hydrologic Region California s Groundwater Sacramento Valley Groundwater Basin Bulletin A description of each member in the constituent groups and a generalized discussion of the relevance of these groups are included in California s Groundwater Bulletin 118 by DWR (2003). 2 Represents distinct number of wells sampled as required under DHS Title 22 program from 1994 through Each well reported with a concentration above an MCL was confirmed with a second detection above an MCL. This information is intended as an indicator of the types of activities that cause contamination in a given basin. It represents the water quality at the sample location. It does not indicate the water quality delivered to the consumer. More detailed drinking water quality information can be obtained from the local water purveyor and its annual Consumer Confidence Report. Well Characteristics Well yields (gal/min) Municipal/Irrigation Range: Average: 1500 (estimate) Total depths (ft) 1 Domestic Range: Average: 230 (estimate) Municipal/Irrigation Range: Average: 400 (estimate) 1 Based on DWR data. Active Monitoring Data Agency Parameter Number of wells /measurement frequency DWR Groundwater Levels YCFC&WCD Sacramento County USBR 10 semi-annually 4 monthly 92 semi-annually 1 monthly 1 semi-annually 12 semi-annually 7 monthly DHS Water Quality 133 annually DWR Ground Subsidence 1 continuously Basin Management Groundwater management: R.D. 108 adopted AB3030 plan 2/95 R.D adopted AB3030 plan 4/95 R.D adopted AB3030 plan 1/97 Yolo County Flood Control and Water Conservation District are drafting plan but not pursuant to AB3030 R.D. 900, City of West Sacramento is not drafting AB3030 plan Water agencies Public Yolo County Flood Control and Water Conservation District City of Woodland, City of Davis, City of West Sacramento Private R.D. 108, 900,2035, 2068 Last update 2/27/04
248 Sacramento River Hydrologic Region California s Groundwater Sacramento Valley Groundwater Basin Bulletin 118 Comments: Although groundwater budgets have been previously calculated for areas overlying the Yolo Subbasin, no groundwater budget has been calculated for the Yolo Subbasin as defined by this report. References Cited Berkstresser, C.F. Jr. Base of Fresh Ground-Water -- Approximately 3,000 micromhos -- in the Sacramento Valley and Sacramento-San Joaquin Delta, California. U.S. Geological Survey Water-Resource Inv California Department of Water Resources. Evaluation of Ground Water Resources: Sacramento Valley. Bulletin August California Department of Water Resources. Groundwater Level Data. Website Evenson, K.D. Chemical Quality of Ground Water in Yolo and Solano Counties, California. U.S. Geological Survey Water-Resource Investigations Report Olmstead, F.H., and Davis, G.H. Geologic Features and Ground-Water Storage Capacity of the Sacramento Valley, California. U.S. Geological Survey Water-Supply Paper Scott, V.H., and Scalmanini, J.C. Investigations of Groundwater Resources Yolo County, California. Department of Land, Air and Water Resources. Water Science and Engineering Paper University of California, Davis. September Yolo County Flood Control and Water Conservation District, Yolo County Water Plan. Prepared by Borcalli & Associates. September, Additional References Bertoldi, G.L. Estimated Permeabilities for Soils in the Sacramento Valley, California. U.S. Geological Survey Water-Resources Investigations Report Bryan, Kirk. Geology and Ground-Water Resources of the Sacramento Valley, California. U.S. Geological Survey Water-Supply Paper California Department of Water Resources. Report to the California State Legislature on Putah Creek Cone Investigation. December California Department of Water Resources. Historical Ground Water Levels in Yolo County. District Report. December Helley, E.J., and Harwood, D.S. Geologic Map of the Late Cenozoic Deposits of the Sacramento Valley and Northern Sierran Foothills, California. U.S. Geological Survey Miscellaneous Field Studies Map MF Harwood, D.S., and Helley, E.J. Late Cenozoic Tectonism of the Sacramento Valley, California. U.S. Geological Survey Professional Paper Jenkins, M. Yolo County, California s Water Supply System: Conjunctive Use Without Management. Department of Civil and Environmental Engineering. University of California, Davis. September Page, R.W. Base and Thickness of the Post-Eocene Continental Deposits in the Sacramento Valley, California. U.S. Geological Survey Water-Resource Investigations Report Page, R.W. Geology of the Fresh Ground-Water Basin of the Central Valley. California, with Texture Maps and Sections. U.S. Geological Survey Professional Paper 1401-C Last update 2/27/04
249 Sacramento River Hydrologic Region California s Groundwater Sacramento Valley Groundwater Basin Bulletin 118 Thomasson, H.G., and others. Geology, Water Resources, and Usable Ground-Water Storage Capacity of Part of Solano County, California. U.S. Geological Survey Water-Supply Paper Yolo County Flood Control and Water Conservation District, Yolo County Water Plan Update (Draft). Prepared by Borcalli and Associates Errata Changes made to the basin description will be noted here. Last update 2/27/04
250 (THIS PAGE LEFT BLANK INTENTIONALLY)
251 APPENDIX H Draft Water Reliability Evaluation TM April 15, 2016
252 (THIS PAGE LEFT BLANK INTENTIONALLY)
 Guidebook for Urban Water Suppliers, the following sections are presented")
253 TECHNICAL MEMORANDUM DATE: April 15, 2016 Project No.: SENT VIA: HAND DELIVERY TO: Tim Busch FROM: Chris Malone, PE, RCE REVIEWED BY: Brenda J. Estrada, PE, RCE SUBJECT: Water Reliability Evaluation In accordance with the 2015 Urban Water Management Plan (UWMP) Guidebook for Urban Water Suppliers, the following sections are presented in this Technical Memorandum (TM): Constraints on Water Sources Reliability by Type of Year Supply and Demand Assessment Regional Supply Reliability City of Woodland CONSTRAINTS ON WATER SOURCES The City of Woodland (City) has the following three major sources of water supply at its disposal: Treated Surface Water Native Groundwater Aquifer Storage and Recovery (ASR) Water The major constraints on each of these supplies are discussed in this section. Treated Surface Water The City is a participant in the Davis-Woodland Water Supply Project (DWWSP), which is managed by the Woodland-Davis Clean Water Agency (WDCWA). The DWWSP will deliver treated surface water to the City, and to two other participants (the City of Davis and the University of California, Davis), from the Regional Water Treatment Facility (RWTF), which is scheduled to begin full-scale operations in Research Park Drive, Suite 100 Davis, CA Phone Fax westyost.com
254 Technical Memorandum April 15, 2016 Page 2 The amount of water that the City can receive from the RWTF is constrained by a number of factors. The first such constraint is that the City is entitled to no more than 18 million gallon per day (mgd) of RWTF capacity. (That number is planned to increase to 22 mgd in 2035.) Thus, any City water demands in excess of that amount will need to be met from other supplies. In addition, surface water deliveries to the City (and to the other DWWSP participants) are constrained by the availability of the water rights available to the Agency. The two main water rights include the primary WDCWA water right permit ( primary water right ) and a set of secondary water rights obtained from the Conaway Preservation Group ( secondary water rights ). The Agency s primary water right is limited to 45,000 acre-feet (AF) per year, which roughly equates to an annual average of 40 mgd. The City is entitled 52.1 percent of that water right, which equates to 23,445 AF, or an annual average of roughly 20.9 mgd. As noted, however, the City s RWTF capacity allocation is 18 mgd, which equates to about 20,160 AF if withdrawn at a constant rate year-round. As a result, the Agency s primary water right is not considered to be a constraint on surface water deliveries to the City. The WDCWA water right is, however, subject to curtailments under State Water Resources Control Board Term 91 regulations. Specifically, when a Term 91 curtailment is declared, the Agency s primary water right is not available at all. At that point, the City will become reliant on the secondary water rights. Key features of the secondary water rights, as they apply to the WDCWA generally, are summarized as follows: 1. The secondary water rights are only available from April through October, and are therefore not available for the period of November through March. 2. In a Lake Shasta normal year, a total of 10,000 AF of water are available under the secondary water rights, of which no more than 7,500 AF may be used during the period of July through September. 3. In a Lake Shasta critical year, a total of 7,500 AF of water are available under the secondary water rights, of which no more than 5,625 AF may be used during the period of July through September. As with the primary water right, the City is entitled to 52.1 percent of the water that is available under the secondary water rights. The resultant availability of the secondary water rights to the WDCWA and to the City is summarized in Table 1. n\c\204\ \wp\uwmp\112315_appg
255 Technical Memorandum April 15, 2016 Page 3 Table 1. Secondary Water Rights Availability Condition Water Availability, AF Woodland-Davis Clean Water Agency City of Woodland Lake Shasta Normal Year April October 10,000 5,210 July September 7,500 3,908 Lake Shasta Critical Year April October 7,500 3,908 July September 5,625 2,931 In addition to the WDCWA water right and the secondary water rights, the City reserves the option to purchase supplemental surface water supplies during critically dry periods. The details of such purchases will be determined on an as-needed basis in the future if and when the need arises to undertake such purchases. Native Groundwater The City has relied on shallow and intermediate-depth native groundwater wells as its primary water supply throughout its history. Increasingly stringent drinking water quality and wastewater discharge regulations have obligated the City to seek other supplies, which resulted in the City s participation in the DWWSP. The potential for wastewater discharge exceedances for such constituents as selenium, boron, and salinity (measured as electrical conductivity, or EC) is expected to be eliminated through the addition of surface water supplies under the DWWSP. However, drinking water regulations and concerns remain a constraint on native groundwater usage. When the RWTF comes online in 2016, the City plans to significantly reduce the use of its native groundwater wells. Key information and operational constraints for the currently-operational native groundwater wells are summarized in Table 2. n\c\204\ \wp\uwmp\112315_appg
256 Technical Memorandum April 15, 2016 Page 4 Well ID # Table 2. Summary Information for Existing Native Groundwater Wells Well Age, years Existing Capacity, gpm Avg Hexavalent Chromium, mg/l (a) Planned Use , Utilize for blending , Utilize for blending , Utilize for blending , Replace with new ASR Well offline 25.7 Replace with new ASR Well , Retain as emergency backup , Retain as emergency backup , Retain as emergency backup , Retain as emergency backup 15S 4 1, Retain as emergency backup , Retain as emergency backup Retain as emergency backup , Retain as emergency backup 22G 4 1, Retain as emergency backup offline 19.0 Destroy , Destroy offline 23.0 Destroy or convert to park irrigation in , Terminate use in September 2016 (a) Average values based on water quality samples taken between August 2012 and April All except three of the wells will be either converted to ASR use, destroyed outright, or discontinued operationally for anything other than emergency or irrigation purposes. The only exceptions are wells 16, 24, and 26, which are slated to be connected to the treated surface water transmission mains and used for blending purposes when the need exists. More specifically, all three wells will be connected to the transmission main serving the southern portion of the City. No wells are currently planned to be connected to the transmission main serving the northern portion of the City. In addition to the capacity and operational constraints indicated in Table 2, the following water quality parameters/concerns also constrain native groundwater use: Nitrate Hexavalent Chromium Aesthetic/Hardness Concerns n\c\204\ \wp\uwmp\112315_appg
257 Technical Memorandum April 15, 2016 Page 5 Nitrate The drinking water limit for nitrate [as N] is 10 mg/l. Due to a long history of agricultural operations in the immediate vicinity of Woodland, certain native groundwater supply wells have high levels of nitrate. In recent years, the City has been obligated to carefully manage supplies from the higher-nitrate wells to ensure that nitrate limits are not exceeded. When the RWTF comes online in 2016, the City plans to retire those wells for anything other than emergency or landscape irrigation purposes. Currently operational wells with nitrate concerns that are planned for retirement from routine drinking water operations include wells 10, 11 and 17 as shown in Figure 1. Hexavalent Chromium A drinking water hexavalent chromium standard of 10 µg/l became effective on July 1, Several of the City s native groundwater supply wells exhibit hexavalent chromium concentrations that periodically exceed the standard. State regulations require full compliance with the hexavalent chromium standard no later than January 1, The exact compliance schedule for the City has not been finalized. Aesthetic/Hardness Concerns The City has adopted a policy whereby once the RWTF comes online and routine treated surface water deliveries begin, water supplies will be delivered in such a way that City residents will no longer receive water that is primarily native groundwater. The option will still be retained to use native groundwater as a supply source; however, the native groundwater will be injected directly into the surface water transmission mains, thereby ensuring that residents receive a high quality, low-hardness blended supply that is dominated by surface water. The City has determined that a minimum surface water to native groundwater ratio of 3-to-1 (i.e., a maximum native groundwater usage rate of 33 percent of the surface water delivery rate, or 25 percent as a percentage of the total supply) will be acceptable. Secondarily, the mixing of native groundwater and surface water in the transmission mains will also ensure that drinking water standards for hexavalent chromium will be met at all times. The native groundwater wells that will be connected to the transmission mains for this purpose include wells 16, 24, and 26, shown in Figure 1. ASR Water Once the DWWSP comes online, the City will begin to implement a long-term ASR program, wherein treated surface water in excess of customer demands will be delivered to the City during the winter and shoulder month periods (generally November through April) and injected into the ground into specially-equipped ASR wells at selected locations. During times when surface water availability is severely curtailed, the previously-injected ASR water would be withdrawn to meet customer demands that cannot be met by direct treated surface water deliveries or by native groundwater supplies. When the RWTF becomes operational in mid-2016, the City is expecting to have three ASR wells ready for operations, with as many as four additional wells planned for construction and operation over the next 20 years. The exact number of wells that will ultimately be built, and the timing of their construction, will depend on the performance of the first three wells, the availability of treated n\c\204\ \wp\uwmp\112315_appg
258 Technical Memorandum April 15, 2016 Page 6 surface water, customer demands, and other factors. For this analysis, it is assumed that five ASR wells will be operational by 2020, with an addition two wells being added by 2035 when the RWTF is scheduled for upsizing from 18 mgd to 22 mgd. The locations of the first three wells, and of likely future wells, are indicated in Figure 1. The major constraints on the use of ASR wells include: The number of wells available; The maximum rates of injection into each well (currently assumed to be 1,000 gallons per minutes, or gpm); The maximum rates of extraction out of each well (currently assumed to be 1,500 gpm); The availability of treated surface water for injection during the critical injection period (November through April); Average and peak customer demands during both the injection and extraction periods; and The recoverability of the injected water. This last item has been assumed to be on the order of 90 percent, based on aquifer hydrogeologic modeling analyses. As a practical matter, once the ASR wells are operational, recoverability of the injected water will be determined in two ways: 1) By tracking the volume stored and extracted; and 2) by monitoring chlorine levels in the stored water at the ASR wells and at two nearby monitoring wells. Once the volume of injected water has been withdrawn, withdrawals will be discontinued until additional injections occur. Ultimately the plan is for the injected surface water volumes to exceed the withdrawals on a year-over-year basis, such that a significant volume of injected surface water will remain banked, with the long-term banked volumes only being withdrawn in severe dry years. RELIABILITY BY TYPE OF YEAR The major topics covered in this section include: Reliability of Surface Water Supplies Reliability of Native Groundwater Supplies Reliability of ASR Water Supplies Reliability of Surface Water Supplies As described in the previous section of this TM, the key constraints on surface water supplies are governed by Term 91 curtailments, Lake Shasta normal/critical year status, the City s share of RWTF capacity, and the withdrawal limits associated with the secondary water rights. Uncertainties on the availability of price of supplemental water purchases also have a bearing on water supply reliability. n\c\204\ \wp\uwmp\112315_appg
259 Technical Memorandum April 15, 2016 Page 7 The history of Term 91 curtailments and Lake Shasta critical years is used as the basis for assessing surface water reliability. Term 91 regulations went into effect in The total number of curtailment days each year for the period of 1984 through 2015 is shown in Figure 2, along with the Lake Shasta normal/critical year status. As indicated in the figure, the three most severe curtailment years in the 32-year history of Term 91 all occurred in the last three years, all of which were also designated as Lake Shasta critical years. Term 91 curtailments during the period outside of April through October (i.e., January through March and November through December) are also of particular interest, as this is the period during which the secondary water rights are not available. The history of Term 91 curtailments during this period is summarized in Figure 3 and Table 3. As indicated, the most severe curtailments outside of April through October have all occurred in the last three years. Moreover, prior to the 2013/2014 water year, there had never been any curtailments later than November 15. In the last three water years, however, curtailments have continued well beyond that date, even extending to as late as February in Table 3. History of Term 91 Curtailment Days Outside of April through October Curtailment Period, days Year January March November December Total Outside April October The average annual curtailment over the 32-year history of Term 91 regulations is 82 days. Calendar year 2009 (which was a Lake Shasta normal year) also had a total curtailment period of 82 days; therefore, 2009 is considered an average year for purposes of this analysis. The most severe Term 91 curtailment on record occurred during 2014, when there was a total curtailment of 233 days, of which a record 68 days occurred outside of the April through October period. The three most severe curtailment years on record have been 2013 through The Term 91 curtailment and Lake Shasta year status associated with an average year, a single dry year and a multiple (3-year) dry period are summarized in Table 4. n\c\204\ \wp\uwmp\112315_appg
260 Technical Memorandum April 15, 2016 Page 8 Water Year Type Table 4. Basis for Estimating Surface Water Availability Basis Term 91 Curtailment, days/year Term 91 Curtailment Apr Oct, days Lake Shasta Year Status Average Year Normal Single-Dry Year Critical Multiple-Dry Years 1st Year Multiple-Dry Years 2nd Year Multiple-Dry Years 3rd Year Critical Critical Critical Accordingly, the availability of surface water is calculated as follows: 1. During Term 91 curtailment periods, surface water availability is assumed to be equivalent to the City s share of the secondary water rights (5,210 AF in a Lake Shasta normal year; 3,908 AF in a Lake Shasta critical year). 2. During non-curtailment periods, surface water availability is assumed to equal the City s share of RWTF capacity (18 mgd, increasing to 22 mgd in 2035). Using this basis, the total availability of surface water supplies, not including supplemental water purchases, is included in Table 7-1 ( Retail: Basis of Water Year Data Surface Water Supply ) of the Draft 2015 UWMP. Reliability of Native Groundwater Supplies The ability of native groundwater supply wells to produce water is not expected to be affected by severe or prolonged drought conditions. Aquifer levels are expected to remain within the historical range, and equipment maintenance and backup power supplies are generally adequate to ensure a high degree of reliability. Instead, the reliability of the native groundwater supply is limited by the constraints described in the previous section of this TM. Specifically, as noted above, native groundwater use as a drinking water supply for anything other than emergency conditions would only occur when the native groundwater can be mixed with treated surface water in the City s southern transmission main at a ratio of no less than 3-to-1 surface water to native groundwater. Accordingly, the availability of native groundwater is assumed to equal the lesser of the following: percent of the surface water delivery rate in the southern transmission main. 2. The combined pumping capacity of the three native groundwater wells connected to the southern transmission main (approximately 5.3 mgd). n\c\204\ \wp\uwmp\112315_appg
261 Technical Memorandum April 15, 2016 Page 9 Thus, native groundwater would not be used in any period when surface water supplies are unavailable, except under emergency conditions. For purposes of this analysis, it is assumed that the southern transmission main will deliver approximately 70 percent of the total treated surface flow to the City, expressed as a long-term average. Using this basis, the total availability of native groundwater supplies is included in Table 7-1 ( Retail: Basis of Water Year Data Native Groundwater Supply ) of the Draft 2015 UWMP. Reliability of ASR Water Supplies ASR water supply wells are expected to have a high degree of reliability based on equipment maintenance and backup power considerations. The main issue in terms of reliability will be the availability of ASR water based on the constraints discussed in the previous section, namely, total ASR pumping rate (the product of per well capacity and number of wells) and the volume of water banked through previous ASR injection periods. In the first few years of the project, ASR water will be limited due to the number of ASR wells (initially three) and the amount of ASR injection water banking that can be achieved during the first few injection periods after the RWTF comes online. It should also be noted that the long-term plan calls for total reliance on ASR for any Term 91 curtailment periods that occur during the period of November through March, when the secondary water rights are unavailable. If curtailments occur during that period prior to the City achieving adequate long-term banked ASR volumes, then it may be necessary for the City to make supplemental surface water purchases to get through the period in question. For purposes of this analysis, it is assumed that the City will have five ASR wells available, each with an extraction capacity of 1,500 gpm (as noted above). Of these five wells, it is assumed that four wells would be in operation at any given time, with one serving as a backup, thus resulting in a firm ASR extraction capacity of 6,000 gpm (approximately 8.6 mgd). It is also assumed that adequate banking of injected ASR water will have occurred previously to support extraction of ASR water throughout prolonged curtailment periods. In addition, the following operational parameters are assumed to apply: 1. In an average year, the ASR wells are available for extraction of banked water during the period of June through September (122 days), with the November through April period being dedicated to ASR injections. 2. In a drought year, the ASR wells are available for extraction of banked water throughout the Term 91 curtailment period. Using this basis, Table 7-1 ( Retail: Basis of Water Year Data ASR Extraction Water Supply ) of the Draft 2015 UWMP includes the total availability of extracted ASR water. n\c\204\ \wp\uwmp\112315_appg
262 Technical Memorandum April 15, 2016 Page 10 SUPPLY AND DEMAND ASSESSMENT For the water supply and demand assessment, demand projections for the period of 2020 through 2035 are taken from Table 4-3 in Chapter 4 of the Draft 2015 UWMP. It is assumed that future supplies will remain relatively constant until 2035, at which time the City s share of the RWTF is expanded and two additional ASR wells are added. The increase in surface water delivered upon expansion of the RWTF also increases the amount of groundwater available for use, for reasons discussed above. Table 5 and Table 6 summarize the anticipated supply availability by type for the periods of and , respectively. Water Year Type Table 5. Estimated Total Supply Availability, Supply availability, AF/year (a) Surface Water Groundwater ASR Water All Supplies Average Year 20,840 4,860 3,240 28,940 Single-Dry Year 11,200 2,610 6,180 19,990 Multiple-Dry Years 1 st Year Multiple-Dry Years 2nd Year Multiple-Dry Years 3rd Year 13,020 3,040 5,300 21,360 11,200 2,610 6,180 19,990 11,370 2,650 6,100 20,120 (a) Supplemental purchases of surface water will be made on an as-needed basis and are not included in the totals shown. Water Year Type Table 6. Estimated Total Supply Availability, Supply availability, AF/year (a) Surface Water Groundwater ASR Water All Supplies Average Year 24,320 5,670 4,850 34,840 Single-Dry Year 12,820 2,990 9,270 25,080 Multiple-Dry Years 1 st Year 15,050 3,510 7,960 26,520 Multiple-Dry Years 2nd Year 12,820 2,990 9,270 25,080 Multiple-Dry Years 3rd Year 13,020 3,040 9,150 25,210 (a) Supplemental purchases of surface water will be made on an as-needed basis and are not included in the totals shown. n\c\204\ \wp\uwmp\112315_appg
263 Technical Memorandum April 15, 2016 Page 11 The comparison of demands with total available supplies for normal year conditions is shown in Table 7-2 of the Draft 2015 UWMP. The comparison of demands with total available supplies for single dry year conditions is shown in Table 7-3 of the Draft 2015 UWMP. The ASR extractions, native groundwater supplies, and supplemental surface water purchases will be adequate to cover all demand scenarios through REGIONAL SUPPLY RELIABILITY The City is either currently implementing, or plans to implement, a variety of water management tools/activities to reduce reliance on imported water. These include extensive demand management measures (documented in Chapter 9 of the Draft 2015 UWMP), increased use of recycled water (documented in Section 6.5 of the Draft 2015 UWMP), and possible conversion of existing shallow/intermediate aquifer supply wells to dedicated landscape irrigation use after the DWWSP comes online (as indicated in Section of the Draft 2015 UWMP). n\c\204\ \wp\uwmp\112315_appg
264 (THIS PAGE LEFT BLANK INTENTIONALLY)


265 5 «0 1, «3,000 Scale in Feet Symbology " ) Groundwater Well for Blending Groundwater Well for Emergency Backup Supply Water Treatment Facility «34 S " R ST 5 3 Q KE 33 " ) 22G AL W 15S MATM OR RD EAST ST FIFTH ST THIRD ST FIRST ST PENDEGAST ST MAIN ST S " Notes: 1. Wells 5 and 6 will be kept as emergency backup wells if they are not replaced as ASR wells. GIBSON RD SIXTH ST DEL ORO ST Alternative ASR Well BEAMER ST S " COLLEGE ST CROS S ST HAYS ST Last Saved: 5/16/2016 3:25:02 PM N:\Clients\204 Woodland\ UWMP \GIS\Figures\Fig1_WaterS upplysources.mxd : areimer FREEMAN ST WALNUT ST CALIFORNIA ST 32 S S " " 6 NORTH ST SECOND ST S " 31 " ) ASR Well " ) ELLIOT ST COURT ST " ) 3 Q THO MA S ST 30 S " CLEVELAND ST IMPERIAL ST 20 COTTONWOOD ST 16 " ) 19 CLOVER ST SIERRA ST " ) 29 ANTELOPE ST WEST ST S " 10 MARIPOSA ST 35 PRIVATE RD 12 " ) 21 «" S S " " ) 16 FARMERS CENTRAL RD " ) 24 " ) «Figure 1 DRAFT Water Supply Sources City of Woodland Water Reliability Evaluation TM
266 (THIS PAGE LEFT BLANK INTENTIONALLY)
267 Days in Curtailment Figure 2 History of Term 91 Curtailments, City of Woodland Water Reliability Evaluation TM Last Revised: 4/14/2016; n\c\204\ \e\WS ReliabilityAnalysis Lake Shasta Normal Year Lake Shasta Critical Year
268 (THIS PAGE LEFT BLANK INTENTIONALLY)

269 Days in Curtailment Figure 3 History of Term 91 Curtailment Days Outside of April October City of Woodland Water Reliability Evaluation TM Last Revised: 4/14/2016; n\c\204\ \e\WS ReliabilityAnalysis 60 January March 50 November December
270 (THIS PAGE LEFT BLANK INTENTIONALLY)
271 APPENDIX I Recycled Water Opportunities Evaluation
272 (THIS PAGE LEFT BLANK INTENTIONALLY)
273 Recycled Water Opportunities Evaluation City of Woodland, California Prepared for City of Woodland, California April 2014
274 (THIS PAGE LEFT BLANK INTENTIONALLY)

275 Recycled Water Opportunities Evaluation City of Woodland, California Prepared for City of Woodland, California April, 2014 April 1, 2014 Brown and Caldwell Project No Drew Avenue, Suite 210 Davis, California 95618
276 Table of Contents 1. Introduction Regulatory Framework for Recycled Water Usage Recycled Water Categories Non-potable Reuse of Recycled Water State Water Resources Control Board Recycled Water Policy Title 22 Quality Standards for Non-potable Reuse Recycled Water Reuse Water Quality Allowable Non-potable Recycle Water Uses Potential Recycled Water Flow and Quality Recycled Water Flow Recycled Water Quality Potential Sites for Reuse Eastern Reuse Properties Western Reuse Properties Evaluation of Alternatives for Water Reuse Screening and Grouping of Alternatives Eastern Properties East Group 1 Parcels Non-rice East Group 2 Parcels Rice Stubble Costs of Supplying Recycled Water to Eastern Parcels Issues and Comparison with Other Water Supply Sources Screening and Grouping of Alternatives Western Properties Costs of Supplying Recycled Water to Western Parcels Issues and Comparison with Alternative Water Sources Parks and Other Urban Users Agricultural Irrigation Users (West Groups 2 and 4) Woodland Biomass Industrial User Recommended Alternatives Comparison of Alternatives Recommended Alternatives Other Benefits of a Recycled Water Program Establishing Precedence to Enable Possible Future Marketing of Tertiary Effluent Conclusions and Implementation Steps Discussions with Potential Users Permitting Design and Construction of Recycled Water Supply Infrastructure Planning to Take Advantage of Water Marketing Opportunities Limitations iii V:\44000\ Woodland Recycled Water Opportunities Eval\Report\Final Recycle Water Reuse Report_ docx
277 Recycle Water Opportunities Evaluation Table of Contents 9. References Appendix A: Recycled Water Regulations... A-1 Appendix B: Boron Sensitivity of Crops... B-1 Appendix C: Cost Estimating Details... C-1 Appendix D: Water Marketing Section from Davis Integrated Water Resource Study... D-1 List of Figures Figure 2-1. Common Uses of Recycled Water at Various Treatment Levels Figure 4-1. Overall Site Map and Potential Reuse Parcels Figure 4-2. Eastern Reuse Parcels and Groups Figure 4-3. Western Reuse Parcels and Pipeline Alignment Figure 4-4. Woodland Draft General Plan Land Use Map Figure 5-1. Western Reuse Parcels and Grouping List of Tables Table 2-1. Title 22 Water Quality Standards for Various Types of Non-potable Reuse Table 2-2. Allowable Non-potable Uses of Recycled Water based on Title 22 Treatment Level Table 3-1. Guidelines for Interpretation of Water Quality for Irrigation (a) Table 3-2. Guideline Assumptions Table 3-3. Woodland Tertiary Effluent Quality Table 4-1. Eastern Reuse Properties Table 4-2. Western Reuse Properties Table 5-1. East Group 1 Parcels Water Use Rates Table 5-2. Costs of Supplying Recycled Water to Eastern Parcels Table 5-3. Costs of Serving Recycled Water to Western Parcels Table 6-1. Comparison of Recycled Water Supply Project Alternatives iv Final Recycle Water Reuse Report_ docx
278 Section 1 Introduction The City of Woodland (City) currently owns and operates the Woodland Water Pollution Control Facility (WPCF). The WPCF provides tertiary treatment, including an oxidation ditch secondary process, cloth media tertiary filtration and ultraviolet (UV) disinfection. The WPCF operates under a NPDES permit (Order No. R , adopted February 5, 2009). The permit specifies that the WPCF has an average daily flow capacity of 10.4 million gallons per day (mgd). Current average dry weather flows are in the range of 5 to 6 mgd. A design is being prepared to upgrade the secondary treatment facilities at the WPCF to a Modified Ludzack Ettinger (MLE) process, which should provide improved process control and greater potential future capacity. Wastewater from the WPCF is currently conveyed through a pipeline and ditches for year round discharge to Tule Canal approximately 4 miles east of the treatment plant. Even though recycled water use is encouraged by the State, the City has not pursued possible wastewater reuse projects in the past because of potential associated costs and moderately elevated WPCF effluent salinity compared with other local sources of irrigation water. The City is a participant in the Woodland-Davis Clean Water Agency, which is planning to construct an intake on the Sacramento River, raw water pipelines connecting the intake to a new regional water treatment plant near the WPCF, and separate pipelines delivering treated water to Woodland, Davis and UC Davis. This project and other water system related improvements will substantially reduce the salinity of the WPCF effluent, making the effluent more attractive as a source of recycled water for irrigation and other uses. The planned Woodland southwest main water transmission pipeline will convey potable water from the new water treatment plant to the southwest portion of Woodland and then along the southern edge of the city. Installing a parallel recycled water pipeline at the same time as the new surface water pipeline could be an economical means to provide recycled water to users near the pipeline route. There are also potential agricultural users of recycled water to the east and northeast of the WPCF. The purpose of this study was to evaluate potential recycled water uses, regulatory issues, approximate costs, and benefits for areas near the WPCF and along the southwest water transmission pipeline route. 1-1 V:\44000\ Woodland Recycled Water Opportunities Eval\Report\Final Recycle Water Reuse Report_ docx
279 Section 2 Regulatory Framework for Recycled Water Usage This section provides an overview of general regulations, permitting, and constraints for water reuse. 2.1 Recycled Water Categories The California regulations for water reuse or water recycling criteria are prescribed in California Title 22 Code of Regulations (Title 22). The water recycling criteria are established by California Department of Public Health (CDPH) but the state agency regulating water recycling projects is the California Regional Water Quality Control Board (Regional Water Board). Title 22 provides definitions of recycled water quality according to treatment level and disinfection performance requirements. The categories of defined recycled water include: Disinfected secondary recycled water, Disinfected secondary - 23 recycled water, Disinfected tertiary recycled water. 2.2 Non-potable Reuse of Recycled Water Non-potable Reuse or NPR is a broad term that encompasses several beneficial uses of treated wastewater. The reused water may be generated from processes that subject wastewater to varying levels of treatment; consequently, the rules and regulations governing non-potable water reuse are also varied. At a minimum, secondary treatment of wastewater is required prior to any non-potable reuse. In order to provide adequate protection to the public, the level of treatment must be increased progressively for applications involving increasing levels of human exposure to the reused water, as illustrated on Figure V:\44000\ Woodland Recycled Water Opportunities Eval\Report\Final Recycle Water Reuse Report_ docx

280 Recycle Water Opportunities Evaluation Section 2 Figure 2-1. Common Uses of Recycled Water at Various Treatment Levels State Water Resources Control Board Recycled Water Policy In 2009, the State Water Resources Control Board (SWRCB) adopted a recycled water policy aimed at increasing recycled water usage, minimizing carbon footprint, and promoting sustainable management of surface and groundwater resources. The policy lists the following primary goals: Increasing recycled water usage over 2002 levels by one million AFY by 2020 and by at least two million AFY by 2030 Increasing stormwater usage by at least half a million AFY by 2020 and at least one million AFY by 2030 Increasing water conservation in industrial and urban uses by 20 percent by 2020 Substituting as much recycled water for potable water as possible by 2030 Although increased conservation and use of stormwater is planned, the thrust of the policy is to increase the use of recycled water from municipal sources in a manner that complies with California Title 22, and all other applicable state and federal water quality laws and regulations. The policy describes criteria intended to streamline and generate consistency in the permitting of recycled water projects. Topics addressed by the policy include the following: Salt and nutrient management plans for groundwater basins and watersheds Streamlined permitting for landscape irrigation projects that use recycled water Groundwater recharge projects using recycled water Antidegradation Contaminants of emerging concern Incentives for the use of recycled water 2-2 V:\44000\ Woodland Recycled Water Opportunities Eval\Report\Final Recycle Water Reuse Report_ docx
281 Recycle Water Opportunities Evaluation Section Title 22 Quality Standards for Non-potable Reuse Chapter 3 of the California Code of Regulations (CCR) Title 22, Division 4, outlines criteria for water recycling. This document is commonly abbreviated as Title 22 in the industry, and contains regulations that govern the sources, production, intended use, and quality of recycled water. Title 22 is currently oriented toward non-potable reuse. A brief summary of the key information contained in Title 22 is provided in Table A-1 in Appendix A. 2.3 Recycled Water Reuse Water Quality The various forms of recycled water and the quality criteria associated with that type of recycled water are summarized in Table 2-1. Table 2-1. Title 22 Water Quality Standards for Various Types of Non-potable Reuse Recycled Water Type Parameter Quality Criteria Disinfected Tertiary (secondary, coagulated, filtered and disinfected) Disinfected Secondary 2.2 (secondary and disinfected) Disinfected Secondary 23 (secondary and disinfected) Undisinfected Secondary (oxidized but not disinfected) BOD 5 TSS Total Coliform, MPN/100 ml Turbidity, NTU BOD 5 TSS Total Coliform, MPN/100 ml BOD 5 TSS Total Coliform, MPN/100 ml BOD 5 TSS <10 mg/l <10 mg/l <2.2 (median/7 days) >23 (once/ 30 days) <240 (at all times) <2 (24 hr average) >5 (<5% of time) <10 (at all times) <45 mg/l (7 day) <30 mg/l (30 day) <45 mg/l (7 day) <30 mg/l (30 day) <2.2 (median/7 days) >23 (once/ 30 days) <45 mg/l (7 day) <30 mg/l (30 day) <45 mg/l (7 day) <30 mg/l (30 day) <23 (median/7 days) <240 (once/ 30 days) <45 mg/l (7 day) <30 mg/l (30 day) <45 mg/l (7 day) <30 mg/l (30 day) 2.4 Allowable Non-potable Recycle Water Uses As defined in Title 22, the City of Woodland recycled water may be limited to specific applications based on its level of treatment. Table 2-2 provides a summary of the various applications allowed based on the minimum level of treatment provided. 2-3 V:\44000\ Woodland Recycled Water Opportunities Eval\Report\Final Recycle Water Reuse Report_ docx
282 Recycle Water Opportunities Evaluation Section 2 Table 2-2. Allowable Non-potable Uses of Recycled Water based on Title 22 Treatment Level Type of Recycled Water Use Urban Uses and Landscape Irrigation Acceptable Minimum Recycled Water Treatment Level Undisinfected Disinfected Tertiary Disinfected Secondary Secondary Fire Protection Trucked Recycled Water for Construction /Multiple Uses Toilet and Urinal Flushing Commercial Car Washes (Vehicle Wash Racks) Commercial Laundries Irrigation of Parks, Schoolyards, Residential Landscaping Irrigation of Cemeteries, Highway Landscaping Irrigation of Nurseries Landscape Impoundment * Agricultural Irrigation Pasture for Milk Producing Animals Fodder and Fiber Crops Orchards (no contact between fruit and recycled water) Vineyards (no contact between fruit and recycled water) Non-Food Bearing Trees Food Crops Eaten After Processing Food Crops Eaten Raw Structural Fire Fighting Environmental and Other Uses Recreational ponds with Body Contact (Swimming) Wildlife Habitat/Wetland Artificial Snow Making Soil Compaction, Concrete Mixing Trucked Recycled Water for Construction Dust Control Aquaculture * Groundwater Recharge Seawater Intrusion Barrier Replenishment of Potable Aquifers * Restrictions and/or additional treatment may apply. * * SOURCE: Water Recycling 2030, California s Recycled Water Task Force, June V:\44000\ Woodland Recycled Water Opportunities Eval\Report\Final Recycle Water Reuse Report_ docx
283 Section 3 Potential Recycled Water Flow and Quality The Woodland WPCF produces a disinfected tertiary effluent that is suitable from a regulatory perspective for unrestricted reuse. In this section, the current flows and water quality are presented and discussed. Suitability of recycled water from the WPCF for irrigation in terms of potential soil and crop effects is also discussed. 3.1 Recycled Water Flow The effluent flow rate is approximately 5 million gallons per day (mgd), which would correspond to 5,600 AF per year. The April through October irrigation season total would be 3,280 AF. If all the water were available for irrigation reuse, the flow would be sufficient for irrigation of approximately 500 to 700 acres of crops or landscape plants in a typical July. Considerably more area would be required to utilize all the effluent in cooler months. Water balance considerations are discussed for potential areas of use later in Section Recycled Water Quality There are two sets of considerations of water quality for water reuse. The first is confirmation that the tertiary disinfected standards are being met. This is confirmed by the effluent meeting discharge standards for total coliform of less than 2.2 MPN/100 ml and a turbidity of less than 2 NTU as specified in Title 22. The second set of considerations for water quality is the quality of the water for irrigation purposes. Irrigation water quality guidelines present values of recycled water salinity and specific ion concentrations for irrigation of various crops with a range of sensitivity to salinity and specific ions, such as boron. The criteria are presented in Table 3-1. The growth of plants and their ability to absorb moisture from the soil are influenced by salinity. Soil salinity is managed by adding an excess of water above that required for crop growth to leach the salts from the soil profile. A rule of thumb for total water required to prevent salt buildup in arid climates is to apply the crop needs plus about 15 percent. The structure of clay soils can be also damaged when there is an excess of sodium with respect to calcium and magnesium in the wastewater as measured by the sodium adsorption ratio (SAR). The WPCF effluent quality is compared to the irrigation guidelines in Table 3-3. The current effluent is moderately elevated in salinity and boron. The effluent quality after implementation of the surface water supply project is projected to be much improved and potentially have only a slight effect on the most sensitive crops due to salinity. 3-1 V:\44000\ Woodland Recycled Water Opportunities Eval\Report\Final Recycle Water Reuse Report_ docx
284 Recycle Water Opportunities Evaluation Section 3 Potential Irrigation Problems Salinity (affects crop water availability) Table 3-1. Guidelines for Interpretation of Water Quality for Irrigation (a) Units Degree of Restriction on Use None Slight to Moderate Severe EC w b ds/m or mmho/cm < >3.0 TDS mg/l < >2000 Permeability (affects infiltration rate of water into the soil. Evaluate using EC w and SAR together) c, d SAR = 0-3 and ECw = > <0.2 SAR = 3-6 and ECw = > <0.3 SAR = 6-12 and EC w = > <0.5 SAR = and EC w = > <1.3 SAR = and EC w = > <2.9 Specific ion toxicity (affects sensitive crops) Sodium (Na) e, f surface irrigation SAR <3 3 9 >9 sprinkler irrigation mg/l <70 >70 Chloride (Cl) e, f surface irrigation mg/l < >350 sprinkler irrigation mg/l <100 >100 Boron (B) mg/l < >3.0 Miscellaneous effects (affects susceptible crops) Nitrogen (Total-N) g mg/l < >30 Bicarbonate (HCO3) (overhead sprinkling only) mg/l < >500 ph Normal range Residual chlorine (overhead sprinkling only) mg/l < >5.0 a) Adapted from University of California Committee of Consultants and Ayers and Westcot. The basic assumptions of the guidelines are discussed on Table 3-2. b) EC w means electrical conductivity of the irrigation water, reported in mmho/cm or ds/m. TDS means total dissolved solids, reported in mg/l. c) SAR means sodium adsorption ratio. SAR is sometimes reported as RNa. At a given SAR, infiltration rate increases as salinity (EC w) increases. Evaluate the potential permeability problem by SAR and EC w in combination. d) For wastewaters, it is recommended that the SAR be adjusted to include a more correct estimate of calcium in the soil water following an irrigation. e) Most tree crops and woody ornamentals are sensitive to sodium and chloride; use the values shown. Most annual crops are not sensitive. f) With overhead sprinkler irrigation and low humidity (<30%), sodium or chloride greater than 70 or 100 mg/l, respectively, have resulted in excessive leaf absorption and crop damage to sensitive crops. g) Total nitrogen should include nitrate-nitrogen, ammonia-nitrogen, and organic-nitrogen. Although forms of nitrogen in wastewater vary, the plant responds to the total nitrogen. 3-2 V:\44000\ Woodland Recycled Water Opportunities Eval\Report\Final Recycle Water Reuse Report_ docx
285 Recycle Water Opportunities Evaluation Section 3 Table 3-2. Guideline Assumptions Assumptions in the Guidelines The water quality guidelines in Table 3-1 are intended to cover the wide range of conditions encountered in California's irrigated agriculture. Several basic assumptions have been used to define the range of usability for these guidelines. If the water is used under greatly different conditions, the guidelines may need to be adjusted. Wide deviations from the assumptions might result in wrong judgments on the usability of a particular water supply, especially if it is a borderline case. Where sufficient experience, field trials, research, or observations are available, the guidelines may be modified to more closely fit local conditions. The basic assumptions in the guidelines are given below. Yield Potential Full production capability of all crops, without the use of special practices, is assumed when the guidelines indicate no restrictions on use. A "restriction on use" indicates that there may be a limitation such as choice of crop or the need for special management in order to maintain full production capability, but a "restriction on use" does not indicate that the water is unsuitable for use. Site Conditions Soil texture ranges from sandy-loam to clay with good internal drainage. Rainfall is low and does not play a significant role in meeting crop water demand or leaching. In the Sierra and extreme North Coast areas of California where precipitation is high for part or all of the year, the guideline restrictions are too severe. Drainage is assumed to be good, with no uncontrolled shallow water table present. Methods and Timing of Irrigations Normal surface and sprinkler irrigation methods are used. Water is applied infrequently as needed, and the crop utilizes a considerable portion of the available stored soil water (50% or more) before the next irrigation. At least 15% of the applied water percolates below the root zone (leaching fraction [LF] > 15%). The guidelines are too restrictive for specialized irrigation methods, such as drip irrigation, which result in near daily or frequent irrigations. The guidelines are not applicable for subsurface irrigation. Water Uptake by Crops Different crops have different water uptake patterns, but all take water from wherever it is most readily available within the root zone. Each irrigation leaches the upper root zone and maintains it at a relatively low salinity. Salinity increases with depth and is greatest in the lower part of the root zone. The average salinity of the soil solution is about three times that of the applied water. Salts leached from the upper root zone accumulate to some extent in the lower part but eventually are moved below the root zone by sufficient leaching. The crop responds to average salinity of the root zone. The higher salinity in the lower root zone becomes less important if adequate moisture is maintained in the upper, "more active" part of the root zone. Constituent Unit EC (a) mmho/cm 1.6 Table 3-3. Woodland Tertiary Effluent Quality Current Estimated Future Value Degree of Restriction Value Degree of Restriction None for forage crops, slight to moderate for tree crops 0.82 None to Slight Sodium mg/l 190 Slight to Moderate 110 Slight to Moderate Calcium mg/l Magnesium mg/l SAR (b) unitless 2.95 None 2.5 None Boron mg/l 2.35 (a) EC = Electrical Conductivity = measure of salinity (b) SAR = Sodium Adsorption Ratio Slight to Moderate, depending upon crops 0.68 None 3-3 V:\44000\ Woodland Recycled Water Opportunities Eval\Report\Final Recycle Water Reuse Report_ docx
286 Section 4 Potential Sites for Reuse The general types of water reuse opportunities were presented in Section 2 and include a variety of urban landscape and agricultural reuse opportunities. Primary options for water reuse in the study area include urban landscape irrigation, agricultural irrigation, and power plant cooling uses. City urban landscape reuse opportunities include park lands and sporting venues. Geographically located within the California Central Valley, the City is also near a variety of agricultural fields, which are located near the WPCF and the outlying rural City landscape. For the purposes of this report, the potential sites for reuse are divided between eastern and western properties centralized around the WPCF location. The potential properties are comprised of approximately 5,056 acres located east of the treatment plant and approximately 876 gross acres located west of the treatment plant, for a total of approximately 5,900 acres. The boundaries of potential reuse parcels are outlined in Figure Eastern Reuse Properties Properties located to the east of the water treatment plant are comprised of twenty properties in sizes ranging from 7 to 626 acre parcels, totaling approximately 5,056 acres. All the eastern properties are potential agricultural reuse properties. The list of potential agricultural reuse properties located east of the treatment plant is presented in Table 4-1. An aerial map showing the locations of the potential reuse properties is provided in Figure V:\44000\ Woodland Recycled Water Opportunities Eval\Report\Final Recycle Water Reuse Report_ docx
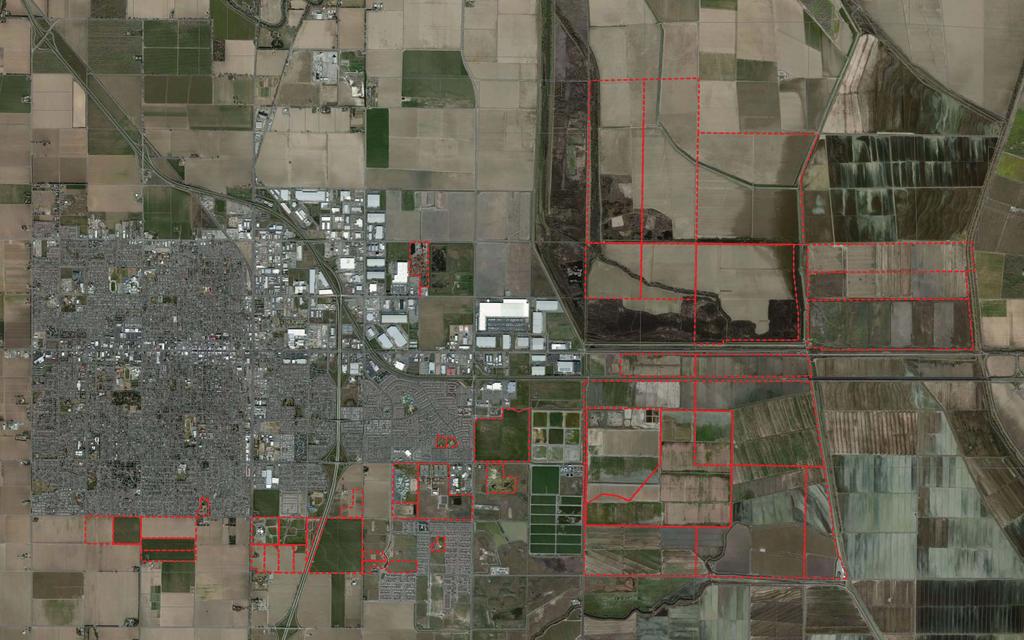
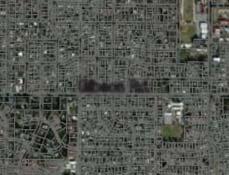
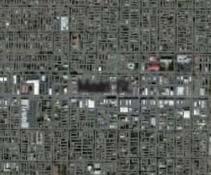
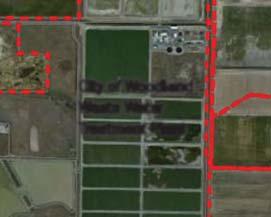
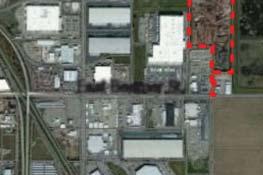
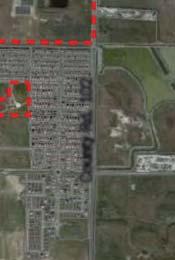
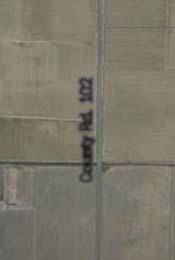
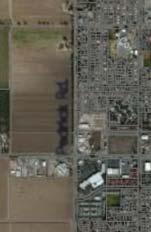
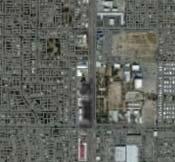

287 V:\44000\ Woodland Recycled Water Opportunities Eval\Figures O 3,000 Feet 5 Knights Landing Bridge Cut Pedrick Rd. West St. County Rd. 99 West St. Gibson Rd. Main St. East St. East St. County Rd. 24A 113 East Kentucky St. East Beamer St. East Main St. East Gibson Rd. County Rd. 102 County Rd City of Woodland Waste Water Treatment Plant County Rd. 22 LEGEND County Rd. 20 Parcels of Interest for recycled Water Opportunities Figure 4-1 Recycled Water Opportunities Evaluation Site Map City of Woodland Yolo County, California
288 (THIS PAGE LEFT BLANK INTENTIONALLY)


289 V:\44000\ Woodland Recycled Water Opportunities Eval\Figures LEGEND O 2,400 Feet Recycled Water Pipelines Knights Landing Bridge Cut Parcels of Interest for Recycled Water Opportunities 1 1 Recycled Water Use Group East Kentucky St. County Rd East Beamer St County Rd. 117 County Rd. 102 RD 2035 High Line Canal 1 East Main St. 2 2 County Rd City of Woodland Waste Water Treatment Plant Figure 4-2 Recycled Water Opportunities Evaluation Parcels and Groups East of the City of Woodland Waste Water Treatment Plant County Rd. 25 City of Woodland Yolo County, California
290 (THIS PAGE LEFT BLANK INTENTIONALLY)
291 Recycle Water Opportunities Evaluation Section 4 Item APN Owner Description Table 4-1. Eastern Reuse Properties Approx. Area (ac) Zoning Zoning Comments City of Woodland / Pacific Coast Producers 106 Agricultural Within City Boundaries City of Woodland / Pacific Coast Producers 320 Agricultural Within City Boundaries City of Woodland / Pacific Coast Producers 464 Agricultural Within City Boundaries Conaway Preserve 87 Agricultural Within City Boundaries Conaway Preserve 169 Agricultural Within City Boundaries Conaway Preserve 298 Agricultural Outside City Boundary Conaway Preserve 164 Agricultural Outside City Boundary Conaway Preserve 524 Agricultural Outside City Boundary Conaway Preserve 130 Agricultural Outside City Boundary Conaway Preserve 434 Agricultural Outside City Boundary Conaway Preserve 512 Agricultural Outside City Boundary Conaway Preserve 160 Agricultural Outside City Boundary Conaway Preserve 159 Agricultural Outside City Boundary Neal Dow Family LP 626 Agricultural Outside City Boundary City of Woodland 427 Agricultural Outside City Boundary Koerwitz 245 Agricultural Outside City Boundary Koerwitz 232 Agricultural Outside City Boundary Total Area (ac) 5,057 The eastern agricultural properties are interconnected by a series of existing open water irrigation and drainage canals. The supply canal closest to the WPCF is locally known as the Reclamation District 2035 (RD 2035) Road 103 High Line Canal system. The canal system has the capacity to convey the 5 mgd reuse water generated at the WPCF throughout the western and northern portion of the agricultural area directly to many parcels and through drainage canals or channels to other parcels. The only major infrastructure required to utilize the RD 2035 High Line Canal system is a 600 foot long pipeline. A couple of the eastern parcels in the Yolo Bypass could also be served from the City s existing effluent pipeline to the Yolo Bypass. The largest potential user of recycled water to the east would be the Conaway Preserve, a major area farm and wildlife preserve. Based on communication with Conaway Preserve representatives in May and June 2013, the 2,644 acres on the Preserve identified as potentially able to receive recycled could accept a limited amount of reuse water during the summer irrigation season and could likely accept all the reuse water during a portion of the winter season. The Conaway Preserve primarily grows rice, much of which is used for export to international destinations. During the irrigation season, rice needs to be irrigated with non-recycled water due to marketability issues according to the California Rice Commission (2013). Outside the irrigation season, the recycled water could likely be used for flooding to promote the decomposition of rice stubble remaining in the fields following harvest. 4-4 V:\44000\ Woodland Recycled Water Opportunities Eval\Report\Final Recycle Water Reuse Report_ docx
292 Recycle Water Opportunities Evaluation Section 4 Parcels Irrigable with Recycled Water during the Main Irrigation Season The Conaway parcels that could utilize recycled water during the irrigation season are parcels in the Cache Creek Settling Basin that are not suitable for growing rice. These parcels were identified in Figures 4-1 and 4-2. Other parcels north of those owned by Conaway in the Cache Creek Settling Basin could also possibly be irrigated with recycled water. Three parcels in the Yolo Bypass could be irrigated with recycled water during the irrigation season. Those would include the City-owned parcel just north of the railroad tracks and the next adjacent parcels further north. The City also leases 890 gross acres on a long term basis to PCP immediately east of the WPCF property. PCP processes tomatoes from July through early October and utilizes most of the land for irrigation of grass crops using wastewater from its cannery. PCP could utilize recycled water from the WPCF for irrigation of its site during late spring and early summer before the processing season. A proposal has also come forth recently for residential and commercial development of some of the land east of the WPCF owned by the City and Conaway. New development could include anything from a purple pipe distribution system for recycled water for only parks to a complete dual distribution system for residential parcels. Addressing this conceptual project was beyond the scope of this study, but possible ramifications are mentioned herein. 4.2 Western Reuse Properties Properties located to the west of the WPCF are comprised of thirty properties in sizes ranging from 4.7 to 134 acre parcels, totaling approximately 939 acres. The western properties include both agricultural and urban landscape reuse opportunities. The list of potential reuse properties located west of the treatment plant is presented in Table 4-2. An aerial map showing the locations of the recommended reuse properties is provided in Figure 4-3. Table 4-2. Western Reuse Properties Approx. Area Item APN Owner Description (ac) Zoning Zoning Comments Woodland Development Co Agricultural Within City Boundaries Woodland Biomass 37.2 Industrial Within City Boundaries Barton Trust 35.9 Agricultural Within City Boundaries City of Woodland 5.4 City Park Within City Boundaries City of Woodland 4.7 City Park Within City Boundaries Woodland Community College Public School Within City Boundaries City of Woodland 7.9 City Park Within City Boundaries Woodland Springlake Partners 9.5 Agricultural Within City Boundaries Optomistic Partners LLC 19.6 Agricultural Within City Boundaries Beeman Michael Agricultural Outside City Boundary City of Woodland 40.0 City Services Within City Boundaries City of Woodland 37.9 City Services Within City Boundaries Singh Balwant 17.4 Agricultural Outside City Boundary Gunnerson Betty B 19.6 Agricultural Outside City Boundary Beeman Fam Trust 22.7 Agricultural Outside City Boundary 4-5 V:\44000\ Woodland Recycled Water Opportunities Eval\Report\Final Recycle Water Reuse Report_ docx
293 Recycle Water Opportunities Evaluation Section 4 Item APN Owner Description Table 4-2. Western Reuse Properties Approx. Area (ac) Zoning Zoning Comments Benson Rev Trust 17.6 Agricultural Outside City Boundary City of Woodland 8.3 City Park Within City Boundaries Beeman Timothy L 61.5 Agricultural Outside City Boundary Franke Harold R Estate 34.9 Agricultural Outside City Boundary Franke Harold R Estate 31.0 Agricultural Outside City Boundary Jenness Benning F 39.4 Agricultural Outside City Boundary Hilleby Martha I 40.4 Agricultural Outside City Boundary Total Area (ac) 876 The western reuse properties are spread across the southern boundary of the City with no existing system for recycled water conveyance. The use of the western properties will require the construction of a pipeline of up to approximately 4.5 miles in length for water conveyance to reach all the properties. In order to meet the potential demand of all the western properties, the pipeline would need to be sized to carry flow rates ranging between 20 gpm and 4,400 gpm and with pipe diameters ranging in size from 2-inches to 18-inches. Since this would exceed the current output of the WPCF, only a portion of the parcels could reliably be served with recycled water. Adjustments in pipeline distance and diameter would vary based on the properties selected for reuse. Figure 4-3 shows the anticipated pipeline alignment along the existing treated water pipeline alignment. The draft General Plan land use map for the City is shown in Figure 4-4. The likely intermediate and long term uses of the parcels can be taken from the land use designations shown. The land use designations were utilized to divide the western reuse parcels into four groups based on likely priority of service for providing recycled water. Grouping of parcels and detailed evaluations of the required pipeline sizes, costs, and issues involved with serving the groups of parcels are discussed in Section V:\44000\ Woodland Recycled Water Opportunities Eval\Report\Final Recycle Water Reuse Report_ docx
294 (THIS PAGE LEFT BLANK INTENTIONALLY)


295 V:\44000\ Woodland Recycled Water Opportunities Eval\Figures O 1,700 Feet LEGEND Recycled Water Pipelines East Beamer St. East St. County Rd. 102 Parcels of Interest for Recycled Water Opportunities East Main St. East St. West St. East Main St. 5 East St. West St. 113 Gibson Rd. East Gibson Rd. City of Woodland Waste Water Treatment Plant County Rd. 102 County Rd. 99 East St. County Rd. 24A Figure 4-3 Recycled Water Opportunities Evaluation West of the City of Woodland Waste Water Treatment Plant City of Woodland Yolo County, California
296 (THIS PAGE LEFT BLANK INTENTIONALLY)

297 V:\44000\ Woodland Recycled Water Opportunities Eval\Figures Figure 4-5 Recycled Water Opportunities Evaluation Draft General Plan Land Use City of Woodland Yolo County, California Source: City of Woodland
298 (THIS PAGE LEFT BLANK INTENTIONALLY)
299 Section 5 Evaluation of Alternatives for Water Reuse 5.1 Screening and Grouping of Alternatives Eastern Properties The eastern fields were grouped into fields unlikely to be planted with rice (East Group 1) and fields that were likely to have rice planted at some point in their crop rotation (East Group 2) East Group 1 Parcels Non-rice The non-rice parcels were identified in Figure 4-2. Planting for the parcels in the Cache Creek Settling Basin and the Yolo Bypass can sometimes be delayed until late May or early June in a wet year. The Conaway parcels are typically planted to tomatoes, corn, safflower, and other field crops. The other parcels in the Cache Creek Settling Basin are also planted to various field crops. The City s 427 acre parcel in the Yolo Bypass is currently on a 3 year lease out to a farmer for organic field crop production. The parcel north of the City s parcel in the Yolo Bypass has been planted to rice in the past, but could be limited to other crops under a suitable agreement with the City. Irrigation tailwater runoff from the fields in the Cache Creek Settling Basin enters the low water Cache Creek Channel. When this occurs, this would likely be considered a discharge to waters of the state, and all commensurate surface water discharge requirements would apply. The requirements, which would likely be identical to requirements in the City s most recent permit, can probably be applied back at the WPCF discharge. Alternatively, it may be possible to retain tailwater at the low ends of the fields. The City-owned parcels farmed by PCP comprise a total of 890 acres, of which PCP farms about 650 acres in any given year. The remainder of the land is used for land application of semi-solid organic wastes or is unusable because of the presence of berms, fill, or other conditions. The potential annual and peak month water use rates of Group 1 parcels is shown in Table 5-1. Area Table 5-1. East Group 1 Parcels Water Use Rates Annual Water Use, Estimated Irrigation Area ac-ft Peak Season Demand, mgd Cache Creek Settling Basin 1,311 4, Yolo Bypass 813 2, Pacific Coast Producers TOTAL 2,774 7, V:\44000\ Woodland Recycled Water Opportunities Eval\Report\Final Recycle Water Reuse Report_ docx
300 Recycle Water Opportunities Evaluation Section 5 The potential water use from all the parcels far exceeds the current 5 mgd of effluent available from the WPCF. The area that could be irrigated with only the 5 mgd of available recycled water would be approximately 500 acres. Therefore the preferred parcels would be those that could be supplied with water most easily and have the best tailwater control possibilities. These would likely be the western Conaway parcels in the Cache Creek Settling Basin, the City s parcel in the Yolo Bypass, and the PCP parcels. The western Conaway parcels in the Cache Creek Settling Basin and the PCP parcels could both be served by a pipeline from the WPCF discharge to and just past the RD 2035 High Line Canal. An 18 inch diameter would handle up to approximately 7 mgd. Existing conveyance facilities could be used to move the water from the end of the pipeline to the fields. The City s parcel in the Yolo Bypass can be supplied with water directly from the existing outfall pipeline. Some minor water control facilities would be needed to distribute the recycled water on the City s parcel. Possible future infrastructure for the recently proposed development east of the WPCF would require a pump station, storage tank, mainline, and purple pipe distribution system constructed prior to or concurrently with the development construction East Group 2 Parcels Rice Stubble It was assumed that these parcels would only accept water during two months in the late fall for rice stubble decomposition. It was also assumed that these parcels could be supplied with water from the RD 2035 High Line Canal. The potential water demand of the Group 2 parcels was assumed to be 0.5 feet per month, or 810 acre-feet/month (8.5 mgd) for the 1,620 net irrigated acres identified. The 8.5 mgd potential demand is much greater than the available flow from the WPCF, therefore only a portion of the identified parcels could be served. Most likely, rice decomposition water would be blended with diverted Sacramento River water within the overall Conaway water distribution system rather than be dedicated to specific isolated parcels anyway. The facilities required to serve water to Group 2 and other parcels for rice decomposition water would be the same 18 inch pipeline and related facilities to convey the WPCF effluent to the RD 2035 High Line Canal. If the pipeline is constructed to serve Group 1 parcels, there would be no additional cost to serve Group 2 parcels in the late fall months Costs of Supplying Recycled Water to Eastern Parcels Estimated total costs and costs per acre-foot for supplying recycled water to the eastern parcels are shown in Table 5-2. The capital costs for reaching the Group 1 fields include $82,000 for a pipeline, $40,000 for valves and a tie-in and $100,000 for permitting, administrative, and miscellaneous costs. A recycled water storage tank was assumed to not be needed because of flexibility in the operation of the RD 2035 High Line Canal. Although a survey would still need to be performed, there appears to be enough head drop between the UV disinfection channel at the WPCF and the RD 2035 High Line Canal to allow gravity flow to the canal. If some of the preferred parcels become unavailable in the future, the costs for extending service to other nearby Group 1 parcels would be relatively small. The incremental costs for serving Group 2 fields would only be administrative and permitting costs. User Group Description Table 5-2. Costs of Supplying Recycled Water to Eastern Parcels Potential Demand, mgd Capped Annual Demand, ac-ft/yr Incremental Capital Cost Incremental Cost/af Group 1 Field crops (non-rice) ,469 $222,000 $17.20 Group 2 Rice decomposition water 8.5 1,332 $30,000 $ V:\44000\ Woodland Recycled Water Opportunities Eval\Report\Final Recycle Water Reuse Report_ docx
301 Recycle Water Opportunities Evaluation Section Issues and Comparison with Other Water Supply Sources As mentioned previously, the California Rice Commission discouraged the use of recycled water for rice crop irrigation because of international marketing considerations. The use of recycled water for irrigating organic field crops could also have marketing related issues. Other than crop marketing issues, the main issues with regards to supplying recycled water to eastern parcels would be the time and effort involved in setting up agreements with farmers, obtaining a water reclamation permit, and performing required monitoring. However, it would be technically possible to begin providing recycled water for crop irrigation on eastern parcels even before the surface water supply project is complete. Based on recent capital and operational cost estimates for irrigation wells as part of another recent study for Glenn County, the cost of groundwater from new wells is roughly $65 per acre-foot for a 1,500 gpm well, and somewhat less for a larger well. The pumping costs for Sacramento River water for Conaway Ranch are roughly only about $25 per acre-foot not including maintenance costs for the water distribution system. However, the value of Sacramento River water in the summer is up to $400 per acre-foot as evidenced by the water sale from Conaway Ranch to the Woodland-Davis Clean Water Agency and other recent water sales. Based on cost comparisons, supplying recycled water to the Group 1 eastern parcels during the irrigation season would be economically viable. Additional economic considerations are discussed later in Section 6, Recommended Alternatives. Even though the cost of alternative water supplies is very low for fall rice stubble decomposition water (about $25 per acre-foot marginal cost), supplying water to Group 2 parcels for rice stubble decomposition would still be economically viable. One other consideration for the use of recycled water for rice stubble decomposition in the late fall months is that residual nutrients in the recycled water would probably help speed the decomposition process. Although cost estimates were not prepared for serving recycled water to new possible development east of the WPCF, the costs for serving large landscaped areas would likely be similar to or slightly less than the costs for serving similar western parcels, which are discussed later in this report. 5.2 Screening and Grouping of Alternatives Western Properties The western parcels were grouped by general priority of supply based on the costs of likely alternative supply. Group 1 included urban park, sporting, and landscape uses, where the alternative water supply would either be potable water or small wells. Pioneer High School was not included because it recently completed construction of a dedicated irrigation well. Group 2 was comprised of agricultural parcels that could potentially have a long term demand for recycled water. Group 3 was comprised of only the Woodland Biomass power generation plant. Group 4 was comprised of agricultural parcels that had been identified in the General Plan Update as potential future development areas. All the western parcels and their corresponding group numbers are shown in Figure 5-1. The Draft Woodland General Plan Update land use map for the area of interest was shown in Figure 4-4. The pipeline to serve all Group 1 parcels would follow the path of the planned southern surface water distribution pipeline, extending west past Highway 113 and East Street all the way to Crawford Park. A short branch would serve the Gateway II Development, Mountain Air Golf Course, and Slaven Park. The pipeline would extend further west to County Road 99 to serve all the Group 2 parcels. For service to Woodland Biomass (Group 3), a separate pipeline would follow the path of the planned northern surface water distribution pipeline under Interstate 5 to Main Street. The Group 3 pipeline would likely then follow County Road 102 and Beamer Street or other suitable alignment through the industrial area towards Woodland Biomass, the assumed base case industrial user. The Group 4 pipeline path would essentially be the same as the Group 2 pipeline, but the pipeline would have greater capacity to be capable of supplying the Group 4 parcels along the way. 5-3 V:\44000\ Woodland Recycled Water Opportunities Eval\Report\Final Recycle Water Reuse Report_ docx
302 (THIS PAGE LEFT BLANK INTENTIONALLY)


303 V:\44000\ Woodland Recycled Water Opportunities Eval\Figures 3 O 1,700 Feet LEGEND Recycled Water Pipelines East Beamer St. Recycled Water Use Group East St. 1 County Rd. 102 Parcels of Interest for Recycled Water Opportunities East Main St. East St. West St. East Main St East St. West St. 1 Gibson Rd. East Gibson Rd City of Woodland Waste Water Treatment Plant 1 County Rd. 24A County Rd County Rd Figure 5-1 Recycled Water Opportunities Evaluation West Parcels and Groups City of Woodland Yolo County, California
304 (THIS PAGE LEFT BLANK INTENTIONALLY)
305 Recycle Water Opportunities Evaluation Section Costs of Supplying Recycled Water to Western Parcels The estimated capital and total costs for providing service to the 4 western parcel groups are shown in Table 5-3. Cost estimating details are provided in Appendix C. The capital costs for reaching the Group 1 fields include approximately $1.4M for a pipeline and appurtenances, $0.2M for a pump station and $0.5M for permitting, administrative, and miscellaneous costs. A recycled water storage tank was not included, but could be necessary depending upon demand scheduling. Adding Group 2 users, the pipeline diameters are larger and the length is assumed to be extended to reach users at County Road 99 (West Street). The industrial user assumed for Group 3 is the Woodland Biomass power generation facility. Should the use of recycled water become attractive to Woodland Biomass, there may be other industrial users that would be interested in recycled water supplied from the same pipeline. The historical annual average use rate for Woodland Biomass has been slightly under 300 gpm. For evaluation purposes, a pipeline capacity of 500 gpm was assumed. The recycled water supply flow rate could be adjusted to approximately match demand through the use of telemetry and variable frequency drive motors on the supply pumps. It was assumed that Woodland Biomass could provide any additional equalization storage needed for their own use. The addition of Group 4 users resulted in larger diameter pipeline segments and a larger pump station. While Group 4 costs are shown for comparative purposes, it is important to consider that there would not be sufficient recycled water to serve all potential Group 1 through 4 customers. Table 5-3. Costs of Serving Recycled Water to Western Parcels User Group Cumulative Demand ac-ft/yr Cumulative Capital Cost Million $ Annualized Capital Cost $/af Unit Total Cost, $/af Incremental Cost, $/af 1 City parks and high value users 881 $2.1M $193 $270 $270 2 Possible long term ag 1,521 $4.1M $215 $297 $335 3 Industrial user 2,005 $5.2M $210 $290 $268 4 Possible intermediate-term ag 2,695 $7.3M $218 $301 $332 Note: Costs shown are preliminary planning level costs based on generalized unit costing assumptions. Effects of site specific conditions are not included. The results shown in Table 5-3 are interesting in that there do not appear to be strong economies of scale to providing recycled water to additional users along the proposed main pipeline alignment for Groups 1, 2, and 4. The estimated incremental costs of supplying recycled water are in the general range of $250 to $350 per ac-ft Issues and Comparison with Alternative Water Sources The issues and cost comparisons for the western parcels are somewhat different than for the eastern parcels Parks and Other Urban Users The alternative water sources available to the urban users would be potable water from the City water system and dedicated small wells. The cost of potable water for large commercial users is scheduled to rise from the current $2.77 per hundred cubic feet ($1,200 per ac-ft) to $5 per hundred cubic feet ($1,900 per ac-ft) by Brown and Caldwell released a draft analysis of water management and alternative water 5-5 V:\44000\ Woodland Recycled Water Opportunities Eval\Report\Final Recycle Water Reuse Report_ docx
306 Recycle Water Opportunities Evaluation Section 5 sources for parks in the City of Davis (Brown and Caldwell, 2013). The replacement capital cost of wells ranged from approximately $3,000 to $30,000 per ac-ft of annual demand depending upon the size of the parks and whether an existing municipal well could be converted to an irrigation well or whether a new well was needed. Although total costs per ac-ft were not presented in the Davis study, the capital cost range of $3,000 to $30,000 per ac-ft of annual demand can be compared with approximately $2,300 ($2,030,210 / 881 from Table 5-3) per ac-ft of annual demand for providing recycled water to parks in western parcels Group 1. While the economics could change somewhat with lower cost wells or with higher unit costs for the recycled water system, this comparison does show that recycled water is likely to be cost competitive with dedicated wells for irrigating Group 1 parks and greenbelts Agricultural Irrigation Users (West Groups 2 and 4) The western parcels that are currently in irrigated agriculture usage depend on groundwater wells for irrigation water. The fully amortized cost of groundwater wells is approximately $65 per ac-ft. Therefore the irrigated agriculture parcels (both long term and intermediate term) would not likely be interested in receiving recycled water unless they wanted water with lower boron content and/or some kind of subsidy was available. The most likely candidates would be those interested in planting walnuts or some other high cash value crop with a sensitivity to boron Woodland Biomass Industrial User The Woodland Biomass powerplant uses cooling water as part of its power generation operation. At year 2016 rates, the cost of potable water would be $1,900 per ac-ft versus approximately $270 per ac-ft for recycled water. Therefore recycled water would be far less costly than potable water from the City. Woodland Biomass could also construct a deep well. Based on estimates for a well for Woodland Biomass performed several years ago, the capital cost would likely be in the range of $650,000 to $900,000. In a draft 2009 report to the City of Woodland (Brown and Caldwell, 2009), the overall cost of water from a larger well that would supply water to both the City and Woodland Biomass was estimated at $0.46/hcf ($200/acft), not including manganese treatment and assuming PG&E power costs. Economies of scale for well construction would imply that the cost of water from a smaller dedicated well for Woodland Biomass alone would be on the order of roughly 50% greater than the $200/ac-ft cost in the 2009 study, making the recycled water cost competitive with water from a new deep well. There would also be a small risk of not finding adequate quality and quantity of water for a new deep well at the Woodland Biomass site. 5-6 V:\44000\ Woodland Recycled Water Opportunities Eval\Report\Final Recycle Water Reuse Report_ docx
307 Section 6 Recommended Alternatives 6.1 Comparison of Alternatives The recycled water supply project alternatives are listed in Table 6-1 along with cost and subjective advantages and disadvantages. Alternative Cost, $/af Table 6-1. Comparison of Recycled Water Supply Project Alternatives Cost of Other Water Sources for Area E1 $17 $65 E2 $11 $25 Late fall use W1 $259 $1,900 or $300 Advantages Economical; physically easy to implement Economical; lower boron, softer water; possible financing incentives Disadvantages Additional permitting and agreements required; only summer irrigation season usage. Additional permitting and agreements required Public perception; permitting W2 $333 $65 Low boron, softer water Relatively expensive for agriculture W3 $268 $1,900 or $300 Cost competitive; lower risk; year round use Street disruption during construction W4 $296 $65 Low boron, softer water Relatively expensive for agriculture E1 Eastern Parcels Group 1, E2 Eastern Parcels Group 2 W1 Western Parcels Group 1, W2 Western Parcels Group 2, W3 Western Parcels Group 3, W4 Western Parcels Group 4 Supplying water to the eastern parcels is clearly very economical because the location of the effluent discharge is so close to the RD 2035 Road 103 High Line Canal and other points of distribution and use. The City could charge users a price nearly equal to the cost of alternative water and use that revenue to offset WPCF operational costs. Structuring agreements with users on eastern parcels should also be performed such that the City is not required to supply water in all years and could possibly sell its recycled water on the open market during drought years at a much higher price. A specific benefit to Conaway Ranch from utilizing recycled water would be to reduce groundwater pumping associated with its original sale of surface water to the Woodland-Davis Clean Water Agency. This would make it easier for Conaway to receive a no-impact or low-impact finding from the State Water Board on its groundwater pumping to offset its surface water sale. The main challenges with supplying recycled water to the eastern parcels would be developing agreements with end users and obtaining permits for the recycled water use. These are not seen as difficult challenges at this time. Monitoring and tailwater control will need to be integral with any implementation. The other disadvantage of a program supplying recycled water to eastern parcels is that the supply window would be only a few months out of the year. Supplying water for rice decomposition in the late fall would increase the number of months of supply, even though the economics are not as favorable as during the irrigation season. 6-1 V:\44000\ Woodland Recycled Water Opportunities Eval\Report\Final Recycle Water Reuse Report_ docx
308 Recycle Water Opportunities Evaluation Section 6 The cost of supplying recycled water to the western parcels is over an order of magnitude greater than the costs of supplying eastern parcels. However, the cost is in the same range as the best alternatives for the park and industrial water users. The cost would be too high for most agricultural irrigation users, but the cost could possibly be acceptable for agricultural irrigation use on high cash value crops that are especially sensitive to boron. Along with higher costs of supply for the western parcels, the other main disadvantage for recycled water use on western park parcels would be possible adverse public perception for irrigation of parks with reclaimed water. 6.2 Recommended Alternatives Since most of the alternatives are economically viable and there is a limited amount of potential recycled water compared to the potential demands, agreements and institutional or administrative factors may prove to be deciding for any particular alternative. Therefore, the alternatives should be pursued in order of priority based on the potential net revenue benefits and the percent of the year when the demand would occur. The recommended order of priority is: 1. East Parcels Group 1 2. East Parcels Group 2 3. West Parcels Group 3 4. West Parcels Group 1 5. West Parcels Group 4 6. West Parcels Group 2 Even though the eastern parcels appear to have a higher priority based purely on costs, there may be political and financing benefits to serving some of the higher priority western parcels in addition to some of the eastern parcels. 6.3 Other Benefits of a Recycled Water Program A recycled water program would be consistent with the State s goal of increasing recycled water use to 1 million ac-ft per year. There may be funding or financial incentives offered to help the State achieve this goal, which would further reduce the cost of a recycled water program. Other potential benefits of a recycled water program include: 1. Reduced surface discharge and loading to surface waters 2. Possible low interest rate and grant funding 3. Setting the City up to be able to sell effluent as supply water on the open market in drought years 4. Putting water to local beneficial use 5. Providing in-lieu recharge of local aquifers 6-2 V:\44000\ Woodland Recycled Water Opportunities Eval\Report\Final Recycle Water Reuse Report_ docx
309 Recycle Water Opportunities Evaluation Section Establishing Precedence to Enable Possible Future Marketing of Tertiary Effluent Given the proper positioning and circumstances, the City could potentially sell a portion of its water to entities outside of Yolo County during drought years. This could apply to either the fresh water supply and/or treated wastewater, depending upon conditions and precedents. Tertiary treatment in particular can provide water for unrestricted irrigation reuse and water sales. Water code section 1485 allows those who discharge treated wastewater to the San Joaquin River to file an appropriative water right application. Assembly Bill (AB) 134 was passed by the Legislature and signed by the Governor in September It enables Sacramento Regional County Sanitation District (SRCSD) to file an application to obtain a water right permit for an equivalent amount of high-quality recycled water that SRCSD treats and discharges to the Sacramento River, subject to the protection of the rights of any legal user of the water. Therefore there is legal precedence for establishing rights to tertiary effluent and allowing it to be sold on the open market. In addition, there are no explicit conditions or requirements mandating treated wastewater return flow listed in the City s area-of-origin water right decision (SWRCB, 2011). A detailed discussion of water rights and marketing is contained in Appendix D. While Appendix D is from a report for the City of Davis, the same issues and conclusions would apply to Woodland. Selling recycled water to local users would help establish precedence and rights to the tertiary effluent that should enable the sale of effluent on the open market. Should treated effluent be reused or sold to local irrigators, the reuse would also offset agricultural groundwater pumping, thereby increasing groundwater in storage. Selling tertiary effluent on the open market during drought years would provide substantial revenue to the City. The open market price for short term water transfers was $275/ac-ft during the 2009 drought and is currently estimated by the Metropolitan Water District of Southern California to be $290/ac-ft at the Delta. 6-3 V:\44000\ Woodland Recycled Water Opportunities Eval\Report\Final Recycle Water Reuse Report_ docx
310 Section 7 Conclusions and Implementation Steps After completion of the surface water supply project, effluent from the Woodland WPCF will be a good quality source of water for irrigation and industrial uses. Even including conveyance facilities, the recycled water should be competitive in cost with potable water for irrigation use within City limits and with groundwater or surface water for agricultural irrigation reuse east and northeast of the WPCF. The recycled water would not be cost competitive with dedicated wells for properties west of the WPCF, but would provide higher quality water for crops and plants that are sensitive to boron. Developing a water recycling program can be done in accordance with new state guidelines. Funding could possibly be obtained to offset some of the cost of a program. A large potential benefit would be to establish priority to beneficial use of the water, possibly enabling lucrative water transfer sales during drought years. 7.1 Discussions with Potential Users The next step would be to continue discussions with major potential recycled water users such as Conaway Ranch, Woodland Biomass, the City Parks Department, and PCP. Discussions should also begin with other potential eastern and western parcel owners to gauge the level of interest in receiving recycled water. After these additional discussions, the cost model developed as part of this study can be modified to focus on the most interested potential users. Updated costs would then be utilized in developing statements of interest and ultimately in developing recycled water supply agreements with users. 7.2 Permitting Once the scope and participating parcels for a recycled water program have been developed, the City will need to apply for a water recycling permit with the Regional Water Board. CEQA compliance in the form of a mitigated negative declaration is also likely to be needed for the program. The State Water Board has mandated that all recycled water programs shall have salt and nutrient management plans (SNMPs) to protect underlying groundwater basins. It may be possible to include the Woodland recycled water program in a regional SNMP, depending upon the outcome of the CV-SALTS process currently underway for the Sacramento Valley. 7.3 Design and Construction of Recycled Water Supply Infrastructure Pipelines to serve western parcels would be most economical if it could be constructed at the same time the construction of the south Woodland surface water supply pipelines. The design of the surface water pipelines is currently scheduled to be completed by V:\44000\ Woodland Recycled Water Opportunities Eval\Report\Final Recycle Water Reuse Report_ docx
311 Recycle Water Opportunities Evaluation Section Planning to Take Advantage of Water Marketing Opportunities It is recommended that the City develop plans for water marketing, or monetizing the City s water resources regardless of what other water management options are implemented. All management options that reduce water demand, including actions taken in the last 5 years, should be documented. The documentation should state that one of the reasons for the demand reduction actions was to provide flexibility in the use of available water resources, including potentially making water available for sale to outside entities during appropriate periods. The City should work with Yolo County to set up conditions that would allow for water sales to entities out of the county. The City should also establish precedence to beneficial use of its water through agricultural or urban irrigation of recycled water and of water made available through other measures. 7-2 V:\44000\ Woodland Recycled Water Opportunities Eval\Report\Final Recycle Water Reuse Report_ docx
312 Section 8 Limitations This document was prepared solely for City of Woodland in accordance with professional standards at the time the services were performed and in accordance with the contract between City of Woodland and Brown and Caldwell dated September 25, This document is governed by the specific scope of work authorized by City of Woodland; it is not intended to be relied upon by any other party except for regulatory authorities contemplated by the scope of work. We have relied on information or instructions provided by City of Woodland and other parties and, unless otherwise expressly indicated, have made no independent investigation as to the validity, completeness, or accuracy of such information. 8-1 V:\44000\ Woodland Recycled Water Opportunities Eval\Report\Final Recycle Water Reuse Report_ docx
313 Section 9 References Brown and Caldwell, Draft General Recommendations and Consideration in the Negotiation of Costs between Woodland Biomass and the City of Woodland. October 13. Brown and Caldwell, Draft Parks and Greenbelts Water Management Plan. October 18. California Rice Communication, Personal phone call with Paul Buttner. June. SWRCB, V:\44000\ Woodland Recycled Water Opportunities Eval\Report\Final Recycle Water Reuse Report_ docx
314 (THIS PAGE LEFT BLANK INTENTIONALLY)
315 Recycle Water Opportunities Evaluation Appendix A: Recycled Water Regulations A-1 V:\44000\ Woodland Recycled Water Opportunities Eval\Report\Final Recycle Water Reuse Report_ docx
316 Recycle Water Opportunities Evaluation Table A-1. Summary of California Code of Regulations, Title 22, Division 4 Article No. Description 1 Provides definitions used in the document. 2 Defines sources of recycled water. 3 4 Provides information on water quality parameters required for various uses of recycled water, namely: Irrigation Water impoundments Cooling water for industrial and commercial facilities Other purposes Specifies requirements governing used areas; i.e., how and where recycled water may be used. For example, no impoundments of tertiary disinfected recycled water are allowed within 100 feet of any domestic water supply well. 5 Provides guidelines on dual-plumbed recycled water systems, including system design and operation requirements. 5.1 Provides guidelines on groundwater recharge applications. This article has now been superseded by the Groundwater Recharge Reuse Projects regulation, discussed in Section of this document. 5.5 Provides guidelines on acceptance of other methods of treatment for producing recycled water. 6 Lists the recycled water sampling and analysis requirements. 7 Describes the requirements for developing an engineering report and the operational requirements for recycled water facilities. 8 Describes the requirements for constructing a recycled water production system Lists the reliability requirements for primary effluent. Use of primary effluent for recycled water applications is no longer permitted. Provides the reliability requirements for full treatment of wastewater during the recycled water production process. Requirements are listed for various treatment processes such as primary and secondary sedimentation, biological treatment, coagulation, filtration, and disinfection. A-1 V:\44000\ Woodland Recycled Water Opportunities Eval\Report\Final Recycle Water Reuse Report_ docx
317 Recycle Water Opportunities Evaluation Appendix B: Boron Sensitivity of Crops B-1 V:\44000\ Woodland Recycled Water Opportunities Eval\Report\Final Recycle Water Reuse Report_ docx
318 Recycle Water Opportunities Evaluation Agricultural Crops Very sensitive (<0.5 mg/l) Lemon (Citrus limon) Blackberry (Rubus sp.) Table B-1. Relative Boron Threshold Tolerance of Agricultural Crops and Landscape plants a, b Sensitive ( mg/l) Avocado (Persea americana) Grapefruit (Citrus X paradisi) Orange (Citrus sinensis) Apricot (Prunus armeniaca) Peach (Prunus Persica) Cherry (Prunus avium) Plum (Prunus domestica) Persimmon (Diospyros Kaki) Fig, kadota (Ficus carica) Grape (Vitis vinitera) Walnut (Juglans regia) Pecan (Carga illinoinensis) Cowpea (Vigna unguiculata) Onion (Allium Cepa) Garlic (Allium sativum) Sweet potato (Ipomea Batatas) Wheat (Triticum aestivum) Barley (Hordeum vulgare) Sunflower (Helianthus annus) Bean, mung (Vigna radiata) Sesame (Sesanum indicum) Lupine (Lupinus Hartwegii) Strawberry (Fragaria sp.) Artichoke, Jerusalem (Helianthus tuberosus) Bean, kidney (Phaseolus vulgaris) Bean, lima (Phaseolus lunatus) Peanut (Arachis hgpogaea) Moderately sensitive ( mg/l) Pepper, red (Capsicum annuum) Pea (Pisum sativa) Carrot (Daucus carota) Radish (Raphanus sativus) Potato (Solanum tuberosum) Cucumber (Cucmis sativus) Ornamentals Very sensitive (<0.5 mg/l) Oregon grape (Nahonia Aquifolium) Photinia (Photinia X Fraseri) Xylosma (Xylosma congestum) Thorny elaeagnus (Elaeagnus pungens) Laurustinus (Viburnum Tinus) Wax-leaf privet (Ligustrum japonicum) Pineapple guava (Feijoa Sellowiana) Spindle tree (Euongmus japonica) Japanese pittosporum (Pittosporum Tobira) Chinese holly (Ilex cornuta) Juniper (Juniperus chinensis) Yellow sage (Lantana Camara) American elm (Ulmus americana) Sensitive ( mg/l) Zinnia (Zinnia elegans) Pansy (Viola tricolor) Violet (Viola odorata) Larkspur (Delphinum sp.) Glossy abelia (Abelia x grandiflora) Rosemary (Rosemarinus officinalis) Oriental arborvitae (Pelagronium X orientalis) Geranium (Pelargonium X hortorum) Moderately sensitive ( mg/l) Gladioli (Gladiolus sp.) Marigold (Calendula officinalis) Poinsettia (Euphorbia pulcherrima) China aster (Callistephus chinensis) Gardenia (Gardenia sp.) Southern yew (Podocarpus macrophgllus) Bruch cherry (Sgzggium paniculatum) Blue dracaena (Cordgline indivisa) Ceniza (Leucophgllum frutescens) B-2 V:\44000\ Woodland Recycled Water Opportunities Eval\Report\Final Recycle Water Reuse Report_ docx
319 Recycle Water Opportunities Evaluation Agricultural Crops Table B-1. Relative Boron Threshold Tolerance of Agricultural Crops and Landscape plants a, b Moderately tolerant ( mg/l) Lettuce (Lactuca sativa) Cabbage (Brassica oleracea capitata) Celery (Apium graveolens) Turnip (Brassica rapa) Bluegrass, Kentucky (Poa pratensis) Oats (Avena sativa) Corn (Zea Nags) Artichoke (Cynara scolgmus) Tobacco (Nicotiana Tabacum) Mustard (Brassica juncea) Clover, sweet (Nelilotus indica) Squash (Cucurbita Pepo) Muskmelon (cucumis melo) Tolerant ( mg/l) Sorghum (Sorghum bicolor) Tomato (Lycopersicon Lycopersicum) Alfalfa (Nedicago sativa) Vetch, purple (Vicia benghalensis) Parsley (Petroselinum crispum) Beet, red (Beta vulgaris) Sugarbeet (Beta vulgaris) Very tolerant ( mg/l) Cotton (Gossgpium hirsutum) Asparagus (Asparagus officinalis) Ornamentals Moderately tolerant ( mg/l) Bottlebrush (Callistemon citrinus) California poppy (Eschscholzia californica) Japanese boxwood (Buxus microphylla) Oleander (Nerium Oleander) Chinese hibiscus (Hibiscus Rosa-sinensis) Sweetpea (Lathyrus odoratus) Carnation (Dianthus Caryophyllus) Tolerant ( mg/l) Indian hawthorn (Raphiolepis indica) Natal plum (Carissa grandiflora) Oxalis (Oxalis Bowiei) a) Data taken from Maas. b) Maximum concentrations tolerated in soil water without yield or vegetative growth reductions. Boron tolerances vary depending upon climate soil conditions and crop varieties. Maximum concentrations tolerated in the applied irrigation water are approximately equal to these values for soil-water or slightly less. B-3 Final Recycle Water Reuse Report_ docx
320 (THIS PAGE LEFT BLANK INTENTIONALLY)
321 Recycle Water Opportunities Evaluation Appendix C: Cost Estimating Details C-1 V:\44000\ Woodland Recycled Water Opportunities Eval\Report\Final Recycle Water Reuse Report_ docx
322 (THIS PAGE LEFT BLANK INTENTIONALLY)
323 TableC1.EastParcelsAreaandWaterDemand Item APN PropertyOwnerDescription Area,ac Est.Net Area,ac Zoning Group AverageAnnualWater Use,acft PeakSeason Demand,ac ft/month mgd RiceDecomp. Demand,acft/month mgd PacificCoastProducers Agricultural PacificCoastProducers Agricultural PacificCoastProducers Agricultural ConawayPreserve Agricultural 1 1, ConawayPreserve Agricultural ConawayPreserve Agricultural Koerwitz;Jim&Courtlandt;Alis Agricultural CityofWoodland Agricultural 1 1, Koerwitz;Jim&Courtlandt;Alis Agricultural NealDowFamilyLP Agricultural TotalGroup ConawayPreserve Agricultural ConawayPreserve Agricultural ConawayPreserve Agricultural ConawayPreserve Agricultural ConawayPreserve Agricultural ConawayPreserve Agricultural ConawayPreserve Agricultural TotalGroup2 1,806 1,626 1, Notes: Groups 1 Minimalconstraintsonrecycledwaterirrigation 2 Administrativeorcropmarketingconstraintsonrecycledwaterirrigation Assumes1footperseasonwaterusebyPCP Assumes0.5ft/mo.For2monthswateruseforricestubbledecomposition
324 (THIS PAGE LEFT BLANK INTENTIONALLY)
325 TableC2.EasternParcelsEstimatedCosts User Group Numberof Properties Irrigation Area,ac UserGroupDescription Potential Demand,mgd Reasonable Future Capacity, mgd Annual Demand, acft/yr Incremental TotalCost Incremental TotalCost, $/AFY TotalAnnualized Cost$/af OtherO&M, $/af Incremental Cost,$/af Fieldcrops(nonrice) ,469 $221,900 $89.86 $7.21 $10.00 $ Ricedecompositionwater ,332 $30,000 $22.52 $1.81 $10.00 $11.81 Multiplierfor20years@5% 0.080
326 (THIS PAGE LEFT BLANK INTENTIONALLY)
327 TableC3.WestAreaParcelsWaterUseandCostAssumptions AnnualWateruse FieldCrops 3.22 ft/yr Orchard 3.88 ft/yr Turf 3.98 ft/yr Landscape 3.49 ft/yr JulyEto in/d JulyFieldCropsKc 1.08 JulyOrchardKc 0.96 JulyTurfKc 0.90 JulyLandscapeKc 0.80 AssumedIrrig.Efficiency 0.80 Max.PipeVelocity 6 ft/sec PipelineCost 10 $/ft/in(unimproved) PipelineCost 15 $/ft/in(improved) PipelineLife 20 InterestRate 5% TableC4.WestParcelsGroup1WaterDemandsandEstimatedCosts Estimated Avg.Annual Avg.July Calculated Estimated Approx. NetIrrig. Field Average WaterUse,ac LoadingRate, Distance, Cumulative Min.Pipe Pipe PipelineCost APN PropertyOwnerDescription Area,Acres Area Turf Landscape Crops Orchards JulyKc Group Zoning ZoningComments AdditionalComment ft acft/day gpm ft Flow,gpm Size,in Size,in persegment WOODLANDDEVELOPMENTCOLLC Agricultural WithinCityBoundaries GatewayIIDevelopment ,040 1, $204, BARTONTRUST Agricultural WithinCityBoundaries MountainValleyGolfCourse , $71, WOODLANDCITYOF CityPark WithinCityBoundaries PioneerPark , $76, WOODLANDCITYOF CityPark WithinCityBoundaries PioneerPark $15, WoodlandComm.College PublicSchool WithinCityBoundaries CommunityCollegeExpansion? , $516, CityofWoodland Agricultural WithinCityBoundaries SlavenPark $25, WoodlandspringlakepartnersLP Agricultural WithinCityBoundaries Park , $56, OptomisticPartnersLLC Agricultural WithinCityBoundaries FuturePark , $234, WOODLANDCITYOF CityServices WithinCityBoundaries SportsCenter,morelater? , $108, WOODLANDCITYOF CityServices WithinCityBoundaries SportsCenter,morelater? , $54, WOODLANDCITYOF CityPark WithinCityBoundaries CrawfordPark , $68,000 Totals Totals 881 1,290 26,860 $1,431,400 PumpStation 54 HP PumpSta.Cost $ 200,000 E,A,&Cat30% $ 489,420 TotalCost $2,120,820
328 TableC5.WestParcelsGroup2WaterDemandsandEstimatedCosts Approx. Area, Acres EstimatedNet Field Average Distance, Cumulative PipeSize, APN PropertyOwnerDescription Irrig.Area Turf Landscape Crops Orchards JulyKc Group Zoning ZoningComments AdditionalComment gpm ft Flow,gpm in WOODLANDDEVELOPMENTCOLLC Agricultural WithinCityBoundaries GatewayIIDevelopment ,040 2, $285, BARTONTRUST Agricultural WithinCityBoundaries MountainValleyGolfCourse , $71, WOODLANDCITYOF CityPark WithinCityBoundaries PioneerPark , $76, WOODLANDCITYOF CityPark WithinCityBoundaries PioneerPark $15, WoodlandComm.College PublicSchool WithinCityBoundaries CommunityCollegeExpansion? ,460 2, $904, CityofWoodland Agricultural WithinCityBoundaries SlavenPark $25, WoodlandspringlakepartnersLP Agricultural WithinCityBoundaries Park , $56, OptomisticPartnersLLC Agricultural WithinCityBoundaries FuturePark ,910 1, $703, WOODLANDCITYOF CityServices WithinCityBoundaries SportsCenter,morelater? ,720 1, $272, WOODLANDCITYOF CityServices WithinCityBoundaries SportsCenter,morelater? ,360 1, $136, WOODLANDCITYOF CityPark WithinCityBoundaries CrawfordPark ,400 1, $340, BEEMANTIMOTHYL Agricultural OutsideCityBoundary Ag , $30, FRANKEHAROLDRESTATE Agricultural OutsideCityBoundary Ag , $80, FRANKEHAROLDRESTATE Agricultural OutsideCityBoundary Ag $40, JENNESSBENNINGF Agricultural OutsideCityBoundary Ag , $156, HILLEBYMARTHAI Agricultural OutsideCityBoundary Ag , $52,000 Total Totals 1,521 2,677 32,560 $2,886,600 Group2AloneTotals 640 1,387 PumpStation 112 HP PumpSta.Cost $250,000 E,A,&Cat30% $940,980 TotalCost $4,077,580 Avg. Annual Water Use,acft Avg.July Loading Rate,ac ft/day Calculated Min.Pipe Size,in Estimated PipelineCost persegment TableC6.WestParcelsGroup4WaterDemandsandEstimatedCosts Approx. Area, Acres EstimatedNet Field Average Distance, Cumulative PipeSize, APN PropertyOwnerDescription Irrig.Area Turf Landscape Crops Orchards JulyKc Group Zoning ZoningComments AdditionalComment gpm ft Flow,gpm in WOODLANDDEVELOPMENTCOLLC Agricultural WithinCityBoundaries GatewayIIDevelopment ,040 4, $550, WoodlandBiomass 37.2 n/a:300gpm 3 Industrial WithinCityBoundaries WoodlandBiomassPowerPlant , $841, BARTONTRUST Agricultural WithinCityBoundaries MountainValleyGolfCourse , $71, WOODLANDCITYOF CityPark WithinCityBoundaries PioneerPark , $76, WOODLANDCITYOF CityPark WithinCityBoundaries PioneerPark $15, WoodlandComm.College PublicSchool WithinCityBoundaries CommunityCollegeExpansion ,460 3, $1,033, CityofWoodland Agricultural WithinCityBoundaries SlavenPark $25, WoodlandspringlakepartnersLPAttn:D Agricultural WithinCityBoundaries Park , $56, OptomisticPartnersLLC Agricultural WithinCityBoundaries FuturePark ,910 2, $821, BEEMANMICHAEL Agricultural OutsideCityBoundary Ag,thenplannedneighborhood ,720 2, $380, WOODLANDCITYOF CityServices WithinCityBoundaries SportsCenter,possibleexpansion ,720 2, $326, WOODLANDCITYOF CityServices WithinCityBoundaries SportsCenter,possibleexpansion ,360 1, $163, SINGHBALWANT Agricultural OutsideCityBoundary Ag,thenplannedneighborhood , $107, GUNNERSONBETTYB Agricultural OutsideCityBoundary Ag,thenplannedneighborhood $45, BEEMANFAMTRUST Agricultural OutsideCityBoundary Ag,thenplannedneighborhood $30, BENSONREVTRUST Agricultural OutsideCityBoundary Ag,thenplannedneighborhood , $61, WOODLANDCITYOF CityPark WithinCityBoundaries CrawfordPark ,400 1, $340, BEEMANTIMOTHYL Agricultural OutsideCityBoundary Ag , $51, FRANKEHAROLDRESTATE Agricultural OutsideCityBoundary Ag , $61, FRANKEHAROLDRESTATE Agricultural OutsideCityBoundary Ag $20, JENNESSBENNINGF Agricultural OutsideCityBoundary Ag , $153, HILLEBYMARTHAI Agricultural OutsideCityBoundary Ag , $54,400 Totals Totals 2,695 4,409 $5,287,000 Group4AloneTotal 690 PumpStation 184 HP PumpSta.Cost $350,000 E,A,&Cat30% $1,691,100 Groups14TotalCost $7,328,100 Avg. Annual Water Use,acft Avg.July Loading Rate,ac ft/day Calculated Min.Pipe Size,in Estimated PipelineCost persegment
329 Recycle Water Opportunities Evaluation Appendix D: Water Marketing Section from Davis Integrated Water Resource Study The following section is from a report prepared for the City of Davis. There are enough similarities between the water supply situations and considerations between Davis and Woodland that many of the findings in the Davis report are applicable to Woodland. D-1 V:\44000\ Woodland Recycled Water Opportunities Eval\Report\Final Recycle Water Reuse Report_ docx
330 Recycle Water Opportunities Evaluation Appendix D Water sales could provide the City supplemental revenue, which would ultimately benefit ratepayers. The purpose of this evaluation is to better define and compare the water marketing opportunities that could be available to the City. This section provides details on water rights, potential sources of water that could be marketed, and considerations for preparation and implementation of water sales. Directly or indirectly, the City can claim rights to both groundwater and surface water sources of supply for its use. Groundwater has been the City s only source of supply until recently when the City acquired access to two water rights for Sacramento River water. Given the proper positioning and circumstances, the City could potentially sell a portion of its water to a third party. This could apply to either the fresh water supply and/or treated wastewater, depending upon conditions and precedents. D.1. Groundwater Rights There is no comprehensive regulatory scheme governing the extraction or use of groundwater in California. Groundwater rights have been established through court decisions and precedent. The most common rights to groundwater are correlative rights, which allow the overlying property owners to put the groundwater to beneficial use in an amount which is reasonable in light of the competing demands of other overlying users. Because of the Mojave Decision precedent, water devoted to public uses (for example, water acquired by municipalities and public utilities for distribution to the public) is now generally considered an appropriative use rather than an overlying correlative use. This would likely be the case for the City s use of groundwater. Appropriative groundwater rights are limited to available surplus water in a groundwater basin (i.e. water in excess of correlative groundwater users needs) and can be applied to beneficial use inside or outside of the basin. Appropriative rights have a priority determined by the timing of the commencement of use. However, where the appropriated water has been put to public use, further appropriation for public use may be allowed under an implied kind of condemnation. After a basin becomes overdrafted, it may be possible for appropriative users to acquire prescriptive rights to groundwater if there are at least 5 years of open, notorious use of water to the detriment of the overlying correlative and/or prior appropriative groundwater users. While this is based on applying the concept of prescriptive use rights for surface water to groundwater, there is still some question as to whether prescriptive rights to groundwater can be asserted. Prescriptive rights would not apply to the City s use of groundwater because the basin is not overdrafted. Specific numerical allocations of rights to groundwater are only established in basins that have been adjudicated. Adjudication is a means to resolve conflicts where there is insufficient groundwater to provide all the water desired by users. Because the process is long and expensive, only a few basins in California have been adjudicated, with none in Yolo County. New public groundwater usage may potentially be limited through the CEQA process if existing users can show potential damage. When the City sought to convert a portion of their water supply to deeper wells tapping zones already used by UC Davis, UC Davis brought forth objections in the CEQA process. The parties ended up negotiating a maximum limit to the City s pumping from the deep aquifer zone to prevent impairment of UC Davis ability to extract water from the deep aquifer zone. The City currently utilizes groundwater for its entire potable water supply of up to approximately 15,000 af/year (based on 2002 and 2004 year usage). Were there to be an adjudication, most of this would likely be considered an appropriative right. The City theoretically could sell some of this water assuming that there was no injury to higher priority groundwater rights holders. D-2 V:\44000\ Woodland Recycled Water Opportunities Eval\Report\Final Recycle Water Reuse Report_ docx
331 Recycle Water Opportunities Evaluation Appendix D D.2 Surface Water Rights Surface water rights are classified as riparian, appropriative, and pre-1914 appropriative. Riparian rights to a stream or river are the highest priority rights, but can only be put to beneficial use on lands bordering that stream or river. Appropriative rights are a first-in-time, first-in-right system of allocation based on the date of filing for diversion and beneficial use. The priority of an appropriative right can be lost if the appropriator does not apply reasonable diligence in putting the water to beneficial use. Before 1914, there was no formal permit system. The pre-1914 appropriative rights were obtained by simply posting and recording a notice of intended diversion and then constructing and using diversion facilities on a regular basis. All appropriative water rights are effectively administered by the SWRCB. Prescriptive rights to surface water can be obtained by open, notorious, continuous and adverse use for a five year prescriptive period. All surface water rights must be put to beneficial use to be perfected. The State Water Project and Federal Central Valley Project hold rights to water retained in Lake Oroville and Lake Shasta, respectively. Their rights to the natural flow of the river are junior to all other water rights holders in the Sacramento Valley, including more recent area-of-origin water rights applications. Many northern California water districts are provided water through contracts with the U.S. Bureau of Reclamation (Reclamation) in addition to their own water rights. Limitations on the districts water rights during dry periods have been negotiated and approved through water rights settlement contracts with the USBR. The City has access to both area-of-origin water rights and settlement contract water on the Sacramento River as detailed in the following paragraphs. Under the watershed area of origin statute, new surface water appropriators using water within the basin of origin are granted senior water rights to the natural surface water flows over exporters. These rights are still junior to all preexisting rights for uses in the area of origin, but would be senior to the state and federal water projects diverting water out of the south Delta. In 1994, the Yolo County Flood Control and Water Conservation District filed for an appropriative right to surface water from the Sacramento River for use by Davis, Woodland, and UC Davis under the new area of origin doctrine. The YCFCWCD assigned this to the municipal entities in Subsequently, the application was split, with the City and UC Davis becoming applicants on Application 30358A for 30,000 acre-feet ac-ft/yr and Woodland becoming an applicant on 30358B for 15,000 ac-ft/yr. An analysis of the availability of water under this water right was performed in 2007 (WDCWA 100, p. 5). The two applications were combined and a water right (Permit 20281) was approved in 2011 (SWRCB, 2011) and assigned to the Woodland Davis Clean Water Agency (WDCWA) Joint Powers Authority (JPA) as a representative agency for the City, Woodland, and UC Davis. The water right is for up to the total filing of 45,000 ac-ft/yr of water. Diversion under the water right is further limited to a period when Term 91 has not been invoked. Term 91 is invoked when the State and Federal projects are effectively exporting less than they are releasing from their storage. (See Lilly, 2009). Additional limitations on diversion could be applied because of Bay-Delta water quality requirements. Because of these limitations, the water right would effectively be limited to approximately the months of October through May in most years, with some water available in June and September about half of the time (West Yost, 2012). The WDCWA also purchased a water right from Conaway Preservation Group (CPG) owners based on appropriative water rights licenses 904 and The agreement dated December 2010 (WDCWA, 2010) is for up to 10,000 ac-ft/yr, with 7,500 ac-ft/yr during summer months (July through September). CPG s effective water right is subject to a Reclamation Settlement contract, which reduces the available overall water right by 25 percent during Lake Shasta critical dry years. There may also be some rescheduling charges imposed by Reclamation to deliver more than 500 ac-ft in August. D-3 Final Recycle Water Reuse Report_ docx
332 Recycle Water Opportunities Evaluation Appendix D The City s share under the water purchase agreement is 46.1 percent. The JPA-held water rights (and the City s share) will be senior to the remaining CPG -appropriative water rights, but only for municipal and industrial uses in the JPA service area. Other uses will have equal priorities with CPG s remaining appropriative water rights. The purchase takes effect in The total principal cost of this water was $18.6 million ($4,000 per ac-ft for normal year water) plus $17.9 million in interest at 6% over the 24 year payment period. The City s portions of the area of origin and purchased water rights are summarized in Table Table C-1. Davis Recorded and Implicit Water Rights Source Potential capacity (ac-ft/yr) Usage precedent (ac-ft/yr) Recorded water right (ac-ft/yr) Limitations Groundwater 22,200 15,100 n/a Surface water - CPG 4,610 CPG usage 4,610 Surface water - Area of origin 20,745 n/a 20,745 Deep wells limit 4,500 gpm under UC Davis agreement, intermediate wells limited by water quality Could be reduced by 25% in critically dry years Held by WDCWA, shared with UC Davis, subject to Term 91 diversion limitations Treated wastewater 3,450 0 n/a Notes: 1. Treated wastewater capacity for May - September irrigation season. 2. Groundwater capacity assumes 2.0 peaking factor for maximum day capacity to annual capacity. D.3 Treated Wastewater The City s treated wastewater will become a more desirable source of irrigation water as the City lowers the salinity of its fresh water supply over time. The City is also moving to tertiary treatment, which would provide water suitable for unrestricted irrigation reuse. This would make it easier to market treated effluent directly or indirectly. There are no explicit conditions on requirements for treated wastewater return flow listed in the City s area-of-origin water right decision (SWRCB, 2011). Should treated effluent be reused or sold to local irrigators, the reuse would likely offset agricultural groundwater pumping, thereby increasing groundwater in storage. D.4 Water Transfers Overview The ability to transfer water rights on a short-term or long-term basis adds flexibility to the State s water supply (Hanak and Stryjewski, 2012). The water market in California accounts for an average of approximately 1.4 million ac-ft of water exchanging hands annually, or roughly 5 percent of all water used in the state. Market growth has slowed since the early 2000s, reflecting infrastructure and administrative constraints. Permanent transfers involve the sale of water rights on a permanent basis from one entity to another. Water rights sales by Natomas Central Mutual Water Company and the sale of water from CPG to the WDCWA are recent local examples of permanent water transfers. Temporary transfers are often for one or several years D-4 Final Recycle Water Reuse Report_ docx
333 Recycle Water Opportunities Evaluation Appendix D term. Past sales to the State Water Bank and sales between Federal and State water project contractors are good examples of short term water transfers. Dry year options are arrangements where purchasers will pay a water rights holder for the right to buy water at a given price at a certain frequency, usually in dry years. Dry year options tend to be better tolerated by third parties in the area of the water seller because they are viewed as having fewer adverse long-term economic impacts. Annual averages for internal and external water sales in the Sacramento Valley for the years are listed in Table 4-19 (Hanak and Stryjewsky, 2012). Approximately 80% of the statewide transfers are between buyers and sellers within projects rather between entities outside of their respective projects. Table C-2. Average Annual Sacramento Valley Water Sales Type of Sale Average Annual Volume (ac-ft/yr, rounded) Internal non-environmental sales 80,000 External non-environmental sales (exports) 82,000 Environmental sales 74,000 Total Sales 238,000 D.5 Water Eligible for Transfer Water eligible for transfer typically must be water that would have otherwise been beneficially consumed or left in storage (also known as wet water in contrast to paper water ). The four sources of wet water eligible for transfer are: Excess water stored in surface reservoirs Other excess amounts of surface water that the seller has the right to use, but does not need during the term of the transfer Conserved water the seller saves by reducing use Groundwater The right to sell conserved water is reinforced in Water Code Sections 1011 and Further clarification was provided in State Water Resources Board (SWRCB) Order The amount of conserved irrigation water available for sale has generally been considered the net water use conserved. In the case of irrigation water, conserved water has been construed to equal evapotranspiration savings rather than the total diversion right, because the total water right may include water that actually gets partially returned to the system. A water transfer decision tree developed by the SWRCB is shown in Figure D-5 Final Recycle Water Reuse Report_ docx
334 P:\43000\ Integrated Water Resources Study\IWRS Report\Figures\Figures for Final Report\AI files LEGEND * No SWRCB approval needed Expedited processing procedures via the water code Exempt from CEQA No special expedited procedures Downstream users have no legal right to object to water right changes. Evaluate effects on fish and wildlife ordinarily based on public interest, rather than public trust. Transfer of Imported Water If transfer involves CALFED agency facilities or funds comply with CALFED transfer information needs Comply with any special provisions of Water Dist., DWR or USBR * For CVP contractors this is limited to historical use except if in Sacramento Valley Transfer = contract entitlement* - actual use Transfer within water rights of Water Dist., DWR or USBR Contract Supply No adverse effects to other legal users of water (wc1706) Pre 1914 Water Rights Transfer outside of water rights of Water Dist., DWR or USBR No unreasonable effects on fish and wildlife no injury to other legal users of water Urgent need for water right change (6 months) Other water rights changes (wc 1435) (>1 year) Reduction in direct diversion (wc 1735) Evaluate transfer windows across the Delta for Evaluate effect of reservoir no unreasonable effects on fish reoperation on non CVP/SWP rights No unreasonable effects on fish & wildlife from transfer or reservoir reoperation to accommodate transfer No additional Transfer = reduction in consumptive use CALFED to the extent of direct diversion rights Comply with agency CALFED approval transfer File reports pursuant needed information to Section 1011 needs Transfer = water in crop change storage or would have fallowing conservation been stored Valid water rights exist for the time of the transfer (1 year) Stored water (or water that would * (1 year) Reduction * have been stored) in direct diversion (wc 1725) (wc 1725) (>1 year) Other water Stored Water Stored Water right changes Other Reduction in wc 1735) (wc 1735, 1702) Direct Diversion Transfer is not limited to only stored water or reduction in consumptive use Subject to CEQA and normal notices, no urgent need required Long Term Transfer Track flows to place of use and protect from diversion by junior rights Refill criteria of CVP/SWP applies if refill occurs when Term 91 is in effect Transfer to in-basin uses Evaluate application of carriage water requirements Refill criteria of CVP/SWP applies if refill occurs when flows in the Delta are in balanced conditions Transfer across the Delta Transfer across the Delta Short Term Transfer Post 1914 Water Rights Base Water Right Supply Surfacewater Transfer to in-basin uses Transfer does not include reductions in surface returns or deep perk unless (1) returns are to a salt sink or (2) reduction in returns or deep perk do not otherwise adversely affect legal users of water and no unreasonable effects on fish and wildlife Yes Use of CALFED agency facilities or funding No adverse effect to other legal users of water (wc 1706) Pre 1914 Water Rights No Track flows to place of use and protect from diversion by junior rights Evaluate effects on other groundwater users, downstream users and avoid impacts Transfer = evapotranspiration + deep perk + surface returns of crop in the ground for which groundwater is used to the extent of surface direct diversion rights Comply with any applicable groundwater management plans per or approved by the water supplier pursuant to section Use of groundwater in lieu of surface water rights Banked Groundwater Groundwater See Long Term Transfer See Short Term Transfer No Yes Water Rights include groundwater storage Banked by original Banked by water right contractor holder Transfer = banked water taken from groundwater storage Seek Appropriate changes to water rights No Ultimate Place of Use covered in original water rights Yes Comply with any groundwater management plan per local ordinance, and section 1215 Export from combined Other direct Sacramento and groundwater Delta Sierra transfers Basins per section 1220 Direct Transfer of groundwater (see section 1220) By others Comply with watershed protection per section By CVP/ SWP Source: State Water Resources Control Board, Division of Water Rights, July 1999 DATE PROJECT SITE TITLE Integrated Water Resources Study Water Transfer Decision Tree Figure
335 Recycle Water Opportunities Evaluation Appendix D Water Code sections 1010 and 1011 allow a water right holder who saves water though certain conservation measures to retain rights to the unused surface water (SWRCB, 1999). The protections provided are subject to the water right holder filing reports required by the SWRCB on the amount of surface water saved through the conservation effort, use of recycled water, or conjunctively used groundwater. Therefore, filings and documentation are critical to preserving a right to conserved water. Conserved water was the basis for much of the water transferred during the state Drought Water Bank operation years of 1990, 1991, 1994, and 2009, with the conserved water generated by land fallowing or crop substitution. Groundwater substitution was the basis for some of the water sold to the Drought Water Bank, where surface water rights holders pumped groundwater for irrigation instead of utilizing surface water. Groundwater substitution has been limited by guidelines that deduct for the loss of surface water than can result from pumping, especially for groundwater pumping near surface waters. D.6 Yolo County Water Transfer Ordinance A California court held that groundwater regulation is within a county's police powers and is not otherwise preempted by general State law. As a result of this case, many counties have adopted groundwater transfer ordinances. In particular, counties are concerned with potential mining of groundwater resources for use outside the county. The extent to which counties can regulate groundwater is still an open question. Yolo County passed an ordinance in 1996 addressing groundwater effects due to water transfers (Yolo County Code section 10-7). It addresses both the extraction of groundwater directly and the extraction of groundwater to replace a surface water supply to be transferred outside the county. The ordinance requires a permit application, demonstration that long term groundwater conditions will not be adversely affected, and approval by the Board of Supervisors. D.7 Rights to Transfer Treated Wastewater Many cities have historically discharged treated wastewater into surface water bodies, thereby providing a source of water for downstream water users. However, other cities use all or a portion of their treated wastewater for agricultural, landscape, or turf irrigation. Wastewater recycling is being strongly encouraged by the State as a source of additional water through policies such as the recent Statewide Recycling Policy (2009). Tertiary treatment in particular provides water for unrestricted irrigation reuse. Water code section 1485 allows those who discharge treated wastewater to the San Joaquin River to file and appropriative water right application. The City of Stockton received a revised permit pursuant to that legislation in year The City of Modesto has also performed preliminary studies, including alternatives for water marketing, for use of effluent from its new tertiary wastewater treatment plant currently under construction. Assembly Bill (AB) 134 was passed by the Legislature and signed by the Governor in September It enables Sacramento Regional County Sanitation District (SRCSD) to file an application with the SWRCB to obtain a water right permit for an equivalent amount of high-quality recycled water that SRCSD treats and discharges to the Sacramento River, subject to the protection of the rights of any legal user of the water. The rights of cities to sell treated wastewater from a groundwater source has been less controversial than for cities which intend to sell treated wastewater derived from a surface water source. In the case of surface water supplies, downstream users may claim injury because they had depended upon return flows. This would likely not apply to state and federal water export projects. Even though there has been legislation reinforcing the rights of municipalities to their treated wastewater for use or transfer, transfers would still be subject to the no injury rule. Putting treated wastewater directly to beneficial use in Yolo County would help establish rights to the tertiary treated effluent. D-7 Final Recycle Water Reuse Report_ docx
336 Recycle Water Opportunities Evaluation Appendix D D.8 Potential Water Purchasers This section describes several types of potential water purchasers of the City s water resources. Local Agricultural Water Users. The City previously evaluated providing treated secondary effluent to Conaway Ranch for irrigation reuse. The conclusions were that tertiary treatment would likely be required anyway to provide the flexibility for reuse and that there were marketability issues for Conaway leaseholders if their crops were to be irrigated with recycled water. Therefore there was no advantage to sending secondary treated water to Conaway versus constructing tertiary treatment facilities for effluent discharge to Willow Slough Bypass. However, the situation has changed now that CPG has sold water to the WDCWA and needs replacement water. CPG is currently planning to replace the sold water with groundwater. CPG also has to prove that their groundwater pumping is not adversely affecting surface water flows. In order to improve Conaway s overall hydraulic balance and possibly reduce groundwater costs, CPG could possibly be interested in purchasing some tertiary treated effluent in place of pumping groundwater, However, this would probably only be feasible if a portion of the Conaway system could be isolated to use recycled water without affecting crop marketability on the rest of the ranch. There is other farmland in the area surrounding the Davis WPCP, most of which is irrigated using groundwater. If recycled water were less costly than groundwater pumping (total costs estimated at $70/acft), some of these lands could be enticed to use recycled water. This would also have the benefit of increasing local groundwater in storage. Swanston Ranch is located in the Yolo Bypass downstream of the City s current discharge point 001 into Willow Slough Bypass. Swanston Ranch currently dedicates approximately 700 acres of land to farm crops and 2,000 acres to wildlife habitat. Swanston Ranch could be interested in purchasing some of the City s treated effluent for both uses. Swanston could resell some of its own water rights during dry years if it had a reliable source of water from the City. Local Environmental Water Users. The Yolo Bypass Wildlife Area may have a need for additional water during some years. Water Code section 1707 provides a means to facilitate water transfers for instream environmental uses. Use on City-Owned Agricultural Land. The City owns over 1100 acres of farmland land southeast of the WPCP as shown in Figure Roughly 3,000 ac-ft of groundwater per year is needed to irrigate these parcels. The City has considered providing recycled water to this parcel. The pipeline cost could be substantial, but it would offset approximately $150,000 per year in pumping related costs. Alternatively, it may be possible to move the treated effluent part way to the City-owned land through Willow Slough Bypass and then divert the water closer to the point of use. More importantly, it would establish a precedent for irrigation reuse of that water and would provide in-lieu recharge of groundwater, potentially helping to enable dry year transfers of a like amount of recycled water. Other Sacramento Valley Agricultural Users. There are several agricultural water districts served by Tehama Colusa Canal on the west side of the Sacramento Valley that have been impacted by Reclamation s cutbacks in drought years. They could be interested in supplemental water in drought years, although they would tend to pay a much lower price for water than municipal suppliers or exporters. In-Basin Municipal Users. Based on legislation passed in 2001 (SB 221 and SB 610), agencies must assess and verify the adequacy of water supplies prior to approving large new development projects. The City of Folsom has been entering into permanent water rights purchase agreements to enable development, reportedly agreeing to pay $4,000 per af for water from Natomas Central Mutual Water Company. Other Sacramento Valley municipalities or municipalities served by the North Bay Aqueduct could be interested in purchasing water on a short term basis, especially during drought years. D-8 Final Recycle Water Reuse Report_ docx
337 P:\43000\ Integrated Water Resources Study\Data\GIS files\davisparcels_8x11_ mxd Legend DATE 1/17/13 Agricultural Parcels Owned by the City of Davis Surrounding Parcel Boundaries PROJECT SITE TITLE Davis Wetlands Davis WPCP Agricultural Parcels Owned by the City of Davis Integrated Water Resources Study 0 1 Miles NORTH Figure D-2
338 Recycle Water Opportunities Evaluation Appendix D Out-Of-Basin Users (Exporters). Out-of-basin users are typically able to pay higher prices for water when needed. Some examples are discussed below. The Metropolitan Water District of Southern California (MWDSC) is a large player in water transfers. They publish water costs annually. In 2003, MWDSC exercised its rights under option contracts and other arrangements with northern California water districts to purchase 147,200 ac-ft of water at a net price of $100 per acre-foot. In 2008, Conaway Conservancy Group agreed to sell 12,195 acre-feet of water to the San Luis & Delta- Mendota Water Authority in the San Joaquin Valley, and San Benito and Santa Clara counties for a $2.1 million sale price (approx. $170/ac-ft) from July to September (Lamb, 2008). The 2009 Drought Water Bank transferred 76,600 ac-ft across the Delta. At an offering price of $275/ac-ft to potential sellers, the participation rate was well below the rate hoped for by DWR, indicating that a true market price may have been higher than $275/ac-ft. San Francisco Public Utilities Commission offered to pay $700/ac-ft for water to the Modesto Irrigation District, but because of concerns over contract details and by other local agencies, Modesto Irrigation District declined. The relatively high offering price may have been due to other business considerations and not reflective of short term open market conditions. MWDSC's Tier 2 rate is set at their estimated cost of developing additional supply to encourage efficient use of local resources. The current Tier 2 rate is $290/ac-ft at the Delta. Marketing of City Water Rights Because the City intends to utilize its share of the water from the WDCWA most future years, water marketing could be a means for the City to realize revenue under these possible scenarios: 1. Selling its portion of the CPG water right held by the WDCWA prior to the City obtaining the water for its own use. 2. Selling a portion of its surface water rights and substituting groundwater during future dry years. 3. Selling treated wastewater to local agricultural users. 4. Selling treated wastewater directly or indirectly to users downstream of a Willow Slough Bypass or Yolo Bypass discharge point. Selling Area-of-Origin Water Rights. The area-of-origin water rights will not be available during most summer months, especially during a drought. Therefore, the area of origin water rights will not be as valuable as more senior water rights and will be more difficult to market. It may be possible to sell some area-of-origin water to exporters during dry years. Selling Water Rights from CPG Purchase. Under terms of the Water Agreement (WDWCA, 2010), transfer of JPA water rights prior to year 2040 is limited to the number of days of Term 91 or other diversion prohibition multiplied by 159 ac-ft/day minus the amount of water actually diverted under the CPG agreement. Therefore, water sales could only be made during years with Term 91 restrictions and could be further limited by this clause in the Water Purchase Agreement. Taking into considerations the above limitations on transferring CPG purchase origin water, selling this water should be feasible during dry years. This would apply to: Water the City has purchased, but not put to use. Conserved water after the City has put the CPG water rights to beneficial use Treated wastewater Establishing a Precedent through Local Transfers and Use. In order to better preserve the rights it has and to establish the rights to transfer water, the City should endeavor to put as much water to local beneficial D-10 Final Recycle Water Reuse Report_ docx
339 Recycle Water Opportunities Evaluation Appendix D use as possible. Supplying recycled water to uses that could easily be switched back to groundwater supply would be one of the best ways to accomplish this. The potential users were described earlier, and would include: Local agricultural irrigators near Willow Slough Bypass Swanston Ranch Yolo Wildlife Area City-owned farmland south of Willow Slough Bypass Water Conservation Considerations. The City should document and formally notify the SWRCB regarding the water savings it has already accomplished. Conservation efforts should be consistent with the urban water management plan referenced in the area-of-origin water rights permit Standard Term 29A. Updates to the City s 2010 Urban Water Management Plan and Groundwater Management Plan (GWMP) should document planned water conservation measures and state that one of the intentions is to provide transferrable water. Real water savings should then be documented as conservation measures are implemented. Yolo County Water Transfer Ordinance Considerations. A permit application and approval by the Yolo County Board of Supervisors would be required for transfers utilizing groundwater substitution. This should probably be arranged at a planning level so that approval would be in place. D.9 Conclusions and Recommendations The City s portion of its CPG purchase rights could be worth as much as $1,000,000 per year on the open market in drought years. Other sources of potentially marketable water could also bring revenue to the City. Maintaining the flexibility to perform water transfers could provide funds to help partially offset costs of new surface water rights and tertiary treatment. The most important recommendation is for the City to plan ahead and set itself up for the ability to sell water, whether it chooses to or not in the future. Filings and other actions should be undertaken to document water savings from prior conservation efforts and to provide notice that the City may be considering transferring the conserved water in the future. Possible detailed action items for consideration are as follows: Implement conservation in coordination with water rights and water marketing considerations Document all conserved water with SWRCB Earmark conserved water and recycled water as potentially transferrable in future updates to the City s 2010 Urban Water Management Plan and GWMP. Work with Yolo County to set up conditions for approval of future water transfers Pursue local agricultural use of recycled water and document any usage as offsetting groundwater pumping Contact potential buyers for interim water sales Contact potential buyers for future dry year option contracts Implement ASR to provide a greater amount of high quality water during dry years Implement local urban water reuse projects if economical Document all other actions that generate transferrable water D-11 Final Recycle Water Reuse Report_ docx
340 Recycle Water Opportunities Evaluation Appendix D The City should also establish precedence to beneficial use of water through one or more of the following: Use of recycled water to irrigate City-owned farmland Selling treated effluent to Swanston Ranch Selling treated effluent to other agricultural lands close to the existing point of discharge Water marketing is a complex subject with more details than can be addressed within the scope of this IWRS. Recommendations for next steps are provided in Section 6. D-12 Final Recycle Water Reuse Report_ docx
341 APPENDIX J Water Conservation Ordinance
342 (THIS PAGE LEFT BLANK INTENTIONALLY)
343


344
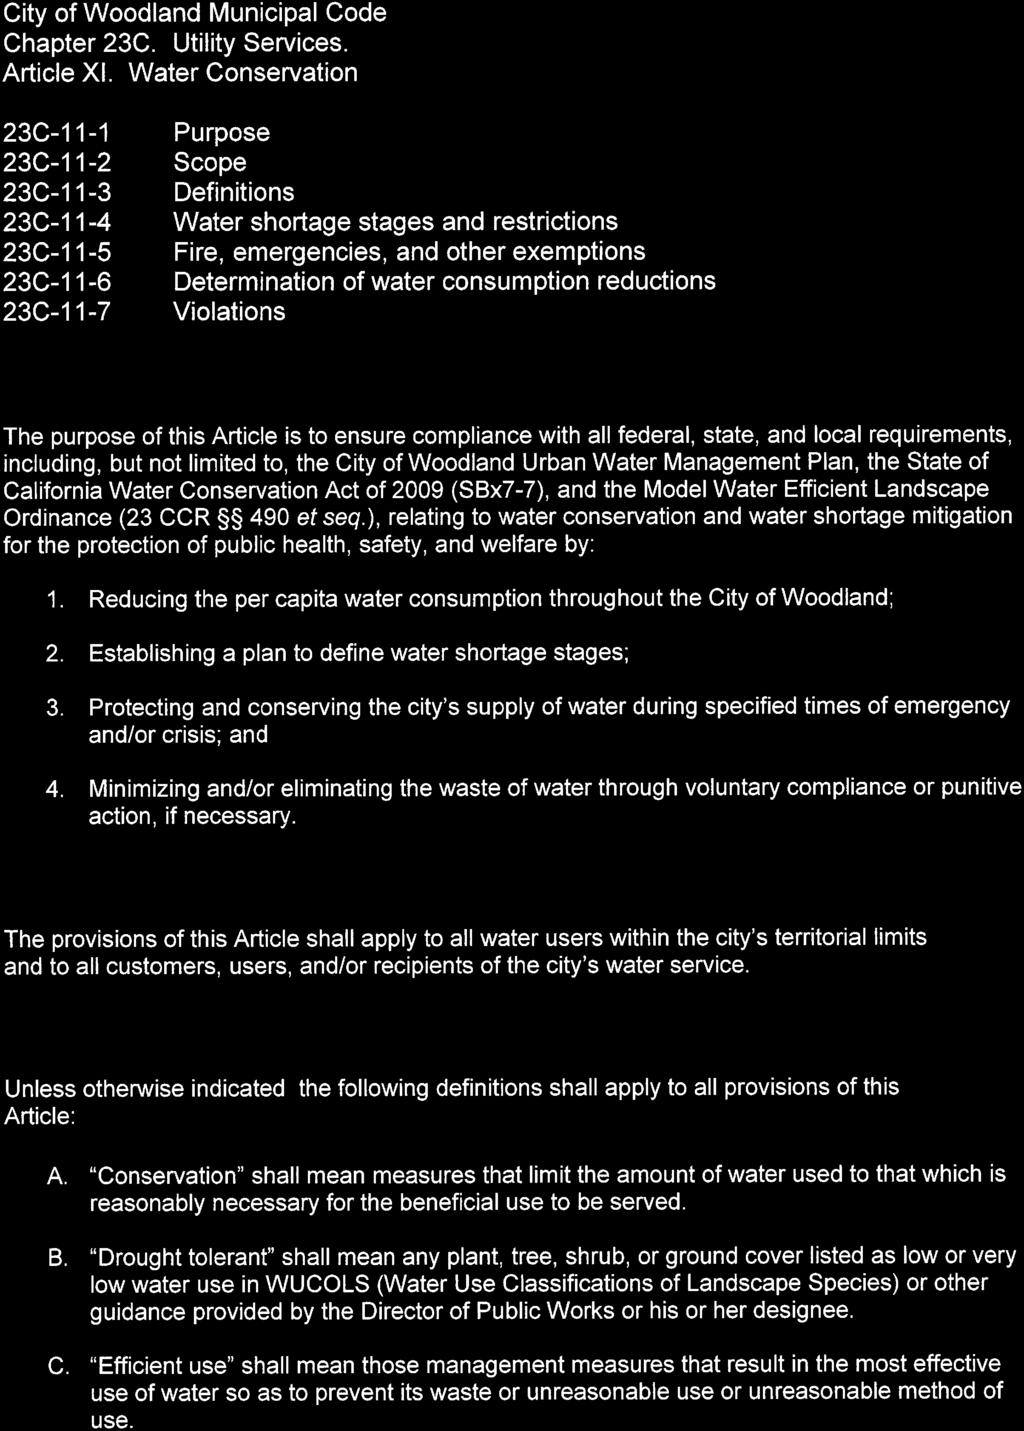
345
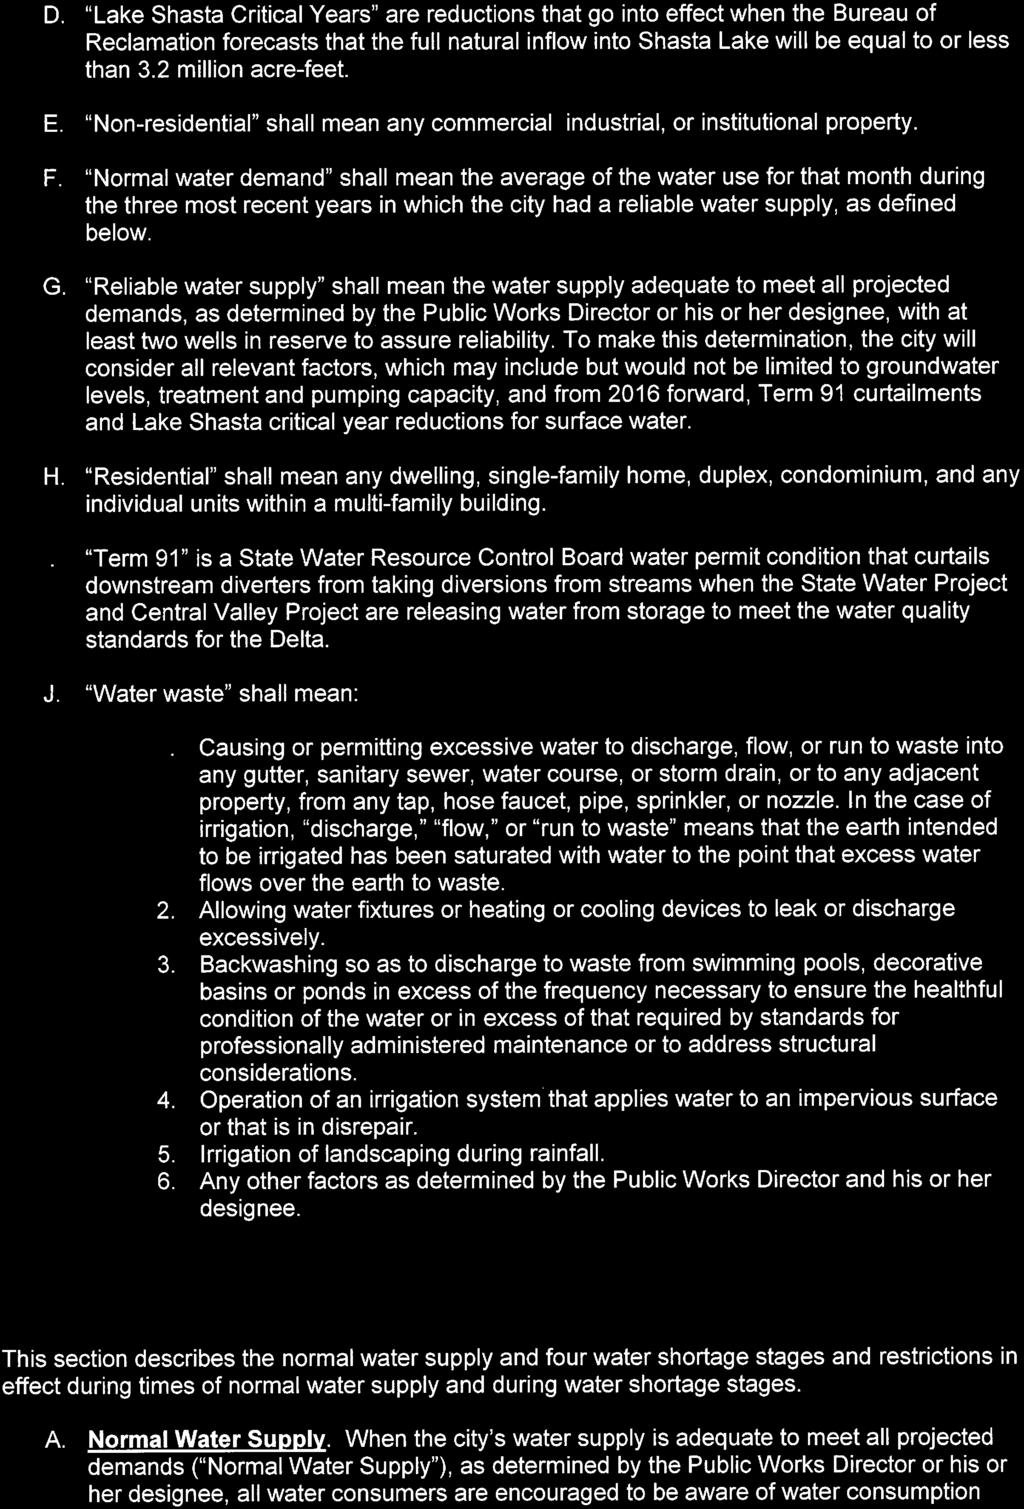
346
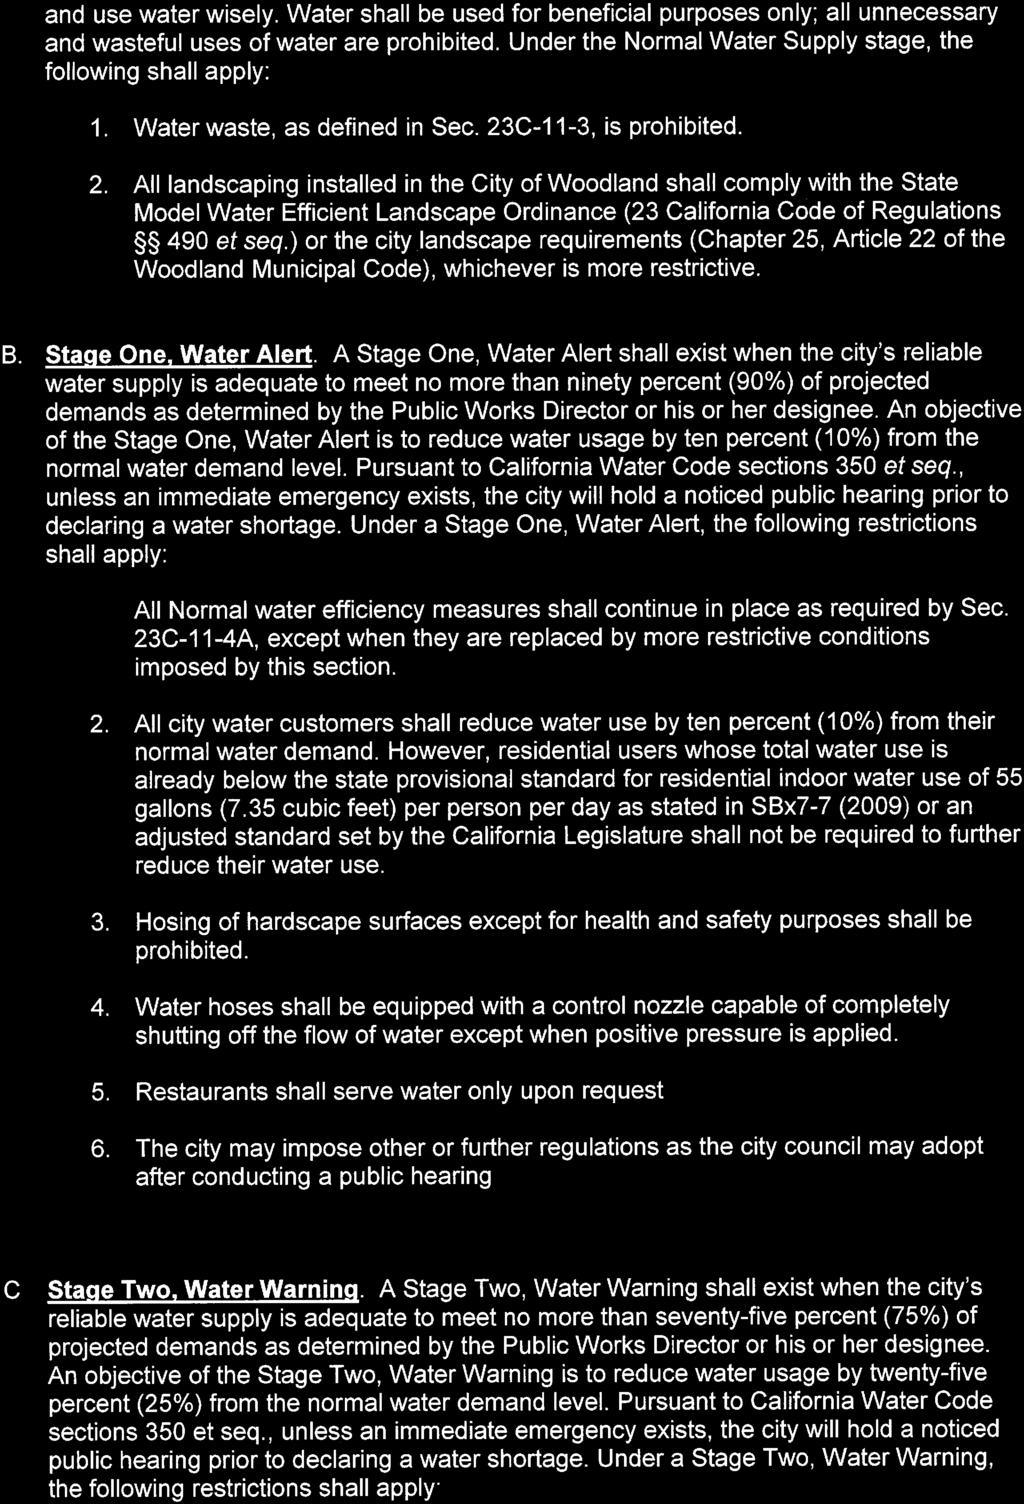
347
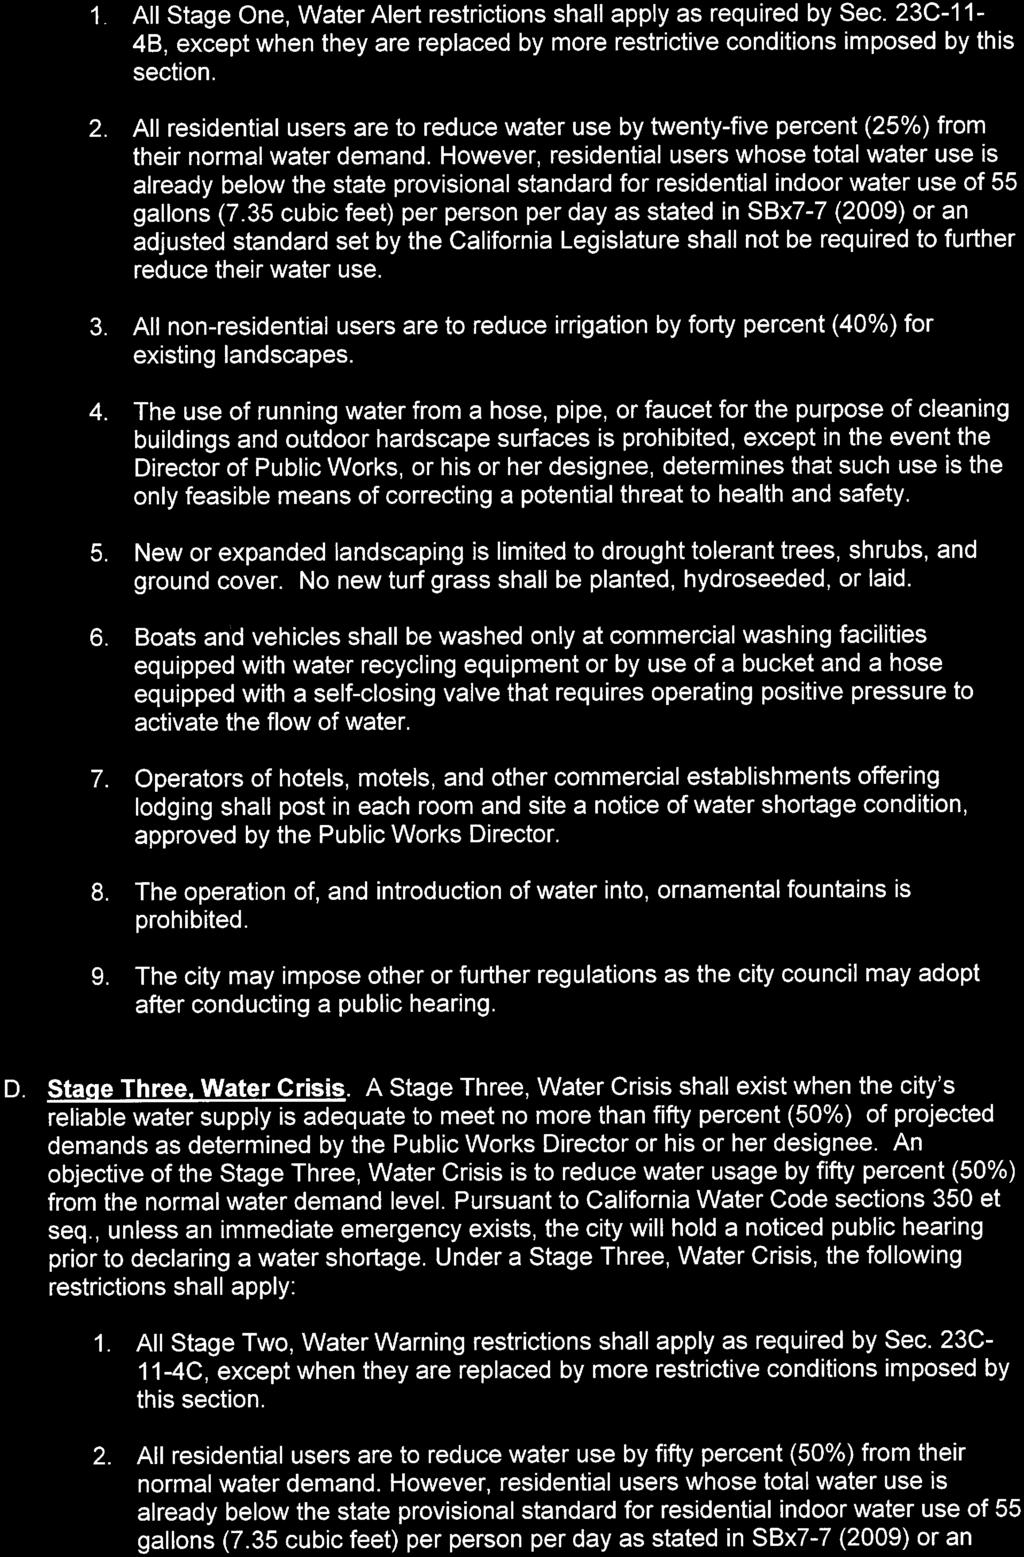
348
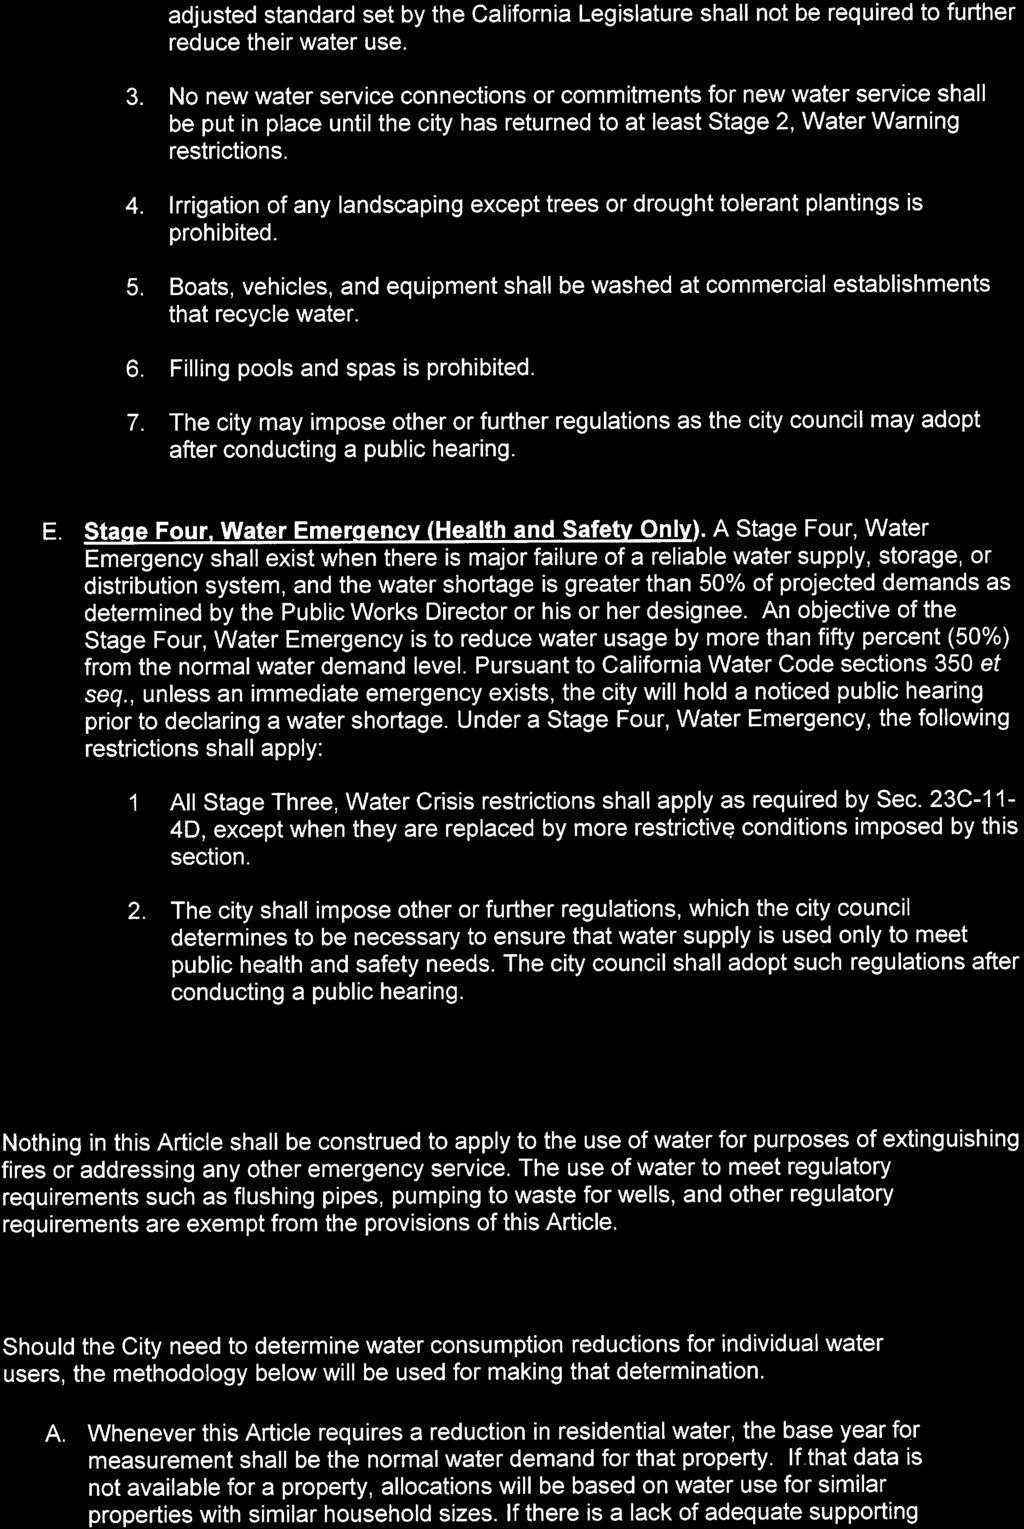
349
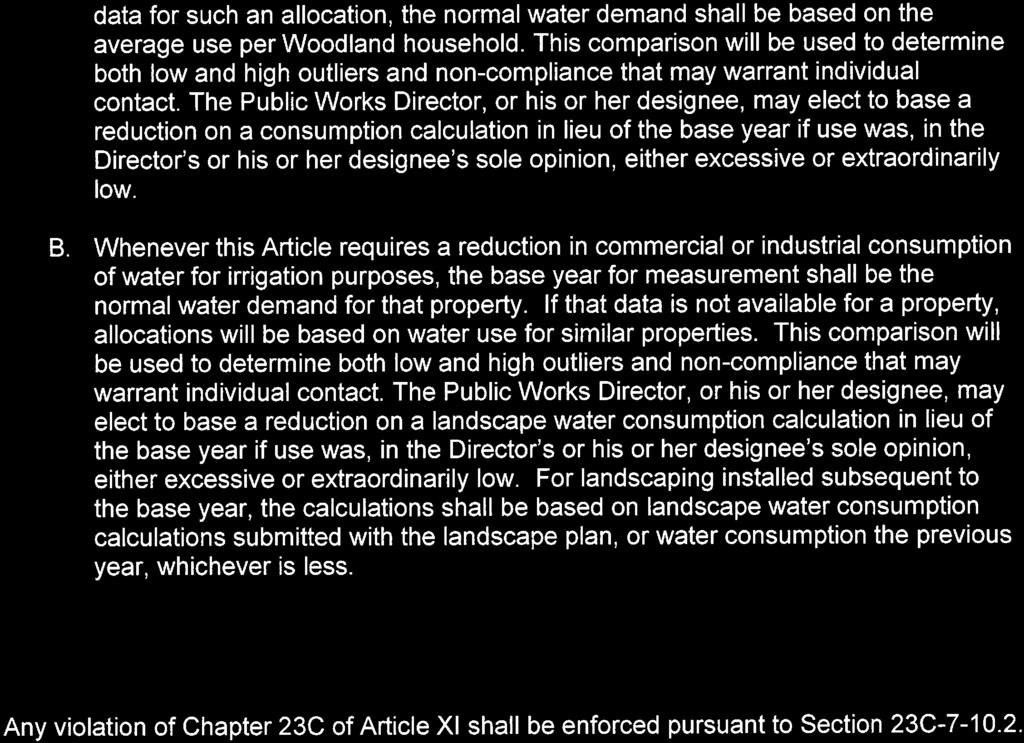
350
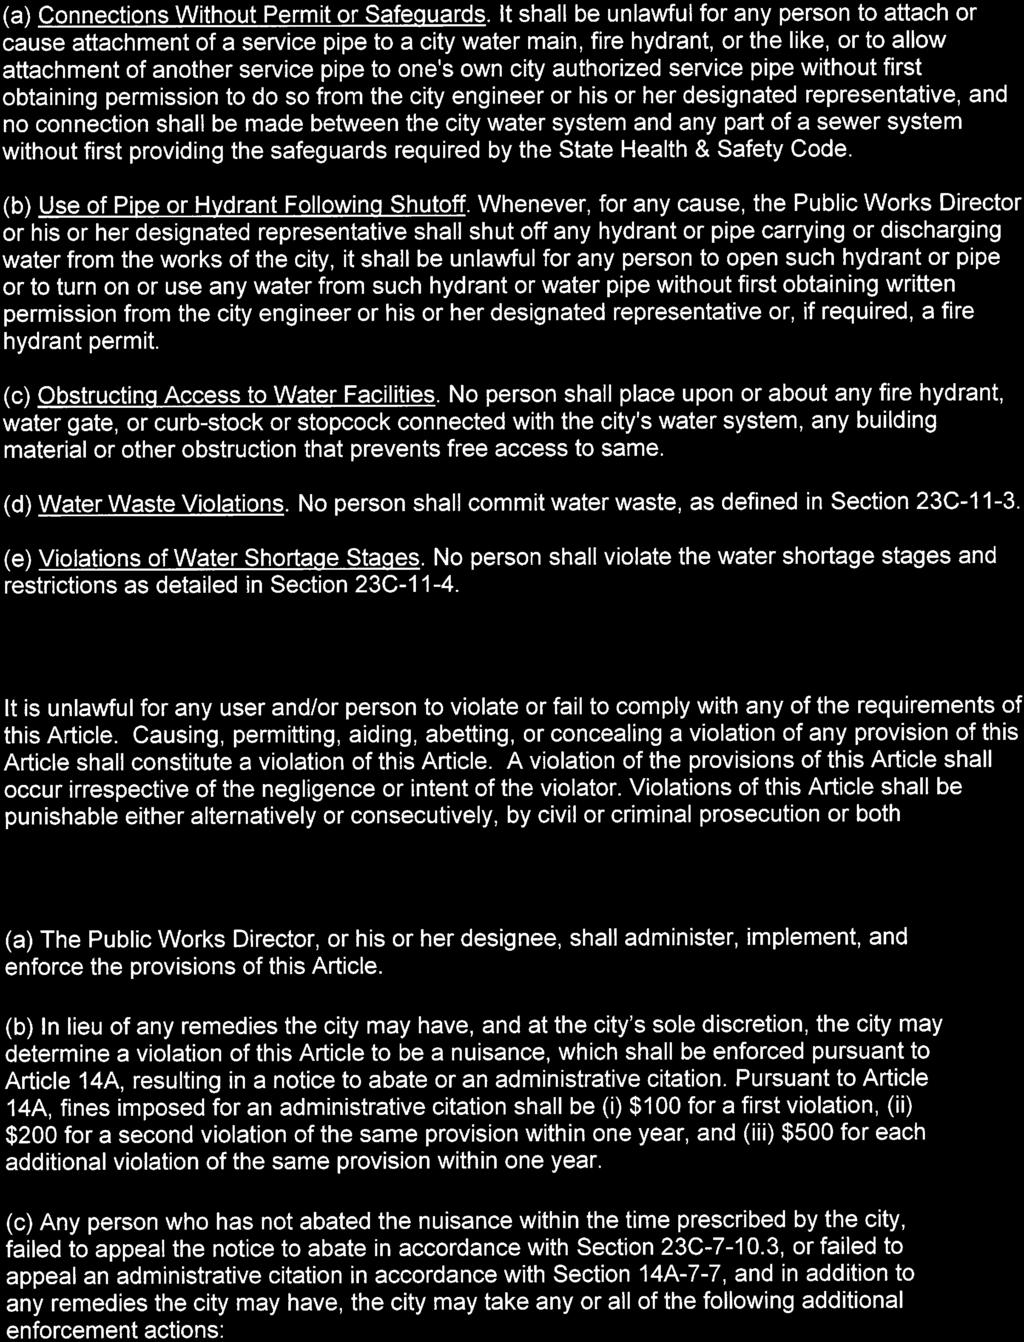
351
352
353 APPENDIX K UWMP Adoption Resolution
354 (THIS PAGE LEFT BLANK INTENTIONALLY)

355

356
357 (THIS PAGE LEFT BLANK INTENTIONALLY)

358
FINAL - MAY 2016 CITY OF ROSEVILLE Urban Water Management Plan
 FINAL - MAY 2016 CITY OF ROSEVILLE 2015 Urban Water Management Plan (THIS PAGE LEFT BLANK INTENTIONALLY) Final 2015 Urban Water Management Plan Prepared for The City of Roseville May 2016 415-12-15-26
UWMP Checklist Arranged by Subject
 Checklist Arranged by CWC 10620(b) 10620(d)(2) Requirement Every person that becomes an urban water supplier shall adopt an urban water management plan within one year after it has become an urban water
Notice of Public Hearing. Notice of Public Hearing
 2015 URBAN WATER MANAGEMENT PLAN Table 8-2: Notification to Cities and Counties Retail: Notification to Cities and Counties City Name 60 Day Notice Notice of Public Hearing Dana Point Mission Viejo County
The City and MID adopted this 2010 UWMP in Copies of the adoption resolutions are included in Appendix B. ES-1
 ES.1 INTRODUCTION This (UWMP) has been prepared for the City of Modesto (City) and the Modesto Irrigation District (MID) by West Yost Associates (West Yost) as a joint UWMP. This 2010 UWMP for the City
2015 Urban Water Management Plan
 East Niles Community Services District 2015 Urban Water Management Plan June 2016 Prepared for: East Niles Community Services District 1417 Vale Street Bakersfield, CA 93306 Prepared by: MKN & Associates
SB 606 (Hertzberg) Summary As Chaptered on 5/31/18
 Summary As Chaptered on 5/31/18") SB 606 (Hertzberg) Summary As Chaptered on 5/31/18 Urban Water Use Objectives and Water Use Reporting Requirements: SB 606 requires the State Water Resources Control Board (State Water Board) and the Department
SB 606 (Hertzberg) Summary As Chaptered on 5/31/18 Urban Water Use Objectives and Water Use Reporting Requirements: SB 606 requires the State Water Resources Control Board (State Water Board) and the Department
UWMP Standardized Tables. Livermore District Urban Water Management Plan Appendix H
 UWMP Standardized Tables Livermore District 2015 Urban Water Management Plan Appendix H Table 2-1 Retail Only: Public Water Systems Public Water System Number Public Water System Name Number of Municipal
2015 Urban Water Management Plan
 2015 Urban Water Management Plan DRAFT Temescal Valley Water District 22646 Temescal Canyon Road Corona, California 92883 (951) 277-1414 December 2017 Prepared by: 2015 Urban Water Management Plan Page
UWMP Standardized Tables. King City District Urban Water Management Plan Appendix H
 UWMP Standardized Tables King City District 2015 Urban Water Management Plan Appendix H Table 2-1 Retail Only: Public Water Systems Public Water System Number Public Water System Name Number of Municipal
2015 Urban Water Management Plan for District 40
 2015 Urban Water Management Plan for District 40 County of Los Angeles Department of Public Works Los Angeles County Waterworks District No. 40, Antelope Valley Alhambra, California February 2017 Table
Final Draft City of Manteca 2015 Urban Water Management Plan
 10850 Gold Center Drive, Suite 350 Rancho Cordova, CA 95670 916-858-2700 916-858-2754 (Fax) Final Draft 2015 Urban Water Management Plan July 2016 Prepared for 1001 W. Center St. Manteca, California 95337
This page is intentionally left blank.
 This page is intentionally left blank. STATE OF CALIFORNIA CALIFORNIA NATURAL RESOURCES AGENCY EDMUND G. BROWN JR., Governor DEPARTMENT OF WATER RESOURCES 1416 NINTH STREET, P.O. BOX 942836 SACRAMENTO,
INDIAN WELLS VALLEY WATER DISTRICT 2010 URBAN WATER MANAGEMENT PLAN MAY Prepared by
 INDIAN WELLS VALLEY WATER DISTRICT (760) 375-5086 500 WEST RIDGECREST BOULEVARD POST OFFICE BOX 1329 RIDGECREST, CALIFORNIA 93556 RIDGECREST, CALIFORNIA 93556-1329 INDIAN WELLS VALLEY WATER DISTRICT 2010
2O15 Urban Water Management Plan
 2O15 Urban Water Management Plan CITY OF SANTA ROSA 2015 URBAN WATER MANAGEMENT PLAN PREPARED BY: In conjunction with: West Yost Associates & Maddaus Water Management JUNE 2016 This page intentionally
UWMP Standardized Tables. City of Hawthorne District Urban Water Management Plan Appendix H
 UWMP Standardized Tables City of Hawthorne District 2015 Urban Water Management Plan Appendix H Table 2-1 Retail Only: Public Water Systems Public Water System Number Public Water System Name Number of
UWMP Standardized Tables. Chico-Hamilton City District Urban Water Management Plan Appendix H
 UWMP Standardized Tables Chico-Hamilton City District 2015 Urban Water Management Plan Appendix H Table 2-1 Retail Only: Public Water Systems Public Water System Number Public Water System Name Number
City of Rio Vista Urban Water Management Plan 2010
 1. Plan Preparation: City of Rio Vista Urban Water Management Plan 2010 The City of Rio Vista (City), as defined in the California Waster Code section 10617, qualifies as an "Urban Water Supplier". The
Las Virgenes Municipal Water District 2010 Urban Water Management Plan Contact Sheet
 2010 Urban Water Management Plan Contact Sheet Date plan submitted to the Department of Water Resources: June 29, 2011 Name of person(s) preparing this plan: Mr. David Lippman, P.E., Director, Facilities
2015 URBAN WATER MANAGEMENT PLAN VOLUME 1 FINAL REPORT
 CITY OF HEMET 2015 URBAN WATER MANAGEMENT PLAN VOLUME 1 FINAL REPORT JUNE 2016 Prepared by CITY OF HEMET 2015 URBAN WATER MANAGEMENT PLAN VOLUME 1 FINAL REPORT JUNE 2016 PREPARED FOR CITY OF HEMET 445
MAKING WATER CONSERVATION A CALIFORNIA WAY OF LIFE
 Public Review Draft MAKING WATER CONSERVATION A CALIFORNIA WAY OF LIFE Primer of 2018 Legislation on Water Conservation and Drought Planning PREPARED BY California Department of Water Resources AUGUST
UWMP Standardized Tables. Salinas District Urban Water Management Plan Appendix H
 UWMP Standardized Tables Salinas District 2015 Urban Water Management Plan Appendix H Table 2-1 Retail Only: Public Water Systems Public Water System Number Public Water System Name Number of Municipal
UWMP Standardized Tables. Palos Verdes District Urban Water Management Plan Appendix H
 UWMP Standardized Tables Palos Verdes District 2015 Urban Water Management Plan Appendix H Table 2-1 Retail Only: Public Water Systems Public Water System Number Public Water System Name Number of Municipal
1.1 Introduction
 Table of Contents Executive Summary ES.1 Introduction... ES-1 ES.2 Plan Adoption... ES-1 ES.3 Plan Overview... ES-2 ES.3.1 Service Area... ES-2 ES.3.2 Water Demand... ES-3 ES.3.3 Projected Water Supply...
UWMP Standardized Tables. Dominguez District Urban Water Management Plan Appendix H
 UWMP Standardized Tables Dominguez District 2015 Urban Water Management Plan Appendix H Table 2-1 Retail Only: Public Water Systems Public Water System Number Public Water System Name Number of Municipal
APPENDIX A. Legislative Requirements. Urban Water Management Planning Act SBx7-7 Water Conservation Act of 2009 SB1478
 APPENDIX A Legislative Requirements Urban Water Management Planning Act SBx7-7 Water Conservation Act of 2009 SB1478 Section K: California Water Code, Division 6, Part 2.6: Urban Water Management Planning
UWMP Standardized Tables. Los Altos Suburban District Urban Water Management Plan Appendix H
 UWMP Standardized Tables Los Altos Suburban District 2015 Urban Water Management Plan Appendix H Table 2-1 Retail Only: Public Water Systems Public Water System Number Public Water System Name Number of
UWMP Standardized Tables. Kern River Valley District Urban Water Management Plan Appendix H
 UWMP Standardized Tables Kern River Valley District 2015 Urban Water Management Plan Appendix H Table 2-1 Retail Only: Public Water Systems Public Water System Number Public Water System Name Number of
2015 Urban Water Management Plan
 Final for the San Lorenzo Valley Water District Prepared by 12/2/2016 Table of Contents TABLE OF CONTENTS Table of Contents... i List of Tables... v List of Figures... vi List of Terms and Acronyms...
2015 URBAN WATER MANAGEMENT PLAN Final Report
 PREPARED FOR Coachella Valley Water District 2015 URBAN WATER MANAGEMENT PLAN Final Report July 1, 2016 This page left intentionally blank TABLE OF CONTENTS Section 1 Introduction and Overview... 1-1 1.1
CHAPTER 4 Water Demand
 CHAPTER 4 4.1 OVERVIEW OF WATER USE As described in Chapter 2, the City s water service area consists of one large contiguous service area and several outlying non-contiguous service areas. The City is
City of Anaheim. Amendments to 2015 Urban Water Management Plan
 City of Anaheim Amendments to 2015 Urban Water Management Plan December 2016 City of Anaheim Amendments to 2015 Urban Water Management Plan (Plan) Contents Revisions to Section 5.2.3 - Provide an outline
CHAPTER 3 Water Supply
 CHAPTER 3 3.1 WATER SUPPLY OVERVIEW This chapter describes the sources of water available to the City and MID. The chapter includes a description of each water source, including limitations, water quality
Eastern Municipal Water District 2015 Urban Water Management Plan
 FINAL Prepared by June 2016 Table of Contents EXECUTIVE SUMMARY ES-1 PLAN PURPOSE AND OVERVIEW... XI ES-2 SERVICE AREA AND WATER SUPPLIES... XII ES-3 WATER DEMANDS... XIII ES-4 WATER SUPPLY FORECAST...
California Water Service Urban Water Management Plan. Antelope Valley District June Quality. Service. Value. Quality. Service. Value.
 2015 Urban Water Management Plan June 2016 Quality. Service. Value. Quality. Service. Value Table of Contents List of Tables... 5 List of Figures... 7 List of Acronyms... 8 Chapter 1 Introduction and
2015 Urban Water Management Plan
 2015 Urban Water Management Plan FINAL June 2016 Prepared by Page intentionally left blank. 2015 Urban Water Management Plan Final Prepared By: June 27, 2016 Sweetwater Authority 2015 Urban Water Management
Urban Water MANAGEMENT PLAN UPDATE. Prepared by:
 2015 Urban Water MANAGEMENT PLAN UPDATE Draft Report May 2016 Prepared by: Table of Contents 1 Introduction and Executive Summary... 1-1 1.1 Plan Preparation... 1-1 1.2 District Overview... 1-1 1.3 District
2015 Urban Water Management Plan
 Prepared for City of Stockton 2015 Urban Water Management Plan July 2016 11020 White Rock Road, Suite 200 Rancho Cordova, California 95670 Tel: 916-444-0123 Fax: 916-635-8805 www.brownandcaldwell.com
City of Arcata Urban Water Management Plan 2015
 City of Arcata Urban Water Management Plan 2015 Completed: May 2016 UPDATED FEBRUARY 2018 Table of Contents Chapter 1 Introduction and Overview... 6 Chapter 2 Plan Preparation... 7 2.1 Basis for Preparing
California Water Service Urban Water Management Plan. Dominguez District June Quality. Service. Value. Quality. Service. Value.
 2015 Urban Water Management Plan June 2016 Quality. Service. Value. Quality. Service. Value Table of Contents List of Tables... 5 List of Figures... 8 List of Acronyms... 9 Chapter 1 Introduction and
California Water Service Urban Water Management Plan. Visalia District June Quality. Service. Value
 2015 Urban Water Management Plan June 2016 Quality. Service. Value Table of Contents List of Tables... 5 List of Figures... 7 List of Acronyms... 8 Chapter 1 Introduction and Overview... 9 1.1 Background
Mammoth Community Water District 2015 URBAN WATER MANAGEMENT PLAN
 Mammoth Community Water District 2015 URBAN WATER MANAGEMENT PLAN January 2017 (This page intentionally blank.) Table of Contents Executive Summary... 1 ES.1 Scope and Purpose of the 2015 Urban Water Management
MILNER-VILLA CONSULTING. Appendix E. UWMP Required Tables. Draft UWMP/AWMP, May 2016 Casitas Municipal Water District
 MILNER-VILLA CONSULTING Appendix E UWMP Required Tables Draft UWMP/AWMP, May 2016 Casitas Municipal Water District Table 2 2: Plan Identification Select Only One Individual UWMP Type of Plan Name of RUWMP
California Water Service Urban Water Management Plan. East Los Angeles District June Quality. Service. Value
 2015 Urban Water Management Plan June 2016 Quality. Service. Value Table of Contents List of Tables... 5 List of Figures... 8 List of Acronyms... 9 Chapter 1 Introduction and Overview... 11 1.1 Background
California Water Service Urban Water Management Plan. Bakersfield District June Quality. Service. Value
 2015 Urban Water Management Plan June 2016 Quality. Service. Value Table of Contents List of Tables... 7 List of Figures... 9 List of Acronyms... 10 Chapter 1 Introduction and Overview... 11 1.1 Background
Cost Sharing Agreement For The Los Vaqueros Reservoir Expansion Project Planning. ACWD Board Meeting December 8, 2016
 Cost Sharing Agreement For The Los Vaqueros Reservoir Expansion Project Planning ACWD Board Meeting December 8, 2016 Los Vaqueros Reservoir (LV) Owned and operated by CCWD Off-stream reservoir, adjacent
LONG-TERM CONSERVATION FRAMEWORK BRIEFING DEPARTMENT OF WATER RESOURCES. EDUCATION ADVOCACY LEADERSHIP March 15, 2019
 LONG-TERM CONSERVATION FRAMEWORK BRIEFING DEPARTMENT OF WATER RESOURCES EDUCATION ADVOCACY LEADERSHIP March 15, 2019 THANK YOU TO OUR HOST THANK YOU TO OUR SPONSORS MEDIA CONTRIBUTER Dawn Hodson, reporter
2015 Urban Water Management Plan for Mojave Water Agency
 Courtesy: Google Earth FINAL 2015 Urban Water Management Plan for Mojave Water Agency Prepared by Kennedy/Jenks Consultants June 2016 300 North Lake Avenue, Suite 1020 Pasadena, California 91101 626-568-4300
Suisun-Solano Water Authority Urban Water Management Plan
 Suisun-Solano Water Authority Urban Water Management Plan FINAL August 8, 2016 TABLE OF CONTENTS LIST OF FIGURES...4 LIST OF TABLES...5 LIST OF ACRONYMS...6 1. INTRODUCTION AND OVERVIEW...8 1.1 Background
20. UTILITIES AND SERVICE SYSTEMS
 June 28, 2018 Page 20-1 20. UTILITIES AND SERVICE SYSTEMS This EIR chapter describes existing conditions for and distribution, collection and, and solid waste disposal and recycling in the planning area.
Urban Water Management Plan
 DR af t 2015 Urban Water Management Plan June 8, 2016 2015 Urban Water Management Plan Santee, California June 8, 2016 Prepared by: 9665 Chesapeake Dr., Suite 201 San Diego, CA 92123 Project Participants
2015 Urban Water Management Plan. for the City of Lompoc
 2015 Urban Water Management Plan for the City of Lompoc June 21, 2016 Final 2015 Urban Water Management Plan Final for the City of Lompoc Prepared Under the Responsible Charge of: Ron Munds Associate Planner,
Draft 2015 Urban Water Management Plan
 Prepared for Sacramento County Water Agency Draft 2015 Urban Water Management Plan May 2016 Northgate 880 80 50 Sacramento Arden Park Vista 50 Rancho Cordova 50 Mather Sunrise 99 SW Tract Laguna Vineyard
2015 Urban Water Management Plan for the City of Redwood City
 2015 Urban Water Management Plan for the City of Redwood City June 2016 1. INTRODUCTION AND PLAN PREPARATION... 1 1.1 Compliance with the UWMP Act, Including Changes Since 2010... 1 1.2 Coordination and
DWR s Sustainable Groundwater Management Implementation Groundwater Sustainability Plan (GSP) & Alternative (Alt) Emergency Regulations
 & Alternative (Alt) Emergency Regulations") DWR s Sustainable Groundwater Management Groundwater Plan (GSP) & (Alt) Emergency Regulations Advisory Group Meetings December 17, 2015 1 Presentation Overview Background Regulation Considerations Next
DWR s Sustainable Groundwater Management Groundwater Plan (GSP) & (Alt) Emergency Regulations Advisory Group Meetings December 17, 2015 1 Presentation Overview Background Regulation Considerations Next
URBAN WATER MANAGEMENT PLAN
 CITY OF POMONA URBAN WATER MANAGEMENT PLAN 2010 Final City of Pomona 2010 Urban Water Management Plan Prepared by: July 2011 City of Pomona 2010 Urban Water Management Plan FINAL Table of Contents Section
The report is organized according to the recommended format established by the California Department of Water Resources (DWR) as follows:
 as follows:") October 31, 2011 City of West Sacramento 1110 West Capitol Ave., 2nd Floor West Sacramento, CA 95691 Attention: Subject: Mr. Vin Cay 2010 Urban Water Management Plan Dear Mr. Cay: We are pleased to submit
October 31, 2011 City of West Sacramento 1110 West Capitol Ave., 2nd Floor West Sacramento, CA 95691 Attention: Subject: Mr. Vin Cay 2010 Urban Water Management Plan Dear Mr. Cay: We are pleased to submit
6.7 Desalinated Water Opportunities Exchanges or Transfers Future Water Projects Summary of Existing and Planned
 TABLE OF CONTENTS LIST OF FIGURES... 4 LIST OF TABLES... 4 LIST OF ACRONYMS... 5 1. INTRODUCTION AND OVERVIEW... 6 1.1 Background and Purpose... 6 1.2 Urban Water Management Planning and the California
Carollo Engineers, Inc N. Ingram Avenue, Suite 112 Fresno, CA (559)
") 2010 URBAN WATER MANAGEMENT PLAN June 2011 Prepared By Carollo Engineers, Inc. 7580 N. Ingram Avenue, Suite 112 Fresno, CA 93711 (559) 436-6616 pw://carollo/documents/client/ca/merced/8098b00/deliverables/cover.docx
2010 URBAN WATER MANAGEMENT PLAN June 2011 Prepared By Carollo Engineers, Inc. 7580 N. Ingram Avenue, Suite 112 Fresno, CA 93711 (559) 436-6616 pw://carollo/documents/client/ca/merced/8098b00/deliverables/cover.docx
City of Pittsburg 2015 Urban Water Management Plan Final Draft
 Final Draft June 2016 Final Draft City Council Ben Johnson, Mayor Will Casey, Vice Mayor Pete Longmire Sal Evola Merl Craft City Manager Joe Sbranti Prepared by: RMC Water and Environment Walter C. Pease,
MCKINLEYVILLE COMMUNITY SERVICES DISTRICT 2015 URBAN WATER MANAGEMENT PLAN
 MCKINLEYVILLE COMMUNITY SERVICES DISTRICT 2015 URBAN WATER MANAGEMENT PLAN July 6, 2016 Approved by MCSD Board of Directors July 6, 2016 Prepared by: MCSD Staff McKinleyville Community Services District
URBAN WATER MANAGEMENT PLAN UPDATE FOR 2010
 URBAN WATER MANAGEMENT PLAN UPDATE FOR 2010 City of Shafter Public Works Department 336 Pacific Avenue Shafter, CA 93263 Michael James, P.E. Public Works Director City of Shafter R.C.E. #60021 Exp. 6-30-12
CITY OF VACAVILLE URBAN WATER SHORTAGE CONTINGENCY PLAN FINAL
 CITY OF VACAVILLE URBAN WATER SHORTAGE CONTINGENCY PLAN FINAL AN AMENDMENT TO THE URBAN WATER MANAGEMENT PLAN ADOPTED JANUARY 1991 REVISED AUGUST 214 Prepared by: City of Vacaville Utilities Department
Eric Oppenheimer February 25, 2015
 http://saveourwater.com Eric Oppenheimer February 25, 2015 Emergency Regulation Background Data Collection Conservation Results Comments and Potential Next Steps Jan 17, 2014 April 25, 2014 May 23, 2014
Water Conservation Plan
 Water Conservation Plan Adopted April 21, 2014 Town Manager: Mike Slye Town of Trophy Club 100 Municipal Drive Trophy Club, TX 76262 (682) 831-4610 Town of Trophy Club Public Improvement District Public
URBAN WATER MANAGEMENT PLAN
 URBAN WATER MANAGEMENT PLAN 2 0 1 5 U P JUNE 2016 PREPARED BY: D A T E Table of Contents 1.0 Introduction and Executive Summary...1-1 Plan Preparation... 1-1 District Overview... 1-2 District Supplies
Appendix D: Public Meeting Notice
 California Water Service 2015 Urban Water Management Plan Kern River Valley District Appendix D: Public Meeting Notice Notice of Intent Proof of Publication Public Meeting Agenda Public Meeting Comment
2015 Urban Water Management Plan. Adopted: June 14, 2016
 2015 Urban Water Management Plan Adopted: June 14, 2016 This page intentionally left blank City of Folsom 2015 Urban Water Management Plan Final June 2016 Prepared by: [This page intentionally left blank]
CHAPTER 10 Water Shortage Contingency Plan
 CHAPTER 10 10.1 OVERVIEW Water Code 10632 The plan shall provide an urban water shortage contingency analysis which includes each of the following elements which are within the authority of the urban water
Update on Conservation and Executive Order B Erik Ekdahl Director Office of Research, Planning, and Performance
 Update on Conservation and Executive Order B-40-17 Erik Ekdahl Director Office of Research, Planning, and Performance May 18, 2017 Background 5 years of Drought Mandatory Conservation Framework Report
MONTE VISTA WATER DISTRICT 2015 URBAN WATER MANAGEMENT PLAN
 MONTE VISTA WATER DISTRICT 2015 URBAN WATER MANAGEMENT PLAN PUBLIC REVIEW DRAFT MAY 2016 Prepared by Monte Vista Water District Staff: General Manager Public Affairs Director/ Water Use Efficiency Practitioner
2003 ANNUAL REPORT on INTERBASIN TRANSFERS For RTP South and the Towns of Cary, Apex, and Morrisville
 2003 ANNUAL REPORT on INTERBASIN TRANSFERS For RTP South and the Towns of Cary, Apex, and Morrisville Prepared for: Town of Apex Town of Cary Town of Morrisville RTP South/Wake County Submitted to: North
URBAN WATER MANAGEMENT PLAN JUNE Prepared By
 2015 URBAN WATER MANAGEMENT PLAN F I N A L JUNE 2016 Prepared By This page intentionally left blank. Final Prepared by: June 2016 This page intentionally left blank. Page ii Table of Contents Executive
Ready or Not Conservation Is Here & You Will Have to Implement It
 Ready or Not Conservation Is Here & You Will Have to Implement It Gerry Nakano Presentation Outline Why Conserve Water? Benefits Interface with 2010 UWMP Update and SB 7 Legislation Examples/Case Studies
Water: What New Regulations May Mean for You. December 9, 2015
 Water: What New Regulations May Mean for You December 9, 2015 Speakers Sarge Green, California Water Institute (Moderator) Russell McGlothlin, Brownstein, Hyatt, Farber, Schreck, LLP Rich Juricich, DWR
2010 Urban Water Management Plan San Dimas
 Final Report 2010 Urban Water Management Plan San Dimas Corporate Office 630 E. Foothill Blvd. San Dimas CA 91773 August 2011 Final Report 2010 Urban Water Management Plan San Dimas Corporate Office 630
City of Morro Bay Urban Water Management Plan
 City of Morro Bay 2015 Urban Water Management Plan Prepared by: MNS Engineers 811 El Capitan Way, Suite 130 San Luis Obispo CA 93401 June 24, 2016 City of Morro Bay i Contents INTRODUCTION AND OVERVIEW...
City of Escondido 2010 Urban Water Management Plan. July 2011
 City of Escondido 2010 Urban Water Management Plan July 2011 City of Escondido 2010 Urban Water Management Plan July 2011 Project No. 139583 9665 Chesapeake Drive, Suite 201 San Diego, California 92123
Water Shortage Contingency Planning
 Section 8: T Water Shortage Contingency Planning he Act requires water agencies to incorporate a water shortage contingency plan (WSCP) focusing on the allocation of water supplies and the management of
URBAN WATER MANAGEMENT PLAN 2015 UPDATE. Zone 3 A Wholesale Water Agency SAN LUIS OBISPO COUNTY FLOOD CONTROL AND WATER CONSERVATION DISTRICT
 URBAN WATER MANAGEMENT PLAN 2015 UPDATE Zone 3 A Wholesale Water Agency SAN LUIS OBISPO COUNTY FLOOD CONTROL AND WATER CONSERVATION DISTRICT Prepared By: Wallace Group June 2016 TABLE OF CONTENTS CHAPTER
2015 URBAN WATER MANAGEMENT PLAN FINAL
 2015 URBAN WATER MANAGEMENT PLAN FINAL B&V PROJECT NO. 188535 Black & Veatch Holding Company 2015. All rights reserved. PREPARED FOR JUNE 2016 CALLEGUAS MUNICIPAL WATER DISTRICT 2015 URBAN WATER MANAGEMENT
City of Roseville General Plan 2035, as amended June 2016 (City of Roseville 2016a)
") 4.7 WATER SUPPLY 4.7.1 INTRODUCTION This section evaluates potential impacts associated with demand for water supply associated with implementation of the VillaSport Athletic Club and Spa Project (proposed
4.7 WATER SUPPLY 4.7.1 INTRODUCTION This section evaluates potential impacts associated with demand for water supply associated with implementation of the VillaSport Athletic Club and Spa Project (proposed
1 of 6 9/8/2012 3:47 PM
 1 of 6 9/8/2012 3:47 PM 10608.16. (a) The state shall achieve a 20-percent reduction in urban per capita water use in California on or before December 31, 2020. (b) The state shall make incremental progress
CHAPTER 9 Supply and Demand Comparison
 CHAPTER 9 Water Code 10635,(c) Every urban water supplier shall include, as part of its urban water management plan, an assessment of the reliability of its water service to its customers during normal,
Ventura County Waterworks District No. 8. Amended 2015 Urban Water Management Plan for. Ventura County Waterworks District No. 8
 Ventura County Waterworks District No. 8 Amended 2015 Urban Water Management Plan for Ventura County Waterworks District No. 8 April 2017 RESOLUTION NO. WWD-263 A RESOLUTION OF THE BOARD OF DIRECTORS
Urban Water Management Plan
 North Tahoe Public Utility District Urban Water Management Plan 2015 Board Adopted: 6 13 2017 2 Table of Contents Table of Contents... 3 1 Introduction and Overview... 5 2 Plan Preparation... 7 3 System
Model Drought Contingency Plans
 Model Drought Contingency Plans Table of Contents Model Drought Contingency Plan for Public Water Suppliers Model Drought Contingency Plan for Irrigation Districts Model Drought Contingency Plan for Wholesale
Conn. Agencies Regs d-2 Preparation of plans and schedule for submission
 As of February 1, 2012 Conn. Agencies Regs. 25-32d-2 Preparation of plans and schedule for submission (a) Each water company supplying water to 1,000 or more persons or 250 or more consumers, and any other
8-3. Water Planning and Stewardship. Board of Directors. 4/14/2015 Board Meeting. Subject. Executive Summary. Details
 Board of Directors Water Planning and Stewardship 4/14/2015 Board Meeting Subject Express support for Governor s Executive Order B-29-15; declare Water Supply Condition for 2015; approve implementation
San Mateo Plain Groundwater Basin Assessment Stakeholder Workshop #7 9 NOVEMBER 2017
 San Mateo Plain Groundwater Basin Assessment Stakeholder Workshop #7 9 NOVEMBER 2017 PRESENTATION OVERVIEW Introductions Project Overview Stakeholder Outreach Summary Phase 2 Updates Modeling Activities
CITY OF BEVERLY HILLS PUBLIC WORKS DEPARTMENT MEMORANDUM
 CITY OF BEVERLY HILLS PUBLIC WORKS DEPARTMENT MEMORANDUM TO: FROM: PUBLIC WORKS COMMISSION Debby Figoni, Water Conservation Administrator DATE: May 10, 2018 SUBJECT: Water Efficiency Update ATTACHMENTS:
MEETING HANDOUT. Meeting: Board of Directors Meeting. Date: April 21, 2017
 MEETING HANDOUT Meeting: Board of Directors Meeting Date: April 21, 2017 AMENDED IN ASSEMBLY APRIL 18, 2017 AMENDED IN ASSEMBLY MARCH 23, 2017 california legislature 2017 18 regular session ASSEMBLY BILL
Hollister Urban Area Water and Wastewater Master Plan Update
 Hollister Urban Area Water and Wastewater Master Plan Update City of Hollister, San Benito County Water District, and Sunnyslope County Water District June 2017 Robert H. Ellis NO. 24679 EXP. 12/31/17
POTABLE WATER ELEMENT
 Goal 4.0. Provide current and future residents of the County's utility service areas, and large users of the regional raw water system a cost-effective and equitable potable or raw water supply system
Montecito Water District Drought and Quarterly Water Supply Update
 Montecito Water District Drought and Quarterly Water Supply Update October 2017 December 2017 Board Meeting February 20, 2018 Page 1 Outline 1. Drought Status 2. Total Production & Customer Demands 3.
Prepared by: Fallbrook Public Utility District staff
 Fallbrook Public Utility District 2015 Urban Water Management Plan Prepared by: Fallbrook Public Utility District staff Table of Contents 1. Introduction and Overview... 1 1.1 California Urban Water Management
Santa Cruz Water Department: Water Resources, Conservation, and Water Shortage Contingency Plan. Santa Cruz Neighbors February 18, 2009
 Santa Cruz Water Department: Water Resources, Conservation, and Water Shortage Contingency Plan Santa Cruz Neighbors February 18, 2009 Presentation Overview Overview of City s Water Supply System Challenges
2010 Urban Water Management Plan City of Morro Bay
 P u blic Review Draft Report 2010 Urban Water Management Plan City of Morro Bay Prepared for City of Morro Bay 955 Shasta Ave Morro Bay, CA 93442 June 2011 325 E. Hillcrest Drive Suite 125 Thousand Oaks,
Water Supply Board Briefing. Water Operations Department March 22, 2016
 Water Supply Board Briefing Water Operations Department March 22, 2016 Water Supply Briefing California Water Supply District Water Supply Water Supply Projections Water Supply Schedule 2 California Water
Executive Summary for the CII Task Force Water Use Best Management Practices
 0//0 Executive Summary for the CII Task Force Water Use Best Management Practices Formatted 0 0 0 Background and History California s water demands have begun to reach and, at some times in some places,
California Drought Update. The 2016 CALAFCO Annual Conference Program. Water Status Update: Where Are We? Where Are We Going?
 California Drought Update The 2016 CALAFCO Annual Conference Program Water Status Update: Where Are We? Where Are We Going? October 26, 2016 David Inouye Water Management Branch Chief Department of Water