Draft Background Report. City of Oxnard General Plan
|
|
|
- Evan Jordan
- 6 years ago
- Views:
Transcription


1 Draft Background Report City of Oxnard General Plan April 2006

2 City of Oxnard Background Report prepared by in association with ESA UCSB URS April 2006
3 Please see the next page.
4 Table of Contents C hapter 1 Introduction 1.1 What is a General Plan? What is Covered in the General Plan? Using the General Plan Regional Setting City of Oxnard Overview History Overview of City and County Demographics Organization of the Background Report Chapter 2 Demographics 2.1 Introduction Local and National Demographic Trends Oxnard s Population Change Oxnard s Census 2000 Profile Housing Population Projections and Growth Fiscal Conditions Labor Trends Jobs Cost and Service Standards Chapter 3 Community Development 3.1 Introduction Land Use Existing Oxnard General Plan Land Use Element Zoning General Plan 2020 and Zoning Consistency Current Development Development Potential Local Coastal Program Specific Plans Other City, County, and Regional Plans and Policies Redevelopment Urban Design Community Identity Historical Design Characteristics Street Character Gateways and Landmarks Density and Community Design Growth Management Existing Growth Management Program Existing Land Use Controls Economic Development Real Estate Characteristics Market Demand Profile April 2006 Background Report Page i 0-Oxnard_GP_TOC_2006_04_20 MRD.doc
5 City of Oxnard General Plan Draft Chapter 4 Infrastructure and Community Services 4.1 Introduction Circulation, Traffic, and Transportation Streets and Highways Existing Traffic Volumes and Level of Service Truck and Goods Movement Passenger Rail Transit Services Non Motorized Transportation Parking Facilities Air Transportation Utilities Water Supply and Water Quality Wastewater Collection, Treatment, and Disposal Stormwater Drainage Solid Waste Management Hazardous Waste Public Facilities and Services Public Safety Marine Safety Education Libraries Additional Facilities Gas and Electric Communications Parks and Recreation Parks and Facilities Park Standards Shared Use Facilities Recreational Programs Community and Senior Centers Additional Recreation Opportunities Special Events Chapter 5 Environmental Resources 5.1 Introduction Biological Resources Regulatory Setting Environmental Setting Special Status Species in the Planning Area Aesthetic Resources Regulatory Setting Environmental Setting Cultural Resources Regulatory Setting Environmental Setting Historic Setting Summary of Existing Resources Agricultural and Soil Resources Regulatory Setting Environmental Setting Existing Soils Conditions Important Farmlands within the Planning Area Williamson Act Contracts Page ii Background Report April Oxnard_GP_TOC_2006_04_20 MRD.doc
6 Draft Table of Contents Agricultural Production Urban Encroachment Water Supply Availability Mineral Resources Regulatory Setting Environmental Setting Air Quality Regulatory Setting Environmental Setting Energy Conservation Chapter 6 Safety and Hazards 6.1 Introduction Geologic, Seismic, and Soil Hazards Regulatory Setting Environmental Setting Natural Hazards Flooding and Sea Level Rise Tsunami and Tidal Marine Hazards Coastal Wave and Beach Erosion Wildfires Noise Regulatory Setting Environmental Setting Hazardous Materials and Uses Regulatory Setting Environmental Setting Transportation Hazards Existing Transportation Hazard Conditions Transportation Response for Other Hazards Responsibilities for Transportation Hazards Existing Implementation Measures Chapter 7 Acronyms Chapter 8 References April 2006 Background Report Page iii 0-Oxnard_GP_TOC_2006_04_20 MRD.doc
7 City of Oxnard General Plan Draft List of Figures Figure 1-1 Regional Context Figure 1-2 Jurisdictional Areas Map Figure 2-1 Oxnard Population and Percentage Change, 1971 to Figure 2-2 Net Foreign and Domestic Migration, Oxnard City, 1990 to Figure 2-3 Oxnard Population and Annual Change, 1971 to Figure 2-4 Oxnard and San Buenaventura Population Profiles, Figure 2-5 Tax Composition, Oxnard, 1995 to Figure 2-6 Revenues, Expenditures, and Balance, Oxnard, 1995 to Figure 2-7 Revenue Composition, Oxnard, 1995 to Figure 2-8 Selected Revenue Comparison, Oxnard, 1995 to Figure 2-9 Expenditure Composition, Oxnard, 1995 to Figure 2-10 Selected Expenditure Comparison, Oxnard, 1995 to Figure 2-11 Population 16-over Employment Status, Oxnard, West Ventura County, and California, Figure 2-12 Worker Type, Oxnard and California, Figure 2-13 Occupation Shares, Oxnard and California, Figure 2-14 Employment Distribution, Oxnard Metro Area, Figure 2-15 Employment by Industry, Oxnard Metro Area, Figure year Employment Growth by Industry, Oxnard, Figure 2-17 Total Employment and Growth, Oxnard, 1993 to Figure 2-18 Average Salary by Industry, Oxnard, Figure 2-19 Average Salary and Growth, Oxnard, 1993 to Figure 2-20 Real Expenditures/Revenues per capita, Oxnard, 1995 to Figure 2-21 Real Expenditure Detail per capita, Oxnard, 1995 to Figure 2-22 Real Revenue Detail per capita, Oxnard, 1995 to Figure 2-23 Real Tax Revenue Detail per capita, Oxnard, 1995 to Figure 2-24 Service Standard for Population, Oxnard, 1995 to Figure 2-25 Service Standard for Jobs, Oxnard, 2000 to Figure 2-26 Revenue Generation Rates for Residential versus Commercial, 2000 to Figure 3-1 Existing Land Use Figure 3-2 Existing Zoning Figure 3-3 Vacant Land Figure 3-4 Specific Plan Areas Figure 3-5 Redevelopment Areas Figure 3-6 Commercial Base Detail, Oxnard/Port Hueneme, 2000 to Figure 3-7 Industrial Space in selected Cities in Ventura County, Figure 3-8 Office Space in selected Cities in Ventura County, Figure 3-9 Retail Space in selected Cities in Ventura County, Figure 3-10 Oxnard/Port Hueneme s Share of Ventura County, Figure 4-1 Roadway Classification Map Figure 4-2 Major Oxnard Corridors Figure 4-3 LOS Critical Intersections Figure 4-4 Goods Movement Figure 4-5 Public Transportation Figure 4-6 Non-motorized Transportation Figure 4-7 City of Oxnard Water Supply and Distribution System Figure 4-8 Oxnard Wastewater System Figure 4-9 Oxnard Storm Drainage System Figure 4-10 Police and Fire Stations Figure 4-11 School Districts Figure 4-12 City Facilities Figure 4-13 Parks and Community Facilities Figure 4-14 Recreational Facilities Figure 5-1 Habitats Page iv Background Report April Oxnard_GP_TOC_2006_04_20 MRD.doc
8 Draft Table of Contents Figure 5-2 Greenbelts Figure 5-3 Waterways Figure 5-4 Agriculture/Open Space Figure 5-5 Beaches/Coastline Figure 5-6 Roadways Figure 5-7 Urban Landscapes # Figure 5-8 Urban Landscapes # Figure 5-9 Planning Timeline Figure 5-10 Oxnard Historic District Figure 5-11 Soil Associations Figure 5-12 Soil Erosion Figure 5-13 Prime Farmland Figure 5-14 Key Agricultural Resources Figure 5-15 Mineral Resources Figure 6-1 Fault Systems April 2006 Background Report Page v 0-Oxnard_GP_TOC_2006_04_20 MRD.doc
9 City of Oxnard General Plan Draft List of Tables Table Demographic Profile for the City of Oxnard and Ventura County Table 2-1 United States Population Projections, 2000 to Table Population Projection, California and the United States Table 2-3 Change in U.S. Population by Age, 2000 to Table 2-4 Projected Ethnic Profile, California, SCAG Region, Ventura County, Table 2-5 Oxnard Net Migration and Natural Increase, 1990 to Table 2-6 Oxnard Housing Age Table 2-7 Bookend Projections Table 2-8 Government Fiscal Accounts, Oxnard, 1995 to Table 2-9 Composition of Revenues and Expenditures, Oxnard, 1995 to Table 2-10 Government Fiscal Accounts Percent Change, Oxnard, 1995 to Table 2-11 Government Fiscal Accounts (Real), Oxnard, 1995 to Table 2-12 Unemployment Rate, Various Areas, Table 2-13 Oxnard, Employment by Major Sector, 1991 to Table 2-14 Oxnard, Salary by Major Sector, 1991 to Table 2-15 Oxnard Employment and Salary by Detailed Sector, Part Table 2-16 Oxnard Employment and Salary by Detailed Sector, Part Table 2-17 Real Expenditures and Revenues per capita, Oxnard, 1995 to Table 2-18 Real Expenditures and Revenues per Housing Unit, Oxnard, 1995 to Table 2-19 Real Expenditures and Revenues per million square feet of Commercial Space, Oxnard, 1995 to Table 2-20 Total Taxable and Retail Sales per Capita, Oxnard, 1995 to Table 2-21 Total Taxable and Retail Sales per Capita, 1995 to Table 2-22 Commercial Space, Oxnard/Port Hueneme, 200 to Table 3-1 History and Status of the 2020 General Plan Table 3-2 General Plan 2020 Residential Density Standards Table 3-3 General Plan 2020 Commercial Floor Area Ratios (FAR) Gross Table 3-4 General Plan 2020 Industrial Floor Area Ratios Gross Table 3-5 Existing Land Use, Table 3-6 Existing Zoning, Table 3-7 General Plan 2020 and Zoning Compatibility Table 3-8 Proposed Residential Units, Table 3-9 Housing Characteristics, Table 3-10 Vacant Land by Parcel Type, Table 3-11 Vacant Land by Land Use Category, Table 3-12 Adopted and Proposed Specific Plans, City of Oxnard Table 3-13 Redevelopment Areas Table 3-14 Architectural Styles Comparison Table 3-15 Densities of California Cities (Population/Sq. Mile) Table 3-16 Commercial Base Oxnard/Port Hueneme (2000 to 2004) Table 3-17 Leasable Industrial Space in Ventura County (2004, 4th Quarter) Table 3-18 Leasable Office Space in Ventura County (2004, 4th Quarter) Table 3-19 Leasable Retail Space in Ventura County (2004, 4th Quarter) Table 3-20 Office Lease Rates and Sale Prices, Ventura County (2000 to 1st Quarter 2004) Table 3-21 Industrial Lease Rates and Sale Prices, Ventura County (2000 to 1st Quarter 2004) Table 3-22 Retail Lease Rates and Sale Prices, Ventura County (2000 to 1st Quarter 2004) Page vi Background Report April Oxnard_GP_TOC_2006_04_20 MRD.doc
10 Draft Table of Contents Table 3-23 Top 35 Employers, Ventura County Table 4-1 Level of Service (LS) Descriptions for Signalized Intersections Table 4-2 AM and PM Peak Intersection Level of Service Table 4-3 Ridership Growth in Oxnard Public Transportation Table 4-4 Existing Water Demand Table 4-5 Projected Water Demands and Supplies Table 4-6 GREAT Program Recommended Water Supply Allocation (AFY) Table 4-7 Existing Lift Stations Table 4-8 Existing Force Mains Table 4-9 Oxnard Wastewater Treatment Plant Capacity Table 4-10 Drainage Facilities Table 4-11 Solid Waste System Annual Solid Waste Collection (Tons) Table 4-12 Hazardous Waste Production in Oxnard Table Police Department Staff, City of Oxnard Table 4-14 Crime Statistics ( ), City of Oxnard Table 4-15 Fire Stations, Oxnard Fire Department Table 4-16 Fire Department Responses, Table Performance Indicators Table 4-18 Future Stations Table 4-19 District Enrollment, Oxnard Planning Area ( ) Table 4-20 Class Size & Pupil/Teacher Ratios, Oxnard Planning Area ( ) Table 4-21 Facility Capacity Table 4-22 School Enrollment Projections and Facility Space Needed Table 4-23 Private Schools, ( ) Table 4-24 Oxnard Public Library Statistics ( ) Table 4-25 Park Classification Summary, City of Oxnard Table Park Inventory, City of Oxnard Table 4-27 Future Park Facilities Table 4-28 City Park and NRPA Standards Table Current Park Standards, Table 4-30 Community, Youth Activity, and Senior Centers Table 5-1 Summary of Habitats, Oxnard Planning Area Table 5-2 Special Status Plant and Wildlife Species Known or Having Potential to Occur in the Planning Area Table 5-3 City of Oxnard Landmarks Table 5-4 City of Oxnard Points of Interest Table 5-5 Description of FMMP Designations Table 5-6 Soil Associations and Other Land Uses within the Planning Area Table 5-7 Land Use by FMMP Designation, Oxnard Planning Area Table 5-8 Leading Crops for Ventura County, Table 5-9 Oil and Gas Field Production, Oxnard Planning Area Table 5-10 Ambient Air Quality Standards Table 5-11 Summary of PM10, PM2.5, and Ozone Air Quality Monitoring Data ( ) Table 6-1 Fault Systems in the Vicinity of the Oxnard Planning Area Table 6-2 Typical Noise Levels Table 6-3 FHWA Noise Abatement Criteria Table 6-4 Community Noise Exposure Ldn or CNEL, Db Table 6-5 State Interior and Exterior Noise Standards Table 6-6 City of Oxnard Exterior and Interior Noise Ordinance Standards Table 6-7 Community Noise Measurement Summary Table 6-8 Leaking Underground Storage Tank Listing in the Planning Area Table 6-9 Aboveground Storage Tanks in the Planning Area Table 6-10 Solid Waste and Landfill Sites in the Planning Area Table 6-11 Recycling Facilities in the Planning Area Table 6-12 Lead Agencies for Transportation Hazards in Oxnard April 2006 Background Report Page vii 0-Oxnard_GP_TOC_2006_04_20 MRD.doc
11 City of Oxnard General Plan Draft Please see the next page. Page viii Background Report April Oxnard_GP_TOC_2006_04_20 MRD.doc
12 1. Introduction 1.1 What is a General Plan? Every city and county in California is required by State law to prepare and maintain a planning document called a general plan. A general plan is designed to serve as the jurisdiction s constitution or blueprint for future decisions concerning land use, infrastructure, public services, and resource conservation. All specific plans, subdivisions, public works projects, and zoning decisions made by the City must be consistent with the General Plan. The current program is designed to update the City s 1990 General Plan to the year The Oxnard General Plan update program will accomplish the following: Provide the public opportunities for meaningful participation in the planning and decision-making process; Provide a description of current conditions and trends shaping the City of Oxnard; Identify planning issues, opportunities, and challenges that should be addressed in the General Plan; Explore land use and policy alternatives; Ensure that the General Plan is current, internally consistent, and easy to use; Provide guidance in the planning and evaluation of future land and resource decisions; and Provides a vision and framework for the future growth of the City. A general plan typically has three defining features: General. As the name implies, a general plan provides general guidance that will be used to direct future land use and resource decisions. Comprehensive. A general plan covers a wide range of social, economic, infrastructure, and natural resource factors. These include topics such as land use, housing, circulation, utilities, public services, recreation, agriculture, biological resources, and many other topics. April 2006 Background Report Page Oxnard_GP_Introduction_2006_04_20 MRD.doc
13 City of Oxnard General Plan Draft Long-range. General plans provide guidance on reaching a future envisioned 20 or more years in the future (this General Plan update will look out 25 years to the year 2030). To reach this envisioned future, the General Plan will include policies and actions that address both immediate and long-term needs. 1.2 What is Covered in the General Plan? The City of Oxnard General Plan is organized into the following five major topic areas, called elements. Community Development. This element covers land use types, distribution, and intensity; population and building density; existing specific plans; public land ownership; and future growth areas. This element also provides a land use diagram that directs future land uses within the Planning Area. The focus of this element is the future growth and physical development of the community. Infrastructure and Community Services. This element provides guidance on the movement of people and goods in and through the City, the adequacy of existing public facilities, and plans and measures for preserving and enhancing open space and recreational opportunities. This element also addresses all modes of travel (e.g. vehicular, transit, rail, pedestrian), utilities (e.g. water, wastewater, storm drainage, solid waste), and public facilities and services (e.g. fire, police, education, civic institutions, libraries, human services, government). Environmental Resources. This element addresses the conservation, development, and use of natural resources. This element also explores the managed production of resources, significant buildings and historic sites, water resources, and biological resources. Agricultural resources are examined in conjunction with the SOAR ( Save Open Space and Agricultural Resources ) programs and Williamson Act policies. Safety and Hazards. This element addresses a number of public safety issues, including seismic and geologic hazards (e.g. landslides); flooding, tsunami, and other marine hazards; hazardous materials and wastes, terrorism, and transportation related hazards. The safety and hazards element consolidates several State-mandated elements including land use, conservation, and open space. Military Land Use Compatibility. This element demonstrates the City s support for military installations in proximity to the planning area. The background document also examines the impact of these installations on the City and discusses land use compatibility. Page 1-2 Background Report April Oxnard_GP_Introduction_2006_04_20 MRD.doc
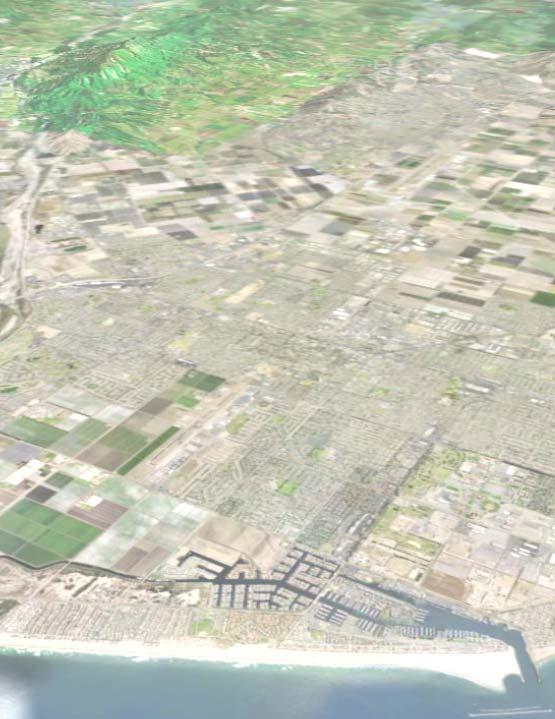
14 Draft 1. Introduction In addition to these elements, relevant information on the following topic areas is examined in the background document: demographics and economic conditions (Chapter 2). Information collected from these areas provides the foundation for the General Plan elements presented above and is incorporated as appropriate. 1.3 Using the General Plan The five component documents comprising the Oxnard General Plan are described below. Background Report. This report provides a detailed description of conditions, as of 2005, within the City during the development of the General Plan. Map Atlas. This document provides a summary graphic version of the Background Report with maps, charts, and photographs. Issues and Alternatives Report. This report discusses the major planning issues facing the City and alternative approaches to address these issues. The report distills the input of the public, City Council, Planning Commission, and City staff. Goals and Polices Report. This report is the essence of the General Plan. It contains the goals and policies that guide future decisions within the City. It also identifies implementation measures that would execute the goals and policies. Environmental Impact Report (EIR). The Environmental Impact Report (EIR) prepared for the General Plan meets the requirements of the California Environmental Quality Act (CEQA). The EIR is used during the process of finalizing the General Plan in order to understand the potential environmental implications associated with the implementation of the General Plan update. 1.4 Regional Setting Located 60 miles northwest of Los Angeles and 35 miles south of Santa Barbara, the City of Oxnard is situated along a beautiful stretch of the Pacific coastline as presented in Figure 1-1. The largest city within Ventura County, Oxnard is a rich combination of a relaxed seaside destination, progressive business center, and the center of a regional agricultural industry. Its Mediterranean climate, fertile topsoil, adequate water supply, and long harvest season combine to provide favorable agricultural conditions in the surrounding Oxnard plain. April 2006 Background Report Page Oxnard_GP_Introduction_2006_04_20 MRD.doc
15 City of Oxnard General Plan Draft Bordered by the mountains and the Pacific Ocean, Ventura County provides a seaside environment with expansive mountain views. Oxnard incorporates both of these attributes through the maintenance of a pattern of urban development clustered in a compact urban core surrounded by agriculture. Agricultural areas to the northwest and east of the City are protected by the Oxnard-Camarillo and Oxnard-Ventura Greenbelt Agreements. Adopted by the Cities of Oxnard, Camarillo and Ventura County, these agreements preserve the existing agricultural zoning. Under these agreements, cities commit not to annex any property within a greenbelt while the County Board of Supervisors agrees to restrict development to uses consistent with existing zoning. In addition to the greenbelt agreements, agriculture and open space is also protected under Oxnard s adopted SOAR (Save Open Space and Agricultural Resources) initiative which established an urban growth boundary around the City. This initiative, described in more detail in subsequent sections, limits urban growth to a defined area until the year City of Oxnard Overview In the development of the General Plan, a number of formal and informal jurisdictional areas and boundaries are used to describe the City and surrounding areas. These areas are illustrated in Figure 1-2. Airport Sphere of Influence. The Airport Sphere of Influence provides a designated area for the coordination and review of land use proposals which may affect or be affected by the operations of the Oxnard Airport. All proposed new development projects in this area are referred to the Oxnard Airport Authority for review and approval. Proposed changes to Oxnard s general plan, zoning, or development regulations that may affect property within the Airport Sphere of Influence are referred to the Ventura County Land Use Commission. Area of Interest. The Area of Interest adopted by the Ventura County Local Agency Formation Commission (LAFCO) defines major geographic areas reflective of the community and planning identity of the City of Oxnard. Typically, only one incorporated city is permitted within each Area of Interest. Development proposals in the unincorporated areas of the Oxnard Area of Interest are referred by Ventura County to the City of Oxnard for review. City Limits. The City of Oxnard has direct land use jurisdiction over the area within the incorporated city limits. Page 1-4 Background Report April Oxnard_GP_Introduction_2006_04_20 MRD.doc
16 Draft 1. Introduction Figure 1-1 Regional Context April 2006 Background Report Page Oxnard_GP_Introduction_2006_04_20 MRD.doc

17 j K e r n C o u n t y Ve n t u r a C o u n t y 5 Cuy uma Ri ver e Cr e k S a n t a B a r b a r a C o u n t y Ve n t u r a C o u n t y 33 Sespe LOS PADRES NATIONAL Beartrap Creek FOREST Pi r u Cr eek Agu a Bl anca Cr eek Pyramid Reservoir L o s A n g e l e s C o u n t y Ve n t u r a C o u n t y ANGELES NATIONAL FOREST l M a t i i ja Cr eek WHEELER SPRINGS Matilija Reservoir 33 MEINERS OAKS OJAI Sespe Creek Lake Piru Ri ver MIRA MONTE 150 Lake Casitas Vent ura OAK VIEW 150 FILLMORE 126 BUCKHORN PIRU a t a Cl ara River S n LA CONCHITA SEACLIFF CASITAS SPRINGS 33 FOSTER PARK SANTA PAULA BARDSDALE 23 FARIA BEACH SOLIMAR BEACH Pacific 101 PIERPONT BAY Ocean Ventura Ri ver VENTURA MONTALVO OXNARD SATICOY EL RIO NYELAND ACRES 126 Santa Clara i R ver Beardsley Wash Revolon Slo ugh 101 CAMARILLO SOMIS Conejo Cr eek Arroyo LEISURE VILLAGE MOORPARK ACRES Si mi Ar royo C one o NEWBURRY PARK rr yo A o Santa 23 Rosa MOORPARK Bard Reservoir OAKBROOK VILLAGE THOUSAND OAKS SIMI VALLEY PORT HUENEME 101 OAK PARK Cal legaus Creek Lake Sherwood 23 W N S E Legend Air Fields Railroad Freeway Highway POINT MUGU 1 Major Road Rivers and Creeks National Forest Boundary SOUTHCOAST Figure 1-1 Regional Map Source: U.S.G.S., Ventura County GIS Created By: City of Oxnard Planning & Environmental Services, Miles
18 City of Oxnard General Plan Draft (Back of Figure 1-1) Page 1-6 Background Report April Oxnard_GP_Introduction_2006_04_20 MRD.doc
19 Draft 1. Introduction Figure 1-2 Jurisdictional Areas Map April 2006 Background Report Page Oxnard_GP_Introduction_2006_04_20 MRD.doc
20 I ST ARNOLD RD CASPER RD OLDS RD RICE AV WALNUT AVE LAS POSAS RD POLI ST LOS ANGELES AVE CENTER RD 101 FRWY 101 FRWY 101 FRWY BRISTOL RD River VINEYARD AVE ROSE AVE CENTRAL AVE WRIGHT RD Santa Clara VINEYARD AVE ROSE AVE HARBOR BL GONZALES RD FIFTH ST VICTORIA AV DORIS AV TEAL CLUB RD H ST OXNARD BL ROSE AV DEL NORTE BL 101 FRWY STURGIS RD 5TH ST AVIATION DR 101 FRWY 5TH ST Pacific WOOLEY RD PATTERSON RD CHANNEL ISLANDS BL SAVIERS RD WOOLEY RD OXNARD BL RICE AV WOLFF RD LAGUNA RD WOOD RD LAGUNA RD WEST RD HAILES RD ETTING RD LAS POSAS RD PLEASANT VALLEY RD HUENEME RD NAUMAN RD 1 FRWY 1 FRWY Ocean CASPER RD Legend PERIMETER RD Oxnard City Limits Area 26.9 sq.mi. (Dec. 2004) Population 188,849 (DOF Jan. 2005) Oxnard Sphere of Influence Adopted by LAFCO , Revised 6-00 ( sq. miles) Coastal Zone Boundary Oxnard Area of Interest Boundary Oxnard Planning Area Boundary W N S E Oxnard Airport Sphere of Influence City Urbarn Restriction Boundary (Shown where not coterminous with Sphere of Influence) Figure 1-2 Jurisdictional Map Source: City of Oxnard GIS Created By: City of Oxnard Planning & Environmental Services, Miles
21 City of Oxnard General Plan Draft (Back of Figure 1-2) Page 1-8 Background Report April Oxnard_GP_Introduction_2006_04_20 MRD.doc
22 Draft 1. Introduction City Urban Growth Boundary and City Buffer Boundary. In 1998, the voters of the City of Oxnard adopted the SOAR initiative establishing the City Urban Growth Boundary (CURB). The CURB defines the urban development boundary for the City of Oxnard until December 31, 2020 at which time the voters can determine whether the program should be extended, modified or expired. This initiative also established a City Buffer Boundary (CBB) which lies outside of the CURB line and is coterminous with the Oxnard Area of Interest. Generally, any significant change to the CURB line or an agricultural land use designation within the CBB requires approval of Oxnard voters. Coastal Zone. Established by the 1976 Coastal Act, the boundary of the coastal zone generally extends 1,000 yards inland from the Pacific Ocean. In Oxnard, the Zone includes the Channel Islands Harbor, the Edison Canal, and channels associated with inland waterway development ( Mandalay Bay ). Land uses in the Oxnard Coastal Zone are governed by a separate Coastal Land Use Plan (CLUP) and zoning regulations adopted pursuant to the California Coastal Act and certified by the California Coastal Commission. Planning Area. Established by the City of Oxnard and Ventura County, the planning area includes the incorporated and unincorporated areas beyond the City s current sphere of influence to include the Point Mugu Naval Air Station (NAS). Areas included within the Planning Area include those areas the City currently or expects to influence in the foreseeable future. This area serves as the primary study area for the General Plan and is also referred to within this document as the General Plan Planning Area or Oxnard Planning Area. Sphere of Influence. The Sphere of Influence encompasses the probable future boundaries and service area of the City, as determined by the Ventura County LAFCO. Unincorporated Areas. An unincorporated area refers to land outside city limits that is the responsibility of Ventura County History The earliest residents of the region were the Chumash Indians, known for their well constructed canoes and fine basket work. European presence began in 1542 when Portuguese explorer Juan Rodriquez Cabrillo sailed into Point Mugu lagoon and described the area as the land of everlasting summers. After a number of Spanish explorations, Mission San Buenaventura was established as a midway point between the San Diego and Monterey Missions in The El Camino Real was the only road April 2006 Background Report Page Oxnard_GP_Introduction_2006_04_20 MRD.doc
23 City of Oxnard General Plan Draft connecting the missions to existing urban areas. Pueblos and ranchos soon sprang up around the Mission and along the roadway within the area now known as the City of Ventura. With the addition of State of California to the Union in 1850, immigrants flocked to the west coast from the eastern states and Europe. Agriculture quickly became the dominant industry, with lima beans and barley dominantly the crops produced. Achille and Henry Levy were thus inspired to open an agricultural brokerage business in 1882, and finally a bank, which provided encouragement and financial assistance to farmers. In 1897, ranchers Albert Maulhardt and Johannes Borchard determined sugar beets would be a profitable crop and invited Henry Oxnard to construct a local factory to process the harvests. Encouraged by a pledge of 18,000 acres of sugar beets from local farmers, Oxnard and his three brothers built a factory in the fertile Oxnard Plain. With the development of the factory, the Southern Pacific Railroad constructed a spur to the factory site to transport the processed beets. Prior to the development of the sugar beet industry, Thomas Bard constructed a wharf to serve as a port for the shipping of supplies and agricultural products grown and produced in the rich agricultural area of the Oxnard Plain. Taking advantage of the deep, submarine Hueneme Canyon, a 1,500-foot wharf was constructed in 1872 to transfer lighter goods from the coast to off-shore ships. A town quickly developed in close proximity to the Oxnard beet factory to provide services for the factory and its workers. The Oxnard Improvement Company was created in 1898 to design the town site, focused around a town square called the Plaza (presently Plaza Park). Businesses and residences were constructed around the town square, with schools and churches following almost as rapidly. Incorporated in 1903, the City of Oxnard took its name from the Oxnard brothers who founded the local sugar beet factory. Diversification of the agricultural base of the City occurred in conjunction with the arrival of Chinese, Japanese, and Mexican workers attracted to the area by the numerous job opportunities. Major crops of the day included beans, beets, and barley, and businesses in town expanded to include general merchandise, restaurants, laundries, saloons, and banks. By the early 1920 s, lemons outstripped lima beans and sugar beets as the number one crop. Page 1-10 Background Report April Oxnard_GP_Introduction_2006_04_20 MRD.doc
24 Draft 1. Introduction With the establishment of military bases at Port Hueneme and Point Mugu, coupled with the rise of electronic, aerospace, and other manufacturing, Oxnard experienced its greatest period of growth during World War II. In more recent years, the attraction of Oxnard s coastal location led to the development of tourism as a significant industry. Oxnard is now the largest city in Ventura County and lies in the center of 180 square miles of some of the richest agricultural land in the State Overview of City and County Demographics Table 1-1 provides a brief overview of the demographics for the City of Oxnard and Ventura County. According to 2005 population estimates, the City of Oxnard is the 20 th most populous city within California with a total population of 188,849. The density of Oxnard s urban core is reflected in the City s population density of over 7,000 persons per square mile, vastly exceeding the County s density of 434 persons per square mile. It should be noted that almost 50% of Ventura County s land area is within the Los Padres National Forest, significantly affecting average the average population per acre. Demographics for the City of Oxnard are discussed in detail in Chapter 2. Table Demographic Profile for the City of Oxnard and Ventura County Ventura County City of Oxnard 1990 Population 142, , Population 170, , Population (estimate) 188, ,052 Percentage Population Growth 32.79% 21.53% ( ) Land (Square Miles) ,873 Population Density per Sq. Mile (2005) 7, Source: 1990 and 2000 US Census, Department of Finance, E-1 City/County Population Estimates, Organization of the Background Report This report is organized into eight chapters, as follows: Chapter 1, Introduction. This chapter provides an introduction to the Background Report with a description of how to use the General Plan documents and a brief overview of the City of Oxnard s regional setting, history, and demographics. April 2006 Background Report Page Oxnard_GP_Introduction_2006_04_20 MRD.doc
25 City of Oxnard General Plan Draft Chapter 2, Demographics. This chapter describes the population, demographics, and fiscal conditions that exist within the planning area. Demographics (2.2) Housing (2.3) Fiscal Conditions (2.4) Labor Trends (2.5) Cost and Services Standards (2.6) Population Projections and Change Areas (2.7) Chapter 3, Community Development. This chapter provides an overview of the existing land uses, land use regulations, and economic and community development strategies employed by the City. These topics are presented in the following sections: Land Use (3.2) Urban Design Community Identity (3.3) Growth Management (3.4) Economic Development (3.5) Chapter 4, Infrastructure and Community Services. This chapter covers the existing infrastructure capabilities and services, and their ability to serve the future needs of the City. This chapter includes the following topics: Circulation, Traffic, and Transportation (4.2) Utilities (4.3) Public Facilities and Services (4.4) Parks and Recreation (4.5) Chapter 5, Environmental Resources. This chapter addresses the natural and man-made resources within the City and is divided into the following sections: Biological Resources (5.2) Energy Conservation (5.3) Page 1-12 Background Report April Oxnard_GP_Introduction_2006_04_20 MRD.doc
26 Draft 1. Introduction Chapter 6, Safety and Hazards. This chapter discusses existing conditions as they relate to the health and safety of the community. The topics discussed include both natural and man-made hazards and are divided into the following sections: Geologic, Seismic, and Soil Hazards (6.2) Natural Hazards (6.3) Noise (6.4) Hazardous Materials and Uses (6.5) Transportation Hazards (6.6) Chapter 7, Acronyms. This chapter provides a comprehensive listing of all acronyms used within the Background Report. Chapter 8, References. This chapter provides a listing of the reference materials consulted during the preparation of the Background Report. April 2006 Background Report Page Oxnard_GP_Introduction_2006_04_20 MRD.doc
27 City of Oxnard General Plan Draft Please see next page. Page 1-14 Background Report April Oxnard_GP_Introduction_2006_04_20 MRD.doc
28 2. Demographics, Housing, and Economics 2.1 Introduction Housing costs, out-migration, higher housing production, and demographics are influencing Oxnard s population, housing, and economic change dynamics. People moving into new housing from outside the City are likely be older than existing residents and have smaller households. New residents also tend to be wealthier and more educated than typical existing residents. Simple population projections (high and low scenarios based on assumptions about the pace of new home-building) imply that Oxnard s 2030 population will be somewhere between 240,000 to 260,000. This estimate is lower than a market trend forecast that suggests a 2030 population of 285,000. Housing costs, outmigration, higher housing production, and demographics are influencing Oxnard s population, housing, and economic change dynamics. Oxnard s recent real estate market trends benefit the City s finances. The increases in property values have boosted property tax receipts to the City in a dramatic fashion. Oxnard is in good financial health despite recurring fiscal crises at the State level and in many local communities. Oxnard s per-capita taxable sales and retail sales are near the Ventura County-wide average. Oxnard could potentially improve their per-capita taxable sales through retail and tourist development. This would further benefit the City s financial position. This chapter covers demographics, housing, and economics. The demographics section includes descriptions of the City s current population as well as trends that are impacting future population change. Housing and real estate development and their inter-action with population change are discussed. The economic section includes a description of the labor market, the City s financial situation, and Cost and Services Standards (the ability of the City to provide services to their residents). The remainder of the section is as follows: Local and National Demographic Trends (2.2) Oxnard s Population Change (2.3) Oxnard s 2000 Census Profile (2.4) Housing (2.5) Population Projections and Growth (2.6) Fiscal Conditions (2.7) Labor Trends (2.8) Jobs (2.9) Cost and Service Standards (2.10) April 2006 Draft Background Report Page Oxnard_GP_Demographics_2006_04_20 MRD.doc
29 City of Oxnard General Plan Draft 2.2 Local and National Demographic Trends Demographics is the statistical characterization of human populations in a given geographic area. A community s future is largely a function of what populations are currently in the community, and what population-related trends will play out during the 25-year planning period (2006 to 2030). Some population trends are somewhat stable, such as the general movement of the U.S. population to the southern and western states. Other trends are harder to predict, such as the impact of relatively high housing costs on businesses and households over the long run. Oxnard has some population characteristics that are different from both other Ventura County cities and between different areas of the city. This chapter collects and summarizes information about Oxnard s demographic and related housing trends, and then presents projections to 2030 for planning purposes. The analysis includes the county, region, state, and nation in order to set the context as Oxnard is part of and responds to market and demographic forces from far outside its borders, to various extents. National As of January 1, 2006, the U.S. population is just under 298 million, and is projected by the Census Bureau to reach 363,600 by 2030, an increase of roughly 2.6 million persons each year. The United Nations projects the 2030 U.S. population at 360,894,000 (see Table 2-1). Most of the Nation s increase is driven by immigration and/or the relatively higher birth rates of children of immigrants. The Population Reference Bureau states: The volume of legal migration has fluctuated since the 1930s. Immigration has accounted for an increasing portion of population growth as American women began having fewer children. Today one-third of the U.S. population growth is from net migration. The U.S. Census Bureau projects that the U.S. population will reach 403,687,000 by Of this projected growth, 36 percent may result from immigration, with 46,691,756 new immigrants being added in the next 50 years. < /NavigationMenu/PRB/Educators/Human_Population/Migration2/Mi gration1.htm> Page 2-2 Draft Background Report April Oxnard_GP_Demographics_2006_04_20 MRD.doc
30 Draft 2. Demographics, Housing and Economics Table 2-1 United States Population Projections, 2000 to 2030 Year Census Bureau United Nations Source: California ,936, ,253, ,584, ,427, ,584, ,894,000 UN 2004 Revised Population Database, Census Bureau Interim Projections, March 2004 California is the Nation s most populous state, with just over 37 million residents as of July, 2005, according to the State Department of Finance (DOF), or a 1:12 ratio to the national population. Both the Census Bureau and the DOF regularly prepare detailed population projections. The Census Bureau s Interim 2030 state projection for California is shown in Table 2-2 (along with Texas and New York) that shows the 1:12 ratio continuing to Table Population Projection, California and the United States Census 2000 Population 2030 Projection United States 281,421, ,584,435 California 33,871,648 46,444,861 Ratio California: United States 1:12.0 1:12.7 Source: < projections/presstab1.xls>un 2004 Revised Population Database, Census Bureau Interim Projections, March 2004 DOF s 2030 projected State population of 48,110,671 is 1.66 million higher than the Census Bureau s projection of 46,444,861. This difference of 3.5% is largely due to different birth rate and migration assumptions. State population growth is a combination of natural increase of our current population migration from other states, and international migration. These components of change are discussed in detail in a subsequent section. The point is that just as the nation will continue to grow into the foreseeable future, so too will California. Ventura County DOF also regularly prepares population projections for the State s 57 counties. The DOF starts with a State projection and then allocates growth to the counties utilizing a complex methodology that takes into account county to county migration revealed by changes in school, motor vehicle, and income tax administrative databases. This top-down projection for Ventura County for 2030 is 982,794. The DOF projection differs from that prepared by the Southern California Association of Governments (SCAG), the regional transportation planning agency that includes Ventura County April 2006 Draft Background Report Page Oxnard_GP_Demographics_2006_04_20 MRD.doc
 growth forecast for the county is 966,900, about 16,000 less than the DOF (about 1.6% difference).")
31 City of Oxnard General Plan Draft and Oxnard, that is more a bottom up approach that relies more on local land use plans and actual housing production. The SCAG 2030 Local Input for the 2004 Regional Transportation Plan (RTP) growth forecast for the county is 966,900, about 16,000 less than the DOF (about 1.6% difference). The SCAG projection does respect the various growth control measures in place in Ventura County and uses somewhat robust assumptions regarding higher density infill development. Using 975,000 as the average of the DOF and SCAG 2030 projections, and based on the DOF s 2005 County population estimate of 813,000, the county is projected to grow by 162,000 in 25 years (a 20% increase), or roughly 6,500 persons per year. The next question is, If this growth occurs, what share of growth would be anticipated for Oxnard? City Of Oxnard SCAG prepares projections for cities as part of its regular update of the regional transportation plan (RTP). The current RTP (2004) projects a 2030 Oxnard population of 242,500. Using the DOF s 2005 city population estimate of 188,849, the city s population would increase by 53,651 over 25 years, or roughly 2,100 people per year. This is about 56% of the annual average city population increase between 2000 and 2005, which was 3,700 people per year, and generally represents a slower growth rate compared to most of the City s history, especially during the 1970 s up to about 1985 (see Figure 2-1). Figure 2-1 Oxnard Population and Percentage Change 1971 to 2005 Note: SCAG is preparing another round of population, housing, and jobs projections to the year 2035 for the 2008 RTP which should be available in summer, And, DOF will release the 2006 city population and housing estimate in May, Source: SCAG, 2004 Page 2-4 Draft Background Report April Oxnard_GP_Demographics_2006_04_20 MRD.doc
32 Draft 2. Demographics, Housing and Economics This projected slower growth rate is, in part, due to assumptions regarding smaller households and lower birth rates compared to the 1980 s and 1990 s, as well as the amount of expected new housing. In addition, there is evidence that the City s population was undercounted in both the 1980 and 1990 censuses, and then had a much better census count in The improved census count would have added population that was, in reality, already here, and creating a somewhat misleading 1990 to 2000 population increase. The SCAG projection does not necessarily translate to inevitable growth nor desired policy. The American Planning Association (APA) and the International City Managers Association (ICMA) jointly publish The Practice of Local Government Planning (known as The Green Book ) which serves as the source for best-practices in the planning profession. The current Third Edition states in several places that population projections should not be immediately considered a planning goal. When planners project existing population they do not mean to say that trend is destiny but that if the future turns out like the past, the community will likely have a population that matches the projected value (p. 34). When using the standard methods of population projection resist the temptation to assume that these results describe the most probable future (the truth) or the most desirable one (the ideal) (p. 82). The uncertainty of projections increases (1) the further in time that the projections are extended and (2) the smaller the size of the subareas for which the projections are constructed (p. 83). Clearly, the SCAG 2030 projection for the City of Oxnard should not be considered a mandatory or inevitable future population that Oxnard must plan to accommodate. The SCAG projection is a small area projection and subject to increasing error the further the date from the base year, The 20-year error estimate is 14 percent, according to SCAG s Marc, 2006 memorandum on baseline forecasts for the 1008 RTP. It is a guide that roughly shows where Oxnard would be in 25 years under a cluster of demographic and development assumptions that are largely continuations of recent large-scale developments on former agricultural land. Gaining a better understanding of the demographic trends aids us in understanding what amount of growth and population change is inevitable (i.e. already set in motion by the people already here and very unlikely to change), and what growth and proportion of Oxnard s future population can be influenced by the General Plan update. The next sections focus on several key demographic trends. April 2006 Draft Background Report Page Oxnard_GP_Demographics_2006_04_20 MRD.doc
33 City of Oxnard General Plan Draft Growing Diversity The Nation s population is growing more diverse, and aging. The Census Bureau projects that of the 81.5 million people anticipated to be added to the Nation between 2000 and 2030, 58% would be Non-Whites. In 2030, Hispanics (of all races) would account for 46% of the change between 2000 and The resulting 2030 National population would be about 25% Non-White and 20% Hispanic. Table 2-3 shows the large percentage increases of the over age 65 population beginning in This is a Baby-boom generation that is large and expected to live longer and in better health than any previous generation. Table 2-3 Change in U.S. Population by Age, 2000 to 2030 Age Percent Change Total Note: DOF projections to 2030 by ethnicity are summarized in Table 2-5 showing that, in the year 2030, Ventura County would have a relatively higher percentage of Hispanics than the State or the SCAG region (Los Angeles, Orange, Riverside, San Bernardino, and Ventura Counties). Source: U.S. Census Bureau, 2004, "U.S. Interim Projections by Age, Sex, Race, and Hispanic Origin," Internet Release Date: March 18, 2004 Table 2-4 Projected Ethnic Profile, California, SCAG Region, Ventura County, 2030 State of California SCAG Region Ventura County White 14,182, % 4,990, % 204, % Hispanic 22,520, % 12,235, % 564, % Asian 6,158, % 2,386, % 143, % Pacific Islander 210, % 74, % 4, % Black 3,192, % 1,540, % 11, % American Indian 815, % 210, % 32, % Multirace 1,030, % 389, % 21, % TOTAL 48,110,671 21,827, ,794 Source: Department of Finance, P3 Population Projections by Race / Ethnicity, Gender and Age for California and Its Counties Page 2-6 Draft Background Report April Oxnard_GP_Demographics_2006_04_20 MRD.doc
34 Draft 2. Demographics, Housing and Economics In a manner similar to the national age profile, California s age profile will also increasingly skew towards the over Age 65 population. The May 2004 DOF projections for Ventura County show 150% to 200% increases in the over Age 65 population groups by 2030, compared to Oxnard is already a diverse city in terms of race and Hispanic Origin, as shown in Table 2-4, and will remain diverse given that California, the region, and Ventura County are all trending towards greater diversity. City diversity information is presented in the Census 2000 section. 2.3 Oxnard s Population Change There are many reasons why a community s population changes over time. The basic formula is that the future population is a function of migration and natural increase. Each of these components is explained in more detail below. Migration Migration is the physical movement of people from one location to another, usually on a permanent basis although seasonal migration plays a somewhat important role in Oxnard. People move within the City, usually to change their living or financial status, such as moving to a larger home or buying a home for investment reasons. Generally, intra-city migration is not of great concern for the General Plan and is hard to track and project. Residents who move up to newly developed housing and residents who move into nursing homes free up older housing that is usually less expensive. People move to and from Oxnard to other communities within Ventura County, elsewhere in California, and other states. This domestic migration is regularly measured by the State DOF and Census Bureau and accounted for in state and county projections, although domestic migration can be highly influenced by economic factors (See Figure 2-2). The other component of migration is international (foreign), both documented (legal) and undocumented (generally illegal, but not necessarily). Documented immigration data is from the U. S. Department of Homeland Security while estimates of undocumented immigration are made by various organizations and can vary. Most foreign immigration is into the Oxnard area. Census 2000 shows that 37% of Oxnard residents were born in a foreign country, and 14% were born in another state. Ventura County s agricultural commissioner estimates that 17,000 to 24,000 immigrant workers come to the County each year at peak growing seasons. Ventura County s agricultural commissioner estimates that 17,000 to 24,000 immigrant workers come to the County each year at peak growing seasons (Ventura County Star, November 30, 2005). If roughly half of these seasonal immigrants reside in Oxnard, the City s population would increase by 10,000 persons, or roughly five percent. An unknown number April 2006 Draft Background Report Page Oxnard_GP_Demographics_2006_04_20 MRD.doc
35 City of Oxnard General Plan Draft of these seasonal workers become permanent residents, either working year round in agriculture, or finding other year-round employment. Almost all migrant agricultural workers were born in Mexico ( The California Farm Labor Force: Overview and trends from the National Agricultural Workers Survey, Aguirre International, Burlingham, CA 2005). UCSB estimates Oxnard gains about 1,000 foreign immigrants per year. UCSB estimates Oxnard gains about 1,000 foreign immigrants per year, as shown in Figure 2-2. About 50% of all immigrants granted legal residency in Ventura County s in 2004 where from Mexico, and roughly 10% were from the Philippines (Office of Immigration Statistics, Department of Homeland Security). Figure 2-2 Net Foreign and Domestic Migration, Oxnard City, 1990 to 2005 Number of people 2,000 1,500 1, ,000-1,500-2,000-2,500 Net Foreign Immigration Net Domestic Migration Source: UCSB Economic Forecast, based on DOF E-6 reports Natural Increase Natural Increase is the net change in population due to births and deaths over a set time period. Oxnard has had about three to four times as many births as deaths since 1990, as shown in Table 2-5. Natural increase is a more stable trend than migration. Birth and death rates are both gradually lowered in State and Census Bureau projections. The gradual lowering of birth rates implies, in part, that second and third generation Hispanic women born in the United States are likely to have fewer children than their parents or grandparents, if they were direct immigrants. Also, death rates are lower for people in their 60 s and 70 s as better health and medical treatment combine to extend lifespans. Page 2-8 Draft Background Report April Oxnard_GP_Demographics_2006_04_20 MRD.doc
36 Draft 2. Demographics, Housing and Economics Table 2-5 Oxnard Net Migration and Natural Increase, 1990 to 2005 Population Change from Population Change from Natural Causes Migration Year Births Deaths Natural Increase Net Migration Net Foreign Net Domestic , ,923-1,485 na na , ,064 1, , , , , , ,143-1, , , ,217-1, , ,952-1, , , , ,039-1, , , , , , , ,799 1, , , , , ,850 2,866 1,601 1, , ,889 1,162 1, , , ,194-1, , , , , , ,146-1,534 Source: UCSB Economic Forecast Project, CA Department of Finance (DOF), and CA Vital Statistics The net result is that Oxnard s recent population growth is largely a factor of natural increase, while the effect of net migration varies from year to year. Forecasting Migration and Natural Increase Population projections incorporate migration and natural increase assumptions, largely based on trends calculated over five to 20 years. These assumptions tend to be more accurate the larger the population. At the local level, there are four issues that may influence Oxnard s future: 1. Housing Cost Out-Migration: The recent run-up of housing purchase prices and rents is a factor in an unknown number of people leaving Oxnard for less expensive communities such as Bakersfield and the lower Central Valley, Palmdale and Lancaster, the Inland Empire, and Nevada and Arizona. This is a statewide trend. Local school districts administrative records provide some evidence to support this suggestion. April 2006 Draft Background Report Page Oxnard_GP_Demographics_2006_04_20 MRD.doc
37 City of Oxnard General Plan Draft 2. Higher Housing Production: Oxnard has been issuing about 1,000 permits for new housing units per year, which is a rough match to the fiveyear average annual population increase of about 3,700 (i.e. 3.7 persons per unit). Several large projects are in the late planning and/or early construction stages that could double the annual production for several years, and increase in-migration relative to natural increase. 3. Under Age 21 Cohort: In 2005, about 35% of Oxnard s population was under age 21, compared to 30% in the rest of the County. This larger younger population will have a localized impact on Oxnard s future population depending on the birth rates of the women as they age into child bearing years, and how many from this population migrate out for cost-of-living or other reasons. 4. Over Age 55 Cohort: In 2005, Oxnard had a proportionally smaller overage 55 population than the rest of the county, 16% compared to 22%. The City s newer housing developments may attract older buyers who can afford the relatively higher prices. In other words, substantial numbers of the retiring Baby-Boom have sufficient wealth to afford Oxnard s newest and highest priced homes. These buyers would be in-migrants and their numbers could substantially differ from migration assumptions used in the projections previously presented. These issues, and others, suggest a detailed look at Oxnard s population is needed to gain a better understanding of how local population and housing factors may impact the City s future. 2.4 Oxnard s Census 2000 Profile Census Counts: 1990 and 2000 The Census 2000 city population count was 170,358, an increase of 28,142 from the 1990 Census unadjusted count in 10 years, about 2% per year. The City s official unadjusted 1990 Census population count was 142,216 while its adjusted count was 147,172, representing an estimated undercount of nearly 5,000 people (about 3.5%, but given the previous discussion regarding agricultural workers, the undercount is probably larger than 5,000). The Census 2000 city population count was 170,358, an increase of 28,142 from the 1990 Census unadjusted count in 10 years, about 2% per year. The 10-year increase would have been 23,186 using the adjusted 1990 Census count of 147,172, about 1.5% per year. Having missed people in earlier censuses, and then counting them in Census 2000, artificially raised the historic rate of population increase. Census 2000 data were not adjusted, as the Census Bureau determined that the adjusted estimates dramatically overstated the level of undercoverage, and that the adjusted Census 2000 data were, therefore, not better than the unadjusted data. Page 2-10 Draft Background Report April Oxnard_GP_Demographics_2006_04_20 MRD.doc

38 Draft 2. Demographics, Housing and Economics The Census 2000 city population of 170,358 exceeded the current (1990) General Plan s estimated 2020 population of 164,936 by over 5,000 people. This is largely due to the larger than expected increase in household size that, itself, was largely due to the higher than expected birth rate during the late 1980 s and early 1990 s. Average household size is estimated at 3.9 persons in 2005, well in excess of the citywide estimate of 3 per unit used in the 1990 General Plan for the year The 1990 General Plan s projection for occupied households of about 55,000 is, in fact, still realistic as the city had only 42,000 households in Census Figure 2-3 shows the annual percent change in the city s population, and the city s total population, since The 1970 s and early 1980 s saw much more growth as a percent of population compared to recent years, although the actual numbers were comparable. The city grew by over 4,000 people per year between 1975 and 1977 and 1979 and 1983, and between 1999 and Age Profile (pyramid) The City of Oxnard has a 2000 age profile, shown below in Figure 2-4, that is a classic growth profile. The largest cohorts (age groups of people) are under age 15 and the pyramid remains wide up to age 44 before it starts to narrow, indicating a predominance of families. The pyramid also shows how Census-designated Hispanics are predominate in the younger age cohorts, while non-hispanics tend to be middle aged. Figure 2-3 Oxnard Population and Annual Change, 1971 to 2005 Source: US Census, California Department of Revenue April 2006 Draft Background Report Page Oxnard_GP_Demographics_2006_04_20 MRD.doc
39 City of Oxnard General Plan Draft A population with this type of age distribution would normally be expected to largely continue in this pattern with each cohort simply getting larger, provided birth rates remained steady and the new family households, formed largely by the Hispanic children, would reside in the same community. If households with children leave the community in disproportionately large numbers, or decide to have far fewer children than their parents, then the future age distribution could more resemble that of San Buenaventure (Ventura City), also shown in Figure 2-4, where the middle age population is relatively larger (the percent Hispanic would be larger in Oxnard and in future years). Economics will play a large role in whichever pattern evolves over the coming 25 years. Over Age 65 Households In 2000, there were 13,400 residents over age 65, of which 2,500 live alone. They represented about six percent of all households, or 1 out of every 18 households. There were 1,200 residents age 85 and over, generally considered the frail elderly. Under Age 18 with One Parent Present About 4,800 households in 2000 consisted of a child under age 18 living with one parent, about two-thirds with the mother (no husband present), and one-third with the father (no mother present). Poverty Status Of the 168,000 persons for whom poverty status was calculated in Census 2000, 25,500 were below the Federal poverty level in 1999 (15.2%). Nearly 10,000 were under age 18, and 1,100 were over age 65, leaving about 14,400 in the labor force (age range of 18 to 64). Large Households In 2000, the citywide average household size was about 3.9 for 43,577 occupied households. This average masked a wide range of household sizes, from 6,225 single-person households (14%) to nearly 9,000 households with six or more people (21%). Just over 18,000 households consisted of families of three to five persons (41%). About one out of three family households, then, were relatively large with five or more members. Armed Forces Members and Veterans Just under 1,000 Oxnard residents were actively in the Armed Forces in Approximately 11,600 residents were veterans, of which 3,500 were over age 65. (These data are from before the Iraq and Afghanistan wars.) Page 2-12 Draft Background Report April Oxnard_GP_Demographics_2006_04_20 MRD.doc

40 Draft 2. Demographics, Housing and Economics Figure 2-4 City of Oxnard Oxnard and San Buenaventura Population Profiles, 2000 Selected Populations Summary Data Census 2000 provides extensive information about the city s population. What follows is a summary that focuses on selected populations that are typically considered during a General Plan update. All data are from Census Educational Attainment Education attainment is based on the highest formal education level of the over age 25 adult population. In 2000, just over 40% of the city s adult population had not completed high school. Just under 20% had a high school diploma or equivalent. The remaining 40% had some college, with 35% of these people having had earned a degree. Employment and Unemployment City of Ventura Of the city s 122,000 residents age 16 and over in 2000, about 38,000 (31%) did not work in 1999, meaning the total labor force participation rate was just under 70 percent. Of the 84,000 who worked in 1999, just under 70,000 worked full time (83%) and 14,000 worked part-time (17%). A total of 5,700 residents were unemployed, a rate of 4.6 percent. Disabilities About 32,000 Oxnard residents had a Census-defined disability in Of those between the ages of 16 and 64 with a disability (25,109), 14,191 were employed (56.5%) and nearly 11,000 were not employed. Of the over age 65 population of 12,500, about 41% had a disability. Group Quarters and Homeless. Source: US Census, 2000 In 2000, about 2,600 people lived in Group Quarters in Oxnard of which 500 were in nursing homes. About 1,000 were in various types of small halfway houses for the mentally ill, handicapped, and/or drug/alcohol recovery. Nearly 400 were in agricultural worker dormitories. Another 622 were classified as Other Noninstitutional and 32 as Other non-household living situation. The last category is the closest the Census Bureau comes to providing a count of the homeless population. April 2006 Draft Background Report Page Oxnard_GP_Demographics_2006_04_20 MRD.doc
41 City of Oxnard General Plan Draft Isolated Due to Language In 2000, about 21,000 households spoke primarily Spanish at home and 5,787 of these were classified as linquistically isolated by the Census Bureau. In 2000, about 21,000 households spoke primarily Spanish at home and 5,787 of these were classified as linquistically isolated by the Census Bureau (no household member over age 5 speaks English well). Another 800 households spoke Asian or another language and were isolated, for a total citywide of about 6,600 households, roughly 1 out of every 7 households. Daytime Population The Census Bureau defines the weekday daytime population as the sum of residents and workers within Oxnard, minus city residents who work outside the city. In 2000, the daytime population was 149,965: 170,358 residents plus 49,018 occupied jobs in the city, minus 69,411 residents who work outside Oxnard (26,145 residents live and work in the city, while 69,411 residents commute out). 2.5 Housing Relationship to the Housing Element State law requires the updating of the Housing Element on a cycle independent of the General Plan. The city s current certified Housing Element is for the period 2000 to 2005, and is due to be updated in 2007 for the five-year period 2006 to The content of the Housing Element is largely set by housing law and focuses on overall production, affordability, and special needs. In general, State housing law requires Oxnard to realistically plan and encourage production of a range of housing types determined by the Southern California Association of Governments (SCAG). This assignment represents the State s interpretation of housing as a need that allows past immigration and other growth trends to continue. An alternative view is that the SCAG housing target is a want that fosters continued growth, similar to the recent past. Either way, Oxnard will be updating its Housing Element shortly after completing this update of the General Plan and will have to work with the SCAG-determined regional housing need assignment. The following information is provided as a summary of housing characteristics typically considered during a General Plan update. The Background Report incorporates by reference the city s current Housing Element as a relatively up-to-date and more detailed discussion of the housing stock, housing needs, and programs and policies. Page 2-14 Draft Background Report April Oxnard_GP_Demographics_2006_04_20 MRD.doc
42 Draft 2. Demographics, Housing and Economics Housing Stock Profile The State Department of Finance (DOF) estimates the city had 49,382 housing units as of January 1, Of this total, 28,001 were detached (56.7%), 4,576 were townhouses (9.3%), 4,427 were in structures with 2 to 4 units (9.0%), 3,432 were in structures with five or more units (19.1%), and 2,346 were mobile homes (6.0%). This 2005 estimate is an increase of 4,216 units from 2000, an increase of 9.3% (or roughly 1.8% per year, or 843 units per year). The five-year change occurred almost entirely with the addition of 3,092 single-family detached units and 1,043 units in structures with five or more units (i.e. multifamily). Mobile homes and small multifamily structures had a very small increase. Tenure and Unit Size In 2000, just under 25,000 Oxnard households were owner-occupied, about 57 percent. The age distribution of home-owners was skewed towards the older population, which is typical in most communities. Over 64 percent of households over age 45 owned their homes, peaking at 77% for the over age 65. In contrast, 64 percent of households between ages 25 and 34 were renters. Owner-occupied units had an average of 5.7 rooms, while renter-occupied units had an average of 3.4 rooms. Value and Rent Housing values from 1999 are amusing in 2006, being that they seem so low in comparison to present values. There were only 54 units of over $1 million value reported in Census 2000, and the median value was $183,200. In 2000, over 3,800 households owned their homes free and clear, roughly 15 percent of all owners and most of these owners were probably older. Likewise, the median gross rent in Census 2000 was $780, and most renters were already paying more than 35 percent of their household income for rent in 2000, a situation that has not improved. Seasonal/Second Homes Of the 1,553 vacant units counted in Census 2000, 679 were for seasonal, recreational, or occasional use. Census 2000 had a separate tabulation for migrant workers, which showed no vacancies. The 679 seasonal units, then, were mostly second homes and beach-oriented rental properties. Another 72 units were vacant and off the market. Vacancy Rate and Household Size The 2005 DOF estimated vacancy rate is 3.5 percent and the average household size is 3.9 persons. Compared to the 2000 DOF estimates, the 2005 vacancy rate is the same but the persons per household is up slightly from 3.85 persons per unit. Household size is a statistic that may be misleading. Young families with two small children are counted the same April 2006 Draft Background Report Page Oxnard_GP_Demographics_2006_04_20 MRD.doc
43 City of Oxnard General Plan Draft as four adults, but they are different situations. Likewise, the 2005 average household size of nearly four persons per housing unit masks the distribution, as stated in an earlier section. Substandard (Lacking Complete Plumbing Facilities) Census 2000 uses the presence of complete plumbing facilities as a proxy for overall housing unit quality. In 2000, only 413 units in Oxnard had incomplete plumbing facilities, barely one percent of the housing stock. These data were based on the occupants self-response to the census, and were based on a sample of all units. Mobile and Manufactured Homes In 2000, over 7,300 residents lived in mobile or manufactured homes, and 77 percent owned their unit. These units were, and remain, an important source of affordable housing for about 1 in 25 Oxnard residents. Housing Age Profile The date when housing was constructed is a useful proxy for size, quality, location, and value or rent. In general, older housing is usually smaller in size, has fewer bathrooms and amenities, and is of lower relative value or rent compared to newer housing. Older housing is usually located near the center of a community, while newer housing is located at the edges. Oxnard s many neighborhoods were largely developed as medium and large scale tract developments, and whole neighborhoods are of similar housing style and age. Over time, some types of housing age better than others, in terms of physical quality and market desirability. Over the next 25 years of this General Plan, selected neighborhoods can be expected to change significantly, reflecting Oxnard s changing demographics interacting with the existing and new housing stock. Table 2-6 shows the distribution of the city s housing stock, followed by a short list of characteristics for the major age periods. Pre-1940 (3,227 units, 6.5%) housing is a mix of low-scale apartments and small to large homes in central Oxnard. The Henry T. Oxnard Historic District is the single largest and best preserved area. Many of these older homes have been remodeled and sit on relatively large lots. Others are small and would be considered below current market standards to 1969 (17,240 units, 34.9%) housing represents the postwar boom of tract housing, mostly in South and central Oxnard. These are almost all one-story ranch style homes on relatively large lots, by current standards. Many may have carports or only one garage. These homes have potential for significant expansion and remodeling. Page 2-16 Draft Background Report April Oxnard_GP_Demographics_2006_04_20 MRD.doc
44 Draft 2. Demographics, Housing and Economics Table 2-6 Oxnard Housing Age Originally built Number of units Percent 2000 to , % 1995 to , % 1990 to , % 1980 to , % 1970 to , % 1960 to , % 1950 to , % 1940 to , % 1939 or earlier 1, % TOTAL 49,399 Median year built 1,972 Source: Census 2000 and CA Department of Finance 970 to 1989 (19,534 units, 39.5%) is the period when condominiums and planned developments began to appear in the city, mostly in the west and northwest areas. More of these homes are two-story and many have Homeowners Associations (HOA) that maintain common open space areas. Lots were beginning to be smaller and in the more dense developments, expansion is limited by space and/or other regulations to 2005 (9,398 units, 19%) saw reduced lot sizes and mostly twostory homes, and most of these units were for-sale, single-family, and detached relatively large houses. During this period, the latent defect liabilities associated with multiunit condominiums steered most development towards single-family homes on relatively small parcels, and almost all within an HOA framework. These developments were largely located around the northeastern, northwestern, and western areas of Oxnard. Population and Housing Interaction This section suggests a conceptual framework for the interaction of the city s current and future population with its current and future housing stock. Assuming that the city must grow to some extent because of natural increase and housing developments already approved but not yet constructed, there are only six ways growth can be accommodated in terms of housing, as follows: 1. New Housing: New housing development, net of any demolitions required to prepare the site, will continue to play a large role in the City s growth for at least 10 years. There are about 7,000 units either under construction, fully entitled but not yet constructed, or anticipated by the April 2006 Draft Background Report Page Oxnard_GP_Demographics_2006_04_20 MRD.doc
45 City of Oxnard General Plan Draft 1990 General Plan and likely to be entitled. New housing, with the exception of required affordable units and public assisted housing, is relatively expensive, compared to the existing housing stock and to the incomes of most Oxnard residents. Still, many residents and in-migrants have accumulated housing equity that can allow them to purchase a new home. In short, if you already own a home, you are more likely to be able to afford a new home. It is renters who are least likely to be able to afford new market-rate homes unless, they are smaller condominium apartments. 2. Larger Existing Households: Natural increase growth largely occurs within existing households, as children are born to existing households. Households may also increase in size as older children continue to live with their parents, and/or relatives are added to create multi-generation extended families. Anecdotal evidence suggests some new homes are being purchased by four and five related wage-earners, none of whom individually have a relatively large income. Within household growth is largely beyond the control of local government. The only indirect tools a local government may have, should it desire to have some influence on within household growth, are regulations on parking and/or additions. 3. Replacement Households: Over the next 25 years, many Oxnard households will dissolve as the residents either consolidate with other households, move into group quarters (i.e. nursing home), move out of Oxnard, or die. These units will come onto the market and be available to in-migrating households, newly formed households out of the local population (i.e. children getting their own place ), or local households moving within the city (who, in turn, free up another unit). This churning of the housing market may gradually reduce household sizes if in-migrant households are generally smaller than the households they replace. Or just as likely, household sizes may increase as young families replace one and two person older households. 4. Reduced Vacancy Rate: The city s vacancy rate in 1990 was 4.72 percent, about 25% higher than in While the actual numbers of units is not large, filling vacant units with households is another way of adding population that, in some communities, is a significantly large number. In Oxnard s case, the increase in seasonal vacancies has largely offset the relative reduction in for-rent and for-sale vacancies. 5. New or Expanded Group Quarters: This category has also played a minor role in Oxnard, as the city s group quarters population has remained in the low 2,000 s for over 20 years. In other cities, adding a prison or military barracks could play a large role in population change. Page 2-18 Draft Background Report April Oxnard_GP_Demographics_2006_04_20 MRD.doc
46 Draft 2. Demographics, Housing and Economics 6. Homeless and Transient Housing: Oxnard s homeless and transient population is relatively small, but is of continuing concern. Cities around the Gulf Coast were inundated by people displaced by Hurricane Katrina, and suddenly the homeless and transient population was their biggest concern. While not anticipated in the Oxnard area, it remains a possibility that the city could find itself hosting a displaced population due to a nearby natural disaster. 2.6 Population Projections and Growth As discussed earlier in this section, planning to a population projection is not encouraged by the planning profession. Yet, in reality and because of the nature of State Housing Element law, communities do look at projections as a starting place in a General Plan Update. There are basically two ways of working with projections, expressed as questions. One way is to ask, What population projection (or growth rate) do we agree on, and where will we build the housing? The other way is, What kind of community do we want, how many people will it accommodate, and how does that compare to the projections? Either approach is a policy decision that is not part of the Background Report. Below are four projections prepared by Planning staff and the UCSB Economic Forecast Project that set the projection bookends for the General Plan Update. (The existing 1990 General Plan projection and the SCAG 2030 forecast have both been discussed earlier in this section.) Each projection begins with the same data for 2005 (using a 2005 city population of 192,232 which is part of the larger data set used by UCSB and retained for continuity purposes), and assumes there are 7,000 new units to be constructed in the city within the next seven years. Each projection has the same birth and death rate assumptions (natural increase), and allows little change in household size. 1. Market Trend Extended: This projection uses historic migration and growth data from 1986 to 2005 and extends this market demand trend to 2030 to calculate how many housing units would be needed to accommodate market-driven growth. Housing production is allowed to rise to whatever level is necessary to accommodate net migration and net natural increase at roughly four persons per unit. The resulting 2030 population is 285,500 and the city adds 23,881 housing units. Overall growth is 50 percent, or 2.0 percent per year. 2. Baseline: Known Projects Plus Natural Increase: This projection assumes 7,000 new units are constructed by 2015, and then only allows housing to grow to match population growth due to natural increase. Migration is not allowed until after natural increase is accommodated. This April 2006 Draft Background Report Page Oxnard_GP_Demographics_2006_04_20 MRD.doc
47 City of Oxnard General Plan Draft projection essentially asks the question, What is needed to take care of our own growth? By 2030, the population has grown to 278,500, an increase of 47 percent, or 1.8 percent per year. 3. Baseline Plus 350 Units per Year: This projection is Baseline with the addition of 350 units in each year from 2016 to By 2030, the population has grown to 239,000, an increase of 26 percent, or 1.0 percent per year. Under these assumptions, natural increase local residents have to leave the city because of the lack of housing, and inmigrants are accommodated only in the first ten years projections for the City range from 238,900 to 285, Baseline Plus 750 Units per Year: This projection is Baseline with the addition of 750 units in each year from 2016 to By 2030, the population has grown to 260,000, an increase of 37 percent, or 1.5 percent per year. Under these assumptions, a much smaller number of natural increase local residents have to leave the city because of the lack of housing. The four projections are summarized in Table 2-7 below. Table 2-7 Bookend Projections Bookend Projections Market Trend Baseline (7,000) Baseline +500/year Baseline +1,000/year 2005 Population 189, , , ,996 Units added 23,881 22,124 12,250 17,500 Population added 95,525 88,495 49,000 70,000 Average annual population gain 3,821 3,540 1,960 2,800 Overall growth compared to % 46.6% 25.8% 36.8% 2030 population 285, , , ,996 Average annual growth (2005) 2.0% 1.86% 1.0% 1.5% Migration allowed? Yes Almost All No No Natural Increase accommodated? Yes Yes No No Source: City of Oxnard, UCSB, 2006 Page 2-20 Draft Background Report April Oxnard_GP_Demographics_2006_04_20 MRD.doc
48 Draft 2. Demographics, Housing and Economics 2.7 Fiscal Conditions California local government finances have been challenged in recent years and the State of California has responded to its financial problems, in part, by reducing local government funding. Even so, Oxnard has not shared in the financial distress that has become common for many California cities and counties. In fact, the city s finances have actually improved; Oxnard has run operating surpluses in seven of the past ten years and in every year since fiscal A summary of Oxnard s fiscal status is provided in Table 2-8 and Figures 2-5 and 2-6. Oxnard has not shared in the financial distress that has become common for California Cities. In fiscal year 2004 Oxnard ran a surplus of $840,000. While this surplus was down significantly from those of the previous five years, it needs to be viewed in the context of the stresses that California s finances have placed on local government finances and on expenditure and revenue trends. In the current circumstances, many California cities would be pleased to be in the same financial condition as Oxnard. Oxnard s revenues and expenses have grown, in real and nominal terms, over the past decade, but revenues have grown more rapidly than expenses. In fiscal 1995, the city had revenues of $114.2 million (2004 dollars) and expenses of $117.1 million (2004 dollars). By fiscal 2004, revenues had increased to $145.5 million (2004 dollars), while expenditures had grown to $144.6 million (2004 dollars). The composition of the budget has also changed. Public Safety has become an increasingly larger component of spending. That increase has been offset in part by decreases in Community Development spending and increased local revenue streams. On the revenue side, Oxnard has successfully reduced its reliance on volatile State funding and increased its reliance on generally less volatile Property and Sales Taxes and Development and Service fees. Revenues Oxnard s nominal revenues have grown 59 percent in the past decade, from $91.5 million in fiscal 1995 to $145.5 million in fiscal In inflation adjusted terms the growth rate was a smaller-but-significant 27 percent. As mentioned above, California s budget issues have had a serious detrimental impact on local government financing. In Oxnard s case, real inflation adjusted Inter-Governmental transfers fell by a rather large 78 percent, from $53.7 million (2004 dollars) in fiscal 2000 to $30.2 million April 2006 Draft Background Report Page Oxnard_GP_Demographics_2006_04_20 MRD
49 City of Oxnard General Plan Draft (2004 dollars) in fiscal This was after a real cut of over $3.5 million between fiscal 2000 and fiscal These transfers have crept back up a bit since fiscal 2001, to a still relatively low $40.8 million in fiscal Table 2-8 Government Fiscal Accounts, Oxnard, 1995 to Year ending June thousands of dollars Expenditures General Government 6,890 5,520 7,070 7,016 7,580 7,602 7,713 9,787 9,781 11,444 Public Safety 29,668 29,676 34,058 35,691 32,863 38,888 40,353 44,561 48,495 55,857 Public Works 3,778 3,983 4,081 4,296 3,990 5,170 5,385 4,744 8,410 8,108 Community Development 20,471 22,381 20,109 22,253 25,786 25,248 13,032 15,269 20,455 17,912 Culture/Leisure/Other 8,243 7,738 7,728 7,788 8,772 8,239 7,799 10,362 10,803 14,644 Debt Service 5,499 5,951 4,450 4,139 4,978 6,673 4,738 4,401 6,704 5,011 Capital Outlay 19,253 21,427 27,523 26,262 23,028 23,469 16,294 23,795 22,199 31,640 TOTAL Expenditures 93,803 96, , , , ,289 95, , , ,616 Revenues Taxes 36,276 37,711 36,977 39,024 38,111 42,055 51,637 59,059 59,303 69,686 General Property Taxes 17,568 17,401 17,521 17,963 15,058 17,417 23,575 26,056 29,234 35,427 Storm Drain Taxes General Sales Taxes 12,874 14,675 13,481 14,867 15,499 17,357 18,140 19,846 20,776 22,772 Transient Occupancy Taxes 1,348 1,445 1,627 1,763 1,908 1,877 2,328 2,322 2,248 2,223 Franchise Taxes 2,414 1,873 1,886 1,812 2,842 2,507 4,807 7,085 2,830 3,719 Business License Taxes 1,877 2,039 2,221 2,304 2,432 2,551 2,203 3,195 3,366 4,386 Deed Taxes ,159 Licenses and Permits 1,050 1,267 1,610 1,391 2,213 2,474 2,211 1,987 2,862 2,183 Inter-Governmental 38,063 41,482 40,930 45,809 49,262 47,736 27,715 37,691 38,509 40,835 Growth/Development Fees 1,647 3,562 3,676 4,332 5,233 11,840 8,049 7,433 8,797 9,004 Charges for Current Svcs 2,413 3,217 2,760 3,721 7,191 6,697 6,070 7,909 12,023 11,105 Fines and Forfeitures ,212 1,699 1,284 1, ,198 Interest 3,676 3,617 3,743 3,327 4,242 5,209 4,389 4,588 3,859 4,547 Miscellaneous 7,427 7,429 5,459 5,610 5,898 7,009 4,738 5,088 4,784 6,899 TOTAL Revenues 91,501 99,168 95, , , , , , , ,458 Balance (Surplus + / Deficit - ) -2,302 2,490-9,059-3,367 6,364 9,430 10,779 12,248 4, Source: City of Oxnard, Comprehensive Annual Financial Report (CAFR), Fiscal Year 2004 Oxnard coped with the revenue cut at first by dramatically cutting expenses in 2001, particularly Capital Outlays and Community Development. As discussed in the following section, the Community Development cut has turned out to be more or less permanent. Capital Outlays have more than recovered, and total spending has climbed significantly since fiscal While many revenue sources have increased, in real terms, to help fund the growth in spending, the bulk of new funds have come from Property Taxes, Sales Taxes, and Service Fees. Figures 2-7 and 2-8 present a summary of Oxnard s revenue composition from 1995 to Page 2-22 Draft Background Report April Oxnard_GP_Demographics_2006_04_20 MRD.doc
50 Draft 2. Demographics, Housing and Economics Figure 2-5 Tax Composition, Oxnard, 1995 to % 90% 80% 70% 60% 50% 40% 30% 20% 10% 0% Deed Taxes Business Franchise Taxes Transient Occupancy Taxes General Sales Taxes Storm Drain Taxes General Property Taxes Source: City of Oxnard, Comprehensive Annual Financial Report (CAFR), Fiscal Year 2004 Figure 2-6 Revenues, Expenditures, and Balance, Oxnard, 1995 to , , , ,000 80,000 60,000 40,000 20, ,000 10,000 5, ,000-10,000-15, Total Revenues Total Expenditures Balance (Surplus + / Deficit - ) Source: City of Oxnard, Comprehensive Annual Financial Report (CAFR), Fiscal Year 2004 April 2006 Draft Background Report Page Oxnard_GP_Demographics_2006_04_20 MRD.doc
51 City of Oxnard General Plan Draft Figure 2-7 Revenue Composition, Oxnard, 1995 to % 90% 80% 70% 60% 50% 40% 30% 20% 10% 0% Miscellaneous Interest Fines and Forfeitures Charges for Current Svcs Growth/Development Fees Inter-Governmental Licenses and Permits Deed Taxes Business License Taxes Franchise Taxes Transient Occupancy Taxes General Sales Taxes Storm Drain Taxes General Property Taxes Source: City of Oxnard, Comprehensive Annual Financial Report (CAFR), Fiscal Year 2004 Figure 2-8 Selected Revenue Comparison, Oxnard, 1995 to ,000 70,000 60,000 50,000 40,000 30,000 20,000 10, Total Taxes Inter-Governmental, Growth/Development Fees, Charges for Current Services Source: City of Oxnard, Comprehensive Annual Financial Report (CAFR), Fiscal Year 2004 Page 2-24 Draft Background Report April Oxnard_GP_Demographics_2006_04_20 MRD.doc
52 Draft 2. Demographics, Housing and Economics A real estate construction boom and rising land values have significantly contributed to Oxnard s current financial health. Development and Service Fees and Property taxes have exceeded forecasts. At the same time, new shopping facilities, particularly The Esplanade, have generated very strong Retail Sales Tax growth. As a result of these changes, Taxes, which lagged Inter-Governmental transfers by approximately $13 million in fiscal 1999, exceeded Inter- Governmental transfers by approximately $29 million in fiscal Given the behavior of the California State Government in recent business cycles, the new revenue structure is probably less volatile than the one that existed in fiscal Expenditures Public Safety and Capital Outlay dominate Oxnard s fiscal 2004, expenditures. Combined, they are over half of the city s expenditures. The trend over the past few years has been for large increases in Public Safety spending, while Capital Outlay spending has been volatile. A summary of Oxnard s expenditure composition is provided in Figures 2-9 and Oxnard s fiscal 2004 Public Safety spending of $55.9 million (38.6 percent of total fiscal 2004 expenditures) comprised, by far, the largest component of city spending. This is up significantly from the mid-1990 s as a percentage of expenditures, but down a bit from the percentage in the early 2000 s. In real, inflation adjusted, 2004 dollars, fiscal 2004 s Public Safety expenditures are much larger than any previous year. In fact, fiscal 2004 s real spending was up 11.5 percent from fiscal 2003 s second highest amount, $50.1 million in 2004 dollars. Tables 2-9 and 2-10 present a summary of expenditures and revenues from 1995 to April 2006 Draft Background Report Page Oxnard_GP_Demographics_2006_04_20 MRD.doc
53 City of Oxnard General Plan Draft Figure 2-9 Expenditure Composition, Oxnard, 1995 to % 90% 80% 70% 60% 50% 40% 30% 20% 10% 0% Capital Outlay Debt Service Culture/Leisure/Other Community Development Public Works Public Safety General Government Source: City of Oxnard, Comprehensive Annual Financial Report (CAFR), Fiscal Year 2004 Figure 2-10 Selected Expenditure Comparison, Oxnard, 1995 to ,000 50,000 40,000 30,000 20,000 10, Public Safety Community Development Capital Outlay Source: City of Oxnard, Comprehensive Annual Financial Report (CAFR), Fiscal Year 2004 Page 2-26 Draft Background Report April Oxnard_GP_Demographics_2006_04_20 MRD.doc
54 Draft 2. Demographics, Housing and Economics Table 2-9 Composition of Revenues and Expenditures, Oxnard, 1995 to Year ending June percent share Expenditures General Government Public Safety % 33.2% 30.7% 33.7% 42.3% Public Works % 4.0% 3.7% 4.5% 5.6% Community Development % 20.7% 24.1% 21.9% 13.7% Culture/Leisure/Other % 7.2% 8.2% 7.1% 8.2% Debt Service % 3.9% 4.7% 5.8% 5.0% Capital Outlay % 24.4% 21.5% 20.4% 17.1% TOTAL Expenditures Revenues Taxes % 37.5% 33.6% 33.7% 48.7% General Property Taxes % 17.3% 13.3% 14.0% 22.2% Storm Drain Taxes % 0.0% 0.0% 0.0% 0.0% General Sales Taxes % 14.3% 13.7% 13.9% 17.1% Transient Occupancy Taxes % 1.7% 1.7% 1.5% 2.2% Franchise Taxes % 1.7% 2.5% 2.0% 4.5% Business License Taxes % 2.2% 2.1% 2.0% 2.1% Deed Taxes % 0.3% 0.3% 0.3% 0.6% Licenses and Permits % 1.3% 2.0% 2.0% 2.1% Inter-Governmental % 44.0% 43.5% 38.3% 26.1% Growth/Development Fees % 4.2% 4.6% 9.5% 7.6% Charges for Current Svcs % 3.6% 6.3% 5.4% 5.7% Fines and Forfeitures % 0.8% 0.8% 1.1% 1.4% 1.2% Interest % 3.9% 3.2% 3.7% 4.2% 4.1% Miscellaneous % 5.7% 5.4% 5.2% 5.6% 4.5% TOTAL Revenues Source: City of Oxnard, Comprehensive Annual Financial Report (CAFR), Fiscal Year 2004 April 2006 Draft Background Report Page Oxnard_GP_Demographics_2006_04_20 MRD.doc
55 City of Oxnard General Plan Draft Table 2-10 Government Fiscal Accounts Percent Change, Oxnard, 1995 to Year ending June annual percent change Expenditures (growth) General Government NA -19.9% 28.1% -0.8% 8.0% 0.3% 1.5% 26.9% -0.1% 17.0% Public Safety NA 0.0% 14.8% 4.8% -7.9% 18.3% 3.8% 10.4% 8.8% 15.2% Public Works NA 5.5% 2.5% 5.2% -7.1% 29.6% 4.2% -11.9% 77.3% -3.6% Community Development NA 9.3% -10.2% 10.7% 15.9% -2.1% -48.4% 17.2% 34.0% -12.4% Culture/Leisure/Other NA -6.1% -0.1% 0.8% 12.6% -6.1% -5.3% 32.9% 4.2% 35.6% Debt Service NA 8.2% -25.2% -7.0% 20.3% 34.0% -29.0% -7.1% 52.3% -25.3% Capital Outlay NA 11.3% 28.5% -4.6% -12.3% 1.9% -30.6% 46.0% -6.7% 42.5% TOTAL Expenditures NA 3.1% 8.6% 2.3% -0.4% 7.7% -17.3% 18.5% 12.3% 14.0% Revenues (growth) Taxes NA 4.0% -1.9% 5.5% -2.3% 10.3% 22.8% 14.4% 0.4% 17.5% General Property Taxes NA -1.0% 0.7% 2.5% -16.2% 15.7% 35.4% 10.5% 12.2% 21.2% Storm Drain Taxes NA -93.5% NA NA NA NA NA NA NA NA General Sales Taxes NA 14.0% -8.1% 10.3% 4.3% 12.0% 4.5% 9.4% 4.7% 9.6% Transient Occupancy Taxes NA 7.2% 12.5% 8.4% 8.2% -1.6% 24.1% -0.3% -3.2% -1.1% Franchise Taxes NA -22.4% 0.7% -4.0% 56.9% -11.8% 91.8% 47.4% -60.1% 31.4% Business License Taxes NA 8.7% 8.9% 3.7% 5.5% 4.9% -13.6% 45.0% 5.4% 30.3% Deed Taxes NA 61.0% -12.7% 31.0% 18.0% -6.9% 68.3% -4.9% 53.0% 36.5% Licenses and Permits NA 20.6% 27.1% -13.6% 59.1% 11.8% -10.6% -10.1% 44.0% -23.7% Inter-Governmental NA 9.0% -1.3% 11.9% 7.5% -3.1% -41.9% 36.0% 2.2% 6.0% Growth/Development Fees NA 116.3% 3.2% 17.9% 20.8% 126.3% -32.0% -7.7% 18.4% 2.4% Charges for Current Svcs NA 33.3% -14.2% 34.8% 93.3% -6.9% -9.4% 30.3% 52.0% -7.6% Fines and Forfeitures NA -7.0% -8.7% 7.2% 40.1% 40.2% -24.4% 9.9% -39.6% 40.5% Interest NA -1.6% 3.5% -11.1% 27.5% 22.8% -15.7% 4.5% -15.9% 17.8% Miscellaneous NA 0.0% -26.5% 2.8% 5.1% 18.8% -32.4% 7.4% -6.0% 44.2% TOTAL Revenues NA 8.4% -3.2% 8.5% 8.9% 10.0% -14.9% 18.0% 4.7% 11.0% Source: City of Oxnard, Comprehensive Annual Financial Report (CAFR), Fiscal Year 2004 Oxnard s Capital Outlay spending was $31.6 million in fiscal 2004, or 21.9 percent of total spending. Nominally, this is the highest spending in this category over the past decade. However, when adjusted for inflation, Capital Outlay spending in fiscal 1997 was higher than in fiscal 2004, while Capital Outlay spending in fiscal 1998 was almost identical to that of fiscal As a percentage of total spending, fiscal 2004 s Capital Outlay was below that of 1996 through A summary of Oxnard s fiscal accounts is provided in Table Page 2-28 Draft Background Report April Oxnard_GP_Demographics_2006_04_20 MRD.doc
56 Draft 2. Demographics, Housing and Economics Table 2-11 Government Fiscal Accounts (Real), Oxnard, 1995 to Year ending June thousands of real 2004 dollars Expenditures General Government 8,602 6,778 8,533 8,351 8,817 8,560 8,399 10,376 10,104 11,444 Public Safety 37,036 36,440 41,104 42,482 38,227 43,788 43,944 47,246 50,096 55,857 Public Works 4,716 4,891 4,926 5,113 4,642 5,821 5,864 5,030 8,687 8,108 Community Development 25,555 27,482 24,269 26,487 29,995 28,429 14,191 16,190 21,130 17,912 Culture/Leisure/Other 10,290 9,502 9,327 9,270 10,204 9,277 8,493 10,987 11,159 14,644 Debt Service 6,865 7,307 5,371 4,927 5,791 7,514 5,159 4,667 6,925 5,011 Capital Outlay 24,034 26,311 33,217 31,259 26,787 26,426 17,744 25,229 22,933 31,640 TOTAL Expenditures 117, , , , , , , , , ,616 Revenues Taxes 45,284 46,306 44,626 46,449 44,332 47,354 56,231 62,618 61,262 69,686 General Property Taxes 21,931 21,367 21,146 21,381 17,516 19,611 25,672 27,626 30,199 35,427 Storm Drain Taxes General Sales Taxes 16,071 18,020 16,270 17,696 18,029 19,544 19,754 21,042 21,462 22,772 Transient Occupancy Taxes 1,683 1,775 1,963 2,098 2,219 2,113 2,535 2,462 2,322 2,223 Franchise Taxes 3,013 2,299 2,277 2,156 3,306 2,822 5,235 7,512 2,924 3,719 Business License Taxes 2,343 2,504 2,680 2,742 2,829 2,872 2,399 3,387 3,477 4,386 Deed Taxes ,159 Licenses and Permits 1,311 1,555 1,942 1,656 2,574 2,786 2,408 2,107 2,957 2,183 Inter-Governmental 47,515 50,937 49,396 54,525 57,303 53,751 30,180 39,963 39,780 40,835 Growth/Development Fees 2,056 4,374 4,436 5,157 6,087 13,332 8,766 7,880 9,087 9,004 Charges for Current Svcs 3,013 3,950 3,331 4,429 8,365 7,541 6,610 8,385 12,420 11,105 Fines and Forfeitures 1,186 1, ,030 1,410 1,913 1,399 1, ,198 Interest 4,589 4,441 4,518 3,960 4,934 5,866 4,780 4,865 3,986 4,547 Miscellaneous 9,271 9,122 6,588 6,677 6,861 7,892 5,159 5,395 4,942 6,899 TOTAL Revenues 114, , , , , , , , , ,458 Balance (Surplus + / Deficit - ) -2,873 3,058-10,933-4,007 7,403 10,618 11,738 12,986 4, Source: City of Oxnard, Comprehensive Annual Financial Report (CAFR), Fiscal Year 2004, CA Department of Finance With Public Safety taking a larger portion of the budget, all other categories had to become proportionately smaller. Community Development expenditures dropped from 21.8 percent in fiscal 1995 to only 12.4 percent of the budget in fiscal 2004, while Public Safety expenditures grew from 31.6 percent in fiscal 1995 to 38.6 percent of the budget in fiscal April 2006 Draft Background Report Page Oxnard_GP_Demographics_2006_04_20 MRD.doc
57 City of Oxnard General Plan Draft 2.8 Labor Trends For Ventura County and Oxnard, jobs and labor force are two population sets that are not balanced within their respective areas. Ventura County, with about 400,000 workers and about 300,000 jobs, has about 100,000 more workers than jobs. Oxnard, with about 85,000 workers and about 60,000 jobs, has about 25,000 more workers than jobs. In both cases, workers commute to other areas, mostly into Los Angeles County. Oxnard has 25,000 more workers than jobs. Most of Oxnard s 2005 population age 16-years and over was either working, (57.8 percent) or voluntarily not in the labor force (36.9 percent). These percentages are similar to West Ventura County and California as presented in Table However, Oxnard s 2005 Unemployment Rate of 7.3 percent was significantly higher than Ventura County s 5.1 percent, and exceeded by only Santa Paula s 8.0 percent. In large part, the city s high unemployment rate is largely due to seasonal agricultural employment. Oxnard s workers differ from Ventura County workers. They are more likely to be Latino, have lower educational attainment, be younger, and have lower incomes. Figures 2-11 and 2-12 present information on Oxnard s employment characteristics. Table 2-12 Unemployment Rate, Various Areas, 2005 Area Unemployment Rate Camarillo 3.5% Thousand Oaks 3.7% Simi Valley 4.2% San Buenaventura 5.0% Ventura County 5.1% California 7.0% Oxnard 7.3% Santa Paula 8.0% Source: Site Reports, 2005 Page 2-30 Draft Background Report April Oxnard_GP_Demographics_2006_04_20 MRD
58 Draft 2. Demographics, Housing and Economics Figure 2-11 Population 16-over Employment Status, Oxnard, West Ventura County, and California, 2005 percent of population In Armed Forces Civilian - Employed Civilian - Unemployed Not in Labor Force Source: Site Reports, 2005 Oxnard West Ventura County California Figure 2-12 Worker Type, Oxnard and California, 2005 percent For-Profit Private Workers Non-Profit Private Workers Local Government Workers State Government Workers Federal Government Workers Self-Emp Workers Unpaid Family Workers Source: Site Reports, 2005 Oxnard California April 2006 Draft Background Report Page Oxnard_GP_Demographics_2006_04_20 MRD.doc
59 City of Oxnard General Plan Draft 2.9 Jobs Oxnard s job composition is quite different than that of California as a whole. Most notably, a large portion of Oxnard s workforce is employed in Agriculture and Production/Transportation/Material Moving. In contrast, a much smaller proportion of Oxnard s workforce is employed in the Professional, and Management/Business/Financial Sectors compared to California, as presented in Figure Oxnard also has relatively fewer self-employed workers than is typical in California. About 5.4 percent of the city s workers are self-employed, while about 8.4 percent California workers are self-employed. Figure 2-13 Occupation Shares, Oxnard and California, 2005 Production/Transportation/Material Moving Construction/Extraction/Maintainance Farming/Fishing/Forestry Sales/Office Service Professional Management/Business/Financial Source: Oxnard California Site Reports, Horizontal scale measured in percent. Even though Oxnard has higher-than-typical representation in the Agricultural and Industrial Sectors, they are not necessarily the City s largest sectors by jobs. The largest sector is the Service Sector, which accounts for about 24 percent (12,682) of all private-sector jobs. Agriculture, with 21 percent (11,605) of private sector jobs, and Retail Trade with 19 percent (10,188) of private sector jobs, are the other major Oxnard private-sector employment industries. In comparison, government (all types), has 7,309 jobs. Figures 2-14 to 2-16 present information on Oxnard s employment distribution. This data is for the Oxnard Metro Area as defined by zip codes Page 2-32 Draft Background Report April Oxnard_GP_Demographics_2006_04_20 MRD.doc
60 Draft 2. Demographics, Housing and Economics Figure 2-14 Employment Distribution, Oxnard, 2005 Finance, Ins. & Real Estate 7% Services 24% Retail Trade 19% Agriculture 21% Wholesale Trade 6% Trans., Comm. & Utilities 5% Non-Durable Goods 7% Durable Goods 7% Mining <1% Construction 4% Source: California Employment Development Department.. The Metro Area is slightly larger than the incorporated city boundary and is defined by zip codes to Figure 2-15 Employment by Industry, Oxnard, 2005 Services Finance, Ins. & Real Estate Retail Trade Wholesale Trade Trans., Comm. & Utilities Non-Durable Goods Durable Goods Construction Mining Agriculture 0 3,000 6,000 9,000 12,000 15,000 18,000 21,000 Jobs Source: California Employment Development Department.. The Metro Area is slightly larger than the incorporated city boundary and is defined by zip codes to April 2006 Draft Background Report Page Oxnard_GP_Demographics_2006_04_20 MRD.doc
61 City of Oxnard General Plan Draft Figure year Employment Growth by Industry, Oxnard, 2005 Services Finance, Ins. & Real Estate Retail Trade Wholesale Trade Trans., Comm. & Utilities Non-Durable Goods Durable Goods Construction Mining Agriculture Jobs Source: California Employment Development Department.. The Metro Area is slightly larger than the incorporated city boundary and is defined by zip codes to Oxnard job growth was relatively high in the 1990s with the exception of With the recession of , the city saw a decline in the job growth rate. However, it is notable that Oxnard gained jobs in every year of the recession. More recently, Oxnard s job growth has been very strong. Jobs grew by 4.8 percent in 2003 and 3.5 percent in 2004, as presented in Figure The Durable and non-durable Manufacturing Sectors were Oxnard s most rapidly growing sectors in 2004, with growth rates of 9.2 percent and 14.6 percent, respectively. However, the larger Service and Agriculture Sectors generated more jobs. In 2004, the Services Sector created 689 net new jobs, while the Agriculture Sector created 332 net new jobs. Somewhat surprisingly, the Finance, Insurance, and Real Estate Sector and the Retail Sector showed job losses in The very small Mining Sector continued its long-term decline. Durable goods manufacturing, with a 2004 average annual salary of $73,850, is Oxnard s highest paying sector. The Finance, Insurance and Real Estate Sector and the small Mining Sector are other well paying industries. Agriculture and Retail Trade are the city s lowest paid sectors with 2004 average annual salaries of $21,082 and $23,073, respectively. Figure 2-18 presents a comparison of the average salary by industry for Oxnard in Page 2-34 Draft Background Report April Oxnard_GP_Demographics_2006_04_20 MRD.doc
62 Draft 2. Demographics, Housing and Economics Oxnard experienced consistent salary growth through 2005, even during one recession. In fact, in three of the past five years the average annual salary grew by over 5 percent. Given the low inflation rate of recent years, many but not all of Oxnard workers are seeing real salary gains. Many of these gains are concentrated in industries where technology gains are generating rapid productivity increases. They also likely represent changes in job distributions, particularly those observed in the Durable Goods Manufacturing Sector. Tables 2-17 to 2-19 present a summary of Oxnard s salary information by job sector and classification for various years. Figure 2-17 Total Employment and Growth, Oxnard, 1993 to 2007 line: jobs 70,000 bar: percent 60 60, , , , , Note: The last three years are estimated / forecasted Source: California Employment Development Department.. The Metro Area is slightly larger than the incorporated city boundary and is defined by zip codes to April 2006 Draft Background Report Page Oxnard_GP_Demographics_2006_04_20 MRD.doc
63 City of Oxnard General Plan Draft Figure 2-18 Average Salary by Industry, Oxnard, 2005 Services Finance, Ins. & Real Estate Retail Trade Wholesale Trade Trans., Comm. & Utilities Non-Durable Goods Durable Goods Construction Mining Agriculture 0 10,000 20,000 30,000 40,000 50,000 60,000 70,000 80,000 90,000 dollars per worker Source: California Employment Development Department. The Metro Area is slightly larger than the incorporated city boundary and is defined by zip codes to Figure 2-19 Average Salary and Growth, Oxnard, 1993 to 2007 line: $ per worker 45,000 bar: percent 90 40, , , , , , , Note: The last three years are estimated / forecasted -15 Source: California Employment Development Department.. The Metro Area is slightly larger than the incorporated city boundary and is defined by zip codes to Page 2-36 Draft Background Report April Oxnard_GP_Demographics_2006_04_20 MRD.doc
64 Draft 2. Demographics, Housing and Economics Table 2-13 Oxnard, Employment by Major Sector, 1991 to 2004 Employment by Industry # of people Agriculture 8,514 9,260 9,429 8,829 8,600 8,932 9,171 9,815 10,215 11,008 10,323 10,720 11,273 11,605 percent change na Mining percent change na Construction 1,683 1, , ,030 1,177 1,566 1,574 1,713 1,723 1,942 1,824 percent change na Durables Manufacturing 2,394 2,384 2,027 1,771 2,039 2,250 3,126 3,425 3,229 3,240 3,200 3,167 3,163 3,454 percent change na Non-Durables Manufacturing 2,251 2,462 2,924 2,725 2,726 2,564 2,930 3,021 3,185 3,168 2,728 2,741 3,120 3,577 percent change na Transp., Comm., & Ut. (2) 1,606 1,678 1,690 1,840 2,486 2,614 2,505 2,580 2,617 2,643 2,567 2,363 2,268 2,371 percent change na Finance, Ins., & Real Est. (2) 1,426 1,522 1,503 1,514 1,579 1,446 1,411 1,436 1,517 1,540 2,566 2,871 3,659 3,597 percent change na Retail Trade (2) 8,017 7,602 8,312 8,821 8,822 8,835 8,654 8,807 9,461 9,313 9,708 10,003 10,259 10,188 percent change na Wholesale Trade 2,299 2,324 2,160 2,376 2,581 2,457 2,783 2,700 2,820 3,037 2,486 2,621 2,932 2,964 percent change na Services (2) 8,666 8,702 9,539 10,773 11,423 11,680 10,778 12,033 12,663 13,223 12,993 12,156 11,993 12,682 percent change na Public Sector 3,180 3,067 3,128 3,453 3,945 4,632 4,979 4,765 5,187 5,232 5,869 6,503 6,916 7,309 percent change na Private Sector 36,961 37,094 38,618 39,775 41,387 41,829 42,549 45,113 47,393 48,865 48,394 48,473 50,686 52,337 percent change na TOTAL, All Sectors 40,141 40,161 41,746 43,228 45,331 46,461 47,529 49,878 52,580 54,098 54,264 54,976 57,601 59,646 percent change na Notes: (1) The Oxnard Metropolitan Area is defined by zip codes (2) These sectors had significant changes in classification in 2001 Source: California Employment Development Department April 2006 Draft Background Report Page Oxnard_GP_Demographics_2006_04_20 MRD.doc
65 City of Oxnard General Plan Draft Table 2-14 Oxnard, Salary by Major Sector, 1991 to 2004 Average Salary By Industry dollars Agriculture 13,992 13,822 14,564 14,836 16,228 16,258 20,177 20,753 20,117 19,815 20,503 20,803 21,348 21,082 percent change na Mining 42,552 70,962 54,438 51,589 52,804 50,941 45,839 47,370 48,542 50,622 61,299 61,519 66,262 69,960 percent change na Construction 27,345 30,249 30,034 31,453 31,437 34,863 31,978 33,602 36,261 36,927 36,859 37,764 38,998 41,100 percent change na Durables Manufacturing 31,127 32,553 31,488 28,205 29,733 30,081 50,842 38,981 56,440 54,088 52,173 54,995 57,618 73,850 percent change na Non-Durables Manufacturing 23,386 25,590 26,116 27,566 27,863 29,028 32,547 31,866 31,359 32,898 33,211 36,298 39,132 40,030 percent change na Transp., Comm., & Ut. (2) 26,359 27,803 28,328 27,120 29,348 30,800 33,623 31,466 35,664 36,604 39,834 40,074 41,443 44,996 percent change na Finance, Ins., & Real Est. (2) 26,706 28,124 29,215 29,094 31,666 38,698 46,020 44,379 47,367 51,460 44,396 49,015 55,540 58,324 percent change na Retail Trade (2) 14,027 13,618 14,994 15,091 15,726 15,970 17,031 18,396 19,308 20,077 22,160 21,728 22,354 23,073 percent change na Wholesale Trade 28,695 30,154 31,205 30,856 30,459 30,380 29,509 33,902 31,752 33,714 36,823 38,774 45,886 46,987 percent change na Services (2) 22,303 22,476 22,169 21,898 22,084 21,788 24,157 26,876 28,435 29,677 30,963 30,476 31,140 32,628 percent change na Public Sector 29,911 32,928 33,591 30,982 31,403 31,811 32,202 32,361 35,113 39,385 44,246 44,056 43,858 42,783 percent change na Private Sector 20,262 20,698 20,894 20,882 21,914 22,297 26,292 26,611 28,437 29,050 30,256 30,806 32,758 34,923 percent change na TOTAL, All Sectors 21,026 21,632 21,846 21,689 22,739 23,246 26,911 27,161 29,095 30,050 31,769 32,373 34,090 35,887 percent change na Notes: (1) The Oxnard Metropolitan Area is defined by zip codes (2) These sectors had significant changes in classification in 2001 Source: California Employment Development Department Page 2-38 Draft Background Report April Oxnard_GP_Demographics_2006_04_20 MRD.doc
66 Draft 2. Demographics, Housing and Economics Table 2-15 Oxnard Employment and Salary by Detailed Sector, Part 1 NAICS Code Title Establishments Employment (1) Average Salary 111 Crop Production 141 8,082 21, Animal Production 1 (2) (2) 114 Fishing, Hunting, and Trapping 1 (2) (2) 115 Support Activities for Agriculture and Forestry 37 3,346 21, Oil and Gas Extraction 1 (2) (2) 212 Mining (except Oil and Gas) 1 (2) (2) 213 Support Activities for mining , Utilities , Construction Buildings , Heavy and Civil Engineering Construction , Speciality Trade Contractors 132 1,177 43, Food Manufacturing , Beverage and Tobacco Product Manufacturing 1 (2) (2) 313 Textile Mills 2 (2) (2) 314 Textile Product Mills , Apparel Manufacturing 5 (2) (2) 321 Wood Product Manufacturing 1 (2) (2) 322 Paper Manufacturing , Printing and Related Support Activities , Petroleum and Coal Products Manufacturing 1 (2) (2) 325 Chemical Manufacturing 8 1,008 54, Plastics and Rubber Products Manufacturing , Nonmetallic Mineral Product Manufacturing , Primary Metal Manufacturing , Fabricated Metal Product Manufacturing , Machinery Manufacturing 19 1, , Computer and Electric Product Manufacturing , Electrical Equip., Appliance, and Component Manufacturing , Transportation Equipment Manufacturing , Furniture and Related Product Manufacturing , Miscellaneous Manufacturing , Merchant Wholesalers, Durable Goods 86 1,322 59, Merchant Wholesalers, Nondurable Goods 77 1,337 40, Wholesale Electric Markets, Agents, and Brokers , Motor Vehicle and Parts Dealers 64 1,480 44, Furniture and Home Furnishings Stores , Electronics and Appliance Stores , Building Material, Garden Equipment, and Supplies , Food and Beverage Stores 91 1,137 24, Health and Personal Care Stores , Gasoline Stations ,243 April 2006 Draft Background Report Page Oxnard_GP_Demographics_2006_04_20 MRD.doc
67 City of Oxnard General Plan Draft Table 2-15 Oxnard Employment and Salary by Detailed Sector, Part 1 (Continued) NAICS Code Title Establishments Employment (1) Average Salary 448 Clothing and Clothing Accessories Stores , Sporting Goods, Hobby, Book, and Music Stores , General Merchandise Stores 15 1,440 23, Miscellaneous Store Retailers , Nonstore Retailers ,921 Notes: Source: (1) Average of October, November, and December, (2) Data unavailable due to confidentiality restrictions, (3) The Oxnard Metropolitan Area is slightly larger than the incorporation boundary and defined by zip codes EDD-Labor Market Information Division ( th Quarter, 3-Digit North American Industry Classification System (NAICS) data for City of Oxnard, based on zip codes Table 2-16 Oxnard Employment and Salary by Detailed Sector, Part 2 NAICS Code Title Establishments Employment (1) Average Salary 481 Air Transportation 2 (2) (2) 484 Truck Transportation , Transit and Ground Passenger Transportation , Sceinic and Sightseeing Transporation , Support Activities Transportation , Postal Service 1 (2) (2) 492 Couriers and Messengers , Warehousing and Storage , Publishing Industries (except inernet) , Motion Picture and Sound Recording Industries 1 (2) (2) 515 Broadcasting (except intenet) , Internet Publishing and Broadcasting 1 (2) (2) 517 Telecommunications , Internet Service, Web Search, and Data Processing , Credit Intermediation and Related Activities , Securities, Commodities, and Other Financial , Insurance Carriers and Related Activities , Funds, Trusts, and Other Financial Vehicles 1 (2) (2) 531 Real Estate , Rental and Leasing Services , Professional, Scientific, and Technical Services 203 1,473 53, Management of Companies and Enterprises 14 1,202 59, Administrative and Support Services 157 3,465 22, Waste Management and Remediation Services , Educational Services , Ambulatiry Health Care Services 285 2,286 54, Hospitals 6 1,268 53, Nursing and Residential Care Facilities , Social Assistance , Performing Arts, Spectator Sports, and Related Industries ,922 Page 2-40 Draft Background Report April Oxnard_GP_Demographics_2006_04_20 MRD.doc
68 Draft 2. Demographics, Housing and Economics Table 2-16 Oxnard Employment and Salary by Detailed Sector, Part 2 (Continued) NAICS Code Title Establishments Employment (1) Average Salary 712 Museums, Historical Sites, and Similar Industries , Amusement, Gambling, and Recreation Industries , Accommodation , Food Services and Drinking Places 214 3,220 13, Repair and Maintenance , Personal and Laundry Services , Religious, Grantmaking, Civic, Professional, and Related , Private Households , Federal Government , State Government , Local Government 70 6,976 46, Nonclassificable Establishments ,307 TOTAL All industries 3,078 59,948 43,272 Notes: (1) Average of October, November, and December, (2) Data unavailable due to confidentiality restrictions, (3) The Oxnard Metropolitan Area is slightly larger than the incorporation boundary and defined by zip codes Source: EDD-Labor Market Information Division ( th Quarter, 3-Digit NAICS data for City of Oxnard, based on zip codes Cost and Service Standards Revenues City spending is largely determined by revenue, and revenue is subject to shocks. Shocks are events that are at best only partially foreseen. Oxnard s per-capita revenue has shown dramatic variation over the recent past, and the composition of that revenue has also changed. These changes were brought about by, most importantly, California s state government fiscal crises. The housing boom and Oxnard s growth have moderated some of the variation, contributed to the changes in composition, and minimized the impact of the California state government fiscal crises. Real per-capita revenue fell precipitously in 2001, to only about $660. Oxnard s real (inflation adjusted) per-capita revenue rose from 1995 to 1999, when it peaked at about $830 (2004 dollars). Real per-capita revenue slipped a bit in 2000, and then it fell precipitously in 2001, to only about $660 (2004 dollars). Rapid population growth and dramatic cuts in Inter-Governmental transfers were the cause of the 2001 decline. Real per-capita revenue resumed its growth in 2002, but with 2004 s real percapita revenue of about $780, is still significantly below the 1999 peak of $830. Information on real expenditures and revenues per capita are presented in Figure 2-20 and Table April 2006 Draft Background Report Page Oxnard_GP_Demographics_2006_04_20 MRD
69 City of Oxnard General Plan Draft Figure 2-20 Real Expenditures/Revenues per capita, Oxnard, 1995 to 2004 real 2004 dollars per person Real Expenditures per capita Real Revenues per capita Sources: City of Oxnard, CA Department of Finance, Unites States (US) Bureau of Labor Statistics Taxes and Inter-governmental Transfers are Oxnard s most important sources, but the relationship between Taxes and Inter-Governmental Transfers has changed. Inter-Governmental Transfers were 44 percent of total per-capita revenue in By 2004, this had fallen to only 28 percent of total per-capita revenue. Taxes by contrast, have become relatively more important. In 1999 and 2000 Taxes represented less than 34 percent or per-capita revenue. By 2004, Taxes represented almost 48 percent of per-capita revenue, nearly 50 percent higher than Expenditure and revenue details for 1995 to 2004 are presented in Figures 2-21 and As is the case with most California cities, Property Taxes and Sales Taxes are Oxnard s most significant tax sources. In 2004, the city collected an average of $190 in Property Taxes from each person, and about $122 in Sales Taxes. Rising real estate values and new construction have contributed to a dramatic increase in city Property Taxes. Real per-capita Real Estate Taxes have almost doubled from about $110 in 1999 to $190 in This Property Tax increase has partially mitigated the impact of cuts in Inter-Governmental Transfers, but it has also increased the city s exposure to a possible decline in real estate prices or declining construction. Page 2-42 Draft Background Report April Oxnard_GP_Demographics_2006_04_20 MRD.doc
70 Draft 2. Demographics, Housing and Economics Table 2-17 Real Expenditures and Revenues per capita, Oxnard, 1995 to Year ending June real 2004 dollars per person Expenditures (per capita) General Government Public Safety Public Works Community Development Culture/Leisure/Other Debt Service Capital Outlay TOTAL Expenditures Revenues (per capita) Taxes General Property Taxes Storm Drain Taxes General Sales Taxes Transient Occupancy Taxes Franchise Taxes Business License Taxes Deed Taxes Licenses and Permits Inter-Governmental Growth/Development Fees Charges for Current Svcs Fines and Forfeitures Interest Miscellaneous TOTAL Revenues Balance (Surplus + / Deficit - ) Source: City of Oxnard, Comprehensive Annual Financial Report (CAFR), Fiscal Year 2004, CA Department of Finance April 2006 Draft Background Report Page Oxnard_GP_Demographics_2006_04_20 MRD.doc
71 City of Oxnard General Plan Draft Figure 2-21 Real Expenditure Detail per capita, Oxnard, 1995 to 2004 percent share of total expenditures 100% 90% 80% 70% 60% 50% 40% 30% 20% 10% 0% Sources: General Government Public Safety Public Works Community Development Culture/Leisure/Other Debt Service Capital Outlay City of Oxnard, CA Department of Finance, US Bureau of Labor Statistics Figure 2-22 Real Revenue Detail per capita, Oxnard, 1995 to 2004 percent share of total revenues 100% 80% 60% 40% 20% 0% Taxes Licenses and Permits Inter-Governmental Growth/Development Fees Charges for Current Svcs Fines and Forfeitures Interest Miscellaneous Sources: City of Oxnard, CA Department of Finance, US Bureau of Labor Statistics Page 2-44 Draft Background Report April Oxnard_GP_Demographics_2006_04_20 MRD.doc
72 Draft 2. Demographics, Housing and Economics Figure 2-23 Real Tax Revenue Detail per capita, Oxnard, 1995 to 2004 percent share of total tax revenue 100% 80% 60% 40% 20% 0% General Property Taxes Storm Drain Taxes General Sales Taxes Transient Occupancy Taxes Franchise Taxes Business License Taxes Deed Taxes Sources: City of Oxnard, CA Department of Finance, US Bureau of Labor Statistics Oxnard s thriving residential real estate market has particularly contributed to increased Property Tax revenue. On average, Oxnard collected about $3,000 in tax revenues per housing unit in In the same year, the city collected about $6,200 per million square feet of commercial space. Real per-unit Residential collections grew by 19 percent from 2001 to 2004, while real Commercial collections per million square feet grew by 14 percent. Residential and commercial summaries for real expenditures are provided in Tables 2-18 and Oxnard s real per-capita Retail Sales tax revenue has increased from $8,400 (2004 dollars) in 1995 to $10,100 in 2004, an increase of 20 percent. Real per-capita Total Taxable Sales (Retail plus Business-to- Business plus Wholesale Taxable) grew from $10,000 (2004 dollars) in 1995 to $11,900 in 2004, an increase of 19 percent. However, this growth has not been steady. Oxnard saw a dramatic decline in both Retail Taxes and Total Taxable Sales in It took three years for real per-capita sales to recover to 1999 levels. This dramatically exposes the city s risk from changes in market conditions. Oxnard s estimated 2005 per-capita Retail Sales are the fourth highest in Ventura County, after Thousand Oaks, San Buenaventura, and Camarillo. Oxnard s $10,900 is about the same as Ventura County s consolidated average of $11,000. Estimated 2005 per-capita Total Taxable Sales in Oxnard is the fifth highest in Ventura County, after Thousand Oaks, San April 2006 Draft Background Report Page Oxnard_GP_Demographics_2006_04_20 MRD.doc
73 City of Oxnard General Plan Draft Buenaventura, Camarillo, and Ojai. Oxnard s $12,700 is 13 percent lower than the consolidated average for Ventura County, $14,600 as presented in Tables 2-20 and Table 2-18 Real Expenditures and Revenues per Housing Unit, Oxnard, 1995 to Year ending June real 2004 dollars per housing unit Expenditures General Government Public Safety , , ,145.8 Public Works Community Development Culture/Leisure/Other Debt Service Capital Outlay TOTAL Expenditures 2, , , , , , , , , ,966.5 Revenues Taxes 1, , , , , , , , , ,429.5 General Property Taxes Storm Drain Taxes General Sales Taxes Transient Occupancy Taxes Franchise Taxes Business License Taxes Deed Taxes Licenses and Permits Inter-Governmental 1, , , , , , Growth/Development Fees Charges for Current Svcs Fines and Forfeitures Interest Miscellaneous TOTAL Revenues 2, , , , , , , , , ,983.7 Balance (Surplus + / Deficit - ) Sources: City of Oxnard, Comprehensive Annual Financial Report (CAFR), Fiscal Year 2004, CA Department of Finance Page 2-46 Draft Background Report April Oxnard_GP_Demographics_2006_04_20 MRD.doc
74 Draft 2. Demographics, Housing and Economics Table 2-19 Real Expenditures and Revenues per million square feet of Commercial Space, Oxnard, 1995 to Year ending June real 2004 dollars per million feet of commercial space Expenditures General Government Public Safety 2, , , , ,398.3 Public Works Community Development 1, Culture/Leisure/Other Debt Service Capital Outlay 1, , , ,358.6 TOTAL Expenditures 6, , , , ,209.4 Revenues Taxes 2, , , , ,992.2 General Property Taxes 1, , , , ,521.2 Storm Drain Taxes General Sales Taxes 1, Transient Occupancy Taxes Franchise Taxes Business License Taxes Deed Taxes Licenses and Permits Inter-Governmental 2, , , , ,753.3 Growth/Development Fees Charges for Current Svcs Fines and Forfeitures Interest Miscellaneous TOTAL Revenues 7, , , , ,245.6 Balance (Surplus + / Deficit - ) Sources: City of Oxnard, Comprehensive Annual Financial Report (CAFR) 2004, CB Richard Ellis Table 2-20 Total Taxable and Retail Sales per Capita, Oxnard, 1995 to Retail Sales per Capita Real Total Taxable Sales per Capita Sources: City of Oxnard, Comprehensive Annual Financial Report (CAFR), Fiscal Year 2004, CA Department of Finance April 2006 Draft Background Report Page Oxnard_GP_Demographics_2006_04_20 MRD.doc
75 City of Oxnard General Plan Draft Table 2-21 Total Taxable and Retail Sales per Capita, 1995 to 2004 Nominal Retail Sales Nominal Total Taxable Sales Camarillo Fillmore Port Hueneme Moorpark Ojai Oxnard Simi Valley Santa Paula Thousand Oaks San Buenaventura Ventura County Sources: Expenditures CA Board of Equalization, CA Department of Finance Oxnard responded to changing revenue stream by changing both the amount of city spending and the composition of that spending. Consequently, Oxnard s real per capita expenditures rose from 1995 to 1997, then spending gradually fell until It is interesting that the city s spending declined prior to the decline in Intra-Government Transfers. It appears that the decline in spending was a response to the use of reserve funds in 1997 and As with revenues, per capita expenditures fell significantly in They have been growing ever since. However, real per-capita spending still lags that of the late 1980s. Service standards attempt to measure the level of public services that the City s residents receive. In most cases, data is limited to expenditures per capita, or per household. Oxnard s leaders made a decision to not only cut spending, but to change the composition of that spending in response to California s fiscal crises and to the city deficits of 1997 and In 2001, Oxnard s real Public Safety expenditures per person increased dramatically, going from about 33 to 42 percent of total per capita expenditures. The Public Safety share has been at or just under 40 percent ever since. The increased Public Safety spending was at the expense of per-capita Capital Outlay and percapita Community Development. Since 2002, Oxnard has spent more than $1,000 real dollars per-housing-unit on Public Safety. The Service Standard for Oxnard s resident population declined with California s budget crises that began in Real per-housing-unit expenditures fell significantly. At the same time the number of persons per housing unit rose significantly. Consequently, from 2000 to 2001 Oxnard s expenditure on services for each member in a household fell dramatically. However, from 2002 on, the growth in real per-capita expenditure has exceeded the growth of persons per household. Finally, in 2004 expenditures per-household reached the levels that prevailed before the state s fiscal crises. Figures 2-24 and 2-25 presents a summary of Oxnard s service standard per person from 1995 to Page 2-48 Draft Background Report April Oxnard_GP_Demographics_2006_04_20 MRD
76 Draft 2. Demographics, Housing and Economics Figure 2-24 Service Standard for Population, Oxnard, 1995 to 2004 Real 2004 dollars per housing unit 3,500 3,000 2,500 2,000 1,500 1, Persons per housing unit Real Expenditure per housing unit People per housing unit Sources: City of Oxnard, CA Department of Finance, US Bureau of Labor Statistics Figure 2-25 Service Standard for Jobs, Oxnard, 2000 to 2004 real 2004 dollars per million square feet 8,000 7,000 6,000 5,000 4,000 3,000 2,000 1,000 jobs per million square feet 2,850 2,800 2,750 2,700 2,650 2,600 2,550 2,500 2,450 2,400 2, ,300 Real Expenditures per square foot Jobs per square foot Sources: City of Oxnard, CB Richard Ellis, CA Employment Development Department, US Bureau of Labor Statistics From 2000 to 2004, the number of jobs per square foot of commercial space fell significantly, while real per-square-foot expenditures, after falling in 2001, has increased every year since. However, real expenditure April 2006 Draft Background Report Page Oxnard_GP_Demographics_2006_04_20 MRD.doc
77 City of Oxnard General Plan Draft per-square-foot is still below those of On net, per-square-foot expenditure fell by about seven percent from 2000 to 2004, while jobs per-square-foot fell by about eight percent. This implies 2004 job holders received a bit more in public spending and services thereof than job holders did in Table 2-22 presents commercial office space characteristics for the Oxnard/Port Hueneme area and Figure 2-26 presents a comparison of residential versus commercial revenue generation rates. Table 2-22 Commercial Space, Oxnard/Port Hueneme, 2000 to Total Leasable Industrial Space 15,605,671 16,561,848 17,227,597 17,525,031 18,428,784 Total Leasable Office Space 881,701 1,251,877 1,329,479 1,297,269 1,254,967 Total Leasable Retail Space 2,982,976 3,332,730 3,677,914 3,677,914 3,605,914 TOTAL Commercial 19,470,348 21,146,455 22,234,990 22,500,214 23,289,665 Estimated additions to Retail Base ,754 Jobs per million square feet 2,778 2,566 2,472 2,560 2,561 Source: CB Richard Ellis, University of California, Santa Barbara (UCSB) Economic Forecast Project Figure 2-26 Revenue Generation Rates for Residential versus Commercial, Oxnard, 2000 to 2004 dollars of revenue commercial 8,000 7,000 6,000 5,000 4,000 3,000 2,000 1,000 dollars of revenue residential 3,500 3,000 2,500 2,000 1,500 1, Sources: Real revenue per million square feet of commercial space Real revenue per housing unit City of Oxnard, CB Richard Ellis, CA Department of Finance, US Bureau of Labor Statistics 0 Page 2-50 Draft Background Report April Oxnard_GP_Demographics_2006_04_20 MRD.doc
78 3. Community Development 3.1 Introduction The diversity of land use plays an integral role in the development of a healthy community with a vibrant economic base and adequate services provided for residents and visitors. In order to accomplish this, land uses must complement each other visually, aesthetically, socially, and economically. Natural resources must be protected, while maintaining and enhancing economic opportunities. Incompatible, conflicting and damaging land use arrangements must be prevented to avoid compromising the overall character of a neighborhood and the community as a whole. This chapter covers land use types, distribution, and intensity; population and building density; existing specific plans; public land ownership; and future growth areas. The focus of this element is on the future growth and physical development of the community. Information presented will be utilized to form the backbone for the subsequent development of land use policies. This chapter is divided into the following sections: The diversity of land use plays an integral role in the development of a healthy community with a vibrant economic base and adequate services provided for residents and visitors. Land Use (3.2) Urban Design - Community Identity (3.3) Growth Management (3.4) Economic Development (3.5) 3.2 Land Use An analysis of the current land use pattern and development potential within the City provides the foundation for the determination of the appropriate future land use mix within the community. As the backbone of the General Plan, the land use fabric exhibits a symbiotic relationship with all other elements of the plan. A firm understanding of the current state of the community and the land use regulations exhibiting influence on the City will be necessary to identify issues and establish the future direction for growth. Key Terms Density (Net and Gross). Density is calculated by taking the number dwelling units in an area and dividing it by the acreage in the area. Gross density is calculated using the total acreage for the area. Net density is calculated by dividing units by the net acreage, generally, exclusive of roadways. April 2006 Draft Background Report Page Oxnard_GP_Community_Development_2006_04_20 MRD.doc
79 City of Oxnard General Plan Draft Floor Area Ratio (FAR). The ratio of gross floor area of structures on a particular parcel to the area of the parcel on which the structures are located. Gross Acreage. This term refers to the total area of a site. Gross Floor Area. The floor area actually occupied or used by a tenant or other user, including hallways, lobbies, utilities, and other common areas. Lot Coverage. This term refers to the amount of a lot that is allowed to be covered by the footprint of structures on that lot. Net Acreage. Net acreage is calculated by taking the gross acreage of a site and subtracting portions of the site dedicated to public improvements, such as streets. Planned Development (PD). Land use zoning which allows the adoption of a set of development standards that are specific to a particular project. PUD zones usually do not contain detailed development standards; those are established during the process of considering proposals and adopted upon project approval. Also known as a Planned Residential Group (PRD) or Planned Unit Development (PUD). Zoning. Zoning is the principal land use tool for implementing the general plan; it translates general plan land use recommendations and standards directly into enforceable regulations. A zoning ordinance divides a community into districts and specifies the land uses allowed and the development standards that apply for each district. Standards generally include minimum lot size, density, building height, lot coverage, and setbacks. Land Use Planning History The Oxnard 2020 General Plan represented a comprehensive revision to the City s 1990 General Plan and consolidation of many of the elements into one document. The Oxnard 2020 General Plan is comprised of 12 required and optional elements including: growth management; land use; circulation; public facilities; open space/conservation; safety; noise; economic development; community design; parks and recreation; housing; and coastal land use. These elements, their original adoption dates, date of last update, and corresponding element within the 2030 General Plan are presented in Table 3-1. Page 3-2 Draft Background Report April Oxnard_GP_Community_Development_2006_04_20 MRD.doc
80 Background Report 3. Community Development Table 3-1 History and Status of the 2020 General Plan Element Status Adopted Updated 2030 General Plan Circulation Required Public Facilities Element Coastal Land Use Required Separate document Community Design Optional Community Development Element Economic Development Optional Community Development Element Growth Management Optional Community Development Element Housing Required Separate document Land Use Required (2) Community Development Element Noise Required Safety and Hazards Element Open Space/Conservation Required Environmental Resources Parks and Recreation Optional Public Facilities Element Public Facilities (1) Required Public Facilities Element Safety Required Safety and Hazards Element Notes: (1) General substance required by State law (2) Last amended Source: City of Oxnard General Plan 2020, Existing Oxnard General Plan Land Use Element The existing General Plan Land Use Element provides for five major types of land use designations: residential, commercial, industrial, open space and other. Each of these categories is further subdivided into distinct uses correlated with specific intensity standards. The following text provides an overview of each designation. Residential The maximum intensities for residential development are defined by density standards specified for each category of residential use. These standards are presented in Table 3-2 following the category definitions. In addition to the density standards, estimated household size reflects the number of inhabitants per dwelling unit projected for each residential category and provides the basis for estimating public service needs (i.e. infrastructure, schools, and parks). Table 3-2 General Plan 2020 Residential Density Standards Land Use Category Density Estimated HH Size Rual 1-4 dus/acre 3.7 persons/du Very Low Density 1-2 du/acre 3.7 persons/du Low Density 1-7 du/acre 3.7 persons/du (attached); 2.7 persons/du (detached) Low-Medium Density 7-12 du/acre 3.7 persons/du (attached); 2.7 persons/du (detached) Medium Density du/acre 2.7 persons/du High Density du/acre 1.9 persons/du Mobile Home du/acre 1.9 persons/du Mobile Home du/acre 2.7 persons/du Source: City of Oxnard General Plan 2020, 1990 April 2006 Draft Background Report Page Oxnard_GP_Community_Development_2006_04_20 MRD.doc
81 City of Oxnard General Plan Draft Large-scale developments and specific plan areas may provide for other intensity control measures that provide development flexibility while maintaining intensity maximums for the planning area. Rural. This designation predominantly provides for single family homes on larger lots and is intended to reflect the semi-rural character of the surrounding area. Although some higher density development may exist, the density range for this classification 1 to 4 dwelling units (du) per acre with a typical household size of 3.7 persons per dwelling unit. Areas with this classification include El Rio and Nyeland Acres. Very Low Density. This classification is intended to provide for a single family residential transition from the edge of a residential area to higher density residential areas. These edges typically adjoin major thoroughfares and urban/rural boundaries. Typical lot size is 20,000 square feet, but dwelling unit density may range from 1 to 2 dwelling units per acre. Household size is an average of 3.7 persons per household. Low Density. This classification is intended for single family detached and attached housing. This type of housing can be conventional detached homes with conventional yard and setback requirements and may also include patio and zero lot line homes and attached planned developments. Density ranges from 1 to 7 dwelling units per acre with an average household size of 2.7 persons per dwelling unit for detached units and 3.7 persons per dwelling unit for attached units. Low-Medium Density. This designation allows lower density apartments or condominiums and higher density detached single family residences. In order to provide a range of housing opportunities, planned developments providing single family detached homes on lots of less than standard size (but not less than 3,500 square feet) shall be considered subject to the following: a. Small lot planned developments providing detached homes are a preferred housing type on infill properties in largely developed neighborhoods. b. In larger undeveloped and specific plan areas, PUDs may be considered as part of an overall housing program that clearly achieves a balance of housing types and housing prices affordable to a broad segment of Oxnard residents. Page 3-4 Draft Background Report April Oxnard_GP_Community_Development_2006_04_20 MRD.doc
82 Background Report 3. Community Development Dwelling unit densities range from 7 to 12 units per acre with an average household size of 2.7 persons per dwelling unit for detached units and 3.7 persons per dwelling unit for attached units. Medium Density. This designation allows for garden apartments and condominiums and other forms of attached housing. Density ranges from 12 to 18 dwelling units per acre with an average household size of 2.7 persons per dwelling unit. High Density. This designation provides for higher density residential apartments and condominiums. Density ranges for 18 to 30 dwelling units per acre with an average household size of 1.9 persons per dwelling unit. Mobile Home 1. This designation applies to existing conventional mobile home parks and future manufactured mobile home parks intended to be developed in a conventional manner. Density ranges from 1 to 7 dwelling units per acre with an average household size of 1.9 persons per dwelling unit. Mobile Home 2. This designation applies to property intended to serve exclusively for the purpose of providing replacement housing Commercial for older dilapidated trailer parks or mobile home parks inconsistent with other land use designations. Density ranges from 7 to 12 dwelling units per acre with an average household size of 2.7 persons per dwelling unit. The primary measure for regulating the intensity of development of commercial uses is the FAR. The FAR is defined as the ratio of gross leasable floor area of structures on a particular parcel to the total gross land of the parcel on which the structures are located. For example, a FAR of 0.5 would permit the development of a structure or structures with a gross leasable floor area amounting to half of the total gross land area of the parcel. Category standards are presented in Table 3-3. Table 3-3 General Plan 2020 Commercial Floor Area Ratios (FAR) - Gross Land Use Category FAR General 0.30:1 Convenience 0.30:1 Neighborhood 0.30:1 Community Shopping Center 0.30:1 Regional Shopping Center 0.60:1 Specialized 0.30:1 Visitor Serving 0.30:1 Central Business District 1.50:1 (Office 3:1) Office 0.60:1 Source: City of Oxnard General Plan 2020, 1990 April 2006 Draft Background Report Page Oxnard_GP_Community_Development_2006_04_20 MRD.doc
83 City of Oxnard General Plan Draft General. This designation includes older established, one-story retail centers, free-standing commercial uses along thoroughfares, and higher density residential uses (up to 18 dwelling units per acre). Convenience. This designation provides for limited retail and other commercial services that are primarily oriented towards and compatible with residential areas. These centers are typically onestory, range up to 26,000 square feet in size, and are located on property of up to two acres in size. Neighborhood. This designation provides for a wide range of services oriented toward two or more residential neighborhoods. A supermarket typically anchors the center; other major retailers may also be included. These one-story centers typically range up to 80,000 square feet in size, occupy from two to six acres, and are located on a thoroughfare. In addition to commercial uses, higher density residential uses (up to 13 to 18 dwelling units per acre) may be permitted. Community Shopping Center. This designation provides for commercial centers with two or more anchor retailers, one or twostory developments, and range up to 265,000 square feet in size on a maximum of 20 acres. These centers are located at the intersection of major thoroughfares. Regional Shopping Center. This designation provides for largescale commercial centers ranging in size of up to 3 million square feet on a maximum of 100 acres. Uses can also include offices, hotels and other service uses. Specialized. This designation provides for specialized commercial uses and includes promotional and discount shopping centers, tourist-oriented developments, and other specialized markets. Other uses include general commercial in special or unique settings. Visitor Serving. This designation applies to visitor serving commercial uses generally restricted to the Coastal Zone and is generally retail service uses oriented to tourists and visitors to coastal attractions. Central Business District (CBD). This designation provides for an area of relatively intense retail and office land uses in the core area of the City s downtown area. Higher density residential uses up to 39 dwelling units per acre, such as apartment and condominium projects, may also be included. Special architectural and site design guidelines apply. Page 3-6 Draft Background Report April Oxnard_GP_Community_Development_2006_04_20 MRD.doc
84 Background Report 3. Community Development Office. This designation provides for single- or multi-story office uses, and limited retail and service uses. These uses generally Industrial provide a transitional use between thoroughfares or retail commercial and residential uses. Limited related retail and service uses may also be allowed. Similar to commercial uses, the primary measure for regulating the intensity of development of industrial uses is the FAR. Category standards for the industrial classifications are presented in Table 3-4. Table 3-4 General Plan 2020 Industrial Floor Area Ratios - Gross Land Use Category FAR Business and Research Park 0.60:1 Limited 0.45:1 Light 0.40:1 Manufactring; 0.50:1 Warehousing Central Industrial Area 0.40:1 Public Utility/Eneregy Facilities No FAR Priority to Coastal Development 0.45:1 Increased FAR Not to Exceed 1:1 Source: City of Oxnard General Plan 2020, 1990 Business and Research Park. Facilities within this designation typically include fully conditioned buildings devoted either exclusively or in part to office and research and development uses. Retail or service facilities may also be established in free-standing buildings or as part of multi-use developments. Development standards (i.e., landscaping, architecture, etc.) apply to business and research parks oriented towards major transportation features such as freeways, thoroughfares, Oxnard Airport, and Port Hueneme. Limited. Limited Industrial uses include light manufacturing, assembly, and warehousing uses developed to higher development standards than may be found in other industrial zones. All activity occurs within buildings with the exception of incidental storage. Office and limited retail activities related to the principal manufacturing, wholesale, or warehousing use may also be allowed. Light. Light industrial uses include manufacturing uses where the principal activity occurs within a building, but also permits incidental light outdoor assembly, fabrication, and storage. Wholesale and retail sales of large commodities related to warehousing or service uses on-site may also be permitted. April 2006 Draft Background Report Page Oxnard_GP_Community_Development_2006_04_20 MRD.doc
85 City of Oxnard General Plan Draft Central Industrial Area. The Central Industrial Area is characterized by uses often requiring outdoor use and storage, but is not considered heavy industrial uses. Agricultural processing and service, vehicle and equipment storage, and repair services are predominate in this area. In order to be compatible with adjacent CBD and redevelopment plans, development standards are applied. Public Utility/Energy Facilities. This designation applies to utility facilities, including electrical generating stations, transmission facilities, and oil and gas development. Due to the uniqueness of these facilities, development intensity is established on an individual basis. Priority to Coastal Dependent. Applicable to industrial properties within the Coastal Zone, land use priority is given to uses related to coastal and offshore activities including oil and gas development and marine shipping. Increased FAR. Properties designated for Increased FAR may be considered for an FAR not to exceed 1:1 upon completion of a fullscope Environmental Impact Report. These areas are limited to major freeway interchanges. Open Space Agriculture. This designation includes lands devoted to row and tree crops intended for consumption as well as other crops and commodities intended for other uses such as livestock feed, grain products, ornamental horticulture, hydroponic agriculture, and sod. This designation may also include greenbelts intended to preserve open spaces and agriculture uses. Greenbelts also serve to provide spatial separations between communities and preserve individual community identity. The land use intensity standard for agricultural uses is a maximum of one dwelling unit per minimum 40-acre parcel. Buffer. This designation includes agricultural, landscaped, or fallow areas intended to provide a spatial separation between potentially incompatible land uses and activities. Planning Reserve Overlay. This overlay designation has been placed on certain open space areas contiguous to developed portions of the City to indicate that they may be considered for urbanization during the term of the 2020 General Plan. This designation applies to properties classified Mineral Resources. Page 3-8 Draft Background Report April Oxnard_GP_Community_Development_2006_04_20 MRD.doc
86 Background Report 3. Community Development Resource Protection. This designation provides for areas identified in order to preserve and enhance sensitive habitats of features that may be threatened by urbanization including wetlands, dunes, and riparian areas. Mineral Resources. This designation identifies sand and gravel extraction areas that may also be threatened by encroachment from development. Parks/Recreation. This designation includes existing or proposed areas under the jurisdiction of a park agency. This includes State beaches and beach parks, regional parks, community and neighborhood parks, golf courses, and special purpose facilities. Miscellaneous. This designation includes parcels, which due to their size or location, do not lend themselves to another land use designation. Other Land Uses Public/Semi-Public. This designation includes public institutions and uses such as the City Hall and civic centers, medical centers, community centers, City maintenance yards, libraries, and fire stations as well as privately owned institutions of a public nature such as cemeteries and hospitals. Airport Compatible. This designation provides for airport compatible land uses including low intensity commercial and industrial uses that do not interfere with airport operations or subject large numbers of persons to aircraft hazards. Airport compatible uses need not be directly related to or dependent upon the adjacent airport. The City may require hazard studies to determine the suitability of a proposed use and its relative intensity. The use must be consistent with the policies of the City; Federal Aviation Administration (FAA); California Department of Transportation (Caltrans), Division of Aeronautics; and the Airport Land Use Commission. Allowable uses are typically of a limited industrial or specialized commercial nature. Schools. This designation allows public and private educational facilities. The FAR for this type of use is established on an individual basis due to their unique nature and single purpose use. Mixed Use Overlay. This designation provides for the incorporation of three or more different land uses (such as residential/retail/office) within one or more structures. The flexibility of this designation provides increased opportunities for persons to live in proximity of their place of employment. The integration of land uses is intended to provide a pedestrian orientation to reduce trips and vehicle miles traveled in order to April 2006 Draft Background Report Page Oxnard_GP_Community_Development_2006_04_20 MRD.doc
87 City of Oxnard General Plan Draft improve air quality and energy conservation. Residential densities for the horizontal integration of mixed use developments are established through site plan review, but shall not exceed a density of 18 dwelling units per acre. Mixed use developments outside of the CBD area are subject to City Council approval of a specific plan and appropriate environmental review to consider potential impacts associated with the development. Existing Land Use A firm understanding of the type and distribution of existing land uses within the Planning Area (as presented in Table 3-5 and Figure 3-1) is critical to the formation of a new land use diagram and standards for the City of Oxnard. This evaluation can assist in the assessment of existing policies and their effectiveness in directing development areas of growth. With the exception of several high rise buildings in northern Oxnard, the City is characterized by low rise buildings (one or two stories), low density residential, and a large industrial base surrounded by agricultural and natural resources. Most of the City s higher intensity development lies adjacent to primary thoroughfares such as Oxnard Boulevard, Highway 101, Saviers Road, and Hueneme Road. The following descriptions characterize the existing development within the City based on the land use categories adopted in the 2020 General Plan. Residential. As the predominant urban land use, residential uses comprise over 15 percent of the acreage within the Planning Area. Sixty percent of the residential units fall into the Low Density category. Limitations with available property for additional development (as discussed in Section 3.2.5) will present planning challenges for the City if this ratio is to be maintained. Although higher density developments have been increasing in recent years, additional considerations must be given to increasing the residential density of future development proposals. Commercial. Commercial uses comprise 1,398.2 acres, or 3.1 percent of the land use within the Planning Area. Commercial development includes regional and community retail, neighborhood uses, and administrative offices. This land is dispersed throughout the City and ranges from small, single parcel retail stores, to large retail and office developments. Several regional retail centers within the City provide a variety of opportunities for City residents and visitors. Brief profiles of the most significant areas are provided. Page 3-10 Draft Background Report April Oxnard_GP_Community_Development_2006_04_20 MRD.doc
88 Background Report 3. Community Development Table 3-5 Existing Land Use, 2005 Land Use Category Acres Percent Residential Rural Very Low Density 9.2 <0.1 Low Density 4, Low-Medium Density 1, Medium Density High Density Mobile Home 1 & TOTAL Residential 7, Commercial General Convenience 4.2 <0.1 Neighborhood Community Shopping Center Regional Shopping Center Specialized Visitor Serving Central Business District (CBD) Office TOTAL Commercial 1, Industrial Business and Research Park Limited Light 1, Central Industrial Area Public Utility/Energy Facilities Priority to Coastal Dependent TOTAL Industrial 3, Open Space Miscellaneous Agriculture 24, Buffer Planning Reserve Overlay 2.0 <0.1 Resource Protection Mineral Resources Parks/Recreation 1, TOTAL Open Space 26, Other Public/Semi-Public Airport Compatible Schools Easements Mixed Use Other areas (County, Pt. Mugu) 4, TOTAL Other 6, TOTAL 45, Source: City of Oxnard, 2005 April 2006 Draft Background Report Page Oxnard_GP_Community_Development_2006_04_20 MRD.doc
89 City of Oxnard General Plan Draft Downtown Oxnard: Also referred to as the Central Business District (CBD), is bounded by 2 nd Street on the north, the Ventura County railroad and Factory Lane on the eat, Wooley Road on the south, and C and D Streets on the west. This area contains a variety of commercial and retail uses including a new theater complex, restaurants, farmer s market, and other various opportunities. Heritage Square: Occupying the block bound by 7 th, A, 8 th, and C Streets, this complex of relocated historic buildings contains professional offices, visitor serving uses, a community theatre, restaurant, and facilities for weddings, meetings, and other special events. Centerpoint Mall: This center is approximately two miles south of Downtown Oxnard at the intersection of Saviers Road and Channel Islands Boulevard. Oxnard Factory Outlet/Oxnard Home and Lifestyle Center: South of Highway 101 between Rice and Rose Avenues, this discount center features a variety of restaurants, housewares, home furnishings, luggage, and electronics retailers. This facility is currently being renovated as The Palms. Plaza del Norte Marketplace/Oxnard Auto Center: North of Highway 101 between Rice and Rose Avenues, this shopping area includes Costco, Marshall s, Wickes Furniture, Sports Chalet, Frye s Electronics, a variety of restaurants, and additional retail stores and the Oxnard Auto Center. The Esplanade: This Power Center is located approximately 2.5 miles north of Downtown Oxnard off Highway 101 at Vineyard and Oxnard Boulevards. Its major tenants include Cost Plus, Borders Books, Staples, Home Depot, and Nordstrom Rack. Shopping at the Rose: Located on Highway 101 at Rose Avenue in Oxnard, this center includes retail businesses such as Sam s Club, Wal-Mart, CompUSA, and Vons. Channel Islands Harbor In addition to these existing regional centers, there are two significant areas already planned for development within the City. These areas include RiverPark and Wagon Wheel. RiverPark: This mixed-use community is located immediately north of Highway 101 between Vineyard Avenue and the Santa Clara River. In addition to a variety of residential uses, it will include a significant retail and office component. The RiverPark Page 3-12 Draft Background Report April Oxnard_GP_Community_Development_2006_04_20 MRD.doc
90 Background Report 3. Community Development Figure 3-1 Existing Land Use April 2006 Draft Background Report Page Oxnard_GP_Community_Development_2006_04_20 MRD.doc
91 CITY OF VENTURA r VIN EY AR D A V ve Ri CE NT RA RO SE AV L AV RA A V ara Cl SA NT A C LA Santa H ST VINEYARD AV GONZALES RD VENTURA RD OXNARD AIRPORT FIFTH ST CAMINO DEL SOL RICE AV ROSE AV OXNARD BL TEAL CLUB RD STURGIS RD THIRD ST A ST H ST C ST CEASAR CHAVEZ DR F ST DORIS AV PATTERSON RD BL OR RB HA VICTORIA AV GONZALES RD FIFTH ST FIFTH ST WOOLEY RD RICE AV C ST SAVIERS RD CITY OF PORT HUENEME ROSE AV WOOLEY RD J ST VENTURA RD PATTERSON RD ic BL OR cif RB HA Pa VICTORIA AV SEVENTH ST CHANNEL ISLANDS BL Legend C ST U.S. Naval Base Ventura County Port Hueneme SAVIERS RD Residential Rural 1-4 DU Residential Very Low 1-2 DU Residential Low 3-7 DU Residential Low Medium 8-12 DU Residential Medium DU Residential High DU Factory Built 1 To 7 DU BARD RD BARD RD RICE AV PLEASANT VALLEY RD Commercial Commercial Community Commercial Convenience Commercial General Commercial Neighborhood Commercial Office Commercial Regional Commercial Specialized RS Central Business District HUENEME RD CITY OF PORT HUENEME ARNOLD RD EDISON DR HUENEME RD Industrial Industrial Light Industrial Limited Industry Coastal Dependent Central Industrial Area Business & Research Park Open Space Misc Resource Protection Recreational Area Park Misc Ag/Planning Reserve Misc Open Space Open Space Buffer Misc Agriculture O ce L AL T V N SA EA PL ROSE AV Residential D R EY J ST CHANNEL ISLANDS BL an Other School Visitor Serving Airport Compatible Other/Ventura County Military Base Public Utility/Energy Facility Public/Semi Public Easement Point Mugu Naval Air Station Naval Base Ventura County Jurisdictinal Boundary Legend Source: City of Oxnard GIS Created By: City of Oxnard Planning & Environmental Services, Oxnard Sphere of Influence Coastal Zone Boundary Figure 3-1 N Oxnard City Limits W Current General Plan Map E S 0 Mug u La goon Miles
92 City of Oxnard General Plan Draft (Back of Figure 3-1) Page 3-14 Draft Background Report April Oxnard_GP_Community_Development_2006_04_20 MRD.doc
93 Background Report 3. Community Development specific plan calls for 244 acres of residential uses, 147 acres of commercial (2.5 million square feet), 44 acres of public facilities (including schools and community playfields), and 265 acres of open space (water storage facilities and passive parks). Commercial uses are expected to include retail and entertainment uses, office space, a hotel and convention center, and ground floor retail in residential buildings in selected locations. Wagon Wheel: Located south of Highway 101, just west of the Esplanade development, is an 80-acre redevelopment project which is expected to combine commercial and residential uses into a mixed-use, transit-oriented development. Industrial. Industrial lands constitute over eight percent of the total planning area. Within the industrial category, light industrial land uses, primarily located in the eastern part of the City between Rice Avenue and Del Norte Boulevard and in southern Oxnard south of Hueneme Road, are the predominate industrial type (almost 41 percent). Major industrial areas within the City include: Oxnard Pacific Commerce Center. Located south of Highway 101 (Ventura Freeway), between Rose Avenue and Del Norte Boulevard, the Pacific Commerce Center provides industrial and business and research park opportunities. Channel Island Business Center. The Channel Islands Business Center consists of 211 acres of industrial uses surrounding the Channel Islands Harbor. Northeast Industrial Area. The Northeast Industrial Area includes 1,389 acres of light industrial, limited industrial, and business and research park uses. Oxnard Town Center (Business and Research Park). The Oxnard Town Center is a multiple use master planned business and commercial development located near the interchange of Highway 101 (Ventura Freeway) and State Route 1 (Oxnard Boulevard). Hueneme Road Industrial Area. Located north and south of Hueneme Road between Edison Drive and the Pacific Ocean, the Hueneme Road Industrial Area includes 185 acres of heavy industrial uses, including the City s Wastewater Treatment Facility. Sakioka Farms/Powers. This project, located south of Highway 101 (Ventura Freeway), proposes light industrial, office, and retail uses on a 430 acre mixed used site. April 2006 Draft Background Report Page Oxnard_GP_Community_Development_2006_04_20 MRD.doc
94 City of Oxnard General Plan Draft Ormond Beach. The Southern Subarea of the Ormand Beach Specific Plan areas consists of approximately 595 acres south of Hueneme Road. Approximately 420 acres of this area would be developed, primarily with light industrial (265 acres) and business/research park (62 acres) uses; the remaining developed areas would include detention/biofiltration areas and a greenbelt area. Power Generating Stations. There are currently two power generating stations located within Oxnard s coastal areas. One station is located within Mandalay Beach and the other, in Ormond Beach. Open Space. There are approximately 26,800 acres of open space and recreational areas within the planning area, most under agricultural production (91 percent) and located outside the incorporated city limits. The abundance of open space creates a unique urban pattern as these resources delineate the City s boundaries. The western and southern edges are framed by the Pacific Ocean, the northwestern edge by the Santa Clara River, and the northeastern and eastern sides by the area associated with the Oxnard-Camarillo Greenbelt Agreement. Bounded on the south and west by the Pacific Ocean, beaches are plentiful and provide significant contributions to open space within the City. Developed beaches include the McGrath State Beach and Oxnard Beach, with undeveloped sites including Mandalay State Beach and Ormond Beach. Significant natural features within these beaches include dunes, wetlands, and animal habitats. The beaches along the City s coastline are recognized as Oxnard s primary natural resources providing unique recreational opportunities and scenic views. In addition to these coastal resources, the Santa Clara River and its floodplain form a strong natural boundary to the northern portion of the City. The City of Oxnard, along with the Cities of Camarillo and Ventura and the County of Ventura, is party to the Oxnard-Camarillo and Oxnard-Ventura Greenbelt Agreements. These agreements contribute to the preservation of a large agricultural area extending outside the planning area (approximately 29,460 acres). These areas provide a buffer between Oxnard and Camarillo to the east and Oxnard and Ventura to the northwest. Other. Approximately 15 percent of land within the City is specified as other uses which do not fit into one of the previous land use classifications. Examples of uses in this description include public facilities, schools, and airport compatible land uses such as low intensity commercial and some limited manufacturing uses. Page 3-16 Draft Background Report April Oxnard_GP_Community_Development_2006_04_20 MRD.doc
95 Background Report 3. Community Development Public and quasi-public uses have a major presence throughout the Downtown area of the City. Facilities within this area include City Hall, City Hall Annex, Main Library, Ventura County Human Services Agency, Oxnard School District Education Service Center, Clincas del Camino Real, and the Oxnard Boys and Girls Club. Additional facilities, such as schools, fire stations, and parks are dispersed through the community providing more direct access to the neighborhoods they serve Zoning The City of Oxnard Zoning Ordinance and Coastal Zoning Ordinance set forth the zoning regulations for the incorporated areas of the Planning Area. These ordinances regulate building height, land uses, setbacks, provisions of open space, density, and other factors related to development on individual properties. Under California State law, cities and counties have latitude in establishing zoning standards and procedures. The Oxnard Zoning Ordinance provides for a total of 39 districts. A brief description of the basic zoning categories and acres within the planning area as of January 2006 are provided in Table 3-6 and Figure 3-2. As shown in Table 3-6, the acreage per each zoning classification correlates with the land use designations established within the 2020 General Plan General Plan 2020 and Zoning Consistency In California, regulations contained within the zoning ordinance are required by law to be consistent with the policies established in the general plan (Government Code ). Consistency is achieved when each land use category has one or more corresponding zoning districts. While the General Plan provides general descriptions of permitted land uses and development intensities, the zoning ordinance must provide the specific regulations upon which property can be developed. Table 3-7 shows the relationship between the 1990 General Plan land use categories and current zoning classification Current Development As of January 2006, a sizeable inventory of residential and non-residential projects is in the development review pipeline or has recently been approved for construction within the City (Table 3-8). It is estimated that these residential projects will create approximately 5,900 additional dwelling units within the City. Although new residential development is scattered throughout the City, RiverPark in northern Oxnard contributes over 24 percent (1,411 dwelling units) of the units presented in Table 3-8. For comparison, the characteristics of housing built over the period is shown in Table 3-9. In 2005, approximately 31% of all new housing units added were single-family residential. April 2006 Draft Background Report Page Oxnard_GP_Community_Development_2006_04_20 MRD.doc
96 City of Oxnard General Plan Draft Table 3-6 Existing Zoning, 2005 Zone Code(s) Acres Percent of Planning Area Residential Zoning Single Family Residential R1, R1-7PD, R1-8PD, R10PD 3, Multiple-Family Residential R2, R2PD Garden Apartment R3, R3PD High-Rise Residential R4, R4PD Manufactured Home MHPD Residential Planned Development RPD Single Family Beach RB Beachfront Residential RBF 12.5 <0.1 Coastal Low-Density Multiple Family R2C 23.4 <0.1 Garden Apartment Coastal R3C Single Family Water Oriented RW <0.1 Multiple-Family Water Oriented RW <0.1 Mobile Home Park Coastal MH, MHPC, MHPD TOTAL Residental Zoning 6, Commercial Zoning Neighborhood Shopping Center C1, C1PD 4.6 <0.1 General Commercial C2, C2PD Central Business District CBD Commercial & Light Manufacturing CM, CMPD Commercial Office CO, COPD 32.4 <0.1 Commercial Planned Development CPD Coastal Neighborhood Commercial CNC 3.4 <0.1 Coastal Visitor Serving Commercial CVC 34.9 <0.1 TOTAL Commercial Zoning Industrial Zoning Light Manufacturing M1, M1PD 1, Heavy Manufacturing M2, M2PD Heavy Manufacturing/Group Housing M <0.1 Limited Manufacturing ML, MLPD Manufacturing Planned Development MPD Business & Research Park BRP Coastal Dependent Industry CDI Coastal Energy Facility EC Coastal Oil Development COD TOTAL Industrial Zoning 3, Parks and Open Space Coastal Resource Protection RP Coastal Recreation RC Agricultural/Open Space AO 2.7 <0.1 Community Reserve CR 1, TOTAL Parks and Open Space Zoning 2, Other Harbor-Channel Islands HCI Easement/Right-of-way ER Specific Plan SPLAN Coastal Planned Unit Community CPC County Zoned Areas CNTY 26, TOTAL Other Zoning 28, TOTAL 40, Source: City of Oxnard, 2005 and Matrix Design Group, 2005 Page 3-18 Draft Background Report April Oxnard_GP_Community_Development_2006_04_20 MRD.doc
97 Background Report 3. Community Development Figure 3-2 Existing Zoning April 2006 Draft Background Report Page Oxnard_GP_Community_Development_2006_04_20 MRD.doc
98 RiverPark er D A V CITY OF VENTURA COMMERCIAL:CONVENTION/HOTEL R COMMERCIAL:REGIONAL EY AR iv COMMERCIAL:OFFICE VIN DRY SWALES/DETENTION BASIN MIXED USE RESIDENTIAL:HIGH/COMM:OFFICE CE NT OPEN SPACE: LANDSCAPE BUFFER RA OPEN SPACE: LANDSCAPED BUFFER OPEN SPACE:PARK SPACE 10 PUBLIC FACILITIES ra 1 F WY C RESIDENTIAL:LOW MEDUIM SA NT A CL AR A AV la RESIDENTIAL:HIGH L AV ROS E A V OPEN SPACE:NEIGHBORHOOD PARKS RESIDENTIAL:MEDIUM Santa RETAIL/OFFICE SCHOOL WATER STORAGE/RECHARGE VINEYARD AV Rose/Santa Clara AUTO SALES & SERVICE 101 FWY H ST BUSINESS PARK COMMERCIAL/MANUFACTURING RETAIL/COMMERCIAL GONZALES RD TEAL CLUB RD SECOND ST CAMINO DEL SOL RICE AV ROSE AV OXNARD BL C ST CEASAR CHAVEZ DR H ST PATTERSON RD L B OR RB VICTORIA AV HA DORIS AV VENTURA RD GONZALES RD STURGIS RD THIRD ST Pa FIFTH ST cif FIFTH ST FIFTH ST SEVENTH ST CHANNEL ISLANDS BL Commercial Office Commercial Office PD Beach/Coastal Residential Zoning Single- Family Beach Beachfront Residential Coastal Low- Density Multiple Family Garden Apartment Coastal Single- Family Water Oriented Multiple- Family Water Oriented Mobile Home Park Coastal SAVIERS RD AL T V N RICE AV HUENEME RD HUENEME RD CITY OF PORT HUENEME Coastal Zoning Coastal Neighborhood Commercial O c ea Coastal Planned Unit Community n Coastal Visitor- Serving Commercial Coastal Resource Protection Other Coastal Dependent Industry Harbor- Channel Islands Coastal Recreation Community Reserve Coastal Energy Facility Easement/ROW Industrial Zoning Ventura County Light Manufacturing Agricultural Open Space Light Manufacturing PD Military Base Heavy Manufacturing Jurisdictinal Boundary Legend Heavy Manufacturing PD Limited Manufacturing Oxnard City Limits Limited Manufacturing PD Oxnard Sphere of Influence Manufacturing PD Coastal Zone Boundary Business & Research Park Source: City of Oxnard GIS Created By: City of Oxnard Planning & Environmental Services, ARNOLD RD Neighborhood Shopping Center Neighborhood Shopping Center PD General Commercial General Commercial PD Central Business District Commercial & Light Manufacturing Commercial & Light Manufacturing PD D Y R LE SA EA PL EDISON DR Commercial Zoning BARD RD BARD RD Single Family Residential Single Family Residential PD Single Family Residential PD Single Family Residential PD Single Family Residential PD Multiple- Family Residential Multiple- Family Residential PD Garden Apartment Garden Apartment PD High- Rise Residential High- Rise Residential PD Manufactured Home PD Residential PD ROSE AV Residential Zoning C ST Zoning Legend CHANNEL ISLANDS BL J ST U.S. Naval Base Ventura County Port Hueneme RICE AV CITY OF PORT HUENEME SAVIERS RD C ST J ST VENTURA RD VICTORIA AV BL OR RB HA PATTERSON RD ic WOOLEY RD WOOLEY RD Figure 3-2 N W E S 1 Current Zoning Map 2 Miles
99 City of Oxnard General Plan Draft (Back of Figure 3-2) Page 3-20 Draft Background Report April Oxnard_GP_Community_Development_2006_04_20 MRD.doc
100 Background Report 3. Community Development Table 3-7 General Plan 2020 and Zoning Compatibility Land Use Designation Zoning Classification Residential Rural R-1 Single family Residential Very Low Density R-1 Single family Residential Low Density R-1 Single family Residential Low-Medium Density R-2 Multiple Family Residential Medium Density R-3 Garden Apartment High Density R-4 High Density Residential; CDB Central Business District Mobile Home 1 MH-PD Mobile Home Planned Development Mobile Home 2 MH-PD Mobile Home Planned Development Commercial General C-2 General Commercial Convenience C-1 Neighborhood Shopping Center Neighborhood C-2 General Commercial Community Shopping Center C-2 General Commercial Regional Shopping Center C-2 General Commercial Specialized C-2 General Commercial Visitor Serving CVC Coastal Visitor Serving Commercial; C-2 General Commercial; Varies Central Business District (CBD) CBD Central Business District Office C-O Commercial Office Industrial Business and Research Park BRP Business Research Park Limited M-L Limited Manufacturing, BRP Business Reseach Park Light M-1 Light Manufacturing Central Industrial Area M-1 Light Manufacturing, M-L Limited Manufacturing Public Utility/Energy Facilities M-1 Light Manufacturing; M-2 Heavy Manufacturing; Varies Priority to Coastal Dependent CDI Coastal Dependent Industry Increased FAR Overlay Varies Open Space Miscellaneous Varies Agriculture C-R Community Reserve Buffer C-R Community Reserve Planning Reserve Overlay Varies Resource Protection R-P Coastal Resource Protection Mineral Resources C-R Community Reserve; Varies Parks Varies Other Public/Semi-Public C-R Community Reserve; Varies Airport Compatible Varies low intensity commercial and industrial Schools R-2 Multiple Family Residential Mixed Use Overlay Varies Source: City of Oxnard General Plan 2020, 1990; City of Oxnard Zoning Ordinance April 2006 Draft Background Report Page Oxnard_GP_Community_Development_2006_04_20 MRD.doc
101 City of Oxnard General Plan Draft Table 3-8 Proposed Residential Units, 2005 Housing Type Proposed Units Percentage Single Family 1, Attached 1, Detached Condominimums Attached Condominiums Unspecified Condominiums Senior Housing TOTAL 5, Note: Includes units with the following status proposed, approved, plan check or under construction as of 4 th quarter 2005 Source: City of Oxnard, 2006 Table 3-9 Housing Characteristics, Housing Type Change (%) Detached 24,909 28, Attached 4,576 4, to 4 Units 4,353 4, Plus Units 8,389 9, Mobile Homes 2,939 2, Source: California Department of Finance, 2000 and 2005 Housing Estimates Approximately 1,519 acres of land within the existing incorporated boundaries are vacant Development Potential Vacant and underutilized lands within the City provide opportunities for new development or redevelopment to occur. Table 3-10 provides a summary of the total acreage of vacant land available by parcel type and Table 3-11 presents a summary of total acreage data by planned land use. Approximately 1,519 acres of land are currently vacant, with the largest percentage of this vacant land designated for industrial development (72.9 percent of the total). However, most vacant properties are either currently within the application process, approved for development, or established as permanent open space (1,204.9 acres or percent). In addition, vacant land that is available for development is generally of insufficient size to provide viable development opportunities. The land constraints posed by the current lack of available properties present challenges to the projected growth within the City. Figure 3-3 illustrates the vacant properties within the City. Page 3-22 Draft Background Report April Oxnard_GP_Community_Development_2006_04_20 MRD.doc
102 Background Report 3. Community Development Table 3-10 Vacant Land by Parcel Type, 2005 Parcel Type Acreage Percent of Total Percent of Planning Area Infill (1) Permanent Open Space Vacant Agriculture <0.1 Vacant Open Space (Private) <0.1 Vacant Development Application Process Vacant Under Construction No Information <0.1 TOTAL 1, Note: (1) Infill lots consist of vacant parcels located within previously developed areas Source: City of Oxnard, 2005 Table 3-11 Vacant Land by Land Use Category, 2005 Land Use Category Acreage Percent of Total Infill Acreage (1) Residential Commercial Industrial 1, Recreation / Conservation Other TOTAL 1, Note: (1) Infill includes all vacant parcels located within previously developed areas Percentage does not equal 100 percent due to rounding Source: City of Oxnard, Local Coastal Program In accordance with State legislation, Oxnard has an adopted a Local Coastal Program consisting of a Coastal Land Use Plan and Coastal Zoning Ordinance. The boundary of the Oxnard coastal zone generally extends 1,000 yards inland from the coast within the City limits. In Oxnard, the coast is measured from mean sea level from the Pacific Ocean and Channel Islands Harbor, and from the channel edge along the Edison Canal and the channels associated with the inland waterway development. The City s coastal zone is divided into four areas: McGrath-Mandalay, Oxnard Shores, Channel Islands, and Ormond Beach. In general, recreational uses are predominant in the McGrath-Mandalay area, with adjacent residential uses concentrated in the Oxnard Shores area. The Channel Islands area includes the Channel Islands Harbor and provides a variety of uses including residential, recreation, visitor serving commercial and harbor-related industry. Separated from the northern portion of the Oxnard coastal zone by the Port of Hueneme, Ormond Beach, to the south, is a mixture of industrial, energy production facilities, wetlands, and other sensitive natural habitats. Building permit authority within the Oxnard coastal zone resides with the City of Oxnard. However, local decisions on the following types of development can be appealed to the California Coastal Commission: April 2006 Draft Background Report Page Oxnard_GP_Community_Development_2006_04_20 MRD.doc
103 City of Oxnard General Plan Draft Developments approved by the local government between the sea and the first public road paralleling the sea or within 300 feet of the inland extent of any beach or of the mean high tide line of the sea where there is no beach, whichever is the greater distance; Developments located on tidelands, submerged lands, public trust lands within 100 feet of any wetland, estuary, stream or within 300 feet of the top of the seaward face of any coastal bluff; and, Any development which constitutes a major public works project or major energy facility Specific Plans The intent of a specific plan is to establish guidelines at the general plan level for those areas requiring a more detailed level of planning. Although specific plans may be prepared by either the public or the private sector the ultimate responsibility for its adoption, amendment, and repeal lies within the City. As a minimum, a specific plan must demonstrate its relationship to the general plan text and land use diagram by including the following ( 65451(b)): The distribution, location, and extent of the uses of land, including open space, within the area covered by the plan. The proposed distribution, location, extent, and intensity of major components of public and private transportation, sewage, water, drainage, solid waste disposal, energy, and other essential facilities proposed to be located within the area covered by the plan and needed to support the land uses described in the plan. Standards and criteria by which development will proceed and standards for the conservation, development, and utilization of natural resources, where applicable. A program of implementation measures, including regulations, programs, public works projects, and financing measures necessary to carry out the established standards and criteria for development. Any other subjects that in the judgment of the City is necessary or desirable for general plan implementation. Page 3-24 Draft Background Report April Oxnard_GP_Community_Development_2006_04_20 MRD.doc
104 Background Report 3. Community Development Figure 3-3 Vacant Land April 2006 Draft Background Report Page Oxnard_GP_Community_Development_2006_04_20 MRD.doc
105 H ST ROSE AV ARNOLD RD CASPER RD OLDS RD RICE AV RICE AV 101 FRWY 101 FRWY MAIN ST TELEPHONE RD PALMA DR 101 FRWY BRISTOL RD River ROSE AVE OLIVAS PARK DR Santa VICTORIA AVE 101 FRWY LELAND ST Clara VINEYARD AV H ST VINEYARD AV COLLINS ST WILL AVE 101 FWY NORTH CENTRAL AVE SANTA CLARA AVE GONZALES RD GONZALES RD HARBOR BL VICTORIA AV DORIS AV VENTURA RD C ST DEL NORTE BL TEAL CLUB RD G ST FIFTH ST FIFTH ST Pacific WOOLEY RD PATTERSON RD C ST B ST OXNARD BL WOOLEY RD RICE AV WEST RD J ST 8TH PL F ST CHANNEL ISLANDS BL BARD RD OXNARD BL PLEASANT VALLEY RD HAILES RD HUENEME RD NAUMAN RD W N S E Legend Oxnard City Limits Infill Lot Permanent Open Space Vacant Agriculture Vacant Application Processing Vacant Open Space Private Vacant Pre-application Vacant Under Construction Other Source: City of Oxnard GIS Created By: City of Oxnard Planning & Environmental Services, Ocean PERIMETER RD BEACH RD Map last updated May 31, 2006 CASPER RD Figure 3-3 Vacant Land Map Miles 0 1 2
106 City of Oxnard General Plan Draft (Back of Figure 3-3) Page 3-26 Draft Background Report April Oxnard_GP_Community_Development_2006_04_20 MRD.doc
107 Background Report 3. Community Development Specific plans are especially suited for the development of large land areas, mixed-use projects, or sites with environmental or fiscal constraints that would pose challenges for a viable development project. The nine adopted and five proposed specific plans as of January 2006 are described in Table 3-12 and illustrated on Figure 3-4. Table 3-12 Adopted and Proposed Specific Plans, City of Oxnard Specific Plan Ordinance No. Adoption Date Acreage Northfield/Seagate Business Park /3/ Mandalay Bay Phase IV /10/ Oxnard Town Center /1/ Rose-Santa Clara Corridor /15/ Northwest Community /27/ McInnes Ranch Business Park /20/ Northwest Golf Course /20/ Northeast Community /24/ RiverPark /10/ Teal Club Proposed n/a 175 Sakioka Farms/Power Proposed n/a 430 Ormond Beach (Southshore) Proposed n/a 323 Ormond Beach (south of Hueneme) Proposed n/a 595 Wagon Wheel Proposed n/a 56 TOTAL 4,773 Note: n/a = Not available Source: City of Oxnard General Plan 2020, City of Oxnard Other City, County, and Regional Plans and Policies Intergovernmental relationships influence and affect the City of Oxnard. A brief summary of the impact of these agencies and their respective policies are described below. Ventura County Local Agency Formation Commission. Formed under provisions of State law, the Ventura County Local Agency Formation Commission (LAFCO) is charged with managing the implementation of State requirements and policies relating to boundary changes within the County. Boundary alterations include spheres of influence, incorporations, annexations, and reorganizations. As with all LAFCO s within the state, the organizations goals and objectives include: encouragement of the orderly formation and expansion of local government agencies; preservation of agricultural land resources; and discouragement of urban sprawal. Ventura County Council of Governments (VCOG). The Ventura County Council of Governments (VCOG) is a voluntary joint powers authority established to promote regional cooperation within the County. VCOG s goal is to facilitate cooperation on issues of mutual concern within the County or subregion of the County. Services provided by the organization include: oversight of the Countywide Integrated Waste Management Plan (CIWMP); review of transportation and planning related regional governance models and documents; coordination with agencies and For more information on the CIWMP, see Chapter 4. April 2006 Draft Background Report Page Oxnard_GP_Community_Development_2006_04_20 MRD.doc
108 City of Oxnard General Plan Draft organization outside of Ventura County; provision of a forum for informal information exchange; and county-wide emergency management coordination. Southern California Association of Governments (SCAG). The Southern California Association of Governments (SCAG) serves as the designated Metropolitan Planning Organization (MPO) for the six-county area including Los Angeles, Orange, San Bernandino, Riverside, Ventura, and Imperial Counties. Mandated at the Federal level, SCAG is responsible for researching and preparing region-wide plans for transportation, growth management, hazardous waste management, and air quality. Oxnard Harbor District. As in independent special district, the Oxnard Harbor District operates the commercial activities of the Port of Hueneme. Created in 1937, the Harbor District is managed by a five-member Board of Harbor Commissioners elected at-large by the residents of the Harbor District. The boundary of the Harbor District includes the cities of Oxnard and Port Hueneme. The Harbor District is empowered to acquire, construct, own, operate, control, and develop any project or activity necessary to accomplish its mission and goals for operation of the harbor. With the exception of the Port of Hueneme, land use decisions remain the responsibility of the jurisdiction within which the property is located. However, activities occurring in the Port of Hueneme can dramatically impact surrounding land uses. As such, cooperation between the City of Oxnard and the Harbor District is necessary to ensure all impacts are considered. California Coastal Commission. The mission of the California Coastal Commission is to protect, conserve, restore, and enhance California s coastal assets to ensure environmental sustainability and stewardship for future generations. The Coastal Commission, in partnership with coastal cities and counties, plans and regulates the use of land within the designated coastal zone. Issues of concern to the commission include: shoreline public access; recreation; habitat protection; landform alteration; development; and other land altering activities. Adjacent Jurisdictions. The land use intentions of neighboring jurisdictions influence and impact the overall pattern of land use within the City of Oxnard. Neighboring jurisdictions include the City of Ventura to the northwest, the City of Camarillo to the northeast, the City of Port Hueneme to the southwest, and the County of Ventura. As previously mentioned, mechanisms exist for the regional coordination of land use and other activities impacting the health and welfare of the community. Page 3-28 Draft Background Report April Oxnard_GP_Community_Development_2006_04_20 MRD.doc
109 Background Report 3. Community Development Figure 3-4 Specific Plan Areas April 2006 Draft Background Report Page Oxnard_GP_Community_Development_2006_04_20 MRD.doc
110 ARNOLD RD CASPER RD EDISON DR OLDS RD UKIAH ST L ST G ST SNOW AV RICE AV RICE AV 101 FRWY 101 FRWY River HARBOR BL TELEPHONE RD Santa LELAND ST Clara VINEYARD AV H ST AZALEA ST ESPLANADE DR VINEYARD AV COLLINS ST AUTO CENTER DR 101 FWY NORTH CENTRAL AVE SANTA CLARA AVE HARBOR BL GONZALES RD VICTORIA AV DORIS AV TEAL CLUB RD EBONY DR PATRICIA ST VENTURA RD L ST RODERICK AV G ST F ST C ST C ST A ST BAHIA DR THIRD ST GONZALES RD WANKEL WY RIBERA DR LATIGO AV COLONIA RD CAMINO DEL SOL STURGIS RD DEL NORTE BL FIFTH ST K ST FIFTH ST Pacific Legend W N S MANDALAY BEACH RD Oxnard City Limits WOOLEY RD OCEAN DR Oxnard Sphere of Influence River Park Adopted Ord./Res. No 2604 Rose-Santa Clara Adopted Ord./Res. No 2085 Northwest Community Adopted Ord./Res. No 9330 Northwest Golf Course Adopted Ord./Res. No 2497 Northeast Community Adopted Ord./Res. No 10,684 McInnes Ranch Business Park Adopted Ord./Res. No 2184 Northfield-Seagate Adopted Ord./Res. No 2012 Mandalay Bay Phase IV Adopted Ord./Res. No 7754 E PIER WK VICTORIA AV WEST RD PORT DR ISLAND VIEW AV KELP ST PATTERSON RD CHANNEL ISLANDS BL Proposed NINTH ST N ST Wagon Wheel Teal Club J ST GUAVA ST Sakioka Farms M ST Ormond Beach I Ormond Beach II Power Machinery K ST J ST E ST C ST B ST PLEASANT VALLEY RD Ocean ELM ST SAVIERS RD BARD RD PERKINS RD IRIS ST ASH ST OXNARD BL LAUREL ST CHANNEL ISLANDS BL CLOYNE ST CYPRESS RD HUENEME RD ROSE AV GARY DR BARD RD WOOLEY RD EMERSON AV PLEASANT VALLEY RD RICE AV CASPER RD HAILES RD Figure 3-4 Specific Plan Areas Source: City of Oxnard GIS Created By: City of Oxnard Planning & Environmental Services, Miles 0 1 2
111 City of Oxnard General Plan Draft (Back of Figure 3-4) Page 3-30 Draft Background Report April Oxnard_GP_Community_Development_2006_04_20 MRD.doc
112 Background Report 3. Community Development Redevelopment Redevelopment is the principal means by which cities can affect community revitalization, foster the maximum utilization of land, promote economic development, provide public amenities, increase housing opportunities, enhance urban aesthetics, and promote public health and welfare. The City of Oxnard maintains a Web site with information on the City s redevelopment activities, and plans ( Redevelopment is the principal means by which cities can affect community revitalization. The City Council serves as the governing board for the Community Development Commission (redevelopment agency); however, the council and the Commission are two separate, distinct legal entities. The Commission reviews all redevelopment plans every five years and adopts a new Redevelopment Implementation Plan that includes updated strategic plan, housing plan, goals, and objectives. The Commission hires staff to carry out the day to day operations and its redevelopment plans. Redevelopment benefits not only the immediate area surrounding the project, but also the entire community. The positive effects of redevelopment include the following: Increased job opportunities, including the construction jobs created by the development of new buildings, new infrastructure, and remodeling of existing buildings; Development of new cultural, shopping, and recreation opportunities within the community; Increase in revenues associated with new development (i.e., sales, hotel, and utility taxes); Reversal of the financial drain of the blighted area into a positive financial asset to the community; Improved safety and environment of the project and adjacent areas; Restoration of community pride; and, Establish barriers to the spread of blighted conditions within the community. Redevelopment projects within the City are primarily funded through the use of tax increment financing, as provided within California law, and bonds. Upon approval of a redevelopment plan, the taxable value of the property within the project area is assessed. When the total taxable value of the project area increases, a majority of the taxes derived from this increase, referred to as tax increments will go to the redevelopment agency. Proceeds from the tax increments are usually used to repay bonds April 2006 Draft Background Report Page Oxnard_GP_Community_Development_2006_04_20 MRD.doc
113 City of Oxnard General Plan Draft issued on behalf of the redevelopment agency. One important factor on tax increments is that they can only be used in the same project area upon which they are generated, with the exception of residential projects which benefit low and moderate income households which can be used within any designated redevelopment area. The City of Oxnard has established five separate redevelopment areas that are intended to encourage reinvestment and rehabilitation of properties within its established boundaries. The City of Oxnard has established five separate redevelopment areas that are intended to encourage reinvestment and rehabilitation of properties within its established boundaries. Existing redevelopment areas within the City of Oxnard are summarized below and depicted on Figure 3-5. Historic Enhancement and Revitalization of Oxnard (HERO). The HERO redevelopment area provides a mechanism for the City to engage in a range of projects and programs that seek to alleviate the blighted conditions within the 2,232 acre redevelopment area. As the largest redevelopment area within the City, the area includes Oxnard Boulevard from the RiverPark development to the north to Hueneme Road in southern Oxnard, along Ventura Boulevard from RiverPark to Rice Avenue, and the area surrounding the Oxnard Airport. Properties within the redevelopment area include underutilized and blighted areas of the City such as the Wagon Wheel area, the former Oxnard High School, and the former St. John s Hospital. Central City Revitalization Project (CCRP). The CCRP encompasses the traditional Central Business District area of the City as well as the area known as the Central Industrial Area. This area generally surrounds the Five-Points Intersection in the downtown area. The redevelopment plan for the CCRP focuses attention on several action areas located in the CBD area where efforts to redevelop and revitalize properties are to be concentrated. In April of 2005, the City adopted the Downtown Strategic Plan with the overall intent to address land use issues and establish priorities for public and private investment in the downtown area. Due to the size of the downtown area, approximately 200 acres, a series of seven districts reflecting the particular character in terms of land use, character, and function were identified for each area. Page 3-32 Draft Background Report April Oxnard_GP_Community_Development_2006_04_20 MRD.doc
114 Background Report 3. Community Development Figure 3-5 Redevelopment Areas April 2006 Draft Background Report Page Oxnard_GP_Community_Development_2006_04_20 MRD.doc
115 ARNOLD RD CASPER RD EDISON DR OLDS RD UKIAH ST L ST G ST SNOW AV RICE AV RICE AV 101 FRWY 101 FRWY River HARBOR BL TELEPHONE RD Santa LELAND ST Clara VINEYARD AV H ST AZALEA ST ESPLANADE DR VINEYARD AV COLLINS ST AUTO CENTER DR 101 FWY NORTH CENTRAL AVE SANTA CLARA AVE HARBOR BL GONZALES RD VICTORIA AV DORIS AV TEAL CLUB RD EBONY DR PATRICIA ST VENTURA RD L ST RODERICK AV G ST F ST C ST C ST A ST BAHIA DR THIRD ST GONZALES RD WANKEL WY RIBERA DR LATIGO AV COLONIA RD CAMINO DEL SOL STURGIS RD DEL NORTE BL Pacific MANDALAY BEACH RD FIFTH ST K ST FIFTH ST WOOLEY RD OCEAN DR PIER WK VICTORIA AV WEST RD PORT DR ISLAND VIEW AV KELP ST PATTERSON RD CHANNEL ISLANDS BL NINTH ST N ST J ST GUAVA ST K ST M ST J ST E ST B ST C ST ELM ST PLEASANT VALLEY RD ASH ST OXNARD BL ROSE AV IRIS ST LAUREL ST CHANNEL ISLANDS BL SAVIERS RD CLOYNE ST BARD RD BARD RD CYPRESS RD GARY DR WOOLEY RD EMERSON AV PLEASANT VALLEY RD RICE AV HAILES RD PERKINS RD HUENEME RD W N S E Legend Oxnard City Limits Oxnard Sphere of Influence Downtown Renewal R-108 Project Area Central City Revitalization Central City Revitalization Annexed Source: City of Oxnard GIS Created By: City of Oxnard Planning & Environmental Services, Ocean Ormond Beach Southwinds Historic Enhancement and Revitalization of Oxnard (HERO) (HERO) Amended 2004 CASPER RD Figure 3-5 Redevelopment Areas Map Miles 0 1 2
116 City of Oxnard General Plan Draft (Back of Figure 3-5) Page 3-34 Draft Background Report April Oxnard_GP_Community_Development_2006_04_20 MRD.doc
117 Background Report 3. Community Development The seven established districts include the following: o o o o o o o The Civic Center District The Plaza Entertainment District A Street Retail District The Transportation Center District The Meta District The South of Seventh District The Five Points Northeast District R-108 Redevelopment Area. Located adjacent to the CCRP in the heart of the downtown area is the R-108 Redevelopment Area. This area encompasses the A Street Mall as well as several adjacent blocks. The focus of this area is on revitalizing retail uses. Southwinds Redevelopment Area. The Southwinds Redevelopment Area, encompassing 153 acres within the Southwinds Neighborhood, is designated with the mission to systematically address neighborhood blight and crime problems that existed in the area. The chief intent of the Southwinds Redevelopment Plan is to continue to reduce crime further through the security fencing and lighting program, enhanced graffiti abatement, stabilization of the existing residential housing stock, encouraging new infill housing and rehabilitation of existing housing, installing enhanced and upgraded public landscaping, new business recruitment, and encourage private reinvestment in the commercial area along Hueneme Road. Completed and on-going activities within the redevelopment area include the investment of over $280,000 for residential rehabilitation and ownership opportunities and completion of Phase I of a median landscaping project on Hueneme Road. Ormond Beach Redevelopment Area. The Ormond Beach Redevelopment Area consists of 1,165 acres located south of Hueneme Road in the Ormond Beach Area. The overall mission of this redevelopment area is to create a high-quality community in Ormond Beach, consisting of a balanced blending of development areas and wetlands and habitat areas, work with the California Coastal Conservancy on wetland restoration and adopt an Ormond Beach Specific Plan. April 2006 Draft Background Report Page Oxnard_GP_Community_Development_2006_04_20 MRD.doc
118 City of Oxnard General Plan Draft Table 3-13 Redevelopment Areas Redevelopment Area Size (acres) Adopted Expiration Last Date to Incur Debt Tax Increment Expansion Historic Enhancement and Revitialization 2,117 4/7/1998 4/7/2029 4/7/2018 4/7/2044 of Oxnard (HERO) HERO Amended /23/2004 3/22/2034 3/22/2024 3/22/2049 Central City Revitalization Project (CCRP) 568 7/6/1976 7/5/2017 1/1/2014 7/5/2027 Central City Revitalization Annexed 129 5/6/2015 5/6/2036 R-108 Redevelopment Area 20 5/14/1968 1/1/2010 1/1/2009 1/1/2020 Southwinds Redevelopment Area 153 6/18/1985 6/17/2026 6/17/2015 6/17/2036 Ormond Beach Redevelopment Area 1,214 11/22/ /21/2024 1/1/ /21/2034 Source: City of Oxnard, Matrix Design Group, Urban Design Community Identity Largely determined by the built environment and the surrounding natural environment, a community is often characterized by the perceptions and experiences of residents and visitors. The character of the community can be complex and diverse. Each neighborhood setting holds an important image that when grouped together produces a unified identity as a single community. Urban, suburban, rural, and coastal elements combine to provide a broad pallet of experiences and expressions, each offering a unique opportunity for an elegant composition. Careful urban design can provide direction and guidance for development to enhance community identity through the creation of place and cohesiveness. This section provides the background information needed to establish the basic tenants of Oxnard s community identity Historical Design Characteristics Architectural style helps create a distinct identity for a single development, neighborhood, or entire community. Most downtown areas possess a variety of architectural styles that mirror the community s historical development and incremental development pattern, and Oxnard is no different. A unique representation of the City s historical past, from initial development to the present, Oxnard s diversity is a reflection of the community s heritage and long-standing variety of cultural backgrounds. The distinct architectural styles present within the City of Oxnard are described in detail below and presented in Table Page 3-36 Draft Background Report April Oxnard_GP_Community_Development_2006_04_20 MRD.doc
119 Background Report 3. Community Development Table 3-14 Architectural Styles Comparison Architectural Style Building Materials Architectural Elements Examples Early Twentieth Brick, concrete, steel, and Recessed entries, bay windows, Woolworth Building Century Commercial wood canopies, and awnings Classical Revival Stone, brick, concrete, Columns, pediments, cornices, and Carneige Art Museum marble, and wood friezes Art Deco Concrete, smooth-faced stone, and metal for exterior coverings, often includes Simplified and streamlined forms and futuristic effects Vogue Theatre on B Street and Teatro on Oxnard Boulevard vivid colors and accents in glass and terra cotta Spanish Revival Masonry, concrete, wood, Arches, cloumns, ornate entrances, US Post Office on A and 4 th stucco, and red clay and red clay tile roofs Streets Early Renaissance Masonry, concrete, steel, and Arched windows, columns, recessed Revival decorative elements entrances, and friezes Eclectic Varies Varies Cabo Restaurant Bungalow Wooden frames, stucco, Walls, porches, chimneys, pitched bricks, roof tiles, shingles, or roofs, and overhangs any other local materials International / Contemporary Source: Concrete, glass, and steel Skeleton-frame construction, ribbon windows, corner glass windows City of Oxnard, Downtown Strategic Plan, 2005; Various Architectural references Early Twentieth Century Commercial. In the late 19 th century, this popular Main Street architectural style is evident in most urban centers around the country. Buildings are characterized by square or rectangular shapes with flat roofs terminating in some form of a cornice. Minimal ornamentation. Classical Revival (Greek Revival). Greek Revival dominated American architecture during the period from 1818 to Considered the first truly national style in the United States, the popularity of the style was a reflection of the county s strong association with classical traditions and democracy. This style was very adaptable and permeated all levels of building from churches, banks, courts and libraries, to residential houses and apartments. Distinctive columns, pilasters, pedimented roofs, and heavy cornices and friezes are characteristic of this architectural style. Art Deco (Moderne). The first widely popular style in the United State, Art Deco (or Moderne, Modernistic) became predominant in the late 1920s. Essentially a style of decoration, Art Deco principles were applied to buildings, furniture, jewelry, and clothing. Art Deco ornamentation consists of geometrical designs, often in the form of parallel straight lines. Spanish Revival. Popular during the 1920s and 1930s, Spanish Revival capitalized on the renovation of original adobe structures Former Bank of A. Levy on A and 5 th Streets Former American Beet Company manager homes at northeast corner of 7 th and B Streets Government buildings, including City Hall, the City Annex Building, and the Main Library April 2006 Draft Background Report Page Oxnard_GP_Community_Development_2006_04_20 MRD.doc
120 City of Oxnard General Plan Draft consisting of massive walls and flat roofs to include more elaborate masonry construction, red clay tile roofs, and ornate entrance portals. Early Renaissance Revival. Popular in the late 19 th and early 20 th Centuries, this style was represented in many public and institutional buildings. Early Renaissance Revival buildings are characterized by close attention to the location of the buildings on the site with subtly different elevations. Eclectic. Eclectic structures do not follow a particular architectural style, often combining a number of architectural styles in a single structure. Bungalow. Bungalow architecture applies to small, single-story houses with a porch or porches. Popular throughout the country in the early 20 th century, they display a high degree of craftsmanship utilizing natural materials when possible. International/Contemporary. Based on modern structural principles, the International/Contemporary style became popular towards the end of the 19 th century. This style rejected decoration, in favor of solid planes and large glass windows Street Character Streetscapes provide the sense of place for the community and quality of life perceptions through the provision of a shared outdoor living space within the community. Building facades, sidewalks, trees and plants, street furniture, and signage all play an important role in creating the final image and identity of a community. In concert with architecture, streetscapes represent the physical form and convey distinct elements of community character. Elements within the City that detract from a successful street façade include the following: Overhead utilities, especially in the Downtown area as one of the prominent destinations within the City Narrow sidewalks Absence or limited street furniture Poor street conditions Gateways and Landmarks Gateways mark the major entrances to the City and provide the opportunity to announce to visitors and residents that one is entering a unique place. Gateways should have distinctive design features, such as Page 3-38 Draft Background Report April Oxnard_GP_Community_Development_2006_04_20 MRD.doc
121 Background Report 3. Community Development signs, graphics, landscaping, and accent lighting that clearly communicate Oxnard s identity. Major entrances into the City include the following: Ventura Freeway at Rice Avenue, Rose Avenue, Oxnard Boulevard, Victoria Avenue, and Harbor Boulevard Fifth Street and Route 1 In addition to marking the entrance to the community, gateways also serve to announce arrival at distinct places within the community, such as Downtown. Most neighborhoods within the City lack well-defined entrances characterized by a distinct physical entry into the area Density and Community Design Similar to most cities in California, Oxnard s urban environment is becoming increasingly denser. As shown in Table 3-15, there were approximately 5,800 persons per square mile (ppsm) in 1990 and an estimated 7,400 persons in 2005, a 28 percent increase. Other cities in Ventura County, such as Thousand Oaks and Camarillo are considerably less dense than Oxnard, while the more mature coastal cities across the state have substantially higher densities. Examples include Los Angeles (8,434 ppsm), Berkeley (9,956 ppsm), and San Francisco (17,115 ppsm). Table 3-15 Densities of California Cities (Population/Sq. Mile) City Oxnard 5,829 7,464 Thousand Oaks 2,104 2,315 Camarillo 2,843 3,320 Los Angeles 7,427 8,434 Berkeley 9,783 9,956 San Jose 4,560 5,403 San Francisco 15,502 17,115 Source: Matrix Design Group, 2006 (based on Census (1990) population, California Department of Finance (2005) population estimates, and land area from the 1994 and 2000 City and County Databooks With 7,464 persons per square mile in 2005, Oxnard is the densest incorporated entity in Ventura County. 3.4 Growth Management As a region, Ventura County is faced with the monumental task of dealing with the consequences of rapid growth in an era of dwindling natural resources, rising housing prices, and tougher economic markets. Successful growth management employs the programs and techniques needed to effectively accommodate growth, maintain quality of life, attract business and capital to the local economy, and increase opportunities for employment, housing, and other basic services. The primary purpose of growth management is to balance new development with: April 2006 Draft Background Report Page Oxnard_GP_Community_Development_2006_04_20 MRD
122 City of Oxnard General Plan Draft The City s ability to provide necessary public services and facilities (water, sewer, transportation); Preservation of existing cultural, social, and economic values that comprise the City s identity and vision for the future; Conservation of open spaces and natural resources; Provision of adequate housing for all income categories; and, Maintenance and enhancement of a healthy business economy Existing Growth Management Program The goals and policies presented in the 2020 General Plan represented the blueprint for the development of the City through the year With the fundamental goal of achieving balanced and orderly growth, the City established the following growth management programs: The creation and implementation of Five-Year Development Plans to assure a desirable balance between short-term growth and infrastructure within the context of the broader long-term goals established by the 2020 General Plan. A Project Consistency Review Program that provides a detailed, performance-based approach for incorporating phasing, infrastructure, fiscal and job/housing balance requirements in specific project approvals based on the performance standards established in the Five Year Development Plans. The institution of a Development Monitoring System to monitor growth on a project-by-project basis using a detailed database to enable the City to track actual cumulative impacts on infrastructure systems from all developments and actual impacts from individual projects. Ventura County and its incorporated cities (including Oxnard) have taken several aggressive steps to ensure the preservation of its rich agricultural soils and focus development within incorporated entities. Frequent review and adjustment of the Five-Year Development Plan and the performance standards to create the sensitivity required for effective planning and regulation. Although originally developed within the 1990 General Plan, the requirements for Five-Year Development Plans was suspended in the early 1990s by a General Plan amendment Existing Land Use Controls While Ventura County has not historically been the direct target of growth pressures focused on other Southern California counties, the County and its incorporated cities (including Oxnard) have taken several aggressive steps to ensure preservation of its rich agricultural soils and focus Page 3-40 Draft Background Report April Oxnard_GP_Community_Development_2006_04_20 MRD.doc
123 Background Report 3. Community Development development within incorporated entities. These steps include establishing numerous agriculture preserves under the State s Williamson Act, development of Guidelines for Orderly Growth, and passage of SOAR (Save Open Space and Agricultural Resources) ordinances. Land Conservation Act Contracts. Owners of agricultural land can reduce their property taxes by entering into a Land Conservation Act contract, agreeing to maintain the land in agriculture for a 10- or 20- year period. Beginning in the late 1960s and early 1970s, the County established numerous agricultural preserves under the State s Williamson Act. As a result of these contracts, large areas of agricultural land are removed from consideration for urban development. Guidelines for Orderly Growth (Guidelines). The Guidelines for orderly development have been adopted by the Ventura Count Board of Supervisors, all City Councils within Ventura County, and the Local Agency Formation Commission (LAFCO). Originally adopted in 1969, these guidelines maintain the consistent theme that urban development with the County should be located within the incorporated cities whenever and wherever practical. The intent of these Guidelines are to: Clarify the relationship between the Cities and County with respect to urban planning; Facilitate a better understanding regarding development standards and fees; and Identify the appropriate governmental agency responsible for making determinations on land use requests. This agreement created Areas of Interest that define major geographic areas reflective of one city or community. The Guidelines specified that other city could be formed within a given Area of Interest. This concept provided that there would be no competition between incorporated entities over the establishment of urban uses. Another concept embedded in the Guidelines is the notion of a Sphere of Influence. Before land can be annexed into a jurisdiction, it must be located within the city s Sphere of Influence. The overall result of these policies has been the development of relatively compact cities within the County, including Oxnard, all with their own unique Area of Interest. Similar to other entities within the County, Oxnard is also surrounded by intervening areas of agricultural land, open space, or other natural resources (such as the Pacific Ocean) which provide a buffer to the City and create a unique identity for the community. For more information on the Grennbelt Agreements and Prime Agricultural Farmland, see Chapter 5. Greenbelt Agreements. Oxnard is a participant, along with several other incorporated entities, in agreements with Ventura County and the Local Agency Formation Commission (LAFCO) for the establishment of April 2006 Draft Background Report Page Oxnard_GP_Community_Development_2006_04_20 MRD
124 City of Oxnard General Plan Draft greenbelts. These greenbelts ensure that entities entering into these agreements will not annex land within the subject areas resulting in the preservation of open space buffers between entities. In addition, the County pledges not to permit development within these areas. The City of Oxnard is a participant in the following two greenbelt agreements (Figure 5-2, within Chapter 5, shows the locations of these areas): Oxnard-Camarillo Greenbelt Agreement. During the 1980 s the City signed a joint resolution with the City of Camarillo and the County of Ventura to create the Oxnard-Camarillo Greenbelt Agreement. This agreement calls for the preservation of a large agricultural area (approximately 27,000 acres) between the cities of Oxnard and Camarillo. Oxnard-Ventura Greenbelt Agreement. Located in the northwest portion of the Planning Area, Oxnard entered into an agreement with the City of Ventura in 1994 for the preservation of 2,460 acres of agricultural land between the two entities. SOAR. Beginning in 1995, jurisdictions within the County began using City Urban Restriction Boundaries (CURB), also referred to as Urban Growth Boundaries, to direct growth and preserve agricultural resources. Oxnard adopted its SOAR Ordinance on November 3, This initiative created a CURB around the City preventing it from developing outside the line without the approval of the voters until December 31, As a result of this initiative the City is limited in its response to demands for additional development. Traditional accommodation techniques, such as outward expansion of the city, are no longer a viable option. As the population increases, the City will be faced with the prospect of breaking the SOAR boundary or increasing density and expanding upwards to accommodate additional needs. it is not surprising that Oxnard is Ventura County s industrial center, with the County s highest concentration of industrial space. Oxnard is more. It is a financial center. 3.5 Economic Development Located midway between Los Angeles and Santa Barbara, Oxnard lies in the center of one of the world s most productive agricultural areas. The largest city within Ventura County, Oxnard is a rich combination of a relaxed seaside destination and progressive business center. Its Mediterranean climate, fertile topsoil, adequate water, and long harvest season combine to provide favorable agricultural conditions. Other assets include the City s proximity to the deep water harbor of Port Hueneme and the Naval Base Ventura County (Pt. Mugu and the Naval Construction Battalion Port Hueneme). Given the assets listed above, it is not surprising that Oxnard is Ventura County s largest industrial center, with the County s highest concentration Page 3-42 Draft Background Report April Oxnard_GP_Community_Development_2006_04_20 MRD.doc
125 Background Report 3. Community Development of industrial space. Oxnard is more: it is a financial center. It has the only high-rise office buildings between San Jose and Los Angeles. These buildings are currently fully leased. Another high-rise office building is fully entitled and in the process of pre-leasing. RiverPark, a major new planned community with homes, schools, and commercial space will contribute to Oxnard s ongoing change. The City will become an even more desirable place to do business. The growing California State University, Channel Islands, in Camarillo, will contribute to the quality of Oxnard s workforce and will spin-off new businesses. In some ways Oxnard is constrained by economic factors affecting California. In contrast to most of its modern history, California, for a long list of reasons, is currently perceived to be an unattractive place to do business. That perception negatively impacts Oxnard s ability to achieve its economic potential Real Estate Characteristics Quantity Commercial real estate includes industrial, retail, and office uses. Reflecting Oxnard s position as Ventura County s industrial center, industrial space dominates the Oxnard/Port Hueneme Market Area s leasable commercial space, or commercial base. The data source for this data is CB Richard Ellis, and their database combines Oxnard with Port Hueneme for many of their statistics. Their data refers to leasable space. Industrial space is almost 80 percent of all of the market s commercial space. Table 3-16 and Figure 3-6 present Oxnard s commercial base information for 2000 to Port Hueneme is surrounded by Oxnard, with a population of 22,192. The two cities combined are a market area representing 26% of the County s population, 24% of the County s Retail Base, 13% of the County s Office Base, and 30% of the County s Industrial Base. The Oxnard/Port Hueneme market also has the largest quantity of leasable industrial space in Ventura County. At over 18 million square feet it is almost half of all leasable industrial space in West Ventura County. Oxnard not only has the largest amount of industrial space available, but also has the largest selection of large industrial buildings. The space available has remained stable with minimal growth over the last five years. Summaries of Oxnard industrial space availability are presented in Table 3-17 and Figure 3-2. April 2006 Draft Background Report Page Oxnard_GP_Community_Development_2006_04_20 MRD.doc
126 City of Oxnard General Plan Draft Table 3-16 Commercial Base Oxnard/Port Hueneme (2000 to 2004) Type of Leaseable Space Total Leaseable Industrial Space 15,605,671 16,561,848 17,277,597 17,525,031 18,428,784 Total Leaseable Office Space 881,701 1,251,877 1,329,479 1,297,269 1,254,967 Total Leaseable Retail Space 2,982,976 3,332,730 3,677,914 3,677,914 3,065,914 TOTAL Commercial 19,470,348 21,146,455 22,234,990 22,500,214 23,289,665 Estimated Additions to Retail Base ,754 Source: CB Richard Ellis, University of California, Santa Barbara (UCSB) Economic Forecast Project, 2004 Figure 3-6 Commercial Base Detail, Oxnard/Port Hueneme, 2000 to 2004 percent of total commercial base 100% 90% 80% 70% 60% 50% 40% 30% 20% 10% 0% Industrial Base Office Base Retail Base Source: CB Richard Ellis, 2004 Page 3-44 Draft Background Report April Oxnard_GP_Community_Development_2006_04_20 MRD.doc
127 Background Report 3. Community Development Table 3-17 Leasable Industrial Space in Ventura County (2004, 4th Quarter) Location Buildings Surveyed Industrial Base (1) Oxnard/Port Hueneme ,428,784 Camarillo 449 8,505,766 San Buenaventura ,518,130 Subtotal 1,040 37,452,680 West Ventura County Thousand Oaks 194 7,377,212 Westlake Village (2) 127 4,440,034 Simi Valley 187 7,979,329 Moorpark 86 3,598,271 Subtotal ,394,846 East Ventura County (3) TOTAL Ventura County (3) 1,634 60,847,526 Notes: (1) Includes existing competitive multi-tenant and single-tenant industrial buildings (vacant and occupied), with building size of 10,000 or more square feet (2) Includes areas in both Ventura County and Los Angeles County (3) Includes Westlake Village Source: CB Richard Ellis, 2004 Figure 3-7 Industrial Space in selected Cities in Ventura County, ,428,784 10,518,130 8,505,766 7,377,212 7,979,329 4,440,034 3,598,271 Ventura Oxnard/ Port Hueneme Camarillo Thousand Oaks Westlake Village Simi Valley Moorpark Source: CB Richard Ellis, 2004 April 2006 Draft Background Report Page Oxnard_GP_Community_Development_2006_04_20 MRD.doc
128 City of Oxnard General Plan Draft The Oxnard/Port Hueneme office and retail markets are also impressive. With about 1.2 million square feet of office space, the Oxnard/Port Hueneme market represents about 31 percent of West Ventura County total office space as presented in Table 3-18 and Figure 3-8. Oxnard also has Ventura County s only high-rise office buildings, the two towers in the Financial Plaza, across from the Explanade. Table 3-18 Leasable Office Space in Ventura County (2004, 4th Quarter) Location Buildings Surveyed Office Base (1) Oxnard 27 1,254,967 Camarillo 36 1,283,658 San Buenaventura 56 1,449,742 Subtotal 119 3,988,367 West Ventura County Thousand Oaks 52 1,665,633 Westlake Village (2) 84 4,042,369 Simi Valley/Moorpark ,353 Subtotal 151 6,085,355 East Ventura County TOTAL Ventura County ,073,722 Notes: (1) Includes existing competitive multi-tenant office buildings of 10,000 square feet or greater: excludes government, medical buildings, and owner/user buildings (2) Includes areas in both Ventura County and Los Angeles County Source: CB Richard Ellis, 2004 Figure 3-8 Office Space in selected Cities in Ventura County, ,042,369 1,449,742 1,254,967 1,283,658 1,665, ,353 Ventura Oxnard Camarillo Thousand Oaks Westlake Village Simi Valley/ Moorpark Note: Westlake area includes both Ventura County and Los Angeles Source: CB Richard Ellis, 2004 Page 3-46 Draft Background Report April Oxnard_GP_Community_Development_2006_04_20 MRD.doc
129 Background Report 3. Community Development With about 1.2 million square feet of retail space, the Port Hueneme market represents 47 percent of West Ventura County s retail market. See Table 3-19 and Figure 3-9. In fact, until the recent completion of the Simi Valley Town Center, the Oxnard/Port Hueneme Retail Sector was Ventura County s largest Retail metro area. East Ventura County possesses slightly more than half (51 percent) of the total leasable retail space in Ventura County. Table 3-19 Leasable Retail Space in Ventura County (2004, 4th Quarter) Location Buildings Surveyed Retail Base (1) Oxnard/Port Hueneme 22 3,605,914 Camarillo 10 1,536,523 San Buenaventura 19 2,274,290 Santa Paula/Fillmore 3 307,243 Subtotal 54 7,723,970 West Ventura County Newbury Park 7 761,807 Thousand Oaks 15 2,121,107 Westlake Village (2) 5 595,792 Simi Valley 25 3,294,558 Moorpark 4 703,887 Subtotal 56 7,477,151 East Ventura County (3) TOTAL Ventura County (3) ,201,121 Notes: (1) Includes existing competitive community/neighborhood shopping centers, the majority of which are anchored by major tenants (2) Includes areas in both Ventura County and Los Angeles County (3) Includes Westlake Village Source: CB Richard Ellis, 2004 Figure 3-9 Retail Space in selected Cities in Ventura County, ,605,914 3,294,558 2,274,290 2,121,107 1,536, , , , ,243 Ventura Oxnard/ Port Hueneme Camarillo Santa Paula/ Fillmore Newbury Park Thousand Oaks Westlake Village Simi Valley Moorpark Source: CB Richard Ellis, 2004 April 2006 Draft Background Report Page Oxnard_GP_Community_Development_2006_04_20 MRD.doc
130 City of Oxnard General Plan Draft By volume, Industrial space has been the Oxnard/Port Hueneme market s most rapidly growing sector over the past four years adding 2.8 million square feet (74 percent) of the markets total 3.8 million square feet in the last four years. However, by growth rate, the industrial sector has been the slowest growing commercial sector. Its 18 percent growth is below the retail sector s 20 percent growth, and it is dwarfed by office sector s 42 percent growth. Table 3-20 In the near future, the RiverPark project will be Oxnard s largest source of developed real estate. This large planned live-work community currently plans include 600,000 square feet of new office space and about 1,000,000 square feet of new retail space. The residential portions of the project, to add a total of 2,800 units, are currently under construction. As part of the RiverPark development, there is another high-rise office building fully entitled in the Financial Plaza, and there is a proposal for three new mixed use (residential, office, and retail) high-rises adjacent to the Esplanade Shopping Center. Price East Ventura County Lease rates and per-foot sales prices have historically been much higher than in West Ventura County, for all classes of commercial space. While relatively few sales make it difficult to separate compositional changes from price changes to clearly establish price trends, it appears that the difference between East and West Ventura County lease rates and sales prices has been declining. Lease and sale rates for office, industrial, and retail property in western and eastern Ventura County are presented in Tables 3-20 to Office Lease Rates and Sale Prices, Ventura County (2000 to 1st Quarter 2004) 2004 (Q1) Lease Type (monthly lease or value p.s.f.) West Ventura County Lease Rates Class A and Mid-Rise n/a 1.88 Lease Rates Class B, 2-3 Story/Garden Style n/a 1.60 Lease Rates Class C, Back Office/R&D n/a 1.38 Avg. Sale Price per Sq. Ft. Class A (1) n/a Avg. Sale Price per Sq. Ft. Class B, 2-3 Story/Garden (2) n/a Avg. Sale Price per Sq. Ft. Class C, Back Offce/R&D n/a n/a Avg. Sale Price per Square Foot for Land n/a East Ventura County Lease Rates Class A and Mid-Rise n/a 2.30 Lease Rates Class B, 2-3 Story/Garden Style n/a 2.08 Lease Rates Class C, Back Office/R&D n/a 1.58 Avg. Sale Price per Sq. Ft. Class A (1) n/a Avg. Sale Price per Sq. Ft. Class B, 2-3 Story/Garden (2) n/a Avg. Sale Price per Sq. Ft. Class C, Back Offce/R&D n/a n/a Avg. Sale Price per Square Foot for Land n/a Source: CB Richard Ellis, 2004 Page 3-48 Draft Background Report April Oxnard_GP_Community_Development_2006_04_20 MRD.doc
131 Background Report 3. Community Development Table 3-21 Industrial Lease Rates and Sale Prices, Ventura County (2000 to 1st Quarter 2004) Lease Type (monthly lease or value p.s.f.) West Ventura County Lease Rates Class A, Hi-Tech/R&D Space n/a 0.68 Lease Rates, Light Industrial n/a 0.58 Lease Rates, Heavy Industrial n/a 0.45 Average Sale Price per Square Foot, Land n/a 9.75 East Ventura County Lease Rates Class A, Hi-Tech/R&D Space n/a 0.83 Lease Rates, Light Industrial n/a 0.71 Lease Rates, Heavy Industrial n/a 0.63 Average Sale Price per Square Foot, Land n/a Source: CB Richard Ellis, (Q1) Table 3-22 Retail Lease Rates and Sale Prices, Ventura County (2000 to 1st Quarter 2004) Lease Type (monthly lease or value p.s.f.) West Ventura County Lease Rates, Regional Mall n/a 3.38 Lease Rates, Neighborhood Shopping Center n/a 2.25 Lease Rates, Strip Center n/a 1.50 Average Sale Price per Sq. Ft., Neighborhood Shopping Center n/a n/a Average Sale Price per Sq. Ft., Strip Center n/a n/a East Ventura County Lease Rates, Regional Mall n/a 4.00 Lease Rates, Neighborhood Shopping Center n/a 2.63 Lease Rates, Strip Center n/a 1.68 Average Sale Price per Sq. Ft., Neighborhood Shopping Center n/a n/a Average Sale Price per Sq. Ft., Strip Center n/a n/a Source: CB Richard Ellis, (Q1) The office sector is where we have seen the most changes in relative prices between East Ventura County and West Ventura County from 2000 to For example, the difference between East and West Ventura County high-rise and mid-rise class A office space fell 32 cents from, 74 cents to 42 cents. This represents a 43 percent decrease in the price differential between the two regions. Only the light industrial portion of the industrial sector has shown significant decline in the price differential between East and West Ventura County between 2000 and Lease rates differentials for these properties have fallen from 21 cents to 13 cents. Sales prices provide something of a paradox. While lease rates, except for light industrial, have changed relatively little, the industrial zoned land sales price April 2006 Draft Background Report Page Oxnard_GP_Community_Development_2006_04_20 MRD.doc
132 City of Oxnard General Plan Draft differential has fallen over 23 percent from $6.88 to $5.25. This indicates that the Industrial space price differential between East and West Ventura County will likely shrink in future years. Retail space prices are perhaps even more location dependent than for other types of space. Still, data from 2000 to 2004 provides evidence of some decrease in price differential between the East and West Ventura County market. Sales price provide stronger evidence of a narrowing of the price differential between the County s two major markets. As was the case with industrial space, the declining sales price differential most likely is a precursor of smaller lease rate differentials Market Demand Profile Economic Activity Oxnard is located on some of the most productive agricultural land in the World. Not surprisingly then, agriculture is a significant component of the City s industrial base. Over time, agriculture has been a stable source of jobs and economic activity. In 2004, agricultural production represented 19.5 percent of Oxnard s job base. For comparison, agricultural production represents only about 2.5 percent of California s jobs. Agriculture has a larger impact than just what one would imagine if one only looked at agricultural jobs. The industry has many support requirements. Consequently, many jobs reported in services and retail sales would not exist if it were not for the community s large agricultural sector. Additionally, a large portion of the City s non-durable manufacturing sector is associated with agriculture. Oxnard is also home to the firm Seminis, a large, publicly traded company, and the world s largest developer, grower, and marketer of vegetable and fruit seeds. Other major employers in Ventura County are shown on Table With a bit more than 11 percent of Oxnard s jobs in manufacturing, the City s manufacturing sector is comparable to California s which has a bit more than 10 percent of its jobs in manufacturing. What is different is that unlike California, Oxnard s Manufacturing Sector is not in freefall. Oxnard can be attractive to companies in manufacturing, particularly those currently producing in California s major metropolitan areas. However, moving a company is expensive. Because of perverse incentives, many companies do not consider relocating in California. In most cases, companies considering moving, move out of the state. Page 3-50 Draft Background Report April Oxnard_GP_Community_Development_2006_04_20 MRD.doc
133 Background Report 3. Community Development Table 3-23 Top 35 Employers, Ventura County Rank Company / Employer Location Industry Jobs As of 1 United States Naval Base Naval Base Ventura Cty. Public Administration 14,457 1/05 2 County of Ventura Ventura County Public Administration 7,424 1/05 3 Amgen, Inc. Thousand Oaks Semi-Durable Manf. 6,800 2/05 4 Countrywide Financial Corp. Simi Valley Finance/Insurance 5,700 2/05 5 Anthem (FKA Wellpoint) Thousand Oaks Finance/Insurance 4,039 2/05 6 Ventura Unified School District San Buenaventura Public Administration 2,318 2/05 7 Verizon Communication, Inc. Thousand Oaks Information 2,178 1/05 8 Conejo Unified School District Thousand Oaks Public Administration 2,150 1/05 9 Vons Countywide Retail Trade 2,136 1/05 10 Ventura County Health Care Agency San Buenaventura Health Care/Social 2,100 1/05 11 Farmers Insurance Group Simi Valley Finance/Insurance 2,100 2/05 12 Simi Valley Unified School District Simi Valley Public Adminsitration 2,086 1/05 13 St. John s Regional Medical Center Oxnard/Camarillo Health Care/Social 1,994 1/05 14 Ventura County Community College San Buenaventura Public Administration 1,927 2/05 15 Community Memorial Hospital San Buenaventura Health Care/Social 1,700 1/05 16 Technicolor Videos Services Camarillo Durables Manf. 1,700 9/04 17 Los Robles Regional Medical Center Thousand Oaks Health Care/Social 1,465 2/05 18 City of Oxnard Oxnard Public 1,424 1/05 Administration 19 Oxnard Union High School District Oxnard Public 1,414 1/05 Administration 20 Kavlico Moorpark Durables Manf. 1,300 2/05 21 Waterway Plastics Oxnard Semi-Durable Manf. 1,300 2/05 22 Air National Guard Point Mugu Public Administration 1,220 2/05 23 Harbor Frieght Tools Oxnard/Camarillo Wholesale Trade 1,200 2/05 24 Moorpark Unified School District Moorpark Public Administration 1,099 2/05 25 City of Buenaventura San Buenaventura Public Administration 1,039 2/05 26 Simi Valley Hospital & Health Care Simi Valley Health Care/Social 895 2/05 27 Hass Automation Oxnard Durables Manf /05 28 Baker Pharmaceautical Thousand Oaks Semi-Durable Man /05 29 Aluminum Precision Prodcuts Oxnard Durables Manf /05 30 Pentair Pool Products Moorpark Wholesale Trade 623 2/05 31 City of Thousand Oaks Thousand Oaks Public Administration 612 2/05 32 Semtech Corp. Camarillo Durables Manf /04 33 City of Simi Valley Simi Valley Public Administration 585 1/05 34 Silver Star Automotive Group Thousand Oaks Retail Trade 577 2/05 35 California Lutheran University Thousand Oaks Educational Services 550 1/05 Source: UCSB Economic Project, 2005 Other Ventura County communities have higher concentrations in manufacturing than Oxnard. In particular, Camarillo has a higher concentration of jobs in durables manufacturing, and Thousand Oaks has a higher concentration of jobs in non-durables manufacturing. These two communities have been particularly successful in attracting or growing those types of companies. Examples of manufacturing companies in Oxnard include Proctor and Gamble Paper Products (about 500 employees), Haas Automation, the largest machine tool builder in the United States, (about 1,200 employees), Waterway Plastics, manufacturer of jets and plastic fittings for spas, (about 1,300 jobs), and Aluminum April 2006 Draft Background Report Page Oxnard_GP_Community_Development_2006_04_20 MRD.doc
134 City of Oxnard General Plan Draft Precision Products, manufacturer of close and open die forgings of aluminum and titanium alloys, (about 650 employees). Oxnard s neighbor, The City of Port Hueneme, is home to the Port of Hueneme. This port, the only commercial deep-water seaport between San Francisco Bay and Los Angeles, is the United States (US) port of entry for California s Central Coast. The port serves international business and ocean carriers from the Pacific Rim and Europe. The Port of Hueneme is the primary support facility for the Central Coast s off-shore oil industry and Ventura County s agricultural sector. Much of the economic activity associated with the Port takes place in Oxnard. The Oxnard Harbor District, the port authority, is the Grantee of U.S. Foreign Trade Zone (FTZ) #205. This FTZ is a trade enhancing program that is available to support businesses operating in the region. FTZs are secure areas that are physically within the U.S. but are considered outside of U.S. Customs territory. Companies or individuals may ship goods into a FTZ and then manipulate, process, assemble, or store imports within the boundaries, deferring customs duty on these goods until such time as they are ready for consumption by the U.S. market. Naval Base Ventura County (NBVC), near Oxnard, is home to a military base that includes development and testing of new systems, joint welfare experimentation, training and readiness, and Homeland Defense. NBVC is composed of two operating facilities, Point Mugu and Port Hueneme, that are home to six major commands: Naval Air Station, Naval Air Warfare Center-Weapons Division, Airborne Early Warning Wing (Pacific Fleet), 31 st Seabee Readiness Group, Naval Surface Warfare Center, and Naval Satellite Operations Center. The base was home to over 14,000 jobs as of February Many of those workers live in Oxnard. Additionally, the military generates many jobs that are not included in the 14,000 on-base jobs. These include support services such ranging from engineering to facilities maintenance. They also include induced jobs resulting from the economic activity resulting from all the jobs on base, jobs such as those held by grocery workers. Infrastructure In 2004, Oxnard and Port Hueneme represented 26 percent of Ventura County s population. Together, they encompass 21.4 percent of the County s Housing Stock, 23.7 percent of its leasable retail base, 12.5 percent of its leasable office base, and 30.3 percent of its leasable industrial base. The regions population is larger than one would think looking at housing units. Residential housing units are more intensively Page 3-52 Draft Background Report April Oxnard_GP_Community_Development_2006_04_20 MRD.doc
135 Background Report 3. Community Development used in Oxnard/Port Hueneme, with more people per housing unit than for all of Ventura County. These factors are graphically depicted on Figure Figure 3-10 Oxnard/Port Hueneme s Share of Ventura County, % 26.0% 21.4% 23.7% 12.5% Population Housing Stock Retail Base Office Base Industrial Base Source: CB Richard Ellis, CA Department of Finance Oxnard/Port Hueneme s leasable Retail space relative to population is comparable to other Ventura County communities. Competition between cities for large retailers in this area is intense. In West Ventura County, neighboring San Buenaventura has a large successful mall. Neighboring Camarillo has a very successful Outlet Mall that will soon see expansion. In East Ventura County, both Thousand Oaks and Simi Valley have very large malls, the former an established venue, and the latter is a new, fashionable, and upscale facility. However, the RiverPark project will significantly add to the City s retail base. Oxnard/Port Hueneme s leasable office space seems a bit small in relation to nearby communities, particularly given the existence of the two office towers. The Oxnard office space market faces competition from the Thousand Oaks/Westlake Village area, particularly for Class A space. The Thousand Oaks area has more selection than Oxnard, and is closer to Los Angeles, seemingly a factor in some company s location decisions. Oxnard/Port Hueneme s leasable Industrial space area is large in relation to its size. This is a community strength with respect to Economic Development. Firms have located and will continue to locate in the community because of the selection and availability of Industrial buildings. April 2006 Draft Background Report Page Oxnard_GP_Community_Development_2006_04_20 MRD.doc
136 City of Oxnard General Plan Draft Planning Economic Development Any cost-effective economic development plan will be consistent with the regions strengths. Our purpose here is not to develop an economic development plan for Oxnard. Instead, we hope to provide some insights on cost-effective economic development plans. Any cost-effective economic development plan will be consistent with the regions strengths. We discuss some, not all, of Oxnard s strengths. Picking the next Amgen is impossible. Therefore, attempts to develop specific new industries are not likely to be cost effective. Any development plan should be consistent with Oxnard s strengths. A successful plan likely involves leveraging the City s industrial base, the Port of Hueneme, the agri-business concentration, and the military base. Such a plan would acknowledge the City s current growth-consensus. Such a consensus is an immeasurable asset for those responsible for economic development, and is in stark contrast with many other Coastal California communities. One example of a good long-term plan consistent with Oxnard s strengths may be in Trade. The Port of Hueneme, Oxnard s existing industrial infrastructure, and the difficulty in locating manufacturing to the California Coast makes the City very competitive. Competition is also tough in the hospitality industry. However, Oxnard has not exploited this market, as evidenced by the somewhat limited promotion of its beaches and marina. New hotels, some of which are upscale relative to existing Ventura County facilities are under construction in Oxnard and other Ventura County communities. Potential opportunities exist for Oxnard to focus future use of its coastal area. Page 3-54 Draft Background Report April Oxnard_GP_Community_Development_2006_04_20 MRD.doc
137 4. Infrastructure and Community Services 4.1 Introduction The Infrastructure and Community Services element provides a description of existing public facilities and services, their locations, and plans and locations of future improvements and/or expansions. It also provides a framework for the creation of a comprehensive plan for the development of public facilities and services needed for the implementation of the community s vision for the future. This Chapter is divided into the following discussions: Circulation, Traffic, and Transportation (4.2) Utilities Water Supply and Water Quality, Wastewater System, Stormwater Drainage, and Solid and Hazardous Waste (4.3) Public Facilities and Services Public Safety, Marine Safety, Education, Libraries, Government Administration and Capital Facilities, and Private Utilities (Gas and Electric, and Communications) (4.4) Parks and Recreation (4.5) 4.2 Circulation, Traffic, and Transportation A community is both defined and constrained by the network of highways, roads, streets, waterways, and railways that move its residents and goods through and also in and out of the area. The historical emphasis of transportation planning efforts in the City of Oxnard has been on the development of a street and highway network that would meet the demands of private automobile users and industry. Alternative transportation modes, including public transportation, bicycling, and passenger rail facilities, are becoming more important as the City of Oxnard focuses on reducing the dependency on private automobiles for transportation. Key Terms Average Daily Traffic (ADT). The total traffic volume during a given period of time divided by the number of days in the period. Current ADT volumes can be determined by continuous traffic counts or periodic counts. The City of Oxnard focuses on reducing the dependency on private automobiles for transportation. Page 4-1 Background Report April Oxnard_GP_Public_Facilities_and_Services_2006_04 20 MRD.doc
138 City of Oxnard General Plan Draft Where only periodic traffic counts are taken, ADT volume can be established by applying correction factors such as for the season or day of the week. Capacity. Maximum rate of flow that can be accommodated on a facility segment under prevailing conditions. Congestion. The resulting reduction of flow that occurs when demand exceeds the capacity of a roadway. Level of Service (LOS). A descriptive indicator of operating conditions on a lane or roadway. LOS is a qualitative measure of the effect of traffic flow factors, such as speed and travel time, interruption, freedom to maneuver, driver comfort, and convenience. Volume to Capacity Ratio (V/C). The V/C ratio is a comparison of traffic volume on a roadway to the traffic capacity of the roadway, based on the number of lanes available Streets and Highways Functional Classification of Roadways A functionally classified roadway system allows streets to be grouped according to their purpose and function within the transportation network. Urban streets generally serve two primary functions: traffic movement or mobility, and accessibility. Functional classification describes the level of mobility and access provided by facilities within a community s transportation network. The City of Oxnard currently provides standards for facilities described in four functional categories: freeways, arterials, collectors, and local roads. Each type of road serves a specific purpose outlined below. This hierarchy of streets and highways is only a general guide to the classification of roadways which make up the circulation system. Often a street serves a dual function (both mobility and accessibility) and it is difficult to provide a definitive classification. In addition, the width of a roadway does not always correspond directly to its function in the overall circulation system, although the wider roadways tend to have more regional functions within the overall circulation system. Figure 4-1 illustrates the functional classification of Oxnard s road network. Freeways. Freeways (expressways) are intended to serve both intraregional and inter-regional travel. Freeways provide for high speed, through traffic movement on continuous routes. Freeways provide connections to other regional highways and are capable of carrying heavy Page 4-2 Background Report April Oxnard_GP_Public_Facilities_and_Services_2006_04 20 MRD.doc
139 Draft 4. Infrastructure and Community Services Figure 4-1, Roadway Classification Map placeholder April 2006 Background Report Page Oxnard_GP_Public_Facilities_and_Services_2006_04 20 MRD.doc
140 TELEPHONE RD ARNOLD RD CASPER RD EDISON DR OLDS RD UKIAH ST L ST G ST SNOW AV RICE AV RICE AV 101 FRWY 101 FRWY CENTRAL AVE HARBOR BL LELAND ST VINEYARD AV VINEYARD AV ESPLANADE DR COLLINS ST AUTO CENTER DR SANTA CLARA AVE H ST 101 FWY NORTH HARBOR BL GONZALES RD VICTORIA AV DORIS AV EBONY DR TEAL CLUB RD PATRICIA ST AZALEA ST VENTURA RD L ST RODERICK AV G ST F ST C ST C ST A ST BAHIA DR THIRD ST ROSE AV GONZALES RD WANKEL WY RIBERA DR LATIGO AV COLONIA RD CAMINO DEL SOL STURGIS RD DEL NORTE BL FIFTH ST K ST FIFTH ST Pacific MANDALAY BEACH RD WOOLEY RD OCEAN DR VICTORIA AV WEST RD PORT DR ISLAND VIEW AV KELP ST PATTERSON RD CHANNEL ISLANDS BL NINTH ST N ST J ST GUAVA ST K ST M ST J ST E ST B ST C ST ELM ST PLEASANT VALLEY RD ASH ST OXNARD BL IRIS ST LAUREL ST CHANNEL ISLANDS BL SAVIERS RD CLOYNE ST BARD RD BARD RD CYPRESS RD GARY DR WOOLEY RD EMERSON AV PLEASANT VALLEY RD RICE AV 1 HAILES RD Legend PERKINS RD HUENEME RD Oxnard City Limits Freeway Interchange SR-1 (Oxnard Blvd.) and Channel Islands Blvd. SR-1 (Oxnard Blvd.) and Pleasant Valley Rd. US-101 and Del Norte Blvd. US-101 and Rose Ave. US-101 and Rice Ave. / Santa Clara Ave. US-101 and SR-1 (Oxnard Blvd.) US-101 and SR-232 (Vineyard Ave.) US-101 and Victoria Ave. Ocean CASPER RD W N S E Roadway Functional Classification Freeway Highway Primary Arterial Secondary Arterial Figure 4-1 Roadway Functional Classification Source: URS Corporation, 2005 Miles 0 1 2
141 City of Oxnard General Plan Draft Back of Figure 4-1, roadway classification map Page 4-4 Background Report April Oxnard_GP_Public_Facilities_and_Services_2006_04 20 MRD.doc
142 Draft 4. Infrastructure and Community Services traffic volumes. Speed limits on freeways are usually the highest allowed by law. Access to freeways is strictly controlled and accomplished through on- and off-ramps. Freeways provide no access to adjacent properties (but do provide high visibility). Collector streets require 80 feet of Right-of-Way (ROW) and are typically designed to accommodate three to four lanes of traffic. Arterials. Arterials provide for mobility within Oxnard and adjacent areas. Arterials are designed to carry through traffic on continuous routes and join major traffic origins and destinations, freeways, and other arterials. For arterials, access is less restricted than freeways, although access to and from adjacent property is generally selective. Collector streets require 80 feet of ROW and are typically designed to accommodate three to four lanes of traffic. Collectors. Collectors provide for internal traffic movement within Oxnard and connect local roads to arterials. Collectors are designed to take traffic off of local roads and feed it into arterials and freeways. Collector streets require 80 feet of ROW and are typically designed to accommodate two lanes of traffic. Collector streets require 80 feet of ROW and are typically designed to accommodate two lanes of traffic. Local Roads. Local roads provide direct access to adjacent property and connect with collectors and arterials. Local roads are typically developed as two lane undivided roadways. Long-term planning is limited to protecting the ability of future developments to extend local roads through existing parcels. Collector streets require 80 feet of ROW and are typically designed to accommodate one lane of traffic in each direction. Alleys. Alleys are narrow roadways providing secondary access to land uses. Generally, alleys provide access to the rear of properties and pass through the middle of a block. Alleys are generally no more than twenty five feet in width because they provide for turning movements into adjacent properties along with allowing vehicles to pass one another. Major Oxnard Corridors Major corridors that impact Oxnard include state highways and freeways, and roadways which serve inter-county and intra-county travel. According to the Ventura County Congestion Management Plan (CMP), the only major CMP corridors that impact Oxnard are State Route (SR) 118 and US-101. Figure 4-2 illustrates Oxnard s major north-south and east-west corridors in Oxnard. SR-118 and US- 101 are major corridors in Oxnard, according to the Ventura County Congestion Management Plan (CMP). April 2006 Background Report Page Oxnard_GP_Public_Facilities_and_Services_2006_04 20 MRD.doc
143 City of Oxnard General Plan Draft Major North-South Travel Corridors. There are eight north-south travel corridors within the City: Harbor Boulevard, Victoria Avenue, Ventura Road, Oxnard Boulevard, Saviers Road, Rose Avenue, Rice Avenue, and Del Norte Boulevard. Major East-West Travel Corridors. There are eight primary east-west travel corridors within the City: Fifth Street, Camino Del Sol, Channel Islands Boulevard, Gonzales Road, Hueneme Road, Pleasant Valley Road, Vineyard Avenue, and Wooley Road. State Highways Parts of five state highways and routes pass through the City of Oxnard. These state highways are described below. Oxnard contains five transportation routes maintained by Caltrans as state facilities. SR-1 - SR-1 (Pacific Coast Highway) is a 656-mile north south route and is a part of the California Scenic Highway System. SR-1 extends from the Los Angeles County line to Santa Barbara County and provides interregional, recreational, commuter and local travel through both rural and urban settings. In relation to Oxnard, SR-1 has a junction with SR-34, SR-232, and US-101. State Route 34 (SR-34) - SR-34 (Fifth Street) is a 13-mile east-west route that starts on the west at the intersection of SR-1 / Oxnard Boulevard and Fifth Street in Oxnard. SR-34 continues to the City of Camarillo and ends at SR-118. According to the 2003 Caltrans District 7 Master System Plan Status, SR-34 will be realigned from Fifth Street to a north-south alignment to SR-1. In relation to Oxnard, SR-34 has a junction with SR-118 and US-101. State Route 118 (SR-118) - SR-118 is a 47-mile east-west route and is a part of the California Scenic Highway System. SR-118 extends from SR- 126, in Ventura, to the Los Angeles County line within Ventura County. SR-118 travels north its last four miles, widening out to four lanes at Vineyard Avenue (SR-232), then crossing the Santa Clara River. In relation to Oxnard, SR-118 has a junction with SR-34 and SR-232. State Route 232 (SR-232) - SR-232 (Vineyard Avenue) is a 4-mile north-south route and extends from SR-1 to SR-118 within Ventura County. SR-232 starts on the west at the intersection of SR-1 / Oxnard Boulevard and Vineyard Avenue. SR-232 continues northeast on Vineyard Avenue, intersects with US-101, and ends at SR-118. According to the 2003 Caltrans District 7 Master System Plan Status, SR-232 will be realigned from Vineyard Avenue to Santa Clara Avenue. In relation to Oxnard, SR-232 has a junction with SR-1, SR-118 and US-101. Page 4-6 Background Report April Oxnard_GP_Public_Facilities_and_Services_2006_04 20 MRD
144 Draft 4. Infrastructure and Community Services Figure 4-2 Major Oxnard Corridors April 2006 Background Report Page Oxnard_GP_Public_Facilities_and_Services_2006_04 20 MRD.doc
145 ARNOLD RD CASPER RD EDISON DR OLDS RD UKIAH ST L ST G ST SNOW AV RICE AV RICE AV 101 FRWY 101 FRWY TELEPHONE RD River HARBOR BL Santa LELAND ST Clara VINEYARD AV ESPLANADE DR VINEYARD AV COLLINS ST AUTO CENTER DR CENTRAL AVE SANTA CLARA AVE H ST 101 FWY NORTH HARBOR BL GONZALES RD VICTORIA AV DORIS AV TEAL CLUB RD EBONY DR PATRICIA ST AZALEA ST VENTURA RD L ST RODERICK AV G ST F ST C ST C ST A ST BAHIA DR THIRD ST GONZALES RD WANKEL WY RIBERA DR LATIGO AV COLONIA RD CAMINO DEL SOL STURGIS RD DEL NORTE BL FIFTH ST K ST FIFTH ST Pacific MANDALAY BEACH RD WOOLEY RD OCEAN DR PIER WK VICTORIA AV WEST RD PORT DR ISLAND VIEW AV KELP ST PATTERSON RD CHANNEL ISLANDS BL NINTH ST N ST J ST GUAVA ST K ST M ST J ST E ST B ST C ST ELM ST PLEASANT VALLEY RD ASH ST OXNARD BL ROSE AV IRIS ST LAUREL ST CHANNEL ISLANDS BL SAVIERS RD CLOYNE ST BARD RD BARD RD CYPRESS RD GARY DR WOOLEY RD EMERSON AV PLEASANT VALLEY RD RICE AV HAILES RD Legend PERKINS RD HUENEME RD Oxnard City Limits South Coast Area Transit (SCAT) City of Oxnard City of Port Hueneme Ocean CASPER RD N W E S Existing Major Traffic Corridors Traffic Corridor Traffic Signals by Agency Caltrans District 7 (37) City of Oxnard (125) City of Port Hueneme (7) Ventura County (8) Source: City of Oxnard, 2005 and URS Corporation, 2006 Figure 4-2 Streets and Highways Miles 0 1 2
146 City of Oxnard General Plan Draft (Back of Figure 4-2) Page 4-8 Background Report April Oxnard_GP_Public_Facilities_and_Services_2006_04 20 MRD.doc
147 Draft 4. Infrastructure and Community Services US Highway 101 (US-101) US-101 is a 1,540-mile north south-route that terminates in Washington State. US-101 extends from the Los Angeles County line to the Santa Barbara County line within Ventura County. US-101 is heavily used by commuters traveling between Ventura, Los Angeles and Santa Barbara Counties and the route experiences heavy seasonal recreational traffic bound for vacation destinations along the coast. Regional activity centers such as Oxnard s Esplanade Shopping Center generate a great deal of localized traffic activity that impacts US Weekend traffic, which has a high recreational component, also results in sporadic traffic congestion for US-101. Locations on US-101 with especially heavy traffic are the stretches between Camarillo and the Santa Clara River Bridge in Oxnard. In relation to Oxnard, US-101 has a junction with SR-1, SR-232 and SR-34. Major Arterials Significant traffic generator routes pass through the City of Oxnard. These arterials are described below. Bard Road Bard Road serves as a secondary arterial from Saviers Road to Pleasant Valley Road. Bard Road provides east-west access to Oxnard s south central and southeast neighborhoods and also serves as a route from the City of Port Hueneme and the Navy s Construction Battalion Center to SR-1. Oxnard provides approximately twenty two major arterials for transportation circulation. C Street C Street functions as a local arterial from Gonzales Road to Bard Road. Although it does not have a cross section consistent with the local arterial standard, C Street functions as one carrying traffic parallel to relatively congested Oxnard Boulevard. Channel Islands Boulevard - From Harbor Boulevard in Oxnard through the City of Port Hueneme to Rice Avenue, Channel Islands Boulevard is primarily a four lane street with limited driveway access in commercial and residential areas. Del Norte Boulevard Del Norte Boulevard provides access to US-101 from the Northeast Industrial Area. Del Norte Boulevard functions as a secondary arterial from US-101 to Sturgis Road and as a local roadway from Sturgis Road south to Fifth Street (SR-34). Emerson Avenue Emerson Avenue is a local arterial that provides access to the Channel Islands Business Center from Rose Avenue and SR-1 via Statham Boulevard. East of Rose Avenue, Emerson Avenue functions as a collector street for the Lemonwood Neighborhood. April 2006 Background Report Page Oxnard_GP_Public_Facilities_and_Services_2006_04 20 MRD.doc
148 City of Oxnard General Plan Draft Fifth Street (SR-34) Fifth Street is the principal east-west street serving the Central Business District of Oxnard and the mid Oxnard region on both the east and west sides of Oxnard. Fifth Street is currently designated SR-34 east of Oxnard Boulevard. Fifth Street functions as a secondary arterial except for the segments from Patterson Road to H Street and Oxnard Boulevard to Rose Avenue, which presently function as primary arterials. Fifth Street provides access to Harbor Boulevard, which is a major route into and out of Oxnard. Gonzales Road - From Victoria Avenue to Rice Avenue in Oxnard, Gonzales Road is a four lane divided primary arterial serving mostly residential and commercial areas. Gonzales Road is also a six lane road at certain locations including east of Entrada. Gonzales Road extends out to Harbor Boulevard into Ventura County. Harbor Boulevard - From the Santa Clara River south to Fifth Street in Oxnard, Harbor Boulevard is a two lane road serving primarily recreational and agricultural uses. South of Fifth Street to Channel Islands Boulevard, Harbor Boulevard is a four lane city street with limited driveway access. The Five Points intersection consists of Oxnard Boulevard, Saviers Road and Wooley Road. H Street/ J Street H and J Street presently function as local arterials from Vineyard Avenue to Channel Islands Boulevard. H and J Streets don t have cross sections consistent with the local arterial standard. Hueneme Road - From Ventura Road in the City of Port Hueneme to J Street in Oxnard, Hueneme Road is a four lane divided roadway. From J Street in Oxnard east to Las Posas Road, Hueneme Road is primarily a two lane road serving light industrial and agricultural areas. Hueneme Road is part of the National Highway System and is a Port of Hueneme access route. Lombard Avenue Lombard Avenue functions as a local arterial serving a portion of the Oxnard Northeast Industrial Area. Oxnard Boulevard (SR-1) Oxnard Boulevard is one of the principal entrances to Oxnard from both the north and south. Oxnard Boulevard is also the principal north south access to the Central Area and continues southerly through the Five Points intersection to southeast commercial and residential areas. Although Oxnard Boulevard s development as a commercial strip is an obstacle, its location in the center of Oxnard has led to its functioning as a primary arterial. Oxnard Boulevard is currently designated as SR-1 and the State of California is responsible for operations and maintenance. Oxnard Boulevard is one of the three major arterials Page 4-10 Background Report April Oxnard_GP_Public_Facilities_and_Services_2006_04 20 MRD.doc
149 Draft 4. Infrastructure and Community Services that create the Five Points Intersection (Oxnard Boulevard/ Saviers Road/ Wooley Road). The City is attempting to expedite the relocation of SR-1 to Rice Avenue prior to Patterson Road Patterson Road is a local arterial which provides access to residential neighborhoods in the northwest and southwest areas of Oxnard. Patterson Road provides access to the Oxnard Airport, the City of Port Hueneme and the U.S. Navy Construction Battalion Center. Pleasant Valley Road - From US-101 in the City of Camarillo south to SR-1 in Oxnard, Pleasant Valley Road is a two lane road serving light industrial and agricultural areas. South of SR-1 to Ventura Road in the City of Port Hueneme, Pleasant Valley Road is a four lane city street serving residential and commercial areas. Rice Avenue - From US-101 south to Fifth Street in Oxnard, Rice Avenue is primarily a six lane city street with limited access serving light industrial areas. South of Fifth Street to SR-1, Rice Avenue is a four lane divided rural highway in Ventura County and extends to Hueneme Road. Rice Avenue is part of the National Highway System and is a Port of Hueneme access route. Rose Avenue - From US-101 south to Pleasant Valley Road, Rose Avenue is primarily a four lane road with six lanes at certain locations. Santa Clara Avenue - From SR-118 to north of US-101 in Oxnard, Santa Clara Avenue is a two lane rural road through agricultural areas. Saviers Road - From Oxnard Boulevard south to Hueneme Road in Oxnard, Saviers Road is a four lane city street serving primarily commercial and residential areas. Saviers Road is one of the three major arterials that create the Five Points Intersection (Oxnard Boulevard/ Saviers Road/ Wooley Road). Ventura Road - From US-101 in Oxnard south to Hueneme Road in the City of Port Hueneme, Ventura Road is a four lane city street with limited driveway access that serves commercial and residential areas. Victoria Avenue - From Olivas Park Drive in the City of Ventura south to Channel Islands Boulevard, Victoria Avenue is a four lane, divided street that serves the agricultural areas north of Wooley Road and the residential and commercial areas south of Wooley Road. Vineyard Avenue (SR-232) - Vineyard Avenue is an important connection between Route 101 and central Oxnard via Oxnard Boulevard. Between Oxnard Boulevard and the Route 101 interchange, Vineyard April 2006 Background Report Page Oxnard_GP_Public_Facilities_and_Services_2006_04 20 MRD.doc
150 City of Oxnard General Plan Draft Avenue is a six lane divided facility. Northeast of Route 101, Vineyard Avenue is a secondary arterial facility. Vineyard Avenue is a principal entrance to Oxnard for westbound traffic on US-101. Wooley Road - In Oxnard from Victoria Avenue east to Rose Avenue, Wooley Road is a divided four lane city street serving residential, commercial areas and light industrial areas. Wooley Road from Harbor Boulevard to Victoria Avenue is a secondary arterial with two to four lanes. Wooley Road also extends out to Rice Avenue with two lanes into Ventura County as a collector west of Harbor Boulevard. Wooley Road is one of the three major arterials that create the Five Points Intersection (Oxnard Boulevard/ Saviers Road/ Wooley Road) Existing Traffic Volumes and Level of Service A Level of Service (LOS) is designated with a letter from A- F, with A assigned to optimal traffic flow. The purpose of Level of Service (LOS) is to determine how much traffic during the rush hour is acceptable on our state freeways, highways and major streets. A LOS measurement makes sure that traffic is measured the same way throughout the City of Oxnard and other regions. To evaluate traffic operating conditions and to provide a basis for comparison of operation conditions, traffic planners use the LOS. LOS is a qualitative measure of traffic flow representing the measurement of several factors, including speed and travel time, traffic interruption, freedom to maneuver, safety, driving comfort and convenience and operating costs. LOS is identified by letter grades ranging from A through F. Table 4-1 illustrates the characteristics associated with the LOS grade for signalized intersections. LOS A represents the best driving conditions, while LOS F represents the worst conditions. LOS A, B and C indicate conditions where traffic moves without significant delays over periods of peak travel demand. LOS D and E are progressively worse peak hour operating conditions and F conditions represent where demand exceeds the capacity of an intersection. Caltrans has planned to relocate SR-1 from Oxnard Boulevard to Rice Avenue by The 2000 Highway Capacity Manual (HCM) contains considerable detail on roadway conditions, including width, terrain and other factors. These factors have been simplified and generalized for planning purposes. LOS for signalized intersections is evaluated based upon average vehicle delay experienced by vehicles entering an intersection. Control delay, or signal delay, includes initial deceleration, queue move up time, stopped delay and final acceleration delay. As delay increases, the LOS decreases. Calculations for signalized and unsignalized intersections are different due to the variation in traffic control. Page 4-12 Background Report April Oxnard_GP_Public_Facilities_and_Services_2006_04 20 MRD.doc
151 Draft 4. Infrastructure and Community Services Table 4-1 Level of Service (LOS) Descriptions for Signalized Intersections Level of Service Description Delay (secs.) A B C D E F Free Flow / Insignificant Delays: No approach phase is fully utilized by traffic and no vehicle waits longer than one red indication. Most vehicles do not stop at all. Progression is extremely favorable and most vehicles arrive during the green phase. Stable Operation / Minimal Delays: An occasional approach phase is fully utilized. Many drivers begin to feel somewhat restricted within a back log of vehicles. This level generally occurs with good progression, short cycle lengths or both. Stable Operation / Acceptable Delays: Major approach phases fully utilized. Most drivers feel somewhat restricted. Higher delays may result from fair progression, longer cycle lengths or both. Individual cycle failures may begin to appear at this level and the number of vehicles stopping is significant. Approaching Unstable / Tolerable Delays: The influence of congestion becomes more noticeable. Drivers may have to wait through more than one red signal indication. Longer delays may result from some combination of unfavorable progression, long cycle lengths or high v/c ratios. The proportion of vehicles not stopping declines and individual cycle failures are noticeable. Unstable Operation / Significant Delays: Volume at or near capacity. Vehicles may wait through several signal cycles. Long queues form upstream from intersection. These high delay values generally indicate poor progression, long cycle lengths and high v/c rations. Individual cycle failures are a frequent occurrence. Forced Flow / Excessive Delays: Represents stopped conditions. Queues may block upstream intersections. This level occurs when arrival flow rates exceed intersection capacity and are considered to be unacceptable to most drivers. Poor progression, long cycle lengths and v/c ratios approaching 1.0 may contribute to these high delay levels. < > 80.0 Source: Transportation Research Board, Highway Capacity Manual, 2000 Comment: Delay in seconds is illustrated with decimal place values because of accuracy For a general understanding of the traffic delay, the decimal places can be removed. For example, would become In general, a deficient LOS in a City would increase congestion and reduce the mobility of residents by use of transit, private automobile, passenger railroad, etc. This decrease in mobility could have fluctuating impacts on City business and revenue generation, especially if goods movement from the Port of Hueneme were impacted as to be a decreased economic resource for Oxnard. Also, a City s deficient LOS does not assist in an emergency situation, such as fire departments, medical response teams and general citywide evacuation for any reason. In the 2020 General Plan, the acceptable LOS for Oxnard intersections was grade C or better. A LOS of a grade C or better is still considered acceptable for the 2030 General Plan horizon year. April 2006 Background Report Page Oxnard_GP_Public_Facilities_and_Services_2006_04 20 MRD.doc
152 City of Oxnard General Plan Draft Existing Conditions SR-1 (Oxnard Boulevard): SR-1 on Oxnard Boulevard is two lanes in each direction and carries a large volume of truck traffic from the Port of Hueneme, the fourth busiest ocean port in the State of California. This portion of SR-1 (Oxnard Boulevard) traveling through Oxnard is heavily congested and operates at Level of Service F. To improve Port of Hueneme access and divert heavy truck traffic from the Oxnard central business district, SR-1 is planned to be relocated from Oxnard Boulevard to Rice Avenue as soon as the Rice and101 Interchange is reconstructed, most likely by In 2005, Oxnard greatly expanded the number of intersections included in data collection for a more comprehensive development of the traffic model. SR-118: On westbound SR-118, traffic volume increases approaching the Cities of Oxnard and Ventura, with 37,000 Average Daily Trips (ADT) using the bridge over the Santa Clara River. SR-118 has been subjected to heavy truck use due to trucks bypassing the congestion, steep grade and weighing station on US-101. According to the Ventura County CMP, 16 percent of the total volume of vehicles on SR-118 is truck traffic. This volume of trucks creates severe congestion, noise, and safety impacts on the two lane segment in Oxnard. US-101: US-101 experiences heavy daily traffic with volumes ranging from 133,000 to 199,000 ADT, with about 5 percent of this volume consisting of truck traffic, according to the Ventura County CMP. About 46 percent of daily truck traffic from the Port of Hueneme, approximately 300 truck trips per day, use US-101 to travel between the Port of Hueneme and the Los Angeles area. The amount of truck traffic from the Port of Hueneme is expected to increase as Port of Hueneme operations are expected to continue to expand. Based on traffic counts taken in 2005 including turning movement counts, often referred to as AM PM Peak counts, and 24 hour counts, often referred to as Average Daily Trip (ADT) counts, the LOS for Oxnard intersections were calculated. Table 4-2 illustrates the LOS for AM and PM peak periods in Oxnard. The Highway Capacity Manual by the Transportation Research Board calculates a signalized and non signalized intersection differently based on the differences in the amount of queue time and the characteristics of the intersection. For example, there is a difference in the amount of time a driver is required to wait at a red light at a signalized intersection as compared with a driver without that particular wait at an unsignlaized intersection. Unsignalized intersections do not use a v/ c ratio, but rather an amount of time measured in seconds for the LOS analysis. Page 4-14 Background Report April Oxnard_GP_Public_Facilities_and_Services_2006_04 20 MRD
153 Draft 4. Infrastructure and Community Services Table 4-2 AM and PM Peak Intersection Level of Service Intersection AM Peak PM Peak V / C LOS V / C LOS 1 C Street and Third Street A A 2 C Street and Fifth Street A E 3 C Street and Channel Islands A C 4 C Street and Gonzales C F 5 C Street and Pleasant Valley A A 6 Del Norte and Camino Del Sol A A 7 Del Norte and SR NB ** 21.9 sec C C 8 Del Norte and SR SB 50.5 sec F C 9 Del Norte and SR-34 ** 34.1 sec D F 10 Del Norte and Sturgis A A 11 H Street and Gonzales C E 12 H Street and Vineyard A A 13 Harbor and Fifth Street F B 14 Harbor and Channel Islands A A 15 Harbor and Gonzales E D 16 Harbor and Olivas Park A B 17 Harbor and Wooley A A 18 J Street and Channel Islands A B 19 J Street and Hueneme ** 1.2 sec B C 20 J Street and Pleasant Valley A A 21 Lombard and Gonzales D A 22 Oxnard - Saviers - Wooley 23 Oxnard and SR NB 24 Oxnard and SR SB 25 Pacific and Wooley A A 26 Patterson and Gonzales B C 27 Patterson and Doris ** 7.2 sec B B 28 Patterson and Teal Club ** 5.6 sec B B 29 Patterson and Fifth Street B C 30 Patterson and Hemlock ** 13.2 sec B B 31 Patterson and Wooley A A 32 Pleasant Valley and Bard C B 33 Rice and Channel Islands A C 34 Rice and Hueneme A A 35 Rice and SR B D 36 Rice and Wooley A B 37 Rose and Third Street A D 38 Rose and Auto Center A D 39 Rose and Bard B A 40 Rose and Camino Del Sol C E 41 Rose and Channel Islands C D 42 Rose and Emerson A A 43 Rose and Pleasant Valley A C 44 Rose and SR A D 45 Rose and SR B E 46 Rose and Wooley A D April 2006 Background Report Page Oxnard_GP_Public_Facilities_and_Services_2006_04 20 MRD.doc
154 City of Oxnard General Plan Draft Table 4-2 AM and PM Peak Intersection Level of Service (Continued) AM Peak PM Peak Intersection V / C LOS V / C LOS 47 Santa Clara and Auto Center B D 48 Santa Clara and Central ** 21.8 sec C F 49 Saviers and Channel Islands C C 50 Saviers and Hueneme A A 51 Saviers and Pleasant Valley Road B C 52 SR-1 and Second Street A B 53 SR-1 and Fifth Street A C 54 SR-1 and Channel Islands ** 1.5 sec B B 55 SR-1 and Colonia A C 56 SR-1 and Cooper A B 57 SR-1 and Esplanade ** 0.2 sec A B 58 SR-1 and Pleasant Valley B E 59 SR-1 and Vineyard D D 60 SR-1 and Wooley 61 Statham and Channel Islands A C 62 Ventura and Vineyard A A 63 Ventura and Gonzales F B 64 Ventura and Doris A B 65 Ventura and Second Street/Teal Club Road A A 66 Ventura and Channel Islands D E 67 Ventura and Fifth Street A B 68 Ventura and Hemlock A A 69 Ventura and Hueneme A A 70 Ventura and Pleasant Valley B A 71 Ventura and Wooley B C 72 Victoria and Channel Islands A B 73 Victoria and Hemlock A A 74 Victoria and Wooley E B 75 Victoria and Olivas Park C C 76 Victoria and Gonzales F A 77 Victoria and Doris D D 78 Victoria and Teal Club ** 0.9 Sec F F 79 Victoria and Fifth Street A B 80 Vineyard (SR-232) and Esplanade B D 81 Vineyard (SR-232) and Myrtle/Ventura Boulevard A E 82 Vineyard (SR-232) and SR-101 NB A B 83 Vineyard (SR-232) and SR-101 SB C C 84 Vineyard and SR F F Note: ** = unsignalized intersection, v/c = volume / capacity ratio, Signalized intersection LOS calculated differently than the signalized intersection based on standardized rates Source: URS Corporation, 2005 Page 4-16 Background Report April Oxnard_GP_Public_Facilities_and_Services_2006_04 20 MRD.doc
155 Draft 4. Infrastructure and Community Services Most Deficient Intersections After traffic counts were conducted in 2005, six intersections had a deficient LOS in the AM and PM peak periods. These intersections include: Fifth Street and Del Norte Harbor Boulevard and Gonzales SR-1 (Oxnard Boulevard)/ Saviers Road and Wooley Road (Five Points) Victoria Avenue and Doris Avenue Victoria Avenue and Teal Club Drive SR-232 (Vineyard Avenue) and SR-1 (Oxnard Boulevard) Critical AM After traffic counts were conducted in 2005, five intersections had a deficient LOS in the AM peak period. These intersections include: Harbor Boulevard and Fifth Street Lombard Street and Gonzales Road Ventura Road and Gonzales Road Victoria Avenue and Gonzales Road US-101 and Del Norte Boulevard Critical PM Intersections After traffic counts were conducted in 2005, fourteen intersections had a deficient LOS in the PM peak period (See Figure 4-3). These intersections include: C Street and Gonzales Road H Street and Gonzales Road Rice Avenue and Fifth Street Rose Avenue and Third Street Rose Avenue and Auto Center Drive Rose Avenue and Camino Del Sol Rose Avenue and Channel Islands Boulevard Santa Clara Avenue and Auto Center Drive Santa Clara Avenue and Central Avenue SR-1 (Oxnard Boulevard) and Pleasant Valley Road April 2006 Background Report Page Oxnard_GP_Public_Facilities_and_Services_2006_04 20 MRD.doc
156 City of Oxnard General Plan Draft SR-232 (Vineyard Avenue) and Myrtle Street Rose Avenue and Fifth Street Rose Avenue and SR-1 (Oxnard Boulevard) Rose Avenue and Wooley Road Truck and Goods Movement Freight is moved within and in/out of Oxnard both by rail and commercial vehicles. The goods movement function is essential for Oxnard and the continued economic development of the city and the region. Freight Rail Railroads have the potential to reduce road congestion when goods are shipped by train rather than trucks. However, trains on at-grade rail lines stop traffic during peak commuting periods causing significant congestion and air pollution from vehicles that idle. One way to reduce traffic congestion and improve safety for pedestrians and drivers is to separate the vehicles from trains with grade separations. Grade separations are usually bridges over railroad tracks that are referred to as flyovers. The primary rail lines are described in the following paragraphs. Union Pacific Railroad. The Union Pacific Railroad (UPRR) Coast Main Line is the only intercity freight rail provider. The railroad connects the City of Oxnard to all major west coast destinations and markets. The freight terminal facilities provide for the delivery of products, goods, and raw materials out of Oxnard. The Santa Paula Branch Line is owned and operated by the Ventura County Transportation Commission (VCTC). Due to UPRR grade crossings, the flow of vehicle traffic can be significantly delayed in Oxnard. Traffic is interrupted by rail movements and by the proximity of the rail crossings to major intersections along Oxnard Boulevard and Fifth Street. The UPRR ROW also creates a physical barrier across Oxnard. UPRR freight service levels are approximately eight through freight trains plus local service daily and this level is expected to continue or increase. Santa Paula Branch Line. Although primarily a passenger rail line, the Santa Paula Branch currently has limited freight service. When the branch line is reconnected to Santa Clarita, there may be an increase in east-west freight movements to and from the Port of Hueneme. Service to the Branch Line is based at the UPRR yard in Oxnard. Page 4-18 Background Report April Oxnard_GP_Public_Facilities_and_Services_2006_04 20 MRD.doc
157 Draft 4. Infrastructure and Community Services Figure 4-3 LOS Critical Intersections April 2006 Background Report Page Oxnard_GP_Public_Facilities_and_Services_2006_04 20 MRD.doc
158 TELEPHONE RD ARNOLD RD CASPER RD EDISON DR OLDS RD UKIAH ST L ST G ST SNOW AV RICE AV RICE AV 101 FRWY 101 FRWY CENTRAL AVE HARBOR BL LELAND ST VINEYARD AV VINEYARD AV ESPLANADE DR COLLINS ST AUTO CENTER DR SANTA CLARA AVE H ST 101 FWY NORTH HARBOR BL GONZALES RD VICTORIA AV DORIS AV EBONY DR TEAL CLUB RD PATRICIA ST AZALEA ST VENTURA RD L ST RODERICK AV G ST F ST C ST C ST A ST BAHIA DR THIRD ST GONZALES RD ROSE AV WANKEL WY RIBERA DR LATIGO AV COLONIA RD CAMINO DEL SOL STURGIS RD DEL NORTE BL FIFTH ST K ST FIFTH ST Pacific MANDALAY BEACH RD WOOLEY RD OCEAN DR VICTORIA AV WEST RD PORT DR ISLAND VIEW AV KELP ST PATTERSON RD CHANNEL ISLANDS BL NINTH ST N ST J ST GUAVA ST K ST M ST J ST E ST B ST C ST ELM ST PLEASANT VALLEY RD ASH ST OXNARD BL IRIS ST LAUREL ST CHANNEL ISLANDS BL SAVIERS RD CLOYNE ST BARD RD BARD RD CYPRESS RD GARY DR WOOLEY RD EMERSON AV PLEASANT VALLEY RD RICE AV HAILES RD PERKINS RD HUENEME RD Ocean Legend CASPER RD Oxnard City Limits N W E S Source: URS Corporation, Intersections with LOS of D-E-F in both AM and PM Intersections with Highest Deficiencies Intersections with LOS of D-E-F in AM or PM Oxnard Intersections with Traffic Signal Deficiencies in AM Oxnard Intersections with Traffic Signal Deficiencies in PM Figure 4-3 Level of Service (LOS) Miles 0 1 2
159 City of Oxnard General Plan Draft (Back of Figure 4-3) Page 4-20 Background Report April Oxnard_GP_Public_Facilities_and_Services_2006_04 20 MRD.doc
160 Draft 4. Infrastructure and Community Services Ventura County Railway (VCRR). The Ventura County Railway (VCRR) line, operated by the Ventura County Railroad Company (Rail America), transfers freight from the Port of Hueneme and connects with the UPRR Coast Main Line in downtown Oxnard. It is particularly important to customers of the Port of Hueneme as well as the U.S. Navy Construction Battalion Center. The VCRR interrupts traffic movement along Wooley Road and at other locations, especially at the Five Points intersection. Due to the type of equipment and operating standards, the Ventura County Railway has less impact on Oxnard than UPRR. The Ventura County Railway alignments have potential for adding passenger service as well as increasing freight use along this route. Port of Hueneme Ventura County has an important center for freight activity that impacts the City of Oxnard substantially and the City of Port Hueneme. The Port of Hueneme is served by both local roads and a railroad that connects to the Union Pacific Coast Main Line. The Port of Hueneme has seen a large increase in activity. Because of this, the Port of Hueneme has made significant improvements to its facilities and expanded its capacity to meet its growing needs. The Port of Hueneme cannot continue to expand at the current rate without significant regional road improvements, often referred to as landside improvements. The Port of Hueneme currently has two primary access routes for the port including Rice Avenue/ Hueneme Road and Victoria Avenue. Victoria Avenue s bridge over the Santa Clara River has been widened to reduce the impacts of a major bottleneck. The Port of Hueneme Intermodal Corridor project is the reconstruction of the SR-1/ Rice Avenue/ Pleasant Valley Road interchange that was built in conjunction with the Rice Avenue extension to Hueneme Road. The City of Oxnard is designing the reconstruction of the Rice Avenue/ US-101 interchange which will complete the link from the Port of Hueneme to US-101, the major route connecting the City of Oxnard to adjoining regions. Trucks Goods movement is an integral part of the circulation system in the City of Oxnard. Large trucks are the operational equivalent of five passenger cars in traffic. These commercial vehicles cause more extensive damage to road surfaces than the average automobile. While large trucks are necessary for the delivery of agricultural goods, products and materials, the size and weight of the commercial vehicle often leads to this excessive wear on roadways and traffic congestion. Commercial vehicle volumes continue to increase, causing delays for passenger vehicles, pavement failures, damaged goods due to congestion and diminished air quality. Approximately 300 truck trips per day (46% of the daily truck traffic from the Port of Hueneme) use US-101 to travel between the Port of Hueneme and the Los Angeles area. April 2006 Background Report Page Oxnard_GP_Public_Facilities_and_Services_2006_04 20 MRD.doc
161 City of Oxnard General Plan Draft There has been a shift in goods movement from the largest proportion of commodities being shipped via rail, to the largest proportion of commodities being shipped by the trucking industry. Some of the factors involved in this shift include the deregulation of both the rail and shipping industry, the completion of major highway networks and the flexibility and speed of truck operations. The establishment of truck routes is one method of addressing the damage to roadways, even though truck routes can be ignored by commercial vehicle drivers. Specific roadways have been designated as truck routes within the City of Oxnard. These roadways are generally arterial streets with few or no adjacent residential properties. These routes were selected to minimize the noise and vibration impacts. Two key components of the truck route system are the two primary routes serving the Port of Hueneme. The designated western access route is Victoria Avenue while Hueneme Road and Rice Avenue form the eastern access route. Given the volume of truck traffic generated by the Port of Hueneme, the improvement of these two access routes is critical to the success of the overall truck route system. Figure 4-4 presents the primary commercial vehicle routes within the City of Oxnard Passenger Rail Passenger rail provides a way for people to get to work, school, and other destinations. Passenger rail services in Oxnard are provided by Metrolink and Amtrak rail services. The inter-city and inter-regional rail passenger services are provided both between Oxnard and many of the cities in Ventura County and areas outside Ventura County. The Coast Starlight and the Pacific Surfliner are the two passenger rail services provided by Amtrak for Oxnard. Amtrak. There are two Amtrak services for the City of Oxnard. The Coast Starlight provides a daily long distance train from San Diego to Seattle with north and southbound stops at Simi Valley and Oxnard, in Vuntura County. The Pacific Surfliner Route connects Ventura County to San Diego, Los Angeles, Santa Barbara, and San Luis Obispo. The SE Amtrak trains stop at Simi Valley, Moorpark, Camarillo, Oxnard, and Ventura. Amtrak Surfliner operates eight trains seven days per week, with three of the round trips currently traveling as far north as San Luis Obispo. Amtrak shares the rail stations in Ventura County with Metrolink commuter train service weekdays. In places where Amtrak cannot run because a gap in train service exists or on trips where Amtrak doesn t have enough ridership to operate a train, there is Amtrak Bus Service to provide connections for rail service. Page 4-22 Background Report April Oxnard_GP_Public_Facilities_and_Services_2006_04 20 MRD.doc
162 Draft 4. Infrastructure and Community Services Figure 4-4 Goods Movement April 2006 Background Report Page Oxnard_GP_Public_Facilities_and_Services_2006_04 20 MRD.doc
163 ARNOLD RD CASPER RD EDISON DR OLDS RD UKIAH ST L ST G ST SNOW AV RICE AV RICE AV 101 FRWY 101 FRWY TELEPHONE RD River HARBOR BL Pacific HARBOR BL MANDALAY BEACH RD Santa GONZALES RD WOOLEY RD OCEAN DR Legend VICTORIA AV VICTORIA AV DORIS AV TEAL CLUB RD FIFTH ST WEST RD PORT DR ISLAND VIEW AV KELP ST PATTERSON RD º R EBONY DR LELAND ST CHANNEL ISLANDS BL R PATRICIA ST Clara AZALEA ST VENTURA RD NINTH ST N ST VINEYARD AV L ST K ST M ST J ST H ST RODERICK AV G ST K ST J ST F ST ESPLANADE DR E ST C ST C ST C ST B ST A ST ELM ST SAVIERS RD BARD RD PLEASANT VALLEY RD PERKINS RD IRIS ST º º BAHIA DR COLONIA RD ASH ST THIRD ST CYPRESS RD OXNARD BL LAUREL ST CLOYNE ST HUENEME RD VINEYARD AV COLLINS ST ROSE AV BARD RD AUTO CENTER DR 101 FWY NORTH GONZALES RD WANKEL WY RIBERA DR WOOLEY RD EMERSON AV CHANNEL ISLANDS BL GARY DR PLEASANT VALLEY RD LATIGO AV CAMINO DEL SOL RICE AV CENTRAL AVE STURGIS RD SANTA CLARA AVE º º º º º º¼ º º º º º º º º ºº º Port of H ueneme R R R R R R R R R R R R R º R R R R R R R R R R R R R R º º º º R R R R R R R R R R R R R R R R R R º R º R R R R R R R R R 101 FIFTH ST R R DEL NORTE BL R R R 1 R HAILES RD Oxnard City Limits City of Port Hueneme Ocean CASPER RD City of Oxnard Commercial Vehicle Routes Truck Route City of Port Hueneme Commercial Vehicle Routes Truck Route W N S E Freight Railroad Union Pacific Railroad Ventura County Railway R R Railroad Crossing Figure 4-4 Goods Movement Source: City of Oxnard, 2005 and City of Port Hueneme, 2006 Miles 0 1 2
164 City of Oxnard General Plan Draft Page 4-24 Background Report April Oxnard_GP_Public_Facilities_and_Services_2006_04 20 MRD.doc
165 Draft 4. Infrastructure and Community Services Metrolink. The Counties of Ventura, Los Angeles, Orange, Riverside, and San Bernardino joined to create the Southern California Regional Rail Authority (SCRRA) or Metrolink commuter rail system. Metrolink currently operates service from the Oxnard Transportation Center (OTC) east to Los Angeles. Oxnard is served by three eastbound trains in the morning and three westbound trains in the early evening. Metrolink schedules are geared to commuters, but the service is available for other intercity travelers. There is interest in extending commuter service to Santa Barbara. California High Speed Rail Authority. The California High Speed Rail Authority is a new California State agency, to develop a high speed train system for California. California has identified that a high speed train system is feasible and the basic design, cost, and routing options are available. One of the routing options is through Ventura County, which would enable residents of the City of Oxnard to travel to Northern and Southern California. The high speed train system is estimated to carry thirty two million intercity passengers and ten million commuters by Transit Services The City of Oxnard has public transportation transfer centers where passengers can make convenient transfers between local bus lines and also between commuter buses or trains. These transit centers include the OTC that provides transfers between South Coast Area Transit (SCAT), Metrolink, Amtrak and VISTA along with the C Street Transfer Center at the Centerpoint Mall in Oxnard. There are also a number of locations where VISTA meets local transit services, although there is no large passenger facility or parking. VISTA centers include Oxnard s Esplanade Shopping Center that provides connections between VISTA and SCAT in northern Oxnard. The County of Ventura offers smart card technology for those utilizing public transportation called Go Ventura. This service utilizes an electronic fare card allowing transit patrons to purchase fares and monthly passes prior to boarding a bus. When riders enter a bus they tap their smart card on the card reader located near the fare box. The reader system will instruct the bus driver whether or not the fare card is a valid monthly pass or deduct the appropriate fare for that operator from the account electronically. The card reader will also tell the rider the current cash balance on their card and warns them when the balance is low. Public Transit Public transit provides transportation for local shopping, work, school and recreational activities. Public transit is provided by fixed route buses or general public Dial a Ride (DAR) services. DAR service is typically within a April 2006 Background Report Page Oxnard_GP_Public_Facilities_and_Services_2006_04 20 MRD.doc
166 City of Oxnard General Plan Draft city or urban area and is characterized by short rides and frequent stops. Table 4-3 illustrates the public transportation ridership growth for Oxnard between 2000 and Oxnard s public transportation network is presented on Figure 4-5. Table 4-3 Ridership Growth in Oxnard Public Transportation Oxnard Service % Growth Metrolink*** 464,100* 485,888* 4.7 Oxnard Harbor and Beaches Dial-A- Ride 4,250 12, SCAT* 3,687,762 3,372, SCAT ACCESS 46,898* 108,024* 130 Notes: *Total SCAT ridership for Ventura County; ***Ventura County percentage of total Metrolink ridership Source: Ventura County Congestion Management Plan, 2005 SCAT is the largest public transit service in Ventura County. South Coast Area Transit. The cities of Ojai, Oxnard, Port Hueneme, Santa Paula and San Buenaventura along with Ventura County formed SCAT to provide bus service within and between their communities. SCAT serves the cities of Ojai, Oxnard, Port Hueneme, and Ventura, as well as the unincorporated areas around those cities, including the El Rio/ Nyland Acres area. SCAT buses connect with VISTA, Metrolink, Amtrak, Greyhound, and the Oxnard Harbor and Beaches DAR and the OTC. SCAT's services carry approximately 3.4 million passengers a year operating with 43 buses in its fleet, according to the Ventura County CMP. SCAT operates seven days a week with 14 different routes as presented on Figure 4-5. SCAT buses are able to transport bicycles by means of racks mounted on the front of the bus. No storage space is available on board for bicycles, surfboards, skateboards or luggage. All SCAT busses are fully accessible with wheelchair lifts and kneeling features. Oxnard Harbors and Beaches Dial a Ride (DAR). Although inside the SCAT service area, the City of Oxnard, the City of Port Hueneme, and Ventura County jointly operate the Oxnard Harbors and Beaches DAR serving the Channel Islands Harbor area, portions of Port Hueneme, unincorporated beach communities near Oxnard, the Oxnard Airport, C Street Transfer Center, and the OTC. The Oxnard Harbors and Beaches DAR provides circulation within the beach communities and serves as a feeder service to SCAT and Amtrak. The Oxnard Harbors and Beaches DAR service operates Monday through Saturday and carries approximately 12,000 passengers per year, according to the Ventura County CMP. Page 4-26 Background Report April Oxnard_GP_Public_Facilities_and_Services_2006_04 20 MRD
167 Draft 4. Infrastructure and Community Services Figure 4-5 Public Transportation April 2006 Background Report Page Oxnard_GP_Public_Facilities_and_Services_2006_04 20 MRD.doc
168 HARBOR BL ARNOLD RD CASPER RD EDISON DR OLDS RD UKIAH ST L ST SNOW AV RICE AV RICE AV 101 FRWY 101 River CENTRAL AVE Santa Clara VINEYARD AV VINEYARD AV AUTO CENTER DR SANTA CLARA AVE HARBOR BL GONZALES RD VICTORIA AV DORIS AV TEAL CLUB RD PATRICIA ST VENTURA RD L ST H ST G ST F ST C ST C ST BAHIA DR THIRD ST GONZALES RD WANKEL WY RIBERA DR LATIGO AV COLONIA RD CAMINO DEL SOL STURGIS RD DEL NORTE BL 101 FIFTH ST K ST FIFTH ST Pacific Legend MANDALAY BEACH RD WOOLEY RD OCEAN DR Oxnard City Limits South Coast Area Transit (SCAT) Route 1A/B Route 2 Route 3 Route 4A/B Route 5 Route 6A Route 6B Route 7 Route 8 Route 9 Route 15 Route 18A Route 18B Transfer Points ACCESS Paratransit (SCAT- Citywide Service) PIER WK WEST RD Oxnard Harbors and Beaches Dial-A-Ride CHANNEL ISLANDS BL Portof H ueneme US-101/ Conejo Connection (to Los Angeles) California State University Channel Islands (CSUCI) VICTORIA AV ISLAND VIEW AV Dial-A-Ride & ACCESS Service Areas Ventura Intercity Service Transit Authority (VISTA) PORT DR KELP ST PATTERSON RD NINTH ST N ST GUAVA ST M ST J ST E ST C ST BARD RD PLEASANT VALLEY RD PERKINS RD B ST IRIS ST ELM ST SAVIERS RD ASH ST Passenger Railroad Amtrak/ Metrolink Amtrak/ Metrolink OXNARD BL LAUREL ST Park and Ride Locations Oxnard Unofficial Park & Ride Location Source: City of Oxnard, 2005 and Oxnard Harbors and Beaches Dial a Ride, 2005, (SCAT) System Map, 2006 K ST CHANNEL ISLANDS BL CLOYNE ST CYPRESS RD HUENEME RD Ocean ROSE AV PLEASANT VALLEY RD WOOLEY RD EMERSON AV W N S E RICE AV Oxnard Transportation Center (OTC) CASPER RD 1 HAILES RD Figure 4-5 Public Transportation Miles 0 1 2
169 City of Oxnard General Plan Draft Back of Figure 4-5 Public Transportation Page 4-28 Background Report April Oxnard_GP_Public_Facilities_and_Services_2006_04 20 MRD.doc
170 Draft 4. Infrastructure and Community Services Inter-City Express Service. Inter-city express service provides a way for people to get to work, school, and other destinations. Inter-city service is typically provided by vehicles designed for long distance travel with limited stops. The express services are provided both between cities and urban areas in Oxnard and Ventura County and to adjacent communities. VISTA. VISTA connects all municipal transit operators in Ventura County and makes it possible for people to travel by bus throughout Ventura County. VISTA service primarily operates on the freeway corridors and stops are limited to transit stations, transfer points, colleges, and major employment centers. VISTA operates six days a week on the VISTA US- 101 route between Ventura, Oxnard, Camarillo, and Thousand Oaks. VISTA operates twenty peak hour buses throughout Ventura County. In 2004, VISTA carried almost 600,000 passengers, according to the Ventura County CMP. Conejo Connection. The Conejo Connection is a commuter service between Oxnard and Los Angeles County and provides two peak hour round trips per weekday between Los Angeles and the OTC. Para Transit Services Paratransit service provides local curb to curb or door to door service for people who are unable to use fixed route bus service. Paratransit is an important link to mobility within the county and is required to parallel all fixed route local transit services. Para transit service is not usually considered a congestion management tool. SCAT is the only public transportation service for Oxnard that experienced a decrease in ridership from 2000 to ACCESS. SCAT ACCESS provides curb to curb service to Americans with Disabilities Act (ADA) certified riders and seniors throughout all of the SCAT service area. SCAT ACCESS operates 20 vehicles, seven days a week, and connects with Camarillo and Santa Paula DAR as well as Thousand Oaks Transit DAR services. In 2004, ACCESS annual ridership was 110,000, according to the Ventura County CMP. Private Bus Operators Greyhound. Greyhound offers bus service in the City of Oxnard. Greyhound makes stops in all major adjacent cities and also serves inter regional travel as well. Besides Greyhound, other recreational tour busses operate in the region, but these are not scheduled nor intended to serve inter community travel needs. Transportes Intercalifornias. Transportes Intercalifornias provides trips to Los Angeles, Santa Ana, and Mexico. The use of Transportation Demand Management (TDM) to encourage alternative forms of transportation programs has the potential to lessen the use of the private automobile. Ventura County Airporter. The Ventura County Airporter provides trips to LAX. A number of other private shuttle operators provide regular van April 2006 Background Report Page Oxnard_GP_Public_Facilities_and_Services_2006_04 20 MRD
171 City of Oxnard General Plan Draft service to the Los Angeles International Airport (LAX) and Burbank Airport, since these airports are used heavily by residents of Oxnard Non Motorized Transportation Transportation Demand Management (TDM) is a series of programs that promote alternatives to driving a private automobile. TDM includes carpools, vanpools, transit, bicycles, and park and ride lot programs. TDMs are aimed at requiring major traffic generators to provide information to drivers and make alternative forms of transportation available to employees and/ or customers. The private automobile will continue to be a vital part of Oxnard s transportation system along with the rest of Southern California. However, the use of alternative forms of transportation programs has the potential to lessen the use of the automobile at peak periods. Figure 4-6 illustrates the primary nonmotorized transportation routes within the City of Oxnard. Pedestrian Routes Pedestrian travel constitutes a very small portion of total urban travel for the City of Oxnard. Providing sidewalks and paths becomes more relevant as the population increases. Oxnard provides pedestrian facilities within and between residential neighborhoods along with commercial and industrial areas. Pedestrian facilities are especially important in those parts of Oxnard where sidewalks are not currently provided, including Oxnard Boulevard, Pleasant Valley Road and Vineyard Avenue. Bicycling As an alternative to the automobile, bicycles are non polluting, quiet, inexpensive, and a reasonably available source of transportation. The combination of the bicycle s advantages and the public increased interest in physical fitness has made the bicycle a much larger part of the transportation system than previously. Bicycles can be used for many short commuting trips and for recreational purposes. The City of Oxnard s level terrain and moderate weather, particularly on the coastal plain, are great for walking and bicycling. There are limited commuter bicycle lanes in Ventura County as a whole. The Santa Clara River Bridge on US-101 has a new Class I bicycle and pedestrian path for the City of Oxnard. The descriptions below illustrate the three classes of bikeway facilities standards and designations established by the California Department of Transportation (Caltrans). Bike Path (Class I) Class I bike paths are separated from roadways by distance or barriers and cross traffic by automobiles is minimized. Bike paths are facilities completely separated from the roadway and expressly for bicyclists. Bike paths can provide recreational opportunities or serve as desirable commuter routes. Design standards require two way bicycle Page 4-30 Background Report April Oxnard_GP_Public_Facilities_and_Services_2006_04 20 MRD
172 Draft 4. Infrastructure and Community Services Figure 4-6 Non-motorized Transportation April 2006 Background Report Page Oxnard_GP_Public_Facilities_and_Services_2006_04 20 MRD.doc
173 ARNOLD RD CASPER RD EDISON DR OLDS RD UKIAH ST L ST G ST SNOW AV RICE AV RICE AV Del 101 FRWY 101 FRWY TELEPHONE RD River HARBOR BL Santa LELAND ST Clara VINEYARD AV ESPLANADE DR VINEYARD AV COLLINS ST AUTO CENTER DR CENTRAL AVE SANTA CLARA AVE H ST 101 FWY NORTH HARBOR BL GONZALES RD VICTORIA AV DORIS AV TEAL CLUB RD EBONY DR PATRICIA ST AZALEA ST VENTURA RD L ST RODERICK AV G ST F ST C ST C ST A ST BAHIA DR THIRD ST GONZALES RD WANKEL WY RIBERA DR LATIGO AV COLONIA RD CAMINO DEL SOL STURGIS RD DEL NORTE BL FIFTH ST K ST FIFTH ST Pacific MANDALAY BEACH RD WOOLEY RD OCEAN DR PIER WK VICTORIA AV WEST RD PORT DR ISLAND VIEW AV KELP ST PATTERSON RD CHANNEL ISLANDS BL NINTH ST N ST J ST GUAVA ST K ST M ST J ST E ST B ST C ST ELM ST PLEASANT VALLEY RD ASH ST OXNARD BL ROSE AV IRIS ST LAUREL ST CHANNEL ISLANDS BL SAVIERS RD CLOYNE ST BARD RD BARD RD CYPRESS RD GARY DR WOOLEY RD EMERSON AV PLEASANT VALLEY RD RICE AV HAILES RD PERKINS RD HUENEME RD Legend Ocean CASPER RD Oxnard City Limits City of Port Hueneme N W E S Bicycle and Pedestrian Routes Bicycle and Pedestrian Route Bicycle Route Pacific Coast Bikeway Route Source: City of Oxnard Bicycle and Pedestrian Master Plan, 2002 Figure 4-6 Non Motorized Transportation Miles 0 1 2
174 City of Oxnard General Plan Draft Back of Figure 4-6 Non-motorized Transportation Page 4-32 Background Report April Oxnard_GP_Public_Facilities_and_Services_2006_04 20 MRD.doc
175 Draft 4. Infrastructure and Community Services paths to be a minimum of eight feet wide plus shoulders. Bike paths are usually shared with pedestrians. If pedestrian use is expected to be significant on the bike path, the desirable width is twelve feet. Bike Lane (Class II) A Class II bikeway is a lane on a road way that is reserved for bicycles. The lane is signed and painted with pavement lines and markings. The lane markings decrease the potential for conflicts between drivers and bicyclists. Bike lanes are one way, with a lane on each side of the roadway between the travel lane and the edge of paving. If parking is permitted, bike lanes are between the travel lane and the parking lane. The bike lanes are at least four feet wide and five feet if parking is permitted. Bike Route (Class III) Class III bike routes share existing roadways and provide continuity to other bikeways or designated preferred routes through high traffic areas. There is no separate lane for bike routes. Bike routes provide for limited pedestrian and driver use for the exclusive use of bicyclists. Bike routes are established by placing signs that direct bicyclists and warn drivers of the presence of bicyclists. Since bicyclists are permitted on all roadways, the decision to sign a road as a bike route is based on factors including the advisability of encouraging bicycle travel on the route, the need to meet bicycle demand and the desire to connect discontinuous segments of bike routes. Oxnard is served by approximately fifteen miles of designated bike paths, lanes and routes. There are gaps in the bike path network which must be completed to facilitate bicycle travel. The bicycle system provides facilities to serve all types of bicycle trips including work, school, recreational, physical training and sport. All of Oxnard s future bicycle route facilities will be provided along public ROW. Future bicycle facilities may be available for the Doris Avenue Drain, Ventura County Railroad, the Santa Clara River levee, UPRR ROW and for certain public utilities easements. Additional bicycle facilities may be available for redevelopment areas and private developments requiring public access improvements with special consideration to service recreational areas such as beaches, golf courses and parks. Also, many bikeways may take advantage of scenic views and other visual resources. Regionally, the system will serve all areas of Ventura County by tying into state and other local facilities, such as the Pacific Coast Trail. April 2006 Background Report Page Oxnard_GP_Public_Facilities_and_Services_2006_04 20 MRD.doc
176 City of Oxnard General Plan Draft Parking Facilities Ample parking is provided for most businesses and residential areas within the City. However, for the past several years the City has been evaluating parking issues in Downtown, particularly as they relate to the theater project and the reconstruction of the Civic Center complex. To ensure adequate parking with new downtown development, a 466-space Civic Center Parking Structure was recently constructed at Third and B Streets. Demand for parking spaces in Downtown Oxnard varies considerably by time-of-day and day-of-week, with the demand peaking during the weekday business hours. The availability of park and ride lots has made carpooling and vanpooling easier for some commuters in the City of Oxnard. According to the Southern California Association of Governments (SCAG) and the Ventura County Transportation Commission (VCTC), there are no officially maintained park and ride facilities in Oxnard, as illustrated on Figure 4-3. However, the City of Oxnard has utilized two parking lots as temporary park and ride facilities for specific events, one at the OTC and one located at Centerpoint Mall Air Transportation The Oxnard Municipal Airport is located in the vicinity of several residential neighborhoods as well as the former Oxnard High School. Air transportation service in the City of Oxnard is provided by airfields serving general aviation and agricultural users. The current lack of a regional airport in Ventura County will generate increased pressure to expand existing airport facilities. Commercial flights too distant or out of state destinations are available at Los Angeles International Airport (LAX) in adjacent Los Angeles County. Oxnard Municipal Airport The Oxnard Airport lies west of the Central Business District, in an area generally bounded by Teal Club Road to the north, Ventura Road to the east, West Fifth Street to the south and Victoria Avenue to the west. Airside facilities at the 216 acre airport include an east west runway, 56,100 square feet of hangar space with the capacity to store 100 aircraft and a tie down area with the capacity to store 140 aircraft. Landside facilities on the airport property consist of a passenger terminal of approximately 10,000 square feet and a paved parking lot with a capacity of 360 cars. The Oxnard airport is currently operated as a commuter service airport and is the only commercial passenger service in Ventura County. A commuter service airport is an airport that is not served by a certified air carrier, but is served by one or more commuter airlines. The Oxnard Airport is presently FAA certified and has experienced air carrier operations Page 4-34 Background Report April Oxnard_GP_Public_Facilities_and_Services_2006_04 20 MRD
177 Draft 4. Infrastructure and Community Services and operates with approximately 46,000 passengers annually. Under this status, the Oxnard Airport can accommodate turboprop aircraft. Dual wheeled aircraft over 53,000 pounds are not allowed in Oxnard due to the runway thickness and length. Business jets that are below subject limits are allowed. Camarillo Municipal Airport As an alternative to the Oxnard Municipal Airport, the Camarillo Airport is located to the east of Oxnard. The Camarillo Airport is limited to business and private airplanes, with no scheduled airlines or military aircraft. In comparison to Oxnard Airport, more extensive commercial airport development may be anticipated at the Camarillo Airport because it is closer to major transportation routes and has less adjacent urban land uses. Camarillo Airport's runway is capable of carrying a larger 115,000 pound aircraft than the Oxnard Airport. The Camarillo Municipal Airport can accommodate aircrafts twice as large as the Oxnard Municipal Airport. Point Mugu Naval Air Station The Point Mugu Naval Air Station (NAS) is located southeast of Oxnard between the SR-1 and the Pacific Ocean and is included in the Oxnard Planning Area. No commercial air service is provided at Point Mugu NAS. The Point Mugu Naval Air Station s (NAS) primary mission is to provide support to the activities of the Pacific Missile Test Center also located at Point Mugu. The California Air National Guard also maintains an adjacent base that shares the air station runways. 4.3 Utilities This section covers the following topics related to public facilities and services: Water Supply and Water Quality (4.4.1) Wastewater Collection, Treatment, and Disposal (4.4.2) Stormwater Drainage (4.4.3) Solid Waste Management (4.4.4) Water Supply and Water Quality Key Terms Acre Feet Per Year (AFY). A quantity measure of water. The amount of water covering an acre of land with one foot of water. Aquifer. A deposit of rock, such as sandstone, containing water that can be used to supply wells. April 2006 Background Report Page Oxnard_GP_Public_Facilities_and_Services_2006_04 20 MRD
178 City of Oxnard General Plan Draft Groundwater. Water beneath the surface that can be collected with wells, tunnels, or drainage galleries. Service Area. The area for which a purveyor is responsible for disturbing water supplies. Water Demand. The volume of water requested by users to satisfy their needs. Water Supply. Water supplied from surface water tanks, direct diversions from a water body (e.g., river, lake, or delta) or groundwater conveyed (e.g., via pipes) for use as a City water source. Existing Water Supply and Distribution Facilities The City of Oxnard owns and operates its own municipal water supply system and is fortunate to have both local and imported water supplies available. The City s water supply sources consist of a blend of local groundwater produced through the City s own groundwater wells, local groundwater the City purchases from the United Water Conservation District (UWCD), and imported surface water purchased from the Calleguas Municipal Water District (CMWD). As previously mentioned, the City s current water supply consists of three sources, two local and one imported. The two local sources are comprised of City wells, which receive groundwater from the Oxnard Plain Basin and United Water Conservation District wells, which taps into the Montalvo Forebay Basin. The City purchases imported water from Calleguas Municipal Water District. CMWD is a member agency of the Metropolitan Water District of Southern California from which it purchases State Project Water. The City s water system includes four blending stations where incoming imported water from CMWD is blended with local water, either from UWCD or from City wells. The City currently tries to achieve a blending ratio of one part imported water to one part local water in order to balance water quality and water supply cost. Figure 4-7 presents the City s water supply and distribution system. Existing Groundwater Supplies The Oxnard Plain Hydrographic sub-unit includes the Oxnard and Pleasant Valley Hydrographic Sub areas, each of which receives natural recharge from a system of nine groundwater basins along the Santa Clara River Basin. The Oxnard Hydrographic Sub area is located in the southwest corner of the Santa Clara River Basin and consists of the Montalvo, Mound, and Oxnard Plain Basins. Page 4-36 Background Report April Oxnard_GP_Public_Facilities_and_Services_2006_04 20 MRD.doc
179 Draft 4. Infrastructure and Community Services Figure 4-7 System City of Oxnard Water Supply and Distribution April 2006 Background Report Page Oxnard_GP_Public_Facilities_and_Services_2006_04 20 MRD.doc
180 HILL RD ARNOLD RD CASPER RD OLDS RD RICE AV 126 FRWY 101 FRWY MAIN ST 101 FRWY TELEPHONE RD River CENTRAL AVE LELAND ST Santa VINEYARD AV Clara H ST COLLINS ST SANTA CLARA AVE HARBOR BL GONZALES RD VICTORIA AV DORIS AV PATTERSON RD OXNARD BL DEL NORTE BL FIFTH ST FIFTH ST Pacific WOOLEY RD B ST WOOLEY RD RICE AV CHANNEL ISLANDS BL WEST RD VENTIURA RD J ST PLEASANT VALLEY RD HAILES RD HUENEME RD Ocean Legend CASPER RD Waterwell W N S E Waterline Water Fire Hydrant Blending Station Figure 4-7 Water Sytem Source: City of Oxnard GIS Created By: City of Oxnard Planning & Environmental Services, Miles 0 1 2
181 City of Oxnard General Plan Draft (Back of Figure 4-7) Page 4-38 Background Report April Oxnard_GP_Public_Facilities_and_Services_2006_04 20 MRD.doc
182 Draft 4. Infrastructure and Community Services The Oxnard Plain Basin is the most important to the City of Oxnard and is composed of two aquifer systems known as the Upper Aquifer System (UAS) and the Lower Aquifer System (LAS). The UAS consists of the Oxnard Aquifer, and the Mugu Aquifer. The LAS is comprised of the Hueneme, Fox Canyon, and Grimes Canyon Aquifers Groundwater Production The City currently has four active wells located at the City Water Division Yard on Third Street and three additional planned wells. Well Numbers 22 and 23 are Upper Aquifer System wells and Well Numbers 20 and 21 are Lower Aquifer System Wells. The wells pump groundwater from the Oxnard Aquifer into a 220,000-gallon clear well reservoir. The UAS wells have a total active pumping capacity of approximately 6,000 gpm. The LAS wells also have a total active pumping capacity of approximately 6,000 gpm. The City is developing three new wells (Well Numbers 19, 24, and 25) at Blending Station Number 3. Well Numbers 19 and 25 are screened in the UAS and Well Number 24 is screened in the LAS. Well Number 24 is also being designed as an Aquifer Storage and Recovery (ASR) well. The City s second source of groundwater comes from UWCD s system. UWCD s El Rio groundwater well field is located at the El Rio Spreading Grounds. UWCD diverts Santa Clara River water at the Vern Freeman Diversion Dam northwest of Saticoy and delivers a portion of the water to the spreading grounds via pipeline. The water is then pumped directly through UWCD s Oxnard-Hueneme (O-H) Pipeline to the City s four blending stations. Imported Water Oxnard s imported water supply originates in Northern California and is conveyed over 500 miles to Southern California through the State Water Project s system of reservoirs, aqueducts and pump stations. Water is filtered and disinfected at Metropolitan Water District (MWD s) Joseph Jensen Filtration Facility in Granada Hills. CMWD receives the treated water from MWD via the MWD West Valley Feeder and Springville Reservoir near Camarillo. The Springville Reservoir in turn provides pressurized water directly through the Oxnard Conduit to the City s four blending stations. CMWD/MWD Aquifer Storage and Recovery Project In a cooperative effort with MWD, CMWD is developing a below ground storage reservoir in the Las Posas Groundwater Basin. The Las Posas Basin ASR project is designed to provide for subsurface storage of up to 300,000 April 2006 Background Report Page Oxnard_GP_Public_Facilities_and_Services_2006_04 20 MRD.doc
183 City of Oxnard General Plan Draft acre- feet of imported water to meet emergency, drought, and peak demands of CMWD s member agencies. The project will be constructed in phases and is anticipated to be fully operational in The Las Posas ASR project will provide the following benefits to the City of Oxnard: Increase the reliability of CMWD s drinking water supply by storing large volumes of water. Increase the water storage capacity for the CMWD service area. The available storage capacity in the Las Posas Basin is 30 times the capacity of Lake Bard. Provide increased operational flexibility in the event of a severe drought or emergency. If the State water supply is either reduced or disrupted entirely, the stored water will be retrieved, treated and delivered to meet CMWD s service area demands. Existing Water Usage Water customers serviced by the City of Oxnard currently use approximately 21,600 acre-feet of water per year. The majority of the water (14,400 acre-feet) is purchased from the CMWD which in turn purchases water from the MWD of Southern California. The City also pumps approximately 5,700 acre-feet from the United Water Conservation District wells, and pumps approximately 1,500 acre-feet from City wells. Both the Carmichael Water District (CWD) and Metropolitan Water District (MWD) have continually assured the City that water supplies will be available in the future. A summary of existing water demand by land use category is provided in Table 4-4. Table 4-4 Existing Water Demand Land Use Type Demand (gpd) Single Family Residential 333 Multi-Family Residential 2,029 Commercial 2,438 Industrial 2,577 City 90 Agricultural 165 Note: gpd = gallons per service day Source: Oxnard Water System Master Plan, January 2003 Daily per capita water consumption rates range from 177 gallons to 134 gallons. The average per capita consumption is about 155 gallons per day. It is important for the City to continue its comprehensive water conservation program, and to develop water supply contingency plans. The Page 4-40 Background Report April Oxnard_GP_Public_Facilities_and_Services_2006_04 20 MRD.doc
184 Draft 4. Infrastructure and Community Services City of Oxnard established a Water Enterprise Fund to pay for operations, maintenance, and capital costs associated with water supply and distribution. Additional funding include operation and connection fees and the requirement for new developments to construct the necessary improvements to expand the water transmission and distribution systems in order to meet the needs of new customers. Projected Future Water Demand City Water Division records indicate that water demand is growing at a compound rate of two percent per year. To meet this increased demand, the City is expanding the supply system (Springville Reservoir Project) and the distribution system (Blending Station Number 4 and Water Pressure Separation Vaults) to ensure that enough water can be delivered at adequate fire flow levels as new customers are added to the system. The ultimate water transmission and distribution system will be capable of delivering approximately 106 cubic feet per second (the equivalent of approximately 68 million gallons per day), meeting fire flow levels required by the State of California. This expanded system can adequately supply water to the projected population in the City s 2020 General Plan. The use of the specific water supply elements is based on economic and operational considerations. The composition of these elements must be based on the current and projected water demand characteristics of the service area. The available water supply elements must be able to meet water demands with a high level of reliability. Table 4-5 presents the projected supply and demands for the City of Oxnard based on current resources. Table 4-5 Year Annual Demand, AFY Projected Water Demands and Supplies Annual Supply Allocations (Acre Feet/Year (AFY)) City Well (1) UWCD CMWD (2) Total (3) Additional Required (4) ,966 5,879 5,302 13,249 24,430 1, ,081 5,568 4,990 13,249 23,807 7, ,730 5,255 4,678 13,249 23, ,380 5,255 4,678 13,249 23,182 17, ,565 5,255 4,678 13,249 23,182 21,383 Notes: 1. Assumes no additional allocation is granted 2. Based on 90 percent of maximum demand from , consistent with proposed CMWD rate structure 3. Total annual water allocation excluding groundwater credits 4. Additional allocation needed to meet the projected demand Source: Oxnard Water System Master Plan, 2003 April 2006 Background Report Page Oxnard_GP_Public_Facilities_and_Services_2006_04 20 MRD.doc
185 City of Oxnard General Plan Draft Supply limitations on the City s local groundwater allocation and imported water sources, as well as the anticipated increasing cost of imported water, justify the City s exploration of alternative water supply source development. In response to this expected shortfall, the City will need to develop additional alternative water supply sources to continue meeting its goal of providing current and future residents and businesses with a reliable and affordable source of good quality water. Future Water Supplies The availability of future supplies is bound by pumping restrictions, the capacity of CMWD s distribution system, and the reliability of State Project water deliveries. Future water supplies will continue to come from local wells (about 5 percent), the UWCD (about 25 percent), and from the CMWD (about 70 percent), which purchases its water from MWD. The MWD maintains that sufficient water supplies will be available to meet future demand. Additional water sources are available through the implementation of the new Groundwater Recovery Enhancement and Treatment (GREAT) Program. The GREAT Program consists of several elements intended to maximize the benefit from local recycled and groundwater resources. The City of Oxnard is planning to upgrade its wastewater treatment plant to produce tertiary recycled water. The GREAT Program is designed to provide the City with: Increased water supply reliability during drought; Reduced water supply costs; Water supply security in meeting growing water demand; Enhanced local water supply stewardship through recycling and reusing a substantial portion of the region s waste water; and Environmental benefits associated with the development and rehabilitation of local saltwater wetlands. The GREAT Program accomplishes these goals through implementation of a water recycling program, a groundwater injection program, and a groundwater desalination program to more efficiently utilize existing local water resources. The GREAT Program s implementation actions assist the City in meeting their water supply needs in A phasing plan was developed that matches the capital expenditures available with the capacity of the water supply and distribution system. Table 4-6 presents a summary of the program s recommended water supply allocation. Page 4-42 Background Report April Oxnard_GP_Public_Facilities_and_Services_2006_04 20 MRD.doc
186 Draft 4. Infrastructure and Community Services In addition to the sources previously mentioned, the Oxnard Wastewater Treatment Plant (OWWTP) currently produces secondary effluent that is discharged via an outfall to the ocean. Additional treatment facilities would be developed to produce tertiary effluent that meets unrestricted use according to California Department of Health Services (DHS) criteria. The tertiary effluent would be further treated and ultimately used for groundwater recharge. Table 4-6 GREAT Program Recommended Water Supply Allocation (AFY) Demand 25,996 31,081 35,730 40,380 44,564 Supply Imported SW 13,239 13,239 13,239 13,239 13,239 City GW Allocation 5,879 5,568 5,255 5,255 5,255 UWCD GW 4,990 4,678 4,678 4,678 5,302 Suballocation GREAT Program GW 0 7,284 12,558 17,208 21,392 Supply TOTAL 24,420 31,081 35,730 40,380 44,564 Notes: SW = Surface Water GW = Groundwater Source: Water System Master Plan, 2003 Implementation of the GREAT Program is the City s preferred choice to meet the their future water demands. It is cost-effective, environmentally sensitive, and develops local water resources. It offers the opportunity for partnering with other water purveyors to provide for a regional solution to Ventura County s growing water needs. Furthermore, CMWD, UWCD, Fox Canyon Groundwater Management Agency (FCGMA), and the County of Ventura support implementation of the GREAT Program as an innovative means of addressing local water quality and quantity issues. The only economical alternative to meet the 2020 demand of 44,565 acre feet per year or higher is by implementation of the GREAT program. Without implementation of the great program, water resources would be a significant potential limiting factor to growth within the City s area of influence. In order to be able to handle a larger volume of water from the CWD or MWD, the City will need to ensure that the water distribution and transmission system has sufficient capacity to handle the increased water flows. The City Council has adopted an interim Master Water Plan that coordinates future expansions and facility upgrades. The plan calls for, among other things, bond measures to provide funds for constructing a 30-inch transmission line from the Springville Reservoir and a fourth Blending Station. April 2006 Background Report Page Oxnard_GP_Public_Facilities_and_Services_2006_04 20 MRD.doc
187 City of Oxnard General Plan Draft Wastewater Collection, Treatment, and Disposal Key Terms Wastewater. Sewage (either treated or untreated) from residential, commercial, industrial, and institutional sources. Wastewater Collection System. The totality of the pipes, pump stations, manholes, and other facilities that convey untreated wastewater from the various sources around the City to the Oxnard Wastewater Treatment Plant. Existing Facilities The City of Oxnard currently provides wastewater collection and treatment services through the Public Works Wastewater Division. The Oxnard Wastewater Treatment Plant (OWWTP) services the cities of Oxnard and Port Hueneme, and the U.S. Navy Construction Battalion Station, the Point Mugu Naval Air Station, and some adjacent unincorporated areas. The City owns, operates, and maintains over 300 miles of sewer pipeline and 16 wastewater pumping stations as shown on Figure 4-8. Three additional pumping stations owned and operated by other entities also discharge to the City s system. The collection systems convey flow to the City s wastewater treatment plant located at the southwest portion of the City. The collection system includes gravity sewers ranging from 6- to 48-inches in diameter. The majority of flow in the system is conveyed to the treatment facility through the Ventura Road, Rose Avenue, Redwood, Western, Central, and Eastern trunk sewers. The City s existing lift stations are presented in Table 4-7 and existing force mains are presented in Table 4-8. The OWWTP has a current design capacity of 39.6 million gallons per day, Average Dry Weather Flow (ADWF) and 75.4 million gallons per day Peak Wet Weather Flow (PWWF) as presented in Table 4-9. The OWWTP has an ocean outfall pipe consisting of three sections. The first section, beginning at the effluent pumping station which consists of 868 feet of 48-inch diameter reinforced concrete pipe. This is followed by 1,600 feet of 30-inch diameter cast iron pipe. Page 4-44 Background Report April Oxnard_GP_Public_Facilities_and_Services_2006_04 20 MRD.doc
188 Draft 4. Infrastructure and Community Services Figure 4-8 Oxnard Wastewater System April 2006 Background Report Page Oxnard_GP_Public_Facilities_and_Services_2006_04 20 MRD.doc
189 ARNOLD RD CASPER RD EDISON DR OLDS RD UKIAH ST L ST G ST SNOW AV RICE AV RICE AV 101 FRWY 101 FRWY River HARBOR BL TELEPHONE RD Santa LELAND ST Clara VINEYARD AV H ST AZALEA ST ESPLANADE DR VINEYARD AV COLLINS ST AUTO CENTER DR 101 FWY NORTH CENTRAL AVE SANTA CLARA AVE HARBOR BL GONZALES RD VICTORIA AV DORIS AV TEAL CLUB RD EBONY DR PATRICIA ST VENTURA RD L ST RODERICK AV G ST F ST C ST C ST A ST BAHIA DR THIRD ST GONZALES RD WANKEL WY RIBERA DR LATIGO AV COLONIA RD CAMINO DEL SOL STURGIS RD DEL NORTE BL FIFTH ST K ST FIFTH ST Pacific MANDALAY BEACH RD WOOLEY RD OCEAN DR PIER WK VICTORIA AV WEST RD PORT DR ISLAND VIEW AV KELP ST PATTERSON RD CHANNEL ISLANDS BL NINTH ST N ST J ST GUAVA ST K ST M ST J ST E ST B ST C ST ELM ST PLEASANT VALLEY RD ASH ST OXNARD BL ROSE AV IRIS ST LAUREL ST CHANNEL ISLANDS BL SAVIERS RD CLOYNE ST BARD RD BARD RD CYPRESS RD GARY DR WOOLEY RD EMERSON AV PLEASANT VALLEY RD RICE AV HAILES RD Legend PERKINS RD HUENEME RD Eastern Trunk Sewer J Street Trunk Sewer W N S E N. Oxnard Blvd Trunk Sewer Rose Ave Trunk Sewer S. Oxnard Blvd Trunk Sewer Ventura Rd Trunk Sewer W. Channel Islands Trunk Sewer W. Wooley Rd Trunk Sewer Wastewater Treatment Plant Ocean CASPER RD Figure 4-8 Wastewater System Source: City of Oxnard GIS Created By: City of Oxnard Planning & Environmental Services, Miles 0 1 2
190 City of Oxnard General Plan Draft (Back of Figure 4-8) Page 4-46 Background Report April Oxnard_GP_Public_Facilities_and_Services_2006_04 20 MRD.doc
191 Draft 4. Infrastructure and Community Services Table 4-7 Existing Lift Stations No. Name Station Type Year Built No. of Pumps Rated Pump Capacity (gpm) Pump Operating Strategy 1 Cabezone Submersible Duty/standby 2 Harbor Submersible Duty/standby 4 Mandalay & Wooley Submersible Duty/standby 6 Canal Submersible Duty/standby 10 Town Center Submersible Duty/standby 15 Cascade Submersible Duty/standby 20 Beardsley Submersible ,000 Duty/standby 22 Royal Duke Submersible Duty/standby 23 Wagon Wheel Submersible ,500 Duty/standby 24 Handyman Submersible Duty/standby 25 El Rio Submersible Duty/standby 26 Stroube Submersible Duty/standby 27 Launch Ramp Submersible Duty/standby 28 Hueneme Wet / dry well ,100 each Lead/Lag/Stand-by 29 Patterson & Hemlock Wet / dry well ,500 each Lead/Lag/Stand-by 30 Colony Submersible Duty/standby Source: Oxnard Wastewater Collection System Master Plan, 2002 The OWWTP has a current design capacity of 39.6 million gallons per day, Average Dry Weather Flow (ADWF) and 75.4 million gallons per day Peak Wet Weather Flow (PWWF) as presented in Table 4-9. The OWWTP has an ocean outfall pipe consisting of three sections. The first section, beginning at the effluent pumping station which consists of 868 feet of 48-inch diameter reinforced concrete pipe. This is followed by 1,600 feet of 30-inch diameter cast iron pipe. There is a 5,200 foot section of 48-inch diameter reinforced concrete pipe of which the terminal 1,016 foot portion is comprised of a diffuser section. The final section of the pipe limits the actual capacity of the system to 50 million gallons per day and therefore the plant incorporates a flow equalization facility to limit maximum plant outfall capacity to an average of 50 MGD. There are presently some lines in the sewer collection system that is at capacity. Work on the trunk lines will provide adequate sewer line capacity for the next 5- to 10-year period. The City established a Wastewater Conveyance Fund to pay for operations, maintenance, and capital costs of the wastewater collection system, and to establish the Wastewater Treatment Plant Fund to pay for operations, maintenance and capital costs of wastewater treatment. In addition to these funds, the City utilized State and Federal grants to pay for a portion of the recent Wastewater Treatment Plant Expansion. The City also collects sewer connection fees, and/or requires developers to build improvements, April 2006 Background Report Page Oxnard_GP_Public_Facilities_and_Services_2006_04 20 MRD.doc
192 City of Oxnard General Plan Draft to expand the wastewater collection system to service new customers. A Sewer Master Plan was developed in 2003 by the City to coordinate future expansion and upgrading. This plan is currently being refined and updated. Table 4-8 No. Existing Force Mains Year Material Built Diameter (inches) Length (ft) 1 ACP class 150 epoxy coated ,300 2 ACP class 150 epoxy coated Schedule 80 PVC ,170 6 PVC ACP PVC , DIP ACP class 150 epoxy coated , ACP class , Schedule 40 PVC class Class 125 CIP ACP , CIP ACP PVC PVC DIP , Class 52 DIP , PVC Source: Table 4-9 Oxnard Wastewater Collection System Master Plan Oxnard Wastewater Treatment Plant Capacity Criteria Capacity Average Dry Weather Flow (ADWF) Peak Wet Weather Flow (PWWT) Notes: MGD = Million Gallons per Day Source: Oxnard Public Works Wastewater Division, MGD 75.4 MGD Projected Future Needs The capacity of the expanded OWWTP will be adequate to handle projected commercial and residential needs based on the population forecasted for the 2020 General Plan. The OWWTP Expansion Environmental Impact Report (EIR) assumed a population of 232,050 for Oxnard in the year 2014, which is 40 percent higher than the anticipated 2020 General Plan build-out. The 2020 General Plan build-out could be accommodated by current OWWTP capacity. Page 4-48 Background Report April Oxnard_GP_Public_Facilities_and_Services_2006_04 20 MRD.doc
193 Draft 4. Infrastructure and Community Services The wastewater collection system requires an investment of 25 capital improvement projects to mitigate hydraulic deficiencies for current and build out conditions. Specific projects to address the repair and replacement of collection lines and pump stations were outlined in the Wastewater Collection System Master Plan This capital investment plan was in three phases starting in 2000 through to Stormwater Drainage Key Terms Drainage. The control and removal of excess rainfall runoff or groundwater by the use of surface or subsurface features or drains. Drainage Channel. An open channel such as swale, constructed channel, or natural drainage course that may convey, store, and treat runoff. NPDES. National Pollutant Discharge Elimination System, a permitting program administered by the State. The NPDES permit granted to Oxnard establishes standards and requirements for the control of pollutants in stormwater. Stormwater Management. Public policies and activities undertaken to regulate the rate, volume, and quality of runoff. Watershed. An area of land that drains water, sediment, and dissolved material to a common outlet. Existing Stormwater Drainage Infrastructure Oxnard s relatively flat topography has a major bearing on the drainage needs of the area. Elevations in the City range from sea level to 80 feet above sea level. The City is in Ventura County Watershed Protection District (VCWPD) Flood Zone 2. The drainage area includes the City and surrounding area that drains into the City. In addition to natural factors, the type and intensity of land use are significant factors affecting storm runoff. Open areas allow for percolation into soils and minimizes runoff. Developed areas have increased portions of impervious surfaces and generate increased surface runoff. The City of Oxnard currently uses storm drain facilities maintained by the Public Works Department Operations Division and County of Ventura flood control channels to handle storm water runoff as depicted in Table 4-10 and Figure 4-9. In addition, it is a common practice for agricultural operations to use private underground tile lines to drain perched water from shallow soil zones. These tile lines empty into city storm drains or natural drainage courses. Funding for storm drain maintenance is provided by the City s general fund. April 2006 Background Report Page Oxnard_GP_Public_Facilities_and_Services_2006_04 20 MRD.doc
194 City of Oxnard General Plan Draft Table 4-10 Drainage Facilities VCFCD Channels Length (miles) Doris Avenue 3.05 West Fifth Street 2.44 Wooley Road 1.61 Oxnard West 3.16 J Street 2.53 Oxnard Industrial 3.39 Rice Road 4.45 El Rio 1.70 Santa Clara 1.33 Victoria Avenue 1.00 Source: Oxnard Master Plan of Drainage, 2003 The City has a 2003 Master Plan of Drainage to assist in making prudent decisions regarding flood protection needs. The plan accounts for the expected rainfall runoff for a ten-year frequency storm event. The planning boundary for the Master Plan of Drainage encompasses the urbanized core of the City and a portion of the area within the Sphere of Influence, a total of approximately 35 square miles. The plan divides the City into 17 watershed areas each approximately 500 acres or larger in size. The drainage system of Oxnard discharges to the sea, either directly or indirectly via VCFCD facilities. The City is a co-permittee, along with nine other cities, Ventura County and the Watershed Protection District for the NPDES permit issued by the California Regional Water Quality Control Board. The City is required to comply with the Countywide Storm Water Quality Management Program and the Federal Clean Water Act that regulates discharge of pollutants into waters of the US. The 2003 Master Plan of Drainage identified problem areas where flooding currently occurs throughout the urbanized area; poor drainage and shallow inundation in these problem areas is usually attributed to insufficient existing drainage facilities. Requirements were needed in each of the 17 watersheds. The requirements were prioritized into four levels. Fourteen of seventeen watersheds required priority 1 type or 2 type projects. Ten of seventeen watersheds required priority 2A and priority 3 type projects where priority 3 type project addressed future requirements. The City has three existing flood planning policies. These policies are (1) a storm drain fund fee aimed at new development, (2) a requirement that all new development convey water generated by their project and all upstream water to the nearest adequate storm drain facility, and Page 4-50 Background Report April Oxnard_GP_Public_Facilities_and_Services_2006_04 20 MRD.doc
195 Draft 4. Infrastructure and Community Services Figure 4-9 Oxnard Storm Drainage System April 2006 Background Report Page Oxnard_GP_Public_Facilities_and_Services_2006_04 20 MRD.doc
196 ARNOLD RD CASPER RD EDISON DR OLDS RD UKIAH ST L ST G ST SNOW AV RICE AV RICE AV 101 FRWY 101 FRWY TELEPHONE RD River HARBOR BL Santa LELAND ST Clara VINEYARD AV ESPLANADE DR VINEYARD AV COLLINS ST AUTO CENTER DR CENTRAL AVE SANTA CLARA AVE H ST 101 FWY NORTH HARBOR BL GONZALES RD VICTORIA AV DORIS AV TEAL CLUB RD EBONY DR PATRICIA ST AZALEA ST VENTURA RD L ST RODERICK AV G ST F ST C ST C ST A ST BAHIA DR THIRD ST GONZALES RD WANKEL WY RIBERA DR LATIGO AV COLONIA RD CAMINO DEL SOL STURGIS RD DEL NORTE BL MANDALAY BEACH RD FIFTH ST K ST FIFTH ST Pacific WOOLEY RD OCEAN DR PIER WK VICTORIA AV WEST RD PORT DR ISLAND VIEW AV KELP ST PATTERSON RD CHANNEL ISLANDS BL NINTH ST N ST J ST GUAVA ST K ST M ST J ST E ST B ST C ST ELM ST PLEASANT VALLEY RD ASH ST OXNARD BL ROSE AV IRIS ST LAUREL ST CHANNEL ISLANDS BL SAVIERS RD CLOYNE ST BARD RD BARD RD CYPRESS RD GARY DR WOOLEY RD EMERSON AV PLEASANT VALLEY RD RICE AV HAILES RD PERKINS RD HUENEME RD Ocean CASPER RD Legend Oxnard City Limits Storm Drain Lines W N S E Open Channel Wastewater Treatment Plant Figure 4-9 Storm Drainage Source: City of Oxnard GIS Created By: City of Oxnard Planning & Environmental Services, Miles 0 1 2
197 City of Oxnard General Plan Draft (Back of Figure 4-9) Page 4-52 Background Report April Oxnard_GP_Public_Facilities_and_Services_2006_04 20 MRD.doc
198 Draft 4. Infrastructure and Community Services (3) drainage standards defining the appropriate hydrology method and roughness factors for use in all storm drainage conveyance system designs. Projected Future Needs The 2003 Master Plan of Drainage provided an analysis for the control of future project-specific drainage. According to this analysis, the existing storm drain network does not have the capacity to accommodate increased runoff produced by full build-out of the 2020 General Plan. The Master Plan of Drainage also identified the need for additional system-wide drainage infrastructure to be adequately assessed at the time of each development. Future increases of both new and infill development will increase impact on storm water system. The low gradient and elevation of Oxnard s topography creates need for impoundment areas to effectively hold runoff for developed areas. Therefore, while developers are required to convey drainage to the storm drain system, the storm drain capacity in the main lines may not be adequate Solid Waste Management Key Terms There are no key terms for this section. Existing Waste Disposal The City of Oxnard currently collects and disposes in excess of 203,000 tons of refuse annually through the City-owned Del Norte Regional Recycling and Transfer Station (Del Norte). In August of 1996, Del Norte began operation to fulfill the needs of the City with the closing of the Oxnard s Bailard landfill. This facility was opened to support waste reduction and disposal needs of the community and to assist the City in meeting the requirements of AB 939, California s waste reduction legislation. Under this legislation, cities are mandated to divert 50 percent of waste currently going to the landfill by the year In 2005, Oxnard possessed a 67 percent state-approved diversion rate. Del Norte accepts refuse from Oxnard and several other cities and areas in western Ventura County and is capable of recycling 50 to 80 percent of the refuse it receives. The Del Norte Facility is approximately 120,000 square feet on a (5 acres) and is situated on 16.5 acres of land. The facility includes: Scale house; Tipping floor; April 2006 Background Report Page Oxnard_GP_Public_Facilities_and_Services_2006_04 20 MRD.doc
199 City of Oxnard General Plan Draft Processing and storage areas; State of the art recycling equipment; Operational and administrative offices; Public viewing deck; Education center; and Facility tours. Refuse incapable of being recycled is presently hauled to other landfill sites in Ventura County. Approximately 80 percent of Oxnard s waste goes to the Simi Valley landfill with the remaining 20 percent to the Toland Road Landfill. Table 4-11 presents a summary of actual waste collected for 2001 to 2004, estimated collections for 2005, and projected waste generation through The City of Oxnard Solid Waste Division offers waste reduction education to schools and community groups, technical recycling assistance to commercial and industrial sectors, and participates in many special events throughout the year. A summary of services provided by the Oxnard Solid Waste Department includes the following: Automated residential and commercial collection service; Residential curbside recycling; Residential curbside green waste recycling; Neighborhood clean-up events; Commercial green waste pilot program; Earth Day Festival; Street Sweeping; and Composting presentations to Oxnard teachers. Implementation of a new standard service for residential waste, recycling and green waste collection will require residents to have three refuse carts, one for each commodity (waste, recyclables, and green waste). The three-cart system will significantly improve customer service, operations and the financial position of the Solid Waste Division. Customers will have greater cart capacity to store materials and due to design efficiencies customers will have greater ease in handling and cleaning carts compared to the current cart system. Operations will maximize payloads and the number of carts collected per truck route. Cost savings will occur due to the lower purchase price of carts and to the lower degree of maintenance Page 4-54 Background Report April Oxnard_GP_Public_Facilities_and_Services_2006_04 20 MRD.doc
200 Draft 4. Infrastructure and Community Services required, as compared to the current cart system. It is also projected that recyclable materials collected will be less contaminated; thus, providing cleaner recyclables and avoiding disposal and haul cost. Table 4-11 Solid Waste System Annual Solid Waste Collection (Tons) Solid Waste Actual Estimated Projected Type Solid Waste 1 149, , , , , , , , , ,663 Recyclables 2 15,880 16,825 16,863 17,336 17,683 18,036 18,397 18,765 19,140 19,523 Other Waste 3 17,772 17,152 12,450 12,526 12,777 13,032 13,293 13,559 13,830 14,107 Sub Total 4 183, , , , , , , , , ,293 Recyclable 5 34,617 32,257 24,651 21,988 22,428 22,876 23,334 23,801 24,277 24,762 Self-Hauler 6 135, , , , , , , , , ,469 Sub Total 7 169, , , , , , , , , ,231 TOTAL 353, , , , , , , , , ,524 Notes: 1. Represents solid waste tons collected by City of Oxnard municipal collection trucks 2. Represents source separated recyclable tons collected by City of Oxnard municipal collection trucks 3. Represents green waste tons collected by the City of Oxnard municipal collection trucks 4. Represents total for all City of Oxnard municipal collection 5. Represents recyclable material tons collected from other than City of Oxnard municipal trucks and delivered to the Del Norte Facility 6. Represents solid waste tons collected by other than City of Oxnard municipal trucks and delivered to the Del Norte Facility 7. Represents total tons collected from other than City of Oxnard municipal trucks and delivered to Del Norte Facility Source: City of Oxnard Solid Waste Division, 2005 Customers currently pay user fees for collection and disposal services. These user fees plus Solid Waste Fund reserves are used to purchase additional equipment and provide additional staff to serve new customers. Projected Future Needs The Solid Waste Division has a vision to develop a material recovery facility (MRF) that would vastly expand its current recycling capabilities. The MRF is planned to be built on approximately eight acres of undeveloped land next to the Del Norte Regional Recycling and Transfer Station. The MRF would include the equipment and processing mechanisms to recycle construction and demolition debris, green waste materials, recover recyclable materials from incoming waste, and convert organic waste into reuseable energy sources through non-combustible methods such as gasification and anaerobic digestion. Landfill capacity within Ventura County could be exceeded prior to buildout of the 2020 General Plan. As local landfill space becomes scarcer due to limited capacities to accept waste, stiffer regulations to open landfills, and rising costs, the advent of rail hauling waste is becoming an economically viable option. A rail spur runs next to Del Norte which makes rail haul of waste a likely option for the future. April 2006 Background Report Page Oxnard_GP_Public_Facilities_and_Services_2006_04 20 MRD.doc
201 City of Oxnard General Plan Draft Hazardous Waste Key Terms There are no key terms for this section. Existing Conditions The County of Ventura and Incorporated Cities Hazardous Waste Management Plan estimates that approximately 12,609 tons of hazardous waste per year is generated within the City of Oxnard. There are no Class I (hazardous) landfills in Ventura County. These Class I wastes are currently being exported from the County and taken either to disposal, treatment or recycling facilities in other counties. Users and producers of hazardous wastes and materials must obtain permits through the County. These permits must specify the types and amounts of materials used and how they will be transported, stored, used and disposed. Hazardous waste production by land use categories are presented below in Table Table 4-12 Hazardous Waste Production in Oxnard Land Use Annual Tons Percent Residential Industrial 8, Commercial TOTAL 12, Source: City of Oxnard Solid Waste Division, 2005 Projected Future Needs Present day volumes would be anticipated to double by the year 2020 under the 2020 General Plan. The Tanner Bill requires each County in the State of California to prepare a County Hazardous Waste Management Plan (CHWMP). The policy to implement the CHWMP at the City level is an important component of hazardous waste management by the City of Oxnard. However, a key to minimization of hazardous waste generation is the City s adopts policies. The generation of potentially hazardous materials is further enhanced by the substantial amount of industrial and business research park uses envisioned in the 2020 General Plan. Present day volumes anticipated to reach 12,609 tons/year by the year An assessment for the need of a treatment or disposal facility for hazardous wastes is required. Page 4-56 Background Report April Oxnard_GP_Public_Facilities_and_Services_2006_04 20 MRD.doc
202 Draft 4. Infrastructure and Community Services 4.4 Public Facilities and Services This section covers the following topics related to public facilities and services: Public Safety (4.5.4) Marine Safety (4.5.5) Education (4.5.6) Libraries (4.5.7) Government, Administration, and Capital Facilities (4.5.8) Gas and Electric (4.5.9) Communications (4.5.10) Public Safety Key Terms Reflex Time. The length of time from commence of an event (e.g. fire ignition) to the start of the response application (e.g. water application as extinguishing agent). The reflex time consists of the following six steps: detection, report, dispatch, turnout, response, and set up). The policies and practices of the fire department directly influence the latter four steps, but can only indirectly manage the detection and reporting of the fire. Response Time. The length of time for public safety personnel to respond to the incident scene after dispatch. Law Enforcement Within the City limits, law enforcement and police protection services are provided by the Oxnard Police Department. In the unincorporated area, the Ventura Sheriff s Department provides patrol services and the California Highway Patrol provides traffic control. Police Department Staffing. In 1990, the City had a staffing ratio of 1.1 officers per thousand residents. Currently, the ratio is 1.2 officers per thousand residents, well below the national average of 1.9 officers per thousand. In 2005, there were 224 sworn officers and over 139 civilians providing law enforcement services for the City of Oxnard. Table 4-13 provides a detailed description of the police department personnel in April 2006 Background Report Page Oxnard_GP_Public_Facilities_and_Services_2006_04 20 MRD.doc
203 City of Oxnard General Plan Draft Table Police Department Staff, City of Oxnard Position Employed Staff to Population Police Chief 1 1:188,849 Assistant Police Chief 3 1:62,950 Police Commander 8 1:23,607 Police Sergeant 24 1:7,869 Police Officers 183 1:1,032 Police Cadets 5 1:37,769 Sworn Officers 224 1:844 Civilian Positions 139 N/A Source: City of Oxnard Police Department, City of Oxnard FY Budget, Department of Finance In 2005, the City had 224 sworn officers on staff, equating to 1.2 officers per thousand population. The Oxnard Police Department s Five Year Staffing Plan (January 2004 to June 2009), projects the need for an additional 49 to 102 sworn officers and 36 to 46 civilian staff members in order to meet the projected additional calls for service based on the City s increasing population and desired service levels. Police Department Organization. The Oxnard Police Department is organized into the following three bureaus: Administrative Services, Investigative Services, and Field Services. The Administrative Services Bureau provides the primary support system for the Police Department. Divisions housed within the bureau include the Records Division, responsible for maintaining all recorded documents and evidence; the Professional Standards Division, responsible for the hiring, training, and internal affairs investigations; the Support Services Division, comprising the business office, information technology and clerical support; and the Communications Division, responsible for police and fire dispatch and 911 call taking. The primary police facilities are depicted on Figure The Investigative Services Bureau is responsible for the investigative and youth services functions of the Department. The bureau is comprised of detective units assigned to one of three distinct specialties: crimes against persons, property crimes, and narcotics. Additional services provided by the bureau include Youth Service Officers, the Police Activities League, Crime Scene Investigators, and Crime Analysis Units. The Investigative Services Bureau annually handles in excess of 14,000 investigations within the City and 6,500 service calls on local school campuses. As the largest of the three Oxnard Police Department bureaus, Field Services provides police protection and specialized law enforcement services for Oxnard residents. Field Services is comprised of three divisions: Patrol, Patrol Support, and the Special Operations. Four commanders serve as patrol watch commanders and oversee Page 4-58 Background Report April Oxnard_GP_Public_Facilities_and_Services_2006_04 20 MRD.doc
204 Draft 4. Infrastructure and Community Services Figure 4-10 Police and Fire Stations April 2006 Background Report Page Oxnard_GP_Public_Facilities_and_Services_2006_04 20 MRD.doc
205 ARNOLD RD CASPER RD EDISON DR OLDS RD UKIAH ST L ST G ST SNOW AV RICE AV RICE AV 101 FRWY 101 FRWY TELEPHONE RD River HARBOR BL Santa LELAND ST Clara VINEYARD AV H ST ESPLANADE DR 4 7 VINEYARD AV COLLINS ST AUTO CENTER DR 101 FWY NORTH CENTRAL AVE SANTA CLARA AVE Pacific HARBOR BL MANDALAY BEACH RD GONZALES RD WOOLEY RD OCEAN DR 6 VICTORIA AV DORIS AV TEAL CLUB RD PIER WK VICTORIA AV FIFTH ST WEST RD PORT DR ISLAND VIEW AV KELP ST PATTERSON RD EBONY DR CHANNEL ISLANDS BL PATRICIA ST AZALEA ST VENTURA RD NINTH ST L ST 1 K ST N ST J ST GUAVA ST RODERICK AV G ST E ST K ST M ST J ST F ST C ST C ST A ST C ST B ST 3 ELM ST PLEASANT VALLEY RD OXNARD BL ROSE AV IRIS ST LAUREL ST CHANNEL ISLANDS BL SAVIERS RD BAHIA DR THIRD ST BARD RD BARD RD CYPRESS RD GONZALES RD COLONIA RD CAMINO DEL SOL ASH ST CLOYNE ST 2 5 GARY DR WANKEL WY RIBERA DR WOOLEY RD EMERSON AV PLEASANT VALLEY RD LATIGO AV STURGIS RD RICE AV FIFTH ST DEL NORTE BL HAILES RD PERKINS RD HUENEME RD Ocean CASPER RD Legend Oxnard City Limits Police Stations W N S E 1 Police Store Fronts Fire Station (with Station Number) Figure 4-10 Public Safety Source: City of Oxnard GIS Created By: City of Oxnard Planning & Environmental Services, Miles 0 1 2
206 City of Oxnard General Plan Draft (Back of Figure 4-10) Page 4-60 Background Report April Oxnard_GP_Public_Facilities_and_Services_2006_04 20 MRD.doc
207 Draft 4. Infrastructure and Community Services approximately 140 officers. The City is separated into four Police Districts, each of which contain two response beats. Each response beat is further divided by a grid network in order to allow the Department to accurately and quickly direct patrol officers to calls for service. The beats are patrolled 24 hours a day by uniformed police officers in four overlapping ten-hour shifts per day. The Patrol Support Division is comprised of the Traffic Unit, Booking Unit, and Code Regulation Section. Code Regulation includes the Code Enforcement Unit, Alarm Control Detail, and Animal Control Unit. The Special Operations Division is comprised of the Special Enforcement Unit/SWAT, K-9 Unit, Surveillance Detail, and the multi-agency Violent Crimes Task Force. Other functions include the Firearms Unit and the Hostage Negotiations Team. Crime Statistics. According to Federal Bureau of Investigation (FBI) and California Crime Index statistics crime in the City of Oxnard decreased by almost 11 percent during the five year period between 2000 and 2004 as shown in Table Notable decreases were witnessed in the following areas: rape (60 percent), aggravated assault (14 percent), and larceny (10 percent). Significant increases occurred in auto theft (128 percent), homicide (100 percent) and arson (61 percent). Crime decreased by 11 percent during the five-year period between 2000 and Table 4-14 Crime Statistics ( ), City of Oxnard Type of Crime % Change ( ) Homicide % Rape % Robbery % Aggravated Assault % Violent Crime % Burglary % Auto Theft , % Larceny 3,417 3,062 3,034 3,156 3, % Property Crime 4,797 4,438 4,525 4,719 5, % Arson % TOTAL Crime 5,702 5,298 5,414 4,766 5, % Source: FBI Crime Statistics, Uniform Crime Index ; California Crime Index, Police Department Programs. The Oxnard Police Department offers a wide variety of programs designed to meet the needs of all residents within the City. April 2006 Background Report Page Oxnard_GP_Public_Facilities_and_Services_2006_04 20 MRD.doc
208 City of Oxnard General Plan Draft A Better Choice. The Better Choice program places at-risk youth into a classroom environment where race, culture, class, and social and economic issues are discussed. Chaplains. The Chaplain program consists of volunteers dedicated to the well-being of police officers, firefighters and community members in Oxnard. Citizen s Academy. The Oxnard Police Department s Citizen s Academy is designed to provide Oxnard residents with first hand information on the operation of the Police Department and the inherent dangers in law enforcement. Crime Stoppers. Ventura County Crime Stoppers assists local law enforcement with solving crimes by offering rewards for information in criminal cases. Crisis Team. The Oxnard Police Department, in partnership with the Ventura County Behavioral Health Agency, the Ventura Police Department, and the Ventura Sheriff s Department, created a county-wide Crisis Intervention Team (CIT) Academy. The objectives of this program include increasing the ability of officers to recognize the signs of mental illness; increasing the empathy of officers for the mentally ill, increasing awareness of community services; improving crisis intervention skills; and decreasing officer anxiety in dealing with the mentally ill. Drug Education for Youth (DEFY). DEFY began in 1997 with the mission to educate youth ages 9-12 on the dangers of substance abuse. DEFY is aimed at deterring at risk behavior by providing youth with the information and tools needed to resist drugs, gangs, and alcohol. Leadership and life skills provided by DEFY include goal setting, team building, conflict resolution, and decision making. Explorers. The Oxnard Police Department sponsors Explorer Post 9286, a community-based policing program for youth. This program is designed to educate and involve youth in police operations and interest them in law enforcement functions whether they enter the law enforcement field or not. Explorers donate thousands of hours by assisting the Oxnard Police Department in the following departments: Property, Investigations, Communications, and Records. In addition, Explorers receive training in various areas of law enforcement, such as cardiopulmonary resuscitation (CPR) & first aid, radio procedures, report writing, patrol procedures, fingerprinting, traffic, and narcotics. Page 4-62 Background Report April Oxnard_GP_Public_Facilities_and_Services_2006_04 20 MRD.doc
209 Draft 4. Infrastructure and Community Services Neighborhood Watch. Neighborhood Watch is an organized group of neighbors aimed at observing activities or situations that depreciates the appearance or safety of the community. Neighborhood Watch members observe their neighborhood and report violations of ordinances and laws to the proper enforcement agencies. Oxnard Partnerships and Resource for Youth Development (PRYDE). PRYDE is a citywide collaboration of public and private agencies and committed volunteers to provide individual support for students. Police Activities League (PAL). PAL is a city-wide program providing outreach to local at-risk youth to build positive relationships between youth, police officers, and the community. Parent Project. The Parent Project involves the parents of children suspected of minor criminal activity and provides them with the parenting tools needed to deal with their at-risk children. This program focuses on topics including: active supervision; communication; consistent consequences; active listening; support groups; promoting the family unit; managing conflicts in the home; building positive self concepts; findings help and support; and negative peer associations. Rape Against Define and Resisting Aggression Defensively (RAD). Oxnard s RAD programs are conducted in partnership with the Boys & Girls Club of Oxnard and Port Hueneme. These programs provide self defense and violence prevention education. Reserve Officers Unit. The Oxnard Police Reserve Officers Unit is a program designed to give members of the community a chance to volunteer their time as police officers. Completion of a Peace Officers Standards and Training (POST) certified Reserve Officer Academy is required for participation in the program. The Oxnard Police Department and the Ventura County Community College District cosponsor the Ventura County Police and Sheriff s Reserve Academy at Camarillo airport. Reserve Officers are required to volunteer twenty hours of service a month, attend regular monthly meetings, and participation in on-going training. Student Truancy Offender Program (STOP). In September 2000, the Oxnard Police Department launched the STOP program designed to deter student truancy and juvenile crime. As a component of the program truants are brought to the STOP truancy center at the Police Activities League. While at the center, the student s parents are contacted and an officer discusses with the student the underlying reasons for the truancy. April 2006 Background Report Page Oxnard_GP_Public_Facilities_and_Services_2006_04 20 MRD.doc
210 City of Oxnard General Plan Draft StreetBeat! StreetBeat! was the nation s first televised crime prevention show. In 1996, StreetBeat! won the California State Governor s Award for Crime Prevention Programming in the Media. Volunteers in Policing (VIP). As one of the Department s newest programs, the VIP program provides opportunities for volunteer service to the police department. Volunteer opportunities include office duties, citizen patrols, graffiti paint out, conducting tours of the police station, and other various responsibilities. Youth Academy. In March 1999, the Oxnard Police Department, in partnership with the Oxnard Union High School District, established the Oxnard Youth Police Academy. This program is designed to provide junior and senior school-aged residents of Oxnard with insight into the law enforcement profession. The curriculum for classes was approved by the School District; therefore, upon successful completion of the program students each receive 5.0 high school units. Standards and Response Time. The City of Oxnard Police Department s goal for response time to priority one (emergency) situations is five minutes or less. The response time for non-emergency calls is 20 to 45 minutes. Emergency Assistance. The City of Oxnard and the Ventura County Sheriffs Department have a mutual aid agreement in the event additional assistance is needed. In addition, assistance is offered by the California Highway Patrol and Port Hueneme Police Department on an as needed basis. Fire Protection Services The Oxnard Fire Department staffed by 87 skilled firefighters. The Oxnard Fire Department provides a full range of emergency and nonemergency services to the community and is staffed by 87 skilled firefighters. The mission of the Oxnard Fire Department is to serve the public and safeguard the community by preventing or minimizing the impact of emergency situations to life, the environment, and property by responding to both emergency and non-emergency calls for service. Services provided by the fire department include: Fire suppression; Urban Search and Rescue; Emergency Medical Service; Hazardous materials response; Water rescue operations; Page 4-64 Background Report April Oxnard_GP_Public_Facilities_and_Services_2006_04 20 MRD.doc
211 Draft 4. Infrastructure and Community Services Dive Rescue Team; Vehicle and industrial accident response; Review and inspection of new construction; Public fire and life safety education; Fire investigation; Records management and regulation of hazardous materials uses; Disaster preparedness; and Community disaster response. The Oxnard Fire Department is currently rated as a Class 2 fire department by the Insurance Services Office (ISO). The ISO rating evaluates the fire department, the City s water system, and the fire department s communication capabilities. ISO rating is important to communities since most property insurance companies determine the fire risk portion of property insurance premiums on the City s ISO rating. Oxnard was last rated by the ISO in Although commercial businesses might see benefits in a Class 1 rating, residential structures would not. Fire Department Facilities and Staffing. The Oxnard Fire Department operates from 7 fire stations; all staffed on a full-time basis with a total of 25 firefighters on duty per shift. The basic unit within the fire department is the engine company. An engine company consists of a Captain who supervises the crew, an Engineer who is responsible for the safe operation of the apparatus and all on-board equipment, and a firefighter who carries out the basic firefighting and medical tasks needed. The Oxnard Fire Department operates from 7 fire stations. The City is divided into overlapping Response Districts for each station. Each station services a primary service area in which they respond to calls, as well as a secondary and tertiary service area. This system assures resources are available to handle all calls for services and distinct types of incidents throughout the City. Depending on the type and severity of the incident, multiple fire stations may respond to one incident according to the Department s established protocol. Table 4-15 lists these stations, the emergency response apparatus, minimum assigned personnel, and secondary focus. Figure 4-10 presents the locations for Oxnard s current fire stations. April 2006 Background Report Page Oxnard_GP_Public_Facilities_and_Services_2006_04 20 MRD.doc
212 City of Oxnard General Plan Draft Table 4-15 Fire Stations, Oxnard Fire Department Station Location Apparatus Station 1 Station 2 Station 3 Station 4 Station 5 Station 6 Station S. K Street 531 E. Pleasant Valley Road 150 Hill Street 230 W. Vineyard Avenue 1450 Colonia Road 2601 Peninsula Road 3300 Turnout Circle Engine (E-61) Ladder Truck (T-61) Duty Chief (B-61) Aircraft Rescue and Fire Fighting (ARFF) Response Unit Reserve Ladder Truck Engine (E-62) Reserve Engine (RE-62) Engine (E-63) Reserve (RE-63) USAR-3 Engine (E-64) Reserve Engine (RE-64) Engine (E-65) Reserve Engine (RE-65) Engine (E-66) Rescue (R-66) Water Rescue Vehicle (WR-66) Engine (E-67) Hazardous Materials (HAZMAT 67) Source: Fire Department Strategic Plan, 2005 and City of Oxnard Fire Department, 2006 Minimum Assigned Staffing Secondary Focus Aircraft Crash Unit, and Training Center Drivers Training Urban Search and Rescue Wildland Firefighting, High Rise Fire Kids Safety House Water Rescue Hazmat Services provided by the Oxnard fire department include a wide variety of functions and duties related to fire suppression, life safety, and public services. Specialized services include the following: Urban Search and Rescue (USAR). Due to the increased potential for natural and man-made hazards, the Oxnard Fire Department has been constantly training and preparing for all types of technical rescues. Currently trained to the Awareness Level of USAR operations, all first line engines carry basic USAR tools. Station 3 is the USAR focus station and houses USAR-3, a trailer consisting of the city s USAR equipment. Emergency Medical Services. Emergency Medical Services (EMS) services are provided 24 hours a day by highly trained Firefighter Emergency Medical Technicians (EMTs). As EMTs each firefighter is trained in advanced first aid, CPR, and the use of Automated External Defibrillators (AEDs). To maintain competency, EMTs must undergo rigorous training and maintain Page 4-66 Background Report April Oxnard_GP_Public_Facilities_and_Services_2006_04 20 MRD.doc
213 Draft 4. Infrastructure and Community Services annual continuing education hours. The Ventura County Health Care Agency has established operational protocols under which EMS providers operate within the County. Hazardous Material Response. Although hazardous materials incidents are rare, the significant risks to life, property, and the environment posed to the City of Oxnard necessitate the maintenance of a Hazardous Materials Response Team (Hazmat) staffed by the Oxnard firefighters. The Hazmat Unit is a 1979 Van Pelt Fire Engine equipped with the following apparatus: on-board computers; portable weather station; electric monitoring station; hazardous materials library; Level A response suits and equipment; and exterior compartments for rescue and decontamination tools. The Hazmat team is assigned to Station 1 and is cross staffed with three personnel on Engine 1. Both units respond together on all hazardous materials emergencies. Water Rescue Operations. With the close proximity of the Pacific Ocean and the Channel Islands Harbor, the Oxnard Fire Department must be prepared to perform water rescue operations. Oxnard firefighters are trained in water rescue and in the operation of personnel water craft. Oxnard s water rescue team and equipment, such as Ocean Rescue 6, is housed in Fire Station 6. Ocean Rescue 6 is equipped with water rescue equipment including wetsuits, swim fins, lifeguard buoys, and tows a personnel water craft. In addition, Ocean Rescue 6 carries dive and rescue and recovery equipment for the Oxnard Police Department/Fire Dive Team. Specialized services provided by the Oxnard Fire Department include Urban Search and Rescue, Emergency Medical Services, Hazardous Material Response, Water Rescue Operations, and Dive Rescue Team. Dive Rescue Team. The Oxnard Police/Fire Dive Team was formed in 1985 after evidence from a murder investigation was recovered from a flood control channel by a police officer trained as a recreational scuba diver. The Dive Rescue Team consists of seven police officers and seven firefighters all trained as Dive Rescue specialists. All ambulance services within the City are provided by Gold Coast Ambulance through a private contract. Staffing. The National Fire Protection Association s (NFPA) recommended standard for fire department staffing is one firefighter per 1,000 residents. Based on an estimated 2005 population of 188,849, Oxnard s current ratio is one firefighter per 1,889 residents. In addition, the NFPA recommends each fire station service approximately 15,000 residents. Oxnard s existing six fire stations service approximately 31,400 residents per station (approximately 30,000 residents with the opening of the RiverPark station). April 2006 Background Report Page Oxnard_GP_Public_Facilities_and_Services_2006_04 20 MRD.doc
214 City of Oxnard General Plan Draft Fire Department Response. The primary function of any emergency service is the provision of sufficient resources (personnel and apparatus) to an emergency within an adequate amount of time to undertake the necessary actions to minimize associated impacts. When discussing service delivery, it is important to note the difference between reflex time and response time. Reflex time includes the amount of time from the ignition of an event to the initial actions and application of services at the scene. Response time refers to the amount of time it takes emergency services to respond to an event after dispatch. Emergency services use response time instead of reflect time to measure performance as it includes only the functions that are directly managed by the fire department. Although detection systems can be encouraged or required and the public can be educated on the reporting of emergencies, the time taken for these functions can vary considerably. As response time is discussed, it is important to note the differences between these terms in order to provide a clear understanding that although an incident may be observed or reported, emergency services may still be in the process of being dispatched. As with most developing cities, the number of responses per capita is increasing over the past several years and is projected to increase further in the future. Table 4-16 presents a summary of the department s calls for services during According to this data, the largest number of service calls were for medical aid (64 percent), distantly followed by vehicle accidents (11.7 percent) and fire alarms were no fires were present (7.8 percent). The Fire Department s goal in response to a call for emergency services is to have a fire unit on the scene within five minutes, 90 percent of the time. The Fire Department s goal in response to a call for emergency services is to have a fire unit on the scene within five minutes, 90 percent of the time as measured from the time of dispatch until arrival of the first unit. Based on an average travel speed of 30 miles per hour, a distance of approximately 1.2 miles can be covered within the standard. An analysis was conducted on responses during the 2004 calendar year to determine the department s performance level in consideration of established response goals. Overall, the average response time during 2004 was five minutes, seven seconds. When using a percentile performance indicator, more appropriate for determining performance in a high demand system such as Oxnard, the department achieved a response performance time of five minutes 66 percent of the time. Page 4-68 Background Report April Oxnard_GP_Public_Facilities_and_Services_2006_04 20 MRD.doc
215 Draft 4. Infrastructure and Community Services Table 4-16 Fire Department Responses, 2004 Type of Call Number Percent Medical Aid 7, Vehicle Accidents 1, Fire Alarms (no fires) Public Assistance Fires (Non-structural) Fires (Structural) Hazardous Conditions Agency Assistance Hazardous Materials Mutual Aid USAR Other TOTAL 11, Source: City of Oxnard Fire Department, 2004 According to the Fire Department s 2005 Strategic Plan, there are four main causes of response times that exceed performance standards. These causes include: Deployment Excessive responses times are expected in areas located further from a fire station than the defined travel time limit of four minutes (approximately 1.25 miles under normal conditions). This five minute performance standards can be exceeded for a variety of reasons including peak hour travel times ( rush hour ), weather, or other extenuating circumstances. Unit Availability Excessive response times would be expected when the workload exceeds the ability of a first-due station, resulting is the response of units from more distant fire stations. Turnout time performance Delayed response times may relate to crew performance due to slow turnout times or lack of familiarity with the response area. Turnout times can be affected by training demands, design of fire stations, technology issues, and employee performance. Anomalous Conditions Excessive response times can also result from rare and unforeseen events such as apparatus accidents and breakdowns, unusual traffic conditions, and freak weather conditions and storms. Based on the criteria presented above, the 2004 response time data is presented in Table From this data, the largest reason for exceeding the department s performance standard is deployment issues such as April 2006 Background Report Page Oxnard_GP_Public_Facilities_and_Services_2006_04 20 MRD.doc
216 City of Oxnard General Plan Draft excessive travel time and traffic. In addition, barriers such as the existing at-grade railroad tracks create bifurcation issues and response challenges for efficient fire department response. The Fire Department projects the need for an additional 3 fire stations to serve several areas that lie outside the reach of a response unit. Table Performance Indicators Performance Indicator Responses Meeting Standard Deployment Issues Unit Availability Turnout Time Performance TOTAL Source: Fire Department Strategic Plan, 2005 Future Facilities. There are currently several areas that lie outside the reach of a response unit within desired response time objectives. These areas include industrial areas east of Oxnard between Rice Avenue and Del Norte Boulevard, residential areas west of Ventura Road and north of Gonzales Road, and residential areas north of Channel Islands Boulevard and east of Rose Avenue. In order to provide sufficient response to meet existing and future needs, the fire department projects the need for additional fire stations as presented in Table Table 4-18 Future Stations Station Location Apparatus Minimum Assigned Staffing Station 8 Channel Islands and Ventura Rd. Engine (E-68) 3 Station 9 Patterson and Doris Engine (E-69) 3 Station 10 N. Rice Avenue and E. Gonzales Rd. Engine (E-60) 3 Source: Fire Department Strategic Plan, 2005 and City of Oxnard Fire Department, 2006 Emergency Assistance. The City of Oxnard Fire Department has mutual aid agreements with Ventura County, the City of Ventura, and the Ventura County Federal Fire Department, which operates fire stations at the Naval Base Ventura County (Port Hueneme Naval Construction Battalion Base and Point Mugu Naval Air Station). Communication Center The Oxnard Communication Center handles all 911 emergency calls for police, fire, and medical service, as well as dispatches all police and fire units. Oxnard is the only entity in Ventura County with a combined communications center. Page 4-70 Background Report April Oxnard_GP_Public_Facilities_and_Services_2006_04 20 MRD.doc
217 Draft 4. Infrastructure and Community Services Marine Safety The Ventura County Harbor Patrol provides rescue and emergency services within the Channel Island Harbor and Mandalay Bay water areas. Services provided include first response, fire suppression for maritime incidents, boating and safety education, vessel inspections, limited law enforcement, and management of all commercial activity permits. In addition to the Harbor Patrol, the United States Coast Guard (USCG) provides maritime safety, security, and preservation services in order to protect the public, environment, and national economic interests in the nation s ports, waterways, and coastal areas. The City of Oxnard falls within the USCG Sector Los Angeles-Long Beach Command which provides services from the Monterey-San Luis Obispo County line extending south to the Orange-San Diego County line. The nearest shore command to the City is the United States Geological Station (USGS) Channel Islands, located within the City of Oxnard. In addition, the USGC Blacktip, a 87-foot Coastal Patrol Boat, is stationed in the Channel Harbors area near Oxnard. Marine safety services are provided by the Ventura County harbor Patrol and the United States Coast Guard Education Key Terms Alternative Schools. These types of schools include continuation schools and facilities that provide independent study, site based instruction, and instructional support to home schooled students. Existing Educational Facilities The City of Oxnard is served by four elementary school districts and one high school district. The boundaries of these school districts and the locations of existing schools within the Planning Area are shown in Figure Brief paragraphs describing each school district are presented below. The City of Oxnard is serviced by 4 elementary school districts and 1 high school district. Hueneme Elementary School District. The Hueneme School District educates approximately 8,200 K-8 th grade students housed in nine elementary schools and two junior high schools. Educational services are provided to the City of Port Hueneme and the southwestern portion of the City of Oxnard. Of the district s 11 facilities, seven are located within the Oxnard Planning Area. Oxnard School District. The Oxnard School District is an elementary school district serving grades K-8 within central Oxnard. Enrolling over 16,500 students in 16 elementary schools, four middle schools, and one special education facility, the Oxnard School District serves most of the urban portions of the City of Oxnard south of US 101 and north of the City of Port Hueneme. The Oxnard School District currently operates on a yearround academic calendar. April 2006 Background Report Page Oxnard_GP_Public_Facilities_and_Services_2006_04 20 MRD.doc
218 City of Oxnard General Plan Draft Ocean View School District. The Ocean View School District boundary encompass 80 square miles from the Pacific Ocean inland to the City of Oxnard, and from the Los Angeles County line near Malibu north to the City of Port Hueneme. Providing services in a mostly rural area, the District serves more than 2,500 students in three K-5 th grade elementary schools and one 6-8 th grade junior high school. District buses travel more than 750 miles per day, providing transportation for more than 80 percent of the District s enrollment with approximately one-third of the total enrollment residing at the Point Mugu Navy base. All of the facilities within the Ocean View School District are located within the Oxnard Planning Area. Rio Elementary School District. Serving the northern Oxnard and the El Rio area, the Rio Elementary School District provides educational services to over 4,000 students. District facilities include six elementary schools and one junior high school. Oxnard Union High School District. Providing educational services since 1901, the Oxnard Union High School District serves the Cities of Camarillo, Oxnard, and Port Hueneme. The District enrolls over 16,000 students at six comprehensive high school campuses, one continuation high school, and various alternative educational programs. Of the district s nine facilities (including alternative facilities), seven are located within the Oxnard Planning Area. The remaining facilities are located within the City of Camarillo. Enrollment Trends The Rio Elementary School District is the fastest growing district servicing Oxnard. Enrollment trends for the schools located within the Planning Area are presented in Table As evidenced by these figures, the fastest growing district is the Rio Elementary School District located in northern Oxnard. With the addition of new developments in northern Oxnard, such as RiverPark, enrollment is expected to continue its present upward trend. Also experiencing substantial growth, enrollment within the Oxnard Union High School District has grown by almost 16 percent since Other districts, such as Oxnard Elementary and Ocean View Elementary, are experiencing only moderate growth. Unlike the school districts in north Oxnard, the enrollment within the Hueneme Elementary School District declined by three percent since The District partially contributes this decline to the relocation of families to areas with more affordable housing. Page 4-72 Background Report April Oxnard_GP_Public_Facilities_and_Services_2006_04 20 MRD.doc
219 Draft 4. Infrastructure and Community Services Figure 4-11 School Districts April 2006 Background Report Page Oxnard_GP_Public_Facilities_and_Services_2006_04 20 MRD.doc
220 L ST G ST ARNOLD RD CASPER RD EDISON DR OLDS RD RICE AV RICE AV 101 FRWY 101 FRWY TELEPHONE RD River Legend W N S HARBOR BL City of Oxnard Blackstock Jr. High Brekke Elementary School HARBOR BL MANDALAY BEACH RD Channel Islands High Chavez Elementary Curren Elementary Driffill Elementary El Rio Elementary GONZALES RD Pacific Elm Street Elementary School Frank Intermediate School Fremont Intermediate Green Jr. High Harrington Elementary Hathaway Elementary Haycox Elementary Haydock Jr. High Hollywood Beach Elementary Hueneme High Kamala Elementary School Larsen Elementary Lemonwood Elementary Mar Vista Elementary Marina West Elementary E Santa WOOLEY RD 16 OCEAN DR VICTORIA AV VICTORIA AV DORIS AV TEAL CLUB RD PIER WK FIFTH ST WEST RD PORT DR ISLAND VIEW AV KELP ST PATTERSON RD EBONY DR LELAND ST CHANNEL ISLANDS BL PATRICIA ST AZALEA ST VENTURA RD NINTH ST Source: City of Oxnard GIS Created By: City of Oxnard Planning & Environmental Services, Marshall Elementary Mcauliffe Elementary Mckinna Elementary 26 Ocean View Jr. High School 27 Oxnard High School 28 Oxnard Junior College 29 Oxnard School District Admin. 30 Oxnard School Site 31 Pacifica High School 32 Ramona Elementary School 33 Richen Elementary Rio Del Mar Elementary 35 Rio Del Norte Elementary 36 Rio Del Valle Elementary Clara N ST K ST VINEYARD AV L ST J ST GUAVA ST M ST H ST RODERICK AV G ST K ST Ocean J ST F ST ESPLANADE DR E ST C ST C ST C ST B ST PLEASANT VALLEY RD Ocean A ST ELM ST SAVIERS RD BARD RD PERKINS RD 6 IRIS ST BAHIA DR THIRD ST OXNARD BL COLLINS ST ROSE AV CHANNEL ISLANDS BL CYPRESS RD VINEYARD AV 101 FWY NORTH GONZALES RD COLONIA RD CAMINO DEL SOL ASH ST LAUREL ST CLOYNE ST Rio Linda Elementary Rio Plaza Elementary Rio Real Elementary Rio Rosales Elementary Rose Avenue Elementary Sierra Linda Elementary Tierra Vista Elementary Williams Elementary School AUTO CENTER DR WOOLEY RD EMERSON AV PLEASANT VALLEY RD HUENEME RD WANKEL WY RIBERA DR LATIGO AV RICE AV CENTRAL AVE STURGIS RD SANTA CLARA AVE FIFTH ST CASPER RD DEL NORTE BL HAILES RD School Districts Hueneme Oceanview Oxnard Rio Note: Entire Planning Area is within the Oxnard Hgh School District. Figure 4-11 Educational Facilities and School District Boundaries Miles 0 1 2
221 City of Oxnard General Plan Draft (Back of Figure 4-11) Page 4-74 Background Report April Oxnard_GP_Public_Facilities_and_Services_2006_04 20 MRD.doc
222 Draft 4. Infrastructure and Community Services Table 4-19 District Enrollment, Oxnard Planning Area ( ) Enrollment District Change ( ) Hueneme Elementary (1) 5,855 5,857 5,821 5,794 5, % Ocean View Elementary 2,512 2,652 2,633 2,521 2, % Oxnard Elementary 16,249 16,507 16,625 16,851 16, % Rio Elementary 3,478 3,763 3,929 4,416 4, % Oxnard Union High (1) 11,515 12,217 12,503 12,911 13, % Ventura County 140, , , , , % Note: (1) Includes only the portion of the school district within the planning area Source: California Department of Education (CDE), January 2006 Class Size and Pupil/Teacher Ratios In 1996, the California legislature passed SB 1777, a reform measure aimed at cutting class size in the early school grades allowing teachers to spend more time and energy helping all students. Small classes also enhance safety, discipline, and order in the classroom. Recent evidence also suggests that class size reduction in California has led to improvement in student test scores, parental involvement, teacher retention, and narrowing the achievement gap (California Educator). The average class size and pupil/teacher ratios for school districts within the Planning Area, Ventura County, and the State are presented in Table With the exception of the Oxnard Union High School District, all districts possess class size averages lower than those witnessed at the County and State level. With the exception of the Oxnard Union High School District, all districts within the Planning Area possess class size averages lower than those witnessed at the County and the State. Table 4-20 Class Size & Pupil/Teacher Ratios, Oxnard Planning Area ( ) District Avg. Class Size Avg. Pupil/Teacher Ratio Ocean View Elementary Oxnard Elementary Rio Elementary Oxnard Union High (1) Ventura County California Notes: (1) Includes only the portion of the school district within the planning area Source: California Department of Education (CDE), January 2006 April 2006 Background Report Page Oxnard_GP_Public_Facilities_and_Services_2006_04 20 MRD.doc
223 City of Oxnard General Plan Draft The Oxnard Elementary, Rio Elementary and Oxnard Union High School Districts currently exceed the capacity of the existing facilities. Facility Capacity Based on enrollment figures for the schools within the Planning Area, several school districts were exceeding the capacity of existing facilities. These districts include Oxnard Elementary, Rio Elementary, and Oxnard Union High School. Oxnard Elementary currently handles some of its existing capacity by operating on a year-round educational calendar. Capacities for each school district are shown in Table Table 4-21 Facility Capacity School District Enrollment Capacity Surplus/ (Deficit) Hueneme Elementary (1) 5,677 6, Ocean View Elementary 2,580 2, Oxnard Elementary 16,541 13,120 (3,421) Rio Elementary 4,062 3,425 (637) Oxnard Union High (1) 13,323 11,739 (1,584) Notes: Source: (1) Includes only the portion of the school district within the planning area California Department of Education (CDE), January 2006; Oxnard Union High School District; Hueneme Elementary School District; Ocean View Elementary School District; Oxnard Elementary School District Future School Facilities In order to meet the future educational needs of the Planning Area, new school and educational facilities may be necessary. Enrollment projections for each school district are provided in Table Based on projections, four of the five school districts serving the City will exceed the capacity of existing facilities. Only the Hueneme Elementary School District projects space available within existing facilities as enrollment figures project the district operating at only 87 percent of capacity. Districts in the most need for additional facilities include Oxnard Elementary and Rio Elementary. In addition to the projected need for new facilities, each district must also be able to acquire acceptable parcels of land upon which to locate these facilities. The unavailability of vacant land within the existing CURB line makes locating new facilities difficult. Page 4-76 Background Report April Oxnard_GP_Public_Facilities_and_Services_2006_04 20 MRD.doc
224 Draft 4. Infrastructure and Community Services Table 4-22 School District School Enrollment Projections and Facility Space Needed Enrollment Projection % Change Existing Capacity Surplus/ (Deficit) Hueneme Elementary 8,274 8, ,166 1,166 Ocean View Elementary 2,580 2, ,749 (59) Oxnard Elementary 16,541 15, ,120 (2,384) Rio Elementary 4,062 5, ,425 (2,301) Oxnard Union High 16,032 17, Notes: Source: District-wide projections are provided; projections include all students within the district including those residing outside of the Oxnard planning area School Facilities Needs Analysis for Consideration of Alternative School Facility Fees Ocean View School District, April 29, 2005; School Facility Needs Analysis, Oxnard Elementary School District, March 29, 2005; Oxnard Union Enrollment Projections, 2005 Private Educational Facilities In 2005, 11 private schools within the City of Oxnard submitted information to the California Department of Education. These institutions provide a variety of educational services, ranging from kindergarten to 12 th grade, and offer both religious and non-religious settings. The location, enrollment, and offered grades for these facilities is provided in Table Higher Education Additional opportunities are available within the City the Oxnard and neighboring communities for students to continue educational pursuits upon graduating high school. These opportunities include the following institutions as described below. Ventura County Community College District (Oxnard College). The Ventura County Community College District is a partner in the 109-campus California Community College System. The District s colleges include: Ventura College, Moorpark College, and Oxnard College. Founded in 1975, Oxnard College is the newest of the three community colleges. Set on 118 acres and located two miles from Pacific Ocean beaches, the college is accessible by the Ventura Freeway or the Pacific Coast Highway. A comprehensive two-year community college, Oxnard College offers 30 Associate of Science and 18 Associate of Arts degree programs as well as certificate courses and continuing education courses. Over 6,200 students are enrolled at Oxnard College for the academic year. April 2006 Background Report Page Oxnard_GP_Public_Facilities_and_Services_2006_04 20 MRD.doc
225 City of Oxnard General Plan Draft Table 4-23 Private Schools ( ) School Address Enrollment Grades Assistance League School 1310 Fremont Way 16 K El Shaddai Academy 143 S. B Street Genesis Christian Academy 1661 Pacific Avenue Linda Vista Adventist Academy 5050 Perry Way 61 K-8 Mary Law Private Elementary 2931 Albany Drive 161 K-6 Our Lady of Guadalupe Elementary 530 N. Juanita Avenue 308 K-8 Peppermint Junction 2150 E. Gonzales 17 K Santa Clara Elementary 324 S. E Street 256 K-8 Santa Clara High 2121 Saviers Road St. Anthony s Elementary 2421 S. C Street 207 K-8 St. John s Lutheran Elementary 1500 N. C Street 235 K-8 Source: California Department of Education, Private School Data California State University, Channel Islands (CSUCI). California State University (CSU) Channel Islands is the 23 rd campus of the CSU system and the first four-year public university in Ventura County. Adjacent to the City of Camarillo and near the City of Oxnard, CSUCI sits on a 670-acre campus at the foot of the Santa Monica Mountains. The university offers Baccalaureate and Master s degrees in business, natural sciences, computer sciences, the arts, and teacher education to a 2005 enrollment of approximately 2,200 students. California Lutheran University (CLU). Founded in 1951, CLU is located on a 225-acre campus in Thousand Oaks, California. CLU offers undergraduate, graduate, and continuing education programs through its College of Arts and Sciences, School of Business, and School of Education. The University offers 36 majors and 28 minors, in addition to professional preparation programs in specified fields of study. Master s and doctoral programs are also available. Originating from across the nation and around the world, the estimated current enrollment is approximately 3,200 students. University of California, Santa Barbara (UCSB) Extension. UCSB- Extension is the continuing education division of UCSB, courses are open to all adults seeking professional and personal development. Courses are offered year-round, with evening and weekend classes available. The closest location of a UCSB facility to the City of Oxnard is the UCSB Ventura Center located in the City of Ventura Libraries The Oxnard Public Library opened in 1907 and occupied a building funded by the Andrew Carnegie Foundation, presently the Carnegie Art Museum. Page 4-78 Background Report April Oxnard_GP_Public_Facilities_and_Services_2006_04 20 MRD.doc
226 Draft 4. Infrastructure and Community Services In 1909, the Library established book deposit stations in Port Hueneme, Moorpark, Saticoy, Camarillo, Somis, and Santa Susana. These deposit stations soon became branch locations to the main facility, but were dissolved in 1915 with the creation of the Ventura County Library System. Since its early years, the Oxnard Library system witnessed numerous expansions to both its services and facilities. A bookmobile service was introduced in 1956 and served as the Library s first extension. The Main Library moved from its original location to a second location on C Street in 1963 and then to its current location in the Oxnard Civic Center in The Colonia Mini Library opened in The newest facility, the South Oxnard Center Branch, opened in 1989, replacing the bookmobile service. Facilities and Services Providing library services to the residents of the City, the Oxnard Public Library operates the following three facilities: Main Library (251 South A Street) Located in the Oxnard Civic Center, this facility is approximately 76,000 square feet in size. Colonia Mini Library (1500 Camino del Sol) The Colonia Library occupies a 580 square foot room in the Family Investment Center on Camino del Sol. Built in 1978, this facility also accommodates offices administered by the Oxnard Housing Authority. South Oxnard Branch Library (200 East Bard Road) Recently, the City of Oxnard received a $6 million grant from the California State Library to build the South Oxnard Center Library at the corner of Saviers and Bard Roads. This 23,000 square-foot facility is expressly designed to serve the needs and desire of the community. The location of these facilities, in addition to other city facilities, is depicted on Figure The Oxnard Public Library contains nearly 400,000 volumes (books, periodicals, cassettes, videos, etc.) in its collection. Additional services include: technology resources and internet access; free programs for adult and children; literacy information for adults and materials for beginning readers; low-cost meeting facilities; and passport services. There has been a steady increase in library usage since the development of the 1990 General Plan as shown in Table According to the information presented, the percentage of registered users in relation to the City population increased from 15.8 percent in 1990 to 35.4 percent in As the city population expands and the number of facilities increased, library services also dramatically increased during the timeframe from 1990 to Significant increases include the provision April 2006 Background Report Page Oxnard_GP_Public_Facilities_and_Services_2006_04 20 MRD.doc
227 City of Oxnard General Plan Draft of print materials (38.5 percent), audio materials (188.6 percent), total circulation (249.9 percent) and library programs (29.1 percent). As services increased, library usage increased from over 8,300 attendees in 1990 to approximately 536,000 attendees in 2005, which equates to a 6,300 percent increase. Although most services increased, technological advances such as the internet is creating a shift from hard copy materials (such as magazines and newspapers) to online services. Table 4-24 Oxnard Public Library Statistics ( ) Statistic Change (89-05) Oxnard Population 129, ,549 Registered Borrowers 20,578 60,534 78,584 66, % Total print materials 246, , , , % Total audio materials 6,037 9,404 15,798 17, % Total magazine subscriptions (28.0%) Annual Library Attendance 8, , , ,359 6,324.6% Total Circulation 401, , ,129 1,405, % Annual Programs % Annual Program Attendance 16,678 15,593 21,794 20, % Source: Oxnard Library, 2006; Matrix Design Group, 2006 Standards for Public Library Space The State of California has not adopted an acceptable minimum standard for public library space. As such, national standards vary based on community size and library needs. Minimum standards often range from 0.6 to 1.0 square foot of space for every person residing in a library s service area. The Oxnard Public Library currently utilizes a standard of 1.0 square foot of library space per resident. Based on the 76,580 square feet of library space and the City s 2005 population estimate of 188,849 persons, the available space per resident is currently 0.41 square feet. With the opening of the South Oxnard Branch Library in 2007, the total square feet of library space will increase to 95,580 square feet. Based on an estimated 192,000 residents (SCAG Socioeconomic Projections), the square footage of library space per resident will be 0.5 square feet. Page 4-80 Background Report April Oxnard_GP_Public_Facilities_and_Services_2006_04 20 MRD.doc
228 Draft 4. Infrastructure and Community Services Figure 4-12 City Facilities April 2006 Background Report Page Oxnard_GP_Public_Facilities_and_Services_2006_04 20 MRD.doc
229 ARNOLD RD CASPER RD EDISON DR OLDS RD UKIAH ST L ST G ST SNOW AV RICE AV RICE AV 101 FRWY 101 FRWY River HARBOR BL Magnolia Av Oxnard Main Library First St CIVIC CENTER CITY HALL PUBLIC Second St SAFETY BUILDING Third St CIVIC CENTER Fourth St ANNEX 2 Fifth St PLAZA PARK Sixth St F St E St D St C St B St Seventh St Ninth St HARBOR BL Eigth St Oxnard Bl GONZALES RD TRANSPORTATION CENTER Fifth St A St Meta St Oxnard Bl Harrison Av WATER TREATMENT AND SUPPLY Hayes Av Second St Third St VICTORIA AV Santa DORIS AV TEAL CLUB RD FIFTH ST EBONY DR LELAND ST PATRICIA ST Clara VENTURA RD VINEYARD AV H ST AZALEA ST L ST K ST G ST 2 C ST 12 RODERICK AV F ST ESPLANADE DR BAHIA DR 4 5 VINEYARD AV COLLINS ST THIRD ST 7 AUTO CENTER DR 101 FWY NORTH GONZALES RD COLONIA RD CAMINO DEL SOL 11 RIBERA DR WANKEL WY LATIGO AV CENTRAL AVE STURGIS RD SANTA CLARA AVE FIFTH ST DEL NORTE BL 15 Legend W MANDALAY BEACH RD Oxnard City Limits WOOLEY RD OCEAN DR 1 Civic Center-City Hall 2 Public Safety Building Police/Fire 3 Oxnard Community Center 4 Water Treatment & Supply PIER WK VICTORIA AV WEST RD PORT DR ISLAND VIEW AV 5 Oxnard Transportation Center (OTC) 6 Oxnard Library Main Branch 7 Colonia Multi-Service Center 8 South Oxnard Multi-Service Center & Library N S E Pacific KELP ST PATTERSON RD CHANNEL ISLANDS BL NINTH ST N ST J ST GUAVA ST M ST 3 K ST J ST 9 City Corporate Yard E ST PLEASANT VALLEY RD 10 C ST B ST IRIS ST ELM ST LAUREL ST 14 SAVIERS RD BARD RD PERKINS RD ASH ST 10 Waste Water Treatment Plant 11 St. John s Hospital 12 North C Street Post Office 13 A Street Post Office 14 Saviers Post Office Source: City of Oxnard GIS Created By: City of Oxnard Planning & Environmental Services, OXNARD BL 9 CHANNEL ISLANDS BL CLOYNE ST CYPRESS RD HUENEME RD 15 Del Norte Regional Recycling Center ROSE AV GARY DR BARD RD WOOLEY RD EMERSON AV PLEASANT VALLEY RD Ocean RICE AV CASPER RD HAILES RD Figure 4-12 City Facilities Miles 0 1 2
230 City of Oxnard General Plan Draft (Back of Figure 4-12) Page 4-82 Background Report April Oxnard_GP_Public_Facilities_and_Services_2006_04 20 MRD.doc
231 Draft 4. Infrastructure and Community Services Strategic Plan In April of 2001, the Oxnard Public Library completed its Strategic Plan of Service as a catalyst to focus attention on the Library system and establish goals for the augmentation and redefinition of services and programs. Highlighted in the plan are six strategic objectives forming the context for the Library s goals. These issues are: Maintain a community focus as the community undergoes rapid social and economic change. Enhance and support technology-based services and electronic information resources. Additional library services are provided by Ventura County, including the Albert H. Soliz Library located in the El Rio area of northern Oxnard. Provide services, resources, and programs that celebrate the diversity of the community. Make the Library a teaching and learning organization capable of responding to new service demands. Evaluate the Library environment and the need for additional hours and facilities. Develop a marketing strategy to create an awareness of Library resources and events. Additional Library Resources Other library resources are available to Oxnard residents which include nearby cities, Ventura County libraries, local colleges, and other educational facilities. These services augment City facilities by providing additional opportunities and sources for library materials. However, many of these facilities may charge a fee or restrict use of their materials by non-residents or non-students. The Ventura County Library offers 16 facilities throughout the County for use by County residents, including the Albert H. Soliz Library within the City of Oxnard. Located in the El Rio area of northern Oxnard (2820 Jourdan Street), this facility contains over 20,000 books, magazines, books on tape, newspapers, and specializes in Spanish language materials. Future Facilities As the City continues to grow, several additional facilities have been identified by the Oxnard Public Library. New Library in the Colonia Area. Library staff recommends a new 20,000 square foot facility in the Colonia area to better serve the needs of surrounding schools, residents of low-income homes, and residents from new communities. April 2006 Background Report Page Oxnard_GP_Public_Facilities_and_Services_2006_04 20 MRD.doc
232 City of Oxnard General Plan Draft RiverPark. The RiverPark development in northern Oxnard is expected to provide sufficient residents and service demands for additional branch library materials and facilities. Harbor Beach Area. As the harbor area continues to grow, library staff recommend building a new library in the Channel Islands Harbor/Mandalay Bay area of the Oxnard Shores area Additional Facilities Additional government facilities include the City Hall/Civic and the Corporation Yard. These complexes provide additional services and serve a multiplicity of functions. In addition to these public facilities, the City s only medical facility, St. John s Regional Medical Center, is also described. Although private, the growing senior population will become increasingly more dependent on the provision of adequate medical care. Service provided and partnerships developed with private entities will dramatically impact the City s quality of life. City Hall/Civic Center. The City of Oxnard City Hall/Civic Center is located in two administrative buildings on Third Street within the Downtown Central Business District. These buildings house Council Chambers, the City Clerk, the City Treasurer, the City Manager, the City Attorney, and other various departmental functions. Corporation Yard. The City of Oxnard s Corporation Yard consists of four main buildings located on approximately 10 acres of land. The site houses three Public Works divisions: Parks and Facilities, Equipment Maintenance, and Streets and Waterways. For these divisions, the yard supports administrative functions, operations and maintenance, equipment storage, inventory storage, and other needed functions. St. John s Regional Medical Center. The St. John s Regional Medical Center was established in 1912 on 10 acres of land and originally had only six rooms. A new Regional Medical Center opened its doors in 1992, offering 266 beds on 48 acres. The Center s beds include general medical surgical plus 20 Intensive Care Unit(ICU)/Critical Care Unit (CCU), 28 perinatal, 23 acute rehabilitation beds, 16 Neonatal Intensive Care Unit (NICU) Also located on the property is a 99,000-square foot medical office building attached to the hospital. Outpatients Surgery Center, Imaging Center and Radiation Oncology Center, and physician offices are located in that building. St. John's offers comprehensive medical services including 24- hour emergency medical services, outpatient surgery, radiation therapies, and high end outpatient diagnostic imaging. The Center is noted for its Page 4-84 Background Report April Oxnard_GP_Public_Facilities_and_Services_2006_04 20 MRD.doc
233 Draft 4. Infrastructure and Community Services Centers of Excellence with HeartOne for cardiac care, California Neurosciences Institute (The Parkinson s Center), Bariatrics, and the Cancer Center of Ventura County. It is located on 48 acres in northeast Oxnard with easy access from Highway 101. Programs offered to the Oxnard community include free screenings, basic needs programs, food pantry, immunizations and flu shots, support groups, diabetes education, prenatal programs for MediCal-eligible women, general prenatal education, general wellness programs, and Health Ministries. St. John's provided $32 million in uncompensated and charity care to vulnerable populations in The Center also has a financial assistance program in place to ensure that all of its communities can receive health care, regardless of their ability to pay. Scheduled for completion in 2007, the Center will be adding a new 66,000- square foot medical office building on its property. A cancer center is also scheduled for completion in Other future improvements to St. John s include emergency room expansion, ICU expansion, operating room expansion, the potential for a specialty services facility, expanded parking via a parking structure, and construction of an offsite primary care clinic Gas and Electric Key Terms Liquefied Natural Gas (LNG). Natural gas is colorless, odorless, and non-toxic. LNG is natural gas that has been supercooled to a liquid at minus 260 degrees Fahrenheit. Liquefying natural gas reduces its volume by more than 600 times, making it more practical to store and transport. Natural Gas Natural gas service is provided by the Southern California Gas Company (SCG) which maintains a network of underground distribution lines throughout the City. Gas is imported into Ventura County through an interstate system and dispersed using SCG s fixed transmission and distribution network. To meet the growing demands for natural gas, several liquefied natural gas (LNG) facilities are proposed off the Oxnard coastline. As a hazardous material, LNG facilities often pose land use challenges due to safety concerns resulting from the potential consequences of an LNG spill. LNG hazards result from several of its inherent properties including cryogenic temperatures, dispersion characteristics, and flammability. LNG s temperature of minus 260 degrees can cause severe burns associated with extended contact. Although not poisonous, exposure to the center of a vapor cloud could result in asphyxiation due to the absence of oxygen. April 2006 Background Report Page Oxnard_GP_Public_Facilities_and_Services_2006_04 20 MRD.doc
234 City of Oxnard General Plan Draft Located offshore, there are currently 2 proposals for LNG facilitites located within proximity to the City of Oxnard. LNG vapor clouds can also ignite if introduced to an ignition source. An ignited vapor cloud is extremely dangerous due to its tremendous radiant heat output. Furthermore, if an ignited vapor cloud comes into contact with the evaporating pool of spilled LNG, the resulting pool fire can cause extensive damage to life and property. Under the Natural Gas Act, as amended, the Federal Energy Regulation Commission (FERC) has the exclusive authority to approve or deny an application for the siting, construction, expansion, or operation of LNG terminal facilities, including pipelines, and off-shore facilities in State waters. The Coast Guard and Maritime Administration have jurisdiction under the Deep Water Port Act for the siting and operation of off-shore LNG facilities in Federal waters. Proposed LNG facilities include the Cabrillo Deepwater Port LNG Facility and the Clearwater Port LNG Project. Located approximately 14 miles offshore, the Cabrillo Deepwater Port LNG Facility would be situated 21 miles from Anacapa Island and 18 miles from the boundary of the Channel Island Marine Sanctuary off the Oxnard coast. This project would develop a permanently moored floating storage and regasification unit (FSRU) import facility off-shore. This facility would include three independent spherical storage tanks mounted within the hull, accommodations for personnel, ship berthing and mooring system, and eight regasification vaporizers. At the mooring point, three 14 foot flexible mooring rise pipes and a pipeline end manifold on the sea floor would connect to a new underwater, 21.1-mile, 30-foot wide pipeline. This pipeline would be buried as it approaches shore north of the Ormond Beach Generating Station where it would connect to Southern California Gas Company pipeline. No extensive on-shore facilities are proposed and the off-shore facilities would only be visible from elevated locations on-shore. This project is not expected to be operational until The second proposed project, the Clearwater Port Project, would be located approximately 12.6-mile off-shore the Oxnard coastline. This project would utilize the existing offshore Platform Grace to import LNG on-shore. Reconfiguration of the platform would involve installation of an LNG transfer system, a cool down system, six LNG pumps, six LNG vaporizers, and reinstalling and upgrading the platoform s powerproduction capability. Under this proposal, LNG would be transported by ship to the Platform Grace where it would be converted back into vapor form. To stabilize the ships during the transfer phase, a new floating dock would be constructed adjacent to the platform. Natural gas would be diverted from the platform to the shore in a new 13-mile, 32-foot wide buried pipeline using an existing pipeline corridor to minimize disturbance to the marine environment. The pipeline would land onshore at the Page 4-86 Background Report April Oxnard_GP_Public_Facilities_and_Services_2006_04 20 MRD.doc
235 Draft 4. Infrastructure and Community Services Mandalay Power Generating Station in Oxnard. From its subsea terminous at Mandalay, a new 12-mile underground pipeline would tie into an existing 30-foot Southern California Gas Company pipeline. The projected operational date for this project is early Electricity Electric services are provided by Southern California Edison (SCE). Electricity is distributed by SCE through a network of substations and transmission lines. Electricity is transportation long distances by high voltage lines, passed through a substation, and distributed to individual customers via lower voltage lines. Typically, electricity is transmitted by 66 kilovolt (kv) lines for direct consumer use. During the restructuring of California s electric industry in the late 1990s, Southern California Edison sold most of its generation facilities, including the Mandalay Beach Station and the Ormond Beach Station in Oxnard. These generating stations are now operated by Reliant Energy. The Mandalay Beach Station features three generating units: two steampowered units that were commissioned in 1959 and one jet enginepowered unit that was commissioned in Fueled by natural gas, the plant can contribute up to 560 megawatts of electricity. This state-of-theart facility is among the first in the world to use selective catalytic reduction technology to minimize emissions. The Ormond Beach Generating Station is located along the southern Oxnard coast. This Station consists of two power generating units, with a combined generating capacity of 1,516 megawatts. Unit 1 began commercial operation in August 1971, and Unit 2 in March Communications Key Terms Digital Subscriber Line (DSL). A service for higher speed data connection (compared to typical phone line). Integrated Services Digital Network (ISDN). Another method for higher speed data transmission (compared to typical phone line). T1. T1 is the highest speed data connection available in the City. Telephone Telephone service is provided to Oxnard by the General Telephone Company. As with other public utility companies, the General Telephone Company is required by California Public Utilities Commission (PUC) regulations to provide service to all new and existing developments. April 2006 Background Report Page Oxnard_GP_Public_Facilities_and_Services_2006_04 20 MRD.doc
236 City of Oxnard General Plan Draft Telephone lines are generally placed in easement right-of-ways and are subject to the regulations governing those areas. Cellular service is available through various major service providers including Cingular, Sprint, T-Mobile, and Verizon. Voice over Internet Protocol (VIOP) services are also provided through a number of national service providers. Cable Cable television, and other broadcast media, is important not only for its entertainment value, but also as a source of information during disasters or emergencies. The City of Oxnard is served by Adelphia cable. In addition, Direct TV and Dish Network satellite television systems are available through many private installation companies. Internet Basic internet service is available through direct telephone lines. High speed digital subscriber line (DSL), cable internet, and wireless broadband internet is available depending on location and service provider. Many of these services require the addition of specialized equipment to the existing telephone and cable lines in close proximity to the user. 4.5 Parks and Recreation This section describes existing and proposed recreational resources located within the City of Oxnard. Key Terms Open Space Land. Any unimproved area devoted to an open-space use for the purpose of the preservation of natural resources, managed production of resources, outdoor recreation, or public health and safety. Park, Park Land. Publicly or privately owned or controlled land for the purpose of providing parks, recreation, or open space for public use. Quimby Act (CA Government Code 66477). Cities and counties in California have been authorized since the passage of the Quimby Act in 1975 to pass ordinances requiring that developers set aside land, donate conservation easements, or pay fees for park improvements. The goal of the Quimby Act is to require developers to assist in the mitigation of impacts associated with property improvements. Originally, the Act was designed to ensure adequate open space acreage in jurisdictions adopting Quimby Act standards (i.e., 3-5 acres per 1,000 residents). Page 4-88 Background Report April Oxnard_GP_Public_Facilities_and_Services_2006_04 20 MRD.doc
237 Draft 4. Infrastructure and Community Services Recreational Area. Any public or private space set aside or primarily oriented to recreational use. This includes parks, community centers or other specialized recreational assets Parks and Facilities Facility Inventory The City of Oxnard operates 50 existing park facilities located within the Planning Area. Oxnard s park facilities are classified based on the park s primary purpose and service area. The following briefly describes the characteristics of each classification. The City of Oxnard operates 50 existing park facilities. Mini-Parks. Mini-parks, also referred to as pocket parks, serve a limited population living within a short radius (usually less than one-third of a mile). These facilities are often targeted for a specific market segment, such as young children or senior citizens. Mini-Parks are typically found within close proximity to apartment complexes, townhouse developments, or senior citizen housing. The size and scope of this type of facility lends itself well to private development and maintenance by homeowner s associations and apartment complexes. Mini-parks currently operated by the City include Fremont Park, Neptune Square Park, Borchard Oak Park, and Kohala Park. Neighborhood Parks. Neighborhood parks are designed to serve the surrounding neighborhood and provide intense recreational activities. These facilities should be easily accessible to local residents and positioned centrally within the neighborhood. Neighborhood parks emphasize free play areas that can be utilized for a variety of purposes, with a playground area generally serving as the central feature. Amenities often include small picnic areas, drinking fountains, security lighting, landscaping, and restrooms. Facilities are often characterized by a lack of lighting for nighttime use, limited or no off-street parking, and the absence of formal community playfields (such as ball diamonds and soccer fields). Of the 50 parks within the City, 33 (66 percent) are Neighborhood Parks. Community Playfields. Community playfields are large recreation areas, usually athletic complexes, designed to meet organized recreation needs. These facilities generally provide specific recreation activities with limited spectator amenities. Community playfields serve a broad segment of the City s population and may stand alone or contained within joint-use facilities or community parks. These facilities are usually buffered from residential areas, enabling more intensive and evening use. Off-street parking is also provided to serve these facilities. April 2006 Background Report Page Oxnard_GP_Public_Facilities_and_Services_2006_04 20 MRD.doc
238 City of Oxnard General Plan Draft Community Parks. Community parks provide diverse recreational opportunities to meet the needs of several surrounding neighborhoods and the City. Facilities geared for intense use, such as sports complexes, large swimming pools, group picnic areas, gardens, and bandstands are often included. Larger than neighborhood parks, community parks usually cover at least 20 to 30 acres and offer amenities that are not provided elsewhere within the park system. Both active and passive recreation activities can be accommodated within a Community Park, which may also serve as a Neighborhood Park to a surrounding area. Special Purpose Facilities. Special purpose facilities are areas reserved for specific or single-purpose recreation activities, such as golf courses, nature centers, marinas, historical sites, beaches, etc. Also included in this category are wildlife and conservation areas designed to protect, preserve, and to educate the public as to the unique flora and/or fauna indigenous to the area. Special purpose facilities within the City include the following: River Ridge Golf Course: As the only golf course within the incorporated city limits, the River Ridge Golf Course is a 27-holes championship golf course occupying over 300 acres. Amenities include driving range, two chipping greens, putting green, pro shop, and clubhouse. Bedford Pinkard Skate Park: Located across from Channel Islands High School, in College Park, the Bedford Pinkard Skate Park provides an opportunity for free, supervised skateboarding and inline skating for all levels and ages. An estimated 40 to 50 individuals utilize the park each day. At 14,500 square feet, this championship quality facility is one of the largest in Ventura County. Oxnard Tennis Center: Located at 801 Hobson Way, the Oxnard Tennis Center is the only full service tennis facility in the City of Oxnard. The center includes eight lighted championship tennis courts, clubhouse, pro shop, and a locker room with shower facilities. Oxnard Shores: A city-owned beach within a residential neighborhood, access is provided from Mandalay Beach Road, Capri Way, and Neptune Square. Oxnard Beach Park: A 62-acre developed beach, facilities include volleyball courts, biking paths, and a large covered picnic area. Rehab Point at Oxnard Beach Park provides access to the ocean for the physically impaired. Paved parking is also available on-site. Page 4-90 Background Report April Oxnard_GP_Public_Facilities_and_Services_2006_04 20 MRD.doc
239 Draft 4. Infrastructure and Community Services Ormond Beach: Situated along a two-mile stretch of the Oxnard coast between Port Hueneme and Point Mugu, Ormond Beach is one of the few remaining tracts of undisturbed coastal habitat in Southern California. Under mixed public ownership, areas of the beach are currently being evaluated by the Coastal Conservancy for restoration of wetland and grassland habitats. Future plans for the area include a wildlife preserve, public nature trails, and an environmental education center. Access to the beach is provided via Perkins and Arnold Roads. The location of existing parks and community facilities within the Planning Area are depicted on Figure 4-13 and As presented in Table 4-25, there are approximately 828 acres of parkland, including a 362-acre public golf course. Table 4-25 Park Classification Summary, City of Oxnard Type Number Acreage Covered Mini-Park Neighborhood Park Community Playfields (1) 8 (Located within other park classifications) Community Parks Special Purpose Facilities TOTAL Note: (1) Community playfields are collocated with other park facilities Source: City of Oxnard, Parks Department, 2006 A detailed description of all parks operated by the City of Oxnard is presented in Table Information presented for each park includes size, classification, and facilities. National, State, and County Parks Completing the recreational and open space resources of the City, several national, state, and county parks reside within the planning area or are easily accessible to the City. These parks include the following: Channel Islands National Park: Referred to as California s Galapagos. Located outside of the planning area, the Channel Island National Park contains over 2,000 species of plants and animals. Consisting of five islands located off the California coast, is park is known for its excellent hiking, birding, and camping opportunities. Managed by the National Park Service, the park is accessible on a year-round by boat. Various additional recreation assets are provided by the Federal government, State, and County. April 2006 Background Report Page Oxnard_GP_Public_Facilities_and_Services_2006_04 20 MRD.doc
240 City of Oxnard General Plan Draft McGrath State Beach: This 295-acre beach is considered one of the best bird watching locations in California due to its proximity with the lush riverbanks of the Santa Clara River and coastal sand dunes. Two miles of beach provide access to surfing and fishing opportunities, however, strong coastal currents and riptides can present dangerous conditions for those entering the water. The park offers beachside campsites and a nature trail leading to the Santa Clara Estuary Preserve. Mandalay State Beach: An undeveloped beach located west of the City of Oxnard, the Mandalay State Beach provides access to the Pacific Ocean and adjacent coastal sand dunes. All public related-related activities are permitted provided that they can be accommodated without impairing the scenic or natural integrity. The beach s dune and wetlands ecosystem is recognized throughout California for its pristine natural habitat. Hollywood Beach: This mile-long beach is known for its white sand beach and views of the Channel Islands. Managed by Ventura County, lifeguards are present Memorial Day to Labor Day. Silver Strand Beach: Known for excellent surfing and sunbathing, this mile-long beach is sandwiched between the Channel Islands Harbor and the U.S. Naval Construction Battalion Center. Silver Strand Beach provides a level, white sand beach that fronts a small pocket community in Oxnard. Page 4-92 Background Report April Oxnard_GP_Public_Facilities_and_Services_2006_04 20 MRD.doc
241 Draft 4. Infrastructure and Community Services Figure 4-13 Parks and Community Facilities April 2006 Background Report Page Oxnard_GP_Public_Facilities_and_Services_2006_04 20 MRD.doc
242 ARNOLD RD CASPER RD EDISON DR OLDS RD UKIAH ST L ST G ST SNOW AV RICE AV RICE AV 101 FRWY 101 FRWY TELEPHONE RD River Pacific Beck Park HARBOR BL HARBOR BL MANDALAY BEACH RD Borchard Oak Park Cabrillo Park Carty Park College Estates Park College Park Colonia Park Connelly Park Cypress Park Del Sol Park Durley Park Eastwood Park Fremont Park Johnson Creek Park 18 Kiddie Beach 19 Kohala Park Parks Campus Park Channel View Driffil Field Lathrop Park Lemonwood Park Linear Mcgrath Sate Beach Mandalay State Beach Marina West Park 26 GONZALES RD WOOLEY RD OCEAN DR VICTORIA AV VICTORIA AV Ormond Beach DORIS AV TEAL CLUB RD PIER WK Neptune Square Orchard Park FIFTH ST WEST RD PORT DR ISLAND VIEW AV Oxnard Beach Park Rio Lindo Park Sea Air Park Seaview Park PATTERSON RD EBONY DR LELAND ST CHANNEL ISLANDS BL PATRICIA ST AZALEA ST VENTURA RD NINTH ST Source: City of Oxnard GIS Created By: City of Oxnard Planning & Environmental Services, N ST K ST VINEYARD AV L ST J ST GUAVA ST M ST H ST G ST J ST ESPLANADE DR E ST C ST RODERICK AV K ST F ST C ST C ST B ST A ST ELM ST SAVIERS RD BARD RD PLEASANT VALLEY RD (Unnamed) Park West Channel PERKINS RD IRIS ST BAHIA DR COLONIA RD ASH ST THIRD ST OXNARD BL LAUREL ST Oxnard Community Park East Oxnard Community Park West 40 Sierra Linda Park Peninsula Park Plaza Park Pleasant Valley Park Southbank Park Southwest Community Park Southwinds Park 35 Public Beaches 44 Sports Park (Phase I) Santa River Ridge Golf Course Clara Thompson Park 15 Via Marina Park CHANNEL ISLANDS BL CLOYNE ST CYPRESS RD HUENEME RD West Port VINEYARD AV COLLINS ST ROSE AV GARY DR 7 BARD RD West Village Park Wilson Park AUTO CENTER DR 101 FWY NORTH GONZALES RD PLEASANT VALLEY RD Ocean WANKEL WY RIBERA DR CAMINO DEL SOL WOOLEY RD EMERSON AV W N S 19 LATIGO AV E RICE AV CENTRAL AVE STURGIS RD SANTA CLARA AVE FIFTH ST CASPER RD DEL NORTE BL HAILES RD Legend Oxnard City Limits Mini-Park Neighborhood Park Figure Community Park 4-5 Special Purpose facility Water Sytem Figure 4-13 Existing Parks Miles 0 1 2
243 City of Oxnard General Plan Draft (Back of Figure 4-13 Page 4-94 Background Report April Oxnard_GP_Public_Facilities_and_Services_2006_04 20 MRD.doc
244 Draft 4. Infrastructure and Community Services Figure 4-14 Recreational Facilities April 2006 Background Report Page Oxnard_GP_Public_Facilities_and_Services_2006_04 20 MRD.doc
245 EDISON DR ARNOLD RD CASPER RD OLDS RD UKIAH ST L ST G ST SNOW AV RICE AV RICE AV 101 FRWY 101 FRWY TELEPHONE RD River HARBOR BL Santa LELAND ST Clara O VINEYARD AV ESPLANADE DR VINEYARD AV COLLINS ST AUTO CENTER DR CENTRAL AVE SANTA CLARA AVE H ST 101 FWY NORTH Pacific HARBOR BL MANDALAY BEACH RD GONZALES RD WOOLEY RD OCEAN DR VICTORIA AV VICTORIA AV DORIS AV TEAL CLUB RD PIER WK FIFTH ST WEST RD PORT DR ISLAND VIEW AV KELP ST PATTERSON RD EBONY DR N CHANNEL ISLANDS BL PATRICIA ST AZALEA ST VENTURA RD NINTH ST L ST K ST N ST J ST GUAVA ST RODERICK AV F G ST A L K S K ST M ST J ST F ST C ST A ST E ST B ST C ST ELM ST PLEASANT VALLEY RD OXNARD BL LAUREL ST CHANNEL ISLANDS BL SAVIERS RD BARD RD PERKINS RD B IRIS ST C I R BAHIA DR THIRD ST CYPRESS RD HUENEME RD ROSE AV BARD RD GONZALES RD COLONIA RD CAMINO DEL SOL ASH ST CLOYNE ST M Q E D H P J GARY DR WANKEL WY RIBERA DR WOOLEY RD EMERSON AV G PLEASANT VALLEY RD LATIGO AV STURGIS RD RICE AV FIFTH ST DEL NORTE BL HAILES RD W N S E Legend A B C D E F G H I Oxnard City Limits Adair & Clark Fields Driffill Field O'Brien Field Colonia Field Colonia Park Gymnasium P.A.L. College Park Colonia Senior Center Wilson Senior Center Source: City of Oxnard GIS Created By: City of Oxnard Planning & Environmental Services, J K L M N O P Q R S Colonia Park Youth Center Performing Arts Center Community Center West South Oxnard Senior Center Southwest Community Park River Ridge Athletic Field Del Sol Soccer Complex South Oxnard Center Southwinds Youth Center Durley Park Youth Center Ocean CASPER RD Figure 4-14 Recreational Facilities Miles 0 1 2
246 City of Oxnard General Plan Draft back of Figure 4-14 Recreational Facilities Page 4-96 Background Report April Oxnard_GP_Public_Facilities_and_Services_2006_04 20 MRD.doc
247 Draft 4. Infrastructure and Community Services Table Park Inventory, City of Oxnard Mini-Parks Neighborhood Parks Park (Year Built) Borchard Oak (1999) Acres Area Lighting Ball Diamond Bandstand Basketball Court Bleachers Concessions Drinking Fountain 1 Fremont (1976) Kohala (1989) 1.1 Neptune Square (1965) Beck (c) (1956) 8.5 2/1 (a) Cabrillo (1995) 6 Carty (1967) Channel View (1965) College Estates (1985) Exercise Stations Horseshoes Jogging Trail Off-street Parking Picnic Facilities Colonia (c) (1950) 10 2/1 (a) 3 (a) 1 1 Connelly (1995) Cypress (b) Durley (1950) (a) 2 Eastwood (c) (1959) Johnson Creek (1978) Lathrop (1960) Lemonwood (1978) Orchard (1981) Peninsula (1977) Plaza (1902) Pleasant Valley (1977) Rio Lindo (1988) Picnic Tables Playground Recreation Bldg. Restrooms Shower Soccer Field Swimming Tennis Court Volleyball April 2006 Background Report Page Oxnard_GP_Public_Facilities_and_Services_2006_04 20 MRD.doc
248 City of Oxnard General Plan Draft Table Park Inventory, City of Oxnard (Continued) Neighborhood Parks (Continued) Community Parks Park (Year Built) Acres Area Lighting Ball Diamond Bandstand Basketball Court Bleachers Concessions Sea Air (1986) Sea View (1981) Drinking Fountain Sierra Linda (1983) Southbank (1995) Southwinds (1979) Southwest Community Park II (b) Thompson (1965) Via Marina (1980) West Channel (1965) 11.7 Westport (2004) West Village (1997) Wilson (1974) Unnamed (2005) 3.2 Campus 30 3 College Park (c) (2000) 75 1 Oxnard Community Park (a) 1 East (c) (1967) Oxnard Community Park (a) 1 8 West (c) (1981) Del Sol (c) (1981) Oxnard Beach (1989) Southwest Community (1998) Exercise Stations Horseshoes Jogging Trail Off-street Parking Picnic Facilities Picnic Tables Playground Recreation Bldg. Restrooms Shower Soccer Field Swimming Tennis Court Volleyball Page 4-98 Background Report April Oxnard_GP_Public_Facilities_and_Services_2006_04 20 MRD.doc
249 Draft 4. Infrastructure and Community Services Table Park Inventory, City of Oxnard (Continued) Special Purpose Park (Year Built) Acres Area Lighting Ball Diamond Bandstand Basketball Court Bleachers Concessions Driffill (c) (1960) (a) Linear (1989) 3.0 Public Beaches 15.6 River Ridge Golf Course Sports Park, Phase I (2001) Kiddie Beach (1965) Drinking Fountain Exercise Stations Horseshoes Jogging Trail Off-street Parking Picnic Facilities Picnic Tables Note: (a) lighted field, (b) anticipated 2006/2007, (c) additionally qualifies as a Community Playfield Source: City of Oxnard, Parks and Recreation March 2006 Future Park Facilities Several additional park facilities are currently in the planning and development stages as presented in Table Table 4-27 Future Park Facilities Park Location Acres Completion Cypress Park Cypress Road East Village Park (1) Jacinto and Gibralter 5.5 TBD Southwest Community Park II 5 th and Patterson Unnamed Park Pinata and Cesar Chavez Unnamed Park Westport and Seabridge TBD 2006/7 Unnamed Parks (8 neighborhood, community playfields) RiverPark development 24.0 or greater TBD Source: City of Oxnard Parks and Recreation Department March 2006 Notes: (1) Joint use with the Rio School District Playground Recreation Bldg. Restrooms Shower Soccer Field Swimming Tennis Court Volleyball Park Standards In general, the City standard is an overall three acres per 1,000 residents, as established by the Quimby Act. The 2020 General Plan established park standards for each park classification as shown in Table Due to the inefficiencies in administration and maintenance created by mini-parks, the City does not establish standards for this type of park facility. The size and scope of mini-parks lends itself well to private development and maintenance by homeowner s associations and higher density residential developments. The City park standard is 3 acres per 1,000 residents. April 2006 Background Report Page Oxnard_GP_Public_Facilities_and_Services_2006_04 20 MRD.doc
250 City of Oxnard General Plan Draft As with mini-parks, there are no specific acreage requirements for special purpose facilities as requirements depend on the unique purpose or use of each facility. For example, an 18-hole golf course may require at least 150 acres, while a wildlife/conservation area would need to be of sufficient size to protect and/or manage the endangered resource. The National Recreation and Park Association (NRPA) developed standards which have traditionally been applied to assess the provision of parks within urbanized areas. The most recent NRPA standards, published in 1979, recommend a minimum of six acres per 1,000 residents. Table 4-28 City Park and NRPA Standards Type of Park Acres per 1,000 persons Acres per Park Service Radius City of Oxnard Mini-Park No standard No standard 0.3 mile Neighborhood No standard Community and over 1.5 miles Special Purpose No standard No standard No standard NRPA Neighborhood and over ¼ - ½ mile Community and over 1-2 miles Regional and over 1 hr. drive Source: City of Oxnard 2020 General Plan, 1990 and NRPA, 2005 Using Oxnard s 2005 population estimate, the City currently has 4.4 acres of parkland for every 1,000 residents. Using Oxnard s 2005 population estimate, the City currently has 4.4 acres of parkland for every 1,000 residents (including the River Ridge Golf Course). When passive recreational assets, such as the City s access to beaches (such as the McGrath State Beach Park) are included the ratio increases to over 7 acres per 1,000 residents. Table 4-29 Current Park Standards, 2005 Current Parks Acres Ratio per 1,000 population Parks Parks (w/golf course) Parks (w/mcgrath State Beach) 1, Source: City of Oxnard Parks and Recreation Department, December Shared Use Facilities The City participates in cooperative agreements with several school districts for shared use of recreational assets. The facilities covered by these shared use agreements represent important contributions to the overall supply of park areas and recreation facilities for the residents of Page Background Report April Oxnard_GP_Public_Facilities_and_Services_2006_04 20 MRD.doc
251 Draft 4. Infrastructure and Community Services Oxnard. A cooperative agreement with the Oxnard Union High School District provides for the shared use of sports facilities, for which the City is charged a per-use fee. Although viewed as an efficient use of resources, the shared use of facilities present several challenges including maintenance issues and public utilization is often limited during school hours and in districts operating on a year-round educational calendar Recreational Programs Oxnard offers a wide variety of recreational programs designed to meet the needs of residents of all ages. Programs include youth activities and sports, adult classes. After School Program. The City, in partnership with the Oxnard School District and Campfire U.S.A, conduct after school activities at 16 elementary school sites within the City. Program activities include homework assistance, game room activities, sports, cultural enrichment, and specialized programs unique to each school. The average daily attendance at each site ranges from 60 to 100 students. During the fall of 2005, over 1,900 students were registered in the program. Mobile Activity Center (MAC). The Oxnard Recreation and Community Services Department sponsors a Mobile Activity Center (MAC) designed to bring recreational activities into the neighborhoods where other opportunities may be limited. This program averages youth per day at each of the five park sites visited each day. The MAC visits 10 park sites during the summer months, including Southwinds, College Estates, Rio Lindo, Marina West, Pleasant Valley, Lemonwood, Beck, Orchard, Sea Air, and Oxnard Beach. Each park is visited during a rotation schedule determined by the Parks and Recreation Department, with five sites visited each day. Oxnard Police Activities League (PAL). Established in 1994, PAL provides cultural, recreational, and educational activities to the youth of Oxnard. Facilities and activities include: teen recreation center, wide variety of sports, Mobile Skate Park, arts and crafts, holiday parties and contests, movies, music, literacy and tutoring programs, teen summits, day camps, and other various activities. The primary mission of PAL is to foster a bond of mutual trust and understanding between police officers and young people by enabling them to interact in a non-confrontational setting. Long-term, PAL is challenged to divert youth away from gangs and other criminal activity by involving them in alternative activities under the care and supervision of trained police officers, recreational staff, and parent and community volunteers. PAL s objectives are: to provide youth April 2006 Background Report Page Oxnard_GP_Public_Facilities_and_Services_2006_04 20 MRD.doc
252 City of Oxnard General Plan Draft There are 8 community facilities within the City that provide a variety of programs and services for the community. an opportunity to grow under the sustained guidance of dedicated adults; to instill in youth a respect and understanding for law enforcement officers and for the laws they uphold; to assist youth in developing self-esteem and provide them with skills to help them stay in school; and involve police, parents, and community volunteers in a personal commitment of time, talents, and energy to the youth of the community. City Corps Program. The City of Oxnard s City Corp program provides youth ages 13 to 21 with opportunities for personal growth through community service. Initially operated as a special project under the City s Summer Youth Employment and Training Program, the program expanded its scope to provide year-round work-based learning opportunities. In coordination with 55 agencies and organizations, City Corp provides work and service learning opportunities to youth, provided work and service learning opportunities to 2,566 youth in 2004, planned and implemented 1,255 projects during 2004, won the 2005 Helen Putnam Award from the California League of Cities Community and Senior Centers There are eight community facilities within the City that provide a variety of programs and services for the community, as presented in Table The Oxnard Performing Arts and Convention Center (PACC) provides ample room for business and entertainment events. This center includes a 1,600- seat performing arts auditorium and eight additional meeting rooms. The PACC can accommodate events of up to 4,000 people. Parking for approximately 500 people is available adjacent to the facility. Additional community facilities and programs are also provided at the South Oxnard Center. The City also provides specialized services for youth and senior residents at several designated facilities located throughout the City. Oxnard s Neighborhood Youth Centers offer a variety of activities for youth ages 6 to 17. Activities include sports, arts, crafts, excursions, special events, movies, and homework assistance. The City of Oxnard operates three Senior Centers providing meal services, education, counseling, recreation, and general meeting facilities for senior residents within the community. The following programs are offered at the various senior centers: Page Background Report April Oxnard_GP_Public_Facilities_and_Services_2006_04 20 MRD.doc
253 Draft 4. Infrastructure and Community Services Table 4-30 Community, Youth Activity, and Senior Centers Facility Location Size (sf) Features Community Centers Performing Arts Center South Oxnard Center 800 Hobson Way 200 E. Bard Road 19,000 1,604-seat theatre, eight meeting rooms Youth Centers Colonia Park Youth Center 197 N. Marquita Various youth activities Durley Park Youth Center 850 Hill Street Various youth activities Southwinds Park Youth Various youth activities 300 West Clara Center Senior Centers South Oxnard Center Wilson Senior Center Colonia Senior Center 200 E. Bard 350 North C Street 126-B Amelia Court Source: City of Oxnard Parks and Recreation Department, December 2005 Retired Senior Volunteer Program (RSVP). Through the RSVP program, Oxnard residents 55 and older provide public service within the community. In 2004, approximately 600 RSVP volunteers provided over 90,000 hours of service in a diverse assortment of public agencies, nonprofit organizations, and faith-based groups. Services provided include entertaining fellow seniors at the City s senior centers, mentoring at-risk youths, tutoring at City libraries, and working at local area food banks preparing and serving food. Activity space, multi-purpose room with kitchen, administrative offices, day care/classrooms, branch library, facility rental available Nutrition program, senior exercise, tai-chi, hula dancing (hula, Latin line, ballroom, century, western line), BG s dance group, FOOD share (brown bag), speakers, potlucks, birthday celebrations, St. John s Wellness Clinic, Clincas Del Camino, Grey Law legal advice, Health Insurance Counseling and Advocacy Program (HICAP) health insurance counseling PACE (People with Arthritis Can Exercise), Braille living skills, Alzheimer s Association, bridge, bingo, St. John s clinic, rug and needlework group, Grey Law legal advice, HICAP health insurance counseling, Better Breathers Club, Braille low vision consultant, Veteran s affairs consultant, rubber stamp class, tri-counties regional center foster grandparents club, game room Exercise class, music day, speakers, Bingo, walkers club, HICAP health insurance counseling Senior Vegetable Garden. Garden plots at the Senior Vegetable Garden are available to Oxnard residents 60 years or older. The garden is located on Pleasant Valley Road next to the Fire Station 2. April 2006 Background Report Page Oxnard_GP_Public_Facilities_and_Services_2006_04 20 MRD.doc
254 City of Oxnard General Plan Draft Adaptive Recreation Program. The Adaptive Recreation Program is designed to provide social and recreational opportunities for the developmentally disabled. Oxnard Joslyn Lawn Bowls Club. The Oxnard-Joslyn Lawn Bowls Green is located within Wilson Park in central Oxnard. This club provides opportunities for individuals to watch or engage in lawn bowling. Classes are available to guests at no charge. Oxnard Excusions. The Senior Services Program offers mini-excursions throughout Southern California and nearby states for adults age 60 years or older. Previous excursions have included trips to the art exhibits, festivals, the Laughlin Riverside Resort and Casino, and Newport Harbor Christmas Boat Parade. Energizer s Program. Offered in cooperation with the City of Oxnard and the St. Johns Regional Medical Center, the Energizer s walking program provides opportunities for older residents to continue physical activity. Health information, including blood pressure, blood sugar, and pulse checks, are provided to encourage healthy and safe exercise Additional Recreation Opportunities Numerous additional recreation opportunities exist within the City. These opportunities include performing arts, museums, and cultural centers and are provided by local non-profit and private organizations. Given Oxnard s coastal location, activities extending outside city boundaries, including whale watching, water sports, fishing, and other activities are also available from numerous businesses. Additional recreational opportunities and activities include the following: Elite Theatre Company (founded in 1994, community theatre company) Gull Wing s Children Museum Henry T. Oxnard Historic District (10 tree-line blocks of F and G Streets, added to National Register of Historic Places in 1999) Heritage Square (15 restored/replicated early 20 th century buildings) Otis Chandler Vintage Museum Murphy Automotive Museum Inlakech Cultural Center (showcases Latino community) Page Background Report April Oxnard_GP_Public_Facilities_and_Services_2006_04 20 MRD.doc
255 Draft 4. Infrastructure and Community Services Special events Numerous special events occur within the City throughout the year. These events celebrate a variety of cultural, historical, and seasonal topics and represent the diversity of the community. Some events, such as the Dallas Cowboys Training Camp, draw national attention and bring numerous visitors from across the nation to Oxnard. Highlights of events occurring throughout the year include the following: Annual Celebration of the Whales (Dec-Mar) Youth Mariachi Festival (Apr) Strawberry Festival (May) Fiestas Filipinas (Jun) Salsa Festival (Jul) Dallas Cowboys Training Camp (Aug) Concerts by the Sea (Aug) Independent Film Festival (Sept) Multi-Cultural Festival (Oct) Dia de Los Muertos (Oct) Holiday Parade / Tree Lighting (Dec) Parade of Lights (Dec) April 2006 Background Report Page Oxnard_GP_Public_Facilities_and_Services_2006_04 20 MRD.doc
256 City of Oxnard General Plan Draft Please see next page. Page Background Report April Oxnard_GP_Public_Facilities_and_Services_2006_04 20 MRD.doc
257 5. Environmental Resources 5.1 Introduction In and effort to identify and understand the key natural resources of the City of Oxnard, this chapter is divided into the following discussions: Biological Resources (5.2) Aesthetic Resources (5.3) Cultural Resources (5.4) Agricultural and Soil Resources (5.5) Mineral Resources (5.6) Air Quality (5.7) Energy Conservation (5.8) 5.2 Biological Resources The City s Planning Area contains a variety of biological communities which provide habitat for both rare and common species. This section describes key biological resources, including sensitive natural communities and special status species. The results of this assessment may be used in planning and management decisions that may affect biological resources in the Planning Area. Methods This evaluation of biological resources includes a review of vegetation and wildlife habitat, special-status species, and jurisdictional waters of the United States that occur or potentially occur at or in the vicinity of the Planning Area. The results of this assessment are based upon field reconnaissance of the Planning Area, literature searches, and database queries. The sources of reference data reviewed include the following: U.S. Fish and Wildlife Service (USFWS) Species List for Ventura County Oxnard s open space is comprised of a unique diversity of habitats including coastal beaches, wetlands, riparian areas, and dune areas. California Natural Diversity Database (CNDDB), Rarefind 3 computer program for the Plan Area and a 5-mile radius beyond the Plan Area April 2006 Background Report Page Oxnard_GP_Environmental_Resources_2006_04_20 MRD.doc
258 City of Oxnard General Plan Draft California Native Plant Society (CNPS), Electronic Inventory computer program for the following USGS quadrangles: Oxnard, Saticoy, Santa Paula, Ventura, Camarillo, and Point Mugu, California California Department of Fish and Game (CDFG) Special Vascular Plants, Bryophytes, and Lichens List CDFG Special Animals List California Department of Forestry and Fire Protection Multi-source Land Cover Data v2 United States Geological Survey (USGS) Digital Orthophoto Quarter Quadrangles Key Terms Sensitive Natural Community. A sensitive natural community is a biological community that is regionally rare, provides important habitat opportunities for wildlife, are structurally complex, or are in other ways of special concern to local, State, or Federal agencies. The California Environmental Quality Act (CEQA) identifies the elimination or substantial degradation of such communities as a significant impact. The CDFG tracks sensitive natural communities in the California Natural Diversity Database. Examples of sensitive natural communities in the Planning Area include Southern California Coastal Lagoon, Coastal and Valley Freshwater Marsh, Southern Coast Live Oak Riparian Forest, Southern Coastal Salt Marsh, Southern Sycamore Alder Riparian Woodland, Valley Needlegrass Grassland, and Southern Riparian Scrub. Some special-status species receive specific protection that is defined by Federal or State endangered species legislation. Special-Status Species. Special-status species are those plants and animals that, because of their recognized rarity or vulnerability to various causes of habitat loss or population decline, are recognized for protection by Federal, State, or other agencies. Some of these species receive specific protection that is defined by Federal or State endangered species legislation. Others have been designated as "sensitive" on the basis of adopted policies and expertise of State resource agencies or organizations with acknowledged expertise, or policies adopted by local governmental agencies such as counties, cities, and special districts to meet local conservation objectives. These species are referred to collectively as "special status species" in this document, following a convention that has developed in practice but has no official sanction. For the purposes of this assessment, the term special-status includes those species that are: Federally listed or proposed for listing under the Federal Endangered Species Act (50 CFR ); Page 5-2 Background Report April Oxnard_GP_Environmental_Resources_2006_04_20 MRD.doc
259 Draft 5. Environmental Resources Candidates for listing under the Federal Endangered Species Act (61 FR ); State listed or proposed for listing under the California Endangered Species Act (14 CCR 670.5); Species listed by the U.S. Fish and Wildlife Service (USFWS) or the California Department of Fish and Game (CDFG) as a species of concern (USFWS), rare (CDFG), or of special concern (CDFG); Fully protected animals, as defined by the State of California (California Fish and Game Code Section 3511, 4700, and 5050); Species that meet the definition of threatened, endangered, or rare under CEQA (CEQA Guidelines Section 15380); Plants listed as rare or endangered under the California Native Plant Protection Act (California Fish and Game Code Section 1900 et seq.); and Plants listed by the California Native Plant Society (CNPS) as rare, threatened, or endangered (List 1A and List 2 status plants in Skinner and Pavlik 1994). Wetlands and Other Waters of the U.S. Wetlands are ecologically complex habitats that support a variety of both plant and animal life. In a jurisdictional sense, the Federal government defines wetlands in Section 404 of the Clean Water Act as areas that are inundated or saturated by surface or ground water at a frequency and duration sufficient to support (and do support, under normal circumstances) a prevalence of vegetation typically adapted for life in saturated soil conditions (33 CFR 328.3[b] and 40 CFR 230.3). Under normal circumstances, the Federal definition of wetlands requires three wetland identification parameters be present: wetland hydrology, hydric soils, and hydrophytic vegetation. Examples of wetlands include saline and freshwater marshes, seasonal wetlands, and vernal pool complexes that have a hydrologic link to other waters of the U.S (see definition below for "other waters of the U.S."). The U.S. Army Corps of Engineers (Corps) is the responsible agency for regulating wetlands under Section 404 of the Clean Water Act, while the Environmental Protection Agency (EPA) has overall responsibility for the Act. The Federal definition of wetlands requires three wetland identification parameters: wetland hydrology, hydric soils, and hydrophytic vegetation. Other waters of the U.S. refers to those hydric features that are regulated by the Clean Water Act but are not wetlands (33 CFR 328.4). To be considered jurisdictional, these features must exhibit a defined bed and bank and an ordinary high-water mark. Examples of other waters of the U.S. include rivers, creeks, intermittent and ephemeral channels, ponds, and lakes. April 2006 Background Report Page Oxnard_GP_Environmental_Resources_2006_04_20 MRD.doc
260 City of Oxnard General Plan Draft The CDFG does not normally have direct jurisdiction over wetlands unless they are subject to jurisdiction under Streambed Alteration Agreements or they support State-listed endangered species; however, CDFG has trust responsibility for wildlife and habitats pursuant to California law. Examples of jurisdictional waters that occur in the Planning Area would include the Santa Clara River, Beardsley Wash/Revolon Slough, McGrath Lake, Ormond Beach Lagoon (a seasonal wetland feature), and other potentially jurisdictional features such as agricultural and urban drains, especially where they replaced natural waterways Regulatory Setting Relevant Federal, State, and local guidelines specific to biological resource issues are discussed in this section. Federal Regulations Clean Water Act Section 404. Wetlands and other waters of the U.S. (as defined above) are subject to jurisdiction by the Corps and EPA under Section 404 of the Clean Water Act. Wet areas that are not regulated by this act would include stock watering ponds, agricultural ditches created in upland areas, and isolated wetlands that do not have a hydrologic link to other waters of the U.S., either through surface or subsurface flow. The discharge of fill into a jurisdictional feature requires a permit from the Corps. The Corps has the option to issue a permit on a case-by-case basis (individual permit) or at a program level (general permit). Nationwide permits (NWPs) are an example of general permits; they cover specific activities that generally have minimal environmental effects. Activities covered under a particular NWP must fulfill several general and specific conditions, as defined by the NWP. If a proposed project cannot meet these conditions, an individual permit may be required. Federal Endangered Species Act. The USFWS administers the Federal Endangered Species Act (16 USC Section 153 et seq.) and thereby has jurisdiction over federally listed threatened, endangered, and proposed species. Projects that may result in take of a listed species must consult with the USFWS. Federal agencies that propose a project that may affect a listed species are required to consult with the USFWS under Section 7 of the Federal Endangered Species Act. If it is determined that a federally listed species may be adversely affected by the Federal action, the USFWS will issue a Biological Opinion to the Federal agency that describes minimization and avoidance measures that must be implemented as part of the Federal action. Projects that do not have a Federal nexus must Page 5-4 Background Report April Oxnard_GP_Environmental_Resources_2006_04_20 MRD.doc
261 Draft 5. Environmental Resources apply for a take permit under Section 10 of the Act. Section 10 of the Act requires that the project applicant prepare a habitat conservation plan as part of the permit application. Under the Federal Endangered Species Act the USFWS designates critical habitat, areas that are essential for the conservation of a threatened or endangered species and which may require special management considerations. A designation only applies to projects with a Federal nexus; it has no specific regulatory impact on landowners who take actions on their land that do not involve Federal funding. However, Federal agencies must consult with the USFWS before taking actions that could harm or kill protected species or destroy their habitat. Migratory Bird Treaty Act, Bald and Golden Eagle Protection Act. The Migratory Bird Treaty Act (MBTA, 16 USC Section ) and the Bald and Golden Eagle Protection Act (16 USC Section 668) protect certain species of birds from direct take. The MBTA protects migrant bird species from take through the establishment of hunting limits and seasons and protecting occupied nests and eggs. The Bald and Golden Eagle Protection Act prohibits the take or commerce of any part of these species. The USFWS administers both acts, and reviews Federal agency actions that may affect species protected by the acts. State Regulations California Fish and Game Code Sections The CDFG regulates the modification of streams, rivers, and lakes under Sections of the California Fish and Game Code. Modification includes diverting, obstructing, or changing the natural flow or bed, channel, or bank of a regulated feature. While most of the features regulated by the Fish and Game Code meet the definition of other waters of the U.S., the Code may regulate some ephemeral features that do not have all the criteria to qualify as other waters of the U.S. A project proponent, including both private parties and public agencies, proposing an activity that may modify a feature regulated by the Fish and Game Code must notify the CDFG before project construction. The CDFG will then decide whether to enter into a Streambed Alteration Agreement with the project proponent. California Endangered Species Act. The CDFG administers the California Endangered Species Act of 1984 (Fish and Game Code Section 2080), which regulates the listing and take of endangered and threatened species. A take may be permitted by CDFG through implementing a management agreement. Under the State laws, the CDFG is empowered to review projects for their potential impacts to listed species and their habitats. California also designates Species of Special Concern which are species of limited distribution, declining populations, diminishing habitat, or unusual scientific, recreational, or educational value. April 2006 Background Report Page Oxnard_GP_Environmental_Resources_2006_04_20 MRD.doc
262 City of Oxnard General Plan Draft CDFG maintains lists for Candidate-Endangered Species (SCE) and Candidate-Threatened Species (SCT). California candidate species are afforded the same level of protection as listed species. California also designates Species of Special Concern (CSC) which are species of limited distribution, declining populations, diminishing habitat, or unusual scientific, recreational, or educational value. These species do not have the same legal protection as listed species, but may be added to official lists in the future. The CSC list is intended by CDFG as a management tool for consideration in future land use decisions. Local Regulations Oxnard 2020 General Plan. The combined Open Space/Conservation Element s of the City s existing General Plan contains several Natural Resources policies pertinent to biological resources Environmental Setting A description of the key wildlife habitats (including plant and wildlife species) found within the Planning Area is described in this section. The section begins with a brief description of the key wildlife habitats. Wildlife Habitats Wildlife habitats provide food, shelter, movement corridors, and breeding opportunities for a variety of wildlife species. Wildlife habitats provide food, shelter, movement corridors, and breeding opportunities for a variety of wildlife species. Habitats are classified in broad terms with an emphasis on vegetation structure, and include other elements such as vegetation species composition, soil structure, and water availability. Some wildlife species are generalists and may use a variety of habitats, while other species may be restricted to one habitat. Species that are restricted to a single habitat type are more susceptible to habitat loss than are generalists, and are more likely to experience population declines. These species are presented in greater detail later in this section. Habitats are not distinct features that can be managed in isolation from each other. More common wildlife species, such as red-shouldered hawk (Buteo lineatus), great-horned owl (Bubo virginianus), northern flicker (Colaptes auratus), brown-headed cowbird (Molothrus ater), raccoon (Procyon lotor), and western toad (Bufo boreas) frequently use more than one habitat type. They may use riparian habitat for breeding sites, resting sites, cover while moving from one area to another, or thermal cover, and range into open upland grasslands, scrub, or over open water to forage. Frequently it is at the edges of habitats, or where they transition from one habitat to another, that the greatest number of these more common wildlife species will be found. Page 5-6 Background Report April Oxnard_GP_Environmental_Resources_2006_04_20 MRD.doc
263 Draft 5. Environmental Resources The Planning Area contains mostly human-modified habitats (see Figure 5-1). The vast majority of these areas include urban, industrial, or agricultural production areas. In some areas (especially in the northern part of the Planning Area), a series of industrial oil fields within agricultural lands exists. Native habitats exist mostly on the edges of the Planning Area (i.e., Santa Clara River, coastal areas, etc.) where they experience fairly heavy recreational pressure. These habitats, as classified in California Habitats (CDFG, 2000), are listed and briefly described below. Habitats present in the Plan Area, and acreage calculations, are based on the California Department of Forestry and Fire Protection s Multi-source Land Cover Data v2 (2002) which was re-classified following a reconnaissance survey and using aerial photo interpretation. A summary of the acreages for each habitat type are provided below in Table 5-1 below. Table 5-1 Summary of Habitats, Oxnard Planning Area Habitat Type Acreage Urban 18,250 Agriculture 23,650 Eucalyptus 30 Valley Foothill Riparian 930 Coastal Scrub and Mixed Chaparral 470 Coastal Oak Woodland 20 Annual Grassland 130 Saline Emergent Wetland 190 Marine (intertidal zone) 440 TOTAL 44,110 Notes: Source: Barren, Fresh Emergent Marsh, Lacustrine, Riverine, and Estuarine habitats occur in patches too small to have been mapped California Department of Forestry and Fire Protection s Multi-source Land Cover Data, 2002 Urban. Large portions of the Planning Area (roughly 18,250 acres) are best characterized as urban habitat. A distinguishing feature of the urban wildlife habitat is the mixture of native and exotic species. This habitat type varies structurally, and can be categorized into three zones: downtown, urban residential, and suburbia. Downtown, the most heavily developed, is usually at the center, followed by concentric zones of decreasing development and increasing vegetative cover through urban residential to the suburbs. Both native and exotic plant species are valuable, with exotic species providing a good source of additional food in the form of fruits and berries, and cover. Wildlife species richness and diversity increases along this same gradient. These areas provide cover and foraging opportunities for some wildlife species, especially those adapted to human disturbance. Common examples include raccoon (Procyon lotor), Virginia opossum (Didelphis virginiana), striped skunk (Mephitis mephitis), northern mockingbird (Mimus polyglottos), mourning Common wildlife species found in the urban areas include raccoon, opossum, skunk, northern mockingbird, mourning dove, and black-bellied slender salamander. April 2006 Background Report Page Oxnard_GP_Environmental_Resources_2006_04_20 MRD.doc
264 City of Oxnard General Plan Draft dove (Zenaida macrocoura), Anna s hummingbird (Calypte anna), wrentit (Chamaea fasciata), and black-bellied slender salamander (Battrachoseps nigriventris). Irrigated Row and Field Crops. Even larger portions of the Planning Area (about 23,650 acres) contain agricultural habitats. As shown in Figure 5-1, these agricultural habitats are included within both the existing City limits and within surrounding lands that comprise the City s Planning Area. Vegetation in this habitat includes a variety of sizes, shapes and growing patterns, with individual locations representing various intensities of use that range from highly farmed to more fallow agricultural uses. Plants may be either annual (e.g. lettuce) or perennial (e.g. strawberries), and when grown in rows provide a varying amount of bare ground between rows. Annual crops are usually planted in spring and harvested in summer or fall. However, they may be planted in rotation with other irrigated crops. In some areas of southern California three crops may be grown in a year. For example, on the Oxnard plain, cool weather crops such as lettuce and cabbage are grown in the fall and winter followed by tomatoes, corn, or peppers in the spring and summer. Crops are typically grown on the most fertile soils, and have lower habitat values than the native habitats they replace. However, many species of rodents and birds have adapted to agricultural areas. Croplands provide food and water for these species, but do not generally provide long-term shelter due to the frequency of disturbance. Although used as a food source for some bird species, the sticky gum produced by Eucalyptus can effectively glue shut the bills of some bird species. Eucalyptus. About 30 acres of this habitat occurs in windbreaks, small copses, and within riparian habitats located throughout the Planning Area. Usually only one or to species of Eucalyptus trees occur together. Although planted for horticultural values and as windbreaks, these non-native trees will invade and displace native habitats (e.g. riparian habitat). Raptors such as red-shouldered hawk may nest in Eucalyptus, which also serves as a food source for birds such as Anna s hummingbird and yellow-rumped warbler; however, sticky gum produced by Eucalyptus can effectively glue shut the bills of birds foraging on nectar, resulting in their death (William, 2002). Monarch butterflies commonly use large stands of Eucalyptus trees for roosts along the California Coast. Valley Foothill Riparian. Within the Planning Area, riparian habitat occurs over an estimated 930 acres mostly along the Santa Clara River, and to a lesser extent along other waterways such as Calleguas Creek and Revolon Slough. This habitat is principally composed of a sparse cottonwood overstory and a dense willow subcanopy mixed with introduced giant reed, Myoporum, and tamarisk. Many species of wildlife use this habitat type for movement corridors, foraging, cover, and Page 5-8 Background Report April Oxnard_GP_Environmental_Resources_2006_04_20 MRD.doc
265 Draft 5. Environmental Resources Figure 5-1 Habitats April 2006 Background Report Page Oxnard_GP_Environmental_Resources_2006_04_20 MRD.doc
266 Santa ClaraRiver W ELL S R D LOS ANG ELES AVE N YAR D V VI E A E Beardsley OXNARD BLVD 101 5TH ST R evolon C hanne l 1 W N S E Legend General Plan Area HABITATS Agriculture Annual Grassland Barren Coastal Oak Woodland Coastal Scrub Eucalyptus Source: USGS, 1993;; FRAP, 2002;; City of Oxnard, 2005;; and ESA, 2006 Marine Mixed Chaparral Saline Emergent Wetland Urban Valley Foothill Riparian Water Figure 5-1 Habitats within the Planning Area Miles
267 City of Oxnard General Plan Draft (Back of 5-1) Page 5-10 Background Report April Oxnard_GP_Environmental_Resources_2006_04_20 MRD.doc
268 Draft 5. Environmental Resources breeding. Recent estimates of this habitat remaining in California range from 2 15%; native riparian habitats have been recognized as an important component of properly-functioning ecosystems, and have been identified as the most important habitat to land-bird species (RHJV, 2000). Coastal Scrub and Mixed Chaparral. These fairly open habitats occur over a small (470 acres) area in the northwest part of the Planning Area, in rear dunes between the coast and agricultural lands. They are principally composed of a discontinuous canopy of coyote brush, California sagebrush, and iceplant with a mixed herbaceous layer. They provide foraging habitat for many species of wildlife, and breeding habitat for a more limited number of common species such as California ground squirrel and white-crowned sparrow. Coastal sage scrub also supports more than 100 species of plants and animals that are considered rare, sensitive, threatened, or endangered by California or U.S. Federal wildlife agencies (Atwood 1993, McCaull 1994 in CalPIF. 2004). Coastal Oak Woodland. Several small inclusions of this habitat are mapped within the Valley Foothill Riparian on the Santa Clara River, and in the vicinity of Mandalay Beach. About 20 acres occurs within the Planning Area. The structure of this habitat is extremely variable. Within the Planning Area Coastal Oak Woodland provides habitat values similar to Valley Foothill Riparian and Coastal Scrub. Annual Grassland. This habitat is annual herbaceous vegetation with little structural complexity. Within the Planning Area it is composed of the non-native grasses series, which occurs in small areas on fallowed fields and other unused and disturbed ground. It is a minor type (mapped at about 130 acres) of habitat within the Planning Area. Fresh Emergent Marsh. This habitat is composed of bulrush and cattail, and occurs in small patches throughout the Planning Area within suitable aquatic areas. Fresh Emergent Marsh occurs in patches too small to have been mapped for the purpose of this document, but is associated with freshwater systems within the Planning Area. Examples include the eastern edge of McGrath Lake, within the estuary of the Santa Clara River, and in un-lined portions of Revolon Slough. This habitat provides important cover and nest or nursery sites for aquatic-associated wildlife species such as waterfowl. Saline Emergent Marsh. This habitat occurs in about 190 acres of undeveloped coastal areas within the Planning Area, and is characterized by pickleweed (Salicornia) and saltgrass (Distichlis) vegetation. The majority of saline emergent wetlands occur at the terminus of the Hueneme and Industrial Drains, which flow to the coast between Port April 2006 Background Report Page Oxnard_GP_Environmental_Resources_2006_04_20 MRD.doc
269 City of Oxnard General Plan Draft Hueneme and the Edison power plant to the south. This habitat type has been severely reduced throughout California. As a consequence, the populations of a large number of wildlife species, including many special status species dependent on this habitat have also declined. Altered hydrologic regimes (i.e., freshwater input, artificial breaching of the sandbars) can alter the functioning of these areas of saline emergent marsh. Saline Emergent Marsh habitats are use extensively by a variety of waterfowl species. Factors affecting the health of the Santa Clara River include water diversions, agricultural/urban runoff, inchannel gravel/sand mining, and non-native species invasions. Lacustrine. This open water habitat type is fairly limited within the Planning Area (with patches too small to have been mapped for the purpose of this document), and occurs where agricultural drains back up behind sandbars at their mouths. McGrath Lake, at the southern end of the park, is an example of a 10-acre back-dune lake that receives agricultural runoff from farming activities east of Harbor Boulevard. This habitat consists of open water, which is bordered by fresh emergent marsh. Lacustrine habitat typically provides roosting and foraging opportunities for wildlife. Near marine environments, they also provide bathing opportunities to wildlife. Under conditions where pollutants accumulate in lakes or ponds, they can become a hazard to wildlife using the habitat. Riverine. The Santa Clara River is the longest free-flowing river in Southern California and is one of the few remaining rivers in the area that remain in a relatively natural state. The total river length is approximately 70 miles, extending from its headwaters at Mount Pinos to the Santa Clara River Estuary adjacent to McGrath State Beach. In the lower 30-mile stretch in Ventura County, the channel becomes wide and sandy. The bed and banks in the lower reaches are composed of unconsolidated sand and gravel, which are easily eroded, and are mapped as barren habitat. Historically, the floodplain of the river contained a dense riparian zone with marshy areas. Agricultural land reclamation and urban development throughout the 1900 s have resulted in a narrowing of the river and its riparian area and a concurrent increase in erosion damage in the floodplain (PWA, 1996). Current aquatic habitat values in the floodplain reaches are low, primarily due to very low to entirely absent surface flows during most of the year. The construction of a 20-foot tall concrete diversion dam, Vern Freeman Diversion Dam near Saticoy, was completed in 1991 and replaced the temporary diversion dikes used at this location since the 1920 s. The dam is operated by the UWCD and delivers water to underground recharge basins via percolation areas. The dam is equipped with a fish ladder to enhance steelhead passage, but the National Marine Fisheries Service (NMFS) is currently reviewing the operation and design of the fish ladder. Page 5-12 Background Report April Oxnard_GP_Environmental_Resources_2006_04_20 MRD.doc
270 Draft 5. Environmental Resources In addition to water diversions and steelhead migration issues, other stressors on the Santa Clara River include water quality problems associated with agricultural and urban runoff, in-channel gravel and sand mining, and non-native species invasions. Estuarine. Principally unvegetated, this habitat occurs at the mouth of the Santa Clara River. It is characterized by a mixing of freshwater and saltwater influences, and is a rich source of phyto- and zooplankton. These plankton form the basis of a rich food web which support a wide variety of wildlife species, including steelhead, terns, shorebirds, and waterfowl. This is a dynamic habitat, due to seasonal flooding and breaching of the sandbar at the mouth of the river. Depending on the timing of flooding, breaching, and tides, it can form a large lagoon or mudflats. The Santa Clara River mouth, including the estuary (as lagoon and mudflats), riparian vegetation, and adjacent beach and dunes has been designated as a California Important Bird Area (Cooper, 2001). Marine. This unique habitat extends from the ocean to the upper limit of the unvegetated shore and comprises four zones. The pelagic zone is characterized by open water with depths greater than required for growth of canopy-forming kelps and extends offshore 12-miles. The subtidal zone includes the area from the depth that supports canopy forming kelps to the low-low tide line. The intertidal zone includes the area exposed by lowest-low tide up to and including the spray zone. Finally, the shore zone consists of any barren land between the spray zone to where terrestrial vegetation exceeds 10 percent canopy closure and may vary in width from a few feet to several hundred meters. The intertidal zone covers about 440 acres in the Planning Area. This zone provides foraging opportunities for shorebirds and opportunistic feeders such as crows, ravens, turkey vultures, and, historically, California condor. The shore zone extends from the spray zone inland to vegetated habitat. Sand dunes and salt flats are included in the shore zone, including areas where vegetation cover is sparse. Wildlife that use salt flats and dunes for breeding, roosting, or foraging (including the federally-listed western snowy plover and California least tern) find cover under or near drift wood and other debris deposited by high tides and moved by wind. Seed-eating small mammals and birds find forage in vegetated portions of the shore zone. Much of this habitat experiences strong recreation pressure on both public and private land. April 2006 Background Report Page Oxnard_GP_Environmental_Resources_2006_04_20 MRD.doc
271 City of Oxnard General Plan Draft Table 5-2 Species PLANTS Aphanisma (Aphanisma blitoides) Ventura Marsh milkvetch (Astragalus pycnostachyus var. lanosissimus) South coast saltscale (Atriplex pacifica) Plummer s mariposa lily (Calochortus plummerae) Late-flowered mariposa lily (Calochortus weedii var. vestus) Santa Barbara morning-glory (Calystegia sepium ssp. binghamiae) Southern tarplant (Centromadia parryi ssp. australis) Orcutt s pincushion (Chaenactis glabriuscula var. orcuttiana) San Fernando Valley spineflower (Chorizanthe parryi var. fernandina) Salt marsh bird s-beak (Cordylanthus maritimus ssp. maritimus) Dune larkspur (Delphinium parryi ssp. blochmaniae) Special Status Species in the Planning Area Special status plant and wildlife species known or having the potential to occur in the Planning Area is provided below in Table 5-2. Information in the table includes a brief description of each species along with a list of habitat areas where the species may occur. Special Status Plant and Wildlife Species as of 2005, Known or Having Potential to Occur in the Planning Area Plan Area Habitat Status Associations Species Notes List 1B FE, CH, CE, List 1B List 1B List 1B List 1B Coastal Scrub and Mixed Chaparral, Marine Saline Emergent Marsh, Marine Coastal Scrub and Mixed Chaparral Urban, Irrigated Row and Field Crops, Eucalyptus, Valley Foothill Riparian, Coastal Scrub and Mixed Chaparral, Coastal Oak Woodland, Annual Grassland Coastal Scrub and Mixed Chaparral, Coastal Oak Woodland List 1A Saline Emergent Marsh Found in coastal marshes. List 1B List 1B Annual Grassland, Fresh Emergent Marsh Coastal Scrub and Mixed Chaparral, Marine Found in coastal bluff scrub, coastal dunes, and coastal scrub. Prefers bluffs and slopes near the ocean in sandy or clay soils. Found from meters. Found in coastal salt marshes. Mostly within reach of high tide or protected by barrier beaches. More rarely found near seeps on sandy bluffs. From 1-35 meters. In coastal scrub, coastal bluff scrub, playas, and chenopod scrub. Found in coastal scrub, chaparral, valley and foothill grassland, cismontane woodland, lower montane coniferous forest. Occurs on rocky and sandy sites, usually made of granite or alluvial material. Can be very common after fires meters. In chaparral and cismontane woodland that may be dry and open. Found on serpentine soils meters. Marshes and margins of swamps, valley and foothill grassland, vernal pools. Often in disturbed sites near the coast. Also in alkaline soils sometimes with saltgrass meters. Found in coastal bluff scrub and coastal dunes meters. FC, CE Coastal Scrub Coastal scrub, sandy soils meters. Two populations known, from Ahmanson Ranch in Ventura County and Newhall Ranch in Los Angeles County FE, CE, List 1B List 1B Saline Emergent Marsh, Marine Coastal Scrub and Mixed Chaparral, Marine Found on coastal dunes and the higher zones of coastal salt marsh habitat meters. Found in chaparral, rocky areas, and coastal dunes meters. Page 5-14 Background Report April Oxnard_GP_Environmental_Resources_2006_04_20 MRD.doc
272 Draft 5. Environmental Resources Table 5-2 Special Status Plant and Wildlife Species as of 2005, Known or Having Potential to Occur in the Planning Area (Continued) Plan Area Habitat Species Status Associations Species Notes Slender-horned spineflower (Dodecahema (=Centrostegia) leptoceras) FE, CE Coastal Scrub and Mixed Chaparral Found in chaparral and coastal scrub, usually Alluvial fan sage scrub and flood deposited terraces and washes; meters. Northern harrier (Circus cyaneus) Western yellow-billed cuckoo (Coccyzus americanus occidentalis) Yellow warbler (Dendroica petechia) White-tailed kite (Elanus leucurus) Southwestern willow flycatcher (Empidonax traillii extimus) California horned lark (Eremophila alpestris) California condor (Gymnogyps californianus) Bald eagle (Haliaeetus leucocephalus) Yellow-breasted chat (Icteria virens) Western least bittern (Ixobrychus exilis) Loggerhead shrike (Lanius ludovicianus) Long-billed curlew (Numenius americanus) CSC Irrigated Row and Field Crops, Annual Grassland, Fresh Emergent Marsh, Saline Emergent Marsh Breeds on the ground in moist grasslands, forages over marsh, grasslands, dunes, and agricultural land. CE Valley Foothill Riparian Historic breeding records on the lower Santa Clara River from the early 1920 s and Recent sightings are reported on the Santa Clara River near the Ventura/Los Angeles County lines (Cooper, 2001). CSC Valley Foothill Riparian On the central California coast, typically breeding in riparian woodlands.. CFP Irrigated Row and Field Breeds in tall shrubs and trees with thick canopy. Forages Crops, Eucalyptus, Valley over open grasslands and agricultural land. Foothill Riparian, Coastal Oak Woodland, Annual Grassland FE, CH, CSC Valley Foothill Riparian There are no records from the lower Santa Clara River, but potentially suitable breeding habitat exists in the riparian area adjacent to the river (SCREMP, 1996). CSC Irrigated Row and Field Crops, Annual Grassland Short-grass prairie, "bald" hills, mountain meadows, open coastal plains, fallow grain fields, alkali flats. FE, CH, Coastal Scrub and Mixed Require vast expanses of open savannah, grasslands, and CE Chaparral, Annual foothill chaparral in mountain ranges of moderate altitude. Grassland, Marine Deep canyons containing clefts in the rocky walls provide nesting sites. Forages up to 100 miles from roost/nest. Historically foraged in coastal habitats. FT, CE Riverine, Estuarine Nests in large trees with open branches along reservoir, lake and river margins, usually within one mile of water. Forages over water and wetlands of reservoirs, lakes, rivers, and streams. CSC Valley Foothill Riparian Breed in dense riparian thickets with tall trees for perches. CSC Fresh Emergent Marsh Breeds in freshwater marsh with dense cattails. CSC CSC Irrigated Row and Field Crops, Coastal Scrub and Mixed Chaparral, Coastal Oak Woodland, Annual Grassland Irrigated Row and Field Crops, Annual Grassland, Fresh Emergent Marsh, Saline Emergent Marsh, Estuarine, Marine Breeds in shrubs and small trees, forages for insects and small vertebrates in open habitats such as grasslands and agricultural land. Forages in winter on mudflats, lagoon, beaches and moist agricultural land. April 2006 Background Report Page Oxnard_GP_Environmental_Resources_2006_04_20 MRD.doc
273 City of Oxnard General Plan Draft Table 5-2 Special Status Plant and Wildlife Species as of 2005, Known or Having Potential to Occur in the Planning Area (Continued) Plan Area Habitat Species Status Associations Species Notes Osprey (Pandion haliaetus) CSC Valley Foothill Riparian, Lacustrine, Riverine, Breeds in tall dead trees or on poles near permanent water sources. Forages for fish over open water. Belding s savannah sparrow (Passerculus sandwichensis beldingi) Blochman s dudleya (Dudleya blochmaniae ssp. blochmaniae) Coulter s goldfields (Lasthenia glabrata ssp. coulteri) Rayless ragwort (Senecio aphanactis) Estuary seablite (Suaeda esteroa) INVERTEBRATES Tiger beetle (Cicindela senilis frosti) Sandy beach tiger beetle (Cicinderela hirticollis gravida) Globose dune beetle (Coelus globosus) Monarch butterfly (Danaus plexippus) Wandering (=saltmarsh) skipper (Panoquina errans) Mimic tryonia (=California brackishwater snail) (Tryonia imitator) FISH Santa Ana sucker (Catostomus santaanae) Tidewater goby (Eucyclogobius newberryi) Estuarine, Marine CE Saline Emergent Marsh Recorded in McGrath State Beach in 1977, but population considered extirpated after saltmarsh at mouth of Santa Clara River was closed to tidal action (CNDDB, 2001). Also recorded in southern Plan Area. List 1B List 1B List 2 List 1B Coastal Scrub and Mixed Chaparral, Marine Annual Grassland, Fresh Emergent Marsh, Saline Emergent Marsh Valley Foothill Riparian, Coastal Scrub and Mixed Chaparral, Coastal Oak Woodland Fresh Emergent Marsh, Saline Emergent Marsh Found in coastal scrub, coastal bluff scrub, valley and foothill grassland, open rocky slopes in shallow clays over serpentine or in rocky areas with little soils meters. Coastal salt marshes, playas, valley and foothill grassland, and vernal pools. Prefer alkaline soils meters. Annual herb found in chaparral, woodland, and on alkaline substrate in coastal scrub habitat. Blooms Jan-Apr meters elevation. Found in coastal salt marshes with clay silt and sand substrates, and swamps. 0-5 meters. CEQA Estuarine, Marine Occasionally found on dry saline flats of estuaries and mudflats along the coast of Southern California. FSC MARINE Inhabits clean, dry, sandy areas which are bright and open. FSC Marine Inhabits coastal dunes CEQA Urban, Eucalyptus, Valley Foothill Riparian Feeds on milkweed plants in the Genus Asclepius and overwinters in large roosts in coastal central and southern California, using protected groves of trees CEQA Saline Emergent Marsh Found in Southern California coastal salt marshes. CEQA FT, CH, CSC Saline Emergent Marsh, Lacustrine, Estuarine Riverine Inhabit permanently submerged coastal lagoons, estuaries, and salt marshes from Sonoma County south to San Diego County. Salinity tolerant. Endemic to Los Angeles Basin south coastal streams. They are habitat generalists, but prefer sand-rubble-boulder bottoms, and cool clear water with algae. FE, CH Estuarine Found in brackish water habitats along the California coast from Agua Hedionda Lagoon, San Diego county, to the mouth of the Smith River. Page 5-16 Background Report April Oxnard_GP_Environmental_Resources_2006_04_20 MRD.doc
274 Draft 5. Environmental Resources Table 5-2 Special Status Plant and Wildlife Species as of 2005, Known or Having Potential to Occur in the Planning Area (Continued) Plan Area Habitat Species Status Associations Species Notes Unarmored threespine stickleback (Gasterosteus aculeatus williamsoni) FE, CE Riverine, Estuarine Found in weedy pools, backwaters, and among emergent vegetation at the stream edge in small southern California streams. Arroyo chub (Gila orcutti) Southern steelhead - southern California ESU (Oncorhynchus mykiss irideus) Arroyo toad (Bufo californicus) California red-legged frog (Rana aurora draytonii) REPTILES Silvery legless lizard (Anniella pulchra pulchra) Southwestern pond turtle (Emys marmorata pallida) Coast horned lizard (Phrynosoma coronatum) South coast garter snake (Thamnophis sirtallis ssp.) CSC Riverine, Estuarine Found within the Los Angeles Basin south coastal streams, in slow moving stream sections with mud or sand bottoms. Feed heavily on aquatic vegetation and associated invertebrates. FE, CH, CSC FE, CH, CSC FT, CH, CSC CSC CSC CSC CSC Riverine, Estuarine Valley Foothill Riparian, Riverine Fresh Emergent Marsh, Lacustrine Coastal Scrub and Mixed Chaparral, Marine Fresh Emergent Marsh, Lacustrine, Riverine Valley Foothill Riparian, Coastal Scrub and Mixed Chaparral, Riverine (on barren sand bars) Valley Foothill Riparian, Fresh Emergent Marsh, Lacustrine, Riverine The Federal listing refers to populations from Santa Maria River South to southern extent of range (San Mateo Creek in San Diego County) Found in semi-arid regions near washes or intermittent streams, including valley-foothill and desert riparian, desert wash, etc. In rivers with sandy banks, willows, cottonwoods, and sycamores, and loose gravelly areas of streams in drier parts of range. Historically found on coastal plain, distribution now limited mostly to headwater streams. Still or slow moving fresh or brackish water with emergent vegetation for breeding. The closest populations are in East Las Virgenes Creek near the Ventura and Los Angeles County line, and the Santa Monica Mountains National Recreation Area. Sandy or loose organic soils, especially with leaf litter; coastal dunes and scrub. Slow-moving to still, permanent water sources with upland areas of friable soils for nests. Open, especially sandy areas such as washes and flood plains. Marsh and upland habitats near permanent water with riparian vegetation. April 2006 Background Report Page Oxnard_GP_Environmental_Resources_2006_04_20 MRD.doc
275 City of Oxnard General Plan Draft Table 5-2 Species MAMMALS Townsend s (western) big-eared bat (Corynorhinus townsendii) South coast marsh vole (Microtus californicus stephensi) BIRDS Two-striped garter snake (Thamnophis hammondii) Cooper s hawk (Accipiter cooperi) Sharp-shinned hawk (Accipiter striatus) Ferruginous hawk (Buteo regalis) Tricolored blackbird (Agelaius tricolor) Burrowing owl (Athene cunicularia) Western snowy plover (Charadrius alexandrinus nivosus) Northern harrier (Circus cyaneus) Western yellow-billed cuckoo (Coccyzus americanus occidentalis) Yellow warbler (Dendroica petechia) Special Status Plant and Wildlife Species as of 2005, Known or Having Potential to Occur in the Planning Area (Continued) Plan Area Habitat Status Associations Species Notes CSC Irrigated Row and Field Crops, Valley Foothill Riparian, Coastal Scrub and Mixed Chaparral, Coastal Oak Woodland, Annual Grassland, Fresh Emergent Marsh, Saline Emergent Marsh, Lacustrine, Riverine, Estuarine Colonial species which uses caves and buildings. Forages over a wide range of forested and open habitats. CSC Saline Emergent Marsh Found in tidal marshes in Los Angeles, Orange and southern Ventura Counties. CSC CSC CSC CSC FSC, CSC CSC FT, CH, CSC CSC Fresh Emergent Marsh, Lacustrine, Riverine Valley Foothill Riparian, Coastal Oak Woodland Valley Foothill Riparian, Coastal Oak Woodland Irrigated Row and Field Crops, Annual Grassland Irrigated Row and Field Crops, Fresh Emergent Marsh Irrigated Row and Field Crops, Annual Grassland Saline Emergent Marsh, Estuarine, Marine Irrigated Row and Field Crops, Annual Grassland, Fresh Emergent Marsh, Saline Emergent Marsh Permanent or semi-permanent bodies of water bordered by dense vegetation. Forages in woodlands. Nests and forages in woodlands. Wintering grounds consist of open grasslands. Largely endemic to California, most numerous in the Central Valley and nearby vicinity. Requires open water, protected nesting substrate, and foraging grounds within vicinity of the nesting colony. Nests in dense thickets of cattails, tules, willow, blackberry, wild rose, and other tall herbs near fresh water. Nests and roosts in medium-sized mammal burrows. Forages for insects, small vertebrates over open habitats. Breeds in foredunes, and at the mouth of the Santa Clara River. Forages on sandy beach. Breeds on the ground in moist grasslands, forages over marsh, grasslands, dunes, and agricultural land. CE Valley Foothill Riparian Historic breeding records on the lower Santa Clara River from the early 1920 s and Recent sightings are reported on the Santa Clara River near the Ventura/Los Angeles County lines (Cooper, 2001). CSC Valley Foothill Riparian On the central California coast, typically breeding in riparian woodlands.. Page 5-18 Background Report April Oxnard_GP_Environmental_Resources_2006_04_20 MRD
276 Draft 5. Environmental Resources Table 5-2 Special Status Plant and Wildlife Species as of 2005, Known or Having Potential to Occur in the Planning Area (Continued) Plan Area Habitat Species Status Associations Species Notes White-tailed kite (Elanus leucurus) CFP Irrigated Row and Field Crops, Eucalyptus, Valley Foothill Riparian, Coastal Oak Woodland, Annual Breeds in tall shrubs and trees with thick canopy. Forages over open grasslands and agricultural land. Southwestern willow flycatcher (Empidonax traillii extimus) California horned lark (Eremophila alpestris) California condor (Gymnogyps californianus) Bald eagle (Haliaeetus leucocephalus) Yellow-breasted chat (Icteria virens) Western least bittern (Ixobrychus exilis) White-faced ibis (Plegadis chihi) Loggerhead shrike (Lanius ludovicianus) Long-billed curlew (Numenius americanus) Osprey (Pandion haliaetus) Belding s savannah sparrow (Passerculus sandwichensis beldingi) Brown pelican (Pelecanus occidentalis) Coastal California gnatcatcher (Polioptila californica californica) FE, CH, CSC Grassland Valley Foothill Riparian There are no records from the lower Santa Clara River, but potentially suitable breeding habitat exists in the riparian area adjacent to the river (SCREMP, 1996). CSC Irrigated Row and Field Crops, Annual Grassland Short-grass prairie, "bald" hills, mountain meadows, open coastal plains, fallow grain fields, alkali flats. FE, CH, Coastal Scrub and Mixed Require vast expanses of open savannah, grasslands, and CE Chaparral, Annual foothill chaparral in mountain ranges of moderate altitude. Grassland, Marine Deep canyons containing clefts in the rocky walls provide nesting sites. Forages up to 100 miles from roost/nest. Historically foraged in coastal habitats. FT, CE Riverine, Estuarine Nests in large trees with open branches along reservoir, lake and river margins, usually within one mile of water. Forages over water and wetlands of reservoirs, lakes, rivers, and streams. CSC Valley Foothill Riparian Breed in dense riparian thickets with tall trees for perches. CSC Fresh Emergent Marsh Breeds in freshwater marsh with dense cattails. CSC Fresh Emergent Marsh, Estuarine May use marsh and mudflats associated with Santa Clara River estuary. CSC Irrigated Row and Field Breeds in shrubs and small trees, forages for insects and Crops, Coastal Scrub and small vertebrates in open habitats such as grasslands and Mixed Chaparral, Coastal agricultural land. Oak Woodland, Annual Grassland CSC Irrigated Row and Field Forages in winter on mudflats, lagoon, beaches and moist Crops, Annual Grassland, agricultural land. Fresh Emergent Marsh, Saline Emergent Marsh, Estuarine, Marine CSC Valley Foothill Riparian, Breeds in tall dead trees or on poles near permanent water Lacustrine, Riverine, sources. Forages for fish over open water. Estuarine, Marine CE Saline Emergent Marsh Recorded in McGrath State Beach in 1977, but population considered extirpated after saltmarsh at mouth of Santa Clara River was closed to tidal action (CNDDB, 2001). Also recorded in southern Plan Area. FE (delisted), CFP FT, CH, CSC Estuarine, Marine Coastal Scrub and Mixed Chaparral Roosts at river mouth. Forages in nearshore marine environment. Obligate permanent resident of low coastal sage scrub in arid washes, on mesas and slopes below 2500 feet in Southern California. April 2006 Background Report Page Oxnard_GP_Environmental_Resources_2006_04_20 MRD
277 City of Oxnard General Plan Draft Table 5-2 Special Status Plant and Wildlife Species as of 2005, Known or Having Potential to Occur in the Planning Area (Continued) Plan Area Habitat Species Status Associations Species Notes Light-footed clapper FE, CE, Saline Emergent Marsh Breeds and forages in coastal saltmarsh. rail (Rallus longirostris levipes) CFP Bank swallow CT Riverine Banks of rivers, creeks, lakes, and seashores; nests in (Riparia riparia) California least tern (Sterna antillarum browni) Least Bell's vireo (Vireo bellii pusillus) FE. CE FE, CH, CE Saline Emergent Marsh, Estuarine, Marine Valley Foothill Riparian excavated dirt tunnels near the top of steep banks. Known to breed on sandbars and mouth of the Santa Clara River. Recent breeding also recorded near the south end of McGrath Lake, and between Port Hueneme and Pt. Mugu. Typically breeds in riparian habitats. Pairs observed in McGrath State Beach in riparian habitat adjacent to the Santa Clara River. Notes: FEDERAL: (U.S. Fish and Wildlife Service and STATE: (California Department of Fish and National Marine Fisheries Service) and Game) FE= Listed as Endangered by the CT= Listed as Threatened by the State of Federal Government California FT= Listed as Threatened by the CR= Listed as Rare by the State of California Federal Government (plants only) CH= Critical Habitat has been designated CSC= California Species of Special Concern for this species CEQA = No formal State status but considered FPT= Proposed for Listing as Threatened rare by CDFG and therefore recognized FC= Candidate for Federal Listing under CEQA as a significant resource FSC= Federal Species of Special Concern (State CEQA Guidelines Section 15380) Source: United States Fish and Wildlife Service (USFWS) 2005 Landscapes can be defined by four visual elements: landforms, water, vegetation, and human-made structures. 5.3 Aesthetic Resources Aesthetic or visual resources is a broad term used to identify the particular scenic qualities that define a place or landscape. The landscapes that define a particular area are a combination of four visual elements: landforms, water, vegetation, and human-made structures. The Planning Area s location between the Pacific Coast and the Coastal Mountain Range provide an opportunity for a variety of unique aesthetic resources. Issues addressed in this section include the following: Regulations associated with local aesthetic resources Types and locations of aesthetic resources unique to the Planning Area Methods This evaluation of aesthetic resources was based on an initial review of existing reports and literature from the City of Oxnard. Additional sources of information included the California Department of Transportation s (Caltrans) Designated Scenic Route Map for Ventura County. Page 5-20 Background Report April Oxnard_GP_Environmental_Resources_2006_04_20 MRD.doc
278 Draft 5. Environmental Resources Key Terms Coastal Zone. A coastal zone is a land and water area of the State of California that extends seaward to the State's outer limit of jurisdiction, including all offshore islands, and extends inland generally 1,000 yards from the mean high tide line of the sea. In significant coastal estuarine, habitat, and recreational areas it extends inland to the first major ridgeline paralleling the sea or five miles from the mean high tide line of the sea, whichever is less, and in developed urban areas the zone generally extends inland less than 1,000 yards. The actual Coastal Zone boundary is delineated on a set of maps adopted by the State Legislature. Greenbelt Agreement. Greenbelt agreements are adopted by a joint resolution ordinance of the affected agencies and represent a policy commitment to the ongoing preservation of agricultural and open space areas. Scenic Highway Corridor. The area outside of a highway right-of-way that is generally visible to persons traveling on the highway. Scenic Highway/Scenic Route. A highway, road, drive, or street that, in addition to its transportation function, provides opportunities for the enjoyment of natural and human-made scenic resources and access or direct views to areas or scenes of exceptional beauty (including those of historic or cultural interest). The aesthetic values of scenic routes often are protected and enhanced by regulations governing the development of property or the placement of outdoor advertising. Until the mid-1980 s, General Plans in California were required to include a Scenic Highways Element. Until recently, General Plans in California were required to include a Scenic Highways Element. Scenic Area. An open or mostly undeveloped area, the natural features of which are visually significant, or geologically or botanically unique. View Corridor. The line of sight, identified as to height, width, and distance, of an observer looking toward an object of significance to the community (e.g., ridgeline, river, historic building); the route that directs the viewer s attention Regulatory Setting Relevant State and local guidelines specific to aesthetic resource issues are discussed in this section. April 2006 Background Report Page Oxnard_GP_Environmental_Resources_2006_04_20 MRD.doc
279 City of Oxnard General Plan Draft State Regulations California Department of Transportation - California Scenic Highway Program. California's Scenic Highway Program was created by the Legislature in 1963 to preserve and protect scenic highway corridors from change, which would diminish the aesthetic value of lands adjacent to highways. The State laws governing the Scenic Highway Program are found in the Streets and Highways Code, Section 260 et seq. The State Scenic Highway System includes a list of highways that are either eligible for designation as scenic highways or have been so designated. These highways are identified in Section 263 of the Streets and Highways Code. A list of California's scenic highways and a map identifying their locations may be obtained from the Caltrans Scenic Highway Coordinators. For a specific route to be included on a list of highways eligible for scenic highway designation, it must be added to the list prior to being considered for official designation. A highway may be designated scenic depending on the extent of the natural landscape that can be seen by travelers, the scenic quality of the landscape, and the extent to which development intrudes upon the traveler's enjoyment of the view. When a local jurisdiction nominates an eligible scenic highway for official designation, it must also identify and define the scenic corridor of the highway. A scenic corridor is the land generally adjacent to and visible from the highway. A scenic highway designation protects theses scenic values of an area. Jurisdictional boundaries of the nominating agency are also considered, and the agency must also adopt ordinances to preserve the scenic quality of the corridor or document such regulations that already exist in various portions of local codes. These ordinances make up the scenic corridor protection program. To receive official designation, the local jurisdiction must follow the same process required for official designation of State Scenic Highways. The minimum requirements for scenic corridor protection include: The City s Coastal Zone has been divided into four planning areas: McGrath/Mandalay Beach, Oxnard Shores, Channel Islands, and Ormond Beach. Regulation of land use and density of development; Detailed land and site planning; Control of outdoor advertising (including a ban on billboards); Careful attention to and control of earthmoving and landscaping; and Careful attention to design and appearance of structures and equipment. Page 5-22 Background Report April Oxnard_GP_Environmental_Resources_2006_04_20 MRD.doc
280 Draft 5. Environmental Resources Citizen participation in developing these requirements is very important if the program is to have popular support. California Coastal Act of The California Coastal Act of 1976 (Public Resources Code Sections et seq.) requires each local jurisdiction lying in whole or in part within the Coastal Zone to prepare a local coastal program (LCP) for that portion of the Coastal Zone lying within its jurisdiction. The LCP must be certified by the Coastal Commission for review and certification. Local Regulations City of Oxnard Coastal Land Use Plan. The Coastal Land Use Plan, drafted by the City of Oxnard in February of 1982, contains the policies by which all new development projects are assessed. Policies have been developed to address the issues of access, recreation, marine environment, land resources, new development and industrial development. Broadly, the policies mandate that an equal opportunity to enjoy coastal resources shall be provided through: Maximum public access for all economic segments of society shall be provided; Coastal areas suitable for recreational use should be preserved for that use; Marine resources shall be maintained and enhanced, where feasible, and restored; Sensitive habitats, prime agricultural land, and archaeological resources are to be preserved; New residential and commercial development is to be concentrated in existing developed areas, and consistent with service capacities; and Industrial developments, including coastal-dependent and energy facilities, are also to be concentrated and consolidated as much as possible. Priorities are established for competing uses of local coastal resources. Preservation of sensitive habitat areas and coastal resources and the provision of coastal access are the highest priority. Preservation of lands suitable for agriculture is also given a high priority. In areas that are determined to be neither sensitive areas nor suitable for agriculture, coastal-dependent uses, including public recreational uses, coastaldependent industries and energy facilities receive the highest priority. April 2006 Background Report Page Oxnard_GP_Environmental_Resources_2006_04_20 MRD.doc
281 City of Oxnard General Plan Draft Other private development is permitted on the areas not reserved for habitat preservation, agriculture, public recreation or coastal-dependent uses. Within the areas for private development, visitor-serving commercial uses receive priority over private developments. Oxnard 2020 General Plan. As described above, the City has adopted an LCP that consists of a Coastal Land Use Plan and Coastal Zoning Regulations and Maps. Goals and policies provided in the City s combined Open Space/Conservation Element are consistent with the local coastal program. Greenbelt Agreements. Within Ventura County, several cities, the County, and the Local Agency Formation Commission (LAFCO) have adopted greenbelt agreements between jurisdictions to assist in preserving agriculture and other open space lands located between cities. Greenbelt agreements are joint or co-adopted resolutions by cities, the County (when applicable) and LAFCO, whereby it is agreed to jointly administer a common policy of non-annexation and non-development in an agreed upon area. The basic purpose of the greenbelt is to establish a mutual agreement between the participating jurisdictions regarding the limits of urban growth for each city. Allowable uses within these greenbelt areas are limited to various agricultural and open space uses. The City of Oxnard is a participant in the following two greenbelt agreements: Oxnard-Camarillo Greenbelt Agreement. During the 1980 s the City signed a joint resolution with the City of Camarillo and the County of Ventura to create the Oxnard-Camarillo Greenbelt Agreement. This agreement calls for the preservation of a large agricultural area (approximately 27,000 acres) between the cities of Oxnard and Camarillo (see Figure 5-2). Oxnard-Ventura Greenbelt Agreement. The City also entered into an agreement with the City of Ventura back in 1994 for the preservation of 2,460 acres of agricultural land. This greenbelt area is located in the northwest portion of the Planning Area (see Figure 5-2). As further evidence of Oxnard s commitment to agricultural preservation, the 2020 Oxnard General Plan encourages the expansion of the Oxnard- Camarillo Greenbelt in the eastern and southeastern areas of the Planning Area. The City s existing General Plan also encourages the establishment of new greenbelts in the northwestern portion of the Planning Area and north of the Santa Clara River in cooperation with the City of San Buenaventura and County of Ventura. Establishment and expansion of Page 5-24 Background Report April Oxnard_GP_Environmental_Resources_2006_04_20 MRD.doc
282 Draft 5. Environmental Resources future greenbelt areas would only be made if these jurisdictions commit to prohibiting incompatible land uses (such as detention facilities and other non-agricultural and institutional uses) within the greenbelt boundaries Environmental Setting The City s Planning Area is located in western Ventura County, midway between the cities of Santa Barbara and Los Angeles. The western and southern edges of the City are framed by the Pacific Ocean; the northern edge is bounded by the Santa Clara River, and the northeastern and eastern sides by agricultural lands that comprise the Oxnard-Camarillo Greenbelt. The Planning Area is defined by several natural and human-made aesthetic resources, including open spaces, beaches and coastline, agricultural areas, low rise commercial and residential development, as well as tall buildings which are visible in the City s skyline. To maintain the low profile character of the community, urban development is clustered in compact core areas surrounded by rural open areas and agricultural uses. Although the topography of the Planning Area is relatively flat, several prominent vertical features are visible throughout the area including several tall eucalyptus and cypress windrows (which provide a windscreen) and by new office/commercial development along the Ventura Freeway corridor. Beach and coastline areas are recognized as the City s primary natural scenic resource. Roadways also serve as important view corridors in the Planning Area. Access to the Planning Area is provided by U.S. Route 101 (Ventura Freeway), State Route 1 (Pacific Coast Highway & Oxnard Boulevard), State Route 254 (Vineyard Avenue) and State Route 34 (Fifth Street). Many roadways traverse key scenic areas (i.e. coastal areas) and provide travelers with a variety of views. Key aesthetic resources (including scenic areas and view corridors) are described below. An overview of where these key scenic areas occur within the Planning Area is provided in Figure 5-2, with several typical views provided in Figures 5-3 through 5-8. Scenic Areas/View Corridors Local Waterways. The primary waterway in the Planning Area is the Santa Clara River, which forms a strong natural boundary north of the City (see Figure 5-2). The entire river flows approximately 100 miles from its headwaters near Acton, California, to the Pacific Ocean. Extensive patches of high-quality riparian habitat, totaling over 4,000 acres, are present along the entire length of the river, whose large sediment deposits contribute greatly to beaches west of the City. Threats to the ecological health of the river include urban development, channelization, oil spills, stormwater runoff pollution, and the possible resumption of large-scale The Santa Clara River is one of only two natural river systems remaining in Southern California. April 2006 Background Report Page Oxnard_GP_Environmental_Resources_2006_04_20 MRD.doc
283 City of Oxnard General Plan Draft aggregate mining in the channel. Numerous smaller waterways also traverse the Planning Area (including Beardsley Wash, Revolon Channel, etc.) and provide valuable natural scenery, recreational areas, and wildlife habitat. Many of these local waterways are visible from several view points including local roadways (see Figure 5-3). Agricultural Open Space. Lands on the periphery of the City are largely agricultural in nature. These agricultural greenbelt areas are found in the northeastern, eastern and northwestern portions of the Planning Area (see Figure 5-2). Agricultural greenbelt areas provide an important open space quality to the Planning Area and allow unrestricted views of the Coastal Mountain Range to the east, south, and north. Figure 5-4 provides one example of this important scenic resource, with a typical motorist view of agricultural areas along West Gonzalez Road, looking south. Figure 5-4 provides a view of the greenbelt area south of Hueneme Road near Point Mugu. Beaches and Coastline. The Planning Area s beaches and coastline are recognized as the City s primary natural scenic resource, with three State beaches located within the Planning Area: McGrath State Beach, Oxnard State Beach and Mandalay Beach State Park (see Figure 5-2). Local and State beaches provide unique views of the Pacific Ocean and the offshore Channel Islands on clear days (see Figure 5-5). Other visual resources in the Coastal Zone include tall sand dunes near the Mandalay Beach (see Figure 5-5) and the wetlands in the Ormond Beach area; though, they are largely undeveloped and difficult to access. In order to preserve the aesthetic quality of the Planning Area s coastline, the City s Coastal Land Use Plan greatly regulates development along the Coastal Zone. Scenic Highways/Roadways. According to the Caltrans Map of Designated Scenic Routes, there are no official State-designated routes in the Planning Area. However, State Route 1, which runs through the City of Oxnard, is under consideration. State Route 33 in Ventura is the closest officially designated scenic route to the Planning Area (see Figure 5-6). The City, in conjunction with Ventura County and the City of Port Hueneme has selected routes for the City s Scenic Highway System. These routes are summarized below: Los Angeles Avenue through Oxnard s Sphere of Influence Vineyard Avenue between Los Angeles Avenue and Patterson Road Oxnard Boulevard/Pacific Coast Highway between U.S. Route 101 (Ventura Freeway) and Point Mugu Page 5-26 Background Report April Oxnard_GP_Environmental_Resources_2006_04_20 MRD.doc
284 Draft 5. Environmental Resources Figure 5-2 Greenbelts April 2006 Background Report Page Oxnard_GP_Environmental_Resources_2006_04_20 MRD.doc


285 Santa ClaraRiver San Buenaventura State Beach McGrath State Beach Mandalay State Beach Camp Santa Clara Ranch OXNARD BLVD VI N E YARD AV E W ELL S R D Bear dsley Was h LOS ANG ELES AVE 101 5TH ST Oxnard State Beach Silver Strand Beach Port Hueneme R evolon C hanne l Calleguas Creek 1 W N S E Legend General Plan Area Ventura-Oxnard Greenbelt Oxnard-Camarillo Greenbelt Source: USGS, 1993;; City of Oxnard, 2005;; and ESA, 2006 Ormond Beach PUBLIC AND CONSERVATION LANDS Federal Other/Private State Pacific Missile Test Center Mugu Lagoon Point Mugu State Park Figure 5-2 Public Land and Greenbelt Areas Miles
286 City of Oxnard General Plan Draft (Back of Figure 5-2) Page 5-28 Background Report April Oxnard_GP_Environmental_Resources_2006_04_20 MRD.doc
287 Draft 5. Environmental Resources Figure 5-3 Waterways April 2006 Background Report Page Oxnard_GP_Environmental_Resources_2006_04_20 MRD.doc


288 VIEW: Motorist s view of Edison Canal from West Fifth Street. VIEW: Motorist s view of Revolon Channel. Figure 5-3 Local Waterways Source: ESA, 2006
289 City of Oxnard General Plan Draft (Back of Figure 5-3) Page 5-30 Background Report April Oxnard_GP_Environmental_Resources_2006_04_20 MRD.doc
290 Draft 5. Environmental Resources Figure 5-4 Agriculture/Open Space April 2006 Background Report Page Oxnard_GP_Environmental_Resources_2006_04_20 MRD.doc


291 VIEW: Motorist s view looking south from W. Gonzales Road VIEW: Pedestrian/motorist s view of the Oxnard-Camarillo Greenbelt looking south toward Pt. Mugu State Park/Santa Monica Mountains. Figure 5-4 Agricultural Open Space Source: ESA, 2006
292 City of Oxnard General Plan Draft (Back of Figure 5-4) Page 5-32 Background Report April Oxnard_GP_Environmental_Resources_2006_04_20 MRD.doc
293 Draft 5. Environmental Resources Figure 5-5 Beaches/Coastline April 2006 Background Report Page Oxnard_GP_Environmental_Resources_2006_04_20 MRD.doc


294 VIEW: Pedestrian s view from the jetty on Silver Strand Beach looking west toward Anacapa Island. VIEW: Pedestrian s view from Mandalay Beach looking northeast toward sand dunes and the Los Padres Mountains. Figure 5-5 Beaches and Coastline Source: ESA, 2006
295 City of Oxnard General Plan Draft (Back of Figure 5-5) Page 5-34 Background Report April Oxnard_GP_Environmental_Resources_2006_04_20 MRD.doc
296 Draft 5. Environmental Resources Figure 5-6 Roadways April 2006 Background Report Page Oxnard_GP_Environmental_Resources_2006_04_20 MRD.doc


297 VIEW: Motorist s view of the Union Bank tower while driving north on Oxnard Boulevard. VIEW: Motorist s view of the intersection of Los Angeles Avenue and State Route 118 looking West toward the City of Oxnard. Figure 5-6 Roadways Source: ESA, 2006
298 City of Oxnard General Plan Draft (Back of Figure 5-6) Page 5-36 Background Report April Oxnard_GP_Environmental_Resources_2006_04_20 MRD.doc
299 Draft 5. Environmental Resources Figure 5-7 Urban Landscapes #1 April 2006 Background Report Page Oxnard_GP_Environmental_Resources_2006_04_20 MRD.doc


300 VIEW: Pedestrian/motorist s view of Heritage Square. VIEW: Pedestrian/motorist s view of Heritage Square. Figure 5-7 Urban Landscapes Source: ESA, 2006
301 City of Oxnard General Plan Draft (Back of Figure 5-7) Page 5-38 Background Report April Oxnard_GP_Environmental_Resources_2006_04_20 MRD.doc
302 Draft 5. Environmental Resources Figure 5-8 Urban Landscapes #2 April 2006 Background Report Page Oxnard_GP_Environmental_Resources_2006_04_20 MRD.doc


303 VIEW: Pedestrian/motorist s view of Plaza Park area. VIEW: Motorist s view of Henry T. Oxnard Historic District. Figure 5-8 Urban Landscapes Source: ESA, 2006
304 City of Oxnard General Plan Draft (Back of Figure 5-8) Page 5-40 Background Report April Oxnard_GP_Environmental_Resources_2006_04_20 MRD.doc
305 Draft 5. Environmental Resources Victoria Avenue between the Santa Clara River and Channel Islands Boulevard, continuing east on Channel Islands Boulevard to Victoria Avenue U.S. Route 101 through Oxnard s Sphere of Influence Fifth Street between Mandalay Beach Road and Revolon Slough Central Avenue between Vineyard Avenue and Santa Clara Avenue Santa Clara Avenue between U.S. Route 101 and the Sphere of Influence boundary Gonzales Road between Harbor Boulevard and Del Norte Boulevard Wooley Road between Harbor Boulevard and Rice Avenue Channel Islands Boulevard between Ventura Road and Rice Avenue Pleasant Valley Road between Port Hueneme city limits and State Route 1 (Pacific Coast Highway) Hueneme Road between Port Hueneme city limits and State Route 1 (Pacific Coast Highway) Del Norte Boulevard between U.S. Route 101 and Fifth Street Rose Avenue between U.S. Route 101 and State Route 1 (Pacific Coast Highway) Rice Avenue between U.S. Route 101 and State Route 1 (Pacific Coast Highway) Saviers Road between Oxnard Boulevard and Channel Islands Boulevard Ventura Road between U.S. Route 101 and Teakwood Street Patterson Road between Fifth Street and Hemlock Street and between Vineyard Avenue and Doris Avenue Doris Avenue between Victoria Avenue and Patterson Road Typical motorist views throughout the Planning Area, range from foreground (0 to ½ mile), to middle ground (1/2 mile to 2 miles), to background (greater than 2 miles). Owing to the flat topography, views within the urban center are generally limited to foreground elements such as houses, stores, factories, and streetscapes. However background views of the Coastal Mountain Range are also possible along several roadways (see Figure 5-6). Urban Landscapes. The City s urban landscape is also considered an important aesthetic resource. As previously described, the City has clustered urban development in smaller compact core areas, with several April 2006 Background Report Page Oxnard_GP_Environmental_Resources_2006_04_20 MRD.doc
306 City of Oxnard General Plan Draft neighborhoods maintaining many of their original architectural features (see Figure 5-7). Park or plaza features also provide important open space areas within these neighborhoods (see Figure 5-8). 5.4 Cultural Resources Cultural Resources are defined as buildings, sites, structures, or objects that may have historical, architectural, archaeological, cultural, or scientific importance. To better understand the City s cultural heritage, the following topics are covered in this section: Federal, State, and local regulations Narrative of recent City History Existing cultural resources (e.g., sites, monuments, etc.) in the Planning Area Methods Information regarding known and recorded cultural resources within the Planning Area was identified through a records search of pertinent survey and site data at the South Central Coastal Information Center, California State University, Fullerton, in January, 2006 [SCCIC # ]. An inventory of properties listed in the National Register of Historic Places, the California Register of Historic Resources, the California Inventory of Historic Resources (1976), the California Historical Landmarks (1996), or the California Points of Historical Interest (1992) was also generated for the purposes of this report. Results of the historic properties listed by the Office of Historic Preservation are also provided. Due to the extensive number of surveys and archaeological sites in the project vicinity, a comprehensive listing of the reports is not included for the purposes of this report. Rather, an example of the types of studies and archaeological sites are provided. Key Terms Archaeology. The study of historic or prehistoric peoples and their cultures by analysis of their artifacts and monuments. Ethnography. The study of contemporary human cultures. Complex. A patterned grouping of similar artifact assemblages from two or more sites, presumed to represent an archaeological culture. Page 5-42 Background Report April Oxnard_GP_Environmental_Resources_2006_04_20 MRD.doc
307 Draft 5. Environmental Resources Historic Preservation District. An area of the City having historic, architectural, cultural or aesthetic significance and designated as a Historic Preservation District under the provisions of the City s Planning and Zoning Code. Historic Site. A property, site, neighborhood, or area having historic, cultural, or geographic significance; structures on historic sites do not necessarily relate to the site's significance. Isolate. Artifacts or features found apart from recognized archaeological sites. Overall, isolates lake the necessary context in order to adequately judge its significance or be considered scientifically meaningful. Landmark. Any structure or natural feature designated as a Cultural or Historic Monument under the provisions of the City s Planning and Zoning Code or as listed in California Historical Landmarks. Midden. A deposit marking a former habitation site and containing such materials as discarded artifacts, bone and shell fragments, food refuse, charcoal, ash, rock, human remains, structural remnants, and other cultural leavings. State Historical Landmark. Historic structure or site of local or statewide interest. State Point of Historical Interest. Historic structure or site of local or countywide interest Regulatory Setting Cultural resources are subject to various Federal, State and local regulations. A brief overview of these regulations follows. Federal Regulations National Historic Preservation Act (NHPA). Most regulations at the Federal level stem from the National Environmental Policy Act (NEPA) and historic preservation legislation such as the National Historic Preservation Act (NHPA) of 1966, as amended. NHPA established guidelines to "preserve important historic, cultural, and natural aspects of our national heritage, and to maintain, wherever possible, an environment that supports diversity and a variety of individual choice." The NHPA includes regulations specifically for Federal land-holding agencies, but also includes regulations (Section 106) which pertain to all projects that are funded, permitted, or approved by any Federal agency and which have the potential to affect cultural resources. All projects that are subject to NEPA are also subject to compliance with Section 106 of the NHPA and NEPA April 2006 Background Report Page Oxnard_GP_Environmental_Resources_2006_04_20 MRD.doc
308 City of Oxnard General Plan Draft requirements concerning cultural resources. Provisions of NHPA establish a National Register of Historic Places (The National Register) maintained by the National Park Service, the Advisory Councils on Historic Preservation, State Historic Preservation Offices, and grants-in-aid programs. American Indian Religious Freedom Act and Native American Graves and Repatriation Act. The American Indian Religious Freedom Act recognizes that Native American religious practices, sacred sites, and sacred objects have not been properly protected under other statutes. It establishes as national policy that traditional practices and beliefs, sites (including right of access), and the use of sacred objects shall be protected and preserved. Additionally, Native American remains are protected by the Native American Graves and Repatriation Act of Other Federal Legislation. Historic preservation legislation was initiated by the Antiquities Act of 1966, which aimed to protect important historic and archaeological sites. It established a system of permits for conducting archaeological studies on Federal land, as well as setting penalties for noncompliance. This permit process controls the disturbance of archaeological sites on Federal land. New permits are currently issued under the Archeological Resources Protection Act (ARPA) of The purpose of ARPA is to enhance preservation and protection of archaeological resources on public and Native American lands. The Historic Sites Act of 1935 declared that it is national policy to "Preserve for public use historic sites, buildings, and objects of national significance." State Regulations California Register of Historic Resources (CRHR). California State law also provides for the protection of cultural resources by requiring evaluations of the significance of prehistoric and historic resources identified in California Environmental Quality Act (CEQA) documents. Under CEQA, a cultural resource is considered an important historical resource if it meets any of the criteria found in Section (a) of the CEQA Guidelines. Criteria identified in the CEQA Guidelines are similar to those described under the NHPA. The State Historic Preservation Office (SHPO) maintains the CRHR. Historic properties listed, or formally designated for eligibility to be listed, on The National Register are automatically listed on the CRHR. State Landmarks and Points of Interest are also automatically listed. The CRHR can also include properties designated under local preservation ordinances or identified through local historical resource surveys. California Environmental Quality Act (CEQA). CEQA requires that lead agencies determine whether projects may have a significant effect on archaeological, paleontological and historical resources. This determination Page 5-44 Background Report April Oxnard_GP_Environmental_Resources_2006_04_20 MRD.doc
309 Draft 5. Environmental Resources applies to those resources which meet significance criteria qualifying them as unique, important, listed on the California Register of Historical Resources (CRHR), or eligible for listing on the CRHR. If the agency determines that a project may have a significant effect on a significant resource, the project is determined to have a significant effect on the environment, and these effects must be addressed. If a cultural resource is found not to be significant or unique under the qualifying criteria, it need not be considered further in the planning process. CEQA emphasizes avoidance of archaeological and historical resources as the preferred means of reducing potential significant environmental effects resulting from projects. If avoidance is not feasible, an excavation program or some other form of mitigation must be developed to mitigate the impacts. In order to adequately address the level of potential impacts, and thereby design appropriate mitigation measures, the significance and nature of the cultural resources must be determined. The following are steps typically taken to assess and mitigate potential impacts to cultural resources for the purposes of CEQA: Identify cultural resources, Evaluate the significance of the cultural resources found, Evaluate the effects of the project on cultural resources, and Develop and implement measures to mitigate the effects of the project on cultural resources that would be significantly affected. State Laws Pertaining to Human Remains. Section of the California Health and Safety Code requires that construction or excavation be stopped in the vicinity of discovered human remains until the county coroner can determine whether the remains are those of a Native American. If the remains are determined to be Native American, the coroner must contact the California Native American Heritage Commission. CEQA Guidelines (Section ) specify the procedures to be followed in case of the discovery of human remains on non-federal land. The disposition of Native American burials falls within the jurisdiction of the Native American Heritage Commission. Tribal Consultation Guidelines (Senate Bill 18). SB 18, authored by Senator John Burton and signed into law by Governor Arnold Schwarzenegger in September 2004, requires local (city and county) governments to consult with California Native American tribes to aid in the protection of traditional tribal cultural places ( cultural places ) through local land use planning. SB 18 also requires the Governor s Office of Planning and Research (OPR) to include in the General Plan Guidelines advice to local governments for how to conduct these consultations. The April 2006 Background Report Page Oxnard_GP_Environmental_Resources_2006_04_20 MRD.doc
310 City of Oxnard General Plan Draft intent of SB 18 is to provide California Native American tribes an opportunity to participate in local land use decisions at an early planning stage, for the purpose of protecting, or mitigating impacts to, cultural places. These consultation and notice requirements apply to adoption and amendment of both general plans (defined in Government Code et seq.) and specific plans (defined in Government Code et seq.). Local Regulations City of Oxnard - Oxnard 2020 General Plan. The combined Open Space/Conservation Element of the City s existing General Plan contains one objective and several policies pertinent to cultural resources Environmental Setting The following section summarizes the Planning Area s prehistoric, ethnographic, and historic setting. Figure 5-9 provides a visual timeline of the Planning Area s historic setting. The region s native people were the Ventureno Chumash who were able to sustain one of the most complex huntergatherer cultures on earth. Prehistoric and Ethnographic Setting The coastal region of the Santa Barbara Channel and the vicinity of the Santa Clara River have a long and diverse history of occupation that has contributed greatly to our understanding of prehistoric ways of life in coastal environments. The Santa Barbara Channel region contains a rich variety of landscapes, from coastal littoral to mountain zones separated by piedmont and terrace lands. In addition, the Santa Barbara region received enough rainfall to sustain an abundant biotic community. The coastal landscape throughout the Southern California coast, especially during the Holocene period (or the last 10,000 yeas), featured lagoons, large estuaries, and bays harboring a rich community of life, such as mollusk, fish and waterfowl. As a result, the region s native peoples, the Chumash, were able to sustain one of the most complex hunter-gatherer cultures on earth. The Ventureno Chumash, who spoke a language of the Hokan stock, occupied the area from Topanga Canyon northwest to San Luis Obispo. The Chumash followed a diverse subsistence pattern, with a reliance on fishing, but hunting and gathering augmented their diet. It is plausible that the abundant sea resources throughout the Chumash coastal occupation were crucial to their overall success in the region. Moreover, their wide diet allowed them to exploit a variety of environments, including long term habitation on the Channel Islands. Indeed, the Chumash achieved a high degree of social complexity, including at least two major chiefdoms, and population size without the need for agriculture. Page 5-46 Background Report April Oxnard_GP_Environmental_Resources_2006_04_20 MRD.doc
311 Draft 5. Environmental Resources Figure 5-9 Planning Timeline April 2006 Background Report Page Oxnard_GP_Environmental_Resources_2006_04_20 MRD.doc


312 11500* 10000* 4000* PALEO-INDIAN PERIOD ARCHAIC PERIOD PACIFIC PERIOD LATE PERIOD EUROPEAN EXPLORATION SPANISH AND MEXICAN PHASES Early Southern California Coastal Cultures Emergence of Chumash Tradition San Dieguito People 1782 Founding of Mission San Buenventura S PANISH AND MEXICAN PHASES ANGLO-EUROPEAN-AMERICAN STAGE INDUSTRIAL ER A Californiabecomesastate Eight Mexican soldiers awarded the Rancho de Santa Clara o La Colonia, consisting of 44,883 acres. City of Oxnard is incorporated. Oxnard Air Force Base established. Port Hueneme built. Oxnard s population exceeds 200,000. * Years Before Photographs Present courtesy of the Oxnard Henry Library Oxnard opens sugar factory in V entura County. Oxnard builds its first public library, a gift from Andrew Carnegie. Oxnard Airport built. Figure 5-9 Historic Timeline for the Planning Area Source: ESA, 2006
313 City of Oxnard General Plan Draft (Back of Figure 5-9) Page 5-48 Background Report April Oxnard_GP_Environmental_Resources_2006_04_20 MRD.doc
314 Draft 5. Environmental Resources Historic Setting The Spanish and Mexican Phases As of the middle 16th century, sporadic exploration of California began by Spanish, British and Russian explorers, which, in turn, initiated the progressive development of immigrant cultures into native California. However, this first phase of exploration did not necessarily result in permanent settlement, but was, in fact, subject to the vagaries of European politics and, in the case of the Spaniards, the progress of Mexican colonial administration. These expeditions, such as those by Gaspar de Portola in and Juan Bautista de Anza in , led up to the establishment of the Mission of San Buenaventura in The founding of the mission marked a clear beginning of the historic period and the decline of the native populations in the process of missionization. It was with the founding of the Mission that the first cultivation of the land took place and precipitated the agricultural significance of the region. Early Spanish expeditions led to the establishment of the Mission San Buenaventura in Despite the proximity to the original Ventura Mission, the Oxnard area and its surrounding landscape fell just outside of the Mission boundaries. Consequently, this region was not a major part of the first fifty years of colonization in Ventura County although any local Chumash were undoubtedly affected by the events taking place around them. By 1822, the Mexican government gained control of California and began to wield more power over the affairs of the region and its use economically, which led to a greater degree of secularization of the missions and ranchos. To this end, in 1837, Governor Juan B. Alvarado awarded the Rancho el Rio de Santa Clara o La Colonia to eight soldiers, consisting of 44, 883 total acres. Subsequently, a smaller rancho, Rancho San Miguel, was sold to Raimundo Olivas and Felipe Lorenzana. The land of this Rancho was situated north of the Santa Clara River with the river itself marking its southern boundary. Although the original Rancho Santa Clara was awarded to eight men, the only part owner that maintained active pastureland for cattle grazing named Rafael Gonzalez. As the American Period began around 1848, many of the originalland grants were converted to U.S. Land Commission control; however, many of the placenames have been preserved, such as El Rio, and unincorporated residential community north of the Ventura Freeway. It was in the location of present-day El Rio that the Gonzales family adobe was located and, consequently, where much of the ranching activities were situated. In addition, the original name for the City of Oxnard, La Colonia, still remains as a Hispanic borough within the city. The City s original name was La Colonia. April 2006 Background Report Page Oxnard_GP_Environmental_Resources_2006_04_20 MRD.doc
315 City of Oxnard General Plan Draft Another Rancho of the Spanish-Mexican era pertinent to the Santa Clara River mouth was Rancho San Pedro, a small parcel that was later incorporated into the Rancho Santa Clara. A map of this rancho from 1852 depicts the boundaries very close to the mouth of the river. The map depicts a dense strip of riparian vegetation along the bank of the river, along with two freshwater lakes, lagunas aqua dulce, which are located near the sand dune border with the ocean and adjacent to the banks of the river mouth. The area around the river mouth was mapped again fifteen years later as part of the Rancho Santa Clara. According to Cota (1867, as cited in Swartsberg and Moore 1995), the mouth of the river was estimated to be fifteen to twenty chains (330 to 44) yards) wide, the sand dunes were measured at 100 to 500 yards, and the swampy land full of sloughs and lagunas extending along the whole front of the rancho was measured at one-half to three-quarters of a mile long. The Anglo-European-American Stage and Emergent Commercial Agriculture The local farming industry quickly reoriented to focus on the sugar beet industry, which created unprecedented economic growth for La Colonia. The center of land use for the region during the mid 1800 s was in the area of El Rio, which was enough distance away to suggest that the coastal area and fringe was likely of peripheral importance at least during the Gonzalez s tenure. The land tenure was changing, however, and by the early 1860 s many non-hispanics began purchasing rancho lands for the first time. An easterner named Thomas A. Scott purchased many of the rancho lands through a local agent, Thomas A. Bard. When Scott s plans to encourage the Southern Pacific Railroad to build its terminus on the property failed, he sold the land to Bard in By this time, however, squatters had assumed that the land was public and available for the taking, and had already occupied portions of the land. After a protracted dispute over the land rights between Bard and the squatters, the courts decided in Bard s favor, with the condition that the squatters be given the opportunity to purchase the lands they occupied. This resulted in the settlement and eventual incorporation of the Town of Hueneme. The underpinnings of these land tenure issues, was, by and large, the evident agricultural potential of the Oxnard Plain, which became the dominant land use in subsequent decades. The impetus for land use change that took place by 1870 from grazing to intensive agriculture was likely due to the development of new strategies to exploit the agricultural potential of the Oxnard flood plain, and the increasing economic importance of agriculture to the growing population of California. The discovery of two major aquifers, the Oxnard and the Fox Canyon Aquifers, contributed greatly to the development of artesian wells in order to exploit this resource. The Fox Canyon Aquifer underlies most of the coastal plain, making it the most widely distributed of the local Page 5-50 Background Report April Oxnard_GP_Environmental_Resources_2006_04_20 MRD.doc
316 Draft 5. Environmental Resources aquifers. With the increasing irrigation capabilities, the existing cultivation potential of the alluvial soils in the coastal plain led, almost inevitably, to the agricultural focus of land use in the region. As a result, many of the new settlers to the region were principally farmers, such as Dominick McGrath, who purchased 1337 acres of the original land grant in 1875 (Bodie, 1977). In addition, the Oxnard brothers success in the sugar beet industry in Chino led to the construction of the America Sugar Beet Factory in La Colonia. The local farming industry quickly reoriented to focus on the sugar beet industry, which created unprecedented economic growth for La Colonia. This led, in turn, to the establishment of the City of Oxnard on the La Colonia center. With the success of the beet industry, commercial agriculture began in earnest, supplanting livestock raising as the predominant land use. By 1875, intensive agriculture began with the introduction of lima beans, which slowly surpassed grain as the top agricultural crop in the region. By the late nineteenth century, the agriculture potential of the Oxnard Plain became more evident, with its high water table and dissolved salts, and more crops were rotated in with limas, including sugar beets, barley and citrus (Gregor, 1953). The experimentation with citrus became a harbinger for change along the Santa Clara River, especially with respect to irrigation and the need to divert water from the river itself, which was not as necessary with the dryland farming that had taken place up to that point. Although an expensive and risky business, farmers began replacing walnut groves with citrus when the first substantial diversion of the river took place by the turn of the century (Blanchard, 1983; Freeman, 1968; Teague, 1944). By the turn of the century, the region became one of the most important agricultural regions in California. The extent of the agricultural influence on the Oxnard Plain has been rising dramatically ever since, and, with it, unprecedented population growth. Over the last 50 years the rapid and significant increases in population has increased the needs for urbanization, which has especially affected the upper Santa Clara Region. Many of the use changes have taken the form of bridge construction, flood control development and landfills, as well as a residential boom that has taken place since the 1920s. Related to the valley s urban development has been the increasing industrial use of the river for sand and gravel mining, which went into the building of roads and general infrastructure. Local agriculture in the lower river region, including the area surrounding the river mouth, has seen a shift toward smaller farms during the 20th century. With the increasing population to Oxnard, farm areas has April 2006 Background Report Page Oxnard_GP_Environmental_Resources_2006_04_20 MRD.doc
317 City of Oxnard General Plan Draft decreased in some locations, which has led to a shift toward higher priced crops that require more intensive irrigation. According to Gregor (1953), over 62 percent of the grain, row, or tree crop farms in the lowland area were less than 100 acres. This statistic only serves to illuminate the increasing urbanization of Oxnard and the decreasing size in agricultural acreage. The Industrial Era (1920 Present) As urbanization and economic growth continued to increase, the demands on the river and the land around it also grew. Agriculture in the region became agribusiness. Population growth in Ventura County expanded during this period exponentially, and, as a result, urban development has followed suit with residential and industrial development further encroaching on the floodplain Summary of Existing Resources The following section summarizes information received from the records search conducted at the South Central Coastal Information Center (SCCIC), California State University, Fullerton, in January, 2006 for the Planning Area. According to the SCCIC records, the Planning Area contains a variety of previously recorded cultural resources, both from the prehistoric and historic eras, including 12 prehistoric sites and 7 isolates. The Planning Area also contains 31 recorded resources in the form of buildings or structures. The County of Ventura also maintains a list of local historic landmarks and points of interest that represent historic resources of local significance. Several key historic resources are identified in Tables 5-3 and 5-4 below. Prehistoric Resources Recorded prehistoric sites within the Planning Area appear to be concentrated to the east of the City (e.g. CA-Ven-789, CA-Ven-506, CA- Ven-666, and CA-Ven-665) and to the south near Port Hueneme (e.g. CA- Ven-663, CA-Ven-662). However, because the Planning Area consists of a relatively flat, alluvial plain, the probabilities for prehistoric sites is considered low in the area south of the Santa Clara River (due to extensive erosion and sedimentation). Overall, few intact archaeological sites occur along the stretch of open coast between Hollywood Beach and the mouth of the Santa Clara River. California s open coasts, or unprotected surf-swept shores, are correlated with low population densities because this environment was considered resource-poor relative to more protected settings. For example, Mugu Lagoon, located approximately 8-miles south of Oxnard, exhibits a protected estuary that Page 5-52 Background Report April Oxnard_GP_Environmental_Resources_2006_04_20 MRD.doc
318 Draft 5. Environmental Resources was likely attractive to prehistoric people due to the easy access to abundant food and water (a major village site, CA-Ven-11 or Muwu, was identified overlooking the lagoon). Although some geographic areas experience greater sensitivity than other areas for the presence of prehistoric or historic archaeological resources, it is possible for a variety of archaeological deposits to be encountered during ground-disturbing activities in almost any location, including areas considered to have low sensitivity. The evidence from previous survey work and site investigations in the Planning Area would indicate that discover of future prehistoric site types may include the following: Surface scatters of lithic artifacts associated with or without midden accumulations, resulting from short-term occupation, and/or specialized economic activities, or long-term occupation. Isolated finds of cultural origin, such as lithic flakes and projectile points or millingstone fragments. Floral and faunal remains or deposits. Historic Archaeological Resources. The evidence from previous survey work and site investigations in the Planning Area indicates that historic archaeological resources include the following: Historic artifact scatters and buried deposits of historic debris and artifacts. Building foundations and associated deposits. Levees and roads. Remains of farms and ranches. Oxnard Historic Resources. Many properties (built environment) characteristic of the City s historic period have been identified through previous historic building surveys and cultural resource studies. A list of properties (maintained by the County) identified as having local significance or those properties listed on or found eligible for listing in the National Register of Historic Places is provided in Table 5-3. Table 5-4 identifies two properties classified as a point of interest by the County of Ventura. Henry T. Oxnard Historic District. The Henry T. Oxnard National Historic District is a residential neighborhood located west of the City s central business and commercial center (F and G Street from 219 North F to 5th Street and from 131 North G Street to 5th Street) (see Figure 5-10). This April 2006 Background Report Page Oxnard_GP_Environmental_Resources_2006_04_20 MRD.doc
319 City of Oxnard General Plan Draft district was nominated for the National Register of Historic Places in Principally, the district qualified for the National Register because most of the homes and the setting appear as they did during the period between 1909 and 1940 (National Register Nomination Form , 1998). The neighborhood is primarily comprised of Bungalow and Craftsman style homes along with Mediterranean/Spanish Revival styles. A representative home is also shown in Figure The total number of contributing houses to the district is 137. Table 5-3 City of Oxnard Landmarks Ventura County Landmark Number Name Location Year Built National Register Status 13 Carnegie Library 424 South C Street 1907 Listed 15 Naumann Giant Gum Pleasant Valley & Etting 1900 Ineligible for listing Tree/Eucalyptus Rows 16 Sugar Beet Factory Wooley & Oxnard Blvd. N/A No information to date 17 Oxnard Plaza Park Pagoda 5 th & C Streets N/A No information to date 18 Japanese Cemetery Pleasant Valley & Etting 1900 Local Landmark 56 Bank of A. Levy 143 W. Fifth Street 1926 Appears Eligible for listing 70 First Church of Christ Scientist Heritage Square N/A No information to date 73 Murphy House 205 S. F Street 1911 Contributor to a listed historic district 74 Henry Levy House 155 S. G Street 1914 Contributor and individually eligible for listing 75 Achille Levy House 201 S. D Street 1912 Eligible for listing 100 Justin Petit Ranch House Heritage Square N/A No information to date 141 Ventura County Railway 250 E. Fifth Street N/A No information to date 144 Scarlett/McGrath Ranch House 5011 W. Gonzales 1890 Contributor to a listed historic district 145 Perkins/Claberh House Heritage Square N/A No information to date 147 Staire/Diener House 235 S. D Street 1912 Contributor to a listed historic district 148 C Street Palm Trees Magnolia to Wooley N/A No information to date Road 149 Japanese Nisei Methodist 630 S. A Street 1940 Appears eligible for listing Episcopal Church 167 Swift House and Lying-in Hospital 838 W Fifth Street N/A Ineligible for listing Notes: N/A = not available Source: National Register of Historic Places, 2006 Page 5-54 Background Report April Oxnard_GP_Environmental_Resources_2006_04_20 MRD.doc
320 Draft 5. Environmental Resources Figure 5-10 Oxnard Historic District April 2006 Background Report Page Oxnard_GP_Environmental_Resources_2006_04_20 MRD.doc


321 N F STREET MAGNOLIA AVENUE W 1ST STREET N E STREET S H STREET W 2ND STREET N D STREET W 3RD STREET Oxnard High School W 4TH STREET W 5TH STREET Figure 5-10 Henry T. Oxnard Historic Area Source: City of Oxnard; and ESA, 2006 NOT TO SCALE
322 City of Oxnard General Plan Draft Back of Figure 5-10 Page 5-56 Background Report April Oxnard_GP_Environmental_Resources_2006_04_20 MRD.doc
323 Draft 5. Environmental Resources Table 5-4 City of Oxnard Points of Interest Ventura County Landmark Number Name Location National Register Status 8 Santa Clara Chapel Site 301 Esplanade Drive No information to date 9 Cesar Chavez Childhood Home Site 452 N. Garfield Avenue No information to date Notes: N/A = not available Source: County of Ventura, 2006 Leonard Ranch Historic District. The Leonard Ranch Historic District (Primary Number ), located at 3779 W. Gonzales Road, is considered eligible for the National Register and is listed in the California Register (OHP, 2006; Scheid 1998). The Leonard Ranch once comprised 1,000-acres on the Oxnard Plain, but now is limited to 3.45-acres of what remains of the ranch buildings. These remains include: the Ranch House, the Main Residence, and a Cook s Cabin. The remaining elements to this district are a variety of landscaped features, such as a pair of Moreton Bay fig trees. 5.5 Agricultural and Soil Resources Agricultural activities have played an important role in the City s economic, cultural, and environmental framework since the first arrival of the Spanish missionaries during the 1700 s. Issues addressed in this section include the following: A general description of existing agricultural operations in the City s Planning Area and adjacent areas, including the viability of the soils, size of farming operations, dominate crops, trends in agriculture, labor supply, and impacts of population growth; Today, most agricultural lands in the City are located along the northeastern and eastern edges of the Planning Area. Identify trends in Williamson Act activity since the program s implementation in 1967 and the current uses of Williamson Act land; Agricultural water demands within the City; Farmland conversion issues; A general description of the soil resources and associated characteristics within the City s Planning Area; and, The geographic location of soil types found within the Planning Area as delineated by the Natural Resource Conservation Service. Other geologic issues associated with seismicity are addressed in Section Geological and Seismic Hazards of this document. April 2006 Background Report Page Oxnard_GP_Environmental_Resources_2006_04_20 MRD.doc
324 City of Oxnard General Plan Draft Methodology This evaluation of agricultural and soils resources was based on an initial review of existing reports and literature from the City of Oxnard. Additional sources of information included the California Department of Conservation s Farmland Mapping and Monitoring Program (FMMP), the California Department of Water Resources, and the Ventura County Agricultural Commissioner s Office. Geographic Information Systems (GIS) data was also obtained for various agricultural resources including soils types and agricultural farmlands. A limited field reconnaissance of the Planning Area was also conducted on November 6, 2005 to field check some of the agricultural farmland mapping data. Key Terms Oxnard, along with the City of Camarillo and the County of Ventura, is a party to the Oxnard-Camarillo Greenbelt Agreement that contributes to the preservation of a large agricultural area (approximately 27,000 acres). Commodities. Any unprocessed or partially processed good (e.g., fruits, vegetables, or grains) used for trade or commerce. Greenbelt Agreement. Greenbelt agreements are adopted by a joint resolution of the affected agencies and represent a policy commitment to the ongoing preservation of agricultural and open space areas. Important Farmlands. Collective term for farmlands designated as Prime, Unique, or as Farmlands of Statewide Importance under the Department of Conservation s FMMP. K-Factor. Provides an indication of a soil's inherent susceptibility to erosion, absent of slope and groundcover factors. Values of K range from 0.05 to The higher the value, the more susceptible the soil is to sheet and rivulet (or small stream) errosion by water. Soil Quality. The capacity of a specific kind of soil to function, within natural or managed ecosystem boundaries, to sustain plant and animal productivity, maintain or enhance water and air quality, and support human health and habitation. Williamson Act Contract Active. A contract between a landowner and a City or County to restrict land to agricultural or open space uses in return for lower than normal property tax assessments. The minimum term for a Williamson Act contract is 10 years. Since the term automatically renews for 10 more years on each anniversary date of the contract, the actual term can be indefinite. Page 5-58 Background Report April Oxnard_GP_Environmental_Resources_2006_04_20 MRD.doc
325 Draft 5. Environmental Resources Williamson Act Contract Cancellation. Under a set of specifically defined circumstances, a contract may be cancelled without completing the process of term non-renewal. Contract cancellation, however, involves a comprehensive review and approval process, and the payment of fees by the landowner equal to 12 percent of the full market value of the subject property. Once a contract has been canceled, the land cannot be converted for non-agricultural uses for 10 years. Upon cancellation of the contract, the land cannot be converted for agricultural uses for 10 years. Williamson Act Contract Notice of Non-Renewal. Contracts may be terminated at the option of the landowner or local government by initiating the process of tem non-renewal. Under this process, the remaining contract term (nine years in the case of an original term of 10 years) is allowed to lapse, with the contract null and void at the end of the term. Property tax rates gradually increase during the non-renewal period, until they reach normal (i.e., non-restricted) levels upon termination of the contract. Williamson Act Contract Expired. Expired parcels are those parcels that have previously been subject to a Williamson Act contract and have since been removed from the contract through non-renewal, cancellation, or annexation Regulatory Setting Relevant State and local guidelines specific to agricultural and soils resource issues are discussed in this section. State Regulations Farmland Mapping and Monitoring Program. The California Department of Conservation (DOC), under the Division of Land Resource Protection, has developed the FMMP that monitors the conversion of the State s farmland to and from agricultural use. County-level data is collected and a series of maps are prepared that identify eight classifications and uses based on a minimum mapping unit size of 10 acres. The program also produces a biannual report on the amount of land converted from agricultural to non-agricultural use. The program maintains an inventory of State agricultural land and updates the Important Farmland Series Maps every two years (Department of Conservation, 2000). Table 5-5 provides a summary of the rating categories used by the FMMP. The FMMP is an informational service only and does not constitute State regulation of local land use decisions. Agricultural land is rated according to several variables including soil quality and irrigation status with Prime Farmland being considered the most optimal for farming practices. April 2006 Background Report Page Oxnard_GP_Environmental_Resources_2006_04_20 MRD.doc
326 City of Oxnard General Plan Draft California Land Conservation Act of 1965 (Williamson Act). The California Land Conservation Act (CLCA) of 1965, Sections et seq. of the California Government Code, commonly referred to as the Williamson Act, enables local governments to restrict the use of specific parcels of land to agricultural or related open space use. Landowners enter into contracts with participating cities and counties and agree to restrict their land to agriculture or open space use for a minimum of 10 years. In return, landowners receive property tax assessments that are much lower than normal because they are based upon farming and open space uses as opposed to full market (speculative) value. Local governments receive an annual subvention of forgone property tax revenues from the State via the Open Space Subvention Act of The DOC reports that the Land Conservation Act Program has remained stable and effective as a mechanism for protecting agricultural and open space land from premature conversion of land to urban uses. The DOC indicates that the program might have remained small if not for the addition of Article 28 (now part of Article 13) to the State Constitution. Article 13 declares the interest of the State in preserving open space land and provides a constitutional basis for valuing property according to its actual use. The amendment originated with groups interested in the preservation of open space land. Agricultural interests added their support after recognizing the importance of a constitutional backing for preferential tax assessments. Article 13 allows preferential assessments for recreational, scenic, and natural resource areas as well as areas devoted to the production of food and fiber. Legislation Affecting the Williamson Act Farmland Security Zones. In August 1998, the Williamson Act s farmland security zone (FSZ) provisions were enacted with the passage of Senate Bill 1182 (California Government Code Section ). This sub-program, dubbed the Super Williamson Act, enables agricultural landowners to enter into contracts with a specific county for 20-year increments with an additional 35 percent tax benefit over and above the standard Williamson Act contract. Senate Bill 1835 (Johnston, Chapter 690, Statutes of 1998) and the Cortese-Knox Local Government Reorganization Act. Senate Bill 1835 requires the appropriate Local Agency Formation Commission (LAFCO), to determine whether a particular City is required to succeed (adhere) to the rights, duties and powers of the county under the contract or whether the City may exercise an option to not succeed to the rights, duties and powers of the county. The determination would be required pursuant to any proposal by a City that would result in the annexation of Williamson Act contracted land. Page 5-60 Background Report April Oxnard_GP_Environmental_Resources_2006_04_20 MRD.doc
327 Draft 5. Environmental Resources Table 5-5 Designation Prime Farmland Farmland of Statewide Importance Unique Farmland Farmland of Local Importance Grazing Land Urban and Built-up Land Other Land Water Description of FMMP Designations Description Land that has the best combination of physical and chemical characteristics for the production of crops. It has the soil quality, growing season, and moisture supply needed to produce sustained yields of crops when treated and managed, including water management, according to current farming methods. It must have been used for the production of irrigated crops within the last three years. It does not include publicly owned lands for which there is an adopted policy preventing agricultural use. Similar to Prime Farmland but with minor shortcomings, such as greater slopes or less ability to hold and store moisture. Considered to have an excellent combination of physical and chemical characteristics for the production of crops. Land of lesser quality soils used for the production of specific high-economic value crops at some time during the monitoring program s two update cycles prior to the mapping date. It has the special combination of soil quality, location and growing season, and moisture supply needed to produce sustained high quality or high yields of a specific crop when treated and managed according to current farming methods. Unique farmland is usually irrigated, but may include non-irrigated orchards or vineyards as found in some climatic zones in California. Farmlands not covered by the categories of Prime, Statewide, or Unique. They include lands zoned for agriculture by County Ordinance and the California Land Conservation Act as well as dry farmed lands, irrigated pasture lands, and other agricultural lands of significant economic importance to the County and include lands that have a potential for irrigation from local water suppliers. Grazing Land is land on which the existing vegetation, whether grown naturally or through management, is suitable for grazing or browsing of livestock. Land occupied by structures with a building density of at least 1 unit to 1.5 acres, or approximately 6 structures to 10-acre parcel. This land is used for residential, industrial, commercial, construction, institutional, public administration, railroad and other transportation yards, cemeteries, airports, golf courses, sanitary landfills, sewage treatment, water control structures, and other developed purposes. Land not included in any other mapping category. Common examples include low density rural developments; brush, timber, wetland, and riparian areas not suitable for livestock grazing; confined livestock, poultry or aquaculture facilities; strip mines, borrow pits; and water bodies smaller than forty acres. Vacant and nonagricultural land surrounded on all sides by urban development and greater than 40 acres is mapped as Other Land. Perennial water bodies with an extent of at least 40 acres. Source: California Department of Conservation, 2000 Senate Bill 2227 (Monteith, Chapter 590, Statutes of 1998). Senate Bill 2227 added new requirements to the Cortese-Knox Local Governmental Reorganization Act regarding any proposed annexation of Williamson contract land. If the proposal would result in the annexation of land that is subject to the Williamson Act, then the petition shall state whether the City shall succeed (adhere) to the contract or whether the City intends to exercise its option to not succeed to the contract. Local Regulations Oxnard 2020 General Plan. The combined Open Space/Conservation Element s of the City s existing General Plan contains an objective and several policies pertinent to agriculture and soils resources. April 2006 Background Report Page Oxnard_GP_Environmental_Resources_2006_04_20 MRD.doc
328 City of Oxnard General Plan Draft Environmental Setting The Planning Area includes an estimated 23,380 acres of agricultural lands. The City of Oxnard lies entirely within the Oxnard Plain, which contains some of the most fertile land in Ventura County. Agricultural areas are found in the northeastern and eastern edges of the City, as well as in large pockets within the northwestern portion of the Planning Area. These pockets are green buffers surrounding the developed areas and are marked by tall eucalyptus and cypress windrows. According to the California Department of Conservation s FMMP, there are currently about 23,380 acres of agricultural land in the Planning Area. Additionally, the City of Oxnard is a party to the Oxnard-Camarillo Greenbelt Agreement that covers approximately 27,000 acres located between the two cities Existing Soils Conditions The deep, alluvial soils of the Planning Area and surrounding area have been classified by the U.S. Department of Agriculture (USDA) Soil Conservation Service (SCS) to determine soil capability for agricultural production. The SCS mapping program rates the agricultural suitability of soils in terms of both the Land Use Capability Classification System and the Storie Index. The SCS Land Use Capability Classification System takes into consideration soil limitations and the way in which soils respond to treatment. Capability classes range from Class I soils, which have few limitations restricting their use for agriculture, to Class VIII soils, which are unsuitable for agriculture. The majority of soils in the Planning Area are Class I and II, which by definition constitute prime agricultural soils under the SCS Land Use Capability Classification System. The Storie Index, the second method for soil classification, expresses the relative degree of soil suitability for general intensive farming, based solely on soil conditions and characteristics. Soils in Grade 1 are rated excellent and are very well suited to general intensive farming. Grade 2 soils are rated good and are well suited to general farming. Grade 3 soils are only fairly suited, Grade 4 soils are poorly suited and Grade 5 are very poorly suited to general intensive farming. Soils and miscellaneous areas that are not suited for farming are in Grade 6. The following soil associations are present within the Oxnard area: Pico-Metz-Anacapa Association. Level to moderately sloping, very deep, well-drained sand loams and very deep, somewhat excessively drained loamy sands. Soil depth can be up to 60 inches or more. The soils Page 5-62 Background Report April Oxnard_GP_Environmental_Resources_2006_04_20 MRD.doc
329 Draft 5. Environmental Resources of this association are Class II and Class III and are some of the most productive soils. Their agricultural use is for irrigated vegetables, citrus crops, field crops, strawberries, walnuts and avocados. Mocho-Sorrento-Garretson Association. Level to moderately sloping, very deep, well-drained loams to silty clay loams. Soil depth can be up to 60 inches or more. The soils in this association are Class I and Class II, and are some of the most productive soils in the City. Their agricultural use is for irrigated vegetables, citrus crops, field crops, strawberries, walnuts and avocados. Camarillo-Hueneme-Pacheco Association. Level and nearly level, very deep, poorly drained loamy sands and silty clay loams. Soil depth can be up to 60 inches or more. The soils in this association are Class II soils and are also some of the most productive in the City. They are used for irrigated vegetables, field crops, lemons and strawberries. In undrained areas, there is a seasonal water table within a depth of 2 feet and periodically the soils contain soluble salts. The Camarillo- Hueneme-Pacheco Soil Association covers a majority of the Planning Area and is considered some of the most productive soils in the area. Riverwash-Sandy Alluvial Land-Coastal Beaches Association. Level to gently sloping, excessively drained to poorly drained stratified sand, gravelly and cobbly material with only a small amount of silt and clay. This soil association is subject to flooding, scouring and deposition during and immediately following storms. This soil association has a Class VIII rating and is unsuitable for agriculture. Rincon-Huerhuero-Azule Association. Level to moderately steep, very deep, well drained and moderately well drained, very fine sandy loams to silty clay loams that have slowly and very slowly permeable sandy clay subsoil. The locations of the soil associations previously described are identified in Figure 5-11, with an estimate of the number of acres for each soil association within the Planning Area provided in Table 5-6. The Camarillo- Hueneme-Pacheco association covers almost all of the City s Planning Area, with an estimated 28,070 acres (see Table 5-6 and Figure 5-11). Limited amounts of the Pico-Metz-Anacapa association are located along the Santa Clara River. A finger of the Mocho-Sorrento-Garretson association (an estimated 2,270 acres) extends into the Planning Area from the north and is located east of Oxnard Boulevard and north of west Fifth Street. As shown in Figure 5-11, the Riverwash-Sandy Alluvial Land- Coastal Beaches Association is located along the entire coastline of the City. The Rincon Ricon-Huerhuero-Azule Association occupies a small area (670 acres) in the northeast portion of the Planning Area. April 2006 Background Report Page Oxnard_GP_Environmental_Resources_2006_04_20 MRD.doc
330 City of Oxnard General Plan Draft Erosion is the detachment and movement of soil materials through natural (e.g., wind, rain) and human (e.g., grading, etc.) activities. Erosion Rates of erosion can vary depending on a number of factors including climate conditions, soil material, soil structure, and levels of human activity. The erosion potential for soils in the Planning Area depend on several soil characteristics, including surface texture, overall permeability, organic matter content, depth, and quantity and type of ground cover. Depending on the local landscape and climatic conditions, erosion may be very slow to very rapid. The City s Planning Area is located within a Mediterranean climatic regime, which is characterized by moist winters and dry summers. The Planning Area is therefore, subject to erosion from both natural and human activities depending on the time of year. Table 5-6. Soil Associations and Other Land Uses within the Planning Area Soil Association/Land Use Type Acreage Pico-Metz-Anacapa Association 7,530 Mocho-Sorrento-Garretson Association 2,270 Camarillo-Huneme-Pacheco Association 28,070 Riverwash-Sandy Alluvial Land-Coastal Beaches Association 3,040 Rincon-Huerhuero Association 670 Gullied Land-Pits and Dumps 670 Water 1,200 Other 1,800 Total 45,250 Other: The other category includes currently unclassified soil types Source: United States Geological Service, 1993 Excessive soil erosion can lead to damage of building foundations, roadways, dam embankments, and result in increased sedimentation to local drainage ways. Figure 5-12 identifies the K-factor for soil surfaces within the Planning Area. As shown in the figure, several locations are identified as areas easily susceptible to erosion processes. However, the development of structures consistent with local building regulations and the implementation of a variety of commonly used post-construction best management practices minimize the negative effects of erosion. Beach Erosion The City s coastline is part of an overall littoral cell that extends from Point Conception to Point Mugu. The concept of a littoral cell is based upon the natural production, transport, and loss or disposal of sediment materials, chiefly sand, along an ocean frontage or beach. The geographic extent of a littoral cell is based upon where sand is generated or introduced to the cell and where sand is eventually lost from the cell. The most common end or termination for a littoral cell is a submarine canyon, where sands tend to Page 5-64 Background Report April Oxnard_GP_Environmental_Resources_2006_04_20 MRD.doc
331 Draft 5. Environmental Resources Figure 5-11 Soil Associations April 2006 Background Report Page Oxnard_GP_Environmental_Resources_2006_04_20 MRD.doc
332 Santa ClaraRiver W ELL S R D LOS ANG ELES AVE N YAR D V VI E A E Beardsley OXNARD BLVD 101 5TH ST R evolon C hanne l W N S E Legend General Plan Area SOIL ASSOCIATIONS Pico-Metz-Anacapa Association Mocho-Sorrento-Garretson Association Camarillo-Hueneme-Pacheco-Association Riverwash-Sandy Alluvial Land-Coast Beaches Association Rincon-Huerhuero Association Gullied Land-Pits and Dumps Water Other Source: USGS, 1993;; USDA, 2005;; City of Oxnard, 2005;; and ESA, Figure 5-11 Soils Associations within the Planning Area Miles
333 City of Oxnard General Plan Draft (Back of Figure 5-11) Page 5-66 Background Report April Oxnard_GP_Environmental_Resources_2006_04_20 MRD.doc
334 Draft 5. Environmental Resources Figure 5-12 Soil Erosion April 2006 Background Report Page Oxnard_GP_Environmental_Resources_2006_04_20 MRD.doc
335 Santa Clara River W ELL S R D LOS ANG ELES AVE N YAR D V VI E A E Beardsley OXNARD BLVD 101 5TH ST R evolon C hanne l W N S E Legend General Plan Area EROSION SUSCEPTIBILITY 0.02 Very Low Low Moderate High Very High Not Classified Source: USGS, 1993;; USDA, 2005;; City of Oxnard, 2005;; and ESA, Figure 5-12 Erosion Susceptibility within the Planning Area Miles
336 City of Oxnard General Plan Draft (Back of Figure 5-12) Page 5-68 Background Report April Oxnard_GP_Environmental_Resources_2006_04_20 MRD.doc
337 Draft 5. Environmental Resources flow or sink away from the coast, making them unavailable to be transported to the next littoral cell. The most common source for sand generation within a cell is typically local waterways that deliver sand to the beach. Two major rivers, the Ventura and Santa Clara Rivers, and two submarine canyons strongly influence the littoral processes in the Planning Area. The entire Oxnard littoral cell is considered very active; that is, substantial volumes of sand are transported annually by littoral currents. The downcoast segment of the Oxnard littoral cell, which includes the City and extends from the Ventura River to Point Mugu, is characterized by relatively wide beaches and low backshore areas. This area has been affected by human activities, including construction of the Ventura and Channel Islands small craft harbors, and the Port of Hueneme. As a result of the construction of these harbors, a regular program of sand bypassing has been implemented to maintain navigation channels and sandy beaches. Because of the past shoreline erosion and beach sand replenishment problems, a joint powers authority was formed in 1986 to encourage coordination and cooperation between public and private agencies in efforts to protect, maintain, and enhance beaches and the coastline in Santa Barbara and Ventura counties. This joint powers authority, called BEACON (Beach Erosion Authority for Control Operations and Nourishment), recently released a draft Coastal Sand Management Plan. The purpose of this report is to promote consideration of a regional program for beach protection and sand replenishment for the Santa Barbara/Ventura coast. BEACON represents a joint powers authority that was formed in 1986 to protect, maintain, and enhance local beaches and coastline areas. According to the draft Coastal Sand Management Plan, the following conditions characterize the existing shoreline form the Ventura River to Point Mugu: The primary sources of sand for this area are the Ventura and Santa Clara Rivers. Historically, these rivers supplied an abundance of sand, resulting in broad beaches backed by extensive sand dunes. Dam construction and sand mining activities have reduced the rate of fluvial sand replenishment to the coast. Imbalances in the amount of littoral sand for this area imply that beach erosion will accelerate beginning in the mid-1990s. April 2006 Background Report Page Oxnard_GP_Environmental_Resources_2006_04_20 MRD.doc
338 City of Oxnard General Plan Draft Beaches in this area will continue to be dependent on dredging and sand by-pass operations.within the Planning Area, the McGrath Beach and Oxnard Shores areas are cited by BEACON as erosion hot spots because of expected reductions in the delivery of sand to the coast by the Santa Clara River. The report also indicated that a yearly deficit of sand creates chronic erosion problems down-coast of Ormond Beach Important Farmlands within the Planning Area Lands designated as Prime Farmland account for an estimated 9,890 acres within the Planning Area. As more fully described above under the Regulatory Setting section, the FMMP monitors the conversion of the State s farmland to and from agricultural use. Land within the City s Planning Area is represented by the breakdown in use between agricultural and urban land. In 2004, an estimated 23,380 acres (roughly half of the total Planning Area) were designated for some type of agricultural use. As shown in Table 5-7, lands designated as Prime Farmland account for an estimated 22% of the Planning Area. The Prime Farmland, Farmland of Statewide Importance, Unique Farmland, and Farmland of Local Importance designations are often referred to collectively as Important Farmlands. Important Farmlands account for the majority of farmland (22,960 acres) within the Planning Area (see Table 5-7). These Important Farmlands are identified in Figure Table 5-7 Land Use by FMMP Designation, Oxnard Planning Area FMMP Designation Acreage Percentage Prime Farmland 9, Farmland of Statewide Importance 11, Unique Farmland Farmland of Local Importance 110 Less than 1 Grazing 420 Less than 1 Urban and Built-Up Land 16, Other Categories 5, Total 45, Source: California Department of Conservation, Williamson Act Contracts As more fully described above under the Regulatory Setting section, a Williamson Act contract represents an agreement to restrict land to agricultural or open space uses in return for lower than normal property tax assessments. Figure 5-13 provides the locations of parcels within the Planning Area that have an active Williamson Act Contract. (NOTE TO READER: To be completed upon receipt of data from Ventura County). Page 5-70 Background Report April Oxnard_GP_Environmental_Resources_2006_04_20 MRD.doc
339 Draft 5. Environmental Resources Figure 5-13 Prime Farmland April 2006 Background Report Page Oxnard_GP_Environmental_Resources_2006_04_20 MRD.doc
340 Santa ClaraRiver W ELL S R D LOS ANG ELES AVE N YAR D V VI E A E Beardsley OXNARD BLVD 101 5TH ST R evolon C hanne l W N S E Legend General Plan Area FARMLAND Prime Farmland Farmland of Statewide Importance Unique Farmland Farmland of Local Importance Grazing Land Urban and Built Up Land Other Land Source: USGS, 1993;; California Department of Conservation, 2004;; City of Oxnard, 2005;; and ESA, Figure 5-13 Important Farmlands within the Planning Area Miles
341 City of Oxnard General Plan Draft (Back of Figure 5-13) Page 5-72 Background Report April Oxnard_GP_Environmental_Resources_2006_04_20 MRD.doc
342 Draft 5. Environmental Resources Figure 5-14 Key Agricultural Resources April 2006 Background Report Page Oxnard_GP_Environmental_Resources_2006_04_20 MRD.doc


343 126 Santa Clara River WELLS RD LOS ANG ELES AVE YARD AV E VI N E Beardsley LEWIS RD OXNARD BLVD 5TH ST 101 C alleguas Cree k R evolon C hanne l 1 W N S E Legend Source: City of Oxnard, 2005;; and County of Ventura, 2006 General Plan Area GREENBELTS Ventura-Oxnard Greenbelt Oxnard-Camarillo Greenbelt WILLIAMSON ACT LANDS Entire Non-Renewal Farmland Security Zone Act Land Conservation Act Partial Non-Renewal Figure 5-14 Williamson Act Lands within the Planning Area Miles
344 City of Oxnard General Plan Draft (Back of Figure 5-14) Page 5-74 Background Report April Oxnard_GP_Environmental_Resources_2006_04_20 MRD.doc
345 Draft 5. Environmental Resources Agricultural Production The Ventura County Agricultural Commissioner s Office provides a variety of county specific agricultural statistics (i.e., crop types, production values, etc.) on an annual basis. This section provides a summary of the key agricultural commodities or crops produced in the County. The general location of key agricultural resources within the Planning Area is provided in Figure Farming in Ventura County has always been a major contributor to the nation s food supply, as well as an important part of the rural lifestyle, which exists throughout much of the county. Agriculture also generates a substantial number of jobs ranging from crop production to processing, shipping and other related industries. Ventura County is recognized as one of the principal agricultural counties in the State, with gross revenues from the sales of agricultural commodities in the billions of dollars (see Table 5-8). Ventura County ranks tenth among the highest in agricultural revenues of the 58 agricultural counties in the State, and approximately 19,600 jobs were created in 2000 by agriculture in the County. Ventura County ranks tenth among the highest in agricultural revenues of the 58 agricultural counties in the State. The seasonal crop production pattern through out Ventura County is divided into two general categories: cool season and warm season crops. The cool season crops are generally harvested from fall through spring or early summer and include: broccoli, cauliflower, celery, lettuce and spinach. The warm season crops are harvested from mid-summer through fall and include: Fordhook green lima beans, snap beans, cucumbers, peppers and tomatoes. Year around crops include: cabbage (all year), strawberries (early spring to early summer) and lemons (January to mid- June). The overall mix of agricultural crops within the County has varied over the past years, but the top three agricultural crops for 2004 were strawberries, nursery stock and lemons (see Table 5-8). Table 5-8 Leading Crops for Ventura County, 2004 Rank Crop Value 1 Strawberries $363,646,000 2 Nursery Stock $221,999,000 3 Lemons $176,361,000 4 Avocados $124,661,000 5 Celery $122,832,000 6 Tomatoes $71,735,000 7 Cut Flowers $65,663,000 8 Raspberries $48,586,000 9 Peppers $34,628, Valencia Oranges $20,525,000 Source: Ventura County, 2005 April 2006 Background Report Page Oxnard_GP_Environmental_Resources_2006_04_20 MRD.doc
346 City of Oxnard General Plan Draft In spite of pressures such as increased agricultural land values, increased water cost, and compatibility problems with urban uses, agriculture activities have remained economically viable in the County because of the area s climate, soils and air quality. The total value in constant dollars of Ventura County s agricultural production has been increasing since the 1930 s Urban Encroachment The fact that produce makes up such a large part of the County s economy makes protecting agricultural land an important issue. Legislation such as the Williamson Act has been put in place to protect the State s agricultural lands and to avoid their premature and unnecessary urbanization. Greenbelt policies, such as the Oxnard-Camarillo and Oxnard-Ventura greenbelt agreements, have also been put into place in order to protect against urban encroachment. The Oxnard-Camarillo Agreement comprises approximately 27,000 acres of agricultural land between the two cities, combined with an additional 2,200 acres that was added in the Del Norte area when the County of Ventura became a party to the agreement as well. The Oxnard-Ventura Agreement comprises 2,460 acres of land of which a portion lies within the northwestern corner of the Planning Area. The City of Oxnard s 2020 General Plan has supported the expansion of the Oxnard-Camarillo Greenbelt south of State Route 1 (approximately 2,672 acres). Despite these efforts, however, urban encroachment is still an issue facing the City s agricultural resources. Future development will reduce the amount of open land within the Planning Area Water Supply Availability Agricultural operations within the southern portion of Ventura County receive the majority of their water from groundwater (generally privatelyowned wells) and public water districts that divert surface water from the Santa Clara River and various lakes and stream watersheds through an extensive network of canals and natural waterways. The United Water Conservation District (UWCD) is responsible for groundwater recharge throughout most of the Santa Clara River Valley and for the wholesale distribution of water to purveyors on the Oxnard Plain. Lake Piru is UWCD s reservoir for water which is released into the Santa Clara River for subsequent recharge into the underground aquifers for later urban and agricultural use. The Calleguas Municipal Water District is responsible for providing imported water for wholesale purposes to retail water purveyors serving municipal/industrial customer in the southeastern portions of the County. Page 5-76 Background Report April Oxnard_GP_Environmental_Resources_2006_04_20 MRD.doc
347 Draft 5. Environmental Resources Groundwater is the single most important source of water in the County. In 1985, it provided about 67% of the water utilized in the County. It is pumped extensively by individual well owners as well as purveyors who sell it at either retails sales to individuals or at wholesale to other purveyors. Since, overall, more groundwater is used than is replaced, the County s groundwater reserves are slowly decreasing (i.e., water is being extracted more rapidly than it is being replaced). 5.6 Mineral Resources This section provides a general overview of the mineral and energyproducing resources within the City s Planning Area. Topics covered in this section included the following: A discussion of applicable regulations specific to mineral and energy resources; and A description of active oil and gas wells; Methods This evaluation of local mineral and energy resources was completed using information collected from the California Department of Conservation s Division of Oil, Gas, and Geothermal Resources. Information from the California Geological Survey and the City s existing Oxnard General Plan 2020 were also reviewed. Key Terms Minerals. Any naturally occurring chemical element or compound, or groups of elements and compounds, formed from inorganic processes and organic substances, including, but not limited to, coal, peat, and bituminous rock, but excluding geothermal resources, natural gas, and petroleum. Gold, sand, gravel, clay, crushed stone, limestone, diatomite, salt, borate, potash, etc. are examples of minerals. Mineral Resource Zone. An area or land where deposits of commercially viable mineral or aggregated deposits are known to exist. This designation is applied to sites determined by the State Division of Mines and Geology as being a resource of regional significance, and is intended to help maintain the quarrying operations and protect them from encroachment of incompatible land uses. April 2006 Background Report Page Oxnard_GP_Environmental_Resources_2006_04_20 MRD.doc
348 City of Oxnard General Plan Draft Mining. The act or process of extracting resources, such as coal, oil, or minerals from the earth. The term also includes quarrying; well operation; milling, such as crushing, screening, washing and floatation; and other preparation customarily done at the mine site or as part of a mining activity Regulatory Setting Relevant State and local guidelines specific to mineral and energy resource issues are discussed in this section. State Regulations California Surface Mining and Reclamation Act of 1975 (SMARA). The loss of regionally significant mineral resource deposits to land uses that preclude mining activities is one of the main emphasis that SMARA was designed to address. The law specifically mandates a two-phased process, commonly referred to as classification-designation, for mineral resources. The California Geological Survey (previously called the California Division of Mines and Geology) is responsible under SMARA for carrying out the classification phase of the process. The California Mining and Geology Board is responsible for implementing the second phase. The second phase allows the designation of areas within a production-consumption (P-C) region that contain significant deposits of Portland cement concrete (PCC)-grade aggregate (valued for its versatility and its importance in construction) that may be needed to meet the region s future demand (California Department of Conservation, 1986). Regulations provided under SMARA require the State Geologist to classify lands into Mineral Resource Zones (MRZ) based on the known or estimated mineral resource potential of that land. The classification process is based solely on geology, without regard to land use or land ownership. The primary goal of mineral land classification is to help ensure that the mineral resource potential of lands is recognized and considered in the land use planning process. The MRZ categories are as follows: MRZ-1. Areas where adequate information indicates that no significant mineral deposits are present or where it is judged that little likelihood exists for their presence. MRZ-2. Areas where adequate information indicates significant mineral deposits are present, or where it is judged that a high likelihood exists for their presence. MRZ-3. Areas containing mineral deposits the significance of which cannot be evaluated from available data. Page 5-78 Background Report April Oxnard_GP_Environmental_Resources_2006_04_20 MRD.doc
349 Draft 5. Environmental Resources MRZ-4. Areas where available information is inadequate for assignment to any other MRZ. In addition to mineral resource conservation, the SMARA regulates surface mining operations within California. The California Mining and Geology Board have established reclamation regulations that fulfill the reclamation requirements of SMARA. These regulations are summarized below. Annual Mining Report. SMARA requires that a mining report be submitted annually and include such information as the amount of land disturbed during the previous year, acreage reclaimed during the previous year, and amendments to local reclamation plans. Reclamation Plan. Before a mining project is approved by a local jurisdiction, a reclamation plan must be prepared and approved. In general, the reclamation plan must include and satisfy the following requirements: Maximum anticipated depth of extraction; A description of the reclamation land use; A description of the manner in which reclamation will be accomplished; A description of the manner in which affected streambed channels and streambanks will be rehabilitated to a condition that minimizes erosion; Final slope stability as determined by a registered geotechnical engineer; Compaction of areas sited for roads, buildings, or other improvements; and Location of planned temporary stream or watershed diversions. Reclamation plans are also required to include performance standards for: Revegetation; Drainage and erosion controls; Reclamation of prime agricultural land and other agricultural land; Stream protection, including protection of surface water and groundwater; and Topsoil salvage. April 2006 Background Report Page Oxnard_GP_Environmental_Resources_2006_04_20 MRD.doc
350 City of Oxnard General Plan Draft Local Regulations Ventura County - Mineral Resource Management Plan. The County of Ventura has adopted a Mineral Resource Management Plan with the following policies requiring: Establishment of land use categories to allow timely mineral extraction in areas classified as MRZ-2 or designated to be of regional or statewide significance and the designation of land use zones to preserve mineral extraction access. Establishment of buffer zones around MRZ-2 Zones to allow the continued extraction of minerals and to avoid land use incompatibilities between mining activities and land uses surrounding the MRZ-2 Zones. According to the plan, compatible land uses include the following: Very Low Density Residential (0.1 units/acre) Extensive Industrial Recreation/Open Space Agriculture City of Oxnard - Oxnard 2020 General Plan. The combined Open Space/Conservation Element s of the City s existing General Plan contains an objective and several policies pertinent to mineral and energy resources Environmental Setting Important mineral/sand/gravel deposits are primarily located along the Santa Clara River channel, along Route 101 (Ventura Freeway) corridor and along the eastern edge of the City extending as far west as Oxnard Boulevard in several areas. These local resources are described in greater detail below. The location of these important sand/gravel deposits and existing oil wells within the Planning Area is identified in Figure Sand and Gravel Resources. Areas of significant mineral deposits within the City s Planning Area are identified as MRZ-2 and MRZ-3 areas. The City s MRZ-2 area encompasses the course of the Santa Clara River through the City and also a corridor of land along U.S. Route 101 (Ventura Freeway) from the Santa Clara River eastward to approximately Del Norte Avenue. MRZ-3 areas are located south of the Santa Clara River (west of Ventura Freeway) and a large area bordering State Route 1 through the center of the Planning Area. Page 5-80 Background Report April Oxnard_GP_Environmental_Resources_2006_04_20 MRD.doc
351 Draft 5. Environmental Resources Figure 5-15 Mineral Resources April 2006 Background Report Page Oxnard_GP_Environmental_Resources_2006_04_20 MRD.doc


352 126 Santa ClaraRiver W ELLS R D LOS ANG ELES AVE N YAR D AV E VI E Beards ley OXNARD BLVD 101 5TH ST R evolon C hanne l C a lleguas Cree k W N S E Legend General Plan Area CROP TYPES Barren and Wasteland Citrus and Subtropical Field Crops Grain and Hay Crops Idle Native Vegetation Not Classified Pasture Riparian Vegetation Truck, Nursery, and Berry Crops Urban Landscape Water Source: USGS, 1993;; California DWR, 2000;; City of Oxnard, 2005;; and ESA, Figure 5-15 Agricultural Resources within the Planning Area Miles


353 Santa ClaraRiver W ELL S R D LOS ANG ELES AVE N YAR D V VI E A E Beardsley OXNARD BLVD 101 5TH ST R evolon C hanne l 1 W N S E Source: USGS, 1993;; City of Oxnard, 2005;; and ESA, 2006 Legend General Plan Area MINERAL RESOURCES Designated MRZ-2 Non-Designated MRZ-2 ` MRZ-3 MRZ-3a Oil Wells Figure 5-16 Mineral Resources within the Planning Area Miles
354 City of Oxnard General Plan Draft Back of Figure 5-15 Page 5-82 Background Report April Oxnard_GP_Environmental_Resources_2006_04_20 MRD.doc
355 Draft 5. Environmental Resources Oil and Gas Resources. Four oil and gas fields are located within the City s current Planning Area: West Montalvo, El Rio, Santa Clara Avenue and Oxnard as shown in Table 5-6. The West Montalvo Field includes the area along the coastline and upstream from the mouth of the Santa Clara River and currently contains 29 active wells and 24 inactive or shut-in wells. The West Montalvo Field is the only local field to increase the number of active wells in recent years. The Santa Clara Avenue Field, located near Nyeland Acres, contains approximately 18 active oil and gas wells and 12 inactive wells. The Oxnard Field contains 38 active oil and gas wells and 59 inactive wells. The El Rio Field is located at the crossing of Ventura Freeway and the Santa Clara River. However, no recent production data is available for this field. An additional 50 abandoned oil well sites are located around the City s Planning Area but not within the identified oil fields shown in Table 5-9. Major petroleum companies with leases in the Planning Area include Chevron, Shell, Texaco, Mobil, and Western LNG. The remainder of the leases is with smaller independent companies. (City of Oxnard General Plan 2020). Table 5-9 Oil and Gas Field Production, Oxnard Planning Area Date Active Wells Inactive Wells Daily Production per Well (bbl) Net Gas Production (Mcf) West Montalvo , , , , ,890 Oxnard , , , , ,101 Santa Clara , , , , ,030 Notes: bbl = barrel, Mcf million cubic feet Source: Department of Conservation, 2005 April 2006 Background Report Page Oxnard_GP_Environmental_Resources_2006_04_20 MRD.doc
356 City of Oxnard General Plan Draft 5.7 Air Quality With the continuing growth in both local and regional population, air quality has become an issue of increasing concern for the South Central Coast Air Basin. To provide a better understanding of the current air quality conditions in the Planning Area, this section describes: Federal and State ambient air quality standards; Air quality planning and management for the City s Planning Area; Existing regional topography and climate; Existing air quality conditions in the Planning Area; and Sensitive receptors in the Planning Area. Methods Information presented in this section is based on printed reports and air quality monitoring data provided from the Ventura County Air Pollution Control District (VCAPCD) and the California Air Resources Board (CARB). Key Terms PM10. Dust and other particulates come in a range of particle sizes. Federal and State air quality regulations reflect the fact that smaller particles are easier to inhale and can be more damaging to health. PM10 refers to dust/particulates that are 10 microns in diameter or smaller. PM2.5 The Federal government has recently added standards for smaller dust particles. PM2.5 refers to dust/particulates that are 2.5 microns in diameter or smaller. The South Central Coast Air Basin is comprised of Ventura, Santa Barbara, and San Luis Obispo Counties. Ozone. Ozone is a pungent, colorless toxic gas created in the atmosphere by a photochemical reaction rather than emitted directly into the air. Motor vehicles are the major sources of ozone precursors. South Central Coast Air Basin. An air basin is a geographic area that exhibits similar meteorological and geographic conditions. California is divided into 15 air basins to assist with the statewide regional management of air quality issues. The City falls within the South Central Coast Air Basin. The South Central Coast Air Basin is comprised of Ventura, Santa Barbara, and San Luis Obispo counties. Page 5-84 Background Report April Oxnard_GP_Environmental_Resources_2006_04_20 MRD.doc
357 Draft 5. Environmental Resources Ventura County Air Pollution Control District (VCAPCD). The VCAPCD is the regulatory agency responsible for developing air quality plans, monitoring air quality, and reporting air quality data for the City s Planning Area Regulatory Setting Air quality conditions are subject to various Federal, State and local regulations. This section begins with a brief introduction to ambient air quality standards and follows with a brief overview of key regulations. Ambient Air Quality Standards Air quality in a given location is described as the concentration of various pollutants in the atmosphere, generally expressed in units of parts per million (ppm) or in micrograms per cubic meter (ug/m3). The type and amount of regulated air pollutants emitted into the atmosphere, the size and topography of the regional air basin, and the prevailing meteorological conditions determine air quality. The pollutants of greatest concern in the Planning Area are ozone, PM10, and PM2.5. The significance of a given pollutant s concentration is determined by comparison with Federal and State ambient air quality standards. Both the State of California and the Federal Government have established ambient air quality standards for several different pollutants, expressed as maximum allowable concentrations. For some pollutants, separate standards have been set for different periods of time. Most standards have been set to protect public health, although for some pollutants, standards have been based on other values (such as protection of crops, protection of materials, or avoidance of nuisance conditions). A summary of State and Federal ambient air quality standards is provided in Table The pollutants of greatest concern in the City s Planning Area are ozone and inhalable particulate matter (PM10 and PM2.5). April 2006 Background Report Page Oxnard_GP_Environmental_Resources_2006_04_20 MRD.doc
358 City of Oxnard General Plan Draft Table 5-10 Pollutant Ozone (O 3 ) Respirable Particulate Matter (PM10) Fine Particulate Matter (PM2.5) Carbon Monoxide (CO) Nitrogen Dioxide (NO 2 ) Sulfur Dioxide (SO 2 ) Lead 9 Ambient Air Quality Standards Average California Standards 1 Federal Standards 2 Time Concentration 3 Method 4 Primary 3, 5 Secondary 3, 5 Method 7 1 Hour 8 Hours Annual Arithmetic Mean 0.09 ppm (180 g/m 3 ) ppm (137 g/m 3 )* 20 g/m 3 Ultraviolet Photometry 0.12 ppm (235 g/ m 3 ) ppm (157 g/m 3 ) 8 24 Hours 50 g/m g/m 3 Gravimetric or Beta Attenuation * 50 g/m 3 24 Hours No Separate State Standards 65 g/m 3 Annual Arithmetic Mean 8 Hours 1 Hour 8 Hours (Lake Tahoe) Annual Arithmetic Mean 1 Hour Annual Arithmetic Mean 12 g/m ppm (10 mg/m 3 ) 20 ppm (23 mg/m 3 ) 6 ppm (7 mg/m 3 ) 0.25 ppm (470 g/m 3 ) 0.04 ppm (105 g/m 3 ) Gravimetric or Beta Attenuation Non-Dispersive Infrared Photometry (NDIR) Gas Phase Chemiluminescence 24 Hours Ultraviolet Fluorescence 3 Hours 1 Hour 30 Day Average Calendar Quarter 0.25 ppm (655 g/m 3 ) 15 g/m 3 9 ppm (10 mg/m 3 ) 8 35 ppm (40 mg/m 3 ) 8 Same as Primary Standard Same as Primary Standard Same as Primary Standard None ppm (100 g/m 3 ) ppm (80 g/m 3 ) 0.14 ppm (365 g/m 3 ) Same as Primary Standard 0.5 ppm (1,300 g/m 3 ) 1.5 g/m 3 ) Atomic Absorption 1.5 g/m 3 Same as Primary Standard Ultraviolet Photometry Inertial Separation and Gravimetric Analysis Inertial Separation and Gravimetric Analysis Non-Dispersive Infrared Photometry (NDIR) Gas Phase Chemiluminescenc e Spectrophotometr y (Paraosaniline Method) High Volume Sampler and Atomic Absorption Page 5-86 Background Report April Oxnard_GP_Environmental_Resources_2006_04_20 MRD.doc
359 Draft 5. Environmental Resources Table 5-10 Pollutant Visibility Reducing Particles Ambient Air Quality Standards (Continued) Average California Standards 1 Federal Standards 2 Time Concentration 3 Method 4 Primary 3, 5 Secondary 3, 5 Method 7 8 Hours Extinction coefficient of 0.23 per km visibility of ten miles or more ( miles or more for Lake Tahoe) due to particles when relative humidity is less than 70 percent. Method: Beta Attenuation and Transmittance through Filter Tape. No Federal Standards Sulfates 24 Hours 25 g/m 3 Ion Chromatography * No Federal Standards Hydrogen Sulfide Vinyl Chloride 9 1 Hour 24 Hours 0.03 ppm (42 g/m 3 ) 0.01 ppm (26 g/m 3 ) Ultraviolet Fluorescence Gas Chromatography No Federal Standards No Federal Standards Notes: *This concentration was approved by the Air Resources Board on April 28, 2005 and is expected to become effective in early California standards for ozone, carbon monoxide (except Lake Tahoe), sulfur dioxide (1 and 24 hours), nitrogen dioxide, suspended particulate matter PM10, PM2.5, and visibility reducing particles, are values that are not to be exceeded. All others are not to be equaled or exceeded. California ambient air quality standards are listed in the Table of Standards in Section of Title 17 of the California Code of Regulations 2. National Standards (other than ozone, particulate matter, and those based on annual averages or annual arithmetic mean) are not to be exceeded more than once a year. The ozone standard is attained when the fourth highest eight hour concentration in a year, averaged over three years, is equal to or less than the standard. For PM10, the 24 hour standard is attained when 99 percent of the daily concentrations, averaged over three years, are equal to or less than the standard. For PM2.5, the 24 hour standard is attained when 98 percent of the daily concentrations, averaged over three years, are equal to or less than the standard. Contact U.S. EPA for further clarification and current Federal policies 3. Concentration expressed first in units in which it was promulgated. Equivalent units given in parentheses are based upon a reference temperature of 25 C and a reference pressure of 760 torr. Most measurements of air quality are to be corrected to a reference temperature of 25 C and a reference pressure of 760 torr; ppm in this table refers to ppm by volume, or micromoles of pollutant per mole of gas 4. Any equivalent procedure which can be shown to the satisfaction of the CARB to give equivalent results at or near the level of the air quality standard may be used 5. National Primary Standards: The levels of air quality necessary, with an adequate margin of safety to protect the public health 6. National Secondary Standards: The levels of air quality necessary to protect the public welfare from any known or anticipated adverse effects of a pollutant 7. Reference method as described by the EPA. An equivalent method of measurement may be used but must have a consistent relationship to the reference method and must be approved by the EPA. 8. New Federal 8-hour ozone and fine particulate matter standards were promulgated by U.S. EPA on July 18, Contact U.S. EPA for further clarification and current Federal policies 9. The CARB has identified lead and vinyl chloride as toxic air contaminants with no threshold level of exposure for adverse health effects determined. These actions allow for the implementation of control measures at levels below the ambient concentrations specified for these pollutants Source: California Air Resources Board, May 6, 2005 Particulate Matter. Dust and other particulates come in a range of particle sizes. Federal and State air quality regulations reflect the fact that smaller particles are easier to inhale and can be more damaging to health. Very small particles of certain substances may produce injury by themselves in the respiratory tract, or may contain absorbed gases that April 2006 Background Report Page Oxnard_GP_Environmental_Resources_2006_04_20 MRD.doc
360 City of Oxnard General Plan Draft are injurious. Suspended in the air, particulates of aerosol size can both scatter and absorb sunlight, producing haze and reducing visibility. They can also cause a wide range of damage to materials. The State PM10 standards are 50 ug/m3 as a 24-hour average and 20 ug/m3 as an annual geometric mean. The Federal PM10 standards are 150 ug/m3 as a 24-hour average and 50 ug/m3 as an annual arithmetic mean. The State PM2.5 standard is 12 ug/m3 as an annual geometric mean. The Federal standards are 65 ug/m3 as a 24-hour average and 15 ug/m3 as an annual average. Particulate matter concerns within the City s Planning Area reflect a mix of rural and urban sources, including agricultural activities, industrial emissions, dust suspended by vehicle traffic, and secondary aerosols formed by reactions of nitrogen and sulfur oxides in the atmosphere. Ozone. An oxidant, ozone, can cause damage to vegetation and other materials, such as untreated rubber. Ozone in high concentrations can also directly affect the lungs, causing respiratory irritation and possible changes in lung functions. State standards for ozone have been set for 1-hour and 8-hour averaging times. The State 1-hour ozone standard is 0.09 ppm, not to be exceeded. The State 8-hour ozone standard is 0.07 ppm, not to be exceeded. The 8- hour standard was approved by the CARB on April 28, 2005 and is expected to become effective in early The Federal government has set an 8-hour ozone standard, which is 0.08 ppm for an 8-hour averaging time. This standard is violated if the 3-year average of the third-highest daily 8-hour maximum exceeds 0.08 ppm. Federal Regulations Federal Clean Air Act. The Federal Clean Air Act, adopted in 1970 and amended twice thereafter (including the 1990 amendments), establishes the framework for modern air pollution control. The act directs the Environmental Protection Agency (EPA) to establish ambient air standards for six pollutants: ozone, carbon monoxide, lead, nitrogen dioxide, particulate matter, and sulfur dioxide. The standards are divided into primary and secondary standards; the former are set to protect human health with an adequate margin of safety and the latter to protect environmental values, such as plant and animal life. Page 5-88 Background Report April Oxnard_GP_Environmental_Resources_2006_04_20 MRD.doc
361 Draft 5. Environmental Resources Areas that do not meet the ambient air quality standards are called nonattainment areas. The Federal Clean Air Act requires each state to submit a State Implementation Plan (SIP) for nonattainment areas. The SIP, which is reviewed and approved by the EPA, must demonstrate how the Federal standards will be achieved. Failing to submit a plan or to secure approval could result in denial of Federal funding and permits for such improvements as highway construction and sewage treatment plants. For cases in which the SIP is submitted by the state but fails to demonstrate achievement of the standards, the EPA is directed to prepare a Federal implementation plan. State Regulations California Clean Air Act (CCAA). The CCAA establishes an air quality management process that generally parallels the Federal process. The CCAA, however, focuses on attainment of the State ambient air quality standards, which, for certain pollutants and averaging periods, are more stringent than the comparable Federal standards. Responsibility for meeting California s standards lies with the CARB and local air pollution control districts (such as the VCAPCD, which covers the City s Planning Area). Compliance strategies are presented in district-level air quality management plans that are incorporated into the State implementation plan. The CCAA requires that air districts prepare an air quality attainment plan if the district violates State air quality standards for carbon monoxide, sulfur dioxide, nitrogen dioxide, or ozone. No locally prepared attainment plans are required for areas that violate the State PM10 standards. The CCAA requires that the State air quality standards be met as expeditiously as practicable but does not set precise attainment deadlines. Instead, the act established increasingly stringent requirements for areas that will require more time to achieve the standards. The VCAPCD is responsible for developing air quality plans, monitoring air quality, and reporting air quality data for the Planning Area. The air quality attainment plan requirements established by the CCAA are based on the severity of air pollution problems caused by locally generated emissions. Upwind air pollution control districts are required to establish and implement emission control programs commensurate with the extent of pollutant transport to downwind districts. Local Regulations Ventura County Air Pollution Control District (VCAPCD). The Planning Area is located within the South Central Coast Air Basin. Air quality planning for the City is under the authority of the VCAPCD. The VCAPCD is responsible for developing air quality plans, monitoring air April 2006 Background Report Page Oxnard_GP_Environmental_Resources_2006_04_20 MRD.doc
362 City of Oxnard General Plan Draft quality, and reporting air quality data for the City s Planning Area. The VCAPCD works with other regional and local governments to reduce air pollutant emissions through regulation of various sources. The air pollutants of most concern in the Planning Area are ozone and particulate matter. Motor vehicle emissions are the major source of ozone precursors in the Planning Area. The main sources of particulate matter include fugitive dust from agricultural and construction operations and emissions from industrial processes. The VCAPCD developed the 1991 Ventura County Air Quality Management Plan (AQMP) in response to the CCAA. The 1991 AQMP addressed attainment of the California air quality standards for ozone. The 1991 AQMP was amended in 1994, 1995, and 1997 to provide further emissions reduction guidance. The VCAPCD is currently revising the AMQP to comply with the Federal requirements regarding conformity of transportation activities to federally-approved air quality plans (transportation conformity). City of Oxnard - Oxnard 2020 General Plan. The Safety Element of the City s existing General Plan contains several policies pertinent to air quality issues Environmental Setting Climate and Atmospheric Conditions. Average temperatures within the Planning Area range from about 75 degrees in summer to 65 degrees in winter. Ventura County s diverse topography, which affects the County s air quality, is characterized by mountains to the north, hills to the east between Ventura and Los Angeles Counties, two major river valleys (the Santa Clara River which flows east-west and the Ventura River which flows roughly north-south), and the Oxnard Plain to the south and west. The Santa Monica Mountains rise above the Oxnard Plain to the south and continue east into Los Angeles County. The mountainous topography surrounding the lower lying portions of Ventura County, where most pollutants are emitted, contributes to poor air quality by acting as a barrier, which prevents winds from blowing away polluted air. The air above the Planning Area often exhibits weak vertical and horizontal dispersion characteristics. The region experiences temperature inversions, which limit atmosphere mixing and trap pollutants, resulting in high pollutant concentrations near ground level. Surface inversions (0-500 feet) are most frequent during winter; subsidence inversions (1,000 2,000 feet) are most frequent during summer. Generally, the lower the inversion Page 5-90 Background Report April Oxnard_GP_Environmental_Resources_2006_04_20 MRD.doc
363 Draft 5. Environmental Resources base height and the greater the temperature increase from the top, the more pronounced the effect the inversion will have on the inhibiting dispersion. The City s climate is characterized by cool winters and generally moderate summers. Marine air influences the climate throughout the year. According to the Western Regional Climate Center, average temperatures range from about 75 degrees F (24 degrees C) in summer to 65 degrees F (18 degrees C) in winter. Annual rainfall averages about 15 inches per year, with most rainfall occurring between November and April. Existing Emission Sources and Emission Levels Emissions are divided into two main categories: stationary and mobile. Stationary sources are those emission sources, such as industrial processes, burning crop residuals, and exposed soils/minerals (source of dust or PM10) that are fixed in place. Within the City, stationary-source pollutants include ozone precursors associated with local industrial processes and PM10 emissions associated with road dust, burning, construction and demolition activities, and fuel combustion (at stationary locations, such as industry residences). Natural sources of PM10 emissions include those resulting from wildfires. The primary source of mobile emissions is vehicles (automobiles, passenger trucks, trucks, and buses). Vehicle emissions are also the primary source of ozone precursors. The VCAPCD has established several monitoring stations in the South Central Coast Air Basin to measure air quality conditions. The nearest monitoring station to the City is located in El Rio, which is adjacent and to the north of the City of Oxnard. Monitoring data from the El Rio monitoring station is shown in Table 5-8. PM10 and PM2.5. The State 24-hour PM10 standard was exceeded between 0 and 5 times from 1999 to 2004 at the El Rio monitoring station. There is no State 24-hour PM2.5 standard. The Federal 24-hour PM2.5 standard was exceeded one time in 2003 and at no other time from 1999 to Ozone. The State 1-hour ozone standard was exceed once in 1999 and has not been exceeded since. The State 8-hour standard is not expected to become effective until early Initial 8-hour monitoring data indicates that the State 8-hour standard may occasional be exceeded at the El Rio monitoring station. April 2006 Background Report Page Oxnard_GP_Environmental_Resources_2006_04_20 MRD.doc
364 City of Oxnard General Plan Draft Table 5-11 Pollutant/ Monitoring Sensitive Receptors in the City Sensitive receptors are typically defined as populations or uses that are more susceptible to the effects of air pollution than the general population. For the Planning Area, sensitive receptors include the following populations or uses: long-term healthcare facilities, rehabilitation centers, convalescent centers, retirement homes, residences, schools, playgrounds, childcare centers, and athletic facilities. Summary of PM10, PM2.5, and Ozone Air Quality Monitoring Data ( ) Standard Station Parameter Federal California PM10 (ug/m3) El Rio Annual geometric mean NA N/A 29 Annual arithmetic mean 50 NA hour maximum PM2.5 (ug/m3) El Rio Ozone (ppm) El Rio Year Days above State standards Annual geometric mean NA 12 NA NA 13 NA NA 11 Annual arithmetic mean 15 NA NA NA NA hour maximum 65 NA Days above State standards hour maximum NA Days above State standards hour maximum b Days above State standards NA NA NA NA NA NA Notes: N/A = not available. Days above standard means days with one or more exceedance of the 1-hour ozone standards The State 8-hour ozone standard was approved by the CARB on April 28, 2005 and is expected to become effective in early 2006 Source: California Air Resources Board, Energy Conservation Energy conservation, such as efficient heating, cooling, and lighting, saves money and assists in the preservation of natural resources. By encouraging energy conservation within the community, the City of Oxnard helps to achieve its goals for a cleaner environment, healthier economy, and improved quality of life for all residents. Existing development review policies within the City ensure new construction within the community adheres to the 2005 Building Energy Efficiency Standards for Residential and Nonresidential Buildings as adopted by the California Energy Commission. These standards and regulations provide the criteria Page 5-92 Background Report April Oxnard_GP_Environmental_Resources_2006_04_20 MRD.doc
365 Draft 5. Environmental Resources for the integration of energy saving materials and design principles into new construction in an effort to preserve resources and promote conservation. In addition to the development review process, recent initiatives undertaken within City facilities to promote energy conservation initiatives include the following: Conversion of incandescent lighting to fluorescent or other energy saving lighting; Use of electronic ballasts for all replacements and new lighting installations; Use of energy efficient Heating Ventilation Air Conditioning (HVAC) equipment for all replacement and new installations; Lowering heating set-points and raising cooling set-points, as well as use of economizers at most facilities to improve energy efficiency; and Installation of low-flow toilets, urinals, and faucets for all replacements and new installations. April 2006 Background Report Page Oxnard_GP_Environmental_Resources_2006_04_20 MRD.doc
366 City of Oxnard General Plan Draft Please see next page. Page 5-94 Background Report April Oxnard_GP_Environmental_Resources_2006_04_20 MRD.doc
367 6. Safety and Hazards 6.1 Introduction This section of the Background Report identifies hazards that currently affect the planning area and the development of policies designed to protect and enhance the public health and safety. Some of these hazards may occur naturally such as flooding, earthquakes, or wildfires. Other health and safety factors may be man-made such as noise or hazardous materials. This section is divided into the following topics: Geologic, Seismic, and Soil Hazards (6.2) Natural Hazards (6.3) Noise (6.4) Hazardous Materials and Uses (6.5) Transportation Hazards (6.6) 6.2 Geologic, Seismic, and Soil Hazards This section describes the general topographical, geologic, and seismic conditions that characterize the City s Study Area. To provide a better understanding of the existing geologic and seismic conditions of the City, this section describes: Regulations associated with geologic and seismic issues; Locations of active and potentially active faults and associated seismic hazards, and Other geologic hazards unique to the Study Area. Background information specific to the Planning Area s soil conditions is addressed in Section Agriculture & Soils. Mineral resource issues are addressed in Section Mineral & Energy Resources. Methods This evaluation of geologic and seismic hazard conditions was completed using information collected from the United States Geological Survey and the California Department of Conservation Division of Mines and Geology (CDMG). April 2006 Background Report Page Oxnard_GP_Safety_and_Hazards_2006_04_20 MRD.doc
368 City of Oxnard General Plan Draft Key Terms Alquist-Priolo Fault Zone. The Alquist-Priolo Earthquake Fault Zoning Act, passed in 1972, requires the State Geologist to identify zones of special study around active faults. An active fault is defined as a fault that has moved within the last 10,000 to 12,000 years (Holocene time). Fault. A fault is a fracture in the Earth s crust that is accompanied by displacement between the two sides of the fault. An active fault is defined as a fault that has moved in the last 10,000 to 12,000 years (Holocene time). A potentially active fault is one that has been active in the past 1.6 million years (Quaternary period). A sufficiently active fault is one that shows evidence that Holocene displacement occurred on one or more of its segments or branches (Hart, 1997). Landslide. Downslope movement of soil and/or rock, which typically occurs during an earthquake or following heavy rainfall. Liquefaction. Liquefaction in soils and sediments occurs during some earthquake events, when material is transformed from a solid state into a liquid state because of increases in pressure in the pores (the spaces between soil particles). Earthquake-induced liquefaction most often occurs in low-lying areas with soils or sediments composed of unconsolidated, saturated, clay-free sands and silts, but it can also occur in dry, granular soils or saturated soils with some clay content. Magnitude increases logarithmically in the Richter scale; thus, an earthquake of magnitude 7.0 is thirty times stronger than one of magnitude 6.0. Magnitude. Earthquake magnitude is measured by the Richter scale, indicated as a series of Arabic numbers with no theoretical maximum magnitude. The greater the energy released from the fault rupture, the higher the magnitude of the earthquake. Magnitude increases logarithmically in the Richter scale; thus, an earthquake of magnitude 7.0 is thirty times stronger than one of magnitude 6.0. Earthquake energy is most intense at the point of fault slippage, which is called the epicenter because the energy radiates from that point in a circular wave pattern; the farther an area is from an earthquake s epicenter, the less likely that area is to be affected by groundshaking Regulatory Setting Relevant State and local guidelines specific to geologic and seismic hazards are discussed in this section. State Regulations Alquist-Priolo Earthquake Fault Zoning Act. The Alquist-Priolo Earthquake Fault Zoning Act (formerly the Alquist-Priolo Special Studies Zone Act), signed into law December 1972, requires the delineation of zones along active faults in California. The purpose of the Alquist-Priolo Act is to regulate development on or near active fault traces to reduce the Page 6-2 Background Report April Oxnard_GP_Safety_and_Hazards_2006_04_20 MRD.doc
369 Draft 6. Safety and Hazards hazards associated with fault rupture and to prohibit the location of most structures for human occupancy across these traces. Cities and counties must regulate certain development projects within these zones, which include withholding development permits until geologic investigations demonstrate that development sites are not threatened by future surface displacement (Hart, 1997). Surface fault rupture is not necessarily restricted to the area within an Alquist-Priolo Zone. Seismic Hazards Mapping Act. The Seismic Hazards Mapping Act was developed to protect the public from the effects of strong groundshaking, liquefaction, landslides, or other ground failure, and from other hazards caused by earthquakes. This act requires the State Geologist to delineate various seismic hazard zones and requires cities, counties, and other local permitting agencies to regulate certain development projects within these zones. Before a development permit is granted for a site within a seismic hazard zone, a geotechnical investigation of the site has to be conducted and appropriate mitigation measures incorporated into the project design. California Building Code. The California Building Code is another name for the body of regulations known as the California Code of Regulations (C.C.R.), Title 24, Part 2, which is a portion of the California Building Standards Code. Title 24 is assigned to the California Building Standards Commission, which, by law, is responsible for coordinating all building standards. Under State law, all building standards must be centralized in Title 24 or they are not enforceable (Bolt, 1988). Published by the International Conference of Building Officials, the Uniform Building Code is a widely adopted model building code in the United States. The California Building Code incorporates by reference the Uniform Building Code with necessary California amendments. About one-third of the text within the California Building Code has been tailored for California earthquake conditions. California Department of Transportation Highway Design Manual. The California Department of Transportation (Caltrans) has developed roadway design standards including those for seismic safety. Consideration of earthquake hazards in roadway design is detailed in the Highway Design Manual published by Caltrans (1995). Modifications to local highways and roads would be required to adhere to Caltrans engineering standards. Local Regulations City of Oxnard - Oxnard 2020 General Plan. The Safety Element of the City s existing General Plan contains an objective and several policies pertinent to geologic and seismic hazard conditions. April 2006 Background Report Page Oxnard_GP_Safety_and_Hazards_2006_04_20 MRD.doc
370 City of Oxnard General Plan Draft Environmental Setting The Study Area is situated on the Oxnard Plain which is located near the western edge of the Transverse Range Province. The Coastal Mountains and the Sierra Nevada Range are located to the north and the peninsular ranges to the south. Local geologic conditions of the Study Area consist of coastal lowland areas that range in elevation from sea level to about 115 feet above sea level. These areas are comprised of alluvial deposits of silt, sands and gravel, which extend to a depth of approximately 500 feet beneath the Study Area. The history of alluviation is related to the Santa Clara River and its flood patterns. Beneath the alluvium lies the San Pedro formation (approximately 4,000 feet thick beneath the City), which consists of moderately indurated sandstones and conglomerates. Seismic Activity The potential earthquake-induced hazards that may affect the City of Oxnard consist of fault rupture and strong ground motions, and the secondary effects of ground motion, such as liquefaction and tsunamis. Each of these is discussed below. Seismicity and Regional Faults The Study Area is located within Seismic Risk Zone 4. Earthquakes occurring in Seismic Risk Zone 4 have the potential to create the greatest impacts compared to the other risk zones. Areas within Seismic Zone 4, have a one in ten chance that an earthquake with an active peak acceleration level of 0.04g (4/10 the acceleration of gravity) will occur within the next fifty years. The CDMG has determined the probability of earthquake occurrences and their associated peak ground accelerations throughout the State of California. According to the CDMG s probabilistic seismic hazard map for California, peak ground accelerations in the Study Area could range from 0.50 g to 0.80 g (California Geological Survey, 1998). The City will probably experience ground shaking from earthquake activity that is most likely associated with the historically active faults in the surrounding area (see Figure 6-1). The resultant ground shaking could be severe with an earthquake of maximum credible or probable magnitude in one of the nearby faults. The estimated maximum (moment) magnitudes (Mw) represent characteristic earthquakes on particular faults. The maximum credible earthquake for a particular fault is the largest magnitude event that appears capable of occurring under the presently known tectonic framework. The maximum probable earthquake is the maximum earthquake likely to occur during a 100-year interval. It is Page 6-4 Background Report April Oxnard_GP_Safety_and_Hazards_2006_04_20 MRD.doc
371 Draft 6. Safety and Hazards Figure 6-1 Fault Systems (NOTE TO REVIEWER: Figure in progress) April 2006 Background Report Page Oxnard_GP_Safety_and_Hazards_2006_04_20 MRD.doc

 N W E S Source: USGS, 1993;; California")

372 Santa Clara River Be ardsle y 101 C a lleguas Cre e k R v o e on 1 l Channe l Legend General Plan Area Liquefaction Areas Historically Active Faults Holocene (10,000 years to today) Quaternary (1,800,000 years to today) N W E S Source: USGS, 1993;; California Department of Conservation, 2005;; City of Oxnard;; and ESA, 2006 Figure 6-1 Seismic Hazard Areas and Known Faults within the Planning Area Miles
Chapter 1 Introduction
 ExhibÌt 2b Ðraft Background Report - chapter 1 lntroduction CountY of Ventura Planning Cómmiásion Work Session #3 ' * PLz-0141- Agenda ltem 6 ein oit 2b - Draft Background léóãtt - ChaPter I lntroduction
City of Oxnard. Public Works Integrated Master Plan PROJECT MEMORANDUM 1.3 POPULATION AND LAND USE ESTIMATES. REVISED FINAL DRAFT September 2017
 This document is released for the purpose of information exchange review and planning only under the authority of Tracy Anne Clinton, September 2017, State of California, PE No. 48199 and Inge Wiersema,
City of Oxnard. Public Works Integrated Master Plan
 City of Oxnard This document is released for the purpose of information exchange review and planning only under the authority of Hugh Steve McDonald, December 20, State of California, PE No. 44074 and
6. Cumulative Impacts
 6.1 OVERVIEW Section 15355 of the California Environmental Quality Act (CEQA) Guidelines defines cumulative impacts as: "...two or more individual effects which when considered together, are considerable
7.0 GROWTH-INDUCING IMPACTS
 7.0 GROWTH-INDUCING IMPACTS 1. PURPOSE The California Environmental Quality Act (CEQA) requires a discussion of the ways in which a project could foster economic or population growth, or the construction
SECTION 5: ALTERNATIVES TO THE PROPOSED PROJECT
 SECTION 5: ALTERNATIVES TO THE PROPOSED PROJECT 5.1 - Introduction In accordance with CEQA Guidelines Section 15126.6, this Draft Subsequent Environmental Impact Report (DSEIR) contains a comparative impact
5 CEQA Required Conclusions
 5 CEQA Required Conclusions This section presents a summary of the impacts of the proposed Pacifica General Plan on several subject areas specifically required by CEQA, including significant irreversible
Towards a Greener Southern California: Regional Transportation Plan/ Sustainable Communities Strategy
 SOUTHERN CALIFORNIA ASSOCIATION of GOVERNMENTS Towards a Greener Southern California: 2012-2035 Regional Transportation Plan/ Sustainable Communities Strategy Hasan Ikhrata Executive Director 2 SCAG Quick
Section 4.13 Population and Housing Introduction
 Section 4.13 Population and Housing 4.13.1 Introduction This section addresses potential impacts of the Project on population, housing, and employment in the Project area; and provides an overview of current
5. OTHER CEQA CONSIDERATIONS
 5. OTHER CEQA CONSIDERATIONS Cumulative Impacts CEQA requires the analysis of impacts due to cumulative development that would occur independent of, but during the same timeframe as, the project under
2. PROJECT DESCRIPTION
 2. PROJECT DESCRIPTION AND DEMOGRAPHIC INFORMATION Introduction The Fresno County General Plan is being updated to provide a more current long-term framework for growth in the County and protection of
Update and Status Report for the Comprehensive Transportation Plan. December 2, 2011
 Update and Status Report for the Comprehensive Transportation Plan December 2, 2011 Overview Comprehensive Transportation Plan (CTP) and Outreach CTP Framework and Program of Projects Alternative Transportation
OTHER CEQA CONSIDERATIONS
 Chapter 5 OTHER CEQA CONSIDERATIONS CEQA Guidelines Section 15128 requires that an EIR disclose the reasons why various possible environmental effects of a proposed project are found not to be significant
SECTION 9.0 Effects Found Not To Be Significant
 SECTION 9.0 Effects Found Not To Be Significant 9.0 EFFECTS FOUND NOT TO BE SIGNIFICANT The City of Santa Clarita conducted an Initial Study in April 2006 to determine significant effects of the proposed
Once known as warehousing and distribution, the process
 Map III-2.3 Proposed Agile Port Industrial Area AGILE PORT INDUSTRIAL AREA PLAN Once known as warehousing and distribution, the process of moving goods to market has evolved dramatically. No longer is
Introduction Page I-1 INTRODUCTION
 Introduction Page I-1 INTRODUCTION The Arcata General Plan: 2020 will help shape how the city of Arcata will look, function, provide services, and manage resources for the next 20 years. The plan is the
I. I N T R O D U C T I O N
 I. INTRODUCTION 2035 INTRODUCTION A. FUNCTION AND INTENT OF THE GENERAL PLAN A General Plan serves as a long-term policy guide for the physical, economic, and environmental growth of a City. It is a statement
TABLE OF CONTENTS Watson Ranch Specific Plan Draft Environmental Impact Report
 TABLE OF CONTENTS Watson Ranch Specific Plan Draft Environmental Impact Report 1. Introduction 1-1 1.1 Project Overview 1-1 1.2 Purpose of Environmental Impact Report 1-1 1.3 Lead Agency and Responsible
METROPOLITAN BAKERSFIELD GENERAL PLAN UPDATE GREATER BAKERSFIELD CHAMBER OF COMMERCE
 METROPOLITAN BAKERSFIELD GENERAL PLAN UPDATE GREATER BAKERSFIELD CHAMBER OF COMMERCE JUNE 12, 2009 PURPOSE OF WORKSHOP MAJOR INFLUENCES PUBLIC OUTREACH REPORT EXISTING CONDITIONS REPORT SB 375/AB 32/AB
REGIONAL PLANNING AND POLICY FRAMEWORK A Preferred Approach for our Regional Growth
 REGIONAL PLANNING AND POLICY FRAMEWORK A Preferred Approach for our Regional Growth The Regional Comprehensive Plan (RCP) establishes a new approach to planning in the San Diego region. This approach is
Section 4.13 Population and Housing Introduction Environmental Setting. Regional and Local Population Trends
 4.13.1 Introduction Section 4.13 Population and Housing This section addresses potential impacts of the proposed project on population, housing, and employment in the project area and provides an overview
NOTICE OF PREPARATION OF ENVIRONMENTAL IMPACT REPORT FOR WOODLAND RESEARCH & TECHNOLOGY PARK SPECIFIC PLAN FOCUS OF INPUT NOP RESPONSES
 NOTICE OF PREPARATION OF ENVIRONMENTAL IMPACT REPORT FOR WOODLAND RESEARCH & TECHNOLOGY PARK SPECIFIC PLAN To: Responsible Agencies, Trustee Agencies, Organizations, and Interested Parties From: Erika
III. BASIS FOR CUMULATIVE ANALYSIS
 III. BASIS FOR CUMULATIVE ANALYSIS III. BASIS FOR CUMULATIVE ANALYSIS The California Environmental Quality Act (CEQA) requires that Environmental Impact Reports (EIRs) analyze cumulative impacts. As defined
Second Addendum to Final Environmental Impact Report for The City of Calabasas 2030 General Plan
 Attachment J Second Addendum to Final Environmental Impact Report for The 2030 General Plan Prepared by: 100 Civic Center Way Calabasas, California 91302 Contact: Tom Bartlett, AICP City Planner (818)
SECTION 6.0 Alternatives to the Proposed Project
 SECTION 6.0 Alternatives to the Proposed Project 6.0 ALTERNATIVES TO THE PROPOSED PROJECT CEQA requires that an EIR include an analysis of a range of project alternatives that could feasibly attain most
APPENDIX A-1. SECTOR PROFILE RESULTS
 References APPENDIX A-1. SECTOR PROFILE RESULTS This Appendix summarizes the effects of 8 inches, 16 inches and 58 inches (about 5 feet) of sea level rise (SLR) on routine monthly high tide inundation
LOCAL AGENCY FORMATION COMMISSION REGULAR MEETING AGENDA. Wednesday, March 8, :00 a.m.
 LOCAL AGENCY FORMATION COMMISSION REGULAR MEETING AGENDA Wednesday, 9:00 a.m. Board of Supervisors' Hearing Room, Room 381B Kenneth Hahn Hall of Administration 500 West Temple Street, Los Angeles 90012
Section 3.9 Land Use and Planning ENVIRONMENTAL SETTING
 Section 3.9 Land Use and Planning This section evaluates the existing land use setting and potential land use and planning impacts that may result from construction and/or operation of the proposed project.
2016 MAJOR GENERAL PLAN AMENDMENT
 2016 MAJOR GENERAL PLAN AMENDMENT GROWTH AREAS ELEMENT GROWTH AREAS ELEMENT 4.0 GOALS 1. Encourage orderly development within Growth Areas. 2. Encourage balanced, mixed use and multi-modal development
2.1 Summary of Existing and Future Population Estimates
 SECTION 2 Demographics This technical memorandum identifies the uncertainties and describes potential future demographics that might affect wastewater facilities in the City of McCall, Idaho (the City).
San Ramon City Center Draft Subsequent EIR
 San Ramon City Center State Clearinghouse Number 2007042022 Prepared for: City of San Ramon Planning/Community Development Department Planning Services Division 2222 Camino Ramon San Ramon, CA 94583 Prepared
Notice of Preparation for the Copeland Creek Stormwater Detention Basin (CIP Project )
") Copeland Creek Stormwater Detention Basin (CIP Project 2006-04) Date: December 20, 2017 To: Public Agencies and Interested Persons From: Mary Grace Pawson, Director of Development Services, City of Rohnert
Copeland Creek Stormwater Detention Basin (CIP Project 2006-04) Date: December 20, 2017 To: Public Agencies and Interested Persons From: Mary Grace Pawson, Director of Development Services, City of Rohnert
3.0 CUMULATIVE IMPACT ANALYSIS METHODOLOGY
 3.0 CUMULATIVE IMPACT ANALYSIS METHODOLOGY 1. PURPOSE The purpose of this section is to explain the methodology for the cumulative project analysis presented in this EIR. This section is important because,
2017 Countywide Comprehensive Transportation Plan. Transportation Plan. Draft Environmental Impact Report. Volume
 2017 Countywide Comprehensive Transportation Plan Draft Environmental Impact Report 2017 Countywide Comprehensive Transportation Plan State Clearinghouse #2017022054 ic l b ew u P vi t Rer a f D Volume
Chapter 5 Transportation Draft
 Chapter 5 Transportation Draft Discussion Similar to the other elements in the Comprehensive Plan, the transportation element impacts the quality of life, economic development and public safety of the
5.0 LONG-TERM CEQA CONSIDERATIONS
 5.0 LONG-TERM CEQA CONSIDERATIONS Section 15126 of the CEQA Guidelines requires that all phases of a project must be considered when evaluating its impact on the environment, including planning, acquisition,
SECTION 5: ALTERNATIVES TO THE PROPOSED PROJECT
 City of American Canyon Broadway District Specific Plan Alternatives to the Proposed Project SECTION 5: ALTERNATIVES TO THE PROPOSED PROJECT 5.1 Introduction In accordance with CEQA Guidelines Section
Notice of Preparation for the General Plan Environmental Impact Report
 July 200 TEHAMA COUNTY GENERAL PLAN Notice of Preparation for the General Plan Environmental Impact Report 1.0 INTRODUCTION 1.1 INTRODUCTION AND REGULATORY GUIDANCE This document is a Notice of Preparation
Amador County General Plan Final Environmental Impact Report
 ENVIRONMENTAL IMPACT REPORT FINAL JULY 2016 Amador County General Plan Final Environmental Impact Report Prepared for: Amador County 810 Court Street Jackson, CA 95642 Contact: Susan Grijalva Planning
Purpose and Organization PROGRAM ENVIRONMENTAL IMPACT REPORT. Native American Consultation Workshop
 PROGRAM ENVIRONMENTAL IMPACT REPORT Native American Consultation Workshop A Presentation by the Southern California Association of Governments October, 2015 Purpose and Organization Introduction Draft
County of Calaveras Department of Planning
 Date: July 18, 2013 To: From: Project: Advisory Agencies Amy Augustine, AICP - Planner County of Calaveras Department of Planning Rebecca L. Willis, AICP ~ Planning Director Phone (209) 754-6394 Fax (209)
3.0 CUMULATIVE PROJECTS SCENARIO
 3.0 CUMULATIVE PROJECTS SCENARIO The CEQA Guidelines define cumulative impacts as two or more individual effects that, when considered together, are considerable or which compound or increase other environmental
FACT SHEETS SAN BERNARDINO COUNTY
 FACT SHEETS SAN BERNARDINO COUNTY WHAT IS THE REGIONAL TRANSPORTATION PLAN/ SUSTAINABLE COMMUNITIES STRATEGY (RTP/SCS) Every four years the Southern California Association of Governments (SCAG) prepares
FINAL ENVIRONMENTAL IMPACT REPORT Volume 1. NBC Universal Evolution Plan ENV EIR STATE CLEARINGHOUSE NO Council District 4
 Division of Land / Environmental Review City Hall 200 N. Spring Street, Room 750 Los Angeles, CA 90012 FINAL ENVIRONMENTAL IMPACT REPORT Volume 1 ENV-2007-0254-EIR STATE CLEARINGHOUSE NO. 2007071036 Council
2030 General Plan. Goals & Policies
 2030 General Plan Goals & Policies September, 2011 City of Oxnard California 2030 General Plan Goals and Policies Development Services Department Planning Division!! September 2011 ! "#$%&'(&) '*!%*!+&
Community Development Department Telephone: (650)
") Community Development Department Telephone: (650) 780-7234 Planning & Housing Services Facsimile: (650) 780-0128 1017 Middlefield Road TDD: (650) 780-0129 P.O. Box 391 Redwood City, CA 94064 Website: www.redwoodcity.org
Community Development Department Telephone: (650) 780-7234 Planning & Housing Services Facsimile: (650) 780-0128 1017 Middlefield Road TDD: (650) 780-0129 P.O. Box 391 Redwood City, CA 94064 Website: www.redwoodcity.org
Chapter 5 - Transportation
 Chapter 5 - Transportation Discussion Similar to the other elements in the Comprehensive Plan, the transportation element impacts the quality of life, economic development and public safety of the residents
SECTION 2: PROJECT DESCRIPTION
 SECTION 2: PROJECT DESCRIPTION 2.1 - Project Location The proposed incorporation of the Arden Arcade Community (project or proposed incorporation) would result in the establishment of a new city. LAFCo
REQUEST FOR PROPOSALS (RFP) FOR DROUGHT ECONOMIC STUDY OF THE OJAI VALLEY
 FOR DROUGHT ECONOMIC STUDY OF THE OJAI VALLEY") REQUEST FOR PROPOSALS (RFP) FOR DROUGHT ECONOMIC STUDY OF THE OJAI VALLEY PROJECT DESCRIPTION The Ojai Valley has been experiencing significant drought since 2012. Lake Casitas is the backup water supply
REQUEST FOR PROPOSALS (RFP) FOR DROUGHT ECONOMIC STUDY OF THE OJAI VALLEY PROJECT DESCRIPTION The Ojai Valley has been experiencing significant drought since 2012. Lake Casitas is the backup water supply
The following findings are hereby adopted by The Regents in conjunction with the approval of the Project which is set forth in Section III, below.
 CALIFORNIA ENVIRONMENTAL QUALITY ACT FINDINGS IN CONNECTION WITH THE APPROVAL OF THE EAST CAMPUS STUDENT HOUSING PHASE III DEVELOPMENT PROJECT UNIVERSITY OF CALIFORNIA, IRVINE I. ADOPTION OF THE MITIGATED
April 14, Re: Comments on Draft Background Report for Ventura County General Plan Update
 Ms. Susan Curtis Project Manager, General Plan Update Ventura County Resource Management Agency 800 S. Victoria Avenue Ventura, CA 93009 Re: Comments on Draft Background Report for Dear Ms. Curtis, This
SUSTAINABLE COMMUNITIES STRATEGY
 SUSTAINABLE COMMUNITIES STRATEGY Introduction With each RTP update cycle, BCAG prepares a Sustainable Communities Strategy (SCS) as required under Senate Bill 375 (SB 375). The SCS demonstrates the integration
CHAPTER SUMMARY. Chapter 4 Socioeconomics
 Chapter Socioeconomics 0 0 CHAPTER SUMMARY This chapter characterizes the existing socioeconomic conditions of the proposed Project area and vicinity, as well as the factors contributing to positive or
II. PROJECT DESCRIPTION
 II. PROJECT DESCRIPTION This description has been prepared in accordance with Section 15124 of the California Environmental Quality Act (CEQA) Guidelines. The proposed, known as the Area 9 Specific Plan,
- FACT SHEET - THE GUIDING PRINCIPLES
 THE GUIDING PRINCIPLES The General Plan begins with seven ideas that together create a vision for the City s future. When the City approved the General Plan in 1994, these idea were dubbed the Seven Guiding
4.13 POPULATION, EMPLOYMENT, AND HOUSING; GROWTH INDUCEMENT; AND ENVIRONMENTAL JUSTICE
 4.13 POPULATION, EMPLOYMENT, AND HOUSING; GROWTH INDUCEMENT; AND ENVIRONMENTAL JUSTICE This section describes the existing and projected demographics of the project area and analyzes the LWRP 2020 Plan
Policy NR Maintain the natural and functional characteristics of Portsmouth s soils. (Related Policies: AG 1.1, LU 6.2)
") PORTSMOUTH DRAFT COMPREHENSIVE COMMUNITY PLAN POLICY STATEMENTS SUMMARY 1 NATURAL RESOURCES Policy NR - 1.1 - Ensure that new development and redevelopment in Portsmouth takes place in a manner which protects
PORTSMOUTH DRAFT COMPREHENSIVE COMMUNITY PLAN POLICY STATEMENTS SUMMARY 1 NATURAL RESOURCES Policy NR - 1.1 - Ensure that new development and redevelopment in Portsmouth takes place in a manner which protects
RE-ISSUED NOTICE OF PREPARATION SUBSEQUENT ENVIRONMENTAL IMPACT REPORT
 RE-ISSUED NOTICE OF PREPARATION SUBSEQUENT ENVIRONMENTAL IMPACT REPORT Date: January 5, 2010 Subject: Re-Issue Notice of Intent to Prepare a Draft Subsequent Environmental Impact Report Project Title:
City of Malibu. Whole Foods and the Park Shopping Center Draft Environmental Impact Report Volume I. Prepared For: Prepared by:
 City of Malibu Whole Foods and the Park Shopping Center Draft Environmental Impact Report Volume I Prepared For: Prepared by: I M PA C T S C I E N C E S, I N C. 638 East Colorado Blvd, Suite 301 Pasadena,
CITY OF TEHACHAPI GENERAL PLAN Draft Environmental Impact Report
 City of Tehachapi CITY OF TEHACHAPI GENERAL PLAN Draft Environmental Impact Report SCH No. 2009101084 Prepared for: City of Tehachapi Community Development Department 115 South Robinson Street Tehachapi,
Municipal Service Review
 Willow Creek Community Services District Municipal Service Review May 2008 Prepared by: For the District Sphere of Influence Report TABLE OF CONTENTS Page Local Agency Formation Commission Authority...
Carpinteria Valley Water District Carpinteria Advanced Purification Project
 NOTICE OF PREPARATION AND SCOPING MEETING Carpinteria Valley Water District Carpinteria Advanced Purification Project TO: Agencies, Organizations, and Interested Parties DATE: January 7, 2019 SUBJECT:
4.10 LAND USE ENVIRONMENTAL SETTING
 4.10 LAND USE 4.10.1 ENVIRONMENTAL SETTING The proposed Project consists of construction and operation of two 8-inch crude oil pipelines (within one trench) and equipment for storage and pumping from the
XI. Thornton Planning Area
 XI. A. OVERVIEW The covers 120 square miles in the northwest corner of San Joaquin County. It consists primarily of low-lying Delta islands, sloughs, and large farms. The town of Thornton, a small agriculturally-based
Stockton General Plan 2035
 General Plans in general California Government Code Section 65300. Each planning agency shall prepare and adopt a comprehensive, long-term general plan for the physical development of the city, and of
Table of Contents. City of Redlands - Redlands Crossing Center
 City of Redlands - Redlands Crossing Center Executive Summary... ES-1 Section 1: Introduction...1-1 1.1 - Overview of the CEQA Process...1-1 1.2 - Scope of the EIR...1-5 1.3 - Organization of the EIR...1-8
ALBION FLATS DEVELOPMENT EXISTING TRAFFIC CONDITIONS AND POTENTIAL IMPACTS
 EXISTING TRAFFIC CONDITIONS AND POTENTIAL IMPACTS FINAL REPORT SEPTEMBER 2010 TABLE OF CONTENTS 1.0 INTRODUCTION 1 2.0 EXISTING TRAFFIC CONDITIONS 2 3.0 FUTURE TRAFFIC CONDITIONS 3 4.0 POTENTIAL IMPACTS
Welcome! Overview Agenda: 6:00 pm 6:30 pm: Welcome & Sign-In. 6:30 pm 7:00 pm: Link US Presentation. 7:00 pm 8:00 pm: Open House
 Welcome! Overview Agenda: 6:00 pm 6:30 pm: Welcome & Sign-In 6:30 pm 7:00 pm: Link US Presentation 7:00 pm 8:00 pm: Open House 1 Link Union Station (Link US) (formerly SCRIP) Scoping Meeting & Open House
2016 RTP/SCS Performance Measures Update Technical Working Group
 2016 RTP/SCS Performance Measures Update Technical Working Group March 19, 2015 Ping Chang & Naresh Amatya SCAG Staff Presentation Outline Background Evolving/Enhanced Performance Measures (PM) Framework
PAJARO COMMUNITY PLAN PRINCIPAL FINDINGS Draft
 PAJARO COMMUNITY PLAN PRINCIPAL FINDINGS Draft 7-2-02 Community Vision Pajaro s future vision is a healthy balanced community in context with agricultural uses and the culturally diverse character of the
Executive Summary. TCAG 2014 Regional Transportation Plan
 Executive Summary TCAG 2014 Regional Transportation Plan About Tulare County Tulare County is located in California's San Joaquin Valley (SJV)[Figure 1-1]. Tulare County is bordered by Inyo County to the
ENVISION BURLINGAME General Plan
 City of Burlingame ENVISION BURLINGAME General Plan Public Review Draft City Council Hearing Draft November 2018August 2017 ENVISION BURLINGAME Chapter I. Introduction THE BURLINGAME GENERAL PLAN articulates
CITY OF LOS ANGELES SAN PEDRO COMMUNITY PLAN
 CITY OF LOS ANGELES SAN PEDRO COMMUNITY PLAN Environmental Impact Report SCH No. 2008021004 Volume I: Draft EIR Prepared for City of Los Angeles Department of City Planning 200 N. Spring Street, Room 667
A DATA-DRIVEN GENERAL PLAN The Power of Facts and How You Can Use Them to Guide Progress and Accountability in the General Plan Update Process
 A DATA-DRIVEN GENERAL PLAN The Power of Facts and How You Can Use Them to Guide Progress and Accountability in the General Plan Update Process Still Protecting Our Newport August 2018 Laura R. Stetson,
Notice of Preparation
 Date: April 8, 2015 To: Subject: Notice of Preparation State Clearinghouse, Responsible Agencies, Trustee Agencies, Federal Agencies, Interested Parties, and Organizations Notice of Preparation of a Draft
5.0 ALTERNATIVES 5.1 INTRODUCTION
 5.1 INTRODUCTION The California Environmental Quality Act (CEQA) Guidelines state that an EIR shall describe a range of reasonable alternatives to the Project, or to the location of the Project, which
1.0 Introduction. 1.1 Project Background
 Gaviota Coast Plan Final EIR This chapter provides an overview of the Environmental Impact Report (EIR) for the proposed Gaviota Coast Plan (proposed Plan). The proposed Plan is described in detail in
FACT SHEETS LOS ANGELES COUNTY
 FACT SHEETS LOS ANGELES COUNTY WHAT IS THE REGIONAL TRANSPORTATION PLAN/ SUSTAINABLE COMMUNITIES STRATEGY (RTP/SCS) Every four years the Southern California Association of Governments (SCAG) prepares a
EAST VALLEY WATER DISTRICT Wastewater Collection System Master Plan
 2 Population and Land Use Population and land use information was utilized to analyze existing wastewater flows and to estimate future flows. The population and land use data were obtained from the following:
Economics and Alluvial Fans. Alluvial Fan Task Force Plenary Meeting 4 March 14, 2008
 Economics and Alluvial Fans Presentation by: Dr. W. Bowman (Bo) Cutter, Ph.D. Autumn DeWoody Alluvial Fan Task Force Plenary Meeting 4 March 14, 2008 Economics/Water Resource Management University of California
Chapter II. Community Growth Strategy A. COMMUNITY GROWTH STRATEGY DIAGRAM AND DESIGNATIONS. 1. Adoption of Growth Strategy Diagram
 Chapter II Community Growth Strategy This chapter contains policies and a diagram to help define the quality, quantity, and direction of future urban growth for the (City). Since 1974, the City has maintained
4.0 ENVIRONMENTAL IMPACT ANALYSIS
 0 0 0.0 ENVIRONMENTAL IMPACT ANALYSIS Existing and Future Tajiguas Landfill Site Conditions The facilities are proposed to be located at the Tajiguas Landfill and residual waste from the facilities would
Notice of Preparation of Draft EIR Notice of Public Scoping Meeting ARB Southern California Consolidation Project
 Date: August 1, 2016 To: Subject: Contact: State Clearinghouse, Responsible Agencies, Trustee Agencies, Federal Agencies, Interested Parties, and Organizations of a Draft Environmental Impact Report and
GUIDE FOR THE PREPARATION OF TRAFFIC IMPACT STUDIES
 GUIDE FOR THE PREPARATION OF TRAFFIC IMPACT STUDIES Adopted by Town Council on November 25, 2008 Prepared By: HNTB Engineering Department Planning Department TABLE OF CONTENTS I. INTRODUCTION... 1 II.
2040 LAND USE WORKBOOK February 2017
 040 LAND USE WORKBOOK February 017 S A/C INTRODUCTION SITE SPOTLIGHT: WATERFRONT Through a series of community workshops and online activities in 016, Stockton community members shared their vision for
Database and Travel Demand Model
 Database and Travel Demand Model 7 The CMP legislation requires every CMA, in consultation with the regional transportation planning agency (the Metropolitan Transportation Commission (MTC) in the Bay
Notice of Preparation of a Draft Environmental Impact Report Vallco Special Area Specific Plan
 COMMUNITY DEVELOPMENT DEPARTMENT CITY HALL 10300 TORRE AVENUE CUPERTINO, CA 95014-3255 (408) 777-3308 FAX (408) 777-3333 of a Draft Environmental Impact Report File Number EA-2017-05 February 9, 2018 To:
INTELLIGENT TRANSPORTATION SYSTEMS APPENDIX
 INTELLIGENT TRANSPORTATION SYSTEMS APPENDIX Southern California Association of Governments ADOPTED APRIL 2012 INTELLIGENT TRANSPORTATION SYSTEMS Introduction 1 Existing System Description 1 Existing System
General Plan Draft Outline
 General Plan Draft Outline Contents General Plan... 1 Draft Outline... 1 PART I: GENERAL PLAN OVERVIEW... 3 Chapter 1: Introduction and General Plan User Guide... 3 What Is a General Plan?... 3 About Envision
APPENDIX M CEQA Initial Study Checklist
 APPENDIX M CEQA Initial Study Checklist Appendix G ENVIRONMENTAL CHECKLIST FORM (To be Completed by Applicant) 1. Project title: 2. Lead agency name and address: 3. Contact person and phone number: 4.
FRESNO LOCAL AGENCY FORMATION COMMISSION (LAFCO) EXECUTIVE OFFICER S REPORT
 EXECUTIVE OFFICER S REPORT") FRESNO LOCAL AGENCY FORMATION COMMISSION (LAFCO) EXECUTIVE OFFICER S REPORT DATE: October 10, 2007 AGENDA ITEM NO. 13-C TO: FROM: SUBJECT: Fresno Local Agency Formation Commission Rick Ballantyne, Executive
FRESNO LOCAL AGENCY FORMATION COMMISSION (LAFCO) EXECUTIVE OFFICER S REPORT DATE: October 10, 2007 AGENDA ITEM NO. 13-C TO: FROM: SUBJECT: Fresno Local Agency Formation Commission Rick Ballantyne, Executive
NOTICE OF PREPARATION
 City of Ceres City of Hughson City of Modesto City of Newman City of Oakdale City of Patterson City of Riverbank City of Turlock City of Waterford County of Stanislaus Date: January 4, 2013 NOTICE OF PREPARATION
The following County planning and policy documents relate to or implement the Circulation, Infrastructure, and Services Element.
 Mariposa General Plan 9 CIRCULATION, INFRASTRUCTURE, AND SERVICES T his element identifies circulation and infrastructure needs in the County. The Element provides guidance for transportation and capital
The Southwest Mega Region. Mark Pisano SCAG Executive Director
 The Southwest Mega Region Mark Pisano SCAG Executive Director Uneven and Inequitable Growth Patterns Population change per square mile 1990-2000 POPULATION CHANGE, 2000-2050 LOSS GAIN >15% 5% 5% >100%
ATTACHMENT B. Findings for Approval and Statement of Overriding Considerations Eastern Goleta Valley Community Plan
 ATTACHMENT B Findings for Approval and Statement of Overriding Considerations Eastern Goleta Valley Community Plan Case Nos. 14GPA-00000-00018, 14GPA-00000-00019, 11ORD-00000-00015, 13ORD-00000-00011,
Chapter 1 INTRODUCTION REGIONAL CONTEXT THE GENERAL PLAN. Purpose of the General Plan
 Chapter 1 INTRODUCTION Sutter County has initiated a comprehensive update of its General Plan to evaluate current conditions in the community, reaffirm a vision for the County s future, and outline a systematic
Notice of Preparation For Link Union Station (Link US) Project. Joint Environmental Impact Statement and Environmental Impact Report
 Project. Joint Environmental Impact Statement and Environmental Impact Report") Notice of Preparation For Link Union Station (Link US) Project Joint Environmental Impact Statement and Environmental Impact Report Date: May 27, 2016 To: Subject: Project Title: From: All Interested Agencies,
Notice of Preparation For Link Union Station (Link US) Project Joint Environmental Impact Statement and Environmental Impact Report Date: May 27, 2016 To: Subject: Project Title: From: All Interested Agencies,
Land Use INTRODUCTION
 Land Use INTRODUCTION The Land Use Element provides the policy context for the Centre Region to achieve its goals for the preservation and future development of rural, suburban, and urban land uses. This
NOTICE OF PREPARATION OF A MASTER ENVIRONMENTAL IMPACT REPORT AND SCOPING MEETING FOR THE 2040 GENERAL PLAN UPDATE AND CLIMATE ACTION PLAN
 NOTICE OF PREPARATION OF A MASTER ENVIRONMENTAL IMPACT REPORT AND SCOPING MEETING FOR THE 2040 GENERAL PLAN UPDATE AND CLIMATE ACTION PLAN PUBLIC COMMENT PERIOD January 28, 2019 to February 28, 2019 Scoping
PROPOSED CALIFORNIA ENVIRONMENTAL QUALITY ACT (CEQA) TRANSPORTATION SECTION UPDATE
 TRANSPORTATION SECTION UPDATE") DRAFT DOCUMENT CITY OF LOS ANGELES PROPOSED CALIFORNIA ENVIRONMENTAL QUALITY ACT (CEQA) TRANSPORTATION SECTION UPDATE Prepared by: Departments of City Planning (DCP) and (LADOT) 3.xx 1 DRAFT 2018 LOS ANGELES
DRAFT DOCUMENT CITY OF LOS ANGELES PROPOSED CALIFORNIA ENVIRONMENTAL QUALITY ACT (CEQA) TRANSPORTATION SECTION UPDATE Prepared by: Departments of City Planning (DCP) and (LADOT) 3.xx 1 DRAFT 2018 LOS ANGELES