Integrated Resource Plan
|
|
|
- Colleen Skinner
- 6 years ago
- Views:
Transcription


1 2011 Integrated Resource Plan Addendum Let s turn the answers on. June 27, 2011
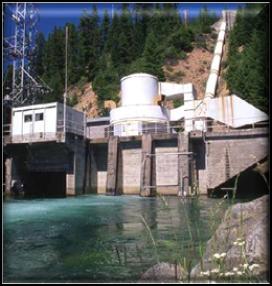
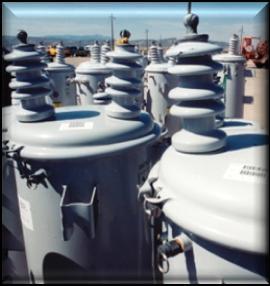
2 For more information, contact: PacifiCorp IRP Resource Planning 825 N.E. Multnomah, Suite 600 Portland, Oregon (503) Cover Photos (Left to Right): Wind: McFadden Ridge I Thermal-Gas: Lake Side Power Plant Hydroelectric: Lemolo 1 on North Umpqua River Transmission: Distribution Transformers Solar: Salt Palace Convention Center Photovoltaic Solar Project Wind Turbine: Dunlap I Wind Project
3 PACIFICORP 2011 IRP TABLE OF CONTENTS TABLE OF CONTENTS TABLE OF CONTENTS... I INDEX OF TABLES...II INDEX OF FIGURES...II ADDENDUM INTRODUCTION... III CHAPTER 1 STOCHASTIC RESULTS FOR ENERGY GATEWAY SCENARIOS... 1 Introduction... 1 Stochastic Production Cost Modeling Results... 4 Conclusion... 5 SUPPLEMENTAL LIMITED ENERGY GATEWAY SCENARIO ANALYSIS... 5 Introduction... 5 Study Approach Details... 6 Study Results... 7 Conclusion CHAPTER 2 CLASS 2 DSM DECREMENT STUDY MODELING APPROACH Generation Resource Capacity Deferral Benefit Methodology CLASS 2 DSM DECREMENT VALUE RESULTS CHAPTER 3 APPRAISAL OF INTERWEST ENERGY ALLIANCE S WIND CAPITAL COST AND CAPACITY FACTOR RECOMMENDATIONS INTRODUCTION CAPITAL COSTS Capacity Factors CONCLUSION APPENDIX A COMMENTS AND DATA SUBMISSION FROM INTERWEST ENERGY ALLIANCE i
4 PACIFICORP 2011 IRP ADDENDUM INDEX OF TABLES AND FIGURES INDEX OF TABLES TABLE 1 STOCHASTIC MEAN PVRR COST COMPARISON FOR ENERGY GATEWAY SCENARIOS, NO CO 2 TAX ( GREEN RESOURCE FUTURE )... 4 TABLE 2 STOCHASTIC MEAN PVRR COST COMPARISON FOR ENERGY GATEWAY SCENARIOS, MEDIUM CO 2 TAX SCENARIO ( GREEN RESOURCE FUTURE )... 4 TABLE 3 RESOURCE PORTFOLIO, REVISED FULL ENERGY GATEWAY SCENARIO ( GREEN RESOURCE FUTURE )... 8 TABLE 4 RESOURCE PORTFOLIO, REVISED ENERGY GATEWAY-LIMITED SCENARIO ( GREEN RESOURCE FUTURE ). 9 TABLE 5 RESOURCE PORTFOLIO DIFFERENCES, REVISED FULL ENERGY GATEWAY SCENARIO LESS ENERGY GATEWAY-LIMITED SCENARIO TABLE 6 PORTFOLIO STOCHASTIC AVERAGE PVRR COMPARISON, GATEWAY-LIMITED VS. FULL GATEWAY SCENARIOS TABLE 7 LEVELIZED CLASS 2 DSM AVOIDED COSTS BY CARBON DIOXIDE TAX SCENARIO, 20-YEAR NET PRESENT VALUE ( ) TABLE 8 ANNUAL NOMINAL CLASS 2 DSM AVOIDED COSTS, NO CO 2 TAX SCENARIO, TABLE 9 ANNUAL NOMINAL CLASS 2 DSM AVOIDED COSTS, LOW TO VERY HIGH CO 2 TAX SCENARIO, TABLE 10 ANNUAL NOMINAL CLASS 2 DSM AVOIDED COSTS, MEDIUM CO 2 TAX SCENARIO, INDEX OF FIGURES FIGURE 1 ENERGY GATEWAY SCENARIO 1 ( GATEWAY-LIMITED )... 2 FIGURE 2 ENERGY GATEWAY SCENARIO FIGURE 3 ENERGY GATEWAY SCENARIO FIGURE 4 ENERGY GATEWAY SCENARIO 4 ( FULL GATEWAY )... 3 FIGURE 5 TRANSMISSION SYSTEM MODEL TOPOLOGY... 7 FIGURE 6 EAST CLASS 2 DSM NOMINAL AVOIDED COST TRENDS, LOW TO VERY HIGH CO 2 TAX SCENARIO FIGURE 7 WEST CLASS 2 DSM NOMINAL AVOIDED COST TRENDS, LOW TO VERY HIGH CO 2 TAX SCENARIO FIGURE 8 EAST CLASS 2 DSM NOMINAL AVOIDED COST TRENDS, MEDIUM CO 2 TAX SCENARIO FIGURE 9 WEST CLASS 2 DSM NOMINAL AVOIDED COST TRENDS, MEDIUM CO 2 TAX SCENARIO FIGURE 10 EAST CLASS 2 DSM NOMINAL AVOIDED COST TRENDS, NO CO 2 TAX SCENARIO FIGURE 11 WEST CLASS 2 DSM NOMINAL AVOIDED COST TRENDS, NO CO 2 TAX SCENARIO ii
5 PACIFICORP 2011 IRP ADDENDUM ADDENDUM INTRODUCTION ADDENDUM INTRODUCTION This addendum to the 2011 IRP includes the results of additional studies and analysis that could not be completed in time to include in the original filed IRP document. These studies and analysis consist of the following: Development of stochastic cost results for 16 Energy Gateway scenarios documented in Chapter 4 of the 2011 IRP. Stochastic production cost simulation of revised full Energy Gateway and minimal Energy Gateway portfolios; the revised portfolios account for transmission operational constraints not captured with the System Optimizer capacity expansion model, as well as an alternate strategy for representing out-year generation resources. An energy efficiency (Class 2 demand-side management) avoided cost study, referred to as the DSM decrement analysis. An evaluation of wind capital cost and capacity factor recommendations and associated supporting data provided by Interwest Energy Alliance. iii
6
7 PACIFICORP 2011 IRP ADDENDUM CHAPTER 1 STOCHASTIC RESULTS FOR ENERGY GATEWAY CHAPTER 1 STOCHASTIC RESULTS FOR ENERGY GATEWAY SCENARIOS Introduction PacifiCorp conducted stochastic Monte Carlo production cost simulation of the portfolios and associated transmission assumptions for the Green Resource Future Energy Gateway expansion scenarios described in Chapter 4 of the 2011 IRP. (Refer to the Transmission Scenario Analysis section, beginning on page 66, for background information on these scenarios and associated resource modeling assumptions.) As noted in the IRP, PacifiCorp assumes that state and federal energy policies will continue to emphasize strong support for renewables development. Hence, the Company focused on the Green Resource Future set of scenarios for stochastic modeling. The Company also concluded that the full Energy Gateway configuration provides a number of strategic benefits. These benefits include insurance for regulatory uncertainty and risk mitigation associated with increased resource diversity and operational flexibility. These production cost simulations, performed with the Planning and Risk (PaR) model, are consistent with the stochastic simulations conducted for the core portfolio cases 1, utilizing two carbon dioxide (CO 2 ) tax scenarios: $0/ton and $19/ton (or medium scenario). 2 Figures 1 through 4 are maps of the four Energy Gateway expansion scenarios. 1 Refer to the Monte Carlo Production Cost Simulation section of Chapter 7, beginning on page 182, for background on stochastic production cost modeling conducted for the IRP. 2 Refer to page 159 of the 2011 IRP for definition of the CO 2 tax scenarios. 1

 Figure 2 Energy Gateway")
8 PACIFICORP 2011 IRP ADDENDUM CHAPTER 1 STOCHASTIC RESULTS FOR ENERGY GATEWAY Figure 1 Energy Gateway Scenario 1 ( Gateway-Limited ) Figure 2 Energy Gateway Scenario 2 2


9 PACIFICORP 2011 IRP ADDENDUM CHAPTER 1 STOCHASTIC RESULTS FOR ENERGY GATEWAY Figure 3 Energy Gateway Scenario 3 Figure 4 Energy Gateway Scenario 4 ( Full Gateway ) 3
10 PACIFICORP 2011 IRP ADDENDUM CHAPTER 1 STOCHASTIC RESULTS FOR ENERGY GATEWAY Stochastic Production Cost Modeling Results Tables 1 and 2 report the stochastic mean Present Value Revenue Requirement (PVRR) for the two CO 2 tax scenarios along with the PVRR cost component details. Table 1 Stochastic Mean PVRR Cost Comparison for Energy Gateway Scenarios, No CO 2 Tax ( Green Resource Future ) Scenario 1 Medium Natural Gas Price Forecast Scenario 2 Scenario 3 Scenario 4* Scenario 1 Scenario 2 Scenario 3 Scenario 4* Cost Component (Million $) Variable Costs Fuel & O&M 15,295 15,235 15,232 15,184 15,327 15,211 15,288 15,181 Emission Cost FOT's & Long Term Contracts 3,857 3,858 3,858 3,858 3,819 3,811 3,800 3,807 Demand Side Management 3,373 3,421 3,421 3,421 4,059 4,137 4,139 4,137 Renewables System Balancing Sales (6,031) (6,008) (6,007) (6,017) (6,084) (6,014) (5,989) (6,011) System Balancing Purchases 1,715 1,705 1,705 1,727 1,683 1,673 1,695 1,709 Energy Not Served Dump Power (133) (131) (131) (132) (137) (140) (140) (141) Reserve Deficiency Total Variable Costs $18,821 $18,829 $18,827 $18,789 $19,411 $19,412 $19,525 $19,412 Capital and Fixed Costs $12,067 $11,131 $11,159 $11,201 $12,128 $11,362 $11,111 $11,336 Total PVRR $30,888 $29,960 $29,986 $29,990 $31,540 $30,774 $30,636 $30,748 * Scenario 4 corresponds to Scenario 7 in Table 4.2, page 78, of the 2011 IRP. High Natural Gas Price Forecast Table 2 Stochastic Mean PVRR Cost Comparison for Energy Gateway Scenarios, Medium CO 2 Tax Scenario ( Green Resource Future ) Medium Natural Gas Price Forecast High Natural Gas Price Forecast Scenario 1 Scenario 2 Scenario 3 Scenario 4* Scenario 1 Scenario 2 Scenario 3 Scenario 4* Cost Component (Million $) Variable Costs Fuel & O&M 15,231 15,165 15,155 15,048 15,300 15,181 15,263 15,087 Emission Cost 7,409 7,332 7,335 7,230 7,331 7,190 7,238 7,096 FOT's & Long Term Contracts 4,063 4,064 4,064 4,064 4,018 4,008 3,994 4,003 Demand Side Management 3,373 3,421 3,421 3,421 4,059 4,137 4,139 4,137 Renewables System Balancing Sales (6,458) (6,413) (6,413) (6,387) (6,528) (6,422) (6,399) (6,387) System Balancing Purchases 2,631 2,646 2,647 2,740 2,583 2,597 2,623 2,710 Energy Not Served Dump Power (127) (126) (126) (128) (131) (135) (135) (137) Reserve Deficiency Total Variable Costs $26,858 $26,830 $26,826 $26,729 $27,368 $27,287 $27,452 $27,237 Capital and Fixed Costs $12,067 $11,131 $11,159 $11,201 $12,128 $11,362 $11,111 $11,336 Total PVRR $38,925 $37,961 $37,985 $37,930 $39,496 $38,650 $38,563 $38,573 * Scenario 4 corresponds to Scenario 7 in Table 4.2, page 78, of the 2011 IRP. 4
11 PACIFICORP 2011 IRP ADDENDUM CHAPTER 1 STOCHASTIC RESULTS FOR ENERGY GATEWAY Conclusion The stochastic modeling results indicate that the full Energy Gateway configuration is costeffective when compared to the Limited Gateway configuration in all CO 2 tax/natural gas price scenarios and outperforms Energy Gateway Scenarios 2 and 3 with medium natural gas prices and medium CO 2 prices. Consistent with the deterministic modeling results using the System Optimizer model, the stochastic PVRR range for Energy Gateway expansion scenarios 2 through 4 is narrow, suggesting that economics does not drive a clear selection of the alternatives. As noted in the 2011 IRP, the Company continues to conclude that proceeding with the full Energy Gateway expansion scenario is the most prudent strategy. Supplemental Limited Energy Gateway Scenario Analysis Introduction The 2011 IRP contemplated seven different scenarios of the Company s Energy Gateway transmission expansion program. The base case (Scenario 1) is a minimum-build transmission plan that, while part of the overall Energy Gateway strategy, needs to be constructed regardless of other Energy Gateway options due to specific load and reliability requirements. This group of projects referred to as Gateway-Limited for the purpose of this IRP addendum includes Populus to Terminal, Mona to Oquirrh and Sigurd to Red Butte. (Refer to Chapter 10 of the 2011 IRP 3 for detailed information on each of the planned Energy Gateway segments). To analyze these transmission planning scenarios, PacifiCorp used its System Optimizer model to select optimal resource portfolios constrained by the transmission topology defined for each Energy Gateway scenario. Both the System Optimizer results reported in the 2011 IRP and the stochastic production cost simulations described in the previous section indicate that the full Energy Gateway strategy has a lower PVRR than the Gateway-Limited strategy under a range of alternative natural gas and CO 2 price assumptions. These two Energy Gateway scenarios are shown in Figures 1 and 4 above. As an extension of this Energy Gateway scenario analysis, the Company wanted to investigate the extent to which operational limitations of the transmission system under the Gateway- Limited scenario constrain the location of thermal resources as determined by System Optimizer. At issue is whether System Optimizer is adequately accounting for the need (and associated cost) to site thermal resources at alternative locations given such operational constraints. A particular focus is on growth resources that the model uses to balance capacity in the outer years of the simulations. Growth resources, which are assigned forward market prices, serve as proxies for unspecified electricity supply options. They are also made available within load bubbles as opposed to acquiring them from market hubs. 4 Use of growth resources circumvents transmission constraints as a limiting factor for adding future resources, and thus may not be a suitable out-year resource modeling strategy when evaluating transmission expansion scenarios. For this supplemental Energy Gateway scenario analysis, the Company s goal was thus to determine the resource selection and cost impact of applying locational resource constraints 3 PacifiCorp IRP documents are available at 4 Growth resources are described on page 179 of the 2011 IRP. 5
12 PACIFICORP 2011 IRP ADDENDUM CHAPTER 1 STOCHASTIC RESULTS FOR ENERGY GATEWAY based on transmission capacity limits, as well as removing growth resources as future resource options. To this end, PacifiCorp developed revised Full Gateway and Gateway-Limited portfolios reflecting application of these resource modeling changes, and then simulated them with the PaR production cost model to provide a PVRR cost comparison. Subsequent sections provide more details on the revised portfolio development approach and the results of the scenario analysis. Study Approach Details As noted above, the study approach consisted of developing Gateway-Limited and Full Gateway portfolios using System Optimizer, and then simulating both portfolios using the Planning and Risk production cost model. The main modeling assumptions for the study are as follows: The expected load, natural gas price, wholesale electricity price, CO 2 price forecasts from the 2011 IRP (described on pages ), developed in September 2010, were used. With the exception of growth resources (previously available beginning in 2021) and geothermal 5, all resource options specified for the 2011 IRP were available for System Optimizer selection. Gas-fired combined-cycle combustion turbine plants acquired after 2019 are represented by two technology options: Mitsubishi G/General Electric H class 1x1 6, and General Electric F class 2x1, both with duct firing. (System Optimizer is allowed to select a fractional amount of duct-firing capacity up to the specified megawatt limits.) All east-side CCCTs beyond 2014 are assumed to be dry-cooled. Consistent with the Green Resource Future outlined in Chapter 4 of the 2011 IRP ( Transmission Planning ), portfolios are required to meet minimum annual renewable generation requirements based on the Waxman-Markey proposed targets (6 percent by 2012, 9.5 percent by 2014, 13 percent by 2016, 16.5% by 2018, and 20% by 2020). The model is allowed to select an optimal amount of wind resources subject to the minimum renewable generation requirements. System Optimizer was allowed to select a variable amount of market purchases (front office transaction proxy resources) up to the annual market hub limits. Consistent with the original minimum-build Energy Gateway scenario, incremental wind resources in Wyoming were excluded as model options in the Gateway-Limited scenario. The base transmission topology for the 2011 IRP was used, which is shown in Figure 5. To account for operational transmission constraints under the Gateway-Limited scenario, PacifiCorp first ran System Optimizer based on the above assumptions to create a base Gateway- Limited portfolio for inspection by the Transmission Department. Based on this inspection, PacifiCorp conducted a final System Optimizer run that incorporated the following resource changes needed to account for a 700 MW incremental capacity transfer limit from the Utah South to Utah North topology bubbles once the Mona-Oquirrh transmission project is in place: 5 Geothermal resources are excluded as resource options due to recovery risk for resource development costs, a procurement issue identified in the 2011 IRP. Geothermal projects will nevertheless be included as eligible resources in future Requests for Proposals. 6 The G and H class CCCTs are assumed to have the same capacity and other attributes, and are considered interchangeable. 6
. The 2019 CCCT resource originally selected by the model at Currant Creek ( Utah South Bubble) was manually moved to the Utah North bubble.")
13 PACIFICORP 2011 IRP ADDENDUM CHAPTER 1 STOCHASTIC RESULTS FOR ENERGY GATEWAY The model was constrained to locate 300 MW of Utah wind ( Utah South bubble) to the west side of the system (Oregon and Washington). The 2019 CCCT resource originally selected by the model at Currant Creek ( Utah South Bubble) was manually moved to the Utah North bubble. The 2025 CCCT resource originally selected by the model for the Utah North bubble was moved to the Borah bubble located in Idaho. Figure 5 Transmission System Model Topology PacifiCorp simulated the Full Gateway and final Gateway-Limited portfolios using the PaR model. Transmission investment costs were incorporated in the PVRRs, consistent with the approach used for the original minimal-build and full Energy Gateway scenarios. Study Results Tables 4 and 5 show the revised Full Gateway and Gateway-Limited portfolio resources respectively after running System Optimizer with the resource modifications described above. Table 6 provides the resource differences between the two portfolios. The major resource changes consist of a location shift of a simple-cycle combustion turbine plant and the Wyoming wind to the west. 7
14 PACIFICORP 2011 IRP SUPPLEMENT CHAPTER 1 ENERGY GATEWAY ADDITIONAL ANALYSIS Table 3 Resource Portfolio, Revised Full Energy Gateway Scenario ( Green Resource Future ) East West Capacity (MW) Resource Totals * Resource year 20-year CCCT F 2x1: Utah North, Utah South ,222 1,222 CCCT G 1x1: Goshen, Utah North CCCT H 1x1, Utah South IC Aero Goshen SCCT Aero, Utah South Coal Plant Turbine Upgrades Wind, Goshen, 29% Cap Factor Wind, Utah, 29% Cap Factor Wind, Wyoming, 35% Cap Factor ,247 Total Wind ,418 CHP - Biomass DSM, Class 1 Total DSM, Class 2, Goshen DSM, Class 2, Utah ,186 DSM, Class 2, Wyoming DSM, Class 2 Total ,462 Micro Solar - Hot Water Heating FOT Mead Q FOT Utah Q FOT Mona-3 Q FOT Mona-4 Q Coal Plant Turbine Upgrades Wind, Yakima, 29% Cap Factor Wind, Walla Walla, 29% Cap Factor Total Wind Utility Biomass CHP - Biomass DSM, Class 1 Total DSM, Class 2, Walla Walla DSM, Class 2, California/Oregon ,017 DSM, Class 2, Yakima DSM, Class 2 Total ,250 OR Solar Cap Standard OR Solar Pilot Micro Solar - Hot Water Heating FOT COB Q FOT MidColumbia Q FOT MidColumbia Q FOT South-Central Oregon/North Cal Q Annual Additions, Long Term Resources Annual Additions, Short Term Resources 350 1,239 1,425 1,172 1, Total Annual Additions 486 1,456 1,621 2,155 1,367 1,517 1,114 1,290 1,484 1, ,047 1,104 1,412 1,254 1,338 1,089 1,238 1,419 * Front office transactions (FOT) are not additive. For the 10-Year column, FOT are a 10-year average for , whereas the 20-Year column report a 10-year average for
15 PACIFICORP 2011 IRP ADDENDUM CHAPTER 1 STOCHASTIC RESULTS FOR ENERGY GATEWAY Table 4 Resource Portfolio, Revised Energy Gateway-Limited Scenario ( Green Resource Future ) East West Capacity (MW) Resource Totals * Resource year 20-year CCCT F 2x1: Utah North, Utah South ,222 1,222 CCCT G 1x1: Goshen, Utah North CCCT H 1x1, Utah South IC Aero, Goshen Coal Plant Turbine Upgrades Wind, Goshen, 29% Cap Factor Wind, Utah, 29% Cap Factor Total Wind CHP - Biomass DSM, Class 1 Total DSM, Class 2, Goshen DSM, Class 2, Utah ,186 DSM, Class 2, Wyoming DSM, Class 2 Total ,463 Micro Solar - Hot Water Heating FOT Mead Q FOT Utah Q FOT Mona-3 Q FOT Mona-4 Q Coal Plant Turbine Upgrades IC Aero, South-Central Oregon/California Wind, Yakima, 29% Cap Factor Wind, Oregon, 29% Cap Factor Wind, Washington, 29% Cap Factor Wind, Walla Walla, 29% Cap Factor Total Wind ,148 Utility Biomass CHP - Biomass DSM, Class 1 Total DSM, Class 2, Walla Walla DSM, Class 2, California/Oregon ,018 DSM, Class 2, Yakima DSM, Class 2 Total ,250 OR Solar Cap Standard OR Solar Pilot Micro Solar - Hot Water Heating FOT COB Q FOT MidColumbia Q FOT MidColumbia Q FOT South-Central Oregon/North Cal Q Annual Additions, Long Term Resources Annual Additions, Short Term Resources 350 1,239 1,425 1,172 1, Total Annual Additions 486 1,456 1,621 2,155 1,367 1,628 1,139 1,285 1,479 1, ,048 1,107 1,410 1,283 1,347 1,106 1,245 1,408 * Front office transactions (FOT) are not additive. For the 10-Year column, FOT are a 10-year average for , whereas the 20-Year column report a 10-year average for
16 PACIFICORP 2011 IRP SUPPLEMENT CHAPTER 1 ENERGY GATEWAY ADDITIONAL ANALYSIS Table 5 Resource Portfolio Differences, Revised Full Energy Gateway Scenario less Energy Gateway-Limited Scenario East West Capacity, MW Resource Totals * Resource Year 20 Year IC Aero Goshen (93) SCCT Aero Utah South (118) - (118) Wind, Goshen, 29% Cap Factor Wind, Utah, 29% Cap Factor (6) Wind, Wyoming, 35% Cap Factor (200) (200) (200) (15) (73) (38) (48) (20) (99) (49) (78) (40) (187) (440) (1,087) Total Wind (100) (100) (100) 3 15 (38) (48) (20) (99) (49) (78) (40) (187) (177) (718) DSM, Class 1, Utah, DLC-Residential (7.2) (7) 0 DSM, Class 2, Utah (14.9) - (0.1) Micro Solar - Hot Water Heating FOT Mead Q (2) (2) (2) FOT Utah Q (5) (5) - (5) - (5) (5) (5) 7 (0) - (0) (9) - (8) (26) IC Aero, South-Central Oregon/CA Wind, Yakima, 29% Cap Factor Wind, Washington, 29% Cap Factor Wind, Oregon, 29% Cap Factor Wind, Walla Walla, 29% Cap Factor Total Wind DSM, Class 2, Walla Walla (0.1) (0) (0) DSM, Class 2, California/Oregon DSM, Class 2 Total (0.1) (0) (0) Micro Solar - Hot Water Heating FOT MidColumbia Q (5) - (5) (1) (1) Annual Additions, Long Term Resources (7) (9) (11) Annual Additions, Short Term Resources (2) (5) (5) (5) (5) (5) (5) (5) (5) 7 (0) - (0) (9) - Total Annual Additions (0) (5) (5) (5) (2) (2) (11) * Front office transactions (FOT) are not additive. For the 10-Year column, FOT are a 10-year average for , whereas the 20-Year column report a 10-year average for
17 PACIFICORP 2011 IRP ADDENDUM CHAPTER 1 STOCHASTIC RESULTS FOR ENERGY GATEWAY Table 6 reports the stochastic average PVRR and cost component details for the revised Full Gateway and Gateway-Limited scenarios under the Green Resource Future scenario assuming medium CO 2 and medium natural gas prices. A comparison of these PVRR results with the original Full and Gateway-Limited PVRR results is also provided. As indicated, the generation resource changes, which account for transmission operational constraints, resulted in higher PVRRs for both scenarios. The table also shows that the PVRR difference between the revised Full Gateway and Gateway-Limited scenario portfolios increased by $89 million ($1.084 billion less $995 million) relative to the difference for the original portfolios. Table 6 Portfolio Stochastic Average PVRR Comparison, Gateway-Limited vs. Full Gateway Scenarios Original Energy Gateway Portfolios Original Gateway- Limited Scenario Original Full Gateway Scenario Difference (Original Gateway Limited less Full Gateway) Revised Energy Gateway Portfolios Revised Gateway- Limited Scenario Revised Full Gateway Scenario Difference (Original Gateway Limited less Full Gateway) Cost Component (Million $) Variable Costs Fuel & O&M $15,231 $15,048 $183 $14,858 $14,586 $272 Emission Cost 7,409 7, ,448 7, FOT's & Long Term Contracts 4,063 4,064 (1) 4,195 4,195 (0) Demand Side Management 3,373 3,421 (48) 3,657 3, Renewables (0) System Balancing Sales (6,458) (6,387) (71) (6,529) (6,250) (279) System Balancing Purchases 2,631 2,740 (109) 2,586 2,744 (158) Energy Not Served (3) Dump Power (127) (127) 0 (125) (124) (1) Reserve Deficiency Total Variable Costs $26,858 $26,729 $129 $26,802 $26,666 $136 Capital and Fixed Costs $12,067 $11,201 $866 $12,693 $11,745 $948 Total PVRR $38,925 $37,930 $995 $39,495 $38,411 $1,084 Conclusion Based on these results, PacifiCorp concludes that for future Energy Gateway and other transmission expansion scenarios conducted for the IRP, a review of initial System Optimizer portfolio results in light of operational transmission constraints followed by manual resource adjustments as needed is a worthwhile modeling refinement. However, the cost impact is relatively small such that it would not be expected to change relative cost rankings of alternative transmission expansion scenarios. Excluding growth resources as a resource option has a more significant impact, raising portfolio costs due to the higher fixed costs associated with generation plant. The Company will revisit the efficacy of the growth resource approach for the next IRP. 11
18
19 PACIFICORP 2011 IRP ADDENDUM CHAPTER 2 DSM DECREMENT ANALYSIS CHAPTER 2 CLASS 2 DSM DECREMENT STUDY This section presents the methodology and results of the energy efficiency (Class 2 demand-side management) decrement study. For this analysis, the 2011 IRP preferred portfolio was used to calculate the decrement value ( avoided cost ) of various types of Class 2 DSM resources. PacifiCorp will use these decrement values when evaluating the cost-effectiveness of current programs and potential new programs between IRP cycles. The Class 2 DSM decrement study was enhanced for the 2011 IRP. To align with the resource costs applied for resource portfolio development using the System Optimizer capacity expansion model, cost credits were applied to the Class 2 DSM decrement values reflecting (1) a transmission and distribution (T&D) investment deferral benefit, (2) a generation capacity investment deferral benefit, and (3) a stochastic risk reduction benefit associated with clean, nofuel resources. 7 Decrement values for two new energy efficiency load shapes were also estimated: residential water heating and plug loads (i.e., energy consumed by electronic devices plugged into sockets.) Modeling Approach To determine the Class 2 DSM decrement values, PacifiCorp defined 17 shaped Class 2 DSM resources, each at 100 megawatts at the time of peak load, and available starting in 2011 and for the duration of the 20-year IRP study period. In contrast, the valuation study for the 2008 IRP focused on 13 resources. The added resources consist of residential water heating and plug loads for both east and west control areas. Adding these new energy efficiency resources to the analysis is intended to provide a refined valuation for energy savings and further aid in developing program initiatives for such applications as showerheads, heat pump water heaters, and consumer electronics. Consistent with prior valuation studies, PacifiCorp first determined the system production cost with and without each Class 2 DSM resources using the PaR production cost model in Monte Carlo stochastics mode. The difference in production cost (stochastic mean PVRR) for the two runs indicates the system value attributable to the DSM resource through lower spot market transaction activity and resource re-optimization with the DSM resource in the portfolio. The cost credits mentioned above are then added separately outside of the model, thereby increasing Class 2 DSM decrement values. The resource deferral benefit, as a new step for deriving the decrement values value, is described below. The PaR decrement values were determined for three CO 2 tax scenarios: zero, medium (starting at $19/ton and escalating to $39/ton by 2030), and low-to-very high (starting as $12/ton and escalating to $93/ton by 2030). 7 Refer to Volume 1, page 147 of the 2011 IRP for a summary of the T&D investment deferral and stochastic risk reduction cost credits applied to the System Optimizer energy efficiency resource options. 13
20 PACIFICORP 2011 IRP ADDENDUM CHAPTER 2 DSM DECREMENT ANALYSIS Generation Resource Capacity Deferral Benefit Methodology PacifiCorp used the System Optimizer model to determine the generation resource capacity deferral benefit. The approach is similar to the stochastic production cost difference method, except that only the fixed cost benefit of adding each 100-megawatt Class 2 DSM resource is calculated. This is accomplished by running System Optimizer with a base resource portfolio that excludes each 100-megawatt Class 2 DSM program, and then comparing the fixed portfolio costs against the cost of the same portfolio derived by System Optimizer that includes the DSM program at zero cost. The simulation period is 20 years. As a simplifying assumption, PacifiCorp applied the East system load shape for the generic DSM program, which has a capacity planning contribution of 93 percent and a capacity factor of 69 percent. The resource deferral fixed cost benefit is comprised of the deferred capital recovery and fixed operation and maintenance costs of a next best alternative resource a combined-cycle combustion turbine (CCCT). The difference in the portfolio fixed cost represents the resource deferral benefit of the DSM program. (Note that System Optimizer s production cost benefits were not taken into account to avoid double-counting the benefit extracted from stochastic PaR model results.) Since a 100-megawatt Class 2 DSM is not sufficiently large enough to defer a CCCT, System Optimizer was configured to allow fractional CCCT unit sizes for both the base portfolio and each of the 17 Class 2 DSM resource portfolios. Deferral of CCCT capacity can begin starting in 2015, the year after the Lake Side 2 CCCT is planned to be in service. Note that each Class 2 DSM resource can also defer front office transactions (a market resource representing a range of forward firm market purchase products). The resource capacity deferral benefit is calculated in two steps: 1. Fixed Cost Deferral Benefit Determination Fixed cost benefits are obtained by calculating the differences in annual fixed and capital recovery costs (millions of 2010 dollars) between the base portfolio and the portfolio with the Class 2 DSM program addition. The stream of annual benefits is then converted into a net present value (NPV) using the 2011 IRP discount rate (7.17 percent). 2. Levelized Value Calculation The fixed cost resource deferral benefit value obtained from step 1 is divided by the Class 2 DSM program energy in megawatt-hours (also converted to a NPV) to yield a value in dollars per megawatt-hour-year ($/MWh-yr). This value, along with the T&D investment deferral credit and stochastic risk reduction credit, are added to the PaR model decrement values to yield the final adjusted values. Class 2 DSM Decrement Value Results Table 7 reports the NPV levelized avoided costs by DSM resource and CO 2 tax scenario for 2011 through 2030, along with a breakdown of the three cost credits (capacity deferral, T&D investment deferral, and stochastic risk reduction). Tables 8, 9, and 10 report the annual nominaldollar avoided costs, in $/MWh, for each CO 2 tax scenario. Figures 6 through 11 graphically 14
21 PACIFICORP 2011 IRP ADDENDUM CHAPTER 2 DSM DECREMENT ANALYSIS show the avoided annual cost trends for the three CO 2 tax scenarios by east and west location, along with average annual forward market prices for the relevant location (Palo Verde (PV) for the east and Mid-Columbia (Mid-C) for the west.) Consistent with the results for the 2008 IRP, the residential air conditioning decrements produce the highest value for both the east and west locations. The water heating (new), plug loads (new), and system load shapes provide the lowest avoided costs. Much of their end use shapes reduce loads during a greater percentage of off-peak hours than the other shapes and during all seasons, not just the summer. 15
22 PACIFICORP 2011 IRP ADDENDUM CHAPTER 2 DSM DECREMENT ANALYSIS Table 7 Levelized Class 2 DSM Avoided Costs by Carbon Dioxide Tax Scenario, 20-Year Net Present Value ( ) Total Avoided Costs by Carbon Dioxide Tax Scenario, Including all Cost Credits ($/MWh) Cost Credit Components ($/MWh) Resource Location Load Factor Low to Very High Medium None Capacity Resource Deferral T&D Investment Deferral Stochastic Risk Reduction Total Credit Residential Cooling East 10% Residential Lighting East 48% Residential Whole House East 35% Commercial Cooling East 20% Commercial Lighting East 48% Water Heating East 57% Plug Loads East 59% System Load Shape East 69% Residential Cooling West 7% Residential Heating West 25% Residential Lighting West 48% Commercial Cooling West 16% Residential Whole House West 49% Commercial Lighting West 48% Water Heating West 56% Plug Loads West 59% System Load Shape West 71%
23 PACIFICORP 2011 IRP ADDENDUM CHAPTER 2 DSM DECREMENT ANALYSIS Table 8 Annual Nominal Class 2 DSM Avoided Costs, No CO 2 Tax Scenario, Avoided Cost Values (Nominal $/MWh) Resource Actual Load Factor EAST Residential Cooling 10% Residential Lighting 48% Residential Whole House 35% Commercial Cooling 20% Commercial Lighting 48% Water Heating 57% Plug Loads 59% System Load Shape 69% WEST Residential Cooling 7% Residential Heating 25% Residential Lighting 48% Commercial Cooling 16% Residential Whole House 49% Commercial Lighting 48% Water Heating 56% Plug Loads 59% System Load Shape 71% Resource EAST Avoided Cost Values (Nominal $/MWh) Actual Load Factor Residential Cooling 10% Residential Lighting 48% Residential Whole House 35% Commercial Cooling 20% Commercial Lighting 48%
24 PACIFICORP 2011 IRP ADDENDUM CHAPTER 2 DSM DECREMENT ANALYSIS Avoided Cost Values (Nominal $/MWh) Resource Actual Load Factor Water Heating 57% Plug Loads 59% System Load Shape 69% WEST Residential Cooling 7% Residential Heating 25% Residential Lighting 48% Commercial Cooling 16% Residential Whole House 49% Commercial Lighting 48% Water Heating 56% Plug Loads 59% System Load Shape 71% Table 9 Annual Nominal Class 2 DSM Avoided Costs, Low to Very High CO 2 Tax Scenario, Avoided Cost Values (Nominal $/MWh) Resource Actual Load Factor EAST Residential Cooling 10% Residential Lighting 48% Residential Whole House 35% Commercial Cooling 20% Commercial Lighting 48% Water Heating 57% Plug Loads 59% System Load Shape 69% WEST Residential Cooling 7% Residential Heating 25%
25 PACIFICORP 2011 IRP ADDENDUM CHAPTER 2 DSM DECREMENT ANALYSIS Avoided Cost Values (Nominal $/MWh) Resource Actual Load Factor Residential Lighting 48% Commercial Cooling 16% Residential Whole House 49% Commercial Lighting 48% Water Heating 56% Plug Loads 59% System Load Shape 71% Avoided Cost Values (Nominal $/MWh) Resource Actual Load Factor EAST Residential Cooling 10% Residential Lighting 48% Residential Whole House 35% Commercial Cooling 20% Commercial Lighting 48% Water Heating 57% Plug Loads 59% System Load Shape 69% WEST Residential Cooling 7% Residential Heating 25% Residential Lighting 48% Commercial Cooling 16% Residential Whole House 49% Commercial Lighting 48% Water Heating 56% Plug Loads 59% System Load Shape 71%
26 PACIFICORP 2011 IRP ADDENDUM CHAPTER 2 DSM DECREMENT ANALYSIS Table 10 Annual Nominal Class 2 DSM Avoided Costs, Medium CO 2 Tax Scenario, Avoided Cost Values (Nominal $/MWh) Resource Actual Load Factor EAST Residential Cooling 10% Residential Lighting 48% Residential Whole House 35% Commercial Cooling 20% Commercial Lighting 48% Water Heating 57% Plug Loads 59% System Load Shape 69% WEST Residential Cooling 7% Residential Heating 25% Residential Lighting 48% Commercial Cooling 16% Residential Whole House 49% Commercial Lighting 48% Water Heating 56% Plug Loads 59% System Load Shape 71% Resource EAST Avoided Cost Values (Nominal $/MWh) Actual Load Factor Residential Cooling 10% Residential Lighting 48% Residential Whole House 35% Commercial Cooling 20%
27 PACIFICORP 2011 IRP ADDENDUM CHAPTER 2 DSM DECREMENT ANALYSIS Avoided Cost Values (Nominal $/MWh) Resource Actual Load Factor Commercial Lighting 48% Water Heating 57% Plug Loads 59% System Load Shape 69% WEST Residential Cooling 7% Residential Heating 25% Residential Lighting 48% Commercial Cooling 16% Residential Whole House 49% Commercial Lighting 48% Water Heating 56% Plug Loads 59% System Load Shape 71%
28 $/MWh $/MWh PACIFICORP 2011 IRP ADDENDUM CHAPTER 2 DSM DECREMENT ANALYSIS Figure 6 East Class 2 DSM Nominal Avoided Cost Trends, Low to Very High CO 2 Tax Scenario East, Low to Very High CO2 Tax Scenario Palo Verde Flat (2011 IRP, Low to Very High CO2 Tax) Residential Cooling Residential Lighting Residential Whole House Commercial Cooling Commercial Lighting System Load Shape Water Heating Plug Loads Figure 7 West Class 2 DSM Nominal Avoided Cost Trends, Low to Very High CO 2 Tax Scenario $200 $190 $180 $170 $160 $150 $140 $130 $120 $110 $100 $90 $80 $70 $60 $50 $40 $30 West, Low to Very High CO2 Tax Scenario Residential Cooling Residential Heating Residential Lighting Commercial Cooling Residential Whole House Commercial Lighting System Load Shape Mid Columbia Flat (2011 IRP, Low to Very High CO2 Tax) Water Heating Plug Loads 22
29 $/MWh $/MWh PACIFICORP 2011 IRP ADDENDUM CHAPTER 2 DSM DECREMENT ANALYSIS Figure 8 East Class 2 DSM Nominal Avoided Cost Trends, Medium CO 2 Tax Scenario 180 East, Medium CO2 Tax Scenario Palo Verde Flat (2011 IRP, Medium CO2 Tax) Residential Lighting Commercial Cooling System Load Shape Plug Loads Residential Cooling Residential Whole House Commercial Lighting Water Heating Figure 9 West Class 2 DSM Nominal Avoided Cost Trends, Medium CO 2 Tax Scenario $180 West, Medium CO2 Tax Scenario $170 $160 $150 $140 $130 $120 $110 $100 $90 $80 $70 $60 $50 $40 $ Residential Cooling Residential Heating Residential Lighting Commercial Cooling Residential Whole House Commercial Lighting System Load Shape Mid Columbia Flat (2011 IRP, Medium CO2 Tax) Water Heating Plug Loads 23
30 $/MWh $/MWh PACIFICORP 2011 IRP ADDENDUM CHAPTER 2 DSM DECREMENT ANALYSIS Figure 10 East Class 2 DSM Nominal Avoided Cost Trends, No CO 2 Tax Scenario 150 East, $0 CO2 Tax Scenario Palo Verde Flat (2011 IRP, $0 CO2 Tax) Residential Cooling Residential Lighting Residential Whole House Commercial Cooling Commercial Lighting System Load Shape Water Heating Plug Loads Figure 11 West Class 2 DSM Nominal Avoided Cost Trends, No CO 2 Tax Scenario West, $0 CO2 Tax Scenario $150 $140 $130 $120 $110 $100 $90 $80 $70 $60 $50 $40 $ Residential Cooling Residential Heating Residential Lighting Commercial Cooling Residential Whole House Commercial Lighting System Load Shape Mid Columbia Flat (2011 IRP, $0 CO2 tax) Water Heating Plug Loads 24
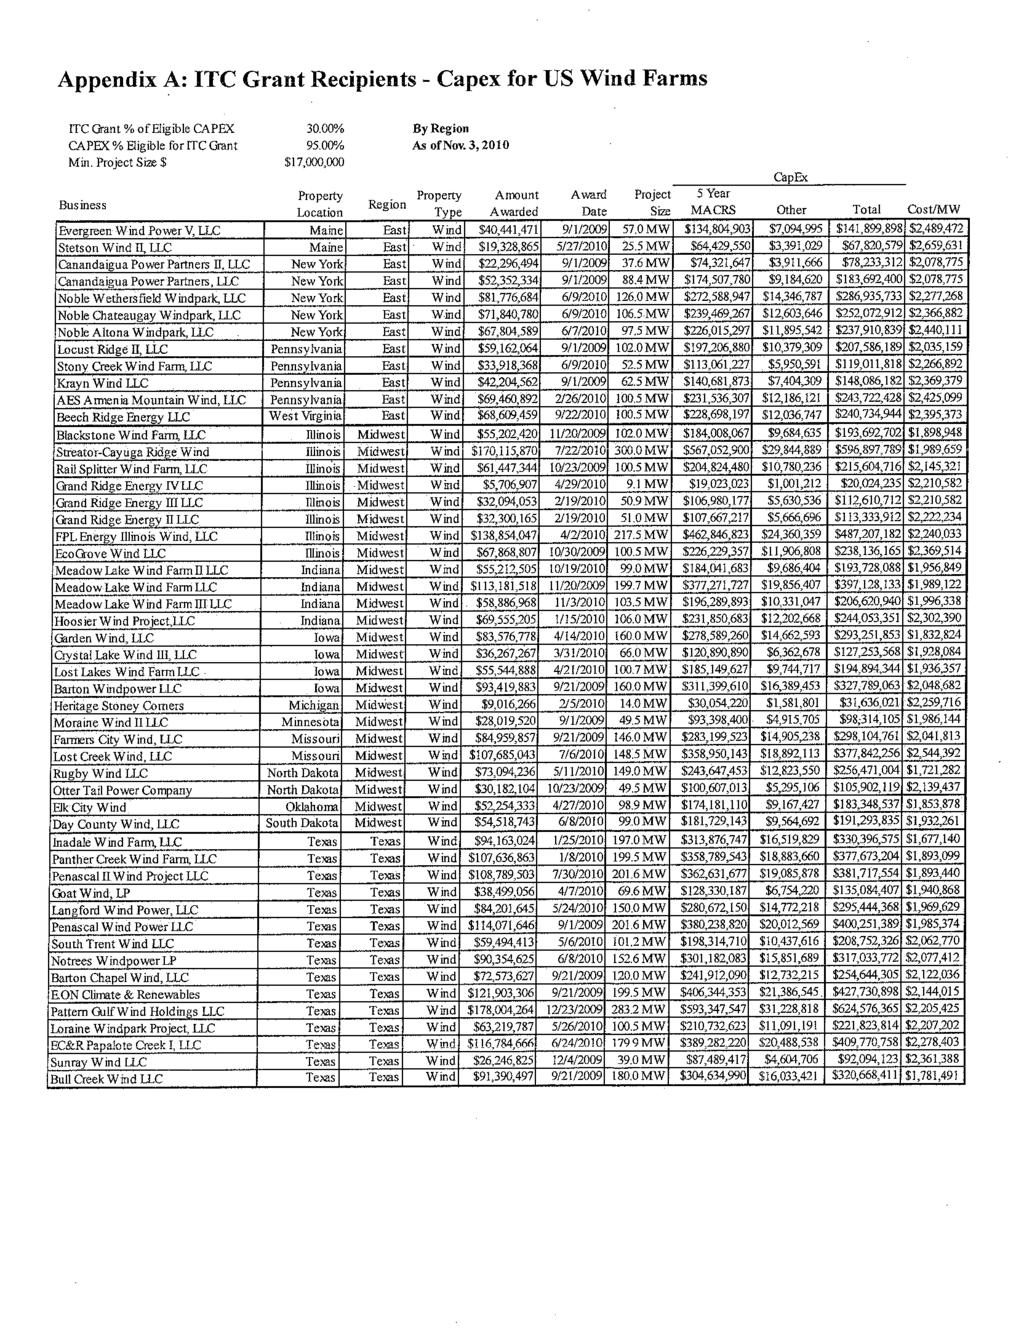
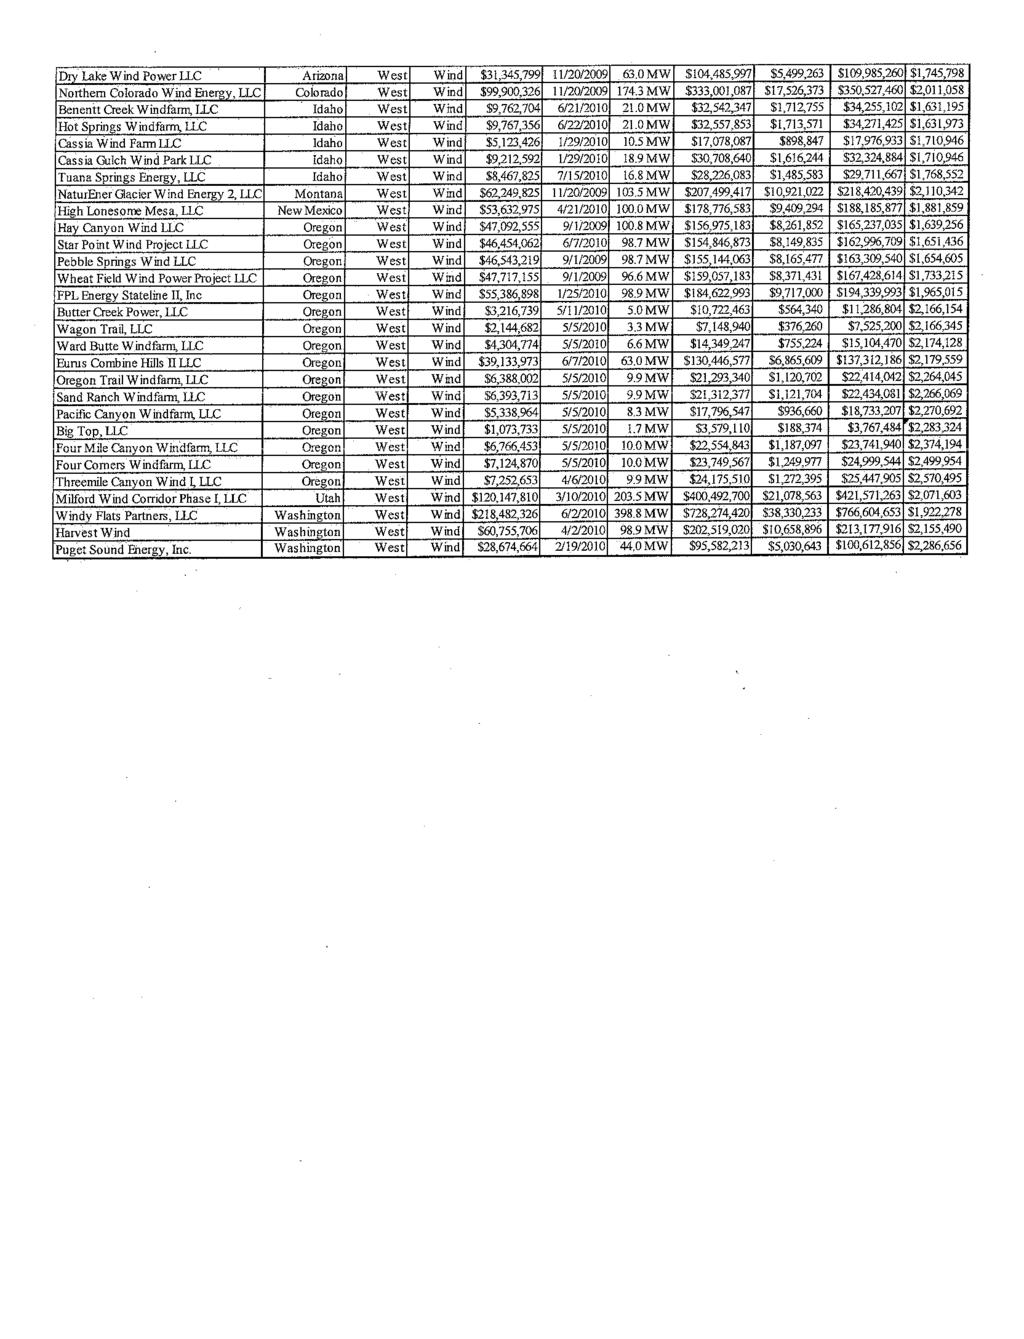
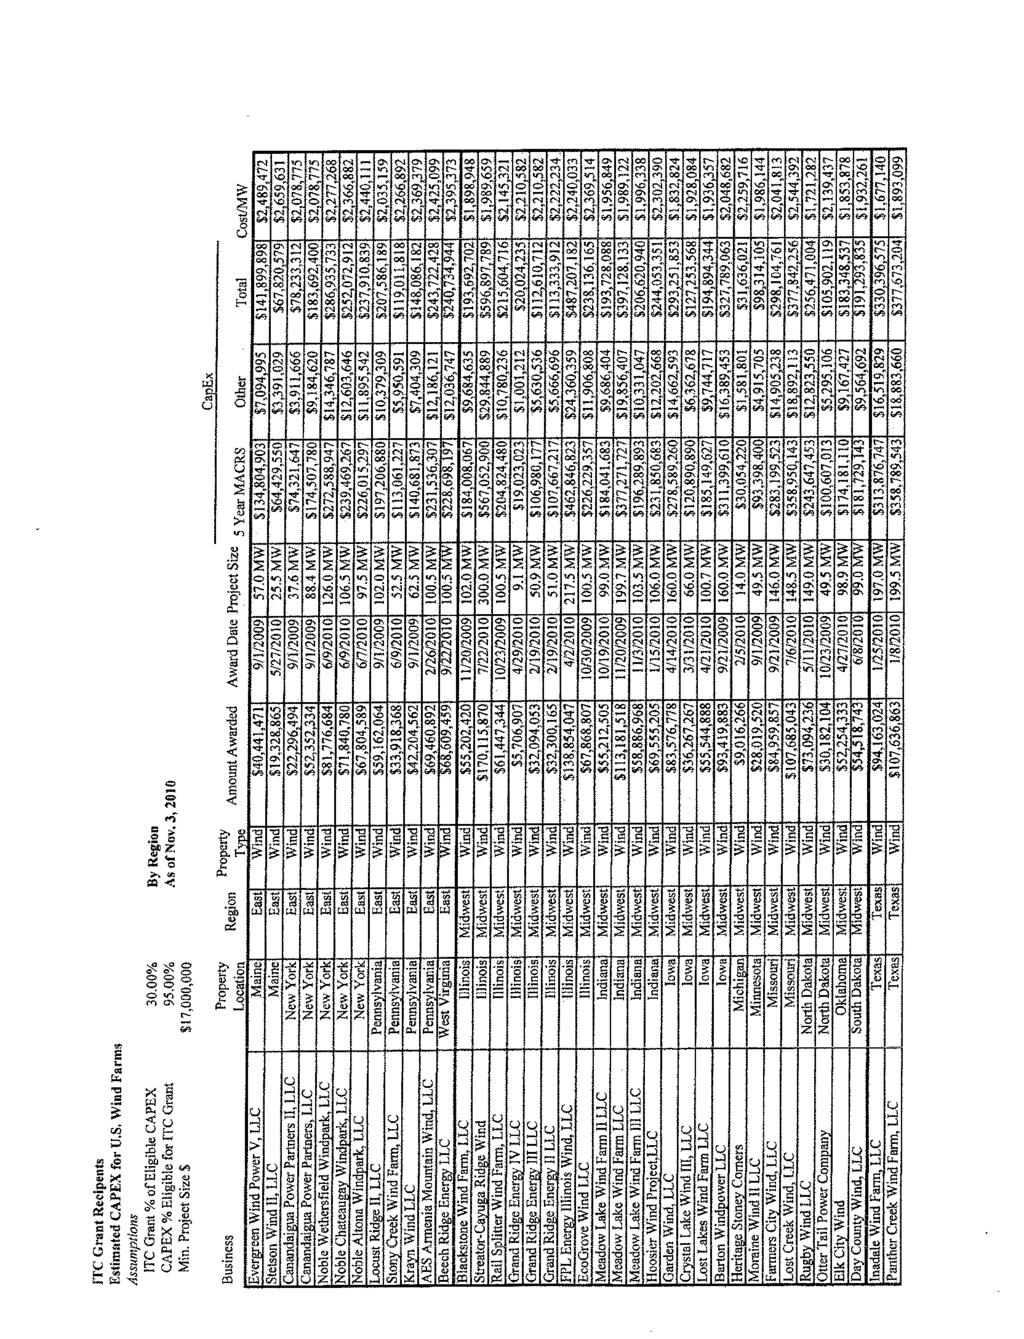
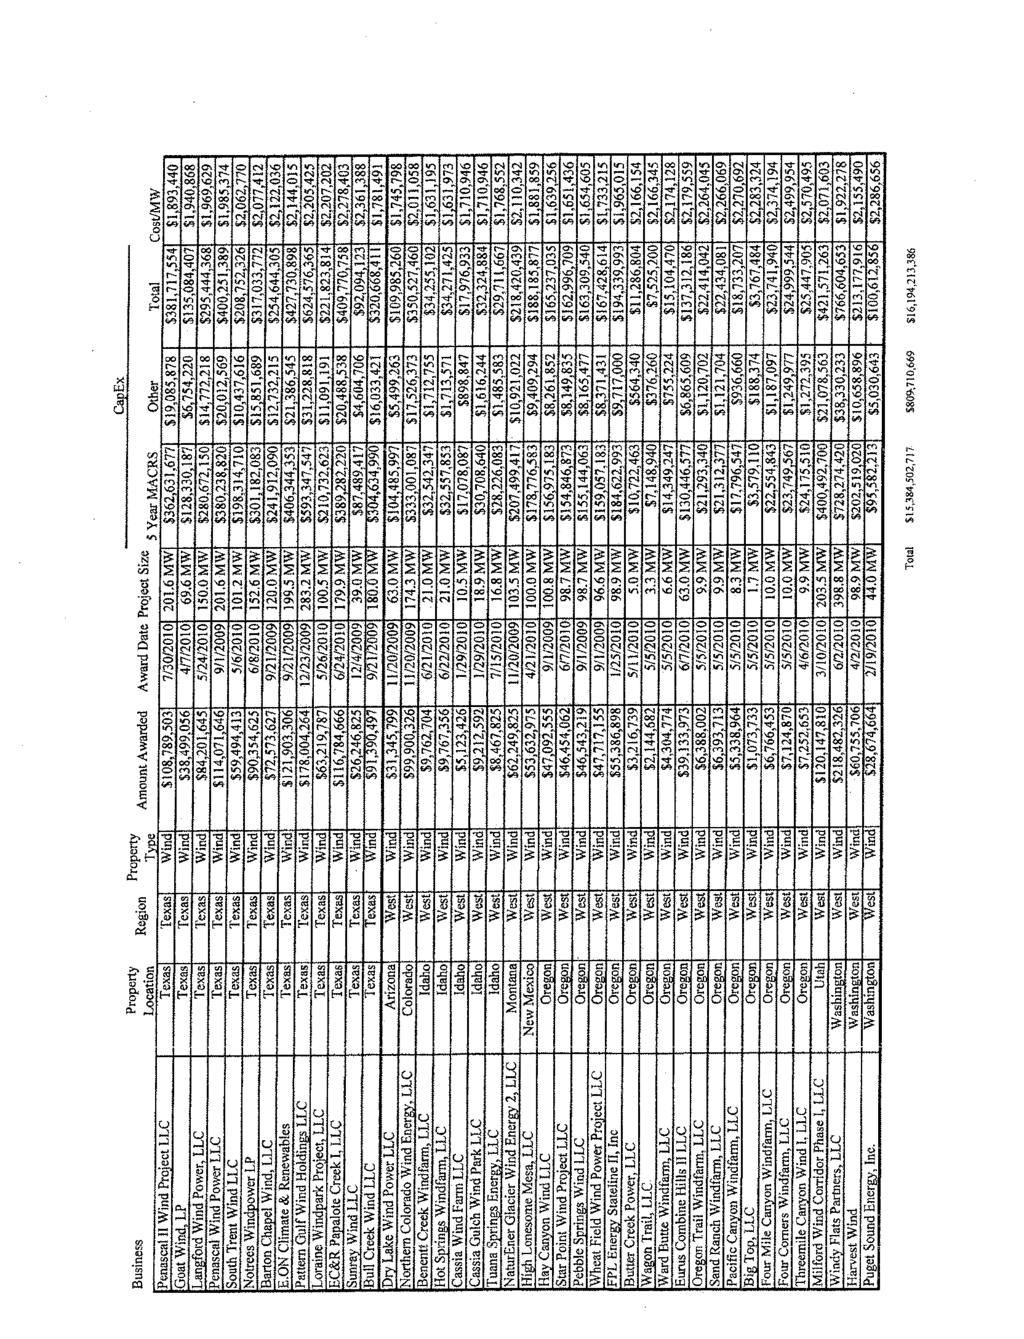
31 PACIFICORP 2011 IRP ADDENDUM CHAPTER 3 ADDITIONAL WIND ANALYSIS CHAPTER 3 APPRAISAL OF INTERWEST ENERGY ALLIANCE S WIND CAPITAL COST AND CAPACITY FACTOR RECOMMENDATIONS Introduction At the 2011 IRP public input meeting held December 15, 2010, Wasatch Wind (a wind project developer headquartered in Utah) and other participants contended that PacifiCorp s planning capital cost value for east-side wind projects were too high, while the planning capacity factor value 35 percent for Wyoming and 29 percent for Utah were too low. PacifiCorp agreed to review information supplied by participants and provide its assessment to all IRP public participants, also noting that it was too late to incorporate such information into the portfolio development process. 8 At the Company s discretion, a sensitivity analysis on wind selection impacts of alternative capital cost and capacity factor values may be conducted as warranted based on its findings. On January 10, 2011, PacifiCorp received wind capital cost and net capacity factor information from Interwest Energy Alliance (IEA). This information is included as Appendix A. The sections below provide PacifiCorp s response to both IEA s capital cost and capacity factor recommendations. Capital Costs The Company has reviewed the IEA s ITC Grant Recipient project cost overview and, while informative, the information is not viewed as a suitable replacement for PacifiCorp s own wind cost information. The reasons are summarized below. First, The IEA information is generally not representative of projects that would interconnect to PacifiCorp s transmission system. None of the example projects are located in Wyoming and only one is located in Utah. In contrast, PacifiCorp s wind capital cost estimates are informed by both actual project costs and regionally-adjusted capital costs used in an independently produced model (ICF International s IPM model). The IPM model supports development of PacifiCorp s forward price curve and, therefore, assumptions within the IPM model are inherently important as it relates to the Company s IRP. Second, the costs represented by IEA are derived by taking United States Treasury Department s ITC Grants stemming from the 2009 Stimulus Bill and dividing by The result is shown on a cost per unit basis ($/MW). IEA represents the divisor as being an adjustment factor to convert the amount of cost qualifying for the cash grant into total wind project costs. It is not known if the total wind project costs being promoted by IEA can accurately be compared to the capital 8 PacifiCorp presented and discussed resource option characteristics, including those for wind, at the August 4, 2010, public input meeting. The subsequent meeting report, provided to IRP participants on October 5, 2010 and posted to PacifiCorp s IRP Web site, included the detailed table of resource characteristics. 25
32 PACIFICORP 2011 IRP ADDENDUM CHAPTER 3 ADDITIONAL WIND ANALYSIS cost assumptions used by PacifiCorp in its most recent version of the IRP. PacifiCorp s cost estimate is intended to represent all costs to develop, permit, construct, own and operate a representative wind-powered generation resource using PacifiCorp s weighted average cost of capital and with an assumed economic life of 25 years. IEA s estimate appears to rely on two key assumptions: (1) that IEA s view of total wind project costs includes all of the factors included in PacifiCorp s cost estimate, and (2) IEA has accurately interpreted Internal Revenue Service (IRS) guidance associated with such grants. It is uncertain if IEA s interpretation of IRS guidance as applied to such a limited set of western project data can, or should, serve as definitive prediction of all costs that will affect the total bus bar costs of future wind-powered generation resources as seen from the customer s perspective. For example, it is uncertain what portion of transmission-related costs the IRS considers as being qualifying costs under the 2009 Stimulus Bill and how transmission-related costs (e.g., generation tie line and/or transmission collector system costs) will change as future projects are brought to fruition. Third, the IEA s sample data set data represents projects that were poised and ready to qualify for a cash grant under the 2009 Stimulus Act. As such, the data set does not account for significant new and prospective environmental regulatory actions or other policy decisions that are expected to change development costs for future projects. Examples include (1) Wyoming s Greater sage-grouse core breeding area plan, (2) the effect of emerging Land-Based Wind Energy Guidelines by the U.S. Fish and Wildlife Service, and (3) federal, state or local tax and/or permitting policies. (As noted above, none of the sample projects in the IEA data set include projects in Wyoming, which are subject to Wyoming s sales tax and generation excise tax policies.) Fourth, even if IEAs estimates include all of the cost elements included in PacifiCorp s estimate, because of the factors that led to the 2009 Stimulus Act, it is impossible to ascertain what cost concessions developers were able to extract from major equipment suppliers and/or construction contractors during then-current market conditions. Furthermore, because PacifiCorp is planning for the long-term, any long-run cost improvements can reasonably be expected to be offset to some degree by supply chain pricing dynamics and/or the effects of domestic and/or international market demand, depth and liquidity. Finally, it can also reasonably be expected that market forces will result in the development of increasingly less desirable and/or more costly sites as the more optimal sites are utilized (i.e., moving higher up the cost-supply curve). In summary, PacifiCorp does not see definitive evidence suggesting that the capital cost estimates in the IRP for wind-powered generation resources are inappropriately high. However, to get a sense for what IEA s capital cost recommendation would do in terms of a wind resource selection impact, we refer to the alternate wind integration cost sensitivity results on page 244 of the 2011 IRP. The lower wind integration cost used for this sensitivity study, $5.38/MWh, equates to a fixed cost reduction of $195/kW. Using the alternative wind integration cost value resulted in 81 MW of additional wind. Based on the $346/kW capital cost reduction advocated by IEA ($2,239/kW from IRP Table 6.5 less $1,893/kW from page 1 of IEA s materials), the capacity impact is not likely to exceed 150 MW. 26
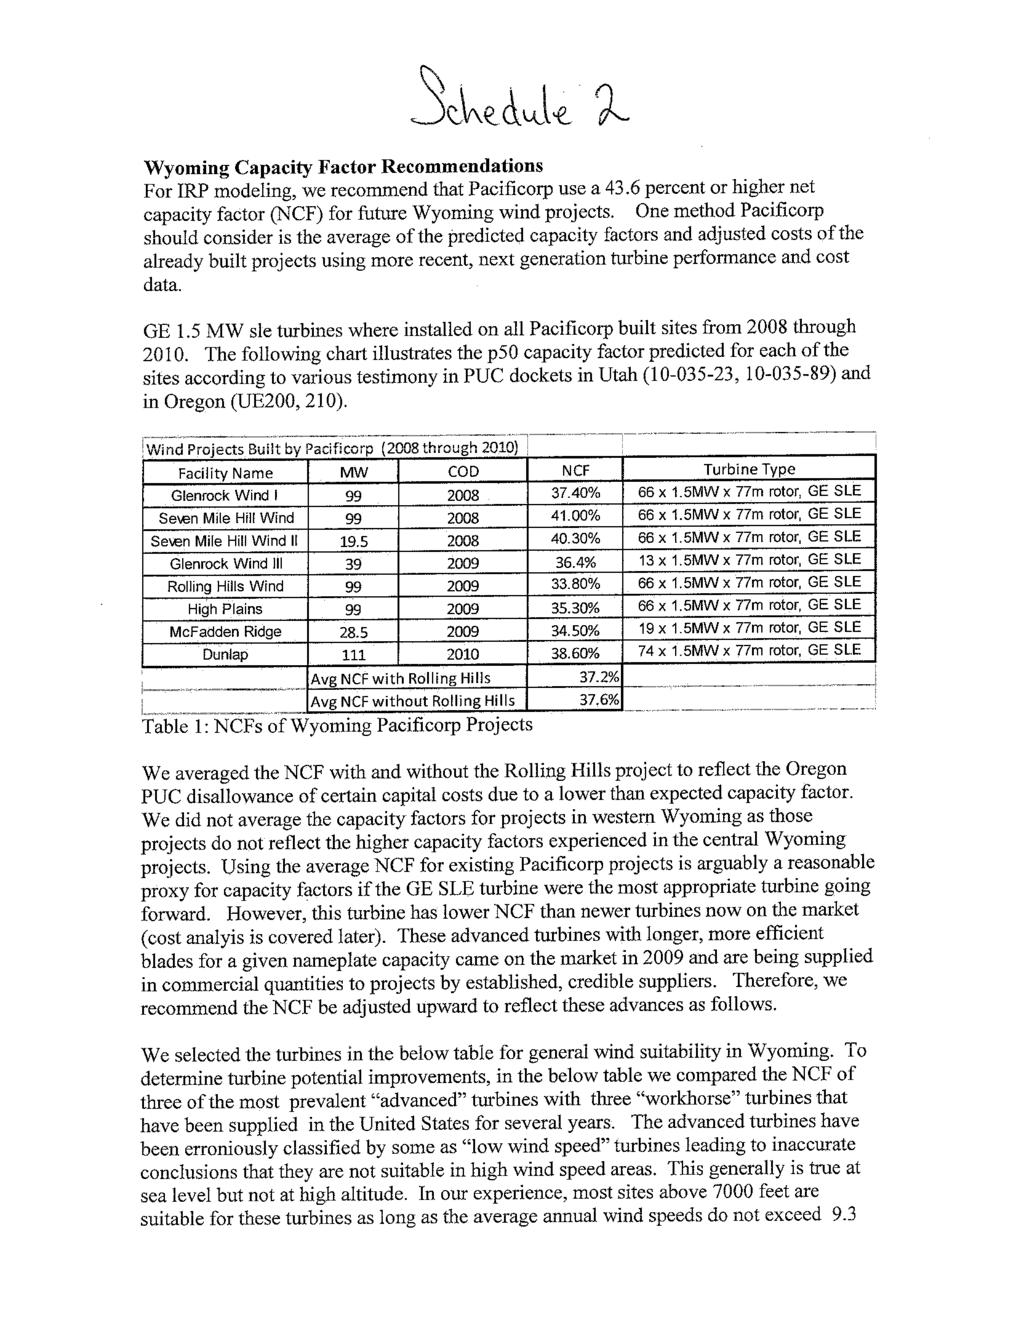
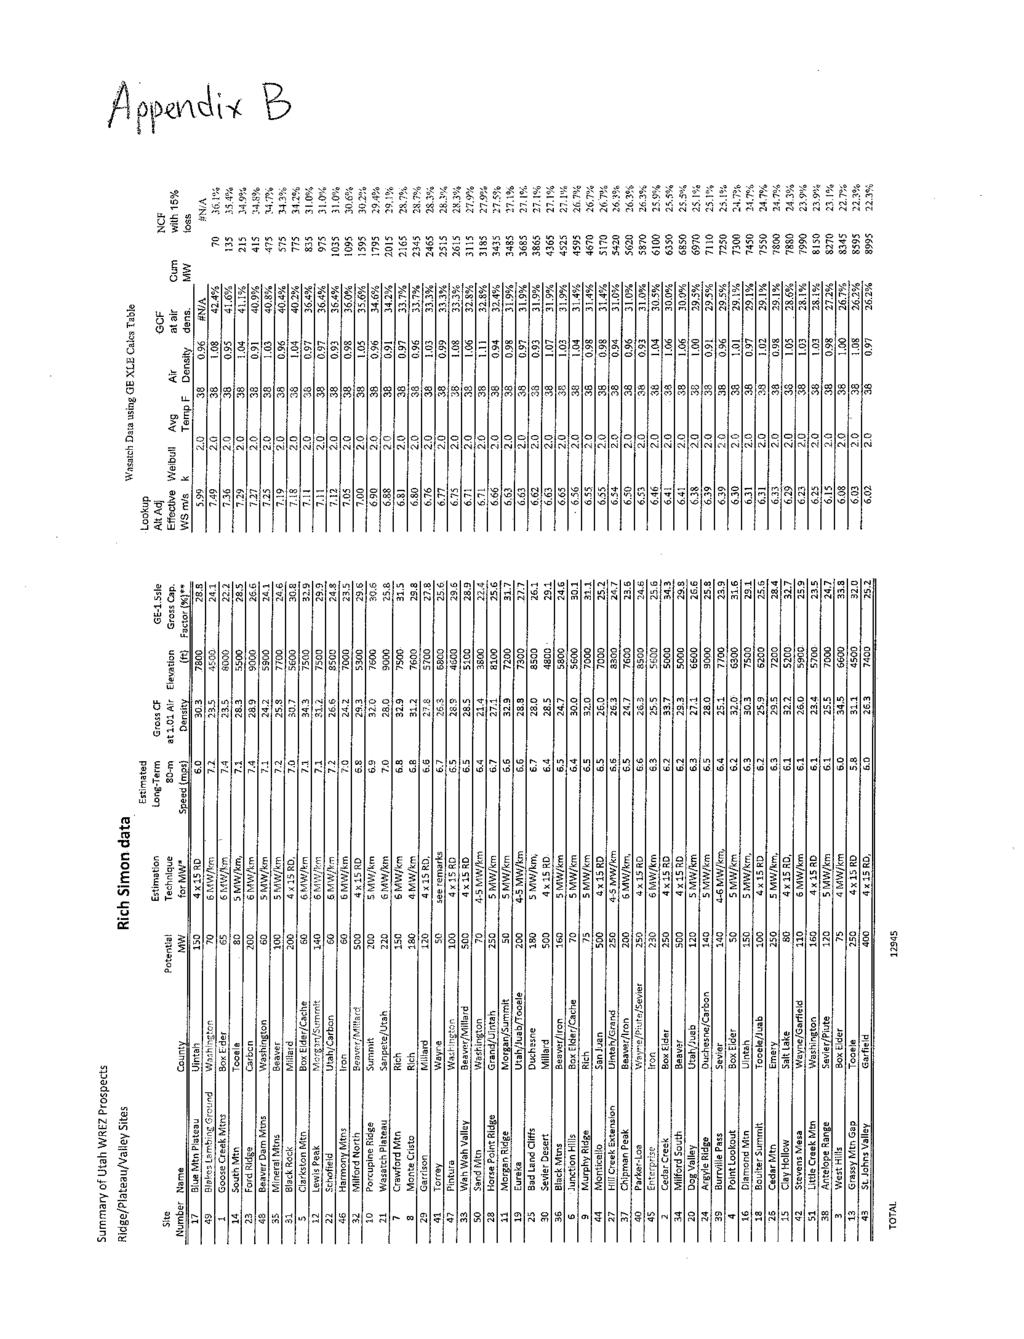
33 PACIFICORP 2011 IRP ADDENDUM CHAPTER 3 ADDITIONAL WIND ANALYSIS Capacity Factors IEA makes multiple generalized assumptions and, using these assumptions as a basis, suggests that PacifiCorp should use a 43.6% or higher net capacity factor (NCF) for modeling future Wyoming wind projects. Below is a discussion of these generalized assumptions and their suitability for characterizing NCFs for use in the IRP context. IEA assumes that the NCF associated with PacifiCorp owned wind resources in Wyoming should serve as a base-level assumption for future wind projects. IEA determines the average NCF for seven selected resources. Using this average NCF, IEA represents that it can back into an annual average wind speed (in meters per second) that should be associated with future wind projects constructed in Wyoming. IEA concludes that 8.6 meters per second should be assumed as the annual average wind speed. Using this average wind assumption, IEA further concludes a theoretical NCF increase of 112 percent can be achieved if a General Electric (GE) model 1.5 megawatt (MW) XLE wind turbine generator (WTG) is used instead of a GE 1.5 MW SLE WTG. The GE 1.5 MW XLE WTG has longer blades and a larger rotor diameter (82.5 meters) than the GE 1.5 MW SLE WTG (77 meter rotor diameter). IEA considers the GE 1.5 XLE to be an advanced WTG design. IEA likewise considers the Vestas V90 and Siemens 2.3 MW WTGs, with 90 meter and 101 meter rotor diameters respectively, to be advanced WTG designs. Applying the 112 percent enhancement to the Dunlap I NCF, IEA represents it has demonstrated its theory. In short IEA suggest that PacifiCorp should assume that all future wind projects in Wyoming are suitable for WTGs with increased rotor diameters. While PacifiCorp agrees that WTG design evolutions may favorably impact performance for those sites for which they are suitable, the Company makes the following observations regarding IEA s NCF recommendation and the assumptions it is based on. First, IEA s NCF recommendation assumes all Wyoming wind developments could utilize WTGs with increased rotor diameters. In arriving at this conclusion, IEA points toward an unreferenced GE determination that, depending on final layouts and turbulence intensity, the GE XLE model is meteorologically suitable for some wind projects at 7500 altitude with annual average wind speeds of 8.5 m/s to over 10 m/s. IEA s representation that WTG suitability for a site is primarily based on average annual wind speed and turbulence intensity is flawed. The suitability of a WTG model(s) for any given site can only be determined using a site specific mechanical loads assessment performed by the turbine manufacturer. IEA has provided no evidence of such assessments demonstrating that WTGs with rotor diameters as large as 101 meters are broadly suitable for use in Wyoming. Further, IEA fails to adequately discuss that WTG suitability is often driven by 50-year peak gusts and turbulence intensity at high wind speeds. Without a sufficient amount of reliable data from the site towers, it is difficult to conclusively determine if a WTG is suitable for a given site, let alone if specific WTG models are broadly suitable for use in Wyoming. Indeed, manufacturers may require more site data to be collected to verify that their WTGs are suitable, and in the event that site conditions are more extreme than was indicated by the data provided to the manufacturer (e.g., higher wind gusts or higher overall average wind speeds), they may not honor warranties in the event of failures associated with greater than estimated environmental conditions at the site. For these reasons, PacifiCorp s IRP does not rely on generalized WTG assumptions. 27
34 PACIFICORP 2011 IRP ADDENDUM CHAPTER 3 ADDITIONAL WIND ANALYSIS Second, IEA s assumed NCF improvement (12 percent applied broadly) associated with the GE XLE WTG over the GE SLE WTG is significantly higher than that indicated by a recent Company procurement process. In its 2009R renewable Request for Proposals, PacifiCorp received two separate bids from the same developer using the same site and based on the GE SLE WTG versus GE XLE WTG. The capacity factor difference was only 1.8 percentage points in favor of the GE 1.5 XLE WTG, a difference of 4.6 percent. This is in contrast to the 12 percent capacity factor improvement recommended by IEA. 9 Of note is that the bid based on the GE XLE WTG commanded a price premium relative to the bid based on the GE SLE WTG. PacifiCorp further notes that IEA s recommendation to reduce assumed capital costs (discussed above) relied on information where the model of WTG was not disclosed. Finally, in selecting the seven wind projects that serve as the source of the average NCF assumption that, in turn, serves as the starting point for all of IEA s subsequent assumptions and resulting adjustments, IEA fails to consider all of PacifiCorp s owned and contracted wind resources in Wyoming. IEA dismisses this choice by stating that We did not average the capacity factors for projects in western Wyoming as those projects do not reflect the higher capacity factors experienced in the central Wyoming projects. PacifiCorp believes there is no basis to assume that all future Wyoming resources would be restricted to locations in just central Wyoming. PacifiCorp s IRP assumption of a 35 percent NCF for planning purposes is informed by those wind resources that are actually in the current portfolio. The NCF for operating Wyoming wind resources both owned and acquired through power purchase contracts is percent based on weighted averaging with each resource s nameplate capacity. This weighted average NCF reflects capacity factor updates utilized in the latest Wyoming General Rate Case. Of note is that Dunlap I has a NCF of 36.4 percent rather than the 38.6 percent NCF cited by IEA. This is in comparison to IEA s starting-point assumption of 37.6 percent. PacifiCorp emphasizes that the NCF assumption in the IRP is not intended to be based on idealistic or theoretical assumptions of what may find its way into the portfolio. Indeed, NCF is not what will determine which individual renewable resources will be added to PacifiCorp s portfolio in the future. The cost and risk to customers of those case-by-case decisions is what will be the determining factor. Conclusion For the reasons cited above, PacifiCorp does not find IEA s recommendations to change the IRP cost or NCF assumptions associated with wind-powered generation resources to be warranted. PacifiCorp will continue to rely on its procurement practice of making decisions regarding individual renewable resource additions on a case-by-case basis, and the standard for such decisions will continue to be established regulatory principals regarding prudence and benefit to customers. 9 Mechanical load suitability of the alternate GE XLE WTG is uncertain. 28
35 PACIFICORP 2011 IRP ADDENDUM APPENDIX A IEA COMMENTS AND DATA APPENDIX A COMMENTS AND DATA SUBMISSION FROM INTERWEST ENERGY ALLIANCE 29

36 10 January 2011 Pete Warnken PacifiCorp IRP Team Re: 2011 IRP Modeling Dear Mr. Warnken: Interwest Energy Alliance appreciates the opportunity to provide input to promote accurate cost analysis of wind and solar energy in the public process related to development of PacifiCorp s 2011 IRP. We ask you to consider some of the enclosed materials related to wind development costs and net capacity factors as you develop modeling inputs and consider the results. Several questions raised at the public meeting held on December 15, 2010, by Wasatch Wind and others, which require further response and consideration. We want to provide any support you may require to inform the resource planning process related to these issues. First, wind costs are lower than PacifiCorp assumes in its modeling, due to decreases in turbine prices and related costs. See attached Schedule 1 Recent Turbines Using the ITC Grant Proxy, and ITC Grant Recipients CAPEX For U.S. Wind Farms attached thereto. Second, please consider the information related to net capacity factors attached as Schedule 2, with Appendix A Wind Turbine Brochure Information and Appendix B Summary of Utah WREZ Prospects attached thereto. Your modeling should reflect the increased net capacity factors available from this new equipment available to the market. We appreciate the opportunity to provide this input. Best regards. Sincerely, Craig Cox Executive Director P.O. Box , Denver, Colorado
37
38
39
40
41
42
43
44
45
46
47
48

49 Appendix A 1.5 MW Wind Turbine Brochure; [Alternate website]
50
2011 Integrated Resource Plan
 2011 Integrated Resource Plan Portfolio Evaluation Results Preferred Portfolio Selection February 14, 2011 Pacific Power Rocky Mountain Power PacifiCorp Energy Recap of Portfolio Resource Differences,
PACIFICORP CLASS 2 DSM DECREMENT STUDY
 PACIFICORP CLASS 2 DSM DECREMENT STUDY This document presents the methodology and results of the Class 2 demand-side management (DSM) (energy efficiency) decrement study. For this analysis, the 2015 integrated
2011 IRP Public Input Meeting. December 15, Pacific Power Rocky Mountain Power PacifiCorp Energy
 2011 IRP Public Input Meeting December 15, 2010 Pacific Power Rocky Mountain Power PacifiCorp Energy Agenda 2011 IRP schedule update and next steps Resource portfolio development status Supply Side Resources
2007 Integrated Resource Plan
 2007 Integrated Resource Plan Public Input Meeting Presentation April 18, 2007 Agenda 2006 IRP will now be referred to as 2007 IRP Introduction Load Forecast Update Summary of Changes to Forecast Changes
Integrated Resource Plan
 2011 Integrated Resource Plan Redacted Supplemental Coal Replacement Study Let s turn the answers on. September 21, 2011 This document contains confidential information, and is provided subject to the
2013 Integrated Resource Plan
 2013 Integrated Resource Plan Energy Efficiency Modeling Workshop Wind Integration Study Technical Workshop Portfolio Development Roundtable Discussion June 20, 2012 1 Agenda Energy efficiency modeling
2017 Integrated Resource Plan. Public Input Meeting 8 March 2-3, 2017
 2017 Integrated Resource Plan Public Input Meeting 8 March 2-3, 2017 Agenda March 2 - Day One Introductions Draft Preferred Portfolio Overview Market Price Scenarios (Refresher) Lunch Break (1 hour) 11:30
RE: UM 1729 Standard Avoided Cost Purchases from Eligible Qualifying Facilities Compliance Filing
 April 26, 2018 VIA ELECTRONIC FILING Public Utility Commission of Oregon 201 High Street SE, Suite 100 Salem, OR 97301-3398 Attn: Filing Center RE: UM 1729 Standard Avoided Cost Purchases from Eligible
Integrated Resource Plan Update
 Assuring a bright future for our customers 2007 Integrated Resource Plan Update Pacific Power Rocky Mountain Power PacifiCorp Energy This 2007 Integrated Resource Plan Update (IRP) Report is based upon
APPENDIX I PLANNING RESERVE MARGIN STUDY
 APPENDIX I PLANNING RESERVE MARGIN STUDY Introduction The planning reserve margin (), measured as a percentage of coincident system peak load, is a parameter used in resource planning to ensure there are
BEFORE THE PUBLIC UTILITIES COMMISSION OF THE STATE OF CALIFORNIA PACIFICORP. Chapter 2. Direct Testimony of Joseph P. Hoerner and Shayleah J.
 Investigation No. -0-0 Exhibit No. Witnesses: Joseph P. Hoerner and Shayleah J. LaBray BEFORE THE PUBLIC UTILITIES COMMISSION OF THE STATE OF CALIFORNIA PACIFICORP Chapter Direct Testimony of Joseph P.
SYSTEM OPERATIONAL AND RELIABILITY BENEFITS TOOL ( SBT )
") SYSTEM OPERATIONAL AND RELIABILITY BENEFITS TOOL ( SBT ) SBT Workgroup Workshop #2 September 30, 2013 Portland, Oregon and Salt Lake City, Utah Let s turn the answers on. SBT Workgroup Participants Organizations
SYSTEM OPERATIONAL AND RELIABILITY BENEFITS TOOL ( SBT ) SBT Workgroup Workshop #2 September 30, 2013 Portland, Oregon and Salt Lake City, Utah Let s turn the answers on. SBT Workgroup Participants Organizations
All Source Request for Proposal for 2016 Resource. Bidders Conference January 17, 2012
 All Source Request for Proposal for 2016 Resource Bidders Conference January 17, 2012 2000 PACIFICORP PAGE 2 Agenda Role of the Independent Evaluator (IEs) Request for Proposal (RFP) for 2016 resource
PacifiCorp s 2017 Integrated Resource Plan Update. Public Utility Commission of Oregon Public Meeting - July 3, 2018
 PacifiCorp s 2017 Integrated Resource Plan Update Public Utility Commission of Oregon Public Meeting - July 3, 2018 2017 IRP Update Highlights Energy Vision 2020 projects updated with the latest cost-and-performance
Energy Trust Electric and Gas Avoided Cost Update for Oregon for 2018 Measure and Program Planning
 Energy Trust Electric and Gas Avoided Cost Update for Oregon for 2018 Measure and Program Planning August 8, 2017 Energy Trust s estimates of future electric and gas avoided costs are critical assumptions
2006 Integrated Resource Plan Public Input Meeting
 2006 Integrated Resource Plan Public Input Meeting June 7, 2006 Pacific Power Utah Power Rocky Mountain Power Agenda Demand-Side Management: Class I & III Resource Assessment Update Procurement Update:
May 9, This presentation will summarize some key takeaways from the most recent Pacificorp Integrated Resource Plan (IRP) filed in April 2017
 filed in April 2017") Henry Lorenzen Chair Oregon Bill Bradbury Oregon Guy Norman Washington Tom Karier Washington W. Bill Booth Vice Chair Idaho James Yost Idaho Jennifer Anders Montana Tim Baker Montana May 9, 2017 MEMORANDUM
Henry Lorenzen Chair Oregon Bill Bradbury Oregon Guy Norman Washington Tom Karier Washington W. Bill Booth Vice Chair Idaho James Yost Idaho Jennifer Anders Montana Tim Baker Montana May 9, 2017 MEMORANDUM
2011 IRP Public Input Meeting. August 4, Pacific Power Rocky Mountain Power PacifiCorp Energy
 2011 IRP Public Input Meeting August 4, 2010 Pacific Power Rocky Mountain Power PacifiCorp Energy Agenda Demand-side management / distributed generation Supply-side Resources Planning Reserve Margin (PRM)
Pacific Power Renewable Portfolio Standard Oregon Implementation Plan January 1, 2014
 Pacific Power 2015-2019 January 1, 2014 (Updated February 28, 2014) Pursuant to S 469A.075 and OAR 860-083-0400, PacifiCorp, d.b.a. Pacific Power (the Company or PacifiCorp), respectfully submits the Oregon
Table 10.1 DRAFT IRP Action Plan
 Table 10.1 DRAFT IRP Plan Item 1. Renewable Resource s 1a. Wind Integration Update the wind integration study for the 2015 IRP. The updated wind integration study will consider the implications of an energy
SYSTEM OPERATIONAL AND RELIABILITY BENEFITS TOOL ( SBT )
") SYSTEM OPERATIONAL AND RELIABILITY BENEFITS TOOL ( SBT ) SBT Workgroup Workshop #3 November 20, 2013 Portland, Oregon and Salt Lake City, Utah Let s turn the answers on. Agenda (MT) 10:00-10:15 Welcome
SYSTEM OPERATIONAL AND RELIABILITY BENEFITS TOOL ( SBT ) SBT Workgroup Workshop #3 November 20, 2013 Portland, Oregon and Salt Lake City, Utah Let s turn the answers on. Agenda (MT) 10:00-10:15 Welcome
CHAPTER 3: RESOURCE STRATEGY
 Seventh Northwest Conservation and Electric Power Plan CHAPTER 3: RESOURCE STRATEGY Contents Key Findings... 3 A Resource Strategy for the Region... 3 Summary... 3 Scenario Analysis The Basis of the Resource
Electric Analysis PSE Integrated Resource Plan. Contents. Chapter 6: Electric Analysis
 6 2017 PSE Integrated Resource Plan Electric Analysis This chapter presents the results of the electric analysis. Contents 1. ANALYSIS OVERVIEW 6-3 2. RESOURCE NEED 6-5 Components of Physical (Peak) Need
2017 Integrated Resource Plan. Public Input Meeting 7 January 26-27, 2017
 2017 Integrated Resource Plan Public Input Meeting 7 January 26-27, 2017 Agenda January 26, 2017 Day One Introductions Volume III Studies Lunch Flexible Capacity Reserve Requirements Study Incremental
DATA ASSUMPTIONS AND DESCRIPTION OF STUDIES TO BE PERFORMED 2014 EGSL & ELL Integrated Resource Plans
 ENTERGY GULF STATES LOUISIANA, L.L.C. & ENTERGY LOUISIANA, LLC LPSC DOCKET NO. I-33014 DATA ASSUMPTIONS AND DESCRIPTION OF STUDIES TO BE PERFORMED 2014 EGSL & ELL Integrated Resource Plans This version
TRANSMISSION SYSTEM OPERATIONAL AND RELIABILITY BENEFITS TOOL ( SBT ) SBT Workgroup Kick-Off Workshop July 29, Let s turn the answers on.
 SBT Workgroup Kick-Off Workshop July 29, Let s turn the answers on.") TRANSMISSION SYSTEM OPERATIONAL AND RELIABILITY BENEFITS TOOL ( SBT ) SBT Workgroup Kick-Off Workshop July 29, 2013 Let s turn the answers on. Agenda SBT Team SBT Background SBT Overview Workgroup Approach
TRANSMISSION SYSTEM OPERATIONAL AND RELIABILITY BENEFITS TOOL ( SBT ) SBT Workgroup Kick-Off Workshop July 29, 2013 Let s turn the answers on. Agenda SBT Team SBT Background SBT Overview Workgroup Approach
PACIFICORP DEMAND-SIDE RESOURCE POTENTIAL ASSESSMENT FOR
 PACIFICORP DEMAND-SIDE RESOURCE POTENTIAL ASSESSMENT FOR 2017-2036 VOLUME 1: EXECUTIVE SUMMARY Prepared for: PacifiCorp February 14, 2017 Applied Energy Group, Inc. 500 Ygnacio Valley Road, Suite 250 Walnut
Idaho Power s Transmission System. Greg Travis Nov. 8, 2018
 Idaho Power s Transmission System Greg Travis Nov. 8, 2018 Presentation Outline Acronyms and definitions Energy Imbalance Market (EIM) Idaho Power s transmission system Path 14 ID-NW Open discussion Acronyms
INTEGRATED RESOURCE PLAN
 INTEGRATED RESOURCE PLAN 2016 OPUC Meeting April 21, 2016 2016 Portland General Electric. All rights reserved. Welcome: Today s Topics April 21, 2016 Slide 2 Clean Power Plan (CPP) Update Resource Portfolios
Boardman to Hemingway Transmission Line Project
 Transmission Line Project Purpose and Need Meeting Summary South Advisory Area July 8, 2009 Four Rivers Cultural Center 676 SW 5th Avenue Ontario, OR 97914 Table of Contents Introduction... 3 Welcome and
Appendix 13. Renewable Energy Market Potential
 Appendix 13. Renewable Energy Market Potential Briefing Paper for the SageCon Partners Estimates of Oregon Renewable Development through 2025 Phil Carver, Oregon Dept. of Energy January 22, 2014 Summary
APPENDIX G: CONSERVATION RESOURCES AND DIRECT APPLICATION RENEWABLES
 Seventh Northwest Conservation and Electric Power Plan APPENDIX G: CONSERVATION RESOURCES AND DIRECT APPLICATION RENEWABLES Contents Overview... 4 General Conservation Resource Methodology... 5 Baseline...
Briefing Paper for the SageCon Partners Estimates of Oregon Renewable Development through 2025
 Briefing Paper for the SageCon Partners Estimates of Oregon Renewable Development through 2025 Phil Carver, Oregon Dept. of Energy January 23, 2014 Revisons based in PacifiCorp comments as of January 22
PACIFIC POWER A DIVISION OF PACIFICORP
 PACIFIC POWER A DIVISION OF PACIFICORP 825 NE Multnomah, Suite 2000 Portland, Oregon 97232 October 30, 2015 VIA ELECTRONIC FILING AND OVERNIGHT DELIVERY Steven V. King Executive Director and Secretary
2017 INTEGRATED RESOURCE PLAN UPDATE. May 1, 2018
 2017 INTEGRATED RESOURCE PLAN UPDATE May 1, 2018 This 2017 Integrated Resource Plan Update is based upon the best available information at the time of preparation. The IRP action plan will be implemented
Review of BC Hydro s Alternatives Assessment Methodology
 Review of BC Hydro s Alternatives Assessment Methodology Prepared for BC Hydro September 23, 2014 AUTHORS Rachel Wilson Bruce Biewald David White 485 Massachusetts Avenue, Suite 2 Cambridge, Massachusetts
100% Fossil Free Electricity. June 27, 2018
 100% Fossil Free Electricity June 27, 2018 Current Washington Emissions Levels 100 90 +7% 80 70 60 50-82% 40 30 20 10 0 1990 2013 2050 (goal) 2016 2017 2018 2019 2020 2021 2022 2023 2024 2025 2026 2027
Levelized Cost of New Generation Resources in the Annual Energy Outlook 2012
 July 2012 Levelized Cost of New Generation Resources in the Annual Energy Outlook 2012 This paper presents average levelized costs for generating technologies that are brought on line in 2017 1 as represented
2017 IRP Update. Proposed Long Term Resource Strategy Proposed Conservation
 2017 IRP Update Proposed Long Term Resource Strategy Proposed Conservation + 10-Year Potential Estimate + 2018/2019 Conservation Target Proposed Action Plan Commission Briefing October 2, 2017 Pre-Decisional
CASE: UM 1910/1911/1912 WITNESS: BRITTANY ANDRUS PUBLIC UTILITY COMMISSION OF OREGON STAFF EXHIBIT 100
 CASE: UM // WITNESS: BRITTANY ANDRUS PUBLIC UTILITY COMMISSION OF OREGON STAFF EXHIBIT 0 March, 0 Docket No: UM // Staff/0 Andrus/ 0 SECTION : INTRODUCTION Q. Please state your name, occupation, and business
Appendix C. Regulatory Compliance Matrix DRAFT 2018 OR IRP
 Matrix DRAFT 2018 OR IRP Matrix Page 2 Order No. 07-047 Guideline (1)(a) Guideline (1)(b) All resources must be evaluated on a consistent and comparable basis All known resources for meeting the utility
Resource and Financial Impact of Clean Line P&E HVDC Delivered Wind Resources for TVA
 Resource and Financial Impact of Clean Line P&E HVDC Delivered Wind Resources for TVA 1. What is the potential contribution of HVDC wind to TVA s forecast demand? HVDC wind could meet 1.4-4.1 % of TVA
BEFORE THE PUBLIC UTILITY COMMISSION OF OREGON UM 1396
 BEFORE THE PUBLIC UTILITY COMMISSION OF OREGON UM 1396 In the Matter of the Public Utility Commission of Oregon Investigation into the Determination of Resource Sufficiency, Pursuant to Order No. 06-538.
February 5, SUBJECT: Release draft white paper on the value of energy efficiency for comment.
 Jennifer Anders Chair Montana Tim Baker Montana Guy Norman Washington Tom Karier Washington Richard Devlin Vice Chair Oregon Ted Ferrioli Oregon Jim Yost Idaho Vacant Idaho February 5, 2019 DECISION MEMORANDUM
New England States Committee on Electricity
 Renewable and Clean Mechanisms 2.0 Study Phase I: Scenario Analysis Winter 2017 New England States Committee on Electricity Overview Context Analytical Approach and Modeling Assumptions Scenario Analysis
APPENDIX B: WHOLESALE AND RETAIL PRICE FORECAST
 APPENDIX B: WHOLESALE AND RETAIL PRICE FORECAST Contents Introduction... 3 Key Findings... 3 Background... 5 Methodology... 7 Inputs and Assumptions... 8 Load... 8 Fuel Prices... 9 Resources... 9 Pacific
Integrated Resource Plan
 Assuring a bright future for our customers 2007 Integrated Resource Plan Appendices Pacific Power Rocky Mountain Power PacifiCorp Energy This 2007 Integrated Resource Plan (IRP) Report is based upon the
BEFORE THE PUBLIC UTILITIES COMMISSION OF THE STATE OF CALIFORNIA PACIFICORP. Direct Testimony of John A. Cupparo
 Docket No. 0- Exhibit No. PPL/00 Witness: John A. Cupparo BEFORE THE PUBLIC UTILITIES COMMISSION OF THE STATE OF CALIFORNIA PACIFICORP Populus to Terminal Transmission Line November 00 Cupparo/ 0 Q. Please
Regional Coordination in the West: Benefits of PacifiCorp and California ISO Integration
 Regional Coordination in the West: Benefits of PacifiCorp and California ISO Integration Technical Appendix October 2015 Regional Coordination in the West: Benefits of PacifiCorp and California ISO Integration
PACIFIC POWER A DIVISION OF PACIFICORP
 PACIFIC POWER A DIVISION OF PACIFICORP NE Multnomah, Suite 000 Portland, Oregon June 0, 01 VIA ELECTRONIC FILING Public Utility Commission of Oregon 01 High Street SE, Suite 0 Salem, OR 01- Attn: RE: Filing
House Energy and Public Utilities Committee March 15, Kendal Bowman Vice President, Regulatory Affairs and Policy
 House Energy and Public Utilities Committee March 15, 2017 Kendal Bowman Vice President, Regulatory Affairs and Policy At A Glance North Carolina 112 years of service 3.3 million retail customers in 83
TEP Portfolio Strategies Michael Sheehan
 TEP Portfolio Strategies Michael Sheehan Director, Resource Planning Integrated Resource Plan (IRP) What is an IRP? A detailed evaluation of future Loads and Resources The current best view of the future
CASE: UM 1910, 1911, 1912 PUBLIC UTILITY COMMISSION OF OREGON STAFF BRIEF
 CASE: UM,, 1 PUBLIC UTILITY COMMISSION OF OREGON STAFF BRIEF July, 0 1 1 In the Matter of: PORTLAND GENERAL ELECTRIC COMPANY BEFORE THE PUBLIC UTILITY COMMISSION OF OREGON Investigation to Determine the
CHAPTER 4 KEY MODEL INPUTS
 CHAPTER 4 KEY MODEL INPUTS Commodity Price Forecasts Used in the 2015 Plan Forecast commodity prices represent the market price NorthWestern will pay for energy purchased to balance its portfolio. There
ENO 2015 IRP PUBLIC TECHNICAL CONFERENCE MAY 12, 2016
 ENO 2015 IRP PUBLIC TECHNICAL CONFERENCE MAY 12, 2016 C ONFERENCE OBJECTIVES Development of the 2015 IRP Process Recap ENO s resource needs IRP Scope and Objectives Overview of Final ENO 2015 IRP Primary
House Energy and Public Utilities Committee March 8, Kendal Bowman Vice President, Regulatory Affairs and Policy
 House Energy and Public Utilities Committee March 8, 2017 Kendal Bowman Vice President, Regulatory Affairs and Policy At A Glance North Carolina 112 years of service 3.3 million retail customers in 83
PGE s 2013 Integrated Resource Plan
 PGE s 2013 Integrated Resource Plan OPUC Public Meeting 2014 Portland General Electric. All rights reserved. Today s topics IRP public process Load-resource balance Assumptions and inputs E3 low-carbon
Selected Findings from Scenario and Sensitivity Analysis Conducted To Date. August 6, 2015
 Selected Findings from Scenario and Sensitivity Analysis Conducted To Date August 6, 2015 Progress Since The July Council Meeting: All Planned Scenario Analysis Completed! RPM Systems 2 Progress Since
Energy Vision Bureau of Land Management 2017 Industry - Government Conference September 13, 2017
 Energy Vision 2020 Bureau of Land Management 2017 Industry - Government Conference September 13, 2017 Agenda Energy Vision 2020 Overview Development Plans Repowering Existing Wind Fleet Gateway West Transmission
Pacific Northwest Low Carbon Scenario Analysis
 Pacific Northwest Low Carbon Scenario Analysis Achieving Least-Cost Carbon Emissions Reductions in the Electricity Sector November 8, 2017 Arne Olson, Partner Nick Schlag, Sr. Managing Consultant Jasmine
Rick Haener September 4th, 2015
 Integrated Resource Plan Rick Haener September 4th, 2015 Integrated Resource Plan (IRP) Public utilities first began preparing integrated resource plans (IRPs) in the early 1990s IRPs are Public Utility
PACIFICORP: PRIVATE GENERATION RESOURCE ASSESSMENT FOR LONG TERM PLANNING
 PACIFICORP: PRIVATE GENERATION RESOURCE ASSESSMENT FOR LONG TERM PLANNING AUGUST 30, 2018 1 DISCLAIMER Notice Regarding Presentation This presentation was prepared by Navigant Consulting, Inc. (Navigant)
11. Stakeholder Process
 Ameren Missouri Highlights Ameren Missouri conducts an inclusive stakeholder process to solicit feedback on its assumptions and analysis methods. Ameren Missouri hosted a stakeholder meeting in February
2017 IRP Update. Analyses Update Portfolio & Sensitivity Results Preliminary Findings. Commission Briefing August 22, 2017
 2017 IRP Update Analyses Update Portfolio & Sensitivity Results Preliminary Findings Commission Briefing August 22, 2017 Agenda 1. Analyses Updates 2. Portfolio Results by Scenario Planned Additions Portfolio
The Role of Efficiency In Meeting PNW Energy Needs
 The Role of Efficiency In Meeting PNW Energy Needs Tom Eckman Manager, Conservation Resources Conservation Energy Efficiency As A Resource September 29, 2009 Conservation Slide 1 Today s Topics Energy
Generation Technology Assessment & Production Cost Analysis
 SPO Planning Analysis Generation Technology Assessment & Production Cost Analysis EAI Stakeholder Meeting July 31, 212 Technology Life Cycle Technology Deployment Over Time Conceptual Research & Development
Scenarios Proposed for Testing
 Draft 7 th Plan Development Schedule and Scenarios Proposed for Testing March 24, 2015 Major Seventh Plan Development Milestones Methodology for Quantification of Environmental Costs and Benefits EE and
Revised Overview of PV Inputs, Data Sources, and Potential Study Results
 Date: September 28, 2012 To: From: Re: PacifiCorp Revised Overview of PV Inputs, Data Sources, and Potential Study Results Introduction, under contract to PacifiCorp, has calculated the predicted technical
Zero Net Carbon Portfolio Analysis
 Zero Net Carbon Portfolio Analysis Prepared for: Platte River Power Authority December 12, 2017 www.paceglobal.com Agenda Background Methodology Assumptions Cases Findings and Recommendations Page 2 Background
Please see response to Question 9 for information related to final TVA resource estimates.
 SACE Questions 1. A document or documents showing TVA s assumed capital costs in the base case strategy for all storage, solar, and wind resource options for each year of the forecast (2019-2038). Although
Sustainable Energy Management
 Sustainable Energy Management Achieving Energy Independence at Wastewater Utilities Dru Whitlock, PE 1 Global Renewable Energy Drivers Climate Change (Global Environmental Issues) Global Economic Downturn
PREPARED FOR: ARIZONA PUBLIC SERVICE Updated Solar PV Value Report
 PREPARED FOR: ARIZONA PUBLIC SERVICE 2013 Updated Solar PV Value Report MAY 2013 2013 Updated Solar PV Value Report Arizona Public Service May 10, 2013 This report has been prepared for the use of the
Beyond LCOE: The Value of CSP with Thermal Energy Storage
 CSP Beyond LCOE: The Value of CSP with Thermal Energy Storage energy.gov/sunshot Mark S. Mehos, Program Manager, CSP NREL Discussion SunShot and LCOE Understanding the Value of CSP with Thermal Energy
The TRC levelized cost includes:
 Date: August 14, 2012 To: Don Jones, Eli Morris, and Pete Warnken PacifiCorp From: Heidi Ochsner and Tina Jayaweera, Cadmus Re: Overview of Solar Water Heating Inputs, Data Sources, and Potential Study
PacifiCorp Coal Unit Valuation Study. A Unit-by-Unit Cost Analysis of PacifiCorp s Coal-Fired Generation Fleet
 PacifiCorp Coal Unit Valuation Study A Unit-by-Unit Cost Analysis of PacifiCorp s Coal-Fired Generation Fleet Prepared for Sierra Club June 20, 2018 Contents 1. Executive Summary... 4 2. Introduction...
2019 Integrated Resource Plan (IRP) Public Input Meeting September 27-28, 2018
 Public Input Meeting September 27-28, 2018") 1 2019 Integrated Resource Plan (IRP) Public Input Meeting September 27-28, 2018 Agenda September 27 Day One 9:00am-10:30am pacific Draft Supply-Side Resource Table 10:30am-11:30am pacific Intra-Hour Flexible
1 2019 Integrated Resource Plan (IRP) Public Input Meeting September 27-28, 2018 Agenda September 27 Day One 9:00am-10:30am pacific Draft Supply-Side Resource Table 10:30am-11:30am pacific Intra-Hour Flexible
July 5, 2018 MEMORANDUM. Power Committee. John Ollis, Power System Analyst. SUBJECT: Wholesale Electricity Price Forecast BACKGROUND:
 James Yost Chair Idaho W. Bill Booth Idaho Guy Norman Washington Tom Karier Washington Jennifer Anders Vice Chair Montana Tim Baker Montana Ted Ferrioli Oregon Richard Devlin Oregon July 5, 2018 MEMORANDUM
SB 838: Oregon Renewable Energy Act Establishing an Oregon Renewable Energy Standard
 SB 838: Oregon Renewable Energy Act Establishing an Oregon Renewable Energy Standard Section-by-Section Summary SB 838, C-engrossed version As passed by Oregon House of Representatives, May 23 rd, 2007.
NORTHWESTERN ENERGY 2018 ELECTRICITY RESOURCE PROCUREMENT PLAN STRAWMAN 1
 NORTHWESTERN ENERGY 2018 ELECTRICITY RESOURCE PROCUREMENT PLAN CHAPTER 1. EXECUTIVE SUMMARY STRAWMAN 1 1. Load Service Requirements a. Peaking Capacity (Planning Reserve Margin) b. Dispatchable Capacity
Co-Benefits of Renewable Energy and Energy Efficiency in Utah
 Co-Benefits of Renewable Energy and Energy Efficiency in Utah Air Quality, Health and Water Benefits A Report to the State of Utah March 15, 2010 Jeremy Fisher, PhD; Jon Levy, ScD; Yurika Nishioka, ScD;
Potential Impacts of a Renewable and Energy Efficiency Portfolio Standard in Kentucky
 Potential Impacts of a Renewable and Energy Efficiency Portfolio Standard in Kentucky Prepared for the Mountain Association for Community Economic Development & the Kentucky Sustainable Energy Alliance
PUBLIC UTILITY COMMISSION OF OREGON STAFF REPORT PUBLIC MEETING DATE: September 27, 2016 CONSENT X EFFECTIVE DATE
 ITEM NO. CA 15 PUBLIC UTILITY COMMISSION OF OREGON STAFF REPORT PUBLIC MEETING DATE: CONSENT X EFFECTIVE DATE REGULAR Upon Commission Approval DATE: TO: Public Utility Commission FROM: John Crider THROUGH:
Colorado PUC E-Filings System
 Page of BEFORE THE PUBLIC UTILITIES COMMISSION OF THE STATE OF COLORADO * * * * IN THE MATTER OF THE APPLICATION OF PUBLIC SERVICE COMPANY OF COLORADO FOR APPROVAL OF ITS 0 ELECTRIC RESOURCE PLAN ) ) )
ENTERED 06/17/05 BEFORE THE PUBLIC UTILITY COMMISSION OF OREGON LC 36 ) ) ) ) ) DISPOSITION: PLAN ACKNOWLEDGED
 ) ) ) ) DISPOSITION: PLAN ACKNOWLEDGED") ENTERED 06/17/05 BEFORE THE PUBLIC UTILITY COMMISSION OF OREGON LC 36 In the Matter of IDAHO POWER COMPANY 2004 Integrated Resource Plan. ) ) ) ) ) ORDER DISPOSITION: PLAN ACKNOWLEDGED The Oregon Public
ENTERED 06/17/05 BEFORE THE PUBLIC UTILITY COMMISSION OF OREGON LC 36 In the Matter of IDAHO POWER COMPANY 2004 Integrated Resource Plan. ) ) ) ) ) ORDER DISPOSITION: PLAN ACKNOWLEDGED The Oregon Public
Attached are my initial comments on behalf of the American Council for an Energy-Efficient Economy (ACEEE).
.") From: mgkushler@aol.com Sent: Saturday, September 09, 2017 10:18 AM To: MPSCEDOCKETS Cc: Poli, Patricia (LARA) Subject: Commens on Staff IRP Strawman for Case No U-18418 Attachments: ACEEE comments on
From: mgkushler@aol.com Sent: Saturday, September 09, 2017 10:18 AM To: MPSCEDOCKETS Cc: Poli, Patricia (LARA) Subject: Commens on Staff IRP Strawman for Case No U-18418 Attachments: ACEEE comments on
Alberta Capacity Market
 Alberta Capacity Market Comprehensive Market Design (CMD 1) Design Proposal Document Section 3: Calculation of Capacity Market Demand Parameters Prepared by: Alberta Electric System Operator Date: January
2009 Integrated Resource Plan. PNUCC Board of Directors Meeting. January 7, Copyright 2010 Portland General Electric. All Rights Reserved.
 2009 Integrated Resource Plan PNUCC Board of Directors Meeting January 7, 2011 1 Copyright 2010 Portland General Electric. All Rights Reserved. IRP Public Process 2 2009 IRP / Boardman Public Process:
Hetch Hetchy Integrated Resource Plan Commission Meeting May 23, 2017
 Hetch Hetchy Integrated Resource Plan Commission Meeting May 23, 2017 Today s Presentation 1. Introduction to IRP 2. IRP Applied to Hetch Hetchy Program 3. IRP Approach 4. IRP Results 5. Discussion SFPUC
Draft 7 th Plan Scenarios Proposed for Testing
 Draft 7 th Plan s Proposed for Testing RSAC March 12, 2015 Major Seventh Plan Development Milestones Methodology for Quantification of Environmental Costs and Benefits EE and Generating Resource Cost and
APSC Docket No U Entergy Arkansas, Inc Integrated Resource Plan
 Entergy Arkansas, Inc. APSC FILED Time: 10/31/2012 2:33:12 PM: Recvd 10/31/2012 2:30:51 PM: Docket 07-016-U-Doc. 24 425 West Capitol Avenue P. O. Box 551 Little Rock, AR 72203-0551 Tel 501 377 4457 Fax
Proposal Concerning Modifications to LIPA s Tariff for Electric Service
 Proposal Concerning Modifications to LIPA s Tariff for Electric Service Requested Action: The Long Island Power Authority ( LIPA ) staff proposes revisions to the LIPA Tariff for Electric Service to authorize
DISTRIBUTED GENERATION POTENTIAL STUDY FOR PENNSYLVANIA
 ITC DISTRIBUTED GENERATION POTENTIAL STUDY FOR PENNSYLVANIA Prepared for: PENNSYLVANIA PUBLIC UTILITY COMMISSION Final Report March 2015 Prepared by: Statewide Evaluation Team Intentionally Left Blank
ERCOT Public LTRA Probabilistic Reliability Assessment. Final Report
 ERCOT Public 2016 LTRA Probabilistic Reliability Assessment Final Report November 21, 2016 Contents Summary... 1 Software Model Description... 3 Demand Modeling... 3 Controllable Capacity Demand Response
2013 Integrated Resource Plan. Supply-Side Resources (Utility-scale) Renewable Portfolio Standards Wind Integration Study Update August 13, 2012
 Renewable Portfolio Standards Wind Integration Study Update August 13, 2012") 2013 Integrated Resource Plan Supply-Side Resources (Utility-scale) Renewable Portfolio Standards Wind Integration Study Update August 13, 2012 1 Overview Utility-scale Supply-Side Resources Lunch Break
2013 Integrated Resource Plan Supply-Side Resources (Utility-scale) Renewable Portfolio Standards Wind Integration Study Update August 13, 2012 1 Overview Utility-scale Supply-Side Resources Lunch Break
January 3, 2018 MEMORANDUM. Council Members. John Ollis, Power System Analyst. SUBJECT: Marginal Carbon Emissions Rate Study Draft BACKGROUND:
 Henry Lorenzen Chair Oregon Bill Bradbury Oregon Guy Norman Washington Tom Karier Washington W. Bill Booth Vice Chair Idaho James Yost Idaho Jennifer Anders Montana Tim Baker Montana January 3, 2018 MEMORANDUM
PUBLIC UTILITY COIVHVHSSION OF OREGON STAFF REPORT PUBLIC MEETING DATE: May 22, 2018
 ITEM NO. 4 PUBLIC UTILITY COIVHVHSSION OF OREGON STAFF REPORT PUBLIC MEETING DATE: May 22, 2018 REGULAR X CONSENT EFFECTIVE DATE May 23, 2018 DATE: TO: Public Utility Commission FROM: Brittany Andrys?
APPENDIX A: RESOURCE PLANNING ANALYSIS
 PUBLIC DOCUMENT TRADE SECRET DATA EXCISED APPENDIX A: RESOURCE PLANNING ANALYSIS Minnesota Power has studied many options for meeting environmental regulations on Boswell Energy Center Unit 4 ( BEC4 )
IRP Public Input Meeting. January 29, 2004
 IRP Public Input Meeting January 29, 2004 Agenda» RFP Update RFP 2003A - Supply Side RFP RFP 2003 B Renewables RFP Demand Side RFP» Review of Inputs & Assumptions» Topology Update» Planning Margin Study»
UTILITY-SCALE RENEWABLES: TECHNOLOGY & POLICY
 UTILITY-SCALE RENEWABLES: TECHNOLOGY & POLICY Sarah Cottrell Propst Executive Director Interwest Energy Alliance September 25, 2014 Women in Government Advanced Technology & Innovation Summit About Interwest
TDI-NE Responses to 83D Questions December 28, b. Type of Organization (Public/Industry/Advocacy/Other)
") 1. Please provide the following information with your comments: a. Name of Organization Champlain VT, LLC d/b/a TDI-NE b. Type of Organization (Public/Industry/Advocacy/Other) Industry (Merchant Transmission
1. Please provide the following information with your comments: a. Name of Organization Champlain VT, LLC d/b/a TDI-NE b. Type of Organization (Public/Industry/Advocacy/Other) Industry (Merchant Transmission