SOMFY - PHILIPS Light balancing Whitepaper
|
|
|
- Madison Hart
- 6 years ago
- Views:
Transcription

1 SOMFY - PHILIPS Light balancing Whitepaper Prepared by Dr Ya Roderick Mr Eoin Nolan Dr Craig Wheatley Mr David McEwan INTEGRATED ENVIRONMENTAL SOLUTIONS LIMITED March 2013 SOMFY - PHILIPS Light Balancing Whitepaper Page 1
2 Table of Contents 1. Introduction Somfy - Philips Light Balancing System Shading and lighting control algorithms Shading control algorithms Lighting control algorithms Methodology Climatic Locations Office Building Model Simulation modelling Results and discussion Shading control analysis Baseline model (scenario 1) Static manual blind control (scenario 2) Dynamic manual blind control (scenario 3) Automated time based blind control (scenario 4) Integrated dynamic shading & lighting control (scenario7) Lighting control analysis Occupancy based switching lighting control (scenario 5) Conclusions SOMFY - PHILIPS Light Balancing Whitepaper Page 2
3 1. Introduction One of the fundamental requirements of buildings is to provide a sheltered living and working space from the extremes of climate. The objective of environmental building design is to create a comfortable yet energy efficient internal environment. Consequently, building façade becomes the actual separator between the indoor and outdoor climate and has a filtering effect on the external impacts. The general performance requirement for building façade varies with location and climate, building type and interior spatial design as well as the needs determined by interior visual tasks. These often interrelate in an intricate way and are time dependent. Therefore, choosing an optimal façade is a complex discipline with many often contradictory parameters of considerable interdependence (Ochoa and Capeluto, 2009). For example, maximization of daylight usage is desired as it reduces electricity consumption for lighting and enhances visual quality. Nevertheless, large fenestration areas often results in excessive solar gains and high varying heating and cooling loads as well as glare problems. As a result, introduction of dynamic fenestration whose optical behaviour (transmission, refection and scattering) may change over time due to shading devices may create the possibility of obtaining a more beneficial utilisation of the available resources, such as insolation and daylight, with respect to both energy demand requirement and occupant comfort (Lee, et al. 1998). Moreover, driven by technological advances in transparent building facades, design alternatives have shifted to utilizing dynamic fenestration and shading systems for optimal control of daylighting and solar gains (Athanassios and Andress, 2006). Building façade can be constructed with a number of static and dynamic components that in combination are capable of preventing thermal and visual discomfort. Shading should be considered as an integral part of fenestration system design in order to balance daylighting requirements versus the need to reduce solar gains. Recent studies (Tzempelikos and Sthienitis, 2003; Johnson et al. 1984) have shown that appropriate shading design and control, when linked with simultaneous control of electric lighting and HVAC components, could significantly reduce peak cooling load and electricity consumption while maintaining good thermal and illuminance indoor conditions. This is particularly important for being able to achieve nearly-zero energy buildings from as required by the recent 2010 Energy Performance of Building Directive (EPBD 2010). It has been recognised that the trend for energy consumption in buildings is a decrease of thermal energy for space conditioning and an increase of electricity for installations and appliances (Bloem and Atanasiu, 2009). Electric lighting is one area where energy savings are possible at reasonable cost in new buildings as well as in retrofit projects. Therefore there is a significant opportunity for potential energy reductions and increase in occupant comfort through implementing integrated lighting and shading controls. However, this is only possible by carefully selecting fenestration and shading properties and control, taking into account their combined impact and then optimizing their operation (Athanassios and Andress, 2006). If the fenestration systems impose adverse thermal loads, the actual savings from the use of daylight to replace or supplement electric lighting may be reduced. The key issue is to accurately evaluate the performance of integrated dynamic façades in terms of their detailed optical and thermal characterization. The most effective means of achieving this is through detailed, dynamic, hourly or sub-hourly computer simulations that model thermal and daylighting performance in an integrated manner to determine the level of indoor environment and the energy demand for heating, cooling and artificial lighting. In this paper, the focus is on quantifying potential energy savings from employing various shading and lighting controls in buildings and investigating the integrated impact on heating, cooling and lighting energy demands by using IES <VE>, the advanced building performance simulation tool. A case study was carried out based on Somfy - Philips shading and lighting control system, called light balancing. A range of shading controls comprising both manual and automated blind controls and a set of lighting controls including manual, occupancy-sensing and dimming controls were explored respectively based on an office building model for 5 different climatic locations. Comparisons of energy performance between these controls were examined. Based on simulation results, it has been indicated that by introducing shading and lighting controls it generally reduces the total energy consumption and the overall energy saving can be achieved up to 8% compared to SOMFY - PHILIPS Light Balancing Whitepaper Page 3


4 a baseline scenario where there was no blind installed and the lighting was simply manually operated. It is worth mentioning that the predicted energy saving was only an indication based on the setup of the case study and the energy saving can be genuinely increased if a better blind fabric is chosen, a better floor layout is designed or different control thresholds are selected. It is also noted that the type of control strategy and the local climatic condition play a key role in determining the extent to which the energy consumption can be reduced. As expected, the time based switching blind control and the occupancy based light switching & daylight dimming control have individually proved to be the most energy efficient approach amongst the investigated shading control strategies and the lighting control strategies respectively. 2. Somfy - Philips Light Balancing System Somfy - Philips light balancing system (Somfy website) is a dynamic solar shading and lighting control system, which reacts by taking into account the occupant presence and external climatic conditions in order to achieve visual comfort when a space is occupied and energy saving when the space is vacant. In general, visual comfort is the key if the space is occupied. In this sense, solar shading will be positioned automatically to avoid glare but still allowing natural daylighting while the luminaire photo sensor dims the light. However occupants are able to override the system and control the position of the solar shading manually via their RTS remote control. The lighting system will adjust the level of light automatically based on the incoming daylight level. If the space is vacant, the luminaires are turned off and the solar shading will be either completely open or closed depending on the heating and cooling needs as well as the external climatic conditions. Figure 2-1 illustrates the light balancing mechanism in different scenarios. External climatic condition: no sun (no direct solar radiation, cloudy (diffuse solar radiation available) Occupancy: yes Internal natural light: low and need artificial lighting Artificial light: maximum External climatic condition: a little sun, some clouds Occupancy: yes Internal natural light: maximum, prevent glare Artificial light: medium Priority: visual comfort External climatic condition: sunny Occupancy: yes Internal natural light: maximum, no direct glare Artificial light: minimum Priority: visual comfort External climatic condition: warm period Occupancy: no Priority: prevent cooling SOMFY - PHILIPS Light Balancing Whitepaper Page 4
5 External climatic condition: cool period Occupancy: no Priority: prevent heating Figure 2-1: Illustration of SOMFY - PHILIPS light balancing (SOMFY 2012) In order to better understand the light balancing dynamic shading and lighting control system and to explore its potential benefit on the heating, cooling and lighting energy demands, this paper sets out to examine various shading and lighting controls from basic manual mode to advanced automated mode with a certain assumptions and simplification using dynamic simulation modelling method. The simulated energy performances are then compared with intent to gain the knowledge of their potential impacts and benefits. 3. Shading and lighting control algorithms In this section, the examined shading and lighting control algorithms are presented in details, which were provided by Somfy and Philips. Only the internal blinds are considered in this study. 3.1Shading control algorithms Static manual blind control In this manual control mode, the internal blind is completely lowered during the occupied period and is fully retracted during the un-occupied period. This can be seen as a simple on and off control strategy according to the occupancy schedule used in each space. For example, offices are occupied from 08:00 to 17:00 in weekdays and are completely un-occupied in weekend, therefore the static manual blind control for office spaces would be the blind is fully lowered from 08:00 to 17:00 and is retracted during the period of 18:00-24:00 and 00:00-07:00 in weekdays and in weekend the blind is fully retracted. Note that different space types may have different occupancy profiles; therefore the static manual blind control may differ accordingly. In practice, this type of blind control is often applied to interior roller blinds; therefore a normal roller fabric has been used for simulating the control strategy here. Details of the fabric s thermal performance refer to Appendix A. Dynamic manual blind control In this control mode, the blind is manually operated by the occupants based on the internal illuminance level of a space. When the space is occupied and its internal illuminance level reaches 5000lux, the blind is fully lowered by the occupant. Once the blind is lowered, it remains the lowered position for the whole day and will be raised up the next day upon occupant first arrival. In this sense, the blind position during the weekend will be dependent on whether it s open or closed on previous Friday. Hence, settings of the dynamic manual blind control will differ due to different occupancy schedules (the start time) and the internal illuminance level. An interior venetian blind has been applied to this control and details see Appendix A. Automated time-based blind control This is an automated control mode. The blind is automatically controlled according to external illuminance level and occupancy schedule as well as the space heating and cooling needs. There are two control modes dependent on the difference between weekday and weekend and occupied and un-occupied conditions. During weekdays in occupied period, the blind control is in comfort SOMFY - PHILIPS Light Balancing Whitepaper Page 5
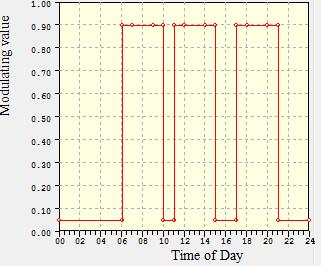
6 mode; otherwise, it is in eco mode. Note that the time-based control is occupancy related and it is not timer-based. Comfort mode The blind is lowered completely as soon as the external illuminance is equal to or above 15000lux. The blind is retracted otherwise. Eco mode During daytime, the blind is retracted, when o The external illuminance at the window is above 15000lux o The building has a need for heating (zone temperature < heating set point) During daytime the blind is lowered, when o The external illuminance at the window is above 15000lux o The building has a need for cooling (zone temperature > cooling set point), During nighttime the sun blind is lowered when o The external illuminance at the window is below 15000lux o The building has a need for heating (zone temperature < heating set point) During nighttime the blind is retracted when o The external illuminance at window is below 15000lux o The building has a need for cooling (zone temperature > cooling set point) The same type of interior venetian blind, as described in Appendix A, has been applied to this control. The venetian blind was assumed to be either fully open or fully closed, therefore the angle of the venetian blind is not considered in this study. 3.2 Lighting control algorithms Manual lighting control The manual lighting control is the most common practice and also is the most un-predictive operation as it is largely determined by the individual preference and by whether a space is actually occupied or un-occupied. It is generally regarded as the most energy intensive lighting approach and tends to be oversimplified, e.g. the lighting is 100% on during the whole working hours. In this study, an optimistic assumption of the manual lighting control has been adopted to illustrate a scenario which is not extremely energy intensive. As a result, it has been assumed that in weekdays lights are on at 90% during the occupied period and at 5% during un-occupied period. In weekends lights are off. Occupancy based switching lighting control This is an automated switching control based on the sensed occupancy status. It has been assumed that for perimeter zones lights are automatically switched on if occupants are present and off if no one is present with a 15min time out setting. For core zones lights are turned on during the occupied period and turned to 10% during the un-occupied period. The time out setting is to prevent the lights from constantly changing between on and off states in response to short transient conditions. Note that the perimeter zone is defined as a space which has external glazing and vice versa for the core zone. Figure 3-1 compares the manual lighting control with the occupancy based switching control based on office spaces for weekdays. Occupancy based switching & daylight dimming control SOMFY - PHILIPS Light Balancing Whitepaper Page 6


7 This control implements not only the occupancy based switching as described above, but also adds dimming due to available daylight. The dimming control is operated according to the external illuminance level and the dimming threshold is set as 650 lux. Lights are ideally linearly dimmable from 100% to 0% when the sensed external illuminance level varies from 0 lux to 650 lux. This is considered to be the most energy efficient approach amongst the three lighting options. Note that the occupancy information is shared between the Somfy and Philips Lighting system. Manual lighting control Occupancy based switching control Core zones Perimeter zones Figure 3-1 Comparison between manual lighting control and occupancy based switching control for office spaces in weekdays 4. Methodology Dynamic computer simulation is used to quantify the impact of various shading and lighting controls on the heating, cooling and lighting energy demands and to assess the potential energy savings from the employment of the integrated dynamic shading and lighting control approach based on an office building model. This section details methods used for delivering such simulation modelling. SOMFY - PHILIPS Light Balancing Whitepaper Page 7
8 4.1 Climatic Locations Climatic condition plays an important role in the design and control of a shading system and has an impact on both daylighting and thermal performance of buildings. In order to have a full picture of the climatic effect within this study, five locations have been selected to represent some of the most typical climate zones in the world, which are: Singapore: representing tropical/megathermal climates, known for their high temperatures year round and for their large amount of year round rain. UAE Abu Dhabi: representing dry (arid and semiarid) climates, characterized by little rain and a huge daily temperature range. Paris: representing maritime temperate climates or oceanic climate, known for that summers are cool due to cool ocean currents, but winters are milder than other climates in similar latitudes but usually very cloudy. San Francisco: representing dry-summer subtropical or Mediterranean climates, known for summers that are hot and dry, due to the domination of the subtropical high pressure systems, except in the immediate coastal areas, where summers are milder due to the nearby presence of cold ocean currents that may bring fog but prevent rain. Beijing: representing continental/micro-thermal climate, characterised by hot, humid summers and generally cold, windy, dry winters. Weather data used for the five locations are standard hourly weather files, which are IWEC format for Singapore, UAE Abu Dhabi, Beijing and Paris and TMY2 format for San Francisco. IWEC (International Weather for Energy Calculations) data files are suitable for use with building energy simulation programs for 227 locations outside the USA and Canada and TMY2 (Typical Meteorological Year 2) data sets are intended to use for computer simulations of solar energy conversion systems and building systems to facilitate performance comparisons of different system types, configurations, and locations in the United States and its territories (Energy plus website). Both weather data formats represent typical weather conditions. Figure 4-1 compares hourly drybulb temperatures of the five climatic locations in general and Figure 4-2 shows detailed breakdown of hours over a series of temperature ranges in steps of every 5 o C for each location. It can be seen that Abu Dhabi has the hottest summer over the five locations. The dry-bulb temperature can reach over 40 o C and there are total 1515 hours in which the temperature is above 35 o C. However, the temperature is seen to drop down from November to March around 12 o C to 25 o C. Singapore also has a hot weather, but it doesn t seem to have clear-cut seasons as the temperature is quite uniform all year round. There are 6514 hours in which the air temperature remains between 25 o C and 30 o C. In contrast, both Beijing and Paris have a wider temperature range, varying from -5 o C to 35 o C. Compared with Paris, Beijing has a hotter summer and a colder winter. Among the five locations, San Francisco seems to have a cool to mild weather throughout the year. There are 4482 hours that the dry-bulb temperature is around o C and only 163 hours that the temperature drops to 0-5 o C. SOMFY - PHILIPS Light Balancing Whitepaper Page 8

")
 Abu")

9 Figure 4-1 Comparison of dry-bulb temperature between the five climatic locations (a) Paris (b) Beijing (c) San Francisco (d) Abu Dhabi SOMFY - PHILIPS Light Balancing Whitepaper Page 9

10 (e) Singapore Figure 4-2 Breakdown of hours over a series of temperature arranges for the five locations Figures 4-3 and 4-4 show the maximum and mean global radiation, direct radiation and diffuse radiation respectively between the five climatic locations. Note that for the same climatic location, the maximum global radiation, the maximum direct radiation and the maximum diffuse radiation do not necessarily appear at the same time/date, therefore the sum of the maximum direct radiation and diffuse radiation is not equal to the maximum global radiation. As indicated in the two graphs, Abu Dhabi has the highest solar radiation level in terms of the maximum and the mean values while Paris has the lowest solar radiation level. Singapore also has rather high solar radiations. It is also noted that although San Francisco has a mild weather condition, it actually has a good solar resource. The maximum and mean direct solar radiation can reach 900 W/m 2 and 172W/m 2 respectively. Figure 4-3 Comparisons of maximum global, direct and diffuse radiations between the five climatic locations SOMFY - PHILIPS Light Balancing Whitepaper Page 10

11 Figure 4-4 Comparisons of mean global, direct and diffuse radiations between the five climatic locations 4.2 Office Building Model The case study building was intended to be representative as well as to allow the impact of various shading and lighting controls to be assessed correctly. It is believed that commercial buildings and primarily office buildings are classified among the building presenting the highest energy consumption (Marie and Ake, 2011). The total annual energy use in office buildings varies in the range kwh/m 2 yr, depending on the geographic location, use and type of office equipment, operational schedules, type of envelope, use of HVAC systems, type of lighting, etc. (Marie and Ake, 2011). Therefore, the building model was created as a seven storey office building as shown in Figure 4-5. The office building has multi-thermal zones comprising open plan and cellular office spaces, circulation area, gym, storage, toilet, kitchen, waiting area, café and changing room. There are 245 zones in total, of which 61 zones are perimeter spaces, 141 zones are core spaces and 43 zones represent ceiling voids. The total floor area of the building was m 2. The total building height was 46m and the floor-to-floor height was 4m. The window to wall ratios of the building model are summarised as below: East façade window to wall ratio = West façade window to wall ratio = South Façade window to wall ratio = North Façade window to wall ratio = Overall façade window to wall ratio = Plan views of the building model are shown in Appendix B. Constructions of the office building are also summarised in Appendix B. SOMFY - PHILIPS Light Balancing Whitepaper Page 11
 Modelling Guide.")
.")
12 (a) (b) Figure 4-5 Axonometric of the office building model To represent a typical internal gain from lighting, equipment and occupancy of an office, settings of the building model need to be standard and representative. Therefore, it was decided to follow the standard data sets from the UK NCM (National Calculation Methodology) Modelling Guide. The NCM Modelling Guide defines the procedures for demonstrating compliance with the Building Regulations for buildings other than dwellings under the European Energy Performance of Buildings Directive (EPBD). In order to facilitate estimating energy performance on a consistent basis, a key part of the NCM is a set of databases that define the activities in various types of space in different classes of building. The database provides standard occupancy patterns, temperature set-points, outdoor air rates and heat gain profiles for each type of space in the buildings, so that buildings with the same mix of activities will differ only in terms of their geometry, construction, building services and weather location. The lighting, equipment and occupancy gains associated with the different zones of the office building are listed in Appendix B. It should be noted that, except for the lighting schedule, both equipment and occupancy profiles were directly taken from the NCM Modelling Guide. Occupancy schedules are fixed profiles which were defined based on space types. In addition, the lighting is calculated based on lighting gains in unit of W/m 2 and the lighting schedule profiles. The lighting gain is a standard figure which varies with the space type. Hence, there are no specific lighting types associated. The office building model was mainly conditioned by a Fan Coil Unit system except for circulation area, toilets, kitchens, changing rooms and storage. Details of all the HVAC systems applied to the building model and their associated heating/cooling set points and ventilation rates are listed in Appendix B. SOMFY - PHILIPS Light Balancing Whitepaper Page 12
13 4.3 Simulation modelling The impact of introducing a range of solar shading and lighting controls on the building energy performance across different climates were investigated by using dynamic computational simulations. A state-of-the-art energy modelling tool, IES <VE> was employed to carry out the investigation. The IES <VE> is a suite of building performance modelling tools based around a single integrated data model. It is comprised of a series of individual modules including climate, geometric modelling, solar shading, energy and carbon, lighting, airflow, value/cost and egress modules but linked by a Common User Interface (CUI) and a single Integrated Data Model (IDM), which allows data input being passed among different applications. As described in the previous section, both solar shading and lighting controls are based on internal or external illuminance level, which requires an integrated modelling approach for analysis. The simulation work can be divided into two parts; first, the evaluation of dynamic daylight availability inside or outside each perimeter room and secondly the implementation of the solar shading and lighting control systems. These were modelled by using the <VE> lighting module, Radiance IES, and the energy and carbon module, ApacheSim respectively. Radiance is a software package developed by the Lighting Systems Research group at the Lawrence Berkeley Laboratory, U.S. It has been integrated into the <VE> and is compatible with other modules. It is used for calculating lighting levels (LUX), Daylight Factors or Glare for daylight and/or artificial lighting. ApacheSim is a dynamic thermal simulation module based on first-principles mathematical modelling of the heat transfer processes occurring in and around a building, which meets ASHRAE Standard 140. Within it, conduction, convection and radiation heat transfer processes for each element of the building fabric are individually modelled and integrated with models of room heat gains, air exchanges and HVAC plant operation. The thermal simulation was conducted in conjunction with the daylight simulation for modelling, the shading and lighting control strategies. Radiance IES calculates illuminances for a standard overcast sky and a number of clear skies with different sun positions. At the coincident simulation time ApacheSim mixes these skies in appropriate amounts to match the weather conditions at each hour of the simulation. This involves applying luminous efficacies to the weather file solar variables (W/m 2 ) to generate illuminance values (lux), from which multipliers are obtained scaling the contributions of the standard overcast and clear skies. There are three sky components in general; one overcast sky and two clear skies with different sun positions which are combined using interpolation. The multipliers are then applied to the internal sensor illuminances calculated by Radiance IES for the standard skies to derive the internal sensor illuminances for the hour in question. To take full advantage of available daylight and avoid dark zones, lighting zoning has been applied to perimeters zones, which virtually not physically divides a perimeter zone 6m from an external wall containing 15% glazing or more. There was one sensor positioned 2.23 m along the centreline from the window in the front zone at a height of 0.85m and one sensor positioned in the centre of the space in the back zone at the same height to calculate the horizontal internal illuminance levels which were then compared with the daylight dimming threshold (650 lux) to determine whether the artificial lighting would be dimmed. In addition, there were four sensors facing upward positioned horizontally 90 degree angle in between above the higher part of the roof to calculate the external illuminance level which was then used for the time based blind switching control. There are a total of 7 simulation scenarios which were conducted individually for the 5 climatic locations, as detailed in Table 4-1: SOMFY - PHILIPS Light Balancing Whitepaper Page 13
14 Table 4-1 Summary of simulation scenarios Scenario no Shading control Lighting control Note that: 1 No shading devices Manual lighting 2 Static manual blind control Manual lighting 3 Dynamic manual blind control Manual lighting 4 Automated time-based blind control Manual lighting 5 No shading devices Occupancy based switching control 6 No shading devices Occupancy based switching & daylight dimming control 7 Automated time-based blind control Occupancy based switching & daylight dimming control Scenario 1 is the baseline model which was used as the reference case to measure the potential energy savings that could be achieved by applying various shading and lighting controls; Scenarios 2-4 focused on investigating the shading controls; therefore the lighting control was simply set up as the manual control which means that the artificial lighting was operated in the same manner disregarding the availability of natural light; Scenario 5-6 focused on investigating the lighting controls, therefore the shading devices were not considered; Scenario 7 is referred as the integrated dynamic shading and lighting control, which was modelled as a combination of two separate controls, namely automated time-based blind control and occupancy based switching & daylight dimming control. In this sense, it hasn t been modelled in a real integrated manner. 5. Results and discussion 5.3 Shading control analysis Baseline model (scenario 1) Figures 5-1 to 5-4 show the room cooling plant sensible load, room heating plant sensible load, lighting energy and the total energy consumption of the baseline models for the five selected climatic locations respectively. The sensible load (either heating or cooling) is a measurement of amount of heat exchange in a unit time which has its sole effect of a change of temperature. The room heating/cooling plant sensible load is the sum of each room s heating/cooling sensible load in the building model. Note that the total energy consumption is not equal to the sum of the room cooling plant sensible load, the room heating plant sensible load and the lighting energy as it includes other types of energy consumptions e.g. equipment energy consumption. As shown in Figure 5-1, Abu Dhabi and Singapore have much higher room cooling sensible loads than the other locations. This is due to their overall rather high dry-bulb temperatures and solar radiations. Especially for Abu Dhabi, it has the hottest summer over the five locations and nearly over one-sixth of the whole year the dry-bulb temperature is above 35 o C, therefore it has the SOMFY - PHILIPS Light Balancing Whitepaper Page 14
15 highest cooling sensible load. On the other hand, there is no heating demand for Abu Dhabi and Singapore, as indicated in Figure 5-2. It is worth mentioning that the dry-bulb temperature in Abu Dhabi does drop down around o C between November and March (see Figure 4-2), however due to the incoming solar gains and internal gains from lighting, occupancy and equipment, the room air temperatures of the office building model were above the heating set points. It is also noted that overall San Francisco has very low cooling sensible load, heating sensible load and the total energy consumption. This results from its cool and mild weather condition throughout the entire year. In contrast, both Beijing and Paris have a wide temperature variation over the year. Compared with Paris, Beijing has a hotter summer and a colder winter. Therefore, both locations have considerable amount of sensible cooling and heating loads but Beijing consumed more energy than Paris. In addition, as shown in Figure 5-3, the lighting energy consumption was the same for all the five locations as the same manual lighting control was applied. As a result, the artificial lighting was operated in the same manner and the availability of natural light due to different climatic locations was not considered in this case. Overall, it can be seen from Figure 5-4 that the total energy consumption varied from 2500 MWh to 3670 MWh due to the impact of the various climatic conditions. Abu Dhabi and Singapore have become the largest two energy consumers whilst San Francisco was the least energy consumer. Figure 5-1 Cooling loads of baseline models for the five selected climatic locations Figure 5-2 Heating loads of baseline models for the five selected climatic locations SOMFY - PHILIPS Light Balancing Whitepaper Page 15
 Table 5-1 and Table 5-2 summary the room cooling plant sensible load, room heating plant sensible load, lighting energy and the total energy consumption")
 for the five locations with different units.")
16 Figure 5-3 Lighting energy consumptions of the baseline model for the five selected climatic locations Figure 5-4 Total energy consumptions of baseline models for the five selected climatic locations Static manual blind control (scenario 2) Table 5-1 and Table 5-2 summary the room cooling plant sensible load, room heating plant sensible load, lighting energy and the total energy consumption between the baseline model (scenario 1), static manual blind control (scenario 2), dynamic manual blind control (scenario 3), automated time based blind control (scenario 4) and the integrated dynamic shading & lighting control (scenario 7) for the five locations with different units. Table 5-3 presents the corresponding percentage changes between these various blind controls and the baseline model. The static manual control was applied to the internal roller blinds to simulate the simplest operation scenario where occupants rarely operate the blinds during the occupied period; therefore the roller blinds will only be lowered during the occupied period and retracted during the un-occupied period. In order to examine whether the execution of the static manual control is accurate, comparison of solar gains with and without the blind control with reference to the occupancy schedule in a summer day are illustrated in Figure 5-5 based on open plan office 03, as shown in Figure 5-6.As expected, it can be seen that the roller blind has been in position within the occupied period as the solar gains have been reduced accordingly. The impact of the roller blind on the solar gains is clear. This has also been demonstrated in Figure 5-7, which shows the annual solar gains with and without the static manual control based on the open plan office 03. SOMFY - PHILIPS Light Balancing Whitepaper Page 16
17 Table 5-1 Summary of heating, cooling, lighting and total energy consumptions between various shading control strategies Variables Simulation scenarios Abu Dhabi Paris Beijing San Francisco Singapore Room cooling plant sensible load (MWh) Baseline model (scenario1) Static manual control (scenario 2) Dynamic manual control (scenario3) Automated time based control (scenario4) Integrated dynamic shading & lighting (scenario7) Room heating plant sensible load (MWh) Baseline model (scenario1) Static manual control (scenario2) Dynamic manual control (scenario3) Automated time based control (scenario4) Integrated dynamic shading & lighting (scenario7) Lighting energy (MWh) Baseline model (scenario1) Static manual control (scenario2) Dynamic manual control (scenario3) Automated time based control (scenario4) Integrated dynamic shading & lighting (scenario7) Total energy (MWh) Baseline model (scenario1) Static manual control (scenarioo2) Dynamic manual control (scenario3) Automated time based control (scenario4) Integrated dynamic shading & lighting (scenario7) Table 5-2 Summary of heating, cooling, lighting and total energy consumptions between various shading control strategies in kwh/m 2 Variables Simulation scenarios Abu Dhabi Paris Beijing Room cooling plant sensible load (kwh/m²) San Francisco Singapore Baseline model (scenario1) Static manual control (scenario 2) Dynamic manual control (scenario3) Automated time based control (scenario4) Integrated dynamic shading & lighting (scenario7) Room Baseline model (scenario1) SOMFY - PHILIPS Light Balancing Whitepaper Page 17
18 heating plant sensible load (kwh/m²) Lighting energy (kwh/m²) Total energy (kwh/m²) Static manual control (scenario2) Dynamic manual control (scenario3) Automated time based control (scenario4) E Integrated dynamic shading & lighting (scenario7) Baseline model (scenario1) Static manual control (scenario2) Dynamic manual control (scenario3) Automated time based control (scenario4) Integrated dynamic shading & lighting (scenario7) Baseline model (scenario1) Static manual control (scenarioo2) Dynamic manual control (scenario3) Automated time based control (scenario4) Integrated dynamic shading & lighting (scenario7) Table 5-3 Percentage change in cooling, heating load and the total energy consumption Variables Percentage change vs baseline Abu Dhabi Paris BeiJing San Francisco Singapore Room cooling plant sensible load % change_ static manual control(scenario2) % change_ dynamic manual control(scenario3) & change_ automated time based control(scenario4) % change_ Integrated dynamic shading & lighting(scenario7) Room heating plant sensible load % change_ static manual control(scenario2) N/A % change_ dynamic manual control(scenario3) N/A & change_ automated time based control(scenario4) N/A % change_ Integrated dynamic shading & lighting(scenario7) N/A Lighting energy % change_ static manual control(scenario2) % change_ dynamic manual control(scenario3) & change_ automated time based control(scenario4) % change_ Integrated dynamic shading & lighting(scenario7) Total energy consumption % change_ static manual control(scenario2) % change_ dynamic manual control(scenario3) & change_ automated time based control(scenario4) % change_ Integrated dynamic shading & lighting(scenario7) SOMFY - PHILIPS Light Balancing Whitepaper Page 18

19 Figure 5-5 Comparison of solar gains with and without the static manual control with reference to the occupancy schedule Figure 5-6 Location of the open plan office 03 SOMFY - PHILIPS Light Balancing Whitepaper Page 19

20 Figure 5-7 Comparison of annual solar gains between with and without the static manual blind control Figure 5-8 compares the overall system loads and energy performance of the static manual control model with the baseline model and Figure 5-9 further indicates the percentage changes in the room cooling sensible load, room heating sensible load and the total energy consumption between these two models. As shown in both graphs, due to the reduction in solar gains caused by the roller blinds, it has resulted in a decrease in the cooling load, an increase in the heating load and an overall decrease in the total energy consumption for most locations except for Beijing. It can be seen that Singapore achieved the most reduction in the total energy consumption by 2.6%, which was 93 MWh. This is due to its long period of hot weather across over the whole year. As mentioned previously, nearly 75% of the year (6514 hours) the dry-bulb air temperature remains between 25 o C and 30 o C. Although Abu Dhabi has the hottest summer over the five locations, it has not achieved a similar amount of energy savings as Singapore has. This is due to its rather cool weather conditions from November to March in which the dry-bulb air temperature is seen to drop between 12 o C to 25 o C, therefore it is not surprised to see that the reduction in the total energy consumption for Abu Dhabi was 43 MWh. San Francisco has a cool to mild weather condition for the most of the year; hence it has achieved a notable reduction by 1.4% in the total energy consumption. It is noted that the total energy consumption for Paris was only slightly reduced but for Beijing it was slightly increased instead. This is due to the fact that the energy saving from the cooling demand is less than the increased heating energy consumption. Amongst the five locations, Beijing has the coldest winter period with the lowest dry-bulb temperature down to -14 o C while the rest of locations have the lowest air temperatures mainly above 0 o C except for Paris which is down to - 8 o C. In addition, Beijing has a quite long winter period normally from early November to the March. Table 5-4 shows the hours that the ambient dry-bulb temperatures are below -10 o C, -5 o C, 0 o C and 5 o C respectively for the five locations over the whole year. Therefore, it is important to be able to maximise the benefit from the solar gains in winter for climatic locations such as Beijing. It can also be concluded that this type of simple blind control is not the appropriate approach for Beijing location. SOMFY - PHILIPS Light Balancing Whitepaper Page 20


 Singapore Figure 5-8 Comparison")
 SOMFY - PHILIPS")
21 Table 5-4 Hours in range for various ambient dry-bulb temperatures Locations Dry-bulb temperature hours in range < 5 o C < 0 o C < -5 o C < -10 o C Paris SanFrancisco Singapore Beijing Abu Dhabi (a) Abu Dhabi (b) Paris (c) Beijing (d) San Francisco (e) Singapore Figure 5-8 Comparison of the static manual blind control with baseline model (no blind) SOMFY - PHILIPS Light Balancing Whitepaper Page 21
22 Figure 5-9 Percentage changes between static manual blind control model and the baseline model Dynamic manual blind control (scenario 3) In comparison with the static manual control strategy, the dynamic manual blind control is mainly based on the internal illuminance level rather than the occupancy schedule. Once the blind is closed, it remains in the lowered position until the next day upon the first arrival. The control logic can be illustrated by comparing the space cooling sensible load and space air temperature between the baseline model and the dynamic manual control model with reference to the level of the internal illuminance and solar radiations based on open plan office 06 (located on the ground floor and west side of the building), as shown in Figure It can be seen that due to the different air temperatures in the very early morning between the two models, the required cooling loads were different in the first 2h pre-cooling period. The cooling loads then became similar after 07:00 am. However, the cooling load of the dynamic manual control model started gradually reducing when the internal illuminance reached the manual control threshold of 5000lux. After 19:00 the plant system was turned off, therefore the cooling load was down to zero. However, the blind remained closed until the next morning at 07:00am. As shown in the figure, there was still a certain amount of solar radiations available after 19:00. The blind position therefore was able to further reduce the solar gains in the room, which led to a slightly lower room air temperature during the whole night compared to the temperatures without any shading device in the baseline model. SOMFY - PHILIPS Light Balancing Whitepaper Page 22
23 Figure 5-10 Comparison of space cooling sensible load and air temperature between dynamic manual control model and baseline model based on open plan office 06 Figure 5-11 shows results of annual cooling and heating loads as well as the total energy consumption of the baseline model, static manual control model and dynamic manual control model. Figure 5-12 displays the percentage changes in the cooling load, heating load and the total energy consumption when comparing the dynamic manual control with the baseline (no blind control) and the static manual control respectively. Both figures have clearly indicated that since employing the dynamic manual blind control, the cooling load has reduced compared to the baseline; however the reduction was less than that achieved by the static manual control due to the amount of blocked solar gains. Similarly, the heating load has been increased; however the increase was less than that caused by the static manual control except for Abu Dhabi. This results from less number of hours that the blind was in closed position during the occupied period for the dynamic manual control. Table 5-5 sets up an example based on open plan office 04 for both cooling and heating modes to demonstrate how the blind was positioned in both static and dynamic manual control strategies. It can be seen that in the cooling mode the blind was closed for 13 hours from 07:00 to 19:00 during the occupied period in the static manual control scenario for BeiJing location. For the dynamic manual control the bind was manually closed at 11:00am when the internal illuminance was above 5000lux and remained this position till the next day, therefore the total closing hours were 13 hours during the occupied period; however there were only 9 hours in the occupied period which led to a lower cooling load compared to the static manual control. Likewise, in the heating mode the blind was closed for 13 hours during the occupied period for the static manual control and in total 15 hours for the dynamic manual blind control but only 4 hours during the occupied period which allows a certain amount of solar gains incoming to the space and thereafter led to a less increase in the heating load. It is worth mentioning that the heating was supplied on continuously with two different set points and the total hours of the blind being closed were overall longer in the dynamic manual blind control scenario. Moreover, Abu Dhabi has the highest global solar radiation amongst the five climatic locations and tends to have solar radiations out of the occupied period. Consequently there were more solar gains being blocked by the dynamic manual blind control than that by the static manual blind control for Adu Dhabi, which therefore led to a higher heating sensible load for the dynamic manual control. Overall, the total energy consumption was reduced for Abu Dhabi, Singapore and San Francisco but slightly increased for Beijing when comparing to the baseline model. As mentioned previously, SOMFY - PHILIPS Light Balancing Whitepaper Page 23

 Abu Dhabi (b) Paris (c)")


24 this is due to the trade-off between the reduced cooling load and the increased heating load. (a) Abu Dhabi (b) Paris (c) Beijing (d) San Francisco (e) Singapore Figure 5-11 Comparison of the dynamic manual blind control with both no blind control (baseline) and static manual control SOMFY - PHILIPS Light Balancing Whitepaper Page 24
25 Figure 5-12 Percentage changes between dynamic manual control and baseline model and between dynamic manual control and static manual control Table 5-5 Comparison of blind positions for both cooling and heating modes based on open plan office 04 for Beijing location Cooling mode (24th May) Heating mode (29th Jan.) Time Static manual control. Blind position Dynamic manual control Internal illuminance (lux) Static manual control. Blind position Dynamic manual control Internal illuminance (lux) 00: : : : : : : : : : : : : : : : : : SOMFY - PHILIPS Light Balancing Whitepaper Page 25


26 18: : : : : : Automated time based blind control (scenario 4) The automated time based blind control was designed mainly based on the availability of the external illuminance, occupancy period and space conditioning mode. Figure 5-13 illustrates the calculated annual hourly external illuminance values of the office building model for the five selected climatic locations. It can be seen that for Abu Dhabi, Singapore and San Francisco, the external illuminance levels were well above the blind control threshold which is lux whilst for Paris the external illuminance values fell below the threshold mainly in the winter season and for Beijing it exceeded the control threshold for the most of the time. Hence, it demonstrates that the setting of the blind control threshold was reasonable for the studied locations. In addition, the variation pattern of the calculated external illuminance for each location correctly reflected the associated local global solar radiations. (a) Abu Dhabi (b) Paris SOMFY - PHILIPS Light Balancing Whitepaper Page 26

27 (c) Beijing (d) San Francisco (e) Singapore Figure 5-13 External illuminance for the five climatic locations Figure 5-14 compares the cooling load, heating load and the total energy consumption between all the investigated shading control strategies for the five climatic locations. Figure 5-15 shows the corresponding percentage changes between the time based switching blind control and the baseline scenario (no shading). As indicated in the two figures, it can be seen that for all the locations the cooling loads were reduced in a range from 7.7% to 24% compared to the baseline model. Given the absolute values, Abu Dhabi and Singapore achieved the most cooling load reductions which are 191 MWh and 185 MWh in turn whilst Paris and Beijing had the least cooling load reductions of 75 MWh and 96 MWh respectively. Due to abundant solar radiations, San Francisco managed a reduction of 112 MWh. Meanwhile the heating loads of the office building model were slightly increased by MWh, 27.3 MWh, 45.8 MWh and 19.0 MWh individually SOMFY - PHILIPS Light Balancing Whitepaper Page 27


 Abu Dhabi (b) Paris (c) Beijing (d) San Francisco (e)")

28 for Abu Dhabi, Paris, Beijing and San Francisco, which resulted from the reduced solar gains by lowering the blinds. As pointed out earlier, Beijing has the coldest and longest winter period compared with other locations and Abu Dhabi has the hottest summer period but a wide seasonal temperature variation, therefore they received the most and the least heating load increase respectively. (a) Abu Dhabi (b) Paris (c) Beijing (d) San Francisco (e) Singapore Figure 5-14 Comparison of cooling load, heating load and the total energy consumption between all the blind control strategies SOMFY - PHILIPS Light Balancing Whitepaper Page 28
29 Figure 5-15 Percentage changes between baseline and automated time based control models Overall, the total energy consumption for all the five climatic locations was reduced when comparing to the baseline model. As expected, Abu Dhabi and Singapore succeeded the most energy reductions by 114 MWh and 111 MWh respectively whilst Beijing only received a slight energy reduction of 1 MWh. This implies that the impact of the shading control on the energy consumption is climate dependent. It has more influence on warmer climates with less heating demand. It is also noted that amongst all the investigated shading control strategies, the automated time basedcontrol was the only attempt which successfully achieved energy savings across all the selected climatic locations. It demonstrates that this type of automated blind control does consider different control strategies in terms of exploiting usage of solar gains in different seasons, which is minimising the solar gains in the cooling mode and maximising the solar gains in the heating mode. In addition, in order to maximise the benefit from employing the automated blind control for a climate with a hot summer and a cold winter such as Beijing, it suggests designing a further fine-tuned control strategy to tailor the local weather conditions, such as changes in the threshold of the external illuminance level or the definition of the heating and cooling modes (set point) Integrated dynamic shading & lighting control (scenario7) Figures 5-16 to 5-19 compare the cooling load, heating load and the total energy consumption respectively between all the investigated shading control strategies as well as the integrated dynamic shading and lighting control strategy. As shown in these graphs, the integrated dynamic shading & lighting control strategy was able to reduce more cooling load and the total energy consumption compared with all the other shading control strategies. This is simply due to the additional deployment of the occupancy based switching & daylight dimming control, which led to a reduction in the annual lighting energy consumption up to nearly 109 MWh, as shown in Figure The reduced lighting energy prompted an increase in the heating load, however due to the trade-off between the heating, cooling and lighting energy uses; the total energy consumption was actually reduced over the five climatic locations from 73 MWh to 278 Mwh. So far, the study has demonstrated that the integrated approach offers an energy efficient solution. SOMFY - PHILIPS Light Balancing Whitepaper Page 29


30 Figure 5-16 Comparison of cooling load between all the shading control scenarios Figure 5-17 Comparison of heating load between all the shading control scenarios Figure 5-18 Comparison of lighting between all the shading control scenarios SOMFY - PHILIPS Light Balancing Whitepaper Page 30
 Figures 5-20 to 5-23 compare the cooling load, heating load, lighting energy and the total energy consumption respectively between all the")
31 Figure 5-19 Comparison of the total energy consumption between all the shading control scenarios 5.1 Lighting control analysis Occupancy based switching lighting control (scenario 5) Figures 5-20 to 5-23 compare the cooling load, heating load, lighting energy and the total energy consumption respectively between all the investigated lighting control strategies which are the manual lighting control (baseline model), occupancy based switching control and occupancy based switching & daylight dimming control for the five climatic locations. Table 5-6 and Table 5-7 summary values of the cooling load, heating load, lighting energy and the total energy consumption of these investigated lighting controls with different units and Table 5-8 presents the corresponding percentage changes for the two types of occupancy based switching controls against the manual lighting control. Figure 5-20 Comparison of the cooling load between all the lighting control scenarios SOMFY - PHILIPS Light Balancing Whitepaper Page 31


32 Figure 5-21Comparison of the heating load between all the lighting control scenarios Figure 5-22 Comparison of the lighting energy between all the lighting control scenarios Figure 5-23 Comparison of the total energy consumption between all the lighting control scenarios SOMFY - PHILIPS Light Balancing Whitepaper Page 32
33 Table 5-6 Summary of heating, cooling, lighting and total energy consumptions between various lighting control strategies Variables Simulation scenarios Abu Dhabi Paris Beijing San Francisco Singapore Cooling load (MWh) Manual lighting control (scenario Occupancy based switching (scenario5) Occupancy based switching & daylight dimming (scenario 6) Heating load (MWh) Manual lighting control (scenario Occupancy based switching (scenario5) Occupancy based switching & daylight dimming (scenario 6) Lighting energy (MWh) Manual lighting control (scenario Occupancy based switching (scenario5) Occupancy based switching & daylight dimming (scenario 6) Total energy (MWh) Manual lighting control (scenario Occupancy based switching (scenario5) Occupancy based switching & daylight dimming (scenario 6) Table 5-7 Summary of heating, cooling, lighting and total energy consumption between various lighting control strategies in kwh/m² Variables Cooling load (kwh/m²) Heating load (kwh/m²) Lighting energy (kwh/m²) Total energy (kwh/m²) Simulation scenarios Abu Dhabi Paris Beijing San Francisco Singapore Manual lighting control (scenario Occupancy based switching (scenario5) Occupancy based switching & daylight dimming (scenario 6) Manual lighting control (scenario1) Occupancy based switching (scenario5) Occupancy based switching & daylight dimming (scenario 6) Manual lighting control (scenario Occupancy based switching (scenario5) Occupancy based switching & daylight dimming (scenario 6) Manual lighting control (scenario Occupancy based switching (scenario5) Occupancy based switching & daylight dimming (scenario 6) SOMFY - PHILIPS Light Balancing Whitepaper Page 33
34 Table 5-8 Percentage change in cooling, heating load, lighting energy and the total energy consumption Variables Percentage change vs baseline Abu Dhabi Paris BeiJing San Francisco Singapore Cooling load % change_ Occupancy based switching % change_ Occupancy based switching & daylight dimming Heating load % change_ Occupancy based switching % change_ Occupancy based switching & daylight dimming Lighting energy Total energy consumption % change_ Occupancy based switching % change_ Occupancy based switching & daylight dimming % change_ Occupancy based switching % change_ Occupancy based switching & daylight dimming Figure 5-24 illustrates percentage changes in cooling load, heating load, lighting energy and the total energy consumption respectively over the five locations when comparing the occupancy based switching model against the baseline model. It is interesting to see that the cooling load, lighting energy and the total energy consumption have been increased whilst the heating load has been decreased, which does not fit into the normal expectation. This is solely due to the settings of the manual lighting control and the occupancy based switching control adopted by this study. As explained previously, an optimistic assumption of the manual lighting control has been employed to illustrate a scenario which is not extremely energy intensive. The manual lighting control indicates that all lights are on at 90% during the occupied period and at 5% during the un-occupied period for weekdays and lights are all off during weekends. For the occupancy based switching control, during the weekdays lights are automatically full on when occupants are present for perimeter zones with a 15min time-out and off otherwise. For core zones the lights are turned full on during the occupied period and turned to 10% during the un-occupied period. During the weekends lights are also off. Furthermore, the core zones account for 49% of the building model which is a quite considerably large area. Hence, the occupancy based switching control model actually has consumed a higher lighting gains than that of the manual lighting control model, which leads to a higher cooling load and a lower heating load. Based on the trade-off between the cooling, heating and lighting energy consumptions, the total energy consumption was therefore increased between 0.15% and 1.29% for the five locations. SOMFY - PHILIPS Light Balancing Whitepaper Page 34

35 Figure 5-24Percentage changes between occupancy based switching model and baseline model Occupancy based switching & daylight dimming control (scenario6) Percentage changes in the cooling load, heating load, lighting energy and the total energy consumption in comparison of the occupancy based switching control against the baseline manual lighting control are shown in Figure It can be seen that the total energy consumption has been decreased from 2.7% up to 4.8% and the cooling load has also been reduced between 3.6% and 13.0% over the five climatic locations. This is due to the reductions in the lighting energy consumption since introducing the daylight dimming strategy. This can also be clearly demonstrated in Figure 5-26, which compares the occupancy based switching & daylight dimming control with the occupancy based switching control in terms of changes in system loads and energy consumptions. As indicated in both figures, the reduction in lighting gains leads to a decrease in the cooling load and an increase in the heating load. Due to the hot climatic conditions in both Abu Dhabi and Singapore, there is no heating requirement during the whole year; therefore the percentage change in the heating load is zero. Figure 5-25 Percentage changes between occupancy based switching & daylight dimming model and the baseline model SOMFY - PHILIPS Light Balancing Whitepaper Page 35
36 Figure 5-26 Percentage changes between occupancy based switching & daylight dimming model and the occupancy based switching model To take a closer look at the dimming control, the lights are linearly dimmable from 0% to 100% based on the 650 lux set point of the internal illuminance. Figure 5-27 shows the availability of the internal illuminance and lighting gains of the open plan office 03 in a summer day when the dimming is on and off respectively for Abu Dhabi. As shown, the red colour line is the internal illuminance value of open plan office 03 and the horizontal black dot line is the dimming threshold line at 650 lux level. It can be seen that during the period where the internal illuminance value was dropped below the dimming threshold line as marked in the light blue block, the lighting gain in the navy blue colour started rising up from 0 kw. The yellow colour line is the lighting gain for the occupancy based switching control without dimming control. The difference between the yellow line and the red line is the impact of introducing the dimming control on the lighting gains. This has resulted in 87.37% reduction in the annual lighting gains, as shown in Figure Figure 5-27 Comparison of daily lighting gains with and without the dimming control with the internal illuminance SOMFY - PHILIPS Light Balancing Whitepaper Page 36


37 Figure 5-28 Comparison of annual internal gains between with and without the dimming control 6. Conclusions A range of shading control strategies and lighting control strategies were investigated in this study, which included manual lighting control, occupancy based switching control, occupancy based switching & daylight dimming control, static manual blind control, dynamic manual blind control, automated timed based blind control and the integrated dynamic shading & lighting control. The impact of these control strategies on the building energy performance was quantified individually based on a seven-storey office building model using advanced dynamic simulation tool IES <VE>. Based on the simulation results it has indicated that by introducing shading devices it generally reduces the incoming solar gains of the perimeter spaces, which leads to a decrease in the cooling load and an increase in the heating load. Whether the total energy consumption can be reduced or not it mainly depends on the trade-off between the reduced cooling load and the increased heating load. In this sense, the type of shading control and the local climatic condition plays a key role. For climatic locations such as Singapore, it experiences an extensive cooling period over the year and has no heating requirement based on the office building model, therefore it is sensible to try to reduce the solar gains for the whole year. It has been shown that the total energy consumption was reduced by 2.6% by simply applying the static manual blind control which manually lowers the blinds during the occupied period. In contrast, for locations such as Beijing which has a hot summer and a cold winter, the blind control strategy needs to consider gaining the benefit from the solar gains for winter season. Hence, by simply applying the static manual blind control to Beijing it increased the total energy consumption. SOMFY - PHILIPS Light Balancing Whitepaper Page 37
38 It is also noted that the automated time based blind control was the only attempt which successfully achieved energy savings across all the selected climatic locations and it has more impact on warmer climates with less heating demand. As expected, Abu Dhabi and Singapore achieved the most energy reductions by 6.94 kwh/m 2 and 6.76 kwh/m 2 respectively whilst Beijing only received a slight energy reduction of kwh/m 2. As a result, it can be concluded that the time based switching control is the most energy efficient approach in all the examined shading control strategies and it does consider minimising the solar gains in the cooling mode and maximising the solar gains in the heating mode. To be able to maximise the benefit from employing the automated blind control for a climate with a hot summer and a cold winter such as Beijing, it suggests designing a further fine-tuned control strategy to tailor the local weather conditions, such as changes in the threshold of the external illuminance level or the definition of the heating and cooling modes (set point). It is worth mentioning that the blind fabrics which were used for the examined shading controls were chosen to represent the average one of the current market with the consideration of visual comfort. This implies a potential to obtaining larger energy savings by swopping to a blind fabric with better Sthermal performance. The simulation results have also shown that by applying the lighting control strategies it would generally reduce the lighting energy and the cooling load but increase the heating load, therefore whether there would be any energy saving achieved it all depends on the trade-off between the cooling, heating and lighting energy consumptions. It is interesting to note that the total energy consumption was increased up to 1.3% for all the five climatic locations when introducing the occupancy based switching control. This is due to the settings of the manual lighting control adopted in this study. As well known, the manual lighting control is the most common practice and also is the most un-predictive operation as it is largely determined by the individual preference and by whether a space is actually occupied or un-occupied. Over the past it has been commonly estimated with a large margin to represent the worst scenario. However the study has taken an optimistic approach to illustrate a scenario of the manual lighting control which is not extremely energy intensive. As a result, the occupancy based switching control consumed more lighting energy than the manual lighting control. As expected, the occupancy based switching & daylight dimming control has proved to be the most efficient approach, which reduced the cooling load in a range between 3.6% and 13% and the total energy consumption from 2.7 % to nearly 5.0%. Once again, the climatic locations affect the extent of the energy reduction that can be achieved. Finally, the main focus of the paper was attempted to understand the Somfy - Philips light balancing system and to examine its potential impact on energy savings. This has been undertaken with a certain assumptions and simplifications and represented as the integrated dynamic shading and lighting control in this case study. Note that the integrated dynamic shading and lighting control was modelled as a combination of two separate controls, namely automated time-based blind control and occupancy based switching & daylight dimming control. Therefore, it requires a further research to be conducted to achieve the real integrated operation. In this context, the integrated dynamic shading and lighting control model still achieved up to 8% reduction in the total energy consumption in comparison with the baseline model in which there was no blind installed and the lighting was simply manually operated. Note that the predicted energy reductions were only indications based on the setup of the case study and the energy saving can be genuinely increased if a better blind fabric is chosen, a better floor layout is designed or different control thresholds are selected. SOMFY - PHILIPS Light Balancing Whitepaper Page 38
39 References Ochoa,C.E., Capeluto, I.G., Advice tool for early design stages of intelligent facades based on energy and visual comfort approach. Energy and Buidlings 41 (5), Lee, E.S., DiBartolomeo, D.L., Selkowitz, S.E., Thermal and daylighting performance of an automated venetian blind and lighting system in a full-scale private office, Energy and Buildings 29 (1), Athanassios Tzempelikos and Andreas K. Athienitis, The impact of shading design and control on building cooling and lighting demand, Solar Energy 81 (2007) Johnson, R., Sullivan, R., Selkowitz, S., Conner, C., Arasteh, D., Glazing energy performance and design optimization with daylighting, Energy and Buildings 6, Tzempelikos, A. and Athienitis, A.K Simulation for façade options and impact on HVAC system design, In: Proceedings of IBPSA 2003, Eindhoven, Netherlands, pp Energy Performance of Buildings Directive (EPBD), Directive 2010/31/EU Bloem, H., Atanasiu, B., Dynamic analysis methodologies applied to energy management in residential buildings. In: EEDAL 09 Conference June, Berlin, Germany. Christoph F. Reinhart, Lightswitch-2012: a model for manual and automated control of electric lighting and blinds, Solar Energy 77 (2004) Rubin, A.I., Colind, B.L., Tibott, R.L., Window blinds as a potential energy saver- a case study. NSB Buidling Science Series 112, Natioanl Bureau of Standards, Washington. IESNA, The lighting Handbook, ninth ed., Illuminating Engineering Society of North America, New York, Marie-Claude Dubois, Ake Blomsterberg, Energy saving potential and strategies for electric lighting in futurenorth European, low energy office buildings: a literature review, Energy and Buildings 43 (2011) Somfy website, Appendix A: Specification of internal blinds Table A-1 Specifications of interior roller blind and interior venetian blind Interior Roller Blind Interior Venetian Blind Thickness (m) Thermal conductivity (W/m K) Shading coefficient Short-wave radiant fraction SOMFY - PHILIPS Light Balancing Whitepaper Page 39
40 Appendix B: Input data of the office building model (a) Plan of ground and 1 st floors (b) Plan of 2 nd and 3 rd floors SOMFY - PHILIPS Light Balancing Whitepaper Page 40
41 (c) Plan of 4 th, 5 th and 6 th floors Figure 34 Plans of the office building model Table B-1 Description of constructions used in case study model Construction Description U-Value (W/m²K) External wall 100m external brick mm Dense EPS Slab insulation 100m Concrete block 15mm Gypsum plastering Internal partition 13mm Plaster mm brick 13mm plaster Ground Floor 250mm external brick mm cast concrete slab 63.5mm Dense EPS Slab insulation 25mm Chipboard 10mm Synthetic carpet Internal Floor/ceiling 75mm screed mm cast concrete (dense) Internal ceiling finish 12.5mm Gypsum/plaster board 3.59 Roof 10mm Stone Chippings mm Felt/Bitumen layers 150mm cast concrete 150mm Glass-Fibre Quilt 100mm cavity 10mm ceiling tiles External Glazing 6mm Pilkington (uncoated) 12mm cavity 6mm Pilkington (uncoated) 1.78 (g-value(en410):0.641) (visible light transmittance: 0.76) Spandrel Panel 20mm Plywood board mm mineral fibre slab 100mm concrete block 20mm Gypsum plasterboard External door 40mm wood (Pine) 2.19 SOMFY - PHILIPS Light Balancing Whitepaper Page 41
42 Space type Table B-2 Internal gains of the office building model Lighting gain (w/m²) Max sensible gain (w/person) Occupancy gain Max latent gain (w/person) Occupancy Density (m²/person) Equipment gain (w/m²) Cafe Cellular office Changing room Circulation area Common room Conference room Gym Kitchen Open plan office Plant Storage Toilet Waiting area Table B-3 HVAC systems in the office building model Spaces HVAC system Circulation LTHW heating & natural ventilation Open plan office Fan Coil Unit Waiting Fan Coil Unit Toilet LTHW heating & mechanical ventilation extract mode Cellular Office Fan Coil Unit Meeting room Fan Coil Unit Cafe Fan Coil Unit Kitchen LTHW heating & mechanical ventilation Gymnasium Fan Coil Unit Changing room Storage LTHW heating & mechanical ventilation extract mode LTHW heating & mechanical ventilation Table B-4 Heating and cooling set points and ventilation rates of the HVAC systems Heating set point ( o C) Cooling set point ( o C) Ventilation Weekday Weekday rate (Nat. or Occupied Un-occupied Mach.) period period Weekend Weekend (l/s/person) Spaces 2h (pre cooling)+ occupied period Unoccupied Circulation N/A N/A N/A 10 Open plan office N/A N/A 10 Waiting N/A N/A 10 Toilet N/A N/A N/A 12 Cellular Office N/A N/A 10 Meeting room N/A N/A 10 Cafe N/A N/A 10 Kitchen N/A N/A N/A 25 Gymnasium N/A N/A 30 Changing room N/A N/A N/A 10 Storage N/A N/A N/A 10 SOMFY - PHILIPS Light Balancing Whitepaper Page 42


43 Café Occupant Equipment Lighting weekday weekend weekday weekend weekday weekend Cellular office/open plan office/ Conference & meeting rooms/common rooms Occupant Equipment Lighting weekday weekend weekday weekend weekday weekend Changing room Occupant Equipment Lighting weekday weekend weekday weekend weekday weekend SOMFY - PHILIPS Light Balancing Whitepaper Page 43
Design and retrofitting of a hybrid building in Athens
 International Conference Passive and Low Energy Cooling 597 Design and retrofitting of a hybrid building in Athens A. Gavalas Gavalas Architects, Athens ABSTRACT This paper s aim is to present a building
SKYLIGHT DESIGN PERFORMANCE EVALUATION METHOD DEVELOPMENT WITH THERMAL AND DAYLIGHT SIMULATION
 SKYLIGHT DESIGN PERFORMANCE EVALUATION METHOD DEVELOPMENT WITH THERMAL AND DAYLIGHT SIMULATION Xianou Li, Frederick Wong, and Yihan Li Arup International Consultants (Shanghai) Co Ltd ABSTRACT This paper
additional cooling energy consumption. Because the thermal resistance of windows has always been a weak point, even with vacuum glass or low-e glass,
 Simulation Study of Automated Blinds Control Strategy for Minimizing Cooling and Lighting Energy Consumptions L. Xiao 1, F. Wang 2,*, Y. Gao 2, T. Gong 2, Y. Di 2, Y. Qian 2, and X. Luo 2 1 School of Mechanical
Modelling Analysis of Thermal Performance of Internal Shading Devices for a Commercial Atrium Building in Tropical Climates
 Modelling Analysis of Thermal Performance of Internal Shading Devices for a Commercial Atrium Building in Tropical Climates Kittitach Pichatwatana, and Fan Wang Abstract This paper examines the TAS computer
The effect of shading design and control on building cooling demand
 International Conference Passive and Low Energy Cooling 953 for the Built Environment, May 25, Santorini, Greece The effect of shading design and control on building cooling demand A. Tzempelikos and A.K.
BUILDING SIMULATION AS AN ASSISTING TOOL IN DESIGNING AN ENERGY EFFICIENT BUILDING: A CASE STUDY
 Eleventh International IBPSA Conference Glasgow, Scotland July 27-30, 2009 BUILDING SIMULATION AS AN ASSISTING TOOL IN DESIGNING AN ENERGY EFFICIENT BUILDING: A CASE STUDY Michael Pollock, Ya Roderick,
The energy benefits of View Dynamic Glass
 Workplace demonstration Energy monitoring over a period of 12 months resulted in the commercial office room installed with View Dynamic Glass saving 39 percent of the total energy consumed compared to
SAGEGLASS VARIABLE TINTED GLAZING INPUT SHEET FOR DIAL+ SOFTWARE
 SAGEGLASS VARIABLE TINTED GLAZING INPUT SHEET FOR DIAL+ SOFTWARE V1 dated 21/04/2017 The following procedure describes data input and handling for SageGlass in DIAL+ natural lighting and thermal dynamic
ADVANCED FAÇADES AND HVAC SYSTEMS: PRELIMINARY RESULTS OF FULL-SCALE MONITORING
 ADVANCED FAÇADES AND HVAC SYSTEMS: PRELIMINARY RESULTS OF FULL-SCALE MONITORING M. Kragh, M. Colombari and M. Zobec Permasteelisa Group, Research & Engineering, 31020 San Vendemiano (TV), Italy www.permasteelisa.com,
The Elithis Tower is an experimental and demonstration. Elithis Tower in Dijon, France. nzeb case studies
 COM Elithis Tower in Dijon, France Elithis Tower, located in Dijon, France, provides strong evidence that net zero energy office buildings are achievable in near future. The building, which was designed
An enhancement of the daylighting from side-window using two-section venetian blind
 An enhancement of the daylighting from side-window using two-section venetian blind Vichuda Mettanant 1,2, Pipat Chaiwiwatworakul 1,2,*, Pattana Rakkwamsuk 3 1 The Joint Graduate School of Energy and Environment,
Monitoring of Advanced Facades and Environmental Systems
 Paper presented at The whole-life performance of facades University of Bath, CWCT, 18/19 April 2001, Bath, UK Monitoring of Advanced Facades and Environmental Systems Mikkel Kragh, PhD Permasteelisa Architectural
Energy Saving Benefits of Daylighting Combined with Horizontal Exterior Overhangs in Hot-and-Humid Regions
 Energy Saving Benefits of Daylighting Combined with Horizontal Exterior Overhangs in Hot-and-Humid Regions Speakers: Huang, Kuo-Tsang 1 ; Fu, Chun 2 1 Department of Bioenvironmental Systems Engineering,
COMPARATIVE EVALUATION OF SIDE-DAYLIGHTING STRATEGIES
 COMPARATIVE EVALUATION OF SIDE-DAYLIGHTING STRATEGIES Michael J. Holtz, FAIA LightLouver LLC 685 S. Arthur Avenue Louisville, Colorado 80027 mholtz@lightlouver.com Zack Rogers, PE, IESNA LightLouver LLC
Comparison of Energy and Visual Comfort Performance of Independent and Integrated Lighting and Daylight Controls Strategies
 Comparison of Energy and Visual Comfort Performance of Independent and Integrated Lighting and Daylight Controls Strategies Eric Shen and Maulin Patel, Philips Research North America Jia Hu, University
171: An urban office designed for the southern Brazilian climate
 171: An urban office designed for the southern Brazilian climate Marianne Costella Elemento 5 Bioclimatic Architecture, Brazil marianne@elemento5.com Abstract The climate in southern Brazil is characterised
Role of daylight in the existent and future French building regulations
 Role of daylight in the existent and future French building regulations Christophe Martinsons Lighting Electromagnetism and Electricty Division christophe.martinsons@cstb.fr 13 May 2009 3rd VELUX Daylight
SIMULATION-ASSISTED DAYLIGHT PERFORMANCE ANALYSIS IN A HIGH-RISE OFFICE BUILDING IN SINGAPORE
 SIMULATION-ASSISTED DAYLIGHT PERFORMANCE ANALYSIS IN A HIGH-RISE OFFICE BUILDING IN SINGAPORE Szu-cheng Chien, Research Fellow, scchien@ntu.edu.sg Berkeley Education Alliance for Research in Singapore
SUMMER THERMAL COMFORT IN TYPICAL FRENCH RESIDENTIAL BUILDINGS: IMPACT ASSESSMENT OF BUILDING ENVELOPE INSULATION ENHANCEMENT
 13th Conference of International Building Simulation Association, Chambéry, France, August 26-28 SUMMER THERMAL COMFORT IN TYPICAL FRENCH RESIDENTIAL BUILDINGS: IMPACT ASSESSMENT OF BUILDING ENVELOPE INSULATION
The Effects of Light Shelf on Climate-based Daylight performance in Tropics- A Case Study
 The Effects of Light Shelf on Climate-based Daylight performance in Tropics- A Case Study Speakers: Chien, S.-C. 1 ; Tseng, K. J. 2 1 Berkeley Education Alliance for Research in Singapore (BEARS), Singapore
Great Ocean Rd Ice Creamery
 Great Ocean Rd Ice Creamery BCA Section J - JV3 Compliance Report Revision: 01 Job No: 2171 Date: 7 July 2015 ADP Consulting Pty Ltd Level 10, 10 Queens Rd, Melbourne Vic 3004 www.adpconsulting.com.au
Assessing the energy performance of modern glass facade systems
 Assessing the energy performance of modern glass facade systems Abdelsalam Aldawoud * Architectural Engineering Department, University of Sharjah Sharjah, United Arab Emirates Abstract. The design and
IESVE Compliance for ASHRAE IES Virtual Environment
 IESVE Compliance for ASHRAE 90.1 - IES Virtual Environment July 2018 IES Virtual Environment and Compliance with ASHRAE 90.1-2004, 2007, 2010 & 2013; Appendix G, Performance Rating Method and Chapter 11,
Analysis of different shading strategies on energy demand and operating cost of office building
 Analysis of different shading strategies on energy demand and operating cost of office building Kwiatkowski, J 1,2 ; Rucińska, J 1,2 ; Panek, A 1,2 1 Warsaw University of Technology, Faculty of Environmental
An Experimental Study for the Evaluation of the Environmental Performance by the Application of the Automated Venetian Blind
 An Experimental Study for the Evaluation of the Environmental Performance by the Application of the Automated Venetian Blind Ji-Hyun Kim 1, Kyoung-Wn Yang 1, Young-Joon Park 1, Kyung-Hee Lee 2, Myoung-Souk
COOLING LOADS AND OCCUPANT COMFORT IN HIGHLY GLAZED BUILDINGS AND THE EFFECTIVE EVALUATION OF WINDOW RETROFITS
 COOLING LOADS AND OCCUPANT COMFORT IN HIGHLY GLAZED BUILDINGS AND THE EFFECTIVE EVALUATION OF WINDOW RETROFITS S. Armstrong ABSTRACT Urban centres contain thousands of mid to late 20th century commercial,
Solar Shading System Based on Daylight Directing Glass Lamellas
 Solar Shading System Based on Daylight Directing Glass Lamellas Jacob B. Laustsen, Assistant Research Professor, Department of Civil Engineering, Technical University of Denmark; jbl@byg.dtu.dk Inês D.
BRE Energy Efficient Office of the Future
 BRE Energy of the Future presentation (1...)! The building was designed by Architects Fielden Clegg Design.! The building has three storeys in two blocks connected by an atrium at the west wall. The main
EE2E045 A Calculation Method on the Energy Demand of Urban Districts
 EE2E045 A Calculation Method on the Energy Demand of Urban Districts DILAY KESTEN 1, AYSEGUL TERECI 2, URSULA EICKER 3 1 Department of Architecture, İstanbul Technical University, İstanbul Turkey & Centre
ENERGETIC MONITORING AND OPTIMIZATION OF A SOLAR HOUSE
 Bulletin of the Transilvania University of Braşov Vol. 3 (52) - 2010 Series I: Engineering Sciences ENERGETIC MONITORING AND OPTIMIZATION OF A SOLAR HOUSE M. MOLDOVAN 1 I. VIŞA 1 A. DUŢĂ 1 Abstract: Into
TREES Training for Renovated Energy Efficient Social housing. Section 1 Techniques 1.2 Replacement of glazing
 TREES Training for Renovated Energy Efficient Social housing Intelligent Energy -Europe programme, contract n EIE/05/110/SI2.420021 Section 1 Techniques 1.2 Replacement of glazing Bruno PEUPORTIER ARMINES
THE ENERGY EFFECTS OF CONTROLLING SOLAR SHADING
 somfy.com THE ENERGY EFFECTS OF CONTROLLING SOLAR SHADING Dr Paul Littlefair - Environmental Consultancy Centre - BRE Jose Ortiz and Claire Das Bhaumik - Sustainable Energy Centre - BRE SOMFY SAS, capital
BUILDING DESIGN AND THERMAL INERTIA: WHEN, WHY, WHERE
 Int. Journal for Housing Science, Vol.34, No.4 pp. 221-231, 2010 Published in the United States BUILDING DESIGN AND THERMAL INERTIA: WHEN, WHY, WHERE R. Albatici, S. Penasa Department of Civil and Environmental
Young Cities Research Briefs 07 Architectural Energy Efficiency
 Young Cities Research Briefs 7 Architectural Energy Efficiency Farshad Nasrollahi 1 Introduction Decreasing the energy demand of buildings by applying cost-intensive measures (such as the addition of insulation
STEADY STATE AND DYNAMIC THERMOPHYSICAL PARAMETERS OF TRANSPARENT BUILDING COMPONENTS
 STEADY STATE AND DYNAMIC THERMOPHYSICAL PARAMETERS OF TRANSPARENT BUILDING COMPONENTS 1. ABSTRACT In modern architecture the buildings are often designed with large glass facades or windows. Due to these
CONTROL STRATEGIES AND ENERGY SAVING POTENTIALS FOR VARIABLE TRANSMITTANCE WINDOWS VERSUS STATIC WINDOWS
 CONTROL STRATEGIES AND ENERGY SAVING POTENTIALS FOR VARIABLE TRANSMITTANCE WINDOWS VERSUS STATIC WINDOWS J. Karlsson, B. Karlsson * and A. Roos Department of Materials Science, The Ångström laboratory,
Buildings with large glazed surfaces: optimization of solar control strategies in relation to the building's thermal inertia
 Buildings with large glazed surfaces: optimization of solar control strategies in relation to the building's thermal inertia Antonio Carbonari 1 1 Department of Design and Planning in Complex Environments,
Student Modeling Competition
 Student Modeling Competition Design and Simulation of a Near-zero Energy Building Building Simulation 2013 Apoorv Goyal agoyal@gsd.harvard.edu Arta Yazdanseta ayazdans@gsd.harvard.edu Keojin Jin kjin@gsd.harvard.edu
Ventilation Approaches for Shopping Malls An Examination of Natural and Hybrid Strategies
 2012. ASHRAE. Published in ASHRAE Transactions, Volume 118, Part 1. For personal use only. Additional reproduction, distribution, or transmission in either print or digital form is not permitted without
Reducing energy demand in non-domestic buildings: integrating smart facades, ventilation, and surface heating and cooling
 Reducing energy demand in non-domestic buildings: integrating smart facades, ventilation, and surface heating and cooling Phil Jones, Shan Shan Hou and XiaoJun Li Welsh School of Architecture, Cardiff
Thermal Thermal Applications Category Version 6.4. Integrated Environmental Solutions
 Thermal Thermal Applications Category Version 6.4 Integrated Environmental Solutions Contents 1. What is the Thermal Applications Category?... 4 1.1. Compliance View... 4 1.2. Apache
Daylight And Seating Preference In Open-Plan Library Spaces
 Daylight And Seating Preference In Open-Plan Library Spaces Zeynep Keskin 1, Yunhao Chen 1, Steve Fotios 1,* 1 School of Architecture, the University of Sheffield, UK Received 6 June 2015, Revised 7 July
SOLAR PASSIVE DESIGN: PRINCIPLES AND PRACTICE
 SOLAR PASSIVE DESIGN: PRINCIPLES AND PRACTICE Understanding Climate and Atmosphere Human impact on global weather Energy outlook in India Energy needs in buildings Comfort zone Solar passive design- Case
IMPACT OF OCCUPANT BEHAVIOUR ON LIGHTING ENERGY USE Heverlee, Belgium Corresponding address:
 Eleventh International IBPSA Conference Glasgow, Scotland July 27-3, 29 IMPACT OF OCCUPANT BEHAVIOUR ON LIGHTING ENERGY USE Wout Parys 1, Dirk Saelens 1 and Hugo Hens 1 1 Laboratory of Building Physics,
AIC TECH 2015 Sustainability in Practice Turning Ideas into Reality Jan 16, 2015 FUTURE & NET ZERO BUILDINGS
 AIC TECH 2015 Sustainability in Practice Turning Ideas into Reality Jan 16, 2015 FUTURE & NET ZERO BUILDINGS CONTENTS Introduction to Net Zero Can we get to Net Zero? Pathway to Net Zero Energy Buildings
Environmentally Responsive School Buildings in the UK
 PLEA2013-29th Conference, Sustainable Architecture for a Renewable Future, Munich, Germany 10-12 September 2013 Environmentally Responsive School Buildings in the UK MEITAL BEN DAYAN 1 1 Environment and
Available online at ScienceDirect. Energy Procedia 78 (2015 ) th International Building Physics Conference, IBPC 2015
 th International Building Physics Conference, IBPC 2015") Available online at www.sciencedirect.com ScienceDirect Energy Procedia 78 (2015 ) 340 345 6th International Building Physics Conference, IBPC 2015 The influence of solar control films on energy and daylighting
Available online at www.sciencedirect.com ScienceDirect Energy Procedia 78 (2015 ) 340 345 6th International Building Physics Conference, IBPC 2015 The influence of solar control films on energy and daylighting
GLAZING STUDIES FOR THE NATIONAL CONSTRUCTION CODE 2019
 GLAZING STUDIES FOR THE NATIONAL CONSTRUCTION CODE 2019 DANIEL JOHNSTON Graduate Consultant, Projects & Advisory Services Division Energy Action Unit H, 58-69 Lathlain St Belconnen ACT 2617 daniel.johnston@energyaction.com.au
BRF Kredit headquarters
 headquarters BRF Kredit Architect: KHR A/S presentation (1) BRF Kredit presentation (2) BRF Kredit! BRF-kredit is a financing institute for property mortgages! The company Headquarters is located in Lyngby,
THE IMPACT OF GLAZING SELECTION ON DAYLIGHTING AND ENERGY PERFORMANCE FOR AN OFFICE BUILDING IN CANBERRA
 THE IMPACT OF GLAZING SELECTION ON DAYLIGHTING AND ENERGY PERFORMANCE FOR AN OFFICE BUILDING IN CANBERRA Peter Taylor, Hélène Duponchel, and Paul Bannister Exergy Australia Pty Ltd PO Box 546 Belconnen
IMPACT OF COLUMNS AND BEAMS ON THE THERMAL RESISTANCE OF THE BUILDING ENVELOPE
 IMPACT OF COLUMNS AND BEAMS ON THE THERMAL RESISTANCE OF THE BUILDING ENVELOPE Dr. Essam Al-Sayed Omar Department Manager Kuwait Institute for Scientific Research Kuwait ABSTRACT This paper addresses the
COMPARATIVE SUMMER THERMAL AND COOLING LOAD PERFORMANCE OF NATURAL VENTILATION OF CAVITY ROOF UNDER THREE DIFFERENT CLIMATE ZONES
 COMPARATIVE SUMMER THERMAL AND COOLING LOAD PERFORMANCE OF NATURAL VENTILATION OF CAVITY ROOF UNDER THREE DIFFERENT CLIMATE ZONES Lusi Susanti 1, Hiroshi Matsumoto 2, and Hiroshi Homma 2 1 Department of
ARCH-MEDES (I) CONSULTANTS PVT. LTD. Green Park Delhi
 CONSULTANTS PVT. LTD. Green Park Delhi") Passive & Energy Efficient Design Assistance Report for Proposed Hospital Complex Manipal Health System at Pitampura, New Delhi ARCH-MEDES (I) CONSULTANTS PVT. LTD. Green Park Delhi Prepared By (Low Carbon
Passive & Energy Efficient Design Assistance Report for Proposed Hospital Complex Manipal Health System at Pitampura, New Delhi ARCH-MEDES (I) CONSULTANTS PVT. LTD. Green Park Delhi Prepared By (Low Carbon
Guidelines for Design and Construction of Energy Efficient County Facilities
 APPENDIX C - DAYLIGHTING The role of daylighting in the total energy balance and performance of a building is a significant one. The admission of useful daylight means that electrical lighting fixtures
Satyen Mukherjee, Dagnachew Birru, Dave Cavalcanti, Eric Shen, Maulin Patel, Yao-Jung Wen, and Sushanta Das, Philips Research North America
 Closed Loop Integrated Lighting and Daylighting Control for Low Energy Buildings Satyen Mukherjee, Dagnachew Birru, Dave Cavalcanti, Eric Shen, Maulin Patel, Yao-Jung Wen, and Sushanta Das, Philips Research
A Case Study on the Daylighting and Thermal Effects of Fixed and Motorized Light Louvers
 A Case Study on the Daylighting and Thermal Effects of Fixed and Motorized Light Louvers Yuxiang Chen 1, Samson Yip 1, Andreas Athienitis 1 1 Building, Civil and Environmental Engineering, Concordia University,
HVAC INTEGRATED CONTROL FOR ENERGY SAVING AND COMFORT ENHANCEMENT vahid Vakiloroaya
 HVAC INTEGRATED CONTROL FOR ENERGY SAVING AND COMFORT ENHANCEMENT vahid Vakiloroaya (vahid.vakiloroaya@engineer.com) ABSTRACT: The overall attainable reduction in energy consumption and enhancement of
Designing carbon neutral schools: The Victor Miller Building, a critical review
 Designing carbon neutral schools: The Victor Miller Building, a critical review Daniela BESSER 1 Lucelia RODRIGUES 1 Benson LAU 1 1 School of the Built Environment UK ABSTRACT: Nowadays, one of the UK
Daylight has been a primary source of lighting in buildings. Daylighting improve indoor environmental quality and visual comfort. Moreover, it reduces
 Effect of Window on Building Energy Performance and Indoor Environmental Quality T. Aker 1, C. Deniz 2, A. Tabancacı 3 and M.S. Mert 4 1 Energy Institute, Istanbul Technical University, Istanbul, Turkey,
NHS Scotland Design Exemplars: Health Centre & Hospital Modelling
 13416 NHS Scotland Design Exemplars: Health Centre & Hospital Modelling For: Health Facilities Scotland (HFS) part of NHS National Services Scotland Final Report v1 Consultant: Colin Rees Consultancy Manager
Phase-Change Wallboard and Mechanical Night Ventilation in Commercial Buildings: Potential for HVAC System Downsizing
 Phase-Change Wallboard and Mechanical Night Ventilation in Commercial Buildings: Potential for HVAC System Downsizing Corina Stetiu Helmut E. Feustel Lawrence Berkeley National Laboratory, Berkeley, CA
Daylight Harvesting in Tropic
 Daylight Harvesting in Tropic Daylight space when done right is much nicer environment than electrically lit spaces. Efficacy lm/watt Daylight is Cool & Free 280 Luminous Efficacy 280 230 180 130 80 30
COMPARISON OF ENERGY USE INDICATORS OF A NON-RESIDENTIAL PASSIVE HOUSE WITH ASHRAE 90.1 BUDGET BUILDING
 COMPARISON OF ENERGY USE INDICATORS OF A NON-RESIDENTIAL PASSIVE HOUSE WITH ASHRAE 90.1 BUDGET BUILDING ABSTRACT F. Bagheri 1, M. Fakoor 1, B. Young 1, C. Cranswick 1 1 BC Building Science Ltd. 611 Bent
Automating the Balance of Energy Performance with Occupant Comfort with Smart Fenestrations
 College of Engineering Dept. of Civil Construction and Environmental Engineering Automating the Balance of Energy Performance with Occupant Comfort with Smart Fenestrations Dr. Kristen Cetin, P.E., LEED
Modeling Energy Consumption Effects of Glazing
 Modeling Energy Consumption Effects of Glazing Daniel Lu 12/7/2012 Table of Contents Introduction... 3 Design Options... 5 Option 1... 5 Option 2... 5 Preliminary Energy Simulation... 7 Objectives... 7
DAYLIGHTING AND VENTILATION USING A DYNAMIC SKYLIGHT
 61 st ATI National Congress International Session Solar Heating and Cooling DAYLIGHTING AND VENTILATION USING A DYNAMIC SKYLIGHT Antonio Carbonari 1, Fabio Peron 1, Nicola Cereser 2 1 Department of Architectural
AN ADVANCED GLAZING CASE STUDY FROM THE IMAGE PROJECT
 AN ADVANCED GLAZING CASE STUDY FROM THE IMAGE PROJECT J Clarke and M Janak University of Strathclyde, Energy Systems Research Unit, James Weir Building, Glasgow G1 1XJ P Ruyssevelt, R Cohen and J Bates
The Assessment of Advanced Daylighting Systems in Multi-Story Office Buildings Using a Dynamic Method
 The Assessment of Advanced Daylighting Systems in Multi-Story Office Buildings Using a Dynamic Method Jianxin Hu 1,*, Jiangtao Du 2, Wayne Place 1 1 College of Design, School of Architecture, North Carolina
User Interactions with Environmental Control Systems in Buildings
 User Interactions with Environmental Control Systems in Buildings Ardeshir Mahdavi, Elham Kabir, Abdolazim Mohammadi, Lyudmila Lambeva, Claus Pröglhöf Department of Building Physics and Building Ecology
Ball State Architecture ENVIRONMENTAL SYSTEMS 1 Grondzik 1
 DAYLIGHT image by NASA use this powerful resource with skill and caution Ball State Architecture ENVIRONMENTAL SYSTEMS 1 Grondzik 1 Daylight and Design From the dawn of time until the widespread introduction
Effects of Fixed and Motorized Window Louvers on the Daylighting and Thermal Performance of Open-Plan Office Buildings
 Purdue University Purdue e-pubs International High Performance Buildings Conference School of Mechanical Engineering 214 Effects of Fixed and Motorized Window Louvers on the Daylighting and Thermal Performance
COMFEN A COMMERCIAL FENESTRATION/FAÇADE DESIGN TOOL
 COMFEN A COMMERCIAL FENESTRATION/FAÇADE DESIGN TOOL Robert J. Hitchcock 1, Robin Mitchell 1, Mehry Yazdanian 1, Eleanor Lee 1 and Charlie Huizenga 2 1 Lawrence Berkeley National Laboratory, Building Technologies
optimize daylighting Opportunities
 optimize daylighting Opportunities DESIGN STRATEGIES DESIGN STRATEGIES NATURAL LIGHTING FOR ENERGY EFFICIENCY DAYLIGHTING Using indirect natural light to illuminate indoor spaces as an alternative to electric
ENERGY PERFORMANCE OF DIFFERENT TYPES OF DOUBLE SKIN FACADES IN VARIOUS CLIMATES
 ENERGY PERFORMANCE OF DIFFERENT TYPES OF DOUBLE SKIN FACADES IN VARIOUS CLIMATES Ajla Aksamija, PhD, LEED AP BD+C, CDT1 1Department of Architecture, University Of Massachusetts Amherst, Amherst, Massachusetts
HOW CURRENT TRENDS IN THE DESIGN OF FACADES INFLUENCE THE FUNCTIONAL QUALITY OF INTERIOR SPACES
 HOW CURRENT TRENDS IN THE DESIGN OF FACADES INFLUENCE THE FUNCTIONAL QUALITY OF INTERIOR SPACES B. Paule 1, F. Flourentzos 1, M. Bauer 1, S. Pantet 1 1: Estia SA, EPFL Innovation Park, Lausanne, Switzerland
The Effects of Set-Points and Dead-Bands of the HVAC System on the Energy Consumption and Occupant Thermal Comfort
 The Effects of Set-Points and Dead-Bands of the HVAC System on the Energy Consumption and Occupant Thermal Comfort Ongun Berk Kazanci, Bjarne W. Olesen 1 1 International Center for Indoor Environment and
MODELLING THE IMPACTS OF NEW UK FUTURE WEATHER DATA ON A SCHOOL BUILDING
 MODELLING THE IMPACTS OF NEW UK FUTURE WEATHER DATA ON A SCHOOL BUILDING Hu Du, Jerry Edge, Chris Underwood School of Built and Natural Environment, Northumbria University, Newcastle upon Tyne, United
THERMAL MASS IMPACT ON ENERGY PERFORMANCE OF A LOW, MEDIUM, AND HEAVY MASS BUILDING IN BELGRADE
 S447 THERMAL MASS IMPACT ON ENERGY PERFORMANCE OF A LOW, MEDIUM, AND HEAVY MASS BUILDING IN BELGRADE by Bojan V. ANDJELKOVIĆ *,a, Branislav V. STOJANOVIĆ b, Mladen M. STOJILJKOVIĆ b, Jelena N. JANEVSKI
Climate Analysis. Daylighting uses solar angles, cloud cover/precipitation, and context. Temperature. Humidity. Precipitation. Wind.
 Climate Analysis Temperature Humidity Precipitation Wind Cloud Cover Daylighting uses solar angles, cloud cover/precipitation, and context. Solar Energy Daylight Glare Simple Daylight Analysis North Angle
Aalborg Universitet. CLIMA proceedings of the 12th REHVA World Congress volume 2 Heiselberg, Per Kvols. Publication date: 2016
 Downloaded from vbn.aau.dk on: januar 28, 2019 Aalborg Universitet CLIMA 2016 - proceedings of the 12th REHVA World Congress volume 2 Heiselberg, Per Kvols Publication date: 2016 Document Version Publisher's
Building Technology Research in Architectural Practice: Lessons Learned from Implementations of Energy-Efficient Advanced Building Technologies
 Building Technology Research in Architectural Practice: Lessons Learned from Implementations of Energy-Efficient Advanced Building Technologies Ajla Aksamija and Abul Abdullah, Perkins+Will ABSTRACT This
546: High Altitude Design, Optimising Residential Architecture in the Alborz Mountains, Iran
 546: High Altitude Design, Optimising Residential Architecture in the Alborz Mountains, Iran Yasamin Arbabi Architectural Association, Graduate School Abstract Darbandsar is a village located in the Alborz
Thermal Performance of Toplighting Systems in a Hot and Humid Climate: Thailand
 Thermal Performance of Toplighting Systems in a Hot and Humid Climate: Thailand S. Harntaweewongsa, L.O. Beltrán, Ph.D., Texas A&M University Keywords: Abstract: Toplighting, architecture, sustainability,
DAYLIGHTING DESIGN IN A LOW ENERGY BUILDING
 Sibilio, S.*, Rosato, A., Scorpio, M. Seconda Università degli Studi di Napoli Department of Architecture and Industrial Design "Luigi Vanvitelli" Via San Lorenzo, Aversa (CE), 81031, Italy *Corresponding
ENERGY ANALYSIS AND ENERGY CONSERVATION OPTION FOR THE WAREHOUSE FACILITY AT THE HUMAN SERVICES CENTER COMPLEX DRAFT REPORT.
 ESL-TR-86/09-03 ENERGY ANALYSIS AND ENERGY CONSERVATION OPTION FOR THE WAREHOUSE FACILITY AT THE HUMAN SERVICES CENTER COMPLEX DRAFT REPORT Submitted by Mohsen Farzad Dennis O'Neal Prepared For Energy
Effect of a Window Shade on Home Energy Use
 University of Nebraska - Lincoln DigitalCommons@University of Nebraska - Lincoln Environmental Studies Undergraduate Student Theses Environmental Studies Program Fall 2015 Effect of a Window Shade on Home
THE USE OF A SIMULATION TOOL IN ORDER TO OBTAIN THE THERMAL PERFORMANCE OF PASSIVE SOLAR HOUSES IN PORTUGAL
 THE USE OF A SIMULATION TOOL IN ORDER TO OBTAIN THE THERMAL PERFORMANCE OF PASSIVE SOLAR HOUSES IN PORTUGAL Helder P. Gonçalves, Marta N. Oliveira & Anita M. Patrício INETI-ITE-DER National Institute of
Work Package 2: Performance of naturally ventilated buildings
 Work Package 2: Performance of naturally ventilated buildings Detailed Monitoring Report BRF-kredit Headquarters (DK2) Niels C. Bergsøe Danish Building Research Institute, SBI Energy and Indoor Climate
IMPACT OF USING DIFFERENT MODELS IN PRACTICE A CASE STUDY WITH THE SIMPLIFIED METHODS OF ISO STANDARD AND DETAILED MODELLING PROGRAMS
 IMPACT OF USING DIFFERENT MODELS IN PRACTICE A CASE STUDY WITH THE SIMPLIFIED METHODS OF ISO 13790 STANDARD AND DETAILED MODELLING PROGRAMS Kokogiannakis Georgios 1, Clarke Joe 1, Strachan Paul 1 1 Energy
Dynamic simulation of buildings: Problems and solutions Università degli Studi di Trento
 Dynamic simulation of buildings: Problems and solutions Università degli Studi di Trento Paolo BAGGIO The basic problem To design (and operate) energy efficient buildings, accurate modeling tools are needed.
It coordinates the lighting, sun-screening, heating, cooling and ventilation as a holistic room automation system
 Room Automation What is room automation? It coordinates the lighting, sun-screening, heating, cooling and ventilation as a holistic room automation system It replaces the traditional system-oriented partial
Potential for Improved Outdoor Comfort by Design in U.S. Climates
 Nathaniel Johnson, Adrian Turcato, Erik Olsen Transsolar New York Summary This white paper presents the potential for passive design strategies to improve comfort in outdoor environments in different regions
Assessment of Energy Performance of Window Technologies for Commercial Buildings
 Assessment of Energy Performance of Window Technologies for Commercial Buildings Tianzhen Hong and Stephen Selkowitz, Lawrence Berkeley National Laboratory ABSTRACT Windows play a significant role in commercial
Higher Education Energy Efficiency Partnership Program BEST PRACTICES AWARDS
 Higher Education Energy Efficiency Partnership Program BEST PRACTICES AWARDS UC / CSU Sustainability Conference, June 2005 A program created by the UC/CSU/IOU Partnership and under the auspices of the
FULL YEAR PERFORMANCE SIMULATION OF A DIRECT-COOLED THERMAL STORAGE ROOF (DCTSR) IN THE MIDWEST
 IN THE MIDWEST") FULL YEAR PERFORMANCE SIMULATION OF A DIRECT-COOLED THERMAL STORAGE ROOF (DCTSR) IN THE MIDWEST Richard C. Bourne Davis Energy Group, Inc. 123 C Street Davis, CA 95616 and Dr. Bing Chen Passive Solar Research
FULL YEAR PERFORMANCE SIMULATION OF A DIRECT-COOLED THERMAL STORAGE ROOF (DCTSR) IN THE MIDWEST Richard C. Bourne Davis Energy Group, Inc. 123 C Street Davis, CA 95616 and Dr. Bing Chen Passive Solar Research
Effect of Building Orientation and Window Glazing on the Energy Consumption of HVAC System of an Office Building for Different Climate Zones
 Effect of Building Orientation and Window Glazing on the Energy Consumption of HVAC System of an Office Building for Different Climate Zones Maya Yeshwanth Pai Dept. of Electrical & Electronics Engineering
Attaining Thermal Comfort in. Buildings with Predominantly. Glazed Facades. presented to: ANSYS Boston Regional Conference
 Attaining Thermal Comfort in Buildings with Predominantly Glazed Facades presented to: ANSYS Boston Regional Conference September 14, 2011 Case Study Background High floor to ceiling windows Large skylight
Daylighting Strategies and Case Studies
 Daylighting Strategies and Case Studies Gregers Reimann IEN Consultants Sdn Bhd www.ien.com.my 27 August 2015 GBI Professional Series, Vivatel, Kuala Lumpur, Malaysia Contents I. Do People Want Daylighting?
AUTOMATION SYSTEM FOR LIGHTING CONTROL: COMPARISON BETWEEN DATA RECORDED AND SIMULATION MODEL
 Int. Journal for Housing Science, Vol.33, No.1 pp. 45-56, 2009 Published in the United States AUTOMATION SYSTEM FOR LIGHTING CONTROL: COMPARISON BETWEEN DATA RECORDED AND SIMULATION MODEL A. Frattari Architecture
Introduction to basics of energy efficient building design
 Introduction to basics of energy efficient building design Pierre Jaboyedoff Seminar on Energy Efficient & Thermally Comfortable Buildings in Amravati For CRDA, Andhra Pradesh May 2 nd 2017 Indo-Swiss