Population Living in Areas Meeting Air Quality Standards. Ozone Levels Above 1-Hour Outdoor Air Quality Standard
|
|
|
- Claude Booth
- 6 years ago
- Views:
Transcription
1 TABLE OF CONTENTS INTRODUCTION PUBLIC HEALTH AIR QUALITY Population Living in Areas Meeting Air Quality Standards Common Air Pollutants Ozone Levels Above 1-Hour Outdoor Air Quality Standard Ozone Levels Exceeding 8-Hour Outdoor Air Quality Standard Change in Emissions by Source Category Vehicle Miles Traveled/Population and NOx Public Transportation Use HAZARDOUS MATERIALS EXPOSURE Hazardous Waste Generated per Year Reported Exceedances of Lead Poisoning Standard Toxics Releases DRINKING WATER QUALITY Public Water Systems in Compliance Surface Water Supply Systems with Source Protection Programs Ground Water Systems with Wellhead Protection Programs Municipal Waste Landfills in compliance with Ground Water Standards Oil Contaminated Sites WATER QUALITY (FISH AND SHELLFISH HARVESTING) Shellfish Harvesting Waters Maryland Waters Safe for Harvesting Finfish WATER QUALITY - Designated Uses of Surface Waters Dissolved Oxygen and Water Quality Impairment Nutrient Inputs to Mainstem and Tributary Waters Cropland Acres Under Nutrient Management Plans Phosphorus Concentration in Maryland's Chesapeake Bay
2 Nitrogen Concentration in Maryland's Chesapeake Bay Atmospheric Nitrogen Loading Cropland Acres Under Integrated Pest Management TIDAL AQUATIC SYSTEMS Submerged Aquatic Vegetation Habitat Quality Acres of Submerged Aquatic Vegetation Benthic Index of Biotic Integrity - Chesapeake Bay Fish Index of Biotic Integrity - Estuarine Striped Bass Juvenile Index American Shad Population Blue Crab Population Seed Oyster Production NON-TIDAL AQUATIC SYTEMS Miles of Streams Degraded by Abandoned Mine Drainage Stream Miles Open to Migratory Fish Physical Habitat Index (Non-Tidal) Benthic Macroinvertebarate Index of Biotic Integrity (Non-Tidal) Fish Index of Biotic Integrity (Non-Tidal) Riparian Forest Buffers TERRESTRIAL SYSTEM DEGRADATION, FRAGMENTATION, ISOLATION Maryland Wetland Trends Wetlands Restoration Initiative Acres of Agricultural and Forest Lands Protected Lands Septic System Permits/Low Density Residential Development Acres of Abandoned Mine Lands Brownfields/Federal Facilities Approved for Redevelopment Recycling Municipal Solid Waste CONSERVATION OF BIOLOGICAL DIVERSITY Forest Interior Breeding Bird Populations Bald Eagle Population Colonial Waterbird Population Trends PUBLIC INTERFACE PUBLIC UNDERSTANDING AND COMMUNITY SUPPORT Envirothon Participants Green Schools Teaching Environmental Awareness in Maryland - TEAM DNR ENVIRONMENTAL JUSTICE
3 PUBLIC COMMENTS TO PREVIOUS ENVIRONMENTAL STATUS REPORT MARYLAND'S FY2000 ENVIRONMENTAL PARTNERSHIP AGREEMENT
4 INTRODUCTION PUBLIC HEALTH PUBLIC INTERFACE A New State-Federal Partnership INTRODUCTION This report is the second in a series that provides a concise characterization of some of Maryland's key environmental and public health conditions. The earlier report, issued in draft in 1997, was the first step in a strategic planning process through which the Maryland Departments of Environment (MDE) and Natural Resources (DNR) and the U.S. Environmental Protection Agency (EPA) have been redefining the federal-state relationship to promote a results-based approach to environmental protection issues. The resulting 1998 Environmental Performance Partnership Agreement (EnPA) and a subsequent one for Fiscal Year 1999, provide Maryland an important opportunity to refine environmental goals and outcomes, focus its programs toward results-based management, and improve the relationship between the State and EPA. The EnPA process also helps fulfill Governor Parris N. Glendening s mandate for improving state agency performance through the results-based strategic planning process known as Managing Maryland for Results. This process also is consistent with the directives that state agencies have received from the Maryland General Assembly to improve various units of measurement and to focus management towards environmental and public health outcomes. For Maryland, broad programmatic goals for protection of public health and the natural environment may be defined by: Federal statutes, such as the Clean Water Act, Clean Air Act, Resource Conservation and Recovery Act, Superfund, Endangered Species Act, or Food Security Act; State statutes, such as the Critical Areas Act; Non-tidal Wetlands Protection Act; Lead Poisoning Prevention Act; Maryland Economic Growth, Resource Protection, and Planning Act; or the many sections of both the Environment and Natural Resources Article; and Executive Orders, executive policies, such as those ensuring Smart Growth, or directives from the Chesapeake Bay Executive Council. The State is committed to achieving these goals through implementation of a variety of environmental protection, resource management, and public health protection programs. Using its strategic planning process, the State is evaluating progress toward meeting the goals established under this array of mandates, using a five-step process: Step 1. Characterizing Maryland's environmental conditions using public and ecosystem health indicators related to the goals; Step 2. Assessing the State's performance and effectiveness in addressing Maryland's environmental problems; Step 3. Establishing priorities for targeting the State's resources needed to remedy problems Step 4. Developing an annual workplan that spells out what actions the State and EPA will take in order to achieve the desired environmental outcomes; and, Step 5. Implementing the workplan and evaluating its effectiveness.
5 Involving the Public. As Figure 1 (enpa_process.pdf) illustrates, the EnPA partners continue to seek broad stakeholder review and comment on the reports; they seek to engage a wide range of stakeholders, including environmental and public health advocacy groups, citizen groups, elected officials, agency advisory groups, business leaders, educators, scientists, natural resources users, among many others. The State is making the updated indicators document available to its stakeholders using a variety of outreach tools, which include direct mailings, State agency Internet Homepages ( and public libraries, and organization newsletters, among others. The Environmental Indicators Background. Traditionally, government has used programmatic measures that focused on measuring and reporting activities related to, for example, issuing permits, inspecting industrial facilities, or counting the number of enforcement actions. While these measures are useful for making resource management decisions and for tracking personnel activity, their usefulness as measures of true environmental performance is very limited. Environmental performance indicators like the following more accurately portray the environmental and public health conditions in Maryland. Environmental indicators describe and analyze scientifically-based information on environmental trends, conditions, and their significance. Indicators can simplify complex phenomena so that a reader may more easily understand what is happening in the environment. Use of environmental indicators to identify trends and conditions and assess their significance requires a strong commitment to long-term monitoring by local, state, and federal agencies. Such monitoring includes water quality and water quantity, aquatic and terrestrial biological species and communities, and atmospheric parameters. Monitoring is vital not only in describing trends and conditions, but also in describing and ranking existing and emerging problems, and in evaluating program effectiveness. Along with monitoring, it is critical that the State maintain accurate data bases and routinely evaluate the data to guide environmental management efforts and communicate status and trends. Maryland has developed over 50 indicators that are organized into three broad categories: public health, ecosystem health, and interface with the public. These indicators provide a snapshot of the status of critical environmental and public health issues that Marylanders face today; however, it is not possible to include indicators for every environmental or health issue. Some important environmental or public health issues are not easy to capture in the context of an indicator. Information may simply be unavailable in some cases. However, the indicators presented in this report relay important information about some aspect of the environmental and public health protection issues facing the people of Maryland. These indicators also provide the kind of information of interest to government and the public, and will continue to be revised and updated in response to public input and stakeholder comments, as well as improved science and further environmental monitoring. Presentation of Indicator Information. Several terms are used to discuss the indicators and the broad themes into which they have been grouped: Goals are broad policy statements of desired outcomes and conditions (i.e., air that is safe to breathe,) Indicators are units of measure that describe information on environmental trends or conditions relating to the goal, Status is the current situation reflected by the indicator in relationship to the goal, Stressors and sources refer to the underlying causes of the environmental condition, Management Objectives describe the approach the State is taking to achieve the goal, and Benchmarks present numerical or time-specific achievements used to measure progress toward meeting the goal, where these have been established through formal consultation, legislation or regulation.
6 INTRODUCTION PUBLIC HEALTH AIR QUALITY HAZARDOUS MATERIALS EXPOSURE DRINKING WATER QUALITY WATER QUALITY (FISH AND SHELLFISH HARVESTING) PUBLIC INTERFACE PUBLIC HEALTH The following section presents Maryland s public health indicators. Most of these indicators first were presented in the 1997 report. In the public health area, researchers are challenged to demonstrate causal relationships between exposure to adverse environmental conditions and human health effects. For example, to analyze the effects of ozone levels on humans, scientists have used the number of hospital days for respiratory illness occurring on high-ozone days as an indicator of the relationship. Most often, epidemiological studies and statistical modeling are used to make the linkages between exposure and illness because it is very difficult to control for the large number of variables, such as: variability in data collection and reporting of hospital admissions, availability and effectiveness of health care among different socio-economic groups; additive or synergistic health effects from exposure to pollutants or infectious agents, differences in ozone exposure or dose due to geographic or demographic variations, etc. While it is difficult to measure directly what changes in public health conditions result from environmental improvements or causes, it is reasonable to use reductions in emissions or ambient concentrations of pollutants known to adversely affect human health as indicators of improvements in conditions affecting public health. The following indicators address public health protection issues related to ensuring that the air is safe to breathe, minimizing exposure to a variety of hazardous materials, protecting public drinking water, and assuring that fish and shellfish are safe to eat.
7 INTRODUCTION PUBLIC HEALTH AIR QUALITY Population Living in Areas Meeting Air Quality Standards Common Air Pollutants Ozone Levels Above 1-Hour Outdoor Air Quality Standard Ozone Levels Exceeding 8-Hour Outdoor Air Quality Standard Change in Emissions by Source Category Vehicle Miles Traveled/Population and NOx Public Transportation Use AIR QUALITY The national ambient (outdoor) air quality standards are established for six common pollutants that are produced in substantial quantities throughout the country-ozone, carbon monoxide, sulfur dioxide (SO 2 ), particulate matter, oxides of nitrogen (NOx), and lead. The U.S. EPA has determined that these common pollutants have adverse health effects when outdoor air concentrations reach certain levels and has established the national standards at levels which protect public health and welfare with an adequate margin of safety. People who live in areas that meet federal air quality standards for a particular pollutant should suffer no adverse health effects from that pollutant. Air pollution control programs have reduced most man-made air pollution substantially, and Maryland largely meets federal air quality standards, however studies show that maintaining these reductions and making further reductions in volatile organic compounds (VOC) and NOx will be necessary for Maryland to comply with the ozone standard. Exposure to ozone levels in the ambient air that are higher than the national standards for ozone has been linked to increased hospital admissions for respiratory ailments, such as asthma. Studies conducted in the northeastern United States and Canada show that ozone air pollution is associated with 10 to 20 percent of all the summertime respiratory-related hospital admissions. Repeated exposure to ozone can make people more susceptible to respiratory infection and lung inflammation, and can aggravate pre-existing respiratory diseases, such as asthma. Children run the greatest risk from exposure to ozone because they are active outside, playing and exercising during the summertime when ozone levels are at their highest. Goal: Ensure the air is safe to breathe. HAZARDOUS MATERIALS EXPOSURE DRINKING WATER QUALITY WATER QUALITY (FISH AND SHELLFISH HARVESTING) PUBLIC INTERFACE Stressors/Sources: Pollutant emission sources in Maryland and long range transport of pollutants from outside of Maryland affect Maryland's air quality. Emission reductions from sources in Maryland alone may not guarantee good air quality. Sources of air pollution may be stationary and/or mobile. Ground-level ozone is formed from the chemical reaction of Volatile Organic Compounds (VOCs) and Nitrogen Oxides (NOx) in the presence of sunlight, especially when the temperature is over 90 degrees. The primary sources of VOC emissions are vehicle exhaust, paints and solvents, and industrial facilities. NOx is formed primarily as the result of combustion. Sources include power plants, industrial processes and vehicles. Levels of ground-level ozone are heavily influenced by meteorological conditions with the highest levels generally occurring during hot, stagnant weather patterns. Long-range transport of ozone-forming pollutants both from neighboring states and other areas of the country contributes to elevated levels of ozone in Maryland. Carbon monoxide is primarily emitted by motor vehicles (cars, buses, and trucks) and some industrial processes. Sulfur dioxide is mostly emitted from industrial and utility sources. Particulate matter comes from industrial processes, motor vehicles, wood burning, and dust from roads, stockpiles, construction, and agricultural sites. Nitrogen oxides mostly result from burning fuels in utilities, industries, and motor vehicles. Lead is emitted by transportation sources using leaded fuels, coal combustion sources, and smelters. Lead emissions have dramatically decreased since 1980 due in large part to the elimination of the sale of leaded gasoline to the general public. Management Objectives: Utilizing the most cost-effective methods for emissions controls in cooperation with other eastern states will ensure continued growth and prosperity in a healthful environment. These reductions are increasingly difficult to maintain as urban centers increase in population. As emissions controls become more stringent, the marginal cost of emissions reductions
8 increases and control technology becomes more complex. Control strategies include preventing and reducing emissions of air pollutants from industries, utilities, small businesses and mobile sources (e.g. automobiles) through a variety of regulatory and educational activities. Particular emphasis is given to steps to reduce formation of ozone, where standards are presently not met. Because of the significance of automobiles as sources of VOC and NOx, much attention is focused on them. One approach, in support of the Governor's Smart Growth initiative, is to demonstrate the relationship between trends in vehicle miles traveled by Maryland citizens and trends in emissions of these pollutants, in order to make them aware of the effects of their daily travel habits. The educational approach continues with encouragement for citizens to investigate alternative ways to travel-car pooling, public transit, bicycling and walking-and to bring these considerations to bear on major decisions in their lives, like where to live and work and shop. Maryland's vehicle emissions inspection program (VEIP) takes a regulatory approach to emissions from individual automobiles. The Indicators: These indicators focus on the results of Maryland's activities to ensure that the air is safe to breathe. We measure our progress in large part on federal health-based air quality standards. Maryland meets five of the six federal ambient air quality standards and is considered to be in attainment with respect to them. The exception is the low-level ozone standard. The Air Quality indicators focus on changes in emissions by source category for ozone-forming compounds (VOC and NOx) and other common pollutants, days/number of times air pollution exceeds federal health-based air quality standards, and the percentage of Maryland population living in areas meeting federal air quality standards. Because MDE has no authority over vehicle miles traveled, no benchmark is given for this indicator. The indicators are included here because they help to tell the story of air pollution and its causes and have a significant impact on the State's ability to meet its overall air quality goal through other means where authority is more clearly established.
9 INTRODUCTION PUBLIC HEALTH Data/Graphs: Population Living in Areas Meeting Air Quality Standards Indicator Development and Data Responsibility: MDE's Air Quality Program, AIR QUALITY Population Living in Areas Meeting Air Quality Standards Common Air Pollutants Ozone Levels Above 1-Hour Outdoor Air Quality Standard Ozone Levels Exceeding 8-Hour Outdoor Air Quality Standard Change in Emissions by Source Category Vehicle Miles Traveled/Population and NOx Percent of MD Population Living in Attainment and Non-Attainment Areas for Common Air Pollutants Goal: Ensure the air is safe to breathe. Indicator: Percentage of Maryland population living in areas meeting federal air quality standardsattainment areas. Status: 100% of Marylanders live in areas that meet standards for the following pollutants: carbon monoxide, sulfur dioxide, particulate matter, nitrogen dioxide, and lead. 87% of Marylanders live in areas where health based standards for the 1-hour ozone standard are exceeded. Areas in Maryland that do not meet the 8-hour ozone standard have not yet been identified. Benchmark: By 2005, all Marylanders live in areas that meet the 1-hour ozone standard. All Marylanders continue to live in areas that meet federal air quality standards for carbon monoxide, sulfur dioxide, nitrogen dioxide, lead, and particulate matter. Public Transportation Use HAZARDOUS MATERIALS EXPOSURE DRINKING WATER QUALITY WATER QUALITY (FISH AND SHELLFISH HARVESTING) PUBLIC INTERFACE

10 Percent of Maryland Population Living in Attainment and Non- Attainment Areas for Common Air Pollutants
11 INTRODUCTION PUBLIC HEALTH Data/Graphs: Common Air Pollutants Indicator Development and Data Responsibility: MDE's Air Quality Program, AIR QUALITY Population Living in Areas Meeting Air Quality Standards Common Air Pollutants Ozone Levels Above 1-Hour Outdoor Air Quality Standard Ozone Levels Exceeding 8-Hour Outdoor Air Quality Standard Change in Emissions by Source Category Vehicle Miles Traveled/Population and NOx Public Transportation Use HAZARDOUS MATERIALS EXPOSURE DRINKING WATER QUALITY WATER QUALITY (FISH AND SHELLFISH HARVESTING) Maryland 1-Hour Exceedance by Year Lead: Annual Arithmetic Mean Nitrogen Dioxide: Annual Arithmentic Average Inhalable Particulate (PM-10): Annual Arithmentic Mean Carbon Monixide: Number of Exceedances of 8-Hour Standard Sulfur Dioxide: Annual Arithmentic Average Goal: Ensure the air is safe to breathe. Indicator: Measured air quality data for common air pollutants: Ozone: Days in year the 1-hour standard was exceeded Lead: The annual arithmetic mean at three locations Nitrogen dioxide (NO 2 ): The annual arithmetic average at two locations Carbon Monoxide (CO): The number of exceedances of the 8-hour standard Inhalable Particulate: The new standard is particulate matter of 10 microns or less in diameter (PM - 10), particulates larger than PM - 10 are filtered out and do not enter the lungs: Annual arithmetic mean at five locations Sulfur dioxide: Annual arithmetic average at four locations Status: All of Maryland meets federal air quality standards for all of the common air pollutants except ozone. The Baltimore and Washington, D.C. areas, Kent, Queen Anne's and Cecil Counties fail to meet the federal 1-hour ozone standard. Benchmark: By 2005, meet the federal 1-hour ozone standard in all areas of Maryland and continue meeting air quality standards for all common air pollutants. PUBLIC INTERFACE

12 Maryland 1-Hour Exceedances by Year

13 Lead Annual Arithmetic Mean (ug/m 3 ) National Ambient Air Quality Quarterly Standard = 1.5 ug/m 3

14 Nitrogen Dioxide Annual Arithmetic Mean (ug/m 3 ) National Ambient Air Quality Quarterly Standard = 100 ug/m 3
 National Ambient Air Quality Quarterly Standard = 50 ug/m 3")
15 Inhalable Particulate -- PM-10 Annual Arithmetic Mean (ug/m 3 ) National Ambient Air Quality Quarterly Standard = 50 ug/m 3

16 Carbon Monoxide Number of Exceedances of 8-Hour Standard

17 Sulfur Dioxide Annual Arithmetic Mean (ug/m 3 ) National Ambient Air Quality Quarterly Standard = 80 ug/m 3
18 INTRODUCTION PUBLIC HEALTH Data/Graphs: Ozone Levels Above 1-Hour Outdoor Air Quality Standard Indicator Development and Data Responsibility: MDE's Air Quality Program, AIR QUALITY Population Living in Areas Meeting Air Quality Standards Common Air Pollutants Ozone Levels Above 1-Hour Outdoor Air Quality Standard Ozone Levels Exceeding 8-Hour Outdoor Air Quality Standard Change in Emissions by Source Category Vehicle Miles Traveled/Population and NOx Public Transportation Use HAZARDOUS MATERIALS EXPOSURE DRINKING WATER QUALITY WATER QUALITY (FISH AND SHELLFISH HARVESTING) Maryland 1-Hour Ozone Exceedances by Year Ratio of Days Ozone Levels Exceeded 1-Hour Ozone Standard to Days > 90 Degrees Fahrenheit in Maryland Nonattainment Areas Goal: Ensure the air is safe to breathe. Indicators: 1. Number of days ozone levels exceeded the federal 1-hour ozone standard. 2. Ratio of days ozone levels exceeded the federal 1-hour ozone standard to days with temperatures above 90 o F. Status: Ozone-levels exceeded the one hour standard 10 times in EPA changed the ozone standard from a 1-hour average level to an 8-hour average level because the 8-hour average level relates more directly to long-term exposure levels that have permanent adverse health effects. The revised 8-hour standard became effective in September 1997 while the existing 1-hour standard will remain in effect until EPA determines that an area has air quality meeting the 1-hour standard. All areas in Maryland must meet the 1-hour ozone standard. The graph on the left shows that it is difficult to see a definitive trend in exceedence days. In the graph on the right, the ratio of exceedence days to days with temperatures above 90 degrees shows that during the 1980s, there was a strong correlation between days when the temperature was 90 degrees or above and exceedences of the ozone standard. In the 1990s, a temperature of 90 degrees or above indicates a less than 50% chance of exceeding the ozone standard. Benchmark: By 2005, each ozone monitor in Maryland will not exceed the 1-hour ozone standard more than three times in a three-year period and all Marylanders live in areas that meet the 1-hour ozone standard. PUBLIC INTERFACE

19 Maryland 1-Hour Exceedances by Year

20 Ratio of Days Ozone Levels Exceeded 1-Hour Ozone Standard to Days > 90 o F in Maryland Nonattainment Areas
21 INTRODUCTION PUBLIC HEALTH Data/Graphs: Ozone Levels Exceeding 8-Hour Outdoor Air Quality Standard Indicator Development and Data Responsibility: MDE's Air Quality Program, AIR QUALITY Population Living in Areas Meeting Air Quality Standards Common Air Pollutants Ozone Levels Above 1-Hour Outdoor Air Quality Standard Ozone Levels Exceeding 8-Hour Outdoor Air Quality Standard Change in Emissions by Source Category Vehicle Miles Traveled/Population and NOx Public Transportation Use Fourth Highest 8-Hour Ozone Level in Maryland (3 Year Average) Number of 8-Hour Ozone Levels Above the 8-Hour Ozone Standard Goal: Ensure the air is safe to breathe. Indicator: Number of times ozone levels exceed the 8-hour ozone national ambient (outdoor) air quality standard. Status: Ozone levels exceeded the 8-hour ozone standard 54 times in The revised 8-hour standard became effective on September 16, 1997 while the existing 1-hour standard will remain in effect until EPA determines that an area has air quality meeting the 1-hour standard. All areas in Maryland must meet the 1-hour ozone standard by EPA changed the ozone standard from a 1-hour average level to an 8-hour level because the 8-hour average level relates more directly to long-term exposure levels that have permanent adverse health effects. Benchmark: Recommend to EPA designations and classifications for counties in Maryland that appropriately reflect the county's air quality with respect to the 8-hour ozone standard and the county's influence on the air quality of other counties in Maryland and other states. HAZARDOUS MATERIALS EXPOSURE DRINKING WATER QUALITY WATER QUALITY (FISH AND SHELLFISH HARVESTING) PUBLIC INTERFACE

22 Fourth Highest 8-Hour Ozone Level in Maryland (3 Year Average) This graph is structured to show whether Maryland areas comply with the 8-hour ozone standard. The test for compliance with the standard is whether the fourth highest ozone level averaged over three years is less than the standard. The three year average dampens the effect extreme weather conditions in a single year can have on ozone levels.

23 Number of 8-Hour Ozone Levels Above the 8-Hour Ozone Standard This graph shows the number of times that ozone levels exceeded the 8-hour standard during the calendar year.
24 INTRODUCTION PUBLIC HEALTH Data/Graphs: Change in Emissions by Source Category Indicator Development and Data Responsibility: MDE's Air Quality Program, AIR QUALITY Population Living in Areas Meeting Air Quality Standards Common Air Pollutants Ozone Levels Above 1-Hour Outdoor Air Quality Standard Ozone Levels Exceeding 8-Hour Outdoor Air Quality Standard Change in Emissions by Source Category Vehicle Miles Traveled/Population and NOx Public Transportation Use HAZARDOUS MATERIALS EXPOSURE VOC Emissions NOx Emissions CO Emissions Lead Emissions SOx & PM-10 Emissions Goal: Ensure the air is safe to breathe. Indicator: Change in emissions by source category for ozone-forming compounds (VOC and NOx) and other common pollutants in the Baltimore nonattainment area. Status: The emissions inventory includes point source emissions for sulfur oxides and particulate matter. For lead, carbon monoxide, and the ozone-forming compounds (VOC and NOx), the inventory includes area, on-road mobile, and non-road mobile emissions as well as point source emissions. The emissions for VOCs and NOx are particularly important because they combine to form ozone. The 1996 inventory of VOC and NOx emissions were reduced by at least 15% by Lead emissions have dramatically decreased since 1980 due in large part to the elimination of the sale of leaded gasoline to the general public. Benchmark: Achieve reductions in NOx and/or VOC emissions that are necessary to meet the healthbased air quality standards for ozone. DRINKING WATER QUALITY WATER QUALITY (FISH AND SHELLFISH HARVESTING) PUBLIC INTERFACE

25 VOC Emissions Baltimore Nonattainment Area Notes: Point source emissions include emissions from major stationary sources. Area source emissions include emissions of stationary sources which are not major sources and which are too numerous to be counted individually. Mobile source emissions include tailpipe and evaporative emissions from vehicles operating on public roadways. Non-road emissions include emissions from vehicles and internal combustion engines not normally operated on public highways. The VOC emissions values were adjusted to allow direct comparison of emission levels based on similar calculation methodologies for different years.

26 NOx Emissions Baltimore Nonattainment Area Notes: Point source emissions include emissions from major stationary sources. Area source emissions include emissions of stationary sources which are not major sources and which are too numerous to be counted individually. Mobile source emissions include tailpipe and evaporative emissions from vehicles operating on public roadways. Non-road emissions include emissions from vehicles and internal combustion engines not normally operated on public highways. The NOx emissions values were adjusted to allow direct comparison of emission levels based on similar calculation methodologies for different years.

27 Carbon Monoxide Emissions Baltimore Nonattainment Area Notes: Point source emissions include emissions from major stationary sources. Area source emissions include emissions of stationary sources which are not major sources and which are too numerous to be counted individually. Mobile source emissions include tailpipe and evaporative emissions from vehicles operating on public roadways. Non-road emissions include emissions from vehicles and internal combustion engines not normally operated on public highways. Baltimore achieved compliance with CO Standard in 1990.

28 Lead Emissions Baltimore Nonattainment Area Notes: Point source emissions include emissions from major stationary sources. Area source emissions include emissions of stationary sources which are not major sources and which are too numerous to be counted individually. Mobile source emissions include tailpipe and evaporative emissions from vehicles operating on public roadways. Non-road emissions include emissions from vehicles and internal combustion engines not normally operated on public highways.

29 SOx & PM-10 Emissions From Point Sources Baltimore Nonattainment Area Note: Point source emissions include emissions from major stationary sources.
30 INTRODUCTION PUBLIC HEALTH AIR QUALITY Population Living in Areas Meeting Air Quality Standards Common Air Pollutants Ozone Levels Above 1-Hour Outdoor Air Quality Standard Ozone Levels Exceeding 8-Hour Outdoor Air Quality Standard Change in Emissions by Source Category Data/Graphs: Vehicle Miles Traveled/Population and NOx Data Development and Indicator Responsibility: MDOT's State Highway Administration, Vehicle Miles Traveled and Population Vehicle Miles Traveled and NOx Emissions Goal: Ensure the air is safe to breathe. Indicator: Trends in Vehicle Miles Traveled (VMT) compared to population growth, total Nitrogen Dioxide (NOx) emissions, and NOx from vehicle emissions Status: Vehicle population and VMT are both growing at a faster rate than population. Total emissions in NOx have been decreasing recently due to technological advances such as clean fuels and lower tailpipe standards. However, the number of trips per day made by each person is projected to increase 42% by 2020, resulting in an additional 5.9 million trips per day. Between 2005 and 2010, vehicle emissions will begin to increase again due to the 65% increase in VMT resulting from the increased trips. Vehicle Miles Traveled/Population and NOx Public Transportation Use HAZARDOUS MATERIALS EXPOSURE DRINKING WATER QUALITY WATER QUALITY (FISH AND SHELLFISH HARVESTING) PUBLIC INTERFACE

31 Vehicles Miles Traveled and Population

32 Vehicles Miles Traveled and NOx Emissions
33 INTRODUCTION PUBLIC HEALTH AIR QUALITY Population Living in Areas Meeting Air Quality Standards Common Air Pollutants Ozone Levels Above 1-Hour Outdoor Air Quality Standard Ozone Levels Exceeding 8-Hour Outdoor Air Quality Standard Change in Emissions by Source Category Vehicle Miles Traveled/Population and NOx Public Transportation Use Data/Graph: Public Transportation Use Data Development and Indicator Responsibility: MDOT's Mass Transit Administration, Transit Trips and Population Goal: Ensure the air is safe to breathe. Indicator: Trends in transit use plotted against population. The projected 2020 figure for transit trips reflects the goal of the Maryland Transit Advisory Panel for increased ridership. Status: Each year the number of transit riders increases. However, the percentage of trips made by personal vehicles increases while the percentage of trips made by transit has decreased. The Maryland Transit Advisory Panel, chaired by former Senator Donald C. Fry, recently completed a comprehensive statewide study of transit use in Maryland. The panel consisted of 28 members representing business, political, transportation, environmental and government leaders from around the State. The panel agreed that the additional travel demand should not be accommodated solely by expanding the highway network. Benchmark: By 2020, increase transit ridership in Maryland from 570,000 to 1,000,000 riders a day. The Maryland Transit Advisory Panel unanimously recommended this goal, and it has been adopted by Governor Parris N. Glendening. HAZARDOUS MATERIALS EXPOSURE DRINKING WATER QUALITY WATER QUALITY (FISH AND SHELLFISH HARVESTING) PUBLIC INTERFACE

34 Transit Trips and Population
35 INTRODUCTION PUBLIC HEALTH AIR QUALITY HAZARDOUS MATERIALS EXPOSURE Hazardous Waste Generated per Year Reported Exceedances of Lead Poisoning Standard Toxics Releases DRINKING WATER QUALITY WATER QUALITY (FISH AND SHELLFISH HARVESTING) PUBLIC INTERFACE HAZARDOUS MATERIALS EXPOSURE Hazardous waste and hazardous materials in the environment pose the potential to cause or contribute to an increase in mortality and serious illness in humans, to slow a child's development and cause learning disabilities and behavior problems. They also threaten the environment if mismanaged: some contaminants can remain in the water column or sediment for long periods of time and studies have shown that even relatively low concentrations of some toxic chemical contaminants can have a range of ecological impacts on the Chesapeake Bay. Chemical contaminants, including oil, can compromise the immune system of Bay organisms, cause cancer in aquatic organisms, harm marine life, and affect the Bay's food web. Goal: Reduce the threat to public health from the presence of hazardous waste and hazardous materials in the environment. Stressors/Sources: Hazardous waste is produced as a byproduct of many manufacturing operations and processes. Increases in business and industrial activity can cause an increase in the generation of hazardous waste; wastes may become newly regulated as hazardous, causing a statistical increase in the amount of hazardous waste generated even though the total amount of waste generated does not increase. Also, numerous commercial chemical products are regulated as hazardous waste once they are declared to be waste or intended to be discarded. Pollution prevention initiatives and hazardous waste recycling systems that can significantly reduce exposure to hazardous products and waste can also involve substantial initial capital expenditures, particularly for small to medium size businesses (in proportion to revenues). Other hazards are created in consumer environments: lead paint is often a source of poisoning of children in older housing units, sometimes the only affordable housing for lower income citizens, where there is insufficient abatement and failure to notify tenants of danger or possible exposure. Leaking or substandard underground storage tanks, or spills of oil, create groundwater contamination. Chemical contaminants, including metals (e.g., copper, zinc, cadmium, mercury), pesticides, and organic compounds like polynuclear aromatic compounds (PNAs) and polychlorinated biphenyls (PCBs) from a variety of sources affect both water and air. Management Objective: Reduce amounts of hazardous waste and hazardous materials potentiallysubject to release into the environment. Encourage waste recycling and other approaches to waste reduction. The Indicators: The hazardous material exposure indicators focus on both the generation of hazardous wastes and the disposition of several hazardous materials in the environment. Over the past year, MDE staff and members of the Maryland Environment 2000 (ME 2000) Steering Committee and the Controlled Hazardous Substances Advisory Council met a number of times to discuss the concerns raised by the public and stakeholder groups on the hazardous and toxic releases indicators in order to develop more meaningful ones or perhaps to merge them. In the end, the workgroup did not develop replacement indicators and agreed that until better ones could be developed, MDE should continue to report on both the hazardous waste generation and toxic releases indicators, with a caveat about stakeholder concerns.
36 Initial discussions focused on what the indicators should accomplish. The workgroup felt that the current hazardous waste indicator, which measures the total amount generated, does not take into account the actual disposition of the waste or the fact that increased production (economic activity) would result in an increase in the amount of waste generated. The workgroup members felt that hazardous waste, when properly managed, does not pose significant risk to public health or the environment; instead, risk resulted from improper disposal of wastes or transportation incidents associated with waste handling. Two purposes for the hazardous waste indicator were discussed: one was primarily educational and the other, more difficult, was to try to demonstrate actual risk. Since the public is concerned with hazardous waste which ends up in the wrong places, the workgroup felt there was some value in demonstrating what was actually done with the waste generated in the state and how businesses were complying with the regulations. However, the workgroup could not develop a way to measure those wastes that were disposed of illegally, which would pose the greatest risk. Therefore, the workgroup decided that the best place to look was where there were already sources of data which could be measured, such as that reported to the State or Federal environmental agencies. The best indicator the workgroup could imagine was one in which the amount of waste was compared to the amount of a product, so that an increase in production, where the wastes were properly handled, would not penalize a company because of the associated increase in waste. While this indicator is easily calculated for an individual generator with its own specific product (and in fact is sometimes used internally to help a company measure its own environmental performance), the workgroup could not find a way to normalize this number across industries. For example, the quarts of waste oil would increase with the number of oil changes a garage did, the amount of waste from fossil or nuclear plants increases with the amount of electricity produced, the amount of waste in a chemical manufacturing plant increases with the number of pounds produced, depending on the chemistry, just as the amount of trash a family has will change depending on the number of children or babies in the house. While these measurements are reflective of how changes in activity can affect changes in waste, they can only be used to effectively compare similar businesses to each other. The workgroup could not find a way to compare pounds of waste / pounds of product or per kilowatt hour, or per item processed, etc., and thereby use this as a statewide indicator. Additional possible indicators were discussed: Incidents (transportation or otherwise) involving hazardous waste: This data was not thought to be useful for an indicator on its own but could be linked with the amount of hazardous waste managed by Toxic Release Inventory (TRI) facilities as evidence that a great deal of waste is being handled without incident. Although there is one commercial hazardous waste treatment facility in Maryland, and a number of facilities have received permits to treat some of the hazardous waste they generate, the majority of hazardous wastes are transported out of state for final disposition (recycling, incineration or other treatment, or disposal in a landfill). TRI pollution prevention data: The group decided that this information was substantially covered by the existing indicator on toxic releases to the air. TRI numbers include releases to the land, air, water or to treatment facilities (on-site or off-site). Number of companies with pollution prevention plans, who participate in Businesses for the Bay, or who participated in the Reilly 33/50 program: The workgroup felt that there is not enough information to create a meaningful indicator. There was a great deal of discussion about pollution prevention and representatives from the companies present said that many pollution prevention efforts have economic benefits and have been done for years, without being specifically labeled as such. If available, this information would also be industry specific and not be a good statewide indicator. Amount of hazardous waste incinerated, landfilled or transferred off-site: An indicator of the disposition of hazardous wastes was proposed to show how wastes were being managed by the generators. This would take the categories of wastes already reported biennially by generators and split them into their disposal methods. This idea was rejected by the workgroup as being more educational in nature than a way to track performance. Per cent compliance with MDE regulations by generator ID# large/small: The workgroup discussed this proposal at length and decided that this measure would not be a useful indicator for the entire state. While the Department targets businesses with a history or suspicion (based on complaints) of non-compliance, this would not represent a total picture, and the generators
37 inspected would not be consistent from year to year. In a similar vein, the workgroup felt the current toxics releases indicator, which measures reported release of chemical contaminants, does not take into account releases that are not reported, changes in reporting requirements, or the fact that increased production would result in an increase in the amount of release. As with the hazardous waste indicator, numerous substitutes were discussed, but the workgroup could not develop a replacement indicator and agreed that until a better one could be developed, MDE should continue to report on this indicator, again with a caveat about stakeholder concerns.
38 INTRODUCTION PUBLIC HEALTH AIR QUALITY HAZARDOUS MATERIALS EXPOSURE Hazardous Waste Generated per Year Reported Exceedances of Lead Poisoning Standard Toxics Releases DRINKING WATER QUALITY WATER QUALITY (FISH AND SHELLFISH HARVESTING) Data/Graphs: Hazardous Waste Generated per Year Indicator Development and Data Responsibility: MDE's Hazardous Waste Program, Hazardous Waste Generated Annually Goal: Reduce the threat to public health from the presence of hazardous waste and hazardous materials in the environment. Indicator: Amount of hazardous waste generated in Maryland annually. Status: In 1995, 91,030 tons of hazardous waste were generated in the State. Maryland anticipates a decline in hazardous waste generation as the number of generators decreases and more pollution prevention technologies and systems are developed and implemented. Data for 1997 is currently being compiled by the U.S. EPA. Benchmark: Achieve continual decrease in aggregate amount of hazardous waste generated per year. PUBLIC INTERFACE

39 Hazardous Waste Generated Annually
40 INTRODUCTION PUBLIC HEALTH AIR QUALITY HAZARDOUS MATERIALS EXPOSURE Hazardous Waste Generated per Year Reported Exceedances of Lead Poisoning Standard Toxics Releases DRINKING WATER QUALITY WATER QUALITY (FISH AND SHELLFISH HARVESTING) PUBLIC INTERFACE Reported Exceedances of Lead Poisoning Standard Indicator Development and Data Responsibility: MDE's Environmental Lead Health Coordination Division, Data/Graphs: Percentage of Children Exceeding Lead Poisoning Standard Goal: Reduce the threat to public health from the presence of hazardous waste and hazardous materials in the environment. Indicator: Reported occurrences of lead poisoning as a percentage of the total tested population. Status: In 1996, there were 1,830 reported incidents of elevated blood-lead levels statewide (3.1% of the children screened exceeded the lead poisoning standard). In 1997, over 67,100 children 0-6 years of age were screened for lead poisoning (15.3% of all children aged 0-6 years in Maryland), and there were 1,233 reported occurrences of elevated blood-lead levels statewide (1.8% of the children screened exceeded the lead poisoning standard). The reduction of lead risk in housing program was fully implemented in February As more properties undergo lead hazard treatments, the number of detected cases is expected to diminish. Maryland seeks to ensure that 100% of properties that require lead paint hazard treatments are completed by the year Benchmark: No new occurrences of lead poisoning in children caused by lead-based paint.

41 Percentage of Children Screened Exceeding Lead Poisoning Standards
42 INTRODUCTION PUBLIC HEALTH AIR QUALITY Data/Graph: Toxics Releases Indicator Responsibility and Data Development: MDE's Emergency Planning and Right-to-Know Program, HAZARDOUS MATERIALS EXPOSURE Hazardous Waste Generated per Year Reported Exceedances of Lead Poisoning Standard Toxics Releases DRINKING WATER QUALITY WATER QUALITY (FISH AND SHELLFISH HARVESTING) PUBLIC INTERFACE Maryland Toxics Release Inventory, Goal: Improve and protect Maryland's water quality. Indicator: Toxics Release Inventory (TRI). Status: Maryland has achieved a 53% percent reduction in reported air and water emissions as of 1994 (including transfers to publicly owned wastewater treatment plants). Since TRI reporting requirements have changed over the years, these data have been edited to include only those chemicals and industries for which reporting was required in Land releases and off-site transfers increased dramatically in 1991 due to a change in reporting requirements to include materials sent off-site for recycling and energy recovery. The additional increase in was due to one-time transfers from two large facilities in Baltimore. Transfers are expected to return to 1992 levels in The majority of the materials transferred are recycled and reused. Benchmark: By 2000, Maryland's Chesapeake Bay Program goal is to achieve a 65% reduction of TRI chemicals into the environment from industries required to report in 1988.

43 Maryland Toxics Release Inventory, Air, Water & Land Releases
44 INTRODUCTION PUBLIC HEALTH AIR QUALITY HAZARDOUS MATERIALS EXPOSURE DRINKING WATER QUALITY Public Water Systems in Compliance Surface Water Supply Systems with Source Protection Programs Ground Water Systems with Wellhead Protection Programs Municipal Waste Landfills in compliance with Ground Water Standards Oil Contaminated Sites WATER QUALITY (FISH AND SHELLFISH HARVESTING) PUBLIC INTERFACE DRINKING WATER QUALITY Under federal and state laws and regulations, MDE is responsible for ensuring that all public drinking water systems throughout Maryland meet strict drinking water quality standards. A public drinking water system is a water system that serves at least 25 individuals year round. Approximately 4.3 million Marylanders are served by public drinking water systems. If the system serves less than 25 people on a regular basis, it is considered a private system. Private systems may consist of an individual well that serves one home or be shared by a few homes or businesses. Private wells serve approximately 900,000 Marylanders. Individual wells, which serve one lot or home, are regulated by local governments through delegation from MDE. MDE protects drinking water by implementing various programs that protect groundwater and surface water supplies from contaminants, establishes criteria for well construction, inspects facilities that treat and provide public drinking water, and assures compliance with all safe drinking water standards. Goal: Ensure safe drinking water. Stressors/Sources: The discharge of nutrients and contaminants from human activities to water bodies present risks. Changes in land use, for example: conversion of forested land into residential, commercial, or industrial-use land negatively effects water quality; in addition, the extension of suburban areas into the Piedmont, and Valley and Ridge provinces places greater stresses on downstream water supplies. Nutrients from human activities, on-site disposal and fertilizer, the affect of storm water runoff on agricultural and urban land within a watershe, along with the improper disposal of chemicals, spills and leaks from underground tanks, and leachate migration from landfills, and piped discharges, all pose direct threats to drinking water supplies. Naturally occuring mineral deposits, such as radon, radium, and arsenic, have also been identified in certain regions. Management Objective: The key management objectives under this goal are: (1) ensure compliance of public water systems with all federal and State requirements; (2) ensure that private wells used by Marylanders comply with state regulations; (3) prevent pollutant contamination of potable surface waters; (4) fully develop and implement source protection programs for all public drinking water systems that receive water from surface sources; (5) prevent contamination of potable groundwater aquifers that are vulnerable to underground hydrological transport mechanisms; (6) develop locally-based wellhead protection programs to ensure long-term viability of supply sources; (7) ensure that municipal landfills operate in significant compliance with all State and federal laws and standards; (8) ensure that permitted solid waste facilities are designed and operated in significant compliance with all applicable water pollution control requirements; (9) initiate and complete cleanups of sites impacted by discharge of oil or other hazardous substances; and (10) manage the State's water resources to ensure adequate quantity for the future. The Indicators: The indicators discussed here do not describe all sources of drinking water in Maryland, but they do provide information on public water systems which serve 4.3 million persons. Private wells provide water to approximately 900,000 Marylanders on a routine basis. The water from private wells is tested, and approved for use when a well is constructed. In addition, the welll construction requirements ensure that the quality of the water is protected for future use. Drinking Water Quality indicators focus on public water system data because it is readily available and represents trends in the water quality of smaller private wells. The Drinking Water Quality indicators focus on the percentage of all Marylanders who are currently served by public drinking water systems that receive water from systems that meet all applicable federal and state health standards (i.e., they are "in compliance"), the percentage of all
45 Marylanders who are currently served by public drinking water systems that receive water from vulnerable surface sources which have active source protection programs in place, and the number of municipal waste landfills in compliance with groundwater standards. Contamination of groundwater by oil is a public health concern primarily related to drinking water, so an indicator dealing with such sites is also included here.
46 INTRODUCTION PUBLIC HEALTH AIR QUALITY HAZARDOUS MATERIALS EXPOSURE DRINKING WATER QUALITY Public Water Systems in Compliance Surface Water Supply Systems with Source Protection Programs Ground Water Systems with Wellhead Protection Programs Municipal Waste Landfills in compliance with Ground Water Standards Data/Graphs: Public Water Systems in Compliance Indicator Development and Data Responsibility: MDE's Water Supply Program, Percent of Marylanders Served by Safe Water Number of Public Water Supply Systems Exceeding Public Health Standards Goal: Ensure safe drinking water. Indicator: Percentage of all Marylanders who are currently served by public drinking water systems that meet all applicable federal and state health standards (i.e., "in compliance"). Status: In Maryland, as in other states, water is provided to the public by a multitude of small systems. These systems serve relatively few people in contrast to those systems in larger metropolitan areas that each serve 50,000 or more. The seven largest systems in the state serve million, while the remaining 1,000 systems serve 860,000 customers. 74% of Maryland's water systems serve fewer than 500 persons. This explains why compliance rates are actually quite high -- 99% for all standards except for lead and copper, which is currently at 96.2%. The Lead and Copper Rule was a new rule in 1995, and treatment improvements are in progress. Benchmark: By year 2005, achieve a 99% compliance rate for the population served by the public water systems, and maintain that the level for all contaminants regulated prior to Oil Contaminated Sites WATER QUALITY (FISH AND SHELLFISH HARVESTING) PUBLIC INTERFACE

47 Percent of Marylanders Served by Safe Water Note: The percentages above are time weighted for bacteriological standards and surface water treatment rules. If a system's violation lasted for a full year then the total population served is shown is out of compliance. If a system had a violation for one month then 1/12th of the population served shown is out of compliance while 11/12th shown is in compliance.

48 Number of Public Water Supply Systems Exceeding Public Health Standards
49 INTRODUCTION PUBLIC HEALTH Data/Graph: Surface Water Supply Systems With Source Protection Programs Indicator Development and Data Responsibility: MDE's Water Supply Program, AIR QUALITY HAZARDOUS MATERIALS EXPOSURE DRINKING WATER QUALITY Public Water Systems in Compliance Surface Water Supply Systems with Source Protection Programs Ground Water Systems with Wellhead Protection Programs Municipal Waste Landfills in compliance with Ground Water Standards Number of Marylanders Served by Surface Systems with Source Protection Goal: Ensure safe drinking water. Indicator: Percentage of all Marylanders who are currently served by public drinking water systems that receive water from vulnerable surface sources which have active source protection programs in place. Status: Formal source protection programs are in place for three larger systems: the City of Baltimore, WSSC's Patuxent Supply, and the City of Cumberland. Comprehensive risk assessments are underway in all three systems concurrent with development of improved watershed management practices. Significant local participation has been key to program successes. Coordination with other agencies and other states has begun for other water system watersheds. Benchmark: By 2005, ensure that the 3.4 million Marylanders served by vulnerable surface water systems will have adequate protection. Oil Contaminated Sites WATER QUALITY (FISH AND SHELLFISH HARVESTING) PUBLIC INTERFACE

50 Number of Marylanders Served by Surface Systems with Source Protection
51 INTRODUCTION PUBLIC HEALTH Data/Graph: Ground Water Systems with Wellhead Protection Programs Indicator Development and Data Responsibility: MDE's Water Supply Program, AIR QUALITY HAZARDOUS MATERIALS EXPOSURE DRINKING WATER QUALITY Public Water Systems in Compliance Surface Water Supply Systems with Source Protection Programs Ground Water Systems with Wellhead Protection Programs Municipal Waste Landfills in compliance with Ground Water Standards Number of Marylanders Served by Ground Water Systems with Wellhead Protection Programs Goal: Ensure safe drinking water. Indicator: Percentage of all Marylanders who are currently served by public drinking water systems that receive water from vulnerable groundwater sources which have active wellhead protection programs in place. Status: Communities have shown interest in voluntary partnerships. The adoption of local codes is a lengthy process. About 80 communities are working with the State to achieve protection programs that include public outreach meetings and education, new construction planning and review, and investigation of potential contaminant sources. New grant funding under the Drinking Water State Revolving Loan Fund has enabled MDE to facilitate development of local programs. Benchmark: By 2005, establish active local programs that implement wellhead protection management practices for 182,000 Marylanders (or 66%) served by vulnerable sources. Oil Contaminated Sites WATER QUALITY (FISH AND SHELLFISH HARVESTING) PUBLIC INTERFACE

52 Marylanders Served by Ground Water Systems with Wellhead Protection Programs
53 INTRODUCTION PUBLIC HEALTH AIR QUALITY HAZARDOUS MATERIALS EXPOSURE DRINKING WATER QUALITY Public Water Systems in Compliance Surface Water Supply Systems with Source Protection Programs Ground Water Systems with Wellhead Protection Programs Data/Graph: Municipal Waste Landfills in Compliance With Ground Water Standards Indicator Development and Data Responsibility: MDE's Solid Waste Program, Landfills and Ground Water Standards Goal: Ensure safe drinking water. Indicator: Number of municipal waste landfills in compliance with ground water standards. Status: Between 1996 and 1998, the number of operating municipal waste landfills has declined from 26 to 22, while the number in compliance has grown from 18 (69% of operating landfills) to 21 (95% of operating landfills). Benchmark: By 2000, achieve 100% compliance with new EPA groundwater standards for landfills. Municipal Waste Landfills in compliance with Ground Water Standards Oil Contaminated Sites WATER QUALITY (FISH AND SHELLFISH HARVESTING) PUBLIC INTERFACE

54 Landfills and Ground Water Standards
55 INTRODUCTION PUBLIC HEALTH Data/Graph: Oil-Contaminated Sites Indicator Development and Data Responsibility: MDE's Oil Control Program, AIR QUALITY HAZARDOUS MATERIALS EXPOSURE DRINKING WATER QUALITY Public Water Systems in Compliance Surface Water Supply Systems with Source Protection Programs Percentage of Oil Contaminated Sites Cleaned Up Goal: Ensure safe drinking water. Indicator: Oil-contaminated sites remediated. Status: 13,977 sites have been remediated or are implementing long-term clean-up activities as of March ,384, or 46%, of the identified sites had been remediated by March Benchmark: By 2005, complete remediation of 85% of sites contaminated with oil. Ground Water Systems with Wellhead Protection Programs Municipal Waste Landfills in compliance with Ground Water Standards Oil Contaminated Sites WATER QUALITY (FISH AND SHELLFISH HARVESTING) PUBLIC INTERFACE

56 Percentage of Oil Contaminated Sites Cleaned Up Note: 2002 & Projected Remediation.
57 INTRODUCTION PUBLIC HEALTH AIR QUALITY HAZARDOUS MATERIALS EXPOSURE DRINKING WATER QUALITY WATER QUALITY (FISH AND SHELLFISH HARVESTING) Shellfish Harvesting Waters Maryland Waters Safe for Harvesting Finfish WATER QUALITY (FISH AND SHELLFISH HARVESTING) Shellfish strain water through their gills to trap microscopic plants and animals for food. If the water were contaminated with disease-causing bacteria or viruses, these could be consumed as food by shellfish. When eaten raw or partially cooked, these shellfish can make people sick. Assuring that oysters and clams are harvested only from areas that are safe and open to harvesting minimizes the risk of human illness. In shellfish waters approved for harvesting, harvesting is permitted any time. In conditionally approved areas, harvesting is permitted except for the three days following rain events greater than 1" in 24 hours. Run-off from such a rainfall event can carry potentially harmful bacteria into surface waters from adjacent land. Shellfish harvesting is not permitted at any time from restricted areas. Certain fish in contaminated waters can accumulate high enough levels of toxic substances that, when consumed frequently over a lifetime, may increase the consumers' risk of adverse health effects. In waters covered by a fish consumption advisory, fishermen and consumers are advised to limit their consumption of certain fish species. Goal: Ensure water is clean and safe for harvesting of fish and shellfish. PUBLIC INTERFACE Stressors/Sources: The presence of humans in a watershed increases the potential for an adverse impact to shellfish water quality from sewage treatment facilities and bypasses from sewage pumping stations, failing septic systems, increased development, and farm animal operations. Where sewage outfalls already exist, closed safety zones surrounding these outfalls are mandated and necessary to protect human health. In addition, past usage and inappropriate disposal of persistent organic substances have resulted in elevated levels of some hazardous substances in water bodies near major urban centers. Certain fish in these waters, due to their feeding habits, metabolic activity, age and fat content, may accumulate these substances to levels which may be harmful to people consuming them frequently throughout their lifetime. Current advisories are the result of contamination due to past use of Chlordane, which is now banned. Management Objective: Maximize availability of shellfish waters for commercial and recreational harvesting and minimize public health risk associated with finfish contaminated with harmful levels of toxic substances. The Indicators: The percentage of total shellfish harvesting acres that are approved (open), conditionally approved, restricted (closed), and the percentage of Maryland waters covered by fish consumption advisories.
58 INTRODUCTION PUBLIC HEALTH AIR QUALITY HAZARDOUS MATERIALS EXPOSURE DRINKING WATER QUALITY WATER QUALITY (FISH AND SHELLFISH HARVESTING) Shellfish Harvesting Waters Maryland Waters Safe for Harvesting Finfish Data/Graph: Shellfish Harvesting Waters Indicator Development and Data Responsibility: MDE's Environmental Risk Assessment Program, Acres of Conditionally Approved, Restricted, and Fully Approved Shellfish Harvesting Waters in Maryland Goal: Ensure water is clean and safe for harvesting of fish and shellfish. Indicator: Percentage of total shellfish harvesting acres that are approved (open), conditionally approved, restricted (closed). Status: In 1998: 1,067,057 acres approved (90.6%); 40,575 acres conditionally approved (3.4%) -- for a total of 94.0% approved; and 70,711 acres restricted (6.0%). Benchmark: Maintain current level of 94% approval of total shellfish harveting acres. PUBLIC INTERFACE

59 Acres of Conditionally Approved, Restricted, and Fully Approved Shellfish Harvesting Waters in Maryland
60 INTRODUCTION PUBLIC HEALTH Data/Graph: Maryland Waters Safe for Harvesting Finfish Indicator Development and Data Responsibility: MDE's Environmental Risk Assessment Program, AIR QUALITY HAZARDOUS MATERIALS EXPOSURE DRINKING WATER QUALITY WATER QUALITY (FISH AND SHELLFISH HARVESTING) Shellfish Harvesting Waters Maryland Waters Safe for Harvesting Finfish Fish Consumption Advisories in Maryland Waters, 1999 Goal: Ensure water is clean and safe for harvesting of fish and shellfish. Indicator: Percentage of Maryland waters covered by fish consumption advisories. Status: As of 1996, 0.8% of estuarine waters, 0.5% of lake waters, and none of Maryland's rivers and streams are covered by fish consumption advisories. Benchmark: Maintain percentage of waters covered by fish advisories below 1% of estuarine, lake, and fresh non-tidal streams. PUBLIC INTERFACE
61 Fish Consumption Advisories in Maryland Waters, 1999 Water Body Affected Species Area (sq. miles) Percent of Total Estuarine Waters Baltimore Harbor Channel Catfish, American Eel % Back River Channel Catfish, American Eel % Potomac River (DC to Maryland Point) Channel Catfish, American Eel, Carp % T o t a l % Lakes Lake Roland Black Crappie, Carp %
62 INTRODUCTION PUBLIC HEALTH WATER QUALITY - TIDAL AQUATIC SYSTEMS NON-TIDAL AQUATIC SYTEMS TERRESTRIAL SYSTEM DEGRADATION, FRAGMENTATION, ISOLATION CONSERVATION OF BIOLOGICAL DIVERSITY PUBLIC INTERFACE Maryland has substantial experience in evaluating the conditions of the State s biological resources. Through initiatives such as the multi-agency Chesapeake Bay Program and Maryland s Power Plant Research Program, state and federal agencies have accumulated a wealth of data for monitoring trends in resource conditions and for developing management recommendations based on this abundance of scientifically credible data. Ecosystems are hierarchical in nature. They exist at many levels and can be described at many scales. To attempt to evaluate ecosystem health therefore requires a multidimensional approach that includes indicators of attributes from multiple levels from the individual organism to populations to assemblages of species. Indicators which measure human impacts in ecosystems must also be recognized within such a hierarchy. An ecosystem approach to management is now being recognized as important at all levels of government and in the educational and private sectors. Approaches for evaluating trends in ecosystem health are being developed and tested at varying scales and locations throughout the United States, including Maryland. Issues of data availability and accessibility are also being confronted and resolved with the advent of new technologies and methodologies, such as remote sensing, geographic information systems and global positioning systems. An ecosystem approach to management also requires a major commitment to a broad spectrum of scientific activities in inventory, assessment, and monitoring. A greater understanding of abiotic and biological processes is particularly important, including water cycle processes, sediment erosiontransport-deposition, geobiochemical processes (nitrate cycle, nutrient and toxics cycling), and human impacts on these processes. In an effort to improve our indicators, Maryland is developing and evaluating new approaches to monitoring the health of the State s ecosystems. These new approaches share one or more of the following approaches: Movement toward composite indicators Movement toward landscape indicators Movement toward indicators contributing to ecological risk assessments Movement toward accessible information on ecosystem health The ecosystem health information presented here was compiled and assembled according to conventional science and the best available data at the time of indicator development. The data are legitimate and meaningful. However, our understanding of ecosystem health is improving and as it does, the State needs to be prepared to develop the new information bases and tools that will enable us to accurately assess conditions. EnPA establishes a framework for refinement of existing and the further development of new indicators. In the long term these new indicators are at least as important, if not more so, than the indicators for which we have collected data in the past. It is imperative for ecosystem recovery and sustainability that we pursue their development.
63 INTRODUCTION PUBLIC HEALTH WATER QUALITY - ECOSYSTEM HEALTH Designated Uses of Surface Waters Dissolved Oxygen and Water Quality Impairment Nutrient Inputs to Mainstem and Tributary Waters Cropland Acres Under Nutrient Management Plans Phosphorus Concentration in Maryland's Chesapeake Bay Nitrogen Concentration in Maryland's Chesapeake Bay Atmospheric Nitrogen Loading Cropland Acres Under Integrated Pest Management TIDAL AQUATIC SYSTEMS NON-TIDAL AQUATIC SYTEMS TERRESTRIAL SYSTEM DEGRADATION, FRAGMENTATION, ISOLATION CONSERVATION OF BIOLOGICAL DIVERSITY PUBLIC INTERFACE WATER QUALITY - Maryland's water quality standards provide that surface waters should be protected for basic water uses such as water contact recreation, fishing, support of balanced and diverse populations of aquatic plants, animals and wildlife, and use as an agricultural and industrial water supply. For some defined uses, like trout fishing, shellfish harvesting and public water supplies, water quality conditions must be even higher. Waters that do not meet their designated uses represent a loss of a common resource that could result in economic and societal impacts and threaten human and ecosystem health. Over the past 25 years, since passage of the landmark Federal clean water legislation, developing science has pointed more and more to the nutrients nitrogen and phosphorus as the pollutants of primary concern for the Chesapeake Bay system. This concern is based upon nutrient enrichment's broad ecological impacts more than on the public health issues associated with earliest pollution abatement efforts. Excessive nutrient loading causes rapid, uncontrolled growth of algae in surface water. These algal blooms cloud the water and block sunlight, which causes Bay grasses to die. When algae die and sink to the bottom water, decomposition of the resulting organic matter uses oxygen; if too much oxygen is used for decomposition, oxygen levels drop to the point that living resources are stressed or excluded. In yet another insult to water quality, chemical contaminants compromise the immune system of Bay organisms, cause cancer in aquatic organisms, harm marine life, and affect the Bay's food web. Goals: Improve and protect quality of surface waters Reduce or eliminate the discharge of chemical contaminants from all controllable sources Stressors/Sources: Nutrients and bacteria from point and nonpoint source pollution affect portions of the State's surface waters. In some areas of the State, acidic waters from abandoned mines and atmospheric deposition, as well as toxic substances in urban watersheds and sediments may affect aquatic life and limit uses of these waters. Chemical contaminants enter the Bay from point sources, nonpoint sources and the atmosphere. Since passage of the 1972 Clean Water Act, great strides have been made in reducing or eliminating the discharge of pollutants from industries and municipal wastewater treatment systems-point sources of pollution to the Bay and its tributary rivers. An estimated 55-74% of nutrient inputs to the Bay system are contributed by non-point sources, including contaminated run-off from urban areas, run-off from agricultural land uses, nutrient-enriched ground water, and deposition from the atmosphere. These sources are more complex and more difficult to control than point sources Management Objectives: The Department of the Environment (MDE) implements a diversity of regulatory and planning programs to reduce the input of pollutants to surface and ground waters of the State. Reduction of nutrients from both point- and non-point sources is the focus of the permit requirements, along with control of bacterial pollution from sewage treatment plants and toxic materials from any source. The Department of Agriculture (MDA) also implements a number of water quality programs to reduce nutrient movement to ground and surface waters from agricultural activities. In 1998 MDA's Nutrient Management Programs changed from voluntary to regulatory. DNR relies on a network of programs with state and local partners to prevent and reduce non-point source pollution; it also supports the State's participation in the multi-state cooperative Chesapeake Bay Program, which has set as a target a 40% reduction of nutrient inputs from controllable sources by the year The primary tools available to DNR to apply to achieving these goals are essentially nonregulatory and focus on increasing the extent of riparian forest, providing grants to State and local
64 agencies, working with the boating community and implementing shore erosion control. A related objective of the Department's is to improve the information available to support decision-making and track the progress of the various programs, through activities such as monitoring and modeling. The Indicators: The indicators that follow reflect the current emphasis on protecting living resources in aquatic systems, particularly in the Chesapeake Bay. The focus is thus heavily on the nutrients nitrogen and phosphorus and the relationship between these and dissolved oxygen. One point of interest in examining these indicators is the difference apparent when data are aggregated at the statewide or large region level, such as overall loadings of nitrogen and phosphorus to the Chesapeake Bay system, and the variable situation found in similar data when their geographic distribution is displayed, as in the nitrogen and phosphorus concentration information, which is mapped for different points in the Bay and its tributaries. Two of the indicators deal more with programmatic response to environmental conditions than with the conditions themselves-nutrient management plans and integrated pest management are measures used by farmers to improve water quality. (It should be noted that the status and trends depicted in the indicator for nutrient management plan implementation will change to reflect the transition of the program from voluntary to regulatory.)
65 INTRODUCTION PUBLIC HEALTH WATER QUALITY - ECOSYSTEM HEALTH Designated Uses of Surface Waters Dissolved Oxygen and Water Quality Impairment Nutrient Inputs to Mainstem and Tributary Waters Cropland Acres Under Nutrient Management Plans Data/Graph: Designated Uses of Surface Waters Indicator development and data responsibility: DNR, Tidewater Ecosystem Assessment Division, Waters Meeting Designated Uses Goal: Improve and protect surface water quality. Indicator: Extent to which "designated uses" of Maryland surface waters are being met. Designated uses are established as part of water quality standards adopted the Federal Clean Water Act. Status: Of the 8,842 miles of Maryland's rivers and streams identified for assessment, 67 percent fully support their designated uses; less than five percent of these waters do not fully support their uses while the status of the 29 percent of remaining waters is unknown. Of the 2,522 square miles of estuarine waters, nearly half (49 percent) fully support their designated uses and another half (49 percent) do not fully support their uses; the status of the remaining two percent is unknown. Of the 21,010 acres of lakes that are tracked in Maryland, 37 percent fully support their designated uses; 63 percent partially support their use. The support status of waters that are not directly monitored is listed as unknown. Benchmark: Meet 100% of designated uses in all waters of the State. Phosphorus Concentration in Maryland's Chesapeake Bay Nitrogen Concentration in Maryland's Chesapeake Bay Atmospheric Nitrogen Loading Cropland Acres Under Integrated Pest Management TIDAL AQUATIC SYSTEMS NON-TIDAL AQUATIC SYTEMS TERRESTRIAL SYSTEM DEGRADATION, FRAGMENTATION, ISOLATION CONSERVATION OF BIOLOGICAL DIVERSITY PUBLIC INTERFACE

66 Waters Meeting Designated Uses
67 INTRODUCTION PUBLIC HEALTH WATER QUALITY - ECOSYSTEM HEALTH Designated Uses of Surface Waters Dissolved Oxygen and Water Quality Impairment Nutrient Inputs to Mainstem and Tributary Waters Data/Graph: Dissolved Oxygen and Water Quality Impairment Indicator development and data responsibility: DNR, Tidewater Ecosystem Assessment Division, Low Dissolved Oxygen and Water Quality Impairment Goal: Improve and protect quality of surface waters. Indicator: Extent to which dissolved oxygen levels below 5 mg/l (Maryland's water quality criteria) contribute to waters' not meeting designated uses. Status: Of the waters in Maryland that do not fully support designated uses, low dissolved oxygen levels contribute to the impaired water status in 49.4% percent of the State's impaired river miles, 87.2% percent of the State's impaired estuarine waters and 98.5% percent of the State's impaired lake waters. Draft Benchmark: Achieved dissolved oxygen water quality standard of 5 mg/l or better in all State waters. Cropland Acres Under Nutrient Management Plans Phosphorus Concentration in Maryland's Chesapeake Bay Nitrogen Concentration in Maryland's Chesapeake Bay Atmospheric Nitrogen Loading Cropland Acres Under Integrated Pest Management TIDAL AQUATIC SYSTEMS NON-TIDAL AQUATIC SYTEMS TERRESTRIAL SYSTEM DEGRADATION, FRAGMENTATION, ISOLATION CONSERVATION OF BIOLOGICAL DIVERSITY PUBLIC INTERFACE

68 Low Dissolved Oxygen and Water Quality Impairment
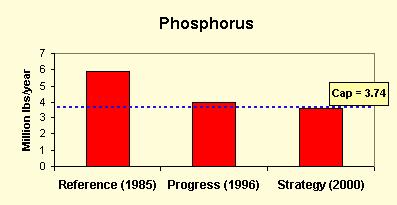
69 INTRODUCTION PUBLIC HEALTH Data/Graphs: Nutrient Inputs to Mainstem and Tributary Waters Indicator Development and Data Responsibility: DNR, Watershed Management and Analysis, Nitrogen Loads Phosphorus Loads WATER QUALITY - ECOSYSTEM HEALTH Designated Uses of Surface Waters Dissolved Oxygen and Water Quality Impairment Nutrient Inputs to Mainstem and Tributary Waters Cropland Acres Under Nutrient Management Plans Phosphorus Concentration in Maryland's Chesapeake Bay Nitrogen Concentration in Maryland's Chesapeake Bay Goal: Improve and protect quality of surface waters. Indicator: Total nitrogen and phosphorus loads to the Chesapeake Bay as measured through Tributary Strategies implementation tracking, the 1997 (phase 4) Watershed model of the multi-state Chesapeake Bay Program, and DNR's Integrated Watershed Analysis and Management System (IWAMS). Nutrient loads come from both point and nonpoint sources. Nonpoint sources include agriculture, developed land, septic tanks, forest lands and atmospheric sources. The controllable part of the nutrient load is the part caused by man's activities, including wastewater treatment discharges and both polluted runoff and groundwater from agricultural and developed lands. The controllable loads can be reduced through the implementation of identified "best management practices." Reductions due to air pollution controls, however, are currently not counted towards the attainment of the 40% reduction goal. Status: A combination of voluntary and regulatory programs has reduced nitrogen by 17 million pounds and phosphorus by 1.9 million pounds from 1985 to The existing goal, or "cap," needs to be reevaluated. In response to a 1997 Directive of the Executive Council of the Chesapeake Bay Program, new maximum loading goals to the Bay may be established. Benchmark: By the year 2000, achieve a 40% reduction in controllable nutrient inputs from 1985 levels. Atmospheric Nitrogen Loading Cropland Acres Under Integrated Pest Management TIDAL AQUATIC SYSTEMS NON-TIDAL AQUATIC SYTEMS TERRESTRIAL SYSTEM DEGRADATION, FRAGMENTATION, ISOLATION CONSERVATION OF BIOLOGICAL DIVERSITY PUBLIC INTERFACE

70
71
72 INTRODUCTION PUBLIC HEALTH WATER QUALITY - ECOSYSTEM HEALTH Designated Uses of Surface Waters Dissolved Oxygen and Water Quality Impairment Nutrient Inputs to Mainstem and Tributary Waters Cropland Acres Under Nutrient Management Plans Data/Graph: Cropland Acres Under Nutrient Management Plans Indicator development and data responsibility: MDA Nutrient Management Program 410/ Cropland Acres Under Nutrient Management Plans Goal: Improve and protect the water quality of the Chesapeake Bay. Indicator: Agricultural practices are responsible for a large portion of the nutrient pollution loads to Maryland waterways, including the Chesapeake Bay. Nutrient management plans are comprehensive plans for efficient use of nutrients from all sources - commercial fertilizer, animal manure, sewage sludge, and past crops. The plans almost always improve the farmer's profits and may lead to reductions in nutrient pollution loads to waterways. Status: Between 1989 and 1998, nutrient management plans were developed for over 1.1 million acres of agricultural cropland in the state. (As noted in the introduction, above, the status and trends depicted in this indicator in the future will change from what is presented here, to reflect the transition of the program from voluntary to regulatory.) Benchmark: By 2000, implement nutrient management plans for million acres. Acreage goals for nutrient management are included in the tributary nutrient reducation strategies. Phosphorus Concentration in Maryland's Chesapeake Bay Nitrogen Concentration in Maryland's Chesapeake Bay Atmospheric Nitrogen Loading Cropland Acres Under Integrated Pest Management TIDAL AQUATIC SYSTEMS NON-TIDAL AQUATIC SYTEMS TERRESTRIAL SYSTEM DEGRADATION, FRAGMENTATION, ISOLATION CONSERVATION OF BIOLOGICAL DIVERSITY PUBLIC INTERFACE

73 Cropland Acres Under Nutrient Management Plans
74 INTRODUCTION PUBLIC HEALTH Data/Graph: Phosphorus Concentration In Maryland's Chesapeake Bay Indicator development and data responsibility: DNR, Tidewater Ecosystem Assessment Division, Status and Trends of Phosphorus Concentration in the Maryland Portion of the Chesapeake Bay WATER QUALITY - ECOSYSTEM HEALTH Designated Uses of Surface Waters Dissolved Oxygen and Water Quality Impairment Nutrient Inputs to Mainstem and Tributary Waters Cropland Acres Under Nutrient Management Plans Goal: Improve and protect quality of surface waters. Indicator: Unfortunately, there are no scientifically established goals for "good" and "poor" levels of phosphorus to use for assessing the current conditions (status). Instead, a benchmark scale was developed using Bay-wide data from for use as a relative scale for each salinity zone (tidal fresh, oligohaline and mesohaline). Each station is scored based on this relative scale and the score is used to categorize the water quality as"good" (lowest concentrations), "fair" (moderate concentrations), and "poor" (high concentrations). Status: Phosphorus concentrations ( ) are relatively fair to good in most parts of the Maryland Bay with the exception of Back River. Phosphorus concentrations ( ) are improving in many areas, but are still degrading in the Potomac, Bush, and lower mainstem. Benchmark: Benchmark is under development by the Chesapeake Bay Program. Phosphorus Concentration in Maryland's Chesapeake Bay Nitrogen Concentration in Maryland's Chesapeake Bay Atmospheric Nitrogen Loading Cropland Acres Under Integrated Pest Management TIDAL AQUATIC SYSTEMS NON-TIDAL AQUATIC SYTEMS TERRESTRIAL SYSTEM DEGRADATION, FRAGMENTATION, ISOLATION CONSERVATION OF BIOLOGICAL DIVERSITY PUBLIC INTERFACE

75 Status and Trends of Phosphorus Concentration in the Maryland Portion of the Chesapeake Bay
76 INTRODUCTION PUBLIC HEALTH Data/Graph: Nitrogen Concentration in Maryland's Chesapeake Bay Indicator development and data responsibility: DNR, Tidewater Ecosystem Assessment Division, Status and Trends of Nitrogen Concentration in the Maryland Portion of the Chesapeake Bay WATER QUALITY - ECOSYSTEM HEALTH Designated Uses of Surface Waters Dissolved Oxygen and Water Quality Impairment Nutrient Inputs to Mainstem and Tributary Waters Cropland Acres Under Nutrient Management Plans Phosphorus Concentration in Maryland's Chesapeake Bay Goal: Improve and protect quality of surface waters. Indicator: Unfortunately, there are no scientifically established goals for "good" and "poor" levels of nitrogen to use for assessing the current conditions (status). Instead, a benchmark scale was developed using Bay-wide data from for use as a relative scale for each salinity zone (tidal fresh, oligohaline and mesohaline). Each station is scored based on this relative scale and the score is used to categorize the water quality as"good" (lowest concentrations), "fair" (moderate concentrations), and "poor" (high concentrations). Status: Nitrogen concentrations ( ) are relatively fair to good in most parts of the Maryland Bay; exceptions are the Back, Patapsco,Chester, Nanticoke, Wicomico Rivers and Pocomoke Sound. Nitrogen concentrations ( ) are improving in some Western Shore tributaries, but are degrading (increasing) in many areas of the Eastern Shore. Benchmark: Benchmark is under development by the Chesapeake Bay Program. Nitrogen Concentration in Maryland's Chesapeake Bay Atmospheric Nitrogen Loading Cropland Acres Under Integrated Pest Management TIDAL AQUATIC SYSTEMS NON-TIDAL AQUATIC SYTEMS TERRESTRIAL SYSTEM DEGRADATION, FRAGMENTATION, ISOLATION CONSERVATION OF BIOLOGICAL DIVERSITY PUBLIC INTERFACE

77 Status and Trends of Nitrogen Concentration in the Maryland Portion of the Chesapeake Bay
78 INTRODUCTION PUBLIC HEALTH Data/Graphs: Atmospheric Nitrogen Loading Indicator development and data responsibility: MDE, Air Quality Program, Overall Nitrogen Sources to the Bay Atmospheric NOx Deposition to the Bay WATER QUALITY - ECOSYSTEM HEALTH Designated Uses of Surface Waters Dissolved Oxygen and Water Quality Impairment Nutrient Inputs to Mainstem and Tributary Waters Cropland Acres Under Nutrient Management Plans Goal: Improve and protect the water quality of the Chesapeake Bay. Indicator: Nitrogen oxides are largely formed as a result of combustion processes. Emission sources include vehicles, utilities, industries. Approximately 75% of the atmospheric nitrogen deposition reaching the Chesapeake Bay and its watershed originates from emission sources located within the designated Chesapeake Bay airshed. The EPA estimates that the remaining 25% originates from emission sources outside the airshed. Approximately 40% of the deposition originates from sources within Maryland, Pennsylvania, Virginia, and the District of Columbia. Status: Atmospheric nitrogen currently is responsible for approximately 27% of the nitrogen reaching the Chesapeake Bay. Benchmark: No specific benchmarks have been established for atmospheric nitrogen reductions; they await results from the Air Subcommittee of the Chesapeake Bay Program. Phosphorus Concentration in Maryland's Chesapeake Bay Nitrogen Concentration in Maryland's Chesapeake Bay Atmospheric Nitrogen Loading Cropland Acres Under Integrated Pest Management TIDAL AQUATIC SYSTEMS NON-TIDAL AQUATIC SYTEMS TERRESTRIAL SYSTEM DEGRADATION, FRAGMENTATION, ISOLATION CONSERVATION OF BIOLOGICAL DIVERSITY PUBLIC INTERFACE

79 Overall Nitrogen Sources to the Bay

80 Atmospheric NOx Deposition to the Bay
81 INTRODUCTION PUBLIC HEALTH WATER QUALITY - ECOSYSTEM HEALTH Designated Uses of Surface Waters Dissolved Oxygen and Water Quality Impairment Nutrient Inputs to Mainstem and Tributary Waters Cropland Acres Under Nutrient Management Plans Phosphorus Concentration in Maryland's Chesapeake Bay Nitrogen Concentration in Maryland's Chesapeake Bay Data/Graph: Cropland Acres Under Integrated Pest Management (IPM) Indicator development and data responsibility: Chesapeake Bay Program Office, Cropland Acres Under IPM Goal: Establish voluntary Integrated Pest Management (IPM) practices on the Chesapeake Bay watershed. Indicator: IPM practices include measures that could allow farmers and landscapers to reduce the use of pesticides and may lead to reductions in the amounts of pesticides entering waterways. The indicator here tracks only "scouting," the regular monitoring of crops to determine if and when treatments are neededbased on biological and/or aesthetic thresholds-to keep pest numbers low enough to prevent intolerable damage or annoyance. Several other IPM practices are currently being tracked, however those practices are not reflected in this indicator since they have not been previously tracked. The other practices include: adjusting crop row spacing, crop rotation, adjusting planting and harvest dates, soil testing to identify pest problems, cleaning equipment, calibrating sprayer, using spot treatments, considering weather forecasts prior to spraying, rotating mode of action (e.g., type of pesticide used) to suppress resistance. Status: In 1997, IPM practices were used on over 1.3 million acres of agricultural cropland in the state. There are 1.62 million acres of cropland in the state, therefore, voluntary IPM practices had been established on 80% in The benchmark has been achieved. Benchmark: By 2000, establish voluntary integrated pest management practices on 75% (1.215 million acres) of cropland in the state. Atmospheric Nitrogen Loading Cropland Acres Under Integrated Pest Management TIDAL AQUATIC SYSTEMS NON-TIDAL AQUATIC SYTEMS TERRESTRIAL SYSTEM DEGRADATION, FRAGMENTATION, ISOLATION CONSERVATION OF BIOLOGICAL DIVERSITY PUBLIC INTERFACE

82 Cropland Acres Under Integrated Pest Management
83 INTRODUCTION PUBLIC HEALTH WATER QUALITY - TIDAL AQUATIC SYSTEMS Submerged Aquatic Vegetation Habitat Quality Acres of Submerged Aquatic Vegetation Benthic Index of Biotic Integrity - Chesapeake Bay Fish Index of Biotic Integrity - Estuarine Striped Bass Juvenile Index American Shad Population Blue Crab Population Seed Oyster Production NON-TIDAL AQUATIC SYTEMS TERRESTRIAL SYSTEM DEGRADATION, FRAGMENTATION, ISOLATION CONSERVATION OF BIOLOGICAL DIVERSITY PUBLIC INTERFACE TIDAL AQUATIC SYSTEMS Tidal aquatic systems include the entire range of plants and animals found in a water environment subject to the ebb and flow of the tide. The living organisms are dependent on the physical and chemical characteristics of their habitats as well as upon interactions among the biological elements of the system. Living organisms include plants, such as algae and the Bay grasses referred to as SAV that provide food and protective cover for many species; benthic, or bottom-dwelling, organisms; and animals which move freely through the water. The tidal system includes animals necessary in the food chain of higher levels of animals, as well as the fish, shellfish and crustaceans which play such an important part in Maryland's image and help to support its economy. Health of tidal aquatic systems depends upon successful functioning of all of these components in physically and chemically supportive habitats. Ecological processes are of concern in dealing with entire systems, not just the individual component species: flows of energy and cycling of materials are sustaining ecological processes; biological processes of reproduction, growth and decay must be supported in suitable habitats; predator-prey relationships between species need to be in balance. Goals Conserve natural ecological communities (whole groups of biological species) Maintain viable populations of native species Maintain natural evolutionary and ecological processes Ensure adequate protection of Maryland's valuable wetland resources Stressors/Sources: Tidal aquatic systems are degraded chemically by the input of various pollutants, including organic materials and nutrients from industries and sewage treatment plants (points), and from non-point sources like urban and farm run-off and atmospheric deposition. Toxic materials from a variety of sources may also affect aquatic organisms. These aquatic systems are altered or degraded physically by erosion and efforts to control erosion, by sedimentation, temperature and salinity changes, dredging, filling and channel modifications. Some of these impacts are naturally occurring; some are due entirely to human activity; most are aggravated by human activities. Biological degradation occurs when the effects of chemical and physical degradation, and in some cases harvesting by humans or attack by disease organisms, interact with the living species present in the system, affecting some directly and impacting others through changes to the overall community composition or interference with ecological processes. High nutrient levels have been identified as the major water quality problem causing degradation of tidal aquatic systems in Maryland. They cause algal blooms (cloudy water resulting from excessive microscopic plant growth)and epiphytic growth (small plants that grow on the SAV) which harm SAV by reducing the amount of light reaching the plants. Epiphytic growth also aggravate mechanical stress on the SAV, contributing to breakage under wave action. And as the algae decay, they use dissolved oxygen in the water, stressing or outright killing necessary benthic organisms and other desirable species. Changes in the landscape, like increasing urban development and additions to the transportation system, often accelerate nutrient and toxics delivery to aquatic habitats and lead to physical degradation as well. For example, urban landscapes without adequate ground cover lack nutrient retention capacity and contribute excess nutrients downstream. Particularly important are the increases in hydraulic efficiency provided by paving large areas and providing storm sewers and ditches to speed the movement of water, and associated nutrients and contaminants, away from buildings or other human use areas. Activities on the land also cause increased inputs of sediment, further clouding the water and affecting light penetration; sedimentation also can blanket the bottom, affecting bottom-dwelling organisms and the habitat necessary to support them.
84 Desirable food species, including shad, crabs and striped bass, are or have been stressed at times by overharvesting; in some cases their reproduction has been affected by landscape change, while alterations in plant composition has disrupted the food supply, particularly for filter-feeders. Oysters, important to water quality in their role as filter-feeders as well as to the economy, have been severely hurt in recent years by the parasites MSX and Dermo and can be affected by salinity levels in the Bay. These, in turn, may vary with weather conditions, clearly outside the reach of any of the State's management programs. Management Objectives: While the Maryland Department of Environment's management objectives are directed primarily toward regulating human activities to reduce the input of pollutants to aquatic systems, DNR's management objectives focus on three different types of activities. First is improving the scientific basis for decision-making, through activities like monitoring water quality and living resources and developing models of probable responses to intervention. The Department also works to protect and restore habitat for various living resources species through physical interventions like planting Bay grasses or moving oyster shell to provide appropriate bottom conditions for oyster development. Finally, both recreational and commercial fishing are regulated, based on estimates of species populations and monitoring of their health and reproduction. Cooperation in the inter-governmental Chesapeake Bay Program and other inter-agency cooperative efforts is an important element in DNR's work toward these objectives. The Indicators: The indicators of tidal aquatic system health which follow were chosen in part because of the availability of the data necessary to support them. They essentially describe the condition of the system. Although they do not describe the entire system, they do include important components of it, and they both reflect the results of past management interventions and point to the need for additional attention. Note that chemical water quality indicators (largely stressors in themselves) are treated separately in another section, although they are clearly of great significance in influencing the indicators that follow. There is always some element of judgment required in assigning particular indicators to particular broad themes-this is a reflection of the interconnectedness of elements when we deal with ecosystems. Some of the living resource indicators described below may, in other DNR applications, appear associated with other themes with which DNR programs deal. For a statewide picture of the overall health of Maryland's environment, however, they are also appropriate for inclusion below as indicators of Tidal Aquatic System health.
85 INTRODUCTION PUBLIC HEALTH WATER QUALITY - Data/Graph: Submerged Aquatic Vegetation Habitat Quality Indicator Development and Data Responsibility: DNR, Tidewater Ecosystem Assessment Division, Submerged Aquatic Vegetation Habitat Quality Goal: Improve and protect quality of surface waters. TIDAL AQUATIC SYSTEMS Submerged Aquatic Vegetation Habitat Quality Acres of Submerged Aquatic Vegetation Benthic Index of Biotic Integrity - Chesapeake Bay Indicator: SAV habitat quality status based a composite of available light, suspended solids, algae, dissolved inorganic nitrogen and phosphorus. This indicator identifies areas providing adequate habitat to 1 meter depth for SAV. Status: Over the period , 62% of Maryland Chesapeake Bay segments have at least marginal (borderline) SAV habitat quality. Benchmark: Achieve adequate SAV habitat quality for all Maryland Chesapeake Bay tidal waters. Fish Index of Biotic Integrity - Estuarine Striped Bass Juvenile Index American Shad Population Blue Crab Population Seed Oyster Production NON-TIDAL AQUATIC SYTEMS TERRESTRIAL SYSTEM DEGRADATION, FRAGMENTATION, ISOLATION CONSERVATION OF BIOLOGICAL DIVERSITY PUBLIC INTERFACE

86 SAV Habitat Quality
87 INTRODUCTION PUBLIC HEALTH Data/Graph: Acres of Submerged Aquatic Vegetation Indicator Development and Data Responsibility: DNR, Tidewater Ecosystem Assessment Division, WATER QUALITY - Acres of Submerged Aquatic Vegetation Goal: Conserve natural ecological communities and maintain viable populations of native species. Indicator: Acres of submerged aquatic vegetation TIDAL AQUATIC SYSTEMS Submerged Aquatic Vegetation Habitat Quality Acres of Submerged Aquatic Vegetation Benthic Index of Biotic Integrity - Chesapeake Bay Status: Approximately 49% of the Tier 1 benchmark was achieved in The tier 1 benchmark of approximately 62,000 acres represents the area inhabited by SAV from 1971 to Tier 2 represents SAV restoration to a depth of one meter in all suitable areas. Tier 3 represents restoration to a depth of two meters in all suitable areas. Benchmark: By 2005, increase submerged aqautic vegetation (SAV) coverage in Maryland to approximately 61,700 acres. Fish Index of Biotic Integrity - Estuarine Striped Bass Juvenile Index American Shad Population Blue Crab Population Seed Oyster Production NON-TIDAL AQUATIC SYTEMS TERRESTRIAL SYSTEM DEGRADATION, FRAGMENTATION, ISOLATION CONSERVATION OF BIOLOGICAL DIVERSITY PUBLIC INTERFACE

88 AAcres offsav
89 INTRODUCTION PUBLIC HEALTH WATER QUALITY - TIDAL AQUATIC SYSTEMS Submerged Aquatic Vegetation Habitat Quality Acres of Submerged Aquatic Vegetation Benthic Index of Biotic Integrity - Chesapeake Bay Fish Index of Biotic Integrity - Estuarine Striped Bass Juvenile Index American Shad Population Blue Crab Population Data/Graph: Benthic Index of Biotic Integrity-Chesapeake Bay Indicator Development and Data Responsibility: DNR, Tidewater Ecosystem Assessment Division, Percentage of Total Area Meeting Benthic Community Restoration Goals Goal: Conserve natural ecological communities and maintain viable populations of native species. Indicator: Benthic communities from various places around the Bay are evaluated on measures of species diversity, species composition, productivity, and trophic composition. For each benthic community, a numeric rating is assigned for each attribute based on whether the community approximates (a score of 5), deviates slightly from (a score of 3) or deviates strongly from (a score of 1) a goal comprised of the characteristics of the attribute at reference sites. These are then averaged to determine the overall score used to classify the benthic community at a site. Scores within each of six regions are used to determine the percent of the region's area that meets the Restoration Goals. Status: Status is assessed for six regions of the Maryland portion of the Bay. In 1997, the percent of total area which met Goals was: Upper Bay, 75%; Mainstem (except the deep trench), 56%; Potomac River, 26%; Patuxent River, 72%; Upper Western Tributaries, 52%; Eastern Tributaries, 84%. Benchmark: Meet community restoration goals in 100% of area of Bay and tributaries. Seed Oyster Production NON-TIDAL AQUATIC SYTEMS TERRESTRIAL SYSTEM DEGRADATION, FRAGMENTATION, ISOLATION CONSERVATION OF BIOLOGICAL DIVERSITY PUBLIC INTERFACE

90 Benthic Communities in the Chesapeake Bay
91 INTRODUCTION PUBLIC HEALTH WATER QUALITY - TIDAL AQUATIC SYSTEMS Submerged Aquatic Vegetation Habitat Quality Acres of Submerged Aquatic Vegetation Data/Graph: Fish Index of Biotic Integrity-Estuarine Indicator Development and Data Responsibility: DNR, Tidewater Ecosystem Assessment, Estuarine Fish Community Index of Biotic Integrity Goal: Conserve natural ecological communities. Indicator: Estuarine Fish Community Index of Biotic Integrity. The Estuarine Fish Index of Biotic Integrity (IBI) score represents a composite index that accounts for the total number of species, number of species that comprise 90%, number of species captured in the bottom trawl, total abundance with menhaden removed, abundance of estuarine fish, abundance of anadromous fish, proportion of planktivores, proportion of carnivores and proportion of benthivores. Status: Only four of the thirteen tributaries sampled meet reference standards. Benchmark: Achieve reference consitions in all sampled tributaries. Benthic Index of Biotic Integrity - Chesapeake Bay Fish Index of Biotic Integrity - Estuarine Striped Bass Juvenile Index American Shad Population Blue Crab Population Seed Oyster Production NON-TIDAL AQUATIC SYTEMS TERRESTRIAL SYSTEM DEGRADATION, FRAGMENTATION, ISOLATION CONSERVATION OF BIOLOGICAL DIVERSITY PUBLIC INTERFACE

92 Estuarine Fish Community Index of Biotic Integrity Fish community indicators for Chesapeake Bay tidal tributaries sampled between 1989 and IBI scores were averaged to get an overall rating for each tributary.
93 INTRODUCTION PUBLIC HEALTH WATER QUALITY - TIDAL AQUATIC SYSTEMS Submerged Aquatic Vegetation Habitat Quality Acres of Submerged Aquatic Vegetation Benthic Index of Biotic Integrity - Chesapeake Bay Data/Graph: Striped Bass Juvenile Index Indicator Development and Data Responsibility: Maryland DNR, Fisheries Service, Young-of-Year Striped Bass - Maryland (Geometric Mean) Goal: Maintain viable populations of native species. Indicator: The striped bass juvenile index is used as one of the parameters to estimate future population levels. Four river systems (Potomac, Choptank, Nanticoke, and Upper Bay), sampled once a month for three months (July to September), covering 22 sites. Status: The 1998 Juvenile Index was 5.50, above the average for the period. Benchmark: Maintain juvenile index at or above average catch per haul of 4.32, the Target Period Average (TPA). This is the average of indices from , a period of stable biomass and general stock health. Fish Index of Biotic Integrity - Estuarine Striped Bass Juvenile Index American Shad Population Blue Crab Population Seed Oyster Production NON-TIDAL AQUATIC SYTEMS TERRESTRIAL SYSTEM DEGRADATION, FRAGMENTATION, ISOLATION CONSERVATION OF BIOLOGICAL DIVERSITY PUBLIC INTERFACE

94 Young-of-the-Year Striped Bass - Maryland (Geometric Mean)
95 INTRODUCTION PUBLIC HEALTH Data/Graph: American Shad Population Indicator Development and Data Responsibility: DNR, Fisheries Service, WATER QUALITY - TIDAL AQUATIC SYSTEMS Submerged Aquatic Vegetation Habitat Quality Acres of Submerged Aquatic Vegetation American Shad Adult Population (Estimated at 95% Confidence Interval) Goal: Maintain viable populations of native species. Indicator: Estimate of the adult American shad population in the Upper Bay. There is a 95% probability that the true number of Shad in the Upper Bay in a given year is within the range depicted in the shaded area. Status: 1998 population estimate was about 488,000 adult shad. There is currently a moratorium on the harvest of American shad from the Chesapeake Bay. Benchmark: Restore the American Shad population to a level that would support a limited fishery. Benthic Index of Biotic Integrity - Chesapeake Bay Fish Index of Biotic Integrity - Estuarine Striped Bass Juvenile Index American Shad Population Blue Crab Population Seed Oyster Production NON-TIDAL AQUATIC SYTEMS TERRESTRIAL SYSTEM DEGRADATION, FRAGMENTATION, ISOLATION CONSERVATION OF BIOLOGICAL DIVERSITY PUBLIC INTERFACE

96 American Shad Adult Population Estimated at 95% Confidence Interval
97 INTRODUCTION PUBLIC HEALTH Data/Graph: Blue Crab Population Indicator Development and Data Responsibility: DNR, Fisheries Service, WATER QUALITY - TIDAL AQUATIC SYSTEMS Submerged Aquatic Vegetation Habitat Quality Acres of Submerged Aquatic Vegetation Overall Crabs Per Tow Goal: Maintain viable populations of native species. Indicator: The numbers graphed are from the summer trawl survey. They provide an indicator of relative abundance of blue crabs. The data are used, along with other survey results, to develop a Blue Crab Advisory Report on the status of the stock. Status: As of 1998, blue crabs are fully exploited. Benchmark: The Chesapeake Bay Blue Crab Target Setting Task Force will develop numerical targets that relate stock size to changes in exploitation. Benthic Index of Biotic Integrity - Chesapeake Bay Fish Index of Biotic Integrity - Estuarine Striped Bass Juvenile Index American Shad Population Blue Crab Population Seed Oyster Production NON-TIDAL AQUATIC SYTEMS TERRESTRIAL SYSTEM DEGRADATION, FRAGMENTATION, ISOLATION CONSERVATION OF BIOLOGICAL DIVERSITY PUBLIC INTERFACE

98 Overall Crabs Per Tow
99 INTRODUCTION PUBLIC HEALTH WATER QUALITY - Data/Graph: Seed Oyster Production Indicator Development and Data Responsibility: DNR, Fisheries Service, Number of Seed Oysters Planted Goal: Maintain viable populations of native species. TIDAL AQUATIC SYSTEMS Submerged Aquatic Vegetation Habitat Quality Acres of Submerged Aquatic Vegetation Benthic Index of Biotic Integrity - Chesapeake Bay Indicator: Number of seed oysters planted from Maryland seed areas. A significant portion of Maryland's oyster fishery depends on seed oyster production in areas of the Bay that receive good spat sets in most years. Seed-bearing shell from these seed areas is transplanted to productive growing areas which have not received adequate recruitment. Spat set is stimulated in seed areas by placing clean shells on suitable bottom each summer. Status: Seed oyster production since 1992 has been limited by Bay salinity and other factors. Bay-wide spat recruitment is limited by availability of suitable substrate. Benchmark: Provide enough shell to produce 500,000 bushels of seed-bearing shell per year. Fish Index of Biotic Integrity - Estuarine Striped Bass Juvenile Index American Shad Population Blue Crab Population Seed Oyster Production NON-TIDAL AQUATIC SYTEMS TERRESTRIAL SYSTEM DEGRADATION, FRAGMENTATION, ISOLATION CONSERVATION OF BIOLOGICAL DIVERSITY PUBLIC INTERFACE

100 Number of Seed Oysters Planted
101 INTRODUCTION PUBLIC HEALTH WATER QUALITY - TIDAL AQUATIC SYSTEMS NON-TIDAL AQUATIC SYSTEMS Miles of Streams Degraded by Abandoned Mine Drainage Stream Miles Open to Migratory Fish Physical Habitat Index (Non-Tidal) Benthic Macroinvertebarate Index of Biotic Integrity (Non-Tidal) Fish Index of Biotic Integrity (Non-Tidal) Riparian Forest Buffers TERRESTRIAL SYSTEM DEGRADATION, FRAGMENTATION, ISOLATION CONSERVATION OF BIOLOGICAL DIVERSITY PUBLIC INTERFACE NON-TIDAL AQUATIC SYSTEMS Non-tidal aquatic systems encompass the range of plants and animals found in free-flowing rivers, streams, lakes and some wetlands-those not subject to the influence of tides. Some anadromous species of fish migrate from tidal into non-tidal systems to spawn and are thus temporary components of these systems. As with tidal systems, non-tidal systems incorporate physical and chemical components of habitats, as well as the interactions among biological species. Because of its importance to physical and chemical habitat and its contribution in cycling nutrients to aquatic species, riparian or near-shore vegetation is included in our consideration of non-tidal aquatic systems. Goals Conserve natural ecological communities and maintain viable populations of native species Maintain natural ecological and evolutionary processes Ensure adequate protection of Maryland's valuable wetland resources Stressors/Sources: Non-tidal aquatic systems are degraded chemically by essentially the same mechanisms as tidal aquatic systems are: water pollution which results in depressed dissolved oxygen levels, toxic inputs, bacterial contaminants, changes to the food chain, and sediment. They are perhaps even more susceptible to physical degradation than tidal systems are: in addition to erosion and sedimentation, dredging and channel modifications (often in the name of flood control), physical degradation includes reductions in base flow, the amount of water flowing in streams between rain events, and thermal effects from removal of forests along shorelines. The systems are often fragmented by development of roads or other transportation facilities, reducing upstream-downstream movement of aquatic species. Hundreds of miles of streams tributary to the Chesapeake Bay are currently blocked by dams, culverts and other obstructions. Anadromous fish, such as shad and river herring, rely on access to freshwater streams with suitable bottom and current for spawning. Loss of riparian forests to agricultural or residential uses results in a lack of buffering of both ground and surface water from impacts of adjacent land use activities, promoting the addition of sediments and nutrients to lakes and streams. It can also lead to additional adverse impacts on the living resources in the adjacent waters, including elevation of water temperature, reduction in stream bank stability, degradation of the aquatic food chain, and loss of habitat for aquatic as well as terrestrial species. Water quality and physical habitat conditions in non-tidal streams and rivers are influenced by land use and land cover patterns in the watershed, such as increasing the area of impervious land cover like roads, roof-tops and parking lots. Increasing impervious surface not only hastens the run-off of stormwater into streams, with its associated contaminants; it also interferes with the percolation of rainwater and snowmelt into ground water, potentially reducing base flow in the streams. Encroachment by livestock into streams in agricultural areas represents a source of both physical and chemical degradation of these streams. Significant sources of environmental stress in some stream systems, especially in Western Maryland, abandoned mines contribute acid and metals from coal mines as well as suspended solids and sediments from both coal and non-coal mines. Management Objectives: Through scientific monitoring and analysis, technical assistance and hands-on project implementation, DNR promotes development and implementation of watershed management strategies that will control and minimize water pollution, prevent the depletion of ground water supplies, minimize the area of impervious land cover, restore riparian forests and wetlands, keep livestock out of stream channels, and remove blockages to fish movements, thereby restoring access to historical spawning grounds for migratory and resident fish.
102 As part of its approach to regulating the range of human activities, including mining, which contribute to water pollution in non-tidal as well as tidal environments, MDE works to restore abandoned mine sites and to mitigate damage in streams adversely impacted by abandoned mine drainage. The Indicators: The indicators discussed here by no means describe entire non-tidal aquatic ecosystems; they do represent a variety of the physical, chemical and biological characteristics of concern in dealing with these systems. The living resources indicators consider communities of living organisms as found throughout the water column, rather than any individual species. Their values reflect the physical and chemical water quality conditions described by other indicators, including those in the Water Quality section. Only one indicator in this section deals with the land adjacent to streams-riparian Forest Buffers. For this indicator there is a statewide benchmark, established through the Chesapeake Bay Program, thus a statewide report of an aggregated quantity is justified. Other landscape indicators which are of great importance to the health of non-tidal aquatic systems-impervious land cover or soil erodibility, for example-are more appropriately considered in fine spatial scale applications, such as the Clean Water Action Plan's Unified Watershed Assessment or an action strategy for a particular watershed.
103 INTRODUCTION PUBLIC HEALTH WATER QUALITY - TIDAL AQUATIC SYSTEMS NON-TIDAL AQUATIC SYSTEMS Miles of Streams Degraded by Abandoned Mine Drainage Stream Miles Open to Migratory Fish Data/Graphs: Miles of Streams Degraded by Abandoned Mine Drainage Indicator Development and Data Responsibility: MDE Mining Program, Stream Miles Degraded Stream Miles Improved Goal: Improve and protect Maryland's water quality Indicator: Miles of streams degraded by acid mine drainage and miles of streams improved by programmed actions. Status: An estimated 400 miles of streams were degraded by abandoned mine drainage in About 52 miles of impacted stream have been improved since Benchmark: By 2000, reduce degraded stream miles to 390; achieve 20 restored stream miles over 1996 level. Physical Habitat Index (Non-Tidal) Benthic Macroinvertebarate Index of Biotic Integrity (Non-Tidal) Fish Index of Biotic Integrity (Non-Tidal) Riparian Forest Buffers TERRESTRIAL SYSTEM DEGRADATION, FRAGMENTATION, ISOLATION CONSERVATION OF BIOLOGICAL DIVERSITY PUBLIC INTERFACE

104 Stream Miles Degraded

105 Stream Miles Improved
106 INTRODUCTION PUBLIC HEALTH WATER QUALITY - TIDAL AQUATIC SYSTEMS NON-TIDAL AQUATIC SYSTEMS Miles of Streams Degraded by Abandoned Mine Drainage Stream Miles Open to Migratory Fish Data/Graph: Stream Miles Open to Migratory Fish Indicator development and data responsibility: Maryland DNR, Fisheries Service, Actual and Cumulative Stream Miles Reopened to Migratory Fish, Goal: Maintain natural ecological and evolutionary processes. Indicator: Stream miles reopened to migratory fish through a program of removing blockages. Both resident species and anadromous species of fish can be benefitted by removal of blockages or construction of projects to help move fish around obstructions. Status: The construction of fish passages, through the completion of 50 projects between 1985 and 1998, has resulted in the reopening of miles of streams in Chesapeake Bay watersheds and four miles of streams draining to the Coastal Bays. Benchmark: By 2003, remove blockages and reopen 413 miles of the Chesapeake Bay's tributaries in Maryland. Physical Habitat Index (Non-Tidal) Benthic Macroinvertebarate Index of Biotic Integrity (Non-Tidal) Fish Index of Biotic Integrity (Non-Tidal) Riparian Forest Buffers TERRESTRIAL SYSTEM DEGRADATION, FRAGMENTATION, ISOLATION CONSERVATION OF BIOLOGICAL DIVERSITY PUBLIC INTERFACE

107 Actual and Cumulative Stream Miles Reopened to Migratory Fish,
108 INTRODUCTION PUBLIC HEALTH WATER QUALITY - TIDAL AQUATIC SYSTEMS NON-TIDAL AQUATIC SYSTEMS Miles of Streams Degraded by Abandoned Mine Drainage Stream Miles Open to Migratory Fish Physical Habitat Index (Non-Tidal) Benthic Macroinvertebarate Index of Biotic Integrity (Non-Tidal) Fish Index of Biotic Integrity (Non-Tidal) Riparian Forest Buffers TERRESTRIAL SYSTEM DEGRADATION, FRAGMENTATION, ISOLATION Data/Graph: Physical Habitat Index (Non-Tidal) Indicator Development and Data Responsibility: DNR, Monitoring and Non-Tidal Assessment Division, Estimated Percentage of Stream Miles Within Habitat Assessment Classes - Statewide Goal: Conserve ecological communities Indicators: A Physical Habitat Index (PHI) has been developed for small (first- to third-order) non-tidal streams. A decline in the PHI score reflects natural disturbances and alterations of the stream habitat relative to minimally-disturbed reference sites; it may represent impaired habitat for stream communities. Eight physical habitat characteristics are measured, scored, weighted, and summed to calculate a PHI for each sampled stream. The coastal plain stream PHI has four characteristics in common with the noncoastal plain stream PHI. All components of the PHI are noted below. in-stream habitat structure velocity-depth diversity pool quality riffle quality embeddedness maximum depth number of root wads aesthetic quality Status: The chart reflects three years of data and was compiled in A comprehensive DNR report covering the entire state, using three years of Maryland Biological Stream Survey (MBSS) data (1995, '96, '97), is scheduled for completion in June, Benchmark: Achieve physical habitat index (PHI) scores of Good plus Fair in 75% of Maryland's stream miles. CONSERVATION OF BIOLOGICAL DIVERSITY PUBLIC INTERFACE

109 Estimated Percentage of Stream Miles* Within Physical Habitat Assessment Classes - Statewide *1st, 2nd, and 3rd order streams only. Data Source: Maryland Biological Stream Survey
110 INTRODUCTION PUBLIC HEALTH WATER QUALITY - TIDAL AQUATIC SYSTEMS NON-TIDAL AQUATIC SYSTEMS Miles of Streams Degraded by Abandoned Mine Drainage Stream Miles Open to Migratory Fish Physical Habitat Index (Non-Tidal) Benthic Macroinvertebarate Index of Biotic Integrity (Non-Tidal) Fish Index of Biotic Integrity (Non-Tidal) Riparian Forest Buffers TERRESTRIAL SYSTEM DEGRADATION, FRAGMENTATION, ISOLATION CONSERVATION OF BIOLOGICAL DIVERSITY PUBLIC INTERFACE Benthic Macroinvertebrate Index of Biotic Integrity (Non-Tidal) Indicator Development and Data Responsibility: DNR, Monitoring and Non-Tidal Assessment Division, Data/Graph: Estimated Percentage of Stream Miles Within Macroinvertebrate IBI Classes - Statewide Goal: Conserve natural ecological communities. Indicators: Benthic Indexes of Biological Integrity (BIBI) have been developed for the small (first- to third-order) non-tidal streams. The coastal plain stream BIBI includes seven characteristics of the benthic macroinvertebrate community. The non-coastal plain BIBI includes eight biological characteristics that are combined to assess the status of benthic macroinvertebrate communities in these streams: All streams taxa number EPT taxa number % Ephemoptera Coastal Plain, only % of Chironomidae that are Tanytarsini % clinger taxa % scrapers Florida Index Non-Coastal Plain, only Ephemoptera taxa number Diptera taxa number % Tanytarsini (Diptera) % pollution intolerant taxa % collectors Status: The BIBIs used in Maryland streams were recently developed. The chart reflects three years' data and was compiled in A decline in BIBI scores reflects natural variation and decreases in water quality and/or physical habitat conditions. BIBI scores generally declined across the state from west to east. A comprehensive DNR report covering the entire state, using three years of Maryland Biological Stream Survey (MBSS) data (1995, '96, '97), is scheduled for completion in June, Benchmark: Attain BIBI scores of Good plus Fair for bethic macroinvertebrate community condition in 75% of Maryland's stream miles.

111 Estimated Percentage of Stream Miles* Within Macroinvertebrate IBI Classes - Statewide *1st, 2nd, and 3rd order streams only. Data Source: Maryland Biological Stream Survey
112 INTRODUCTION PUBLIC HEALTH WATER QUALITY - TIDAL AQUATIC SYSTEMS NON-TIDAL AQUATIC SYSTEMS Miles of Streams Degraded by Abandoned Mine Drainage Stream Miles Open to Migratory Fish Physical Habitat Index (Non-Tidal) Benthic Macroinvertebarate Index of Biotic Integrity (Non-Tidal) Fish Index of Biotic Integrity (Non-Tidal) Riparian Forest Buffers TERRESTRIAL SYSTEM DEGRADATION, FRAGMENTATION, ISOLATION Data/Graph: Fish Index of Biotic Integrity (Non-Tidal) Indicator Development and Data Responsibility: DNR, Monitoring and Non-Tidal Assessment Division, Estimated Percentage of Stream Miles Within Fish IBI Classes - Statewide Goal: Conserve natural ecological communities. Indicators: Indexes of Biotic Integrity for fishes (FIBIs) have been developed for small (first- to thirdorder) non-tidal streams. Several characteristics of the fish community are measured, scored and summed to calculate an FIBI for each sampled stream: number of native species number of benthic species number of tolerant individuals % tolerant species % abundance of dominant species % generalists, omnivores and insectivores number of individuals/square meter biomass (grams/square meter) % lithophilic spawners % insectivores Different combinations of these characteristics were combined to generate FIBIs for three regions in Maryland: coastal plain, eastern Piedmont, and highlands. A decline in FIBI scores reflects natural variation and decreases in water quality and/or physical habitat conditions. Status: A report describing the results of FIBI assessments based on 1995 and 1996Maryland Biological Stream Survey (MBSS) sampling in 12 river basins is available from DNR. A comprehensive DNR report covering the entire state, using three years of MBSS data (1995, '96, '97), is scheduled for completion in June, Benchmark: Achive FIBI of Good plus Fair in 75% of Maryland's stream miles. CONSERVATION OF BIOLOGICAL DIVERSITY PUBLIC INTERFACE

113 *1st, 2nd, and 3rd order streams only. Data Source: Maryland Biological Stream Survey Estimated Percentage of Stream Miles* Within Fish IBI Classes - Statewide
114 INTRODUCTION PUBLIC HEALTH Data/Graph: Riparian Forest Buffers Indicator Development and Data Responsibility: DNR, Forest Service, WATER QUALITY - TIDAL AQUATIC SYSTEMS NON-TIDAL AQUATIC SYSTEMS Miles of Streams Degraded by Abandoned Mine Drainage Stream Miles Open to Migratory Fish Physical Habitat Index (Non-Tidal) Riparian Forest Buffers Reestablished Goal: Maintain natural ecological and evolutionary processes. Indicator: Miles of riparian forest buffers re-established on one side of a stream. Because property ownerships often end at a stream and only willing landowners are used for establishment of riparian forest buffers, one-side buffers are the units measured. Status: Maryland has approximately 17,000 miles of streams depicted on United States Geological Survey (USGS) 7.5' quadrangle maps, plus an unmeasured number of miles of intermittent streams. A 1996 study carried out by Penn State University and submitted to the Chesapeake Bay Program Office found that nearly half of Maryland's streams lacked 100-foot buffers on both sides of the stream. Since then, 106 miles of forest buffer have been re-established. Benchmark: By 2010, reestablish 600 miles of forest buffers, or 43 miles per year. Benthic Macroinvertebarate Index of Biotic Integrity (Non-Tidal) Fish Index of Biotic Integrity (Non-Tidal) Riparian Forest Buffers TERRESTRIAL SYSTEM DEGRADATION, FRAGMENTATION, ISOLATION CONSERVATION OF BIOLOGICAL DIVERSITY PUBLIC INTERFACE

115 Riparian Forest Buffers Reestablished
116 INTRODUCTION PUBLIC HEALTH WATER QUALITY - TIDAL AQUATIC SYSTEMS NON-TIDAL AQUATIC SYTEMS TERRESTRIAL SYSTEM DEGRADATION, FRAGMENTATION, ISOLATION Maryland Wetland Trends Wetlands Restoration Initiative Acres of Agricultural and Forest Lands Protected Lands Septic System Permits/Low Density Residential Development Acres of Abandoned Mine Lands Brownfields/Federal Facilities Approved for Redevelopment Recycling Municipal Solid Waste CONSERVATION OF BIOLOGICAL DIVERSITY PUBLIC INTERFACE TERRESTRIAL SYSTEM DEGRADATION, FRAGMENTATION, ISOLATION As urban development, road building and, to a lesser extent in recent years, expansion of agriculture and mineral extraction have converted more and more land to intensive human use, upland terrestrial habitats have been lost or fragmented into smaller and smaller pieces. Although the concern is usually associated with loss and fragmentation of forest, wetland and grassland losses are also considered here. Many bird and other wildlife species require large blocks of forest for successful breeding, or some life stage requires some specialized type of habitat more likely to be found in a large natural area than in a small patch. Connecting large patches of natural landscape with green corridors can help to maintain the viability of populations otherwise rendered vulnerable because of small numbers and/or isolation. In addition to their important habitat values, both forests and wetlands provide major water quality benefits which are difficult to replicate once the natural landscapes are lost. There is an economic dimension to the loss and splitting up of resource lands also. The viability of both agriculture and forestry depends on the availability not just of suitable land but of uninterrupted tracts. Failure to protect substantial amounts of land from intensive development also increases the potential threat to maintaining biological diversity and the resource base needed to support natural resource based recreation. Increasing demands placed on existing public land resources for recreation can be detrimental to the maintenance of ecological functions at sites already acquired, while acquiring more natural area to meet the expanded need becomes more and more difficult-increased real estate values resulting from development pressure translate to less open space protected for each dollar spent. Wetlands are a special system we have included as terrestrial, although clearly there is a strong tie to aquatic systems, particularly for those wetlands in the riparian zone. Some of the wetlands most susceptible to damage or destruction are those non-tidal wetlands which do not appear wet much of the time. For this reason, and because they support terrestrial fauna, we include wetlands here as part of the terrestrial system, recognizing their hydrologic connections to the aquatic systems considered elsewhere. Goals Conserve natural ecological communities Maintain natural evolutionary and ecological processes Maintain viable populations of native species Maintain Maryland's natural resource base Stressors/Sources: Although natural processes like sea level rise and shoreline erosion contribute to the loss of wetlands, the primary stressors of natural terrestrial systems are largely human-induced. Human population growth, exacerbated by decreasing household sizes, continuing trends toward larger lot sizes, and out-migration from existing communities, has spurred the rapid conversion of natural areas to residential, commercial, and industrial uses. The actual loss of natural resource lands to intense human use is not the only problem here; the increasing fragmentation of the natural area that remains, into smaller and smaller patches, significantly stresses the maintenance of ecosystem health and the viability of important species. Low density, sprawl, development, characteristic of much of what has occurred in recent years, is a stressor of aquatic systems as well as terrestrial: it is a major contributor of nutrients to local waterways. Research has revealed that low density development (1 unit per 5 acres) contributes nearly 17 times more phosphorus and 24 times more nitrogen per dwelling unit than high density development. Septic systems are the predominant form of sewage treatment in low density areas. Newer system designs, which allow for nutrient removal, are expensive and rarely utilized. Finally, low density development also requires the
117 increased use of automobiles, which consume gasoline and contribute nitrogen to the air that is subsequently deposited into waterways. Failure to reuse previously disturbed lands, including mined areas and brownfields-older commercial or industrial sites and federal facilities sometimes left idle because of anticipated liability associated with potential contamination of the property-contributes to the increasing rate of consumption of open space, agricultural, and forest land. In addition to being wasteful of the land resource, abandoned mine lands constitute safety hazards for humans and environmental stressors through disturbance or destruction of terrestrial habitat for plant and animal species. Similarly, failure to reclaim potentially contaminated industrial sites, besides adding to land consumption pressures, does nothing to reduce exposure to materials which can harm living resources. Management Objectives: The State's objectives, carried out by multiple agencies, include preventingfurther loss and fragmentation of terrestrial ecosystems and restoring ecosystem function where it has been disturbed. Actual expansion of riparian forest and wetlands is also among the management objectives. Both regulatory and voluntary or incentive-based approaches are taken to advance these objectives. "Smart Growth" is a many-faceted approach to improving human use of the land and protecting natural resource values. Conservation and renewal of existing neighborhoods, encouraging new development which is more compact and readily serviced by existing public infrastructure-roads, water supply lines and sewers-cleanup and reuse of vacated former commercial or industrial sites and federal facilities, and reclamation of abandoned mine lands are all features of the Smart Growth initiative, along with expanded protection of open space. DNR and MDE seek to work in collaboration with local and other State agencies with similar objectives, and with community groups and individuals, supporting their efforts through improved science and the means to apply scientific information to on-the-ground decisions. Through development of maps and data for dissemination to local governments, areas most sensitive to disturbance can be identified and avoided; through purchase of lands or easements on land, or grants to local governments to purchase land, important natural resource areas can be permanently set aside. Assistance is also provided to homeowners and other private sector landowners to improve management of their properties to support ecosystem concerns. The Indicators: Terrestrial system indicators-those dealing with forest, grassland, most wetland environments, and the flora and fauna associated with them-are less well-developed than those for aquatic systems. Public attention has long been focused on aquatic systems, at least to some extent because of the early emphasis of much of the environmental movement on water pollution. Concern for terrestrial resources has grown along with the increasing attention being to devoted to land-based sources of water quality problems. What is happening to terrestrial ecosystems in their own right is an even more recent focus of interest; fewer data exist from which to construct indicators. Thus a number of the indicators which follow focus on human encroachments into natural areas, and the continuing stress of population and development on the natural resource base, and on activities undertaken to reduce this pressure, like decreasing the need for additional landfill space for solid waste.
118 INTRODUCTION PUBLIC HEALTH WATER QUALITY - TIDAL AQUATIC SYSTEMS NON-TIDAL AQUATIC SYTEMS TERRESTRIAL SYSTEM DEGRADATION, FRAGMENTATION, ISOLATION Maryland Wetland Trends Wetlands Restoration Initiative Data/Graphs: Maryland Wetland Trends Indicator Development and Data Responsibility: MDE's Wetlands and Waterways Program, Non-Tidal Wetlands Tidal Wetlands Goal: Achieve "no net loss" of Maryland's wetland resources. Indicator: Acres of Maryland's total wetland resource base (both tidal and non-tidal) that is being gained/lost through regulatory programs. Status: Over the course of Maryland's post-colonial history, it is estimated that some 300,000 acres of wetlands have been lost. The total number of wetland acres in Maryland is currently estimated as 598,422 acres, including unvegetated flats, bars and shorelines; rocky shores; and open water areas. Tidal wetlands account for 252,280 acres, and non-tidal wetlands account for 346,142 acres, including riverine and lacustrine wetlancs. The average annual increase in wetland acreage under State wetland regulatory programs is 9 acres of tidal wetlands and 20 acres of non-tidal wetlands. Benchmark: Develop a state wetland conservation plan that will incorporate a long-range goal of 10% for wetlands protection in Maryland. Acres of Agricultural and Forest Lands Protected Lands Septic System Permits/Low Density Residential Development Acres of Abandoned Mine Lands Brownfields/Federal Facilities Approved for Redevelopment Recycling Municipal Solid Waste CONSERVATION OF BIOLOGICAL DIVERSITY PUBLIC INTERFACE

119 Non-Tidal Wetlands

120 Tidal Wetlands
121 INTRODUCTION PUBLIC HEALTH WATER QUALITY - TIDAL AQUATIC SYSTEMS NON-TIDAL AQUATIC SYTEMS TERRESTRIAL SYSTEM DEGRADATION, FRAGMENTATION, ISOLATION Maryland Wetland Trends Data/Graph: Wetlands Restoration Initiative Indicator Development and Data Responsibility: MDE's Wetlands and Waterways Program, and the Wetlands Restoration Steering Committee, 410, Progress Toward 60,000 Acre Goal Goal: Ensure adequate protection and restoration of Maryland's wetlands resources. Indicator: Acres of wetlands restored or created other than those required for mitigation under regulatory programs. Status: A Wetlands Restoration Steering Committee has been appointed and is in the process of developing a strategy for the accomplishment of the management objective. The Maryland restoration program is being coordinated with the Chesapeake Bay Program wetland restoration initiative. An average annual increase of 85 acres of non-tidal wetlands is attributed to non-regulatory programs. Benchmark: Restore and create 60,000 acres of tidal and non-tidal wetlands on a voluntary basis. Wetlands Restoration Initiative Acres of Agricultural and Forest Lands Protected Lands Septic System Permits/Low Density Residential Development Acres of Abandoned Mine Lands Brownfields/Federal Facilities Approved for Redevelopment Recycling Municipal Solid Waste CONSERVATION OF BIOLOGICAL DIVERSITY PUBLIC INTERFACE

122 Progress Toward 60,000 Acre Goal
123 INTRODUCTION PUBLIC HEALTH Data/Graph: Acres of Agricultural and Forest Land Indicator Development and Data Responsibility: Maryland Office of Planning, WATER QUALITY - TIDAL AQUATIC SYSTEMS NON-TIDAL AQUATIC SYTEMS TERRESTRIAL SYSTEM DEGRADATION, FRAGMENTATION, ISOLATION Maryland Wetland Trends Wetlands Restoration Initiative Acres of Agricultural and Forest Lands Acres of Resource Lands Goal: Maintain Maryland's natural resource land base and encourage smart growth. Indicator: Agricultural and forest lands are declining. These lands are important both for supporting valued sectors of the economy and for their aesthetic benefits to the public. Forest lands are particularly necessary for supporting a variety of species of both plants and animals native to Maryland, for their role protecting water quality, and for their effects on air quality. The satellite and air photo data used to develop this indicator are not acquired on an annual basis, and their interpretation is time-consuming and expensive. For these reasons, changes in indicator values will not occur in annual increments. Status: Statewide, the loss of forest land between 1973 and 1990, the latest period for which numbers are available, was 5.6%; agricultural land losses were over 4.7%. Significant losses of agricultural and forest land occurred in Central and Southern Maryland. Benchmark: Reduced rate of agricultural and forest land conversions to non-resource use. Protected Lands Septic System Permits/Low Density Residential Development Acres of Abandoned Mine Lands Brownfields/Federal Facilities Approved for Redevelopment Recycling Municipal Solid Waste CONSERVATION OF BIOLOGICAL DIVERSITY PUBLIC INTERFACE

124 Acres of Resource Lands
125 INTRODUCTION PUBLIC HEALTH WATER QUALITY - TIDAL AQUATIC SYSTEMS NON-TIDAL AQUATIC SYTEMS TERRESTRIAL SYSTEM DEGRADATION, FRAGMENTATION, ISOLATION Maryland Wetland Trends Wetlands Restoration Initiative Data/Graph: Protected Lands Indicator Development: Maryland DNR, Watershed Management and Analysis Division, Maryland Lands Protected Under Public Ownership or Easements Goal: Maintain Maryland's natural resource land base. Indicator: Acres of land in public ownership or under conservation or agricultural easement. These lands represent a public and private commitment to preventing urban type development and reserving portions of the landscape for natural resource and resource-based economic purposes. Status: Land protected via public ownership or public easement programs in 1998 totaled over 846,100 acres, or over 13% of the total land base of the State. However, protected lands are not distributed evenly across the Maryland, or in proportion to the State's population, nor do they necessarily protect the areas with the greatest natural resource value. Natural lands accessible to the public are not being acquired at a rate proportional to population growth. Benchmark: Protect open space at a level equal to or greater than the rate land is converted to non-open space uses. Acres of Agricultural and Forest Lands Protected Lands Septic System Permits/Low Density Residential Development Acres of Abandoned Mine Lands Brownfields/Federal Facilities Approved for Redevelopment Recycling Municipal Solid Waste CONSERVATION OF BIOLOGICAL DIVERSITY PUBLIC INTERFACE

126 Maryland Lands Protected Under Public Ownership or Easements Sources: DNR Lands--Acreage Report, 1998; Federal and Local Lands-- Office of Planning Open Space Acreage by Classification for Maryland, Dec. 1992; MET Easements--Maryland Environmental Trust, Dec 1998; Agricultural Easements --Maryland Agricultural Land Preservation Foundation, Summer 1998.
127 INTRODUCTION PUBLIC HEALTH Data/Graph: Septic System Permits/Low Density Residential Development Indicator Development and Data Responsibility: Maryland Office of Planning, WATER QUALITY - TIDAL AQUATIC SYSTEMS NON-TIDAL AQUATIC SYTEMS TERRESTRIAL SYSTEM DEGRADATION, FRAGMENTATION, ISOLATION Maryland Wetland Trends Wetlands Restoration Initiative Ratio of Septic Permits to Total Building Permits Low Density Residential Land Goal: Reduce sprawl development. Indicators: 1. Ratio of septic permits to total building permits, reflective of development occurring beyond the limits currently developed areas. 2. Acres of low density residential development, reflecting continuing high levels of land consumption for urban-type development. Status: Large-lot development and concomitant use of septic tanks are both increasing. Benchmark: A downward trend in the ratio of septic permits to total building permits issued, consistent witht he State's overall effort to encourage "Smart Growth." Acres of Agricultural and Forest Lands Protected Lands Septic System Permits/Low Density Residential Development Acres of Abandoned Mine Lands Brownfields/Federal Facilities Approved for Redevelopment Recycling Municipal Solid Waste CONSERVATION OF BIOLOGICAL DIVERSITY PUBLIC INTERFACE

128 Ratio of Septic Permits to Total Building Permits

129 Low Density Residential Land
130 INTRODUCTION PUBLIC HEALTH Data/Graphs: Acres of Abandoned Mine Lands Indicator Development and Data Responsibility: MDE, Mining Program, WATER QUALITY - TIDAL AQUATIC SYSTEMS NON-TIDAL AQUATIC SYTEMS TERRESTRIAL SYSTEM DEGRADATION, FRAGMENTATION, ISOLATION Abandoned Lands Restoration Targets Goal: Improve and protect Maryland's water quality. Indicator: Extent to which terrestrial ecosystems disrupted prior to the enactment of stricter controls over mining have been restored to safe, productive use. Status: An estimated 8,040 acres of abandoned mine lands currently exist in Maryland's two coal producing counties, i.e., Allegany and Garrett. About 1,460 acres have been reclaimed since Benchmark: By 2000, reclaim 240 additional acres of abandoned mine sites, making the sites safe for humans and environmentally productive. Maryland Wetland Trends Wetlands Restoration Initiative Acres of Agricultural and Forest Lands Protected Lands Septic System Permits/Low Density Residential Development Acres of Abandoned Mine Lands Brownfields/Federal Facilities Approved for Redevelopment Recycling Municipal Solid Waste CONSERVATION OF BIOLOGICAL DIVERSITY PUBLIC INTERFACE

131 Abandoned Mine Lands

132 Restoration Targets
133 INTRODUCTION PUBLIC HEALTH WATER QUALITY - TIDAL AQUATIC SYSTEMS NON-TIDAL AQUATIC SYTEMS TERRESTRIAL SYSTEM DEGRADATION, FRAGMENTATION, ISOLATION Maryland Wetland Trends Wetlands Restoration Initiative Acres of Agricultural and Forest Lands Protected Lands Brownfields/Federal Facilities Approved for Redevelopment Indicator Development and Data Responsibility: MDE, Environmental Restoration and Redevelopment Program, Data/Graphs: Goals: Approved Brownfield Sites Approved Federal Facilities Protect Maryland's natural resource land base Encourage smart growth. Indicator: Acres of brownfields/federal facilities approved for development. Redevelopment approval results in environmental cleanups at properties that otherwise remain idle, and provide economic development benefits including new jobs and increased tax revenues, promoting growth management by using existing infrastructure and avoiding unnecessary development in undeveloped "greenfields." Status: Six federal facilities approvals have been completed, representing 1,991 acres; 57 brownfields assessments have been completed to date, representing 408 acres; and 15 voluntary clean-up program sites have been completed, representing 227 acres. Benchmark: By the year 2000, remediate 222 acres of brownfileds sites; by the year 2001, approve for remedial action and/or reuse one hundred percent of federal facilities slated for closure. Septic System Permits/Low Density Residential Development Acres of Abandoned Mine Lands Brownfields/Federal Facilities Approved for Redevelopment Recycling Municipal Solid Waste CONSERVATION OF BIOLOGICAL DIVERSITY PUBLIC INTERFACE

134 Approved Brownfield Sites

135 Approved Federal Facilities
136 INTRODUCTION PUBLIC HEALTH WATER QUALITY - TIDAL AQUATIC SYSTEMS NON-TIDAL AQUATIC SYTEMS TERRESTRIAL SYSTEM DEGRADATION, FRAGMENTATION, ISOLATION Maryland Wetland Trends Wetlands Restoration Initiative Data/Graph: Recycling Municipal Solid Waste Indicator Development and Data Responsibility: MDE, Recycling Services Program, Statewide Recycling Rate Goal: Protect Maryland's natural resource land base. Indicator: Statewide recycling rates. The recycling rate represents the tonnage of municipal solid waste recycled divided by the sum of the tonnage disposed plus the tonnage recycled. In addition to increasing consumption of land for desired urban uses like housing and commercial/industrial development, population increase and present-day lifestyles have substantially increased the amount of material discarded by each household. The method of choice for disposing of this material has come to be the sanitary landfill, in most cases-another land-consuming activity. As recycling of municipal solid waste increases, devotion of land to development of landfills for solid waste disposal can be reduced. Status: The 1998 Statewide recycling rate was 33%. Benchmark: Maintain at least 33% statewide recycling rate. Acres of Agricultural and Forest Lands Protected Lands Septic System Permits/Low Density Residential Development Acres of Abandoned Mine Lands Brownfields/Federal Facilities Approved for Redevelopment Recycling Municipal Solid Waste CONSERVATION OF BIOLOGICAL DIVERSITY PUBLIC INTERFACE

137 Statewide Recycling Rate
138 INTRODUCTION PUBLIC HEALTH WATER QUALITY - TIDAL AQUATIC SYSTEMS NON-TIDAL AQUATIC SYTEMS TERRESTRIAL SYSTEM DEGRADATION, FRAGMENTATION, ISOLATION CONSERVATION OF BIOLOGICAL DIVERSITY Forest Interior Breeding Bird Populations Bald Eagle Population Colonial Waterbird Population Trends PUBLIC INTERFACE CONSERVATION OF BIOLOGICAL DIVERSITY In addition to their intrinsic interest, diverse natural communities in temperate zones are more resilient to the effects of human activities and natural hazards than less diverse communities. Interest in biological diversity has grown out of earlier concern for rare and endangered species as both professionals and lay environmental activists are taking a broader or more holistic look at maintaining entire ecosystems, attending to interactions among species, like predator-prey relationships and seed migration, as well as individual ecosystem components. Protecting Maryland s communities of native species is a component of this issue. In this we include large acreages of widespread and abundant communities, contributing to the range of ecological processes, as well as smaller acreages of rare or highly diverse communities. Identifying the best examples of all of these communities is part of the job. Lands representative of Maryland's biological diversity should be protected through public ownership or permanent easement in buffered core areas in order to preserve these diverse communities. Our land protection efforts, both fee acquisition and acceptance or purchase of conservation easements, have often not been directed by this concept, and the knowledge base to support this kind of decision-making is still being developed. The result is that DNR's public estate does not presently incorporate the most diverse and valuable natural areas in the State. Attention to ecological processes also characterizes interest in biological diversity. Particular attention has been focused on the reproductive process as a result of declines in key species, like eagles, resulting from reproductive failures induced in the 1960's and 70's by pesticide contamination. Nesting success is also an important focus of attention for other species. Goals Maintain natural evolutionary and ecological processes Conserve natural ecological communities Maintain Maryland's natural resource land base Protect a core network of natural areas representative of Maryland s biological diversity. Stressors/Sources: Many species have particular habitat requirements for different life stages, like reproduction. As area-sensitive nesting species, many bird species are affected by habitat loss and fragmentation. For some species of birds, loss of interior forest, at least 300 feet from an adjacent type of land cover, eliminates the required habitat for nesting, while forest fragmentation results in reduced or no reproductive success, due to increased nestling predation and nest parasitism rates. Water birds like herons nest in a few large colonies; these species as well as bald eagles require wooded shorelines and other wooded areas in close proximity to tidal waters to support large numbers of nests. Increased development of wooded shorelines and increased human activities within these areas can render the habitat unsuitable for nesting. As top predators, these birds also depend upon a stable and healthy prey base of fish and other aquatic animals. Management Objectives: DNR is moving to an ecosystem approach to management in order to improve stewardship of the State's natural resources. It seeks to minimize or avoid the loss and isolation of native terrestrial habitats and to conserve habitats and processes necessary to support the diversity of native species, with particular emphasis on top predators in the food chain. Monitoring, data analysis and mapping are critical to the Department's ability to meet these objectives and to develop additional or more appropriate indicators to track future progress. Because the issue of protection of biological diversity and associated ecosystem concerns is new relative to the long-standing public concern with environmental pollution, public education and outreach are particularly important management
139 approaches. DNR tries to incorporate in its land holdings exemplary representatives of all of the State s major landscape types, geologically and biologically defined. Another reflection of this objective is the periodic designation, through legislation, of Wildlands, parts of DNR properties which do not receive active management in order that natural processes may proceed unimpeded. The Indicators: Current indicators of biological diversity are derived from information which has been collected over several years for other purposes. Two indicators do cover a combination of species which have particular habitat needs, while the other deals with a single species which is a top predator in the landscape and highly symbolic nationally. As work that is currently under way is completed to identify biological community alliances, new indicators more representative of biological diversity can be developed.
140 INTRODUCTION PUBLIC HEALTH WATER QUALITY - TIDAL AQUATIC SYSTEMS NON-TIDAL AQUATIC SYTEMS TERRESTRIAL SYSTEM DEGRADATION, FRAGMENTATION, ISOLATION CONSERVATION OF BIOLOGICAL DIVERSITY Forest Interior Breeding Bird Populations Data/Graphs: Goals: Forest Interior Breeding Bird Populations Indicator Development and Data Responsibility: DNR, Wildlife and Heritage Division, Maryland Breeding Bird Survey, Maryland Breeding Bird Survey, Conserve natural ecological communities Maintain viable populations of native species. Indicator: Number of forest interior breeding bird species with stable or increasing population trends. Declining populations of these species indicate that large, contiguous forested areas are being lost, degraded, or fragmented into smaller blocks of woodlands incapable of sustaining complete forest ecosystem functions. Status: Eighteen of 21 species had stable or increasing long-term population trends during the period and 18 of 21 species had stable or increasing recent, short-term population trends during Benchmark: Populations of all species of forest interior breeding birds remain stable or increase. Bald Eagle Population Colonial Waterbird Population Trends PUBLIC INTERFACE
141 Maryland Bird Breeding Survey,

142 Maryland Bird Breeding Survey,
143 INTRODUCTION PUBLIC HEALTH WATER QUALITY - TIDAL AQUATIC SYSTEMS NON-TIDAL AQUATIC SYTEMS TERRESTRIAL SYSTEM DEGRADATION, FRAGMENTATION, ISOLATION CONSERVATION OF BIOLOGICAL DIVERSITY Forest Interior Breeding Bird Populations Data/Graph: Bald Eagle Population Indicator Development and Data Responsibility: DNR, Wildlife and Heritage Division, Bald Eagle Nest Success Goal: Maintain natural ecological and evolutionary processes. Indicator: Number of successful bald eagle nesting pairs. As top predators susceptible to damage from contamination in the food chain, bald eagles tell an important part of the story about the health of the overall Chesapeake Bay system. Status: There were 260 nesting pairs in 1999, of which 190 nested successfully saw the first sighting of nesting pairs in Frederick County, bringing the total number of counties where nesting eagles have been sighted to 19. The new numbers meet minimum standards for designation as a fully recovered species, however the bald eagle remains for the time being on State and federal lists of threatened and endangered species. Benchmark: The number of nesting pairs of bald eagles successfully fledging an average of one juvenile per nest remains at or above 200 annually. Bald Eagle Population Colonial Waterbird Population Trends PUBLIC INTERFACE

144 Bald Eagle Nest Success
145 INTRODUCTION PUBLIC HEALTH WATER QUALITY - TIDAL AQUATIC SYSTEMS NON-TIDAL AQUATIC SYTEMS TERRESTRIAL SYSTEM DEGRADATION, FRAGMENTATION, ISOLATION CONSERVATION OF BIOLOGICAL DIVERSITY Data/Graph: Colonial Waterbird Population Trends Indicator Development and Data Responsibility: DNR, Wildlife and Heritage Division, Colonial Waterbird Population Trends, Goal: Maintain natural ecological and evolutionary processes. Indicator: Population trends for waterbirds which nest in large colonies. Declining populations of these species indicate that natural ecological processes have been compromised and the stability of the estuarine ecosystem may be in jeopardy Status: Full surveys are conducted every five years, most recently in Eleven of 20 species had stable populations between ; three species populations increased during ; six populations decreased. Benchmark: Populations of all species of colonial waterbirds remain stable or increase.. Forest Interior Breeding Bird Populations Bald Eagle Population Colonial Waterbird Population Trends PUBLIC INTERFACE

146 Colonial Waterbird Population Trends,
147 INTRODUCTION PUBLIC HEALTH PUBLIC INTERFACE PUBLIC UNDERSTANDING AND COMMUNITY SUPPORT ENVIRONMENTAL JUSTICE PUBLIC INTERFACE The people of Maryland are at the heart of the State s environmental management. Over the past three decades or so, the people have spoken clearly and repeatedly of their desire for protection of natural resources, clean-up of pollution, a healthy Chesapeake Bay. These desires find expression in a variety of State laws and regulations covering the range of goals and issues reflected in the Public Health and Ecosystem Health portions of this report. A major tenet of the ecosystem-based management toward which the State is moving in its approach to the environment and natural resources is that people are part of the ecosystem all of the people of Maryland are parts of the ecosystem(s) of the State, their health and quality of life affected by environmental conditions and many of their actions affecting other ecosystem components. Part of the job facing environmental managers at all levels of government is to bring together the social context with the science with which most of them have greater experience and comfort. A two-way communication system is called for making environmental information available to the people, and hearing from the people their concerns and issues. If indicators of public health and ecosystem health are constrained by the level of knowledge and the data available to measure what is happening "out there," indicators of social interaction with the environment are even less well developed. The indicators which follow provide a first cut at measuring our ability to convey information in a meaningful way, to children as well as adults, and how even-handed we are being in providing environmental programs to the people of Maryland.
148 INTRODUCTION PUBLIC HEALTH PUBLIC INTERFACE PUBLIC UNDERSTANDING AND COMMUNITY SUPPORT Envirothon Participants Green Schools Teaching Environmental Awareness in Maryland - TEAM DNR ENVIRONMENTAL JUSTICE PUBLIC UNDERSTANDING AND COMMUNITY SUPPORT More and more people are developing a stewardship ethic a sense of personal responsibility for environmental protection and maintaining natural values partly as a result of improved understanding and more experience in natural settings. And they are recognizing the need to act at the local level. One evidence of this is the welling up of volunteer effort, at both the State and local level, which is becoming more important as budget pressures tighten. Education is a major component of Maryland s efforts to improve environmental performance; it is a feature of many regulatory programs and a goal of most publications, press releases and briefings of decision-makers carried out by both the Maryland Department of Environment and the Department of Natural Resources. Education of all citizens, from children through adults, is a primary function of one of DNR s operating units and underlies much of the programming of activities at State Parks. Clearly, environmental education goes beyond school and curriculum, although much of a family s education may begin with the experiences of its school children. Goals Increase community involvement in environmental management Improve public education about environmental and natural resource issues Stressors/Sources: Environmental issues are complex, and the science necessary to support effective approaches to dealing with them is still being developed. Decision-making in the arena of environmental improvement and natural resources management is thus, almost necessarily, seen as addressing "moving targets." The political instinct to place blame and look for immediate solutions to emerging problems, resource use conflicts between different interest groups, and public scares over perceived environmental catastrophes all illustrate the critical nature of this issue. Environmental issues, and educational efforts directed toward environment and natural resources, also must compete for public attention and educational resources with a myriad of other concerns and education needs. Improving public understanding and support for environmental programs thus must include translating emerging scientific understandings for the benefit of decision-makers, improving the communication of scientific information to the general public, improving teachers understanding of important issues, and developing improved environmental education programs and materials for school students. Management Objectives: DNR and MDE s management objectives target environmental education and include providing consistent information focused on environmental goals and outcomes, both to selected audiences and to a more general public through the mass media. Much of the Departments educational effort focuses on simply being available to numerous and diverse audiences, sometimes in their local settings, often at events they may be attending for recreational purposes. Development of written materials, particularly focused on lay or student audiences, permeates many other activities. Stimulating and supporting individual and civic interest and action needs to be part of how the State carries out the entire array of its environmental programs. The strategy is also to get people who have been reached by the information provided to expand their efforts in their own communities. The Indicators: Public meetings held to discuss the initial Environmental Performance Partnership submissions in 1997, as well as those held more recently, elicited a number of comments on the need for indicators of environmental education efforts. One difficulty in arriving at outcome indicators is the time lapse between many education efforts, particularly those carried out through the school system, and the evidence changed behaviors, community involvement that the education has truly occurred. That is, programmatic efforts are several steps removed from the outcomes. One of the indicators that follows
149 attempts to overcome this difficulty, since the Green Schools program requires community activity concomitant with curricular activities. Green Schools is a new program, so the indicator as presented may change in future years.
150 INTRODUCTION PUBLIC HEALTH PUBLIC INTERFACE PUBLIC UNDERSTANDING AND COMMUNITY SUPPORT Envirothon Participants Green Schools Teaching Environmental Awareness in Maryland - TEAM DNR Envirothon Participants Indicator Development and Data Responsibility: DNR, Education, Bay Policy and Growth Management, Data/Gaph: Participation in Local Envirothon Activities Goal: Improve public education about environmental and natural resource issues Indicator: Number of students, statewide, participating in Envirothon, a national and statewide problemsolving competition to educate high school students about natural resource issues. Students receive training and testing in five areas: aquatics, forestry, wildlife, soils, and a topic which changes yearly and reflects an issue of national importance. Students participate in a county level competition, with winners competing at the State level; the winning State team participates in a national competition. Maryland teams have place in the top five teams for the past five years. Status: In 1998 there were 940 students participating in county Envirothon competitions. Benchmark: By the year 2002, there will be an increase of 10% in the number of county participants. ENVIRONMENTAL JUSTICE

151 Participation in Local Envirothon Activities
152 INTRODUCTION PUBLIC HEALTH PUBLIC INTERFACE PUBLIC UNDERSTANDING AND COMMUNITY SUPPORT Envirothon Participants Green Schools Teaching Environmental Awareness in Maryland - TEAM DNR ENVIRONMENTAL JUSTICE Green Schools Indicator Development and Data Responsibility: DNR, Education, Bay Policy and Growth Management, Data/Graph: Green Schools Participation Goal: Improve public education about environmental and natural resource issues Indicator: Green Schools Program participation. This new program was developed by a diverse team of educators representing the Maryland Association for Environmental and Outdoor Education, Office of the Governor, Maryland Association of Student Councils, and the Maryland Departments of Education, Natural Resources and Environment. Green Schools combines classroom studies with the use of the best management practices at schools and involves the community. The program provides non-competitive awards to recognize and celebrate the achievement of entire schools. All public and non-public schools in Maryland are eligible to participate. No special curriculum is needed. Schools must demonstrate that they meet criteria in three areas: The school uses the environment as an integrating context or as an integral part of the school s instruction program. Best environmental practices are modeled in the operation and design of the school facility. The school extends its learning into the community through a variety of projects which address local environmental issues. Status: In 1999 there were 34 schools from 15 counties and Baltimore City selected from 62 applications to be Green Schools. Benckmark: By 2002, 20% of Maryland Schoold will be Green Schools.

153 Green Schools Participation
154 INTRODUCTION PUBLIC HEALTH PUBLIC INTERFACE PUBLIC UNDERSTANDING AND COMMUNITY SUPPORT Envirothon Participants Green Schools Teaching Environmental Awareness in Maryland - TEAM DNR Teaching Environmental Awareness in Maryland TEAM DNR Indicator Development and Data Responsibility: DNR, Education, Bay Policy and Growth Management, Data/Graph: T.E.A.M. Classroom Programs Goal: Improve public education about environmental and natural resource issues and increase community involvement. Indicator: TEAM DNR is a new volunteer initiative to provide quality hands-on presentations to elementary school students around the State. The program is offered as a free service to schools. Each volunteer successfully completes a four month training program at DNR before entering the classroom. Many are retired teachers or other persons seeking to help educate students about the Chesapeake Bay. Their efforts provide an important link between DNR and schools. TEAM DNR has been well received by teachers and our requests for presentations continues to grow. Status: During the first five months of 1999, TEAM volunteers have delivered more than 60 classroom presentations. Since the program s inception, it has reached over 3000 students throughout the State. Benchmark: By 2001, increase by 25% the number of programs delivered to Maryland schools. ENVIRONMENTAL JUSTICE

155 T.E.A.M. Classroom Programs
Criteria Pollutants. Sulfur Dioxide (SO 2 ) Nitrogen Oxides (NOx)
 Nitrogen Oxides (NOx)") 1) Sulfur dioxide 2) Nitrogen oxides 3) Carbon monoxide 4) Ozone 5) Particulates 6) Lead Criteria Pollutants Sulfur Dioxide (SO 2 ) SO 2 is a colorless gas that is formed from the combustion of sulfur-containing
1) Sulfur dioxide 2) Nitrogen oxides 3) Carbon monoxide 4) Ozone 5) Particulates 6) Lead Criteria Pollutants Sulfur Dioxide (SO 2 ) SO 2 is a colorless gas that is formed from the combustion of sulfur-containing
Fact Sheet. Chesapeake Bay Water Quality
 Fact Sheet Chesapeake Bay Water Quality Water quality is a critical measure of the Chesapeake Bay s health. For the Bay to be healthy and productive, the water must be safe for people and must support
Final Revisions to the Primary National Ambient Air Quality Standard for Nitrogen Dioxide (NO 2 )
") Final Revisions to the Primary National Ambient Air Quality Standard for Nitrogen Dioxide (NO 2 ) General Overview Office of Air and Radiation Office of Air Quality Planning and Standards January 2010
Final Revisions to the Primary National Ambient Air Quality Standard for Nitrogen Dioxide (NO 2 ) General Overview Office of Air and Radiation Office of Air Quality Planning and Standards January 2010
Air Pollution Sources Overview. Amy Roberts, Division Manager January 24, 2019
 Air Pollution Sources Overview Amy Roberts, Division Manager January 24, 2019 Types of Air Pollutants Criteria Pollutants Particulate Matter Nitrogen Dioxide Ozone Carbon Monoxide Lead Sulfur Dioxide Air
Layers of the Atmosphere. Troposphere Stratosphere Mesosphere Thermosphere
 Air Pollution Layers of the Atmosphere Troposphere Stratosphere Mesosphere Thermosphere Troposphere Composition Sea level 17km Composition 78% Nitrogen 20% Oxygen Other 2%... Water vapor Argon gas Carbon
Department of the Environment. The 2006 Healthy Air Act New Clean Air Act Power Plant Requirements Greenhouse Gas Emission Reduction Act of 2009
 Department of the Environment The 2006 Healthy Air Act New Clean Air Act Power Plant Requirements Greenhouse Gas Emission Reduction Act of 2009 Senate Finance Committee- April 1, 2014 Robert Summers, Ph.D.,
Department of Environmental Conservation. Fiscal Year 2015 Performance Outcomes and Measures
 Department of Environmental Conservation Fiscal Year 2015 Performance Outcomes and Measures Department of Environmental Conservation Fiscal Year 2015 Performance Outcomes and Measures Department of Environmental
DC STORMWATER PLAN CONSOLIDATED TOTAL MAXIMUM DAILY LOAD (TDML) IMPLEMENTATION PLAN
 IMPLEMENTATION PLAN") DC STORMWATER PLAN CONSOLIDATED TOTAL MAXIMUM DAILY LOAD (TDML) IMPLEMENTATION PLAN CONTENTS Introduction 1 The Challenge 5 The Solution 7 Tracking Progress 11 What can you do? 15 INTRODUCTION The DC Stormwater
DC STORMWATER PLAN CONSOLIDATED TOTAL MAXIMUM DAILY LOAD (TDML) IMPLEMENTATION PLAN CONTENTS Introduction 1 The Challenge 5 The Solution 7 Tracking Progress 11 What can you do? 15 INTRODUCTION The DC Stormwater
MARYLAND DEPARTMENT OF THE ENVIRONMENT 1800 Washington Boulevard Baltimore MD
 MARYLAND DEPARTMENT OF THE ENVIRONMENT 1800 Washington Boulevard Baltimore MD 21230 410-537-3000 1-800-633-6101 Martin O Malley Governor Anthony G. Brown Lieutenant Governor November 6, 2009 Shari T. Wilson
PUBLIC POLICY POSITION
 PUBLIC POLICY POSITION POSITION TITLE: Healthy Air DATE APPROVED: February 27, 2016 POLICY PRINCIPLE ON HEALTHY AIR All people are entitled to breathe healthy air and to be free of the adverse health effects
Clean Air Act 101 Air Toxics
 Clean Air Act 101 Air Toxics 2011 Environmental Justice Conference Detroit, Michigan Donnette Sturdivant U.S. EPA Region 4 August 23, 2011 10/3/2011 U.S. Environmental Protection Agency 1 Acid Rain Program
Module 4.1 Pollution Prevention
 Module 4.1 Pollution Prevention Prevention of Air Pollution from Point Sources Prevention of Air Pollution from Point Sources Reducing pollution to air involves considering Point sources Nonpoint sources
Chapter 15 Air Pollution and Stratospheric Ozone Depletion
 Chapter 15 Air Pollution and Stratospheric Ozone Depletion Friedland and Relyea Environmental Science for AP, second edition 2015 W.H. Freeman and Company/BFW AP is a trademark registered and/or owned
Frumkin, 2e Part Three: Environmental Health on the Regional Scale. Chapter 12: Air Pollution
 Frumkin, 2e Part Three: Environmental Health on the Regional Scale Chapter 12: Air Pollution History of Air Pollution Since human beings discovered fire, they began to pollute the air. At first, air pollution
Crittenden County NOx, VOC & CO Emission Inventory Ozone NAAQS Nonattainment
 Crittenden County NOx, VOC & CO Emission Inventory 2008 NAAQS Nonattainment 2014 TABLE OF CONTENTS 1 Introduction 2 A. Background B. Emissions Summary Section I 3 Area Source Inventory Section II 6 On-road
Air Pollution. tutorial by Paul Rich. Brooks/Cole Publishing Company / ITP
 Air Pollution tutorial by Paul Rich Outline 1. The Atmosphere layers, some major processes 2. Urban Air Pollution photochemical & industrial smog 3. Regional Air Pollution from Acid Deposition acid deposition,
Why are resources being polluted?
 Why are resources being polluted? In consideration resources, there are two parts to the equation: consumption and disposal of waste. Pollution is when more waste is added than a resource can accommodate
Proposed Data layers for PCB Resource Center
 Proposed Data layers for PCB Resource Center Chris Wright U.S. Geological Survey January 11, 2017 Introduction PCB Resource Center One stop shop for all resources pertaining to implementing TMDLs Mapping
Maryland Clean Air Progress Report
 Maryland Clean Air 217 Progress Report In 216, it was hot. Really hot. Maryland experienced the sixth-warmest summer ever recorded. Despite that type of weather -- which usually ushers in high levels of
Fine Particles in the Air
 Fine Particles in the Air Presentation for STAPPA Outreach Committee Rich Damberg, EPA Office of Air Quality Planning and Standards April 6, 2004 Particulate Matter: What is It? A complex mixture of extremely
CITY OF SPOKANE VALLEY Request for Council Action
 CITY OF SPOKANE VALLEY Request for Council Action Meeting Date: July 28, 2015 Department Director Approval : Item: Check all that apply: consent old business new business public hearing information admin.
Overview of the Human Health and Environmental Effects of Power Generation: Focus on Sulfur Dioxide (SO 2 ), Nitrogen Oxides (NO X ) and Mercury (Hg)
, Nitrogen Oxides (NO X ) and Mercury (Hg)") The information presented here reflects EPA's modeling of the Clear Skies Act of 2002. The Agency is in the process of updating this information to reflect modifications included in the Clear Skies Act
The information presented here reflects EPA's modeling of the Clear Skies Act of 2002. The Agency is in the process of updating this information to reflect modifications included in the Clear Skies Act
Implementation of the National Ambient Air Quality Standards (NAAQS): Opportunities for Public Participation
: Opportunities for Public Participation") Implementation of the National Ambient Air Quality Standards (NAAQS): Opportunities for Public Participation EPA Environmental Justice Training Research Triangle Park, NC March 18, 2014 Rich Damberg U.S.
Implementation of the National Ambient Air Quality Standards (NAAQS): Opportunities for Public Participation EPA Environmental Justice Training Research Triangle Park, NC March 18, 2014 Rich Damberg U.S.
Streamlines V2, n2 (May 1997) A Newsletter for North Carolina Water Supply Watershed Administrators
 A Newsletter for North Carolina Water Supply Watershed Administrators") Page 1 of 5 STREAMLINES A Newsletter for North Carolina Water Supply Watershed Administrators Volume 2, Number 2 May 1997 Non-Point Source (NPS) Pollution This issue of Streamlines provides basic information
Page 1 of 5 STREAMLINES A Newsletter for North Carolina Water Supply Watershed Administrators Volume 2, Number 2 May 1997 Non-Point Source (NPS) Pollution This issue of Streamlines provides basic information
National Ambient Air Quality Standards, Implementation Plans and Public Participation. Laura McKelvey U.S. EPA
 National Ambient Air Quality Standards, Implementation Plans and Public Participation Laura McKelvey U.S. EPA mckelvey.laura @epa.gov Topics What are the NAAQS? Why are they important? What is the air
STATE OF THE BAY IN 2012
 9 10 11 STATE OF THE BAY IN 2012 Nitrogen &!Phosphorus Bay-wide nitrogen loads were similar to 2010, but phosphorus loads decreased. These loads are highly elated to river flows and stormwater runoff that
Testimony of Shari T. Wilson, Secretary Maryland Department of the Environment. Before. The Senate Committee on Environment and Public Works
 Testimony of Shari T. Wilson, Secretary Maryland Department of the Environment Before The Senate Committee on Environment and Public Works The Clean Energy Jobs and American Power Act (S. 1733) Wednesday,
CHAPTER 11. Air Quality and the Transportation Plan
 Chapter 11. Air Quality and the Transportation Plan 159 CHAPTER 11. Air Quality and the Transportation Plan Background Air quality in Anchorage is subject to national ambient air quality standards established
Air Pollution Poses Severe Health and Environmental Risks
 Testimony of the State and Territorial Air Pollution Program Administrators and the Association of Local Air Pollution Control Officials before the Senate Appropriations Subcommittee on VA, HUD, and Independent
Index of Watershed Indicators: An Overview
 Index of Watershed Indicators: An Overview U.S. Environmental Protection Agency Office of Wetlands, Oceans, and Watersheds Table of Contents Introduction...1 Questions and Answers...3 Flow Charts for the
Introduction. Q2/ 11 Performance Summary
 Intel Ocotillo Environmental Excellence Introduction Quarterly PROGRESS REPORT Issued August 31, 2011 (April 1 - June 30, 2011) This is the 2011 Second Quarter Progress Report for the Intel Ocotillo Environmental
Chapter: Conserving Resources
 Table of Contents Chapter: Conserving Resources Section 1: Resources Section 2: Pollution Section 3: The Three Rs of Conservation *Problems related to the use of Fossil Fuels Limited availability Pollution
Clean Air Act of 1970
 Clean Air Act of 1970 Set National Ambient Air Quality Standards (NAAQS), to protect public health and welfare Set New Source Performance Standards (NSPS), that strictly regulated emissions of a new source
Chapter Introduction. 1.2 Purpose. 1.3 Background. 1.4 Ozone Production and Health Effects. 1.5 Responsibilities of Agencies
 Chapter 1 1.1 Introduction 1.2 Purpose 1.3 Background 1.4 Ozone Production and Health Effects 1.5 Responsibilities of Agencies 1.1 INTRODUCTION On July 18, 1997, the United States Environmental Protection
Air Quality in the San Joaquin Valley
 Air Quality in the San Joaquin Valley Core Values of the Valley Air District Protection of public health Active and effective air pollution control efforts with minimal disruption to the Valley s economic
Cannon River One Watershed, One Plan. POLICY COMMITTEE MEETING January 10, 2018 Rice County Government Center Faribault, MN
 Cannon River One, One Plan POLICY COMMITTEE MEETING January 10, 2018 Rice County Government Center Faribault, MN TASK Task 1. Aggregate Existing Physical & Spatial Data 1A. Create project maps 1B. Meeting
OUR NATION'S AIR STATUS AND TRENDS THROUGH 2015 WELCOME!
 Page 1 of 14 OUR NATION'S AIR STATUS AND TRENDS THROUGH 2015 WELCOME! The U.S. Environmental Protection Agency (EPA) is committed to protecting public health by improving air quality and reducing air pollution.
EPA s Draft Report on the Environment 2003 Technical Document
 EPA s Draft Report on the Environment 23 Technical Document 1.1 Outdoor Air Quality Among the pollutants affecting outdoor air quality are: Criteria pollutants ozone (O 3 ), particulate matter (PM), sulfur
Observations on Nutrient Management and the Chesapeake Bay TMDL
 Observations on Nutrient Management and the Chesapeake Bay TMDL Introduction William J. Rue and Sadie B. Barr EA Engineering, Science & Technology, Inc. 15 Loveton Circle, Sparks, MD 21152 On 29 December
Air pollution is caused by high concentrations of gases and particles emitted form combustion sources (vehicles, power plants, industries)
") AIR POLLUTION Clean Air Act & Criteria Pollutants 7.1-7.5 Motor Vehicle Emissions: 7.8 Indoor Air and Box Models: 7.12 Air Pollution Meteorology: 7.10 Gaussian Plume Modeling: 7.11 1 Air pollution is caused
AIR POLLUTION Clean Air Act & Criteria Pollutants 7.1-7.5 Motor Vehicle Emissions: 7.8 Indoor Air and Box Models: 7.12 Air Pollution Meteorology: 7.10 Gaussian Plume Modeling: 7.11 1 Air pollution is caused
What is air pollution?
 Air Pollution 1 What is air pollution? Air pollution is a mixture of natural and man-made substances in the air we breathe. It is typically separated into two categories: outdoor air pollution and indoor
Phase III Watershed Implementation Plans
 Phase III Watershed Implementation Plans Including programmatic outcomes in your planning to provide co-benefits for your community and reduce pollution Rachel Felver Chesapeake Bay Program Director of
The Chesapeake Bay Program Biennial Strategy Review System: A Guide to Your Quarterly Progress Meeting
 The Chesapeake Bay Program Biennial Strategy Review System: A Guide to Your Quarterly Progress Meeting Table of Contents Executive Summary...2 Introduction...3 Quarterly Progress Meeting Template...4 Appendix
Chesapeake Bay TMDL and Maryland s Watershed Implementation Plan. Robert M. Summers, Ph.D. Acting Secretary Maryland Department of the Environment
 Chesapeake Bay TMDL and Maryland s Watershed Implementation Plan Robert M. Summers, Ph.D. Acting Secretary Maryland Department of the Environment TMDL Background TMDL = Total Maximum Daily Load. The maximum
CHAPTER 15 WATER POLLUTION. INTO THE GULF Researchers try to pin down what s choking the Gulf of Mexico
 CHAPTER 15 WATER POLLUTION INTO THE GULF Researchers try to pin down what s choking the Gulf of Mexico SAVING THE BAY Teams of researchers try to pin down what s choking the Chesapeake Water pollution
Ch. 1: Watersheds and Wetlands. Lesson 1.5: Factors That Affect Wetlands and Watersheds Part 2
 Ch. 1: Watersheds and Wetlands Lesson 1.5: Factors That Affect Wetlands and Watersheds Part 2 Index of Watershed Indicators (IWI) The Index is a compilation of information on the "health" of aquatic resources
Americans make the equivalent of round
 AIR POLLUTION CE 326 Principles of Environmental Engineering Prof. Tim Ellis January 18, 2008 Air Pollution Factoids Americans make the equivalent of round trips to the moon each year in their automobiles.
Air Pollution. Introduction. Natural Air Pollution
 Air Pollution Introduction Anything in the atmosphere that decreases quality of life for organisms Can be chemical, particulate, biological Generally restricted to the troposphere Both natural and anthropogenic
GE 2211 Environmental Science and Engineering Unit III Air Pollution. M. Subramanian
 GE 2211 Environmental Science and Engineering Unit III Air Pollution M. Subramanian Assistant Professor Department of Chemical Engineering Sri Sivasubramaniya Nadar College of Engineering Kalavakkam 603
Monday, January 9th, :00 pm. Montgomery Park, Lobby Conference Rooms
 Monday, January 9th, 2016 6:00 pm Montgomery Park, Lobby Conference Rooms Purpose of This Meeting Provide General Information/Updates on 2016 IR and MD s TMDL Prioritization Encourage public dialogue,
Air Quality Program
 M E D I A PA C K A G E Air Quality Program www.broward.org/pollutionprevention/airquality Agency Overview: Table of Contents Agency Overview 2 Did You Know? 3 Criteria Air Pollutants 4 Air Quality Index
Emerging Pollution Control Issues. In 2001, MPCA proposed environmental tax reform partly because it believed
 3 Emerging Pollution Control Issues SUMMARY Federal requirements for a new approach to water quality management will present new challenges for the Minnesota Pollution Control Agency (MPCA) particularly
Chapter 11: Hazardous Materials A. INTRODUCTION
 Chapter 11: Hazardous Materials A. INTRODUCTION This chapter relies on the analysis from the Fresh Kills Park Final Generic Environmental Impact Statement (FGEIS) and summarizes the conclusions drawn from
Water Quality. New Standards on the Way? by Marty P. Lamia and Albert R. Capellini, P.E., BCEE
 Water Quality New Standards on the Way? by Marty P. Lamia and Albert R. Capellini, P.E., BCEE Water quality is a critical component having a direct effect on the physical and economic well-being of the
OVERVIEW CAPACITY & CONDITION
 OVERVIEW Over 18,000 sites and an associated 22 million acres of land are related to the primary hazardous waste programs that comprise much of the nation s hazardous waste infrastructure, and more than
Every Breath You Take. Provincial Health Officer s Annual Report 2003
 Every Breath You Take Provincial Health Officer s Annual Report 2003 Report Overview The Air We Breathe Outdoor Air Pollutants & Their Health Effects Indoor Air Pollutants & Their Health Effects Air Pollutants
Chapter 14. Water Pollution
 Chapter 14 Water Pollution The Chesapeake Bay Chesapeake Bay largest estuary in the US Pollutants: Excess nitrogen and phosphorus From 3 major sources: Consequence of increased nutrients Sediment increase
City of Dallas Contractor/Vendor/Consultant,
 2007/ Revised August 24, 200! Revision Number: 3 City of Dallas City of Dallas Contractor/Vendor/Consultant, In January 2005, the Dallas City Council adopted an Environmental Policy for the City of Dallas
FACT SHEET. Public Comment Period Expiration Date: To be determined Contact: Raymond Bahr
 FACT SHEET NPDES Permit Number: MDR 055501 MDE Permit Number: 13-IM-5501 Public Comment Period Expiration Date: To be determined Contact: Raymond Bahr 410-537-3543 The Maryland Department of the Environment
FACT SHEET. Public Comment Period Expiration Date: March 30, 2017 Contact: Raymond Bahr
 FACT SHEET NPDES Permit Number: MDR 055501 MDE Permit Number: 13-IM-5501 Public Comment Period Expiration Date: March 30, 2017 Contact: Raymond Bahr 410-537-3543 The Maryland Department of the Environment
Going One Step Beyond in North Denver
 Going One Step Beyond in North Denver A Neighborhood Scale Air Pollution Modeling Assessment Part I : Predicted Mobile Emissions in 2035 Michael Ogletree Denver Environmental Health Purpose To compare
BACKGROUND TO THE 1993 GENERAL PLAN AS AMENDED
 General Plan Air Quality Element BACKGROUND TO THE 1993 GENERAL PLAN AS AMENDED Portions of the background section text were updated as part of the 2011 amendments to the County General Plan. County of
Environmental Science 101 Air Resources. Fall Lecture Outline: Terms You Should Know: Learning Objectives: Reading Assignment:
 Environmental Science 101 Air Resources Fall 2012 1 Lecture Outline: 10. AIR POLLUTION A. The Atmosphere An Introduction B. Background Information About Air Pollution C. Six Principal Pollutants D. Air
5.0 LONG-TERM CEQA CONSIDERATIONS
 5.0 LONG-TERM CEQA CONSIDERATIONS Section 15126 of the CEQA Guidelines requires that all phases of a project must be considered when evaluating its impact on the environment, including planning, acquisition,
City of Dallas Contractor/Vendor/Consultant,
 ,. Adopted: December 1 2007 / Revised August 24, 2010 / Revision Number: 3 City Dallas City Dallas Contractor/Vendor/Consultant, In January 2005, the Dallas City Council adopted an Environmental Policy
Earth s Atmosphere. Air Quality. 7. If no humans lived on Earth, there would be no air pollution.
 CHAPTER 4 LESSON 4 Earth s Atmosphere Air Quality Key Concepts How do humans impact air quality? Why do humans monitor air quality standards? What do you think? Read the two statements below and decide
Norwalk Harbor Report Card
 Norwalk Harbor Report Card C+ Following the water s trail from your house, into the river, and to the Harbor The way land is used in a watershed has a significant effect on water quality. In areas where
UGRC 144 Science and Technology in Our Lives/Geohazards
 UGRC 144 Science and Technology in Our Lives/Geohazards Session 13 Environmental Pollution Lecturer: Dr. Patrick Asamoah Sakyi Department of Earth Science, UG Contact Information: pasakyi@ug.edu.gh College
Section 4 The Air We Breathe
 Section 4 The Air We Breathe Key Concept Air is an important natural resource that is affected by human activities. What You Will Learn Air pollution is caused by human activities, such as burning fossil
CLEAN AIR FOR EUROPE - THE BASELINE ASSESSMENT
 CLEAN AIR FOR EUROPE - THE BASELINE ASSESSMENT Clean air is essential for a good quality of life and it enhances the social well being of European citizens. Scientific assessments reveal a range of harmful
Ergonomic assessment and implement controls in Automobile Closed room Testing by using Risk assessment Methodology.
 Ergonomic assessment and implement controls in Automobile Closed room Testing by using Risk assessment Methodology. Jithin V 1, 1BMW India Pvt Ltd, Mahindra World City, Chengalpet-603002 ---------------------------------------------------------------------***---------------------------------------------------------------------
MPCA Citizens Board. Michael Sandusky Director Environment Analysis and Outcomes Division
 DEPARTMENT : POLLUTION CONTROL AGENCY DATE : September 17, 2010 SF-00006-05(4/86) STATE OF MINNESOTA Office Memorandum TO : FROM : MPCA Citizens Board Michael Sandusky Director Environment Analysis and
Frequently Asked Questions
 North Wake Landfill Q1. Where is the North Wake Landfill located? The North Wake Landfill is located at 9300 Deponie Drive, off of Durant Road in north Raleigh, between Falls of Neuse Road and Capital
Support legislation that will protect the quantity of water in Lake Erie
 Specific Regional Priorities Each of Pennsylvania s major drainage basins has an array of individual characteristics that distinguish it from other regions of the state. These include diverse geographic
Chesapeake Bay Program Indicator Analysis and Methods Document Reducing Pollution Indicators Updated May 2018
 1 Chesapeake Bay Program Indicator Analysis and Methods Document Reducing Pollution Indicators Updated May 2018 Indicator Title: Reducing Pollution Relevant Outcome(s): 2017 Watershed Implementation Plans
Preventing Illness and Enhancing Health Through Quality Service
 Background This report card was originally developed by a committee of concerned citizens and public officials interested in the status of key environmental health issues in Rock County. The Rock County
6Compliance. Reduce compliance costs. Plan, program, budget, and execute projects and activities that facilitate compliance
 6Compliance Department of Defense (DoD) operations must comply with applicable laws, regulations, Executive Orders (E.O. s), Final Governing Standards (FGS), and agreements designed to protect human health
Oregon. 800 NE Oregon St. #640 Portland, OR (971)
") Air Quality Frequently Asked Questions Oregon Environmental Public Health Tracking (EPHT) Oregon ENVIRONMENTAL PUBLIC HEALTH TRACKING 800 NE Oregon St. #640 Portland, OR 97232 www.oregon.gov/dhs/ph/epht
Air Quality Frequently Asked Questions Oregon Environmental Public Health Tracking (EPHT) Oregon ENVIRONMENTAL PUBLIC HEALTH TRACKING 800 NE Oregon St. #640 Portland, OR 97232 www.oregon.gov/dhs/ph/epht
S E C T I O N. six. Environment
 S E C T I O N six Environment 202 VOLUME 15: EXAMPLES OF SUCCESSFUL PUBLIC-PRIVATE PARTNERSHIPS 23 Chesapeake Forest, Maryland, United States P R O J E C T S U M M A R Y The Chesapeake Bay is the largest
Contents. Alamo Area Metropolitan Planning Organization. Introduction S. St. Mary s Street San Antonio, Texas 78205
 Contents Introduction 1 Alamo Area Metropolitan Planning Organization Tel 210.227.8651 Fax 210.227.9321 825 S. St. Mary s Street San Antonio, Texas 78205 www.alamoareampo.org aampo@alamoareampo.org Pg.
Background What is the Integrated Report (IR)? CWA Background
? CWA Background") Department of the Environment Monday, September 8th, 2014 6:00 pm Montgomery Park, Lobby Conference Rooms Purpose of This Meeting Provide General Information/Updates on 2014 IR Encourage public dialogue,
Department of the Environment Monday, September 8th, 2014 6:00 pm Montgomery Park, Lobby Conference Rooms Purpose of This Meeting Provide General Information/Updates on 2014 IR Encourage public dialogue,
Section 5: Water Quality
 T Section 5: Water Quality he California Urban Water Management Planning Act (Act) requires that the 2010 Urban Water Management Plan (UWMP) include information, to the extent practicable, on the quality
High-energy Hydrogen II Teacher Page
 High-energy Hydrogen II Teacher Page Video: Hydrogen - The Pollution Solution Student Objectives will be able to explain how fossil fuels have caused our pollution problem will be able to explain how hydrogen
CHAPTER 18: AIR POLLUTION SOUTH ASIA THE ATMOSPHERE APES 2013
 CHAPTER 18: AIR POLLUTION APES 2013 1 SOUTH ASIA ASIAN BROWN CLOUD - TWO MILES THICK AND IS ABOUT THE SIZE OF THE CONTINENTAL UNITED STATES COMPOSED OF 1/3 = DUST, SMOKE, AND ASH 2/3 = ACIDIC COMPOUNDS,
Environmental Toxicology
 The Science of Chemical Safety Essential Toxicology - 3 Environmental Toxicology John Duffus & Howard Worth IUPAC Educators Resource Material IUPAC 1 Environmental Toxicology Large exposures to chemicals
Thief River One Watershed One Plan Prioritization Matrix Prioritization of Issues
 Thief River One Watershed One Plan Prioritization Matrix Prioritization of Issues The Prioritization Matrix is a categorized table that lists the issues that were compiled for the Thief River watershed,
PUTNAM COUNTY COMPREHENSIVE PLAN EXHIBIT DD INFRASTRUCTURE ELEMENT
 COMPREHENSIVE PLAN EXHIBIT DD D. Infrastructure Element (Sanitary Sewer, Potable Water, Solid Waste, Drainage and Natural Groundwater Aquifer Recharge) Goals, Objectives and Policies GOAL D.1: Putnam County
A Primer on Stormwater Management, your Facility and the Chesapeake Bay. Tom Schueler Chesapeake Stormwater Network June
 A Primer on Stormwater Management, your Facility and the Chesapeake Bay Tom Schueler Chesapeake Stormwater Network June 5. 2017 Key Themes Why do we need to be concerned about Stormwater? What are all
Monterey Bay Unified Air Pollution Control District (
 3.3.8 Air Quality Introduction The Air Quality section addresses the impacts of the project on ambient air quality and the exposure of people, especially sensitive individuals, to hazardous pollutant concentrations.
Particulate Matter Air Pollution and Health Risks ( edited for AHS APES)
") Particulate Matter Air Pollution and Health Risks ( edited for AHS APES) What is Particulate Matter? Image from http://www.epa.gov/eogapti1/ module3/distribu/distribu.htm Particulate matter (PM) describes
Particulate Matter Air Pollution and Health Risks ( edited for AHS APES) What is Particulate Matter? Image from http://www.epa.gov/eogapti1/ module3/distribu/distribu.htm Particulate matter (PM) describes
CHAPTER 2 - Air Quality Trends and Comparisons
 CHAPTER 2 - Air Quality Trends and Comparisons Particulate Sampling Total Suspended Particulate Matter With the monitoring for PM 2.5 particulate matter being labor intensive, DEP reduced the number of
Appendix C: GHG Emissions Model
 Appendix C: GHG Emissions Model 1 METHOD OVERVIEW The Maryland Statewide Transportation Model (MSTM) Emissions Model (EM) is a CUBE-based model that uses emission rates calculated by the MOVES2010 EPA
Technical Document EPA s Draft Report on the Environment Chapter 1 - Cleaner Air 1.2 Acid Deposition 1-25
 Technical Document EPA s Draft Report on the Environment 3 1. Acid Deposition Sulfur dioxide and NO X emissions in the atmosphere react with water, oxygen, and oxidants to form acidic components, also
Introduction. Remedial Action Objectives. In This Guide
 Addendum to Citizens Guide Proposed soil cleanup plans for additional Tax Blocks for Lockheed Martin s Middle River Complex Winter 2013-2014 Lockheed Martin Would Like to Invite the Community to a Public
RURAL RESIDENTIAL COMMUNITY ROLE COUNCIL ROLE RURAL RESIDENTIAL ALL COMMUNITIES
 Orderly and Efficient Land Use Align land use, development patterns, and infrastructure to make the best use of public and private investment. Discourage future development of rural residential patterns
Southwood Community s Public Water Supply. Consumer Confidence Report 2015
 Southwood Community s Public Water Supply Consumer Confidence Report 2015 Southwood Public Water Supply King Road / County Road 995 Ashland, Ohio 44805 http://southwoodestateswater.weebly.com/ Section
H. WATER RESOURCES. a. describe the characteristics, uses, and quality of Orland's significant water resources;
 H. WATER RESOURCES 1. Purpose This section will present an overview of Orland's water resources. An understanding of water resources is important since all residents must have a reliable source of drinking
CE 326 Principles of Environmental Engineering Prof. Tim Ellis
 AIR POLLUTION CE 326 Principles of Environmental Engineering Prof. Tim Ellis January 25, 2008 Seven Major Pollutants of Concern 1. P 2. S Oxides (SO X ) 3. O 4. N Oxides (NO X ) 5. Carbon M (CO and other
The History of Air Pollution Air pollution is not a new phenomenon.
 Name: April 14-18, 2014 Chapter 12, Air Section 1: What Causes Air Pollution? What Causes Air Pollution? is the contamination of the atmosphere by wastes from sources such as industrial burning and automobile
Overview of Chapter 21
 21 Water Pollution Overview of Chapter 21 Types of Water Pollution Water Quality Today Agricultural, Municipal, Industrial, Groundwater, Water pollution internationally Improving Water Quality Laws Controlling