Air Quality, Health, and Ecosystem Co-Benefits of Policy Options for a U.S. Power Plant Carbon Standard. Kathy Fallon Lambert December 13, 2017
|
|
|
- Tabitha Robertson
- 6 years ago
- Views:
Transcription


1 Air Quality, Health, and Ecosystem Co-Benefits of Policy Options for a U.S. Power Plant Carbon Standard Kathy Fallon Lambert December 13,
2 Acknowledgements Charles Driscoll Syracuse University Jonathan Buonocore Harvard School Public Health Dallas Burtraw Resource For the Future Habib Fakhraei Syracuse University Jon Levy BU School Public Health Steve Reid Sonoma Technologies Joel Schwartz Harvard Public School Health Pam Templer Boston University Jana Milford University of Colorado, Boulder Shannon Capps Drexel University Ken Craig Sonoma Technologies Scenarios: BPC, NRDC, MJB 2


3 Accounting for Full Benefits or ancillary benefits 3

4 Average Annual PM2.5 in Reference Case 4


5 Power Plant Carbon Standards Co-Benefits Study Scenario 1: Inside the Fence line Scenario 2: Beyond the Fence line - resembles CPP Scenario 3: Social Cost of Carbon Reference Case: AEO 2013 for demand 5


6 Study Model Platform IPM Power Sector Analysis & Emissions Estimates CMAQ Air Quality Projections & Deposition Estimates BenMap Human Health Benefits PnET-BGC Acidification Benefits Ozone benefits for timber & crops Visibility Improvements Reference Case Scenario 1: Inside Fence line Scenario 2: Beyond Fence line/cpp Scenario 3: Cost of Carbon 6
7 Scenario Assumptions Beyond the Fence line State-specific rate-based performance standard Establishes benchmark emissions rate for each state For 2020, the national emission rate targets are 1,500 lbs/mwh for coal and 1,000 lbs/mwh for gas. Also allows averaging and trading Allows states to develop alternative plans, including massbased standards, provided they achieve equivalent emission reductions Inside the Fence line Uses best-in-class heat rates for different coal plant categories Emission rate equivalent to closing gap to best in class by 40% Unit Retrofits Co-fire or convert to natural gas or biomass Combination of modest plant efficiency retrofit and co-firing Improves fleet-wide average heat rate 4%; national average emissions rate of 2000 lbs/mwh for coal and 1000 lbs/mwh for gas No new coal plants built 7
8 Change in National Emissions 2005 & 2020 Beyond the Fence line CO 2 = -35% from 2005 SO 2 = -27% NO x = -22% Inside the Fence line CO 2 = -17% from 2005 SO 2 = +3% NO x = -3% Final Clean Power Plan Mass-based Illustrative Case CO 2 = -32% from 2005 by 2030 SO 2 = -21% (2015 RIA) or -31% (2017 RIA) NO x = -21% (2015 RIA) or -23% (2017 RIA) Note: actual emissions reductions depend on State Implementation Plans 8
9 Air Quality Results Beyond the Fence line All lower 48 states experience an improvement in air quality in 2020 compared to reference case States with largest statewide average decreases in air pollution detrimental to human health include: OH, PA, MD, WV, IL, KY, MO, IN, AR, CO, AL, WV 41 million people in 41 large cities would gain higher air quality Inside Fence line Large areas of eastern and western US experience decrease in air quality in 2020 compared to reference case 9

10 BEYOND THE FENCE LINE Darker brown = larger reductions 10
11 INSIDE THE FENCE LINE Darker blue = larger increases 11

12 BEYOND THE FENCE LINE 12

13 INSIDE THE FENCE LINE 13
 CE (95%")
14 Health Benefits Health outcome Pollutant Inside Fence line Beyond Fence line CE (95% CI) CE (95% CI) 14

15 >= 25 years) =>65 years =>65 years >18 years =>30 years =>65 years 15
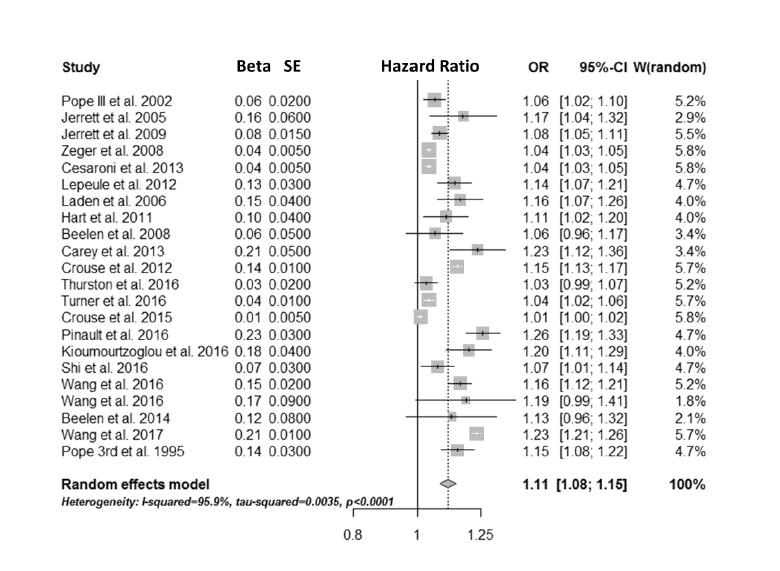
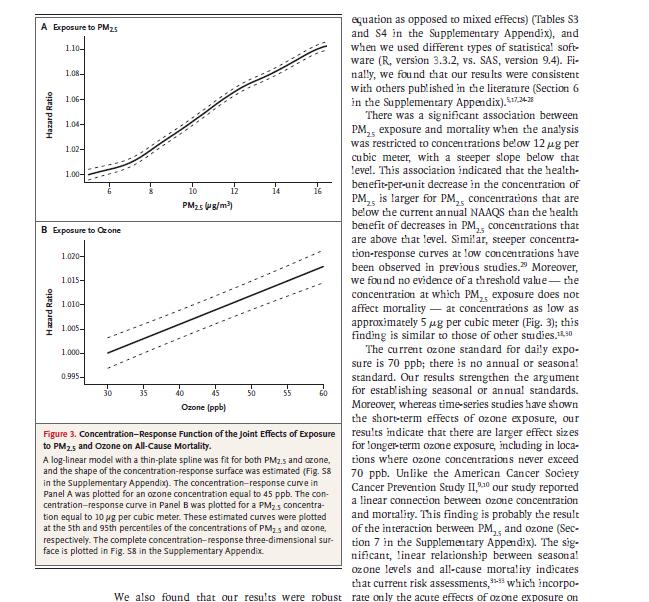
16 Recent Research Qi et al. NEJM 2017 Medicare beneficiaries m people Across US/exposures 460 million person-years of follow-up Relationship between PM 2.5, ozone, and all-cause mortality almost linear, with no signal of threshold down to 5 μg per cubic meter and 30 ppb. Significant association between PM 2.5 exposure and mortality when the analysis was restricted to concentrations below 12 μg/m 3, with a steeper slope below that level. Health benefit per-unit decrease in the concentration of PM 2.5 is larger below the current annual NAAQS than above.

17 BEYOND THE FENCE LINE Cases map #2 PA = 330 OH = 280 TX = 230 IL = 210 MI = 190 NY =

18 INSIDE THE FENCE LINE Scenario 1 lives CA = -33 NY = -16 IL = -15 IN =
19 BEYOND THE FENCE LINE 19

20 INSIDE THE FENCE LINE 20
21 Costs & Benefits (2010 USD) Beyond the Fence Line (billions of USD 2010 and 2011) Estimated health co-benefits = $29 per year Carbon benefits = $21 per year Estimated cost in 2020 = $17 Net benefits = $33 per year 2015 RIA net benefits = $25 to $ RIA net benefits = $15 to $38 $-12.7 to $2.1 Buonocore et al. Plos One; EPA RIA 2015,

22 Value of Health Benefits Beyond Fence line
23 Policy Comparison Inside Fence line Beyond Fence line EPA Repeal
24 Study Take-Aways Carbon standards can produce large and widespread improvements in air quality and health outcomes that far exceed costs. But design of power plant carbon standards strongly influences the magnitude, and distribution of benefits. Inside the Fence line standards could generate disbenefits. Results demonstrate the importance of comparing full costs and benefits for a range of policy alternatives and reference cases. 24

25 Total national emissions in % 22% 34% 36% Policy Cases Roll-back Cases 25
26 Take-Aways for Future Policy 1. Multi-pollutant approach illuminates emission interactions, unintended disbenefits, and policy approach with the largest benefits per ton of CO 2 reduced. 2. Scientific understanding of benefits for multiple endpoints and at various levels of exposure is increasing. 3. An RIA that under-estimates benefits could be vulnerable to overturn, weaken policy rationale perpetuate regulatory uncertainty for electricity sector. 4. Federal standard important for coherent approach to cross-boundary pollution. City/state approach important but patchwork may result; leading states currently tend to be lower emitting. 5. Need to codify acceptable practices for cost-benefit analysis with guidelines for addressing full benefits and costs. 26
27 Back Pocket 27
28 12000 U.S. Electricity Sector Emissions (metric tons) Business as usual Power plant carbon standards Carbon dioxide (million) Sulfur dioxide (thousand) Nitrogen oxides (thousand) 28
29 Trends in Average Annual PM2.5 29
30 Reference case 2013 AEO EIA 2013 Annual Energy Outlook determines energy demand Mercury and Air Toxics Standards (MATS) implemented Clean Air Interstate Rule implemented, including Phase II in 2015 Regional Greenhouse Gas Initiative (RGGI) model rule for emissions trading included (w/out NJ) CA Assembly Bill 32 (AB32) included Regional haze rule included Wind power production tax credit (PTC) expires Onshore wind costs: DOE/LBL 2012 Wind Technologies Report Nuclear units re-licensed, 20-year extension existing state-level require-ments for power sector emissions reductions and renewable energy portfolio standards are implemented under this scenario By 2020, the reference case results in modest shifts in energy generation from 2005 and achieves an estimated 15.2% decrease in annual CO2 emissions from the electricity sector (Table 1). 30
31 TWh TWh Combined Cycle (Gas) Fossil Fuel Generation in 2020 Combustion Turbine (Gas) Coal (without CCS) Biomass cofiring Coal (with CCS) 900 Reference case Scenario 1 Scenario 2 Scenario 3 CCS = carbon storage and sequestrati on Renewable Generation and Efficiency in Reference case Scenario 1 Scenario 2 Scenario Nuclear Hydro Wind Biomass New Energy Efficiency Other Renewables 31

32 MMST (CO2) and TST (SO2 and NOx) 2,500 Annual Power Sector Emissions in ,250 2,199 2,000 1,719 1,742 1,792 Reference case 1,500 1,000 1,268 1,332 1,293 1,033 Scenario Inside Fence 1 line Scenario Beyond Fence 2 line MMST = million short tons TST = thousand short tons CARBON DIOXIDE SULFUR DIOXIDE NITROGEN OXIDES CO2 SO2 NOx 32
33 IPM 2417 unique power plants in the U.S. IPM is a dynamic power sector production cost linear optimization model for North America. It incorporates many drivers of generation and power sector demands, including wholesale power, system reliability needs, environmental limitations, fuel selection, power transmission, capacity, and operational elements of generators on the power grid, to estimate generation and resulting emissions. By running IPM the least-cost means of meeting electric generation energy and capacity requirements are determined, while complying with the requirements specified in each of the policy scenarios. The results suggest that generation mix, coal retirements, cost of electricity, and building of new generation capacity are all sensitive to varying levels to natural gas price and cost of demand-side energy efficiency. 33
34 Scenario A1: Low Stringency On-Site Rate Reductions Policy: coal plants are required to either invest in on-site efficiency (heat rate) retrofits, OR Satisfy equivalent CO2 emission rate reduction through: 34 Co-fire or convert to natural gas or biomass Combination of modest plant efficiency retrofit and co-firing Unit-specific HR improvement & cost based on analysis of available data Coal units with on-site gas or nearby pipeline can co-fire 15% natural gas Coal units can co-fire up to 15% biomass (EIA biomass supply and cost)
35 BPC Heat Rate Approach First, coal units were split into categories based on the unit s capacity, fuel type, steam cycle, and boiler type. These parameters were found to be correlated with a unit s heat rate in an analysis conducted for the BPC by Andover Technology Partners. In general, within each category, the unit with the lowest heat rate set a best-in-class heat rate standard for the group. The best-in-class heat rates developed for the BPC modeling approach are shown in Table 1. For BPC s simplified approach, each unit that is not best-in-class has the option to select one of two heat rate investments that would bring it closer to the best-in-class heat rate for its group. Each unit can select either a 25 percent investment option that improves its heat rate by an amount that closes the gap between its unit-specific heat rate and the best-in-class heat rate by 25 percent or a 40 percent investment option that closes the gap by 40 percent. Heat rate data is derived from NEEDS v Subcritical Capacity in MW Bituminous Subbituminous Lignite CFB Supercritical MW <100 9,792 10,000 * 10,000 * 100 MW <200 9,290 9,633 * 9,497 * 200 MW < 500 8,763 8,763 9,243 8,763 8,687 MW 500 8,518 8,763 8,763 ** 8,518 *There are not enough supercritical or lignite units under 200 MW to establish a best-in-class category. **There are no CFB units larger than 500 MW. 35
36 111(D) MODELING RESULTS 36 A1: low stringency scenario has modest changes from reference case 0.8% increase in generation from coal Plant efficiency upgrades = more electricity generated per coal burned 0.8% decrease in gas generation Plant upgrades at coal units allow them to better compete with gas Slightly fewer coal retirements (2 GW) Total US generation in 2020 projected to be 4212 TWh Difference in U.S Generation between A1 and Reference (TWh) Gas Coal Renewables
37 111(D) MODELING RESULTS 37 Illustrative Map of Key States in Reporting Regions New England Pacific Northwest MISO New York PJM Central/West PJM East/South California Other West SPP SERC-Central SERC-Delta SERC-Southeast ERCOT Florida *SERC-Gateway covers a portion of Illinois, Iowa, and Missouri. Note: This map shows groups of states that approximate the aggregate reporting regions. Actual regions cross state lines in many instances. This map is illustrative and does not show exact regional boundaries.
38 111(D) MODELING RESULTS 38 Percent Change in 2020 Emissions between A1 and Reference CO 2 SO 2 NO x California -7.8% 12.2% 1.1% ERCOT -0.2% 4.6% -0.1% FRCC 0.1% 4.7% -3.1% ISONE -2.7% -7.9% -2.8% MISO -3.2% 20.6% -5.2% NYISO -4.6% -8.5% -4.7% OTHERWES -1.6% -3.6% -1.2% PJMC -2.7% -2.5% -1.6% PJME -3.9% -7.6% -3.2% PNW 0.9% 1.6% -10.4% SERCC -3.5% -1.9% -2.7% SERCD -2.2% -2.2% -2.2% SERCG -0.4% -4.5% -0.1% SERCSE -1.2% 0.8% 0.5% SPP -2.7% -3.9% -5.1% US -2.2% 2.8% -2.9%
39 111(D) MODELING RESULTS 39 Difference in California 2020 Emissions between A1 and Reference (%) Difference in California 2020 Generation between A1 and Reference (TWh) 25% 4 20% % 10% 12.2% Gas Oil/Gas Steam Hydro Renewables % 0% -5% -10% -7.8% 1.1% CO2 SO2 NOx The apparent significant % increase in SO2 is actually a function of very low SO2 emissions (no coal) which increase with biomass generation
40 111(D) MODELING RESULTS 40 Difference in MISO 2020 Emissions between A1 and Reference (%) Difference in MISO 2020 Generation between A1 and Reference (TWh) 25% 20% 20.6% % % 0.4 5% % -5% -10% CO2 SO2 NOx -3.2% -5.2% Gas Coal w/out CCS Oil/Gas Steam Renewables Dispatch changes w/in the coal fleet, due to changing costs after efficiency upgrades, are likely cause of seemingly contradictory emissions results MISO = IA, IL, IN, MI, MN, MO, MT, ND, NE, OH, SD, WI A1 coal plant retirements, : 5 GW A1 heat rate upgrades, : 41 GW

41 Thousand Short Tons ISONE NYISO MISO PJM SERCC SERCD SERCG SERCSE ERCOT + SPP FRCC PNW CA + OTHERWEST Scenario 2: Beyond Fence line REGIONAL SO2 EMISSION REDUCTIONS IN % -8% -14% -29% -32% -37% -57% -26% -78% -12% -48% -19%
42 Thousand Short Tons ISONE NYISO MISO PJM SERCC SERCD SERCG SERCSE ERCOT + SPP FRCC PNW CA + OTHERWEST 14 Scenario 2: Beyond Fence line 0-22% -16% -20% -18% -32% -32% -50% -16% -25% -14% -30% -19%
43 CMAQ Details CMAQ v4.7.1 Based on EPA s 2007/2020 Modeling Platform Year 2007 meteorology from WRF v3.1 held constant CB05 gas chemistry AE5 aerosol chemistry Multi-pollutant options engaged for mercury chemistry Spatial Plots National Emissions Inventory Air Quality Concentrations SMOKE CMAQ Post-Processing Data Exports IPM Data Deposition Rates WRF Meteorology GEOS-Chem Initial & Boundary Conditions Analysis Products 43

44 Analysis Details 4 CMAQ Simulations 2020 reference case 3 future year (2020) emissions policy scenarios Processes simulated Emissions, advection, diffusion, chemistry, deposition Gridded air quality concentrations and deposition rates on a 12- km CONUS domain CMAQ Modeling Grid 12-km grid cell resolution 396 x 246 grid cells 44
45 BenMap We used BenMAP CE v1.0.8, published by the U.S. EPA (USEPA, Office of Air and Radiation, n.d.). BenMAP CE is a Geographic Information System (GIS)-based software tool designed for calculating the health co-benefits of air quality management scenarios. BenMAP contains data on population, demographics, and incidence and prevalence rates of health outcomes. We used BenMAP, with 2020 population and baseline health incidence and prevalence rates in conjunction with concentrationresponse functions we developed and the CMAQ results to estimate the health co-benefits of the three policy scenarios. We use the valuation module in BenMAP CE v1.1 with default methods and values to estimate the economic value of the cobenefits at county, power region, and national scales. 45

46 BenMAP Community Edition v1.08 Model year CMAQ model year Default 2020 population estimates, baseline disease incidence, valuation, pooling 46
47 Health Effects in U.S. (2005) PM ,000 non-fatal heart attacks 200,000 hospital admissions and emergency room visits 2.5 million asthma exacerbations 18 million lost days of work, and other public health effects in the U.S. 130,000 or 320,000 premature deaths in 2005 depending on study Ground-level ozone 77,000 hospital admissions and emergency room visits 11 million school absence days 4,700 or 19,000 premature deaths depending on the study Fann et al
48 Roman Expert Elicitation 48
49 Source Health Endpoint Age Group Total Central Estimate (medical + opportunity costs) Dockins et al Mortality $6,985,000 Eisenstein et al ; Cropper and Krupnick, 2000 Eisenstein et al ; Cropper and Krupnick, 2000 Eisenstein et al ; Cropper and Krupnick, 2000 Eisenstein et al ; Cropper and Krupnick, 2000 Eisenstein et al ; Cropper and Krupnick, 2000 HCUP 2007 HCUP 2007 Acute Myocardial Infarction $63,057 - $155,668 Acute Myocardial Infarction $73,928 Acute Myocardial Infarction $79,079 Acute Myocardial Infarction $155,668 Acute Myocardial Infarction $49,651 Hospital Admissions, All Respiratory Hospital Admission, All Cardiovascular $27, $32,314

50 NEJM Results 50
51 51
52 Costs We use the IPM output to develop three partial equilibrium cost cases to compare with the partial equilibrium co-benefit estimates. Our measure of costs includes capital, operations and maintenance for generation and investments in energy efficiency and assumes a default real interest rate of 4.77% for all expenditures. The costs for capital and operations and maintenance are the same in each of the three cost cases because generation is the same. Uncertainty arises in how to account for the costs of energy efficiency, and we explore three options.

53
54 $ Health Co-benefits

55 Net Benefits by Region
56 Tree & Crop Results Map of change in W126 Reference case, scenario 2 Table showing : Initial productivity decrease and Reduction in productivity decrease for specific species Corn = Reference case PPL = 1.5%; 15.6% decrease in productivity losses from reference case in 2020 Soybean = Reference case PPL = 1.64%; 8.4% decrease in productivity losses (PPL) from reference case in 2020 Eastern cottonwood = Reference case PPL = 32%; 8.4%decrease in productivity losses from reference case in 2020 Black cherry = Reference case PPL = 10%; 7.6% 8.4%decrease in productivity losses from reference case in
57 Visibility Benefits 57
58 Emissions Comparison NCC Study Series Unit No CPP Scenario 2 No CPP- Scenario 2 CPP No CPP No CPP - CPP Percent change CPP No CPP No CPP - CPP Coal generation Thousand GWh 1,126 1, ,024 1, Gas generation Thousand GWh 1,340 1, ,499 1, Renewables generation Thousand GWh ,114 1, Total generation Thousand GWh 4,110 4, ,442 4, Henry Hub Nat gas price 2016$/MMBtu CO2 emissions Million short tons ,814 2, ,694 2, SO2 emissions Thousand short tons ,034 1, , NOx emissions Thousand short tons ,015 1, , Note: Sources: Renewables include hydro RIA: AEO: 58
59 PMD Avoided Our analysis (2013 AEO) Upper bound = deaths per ton SO2 averted Central measure 3500 (0.008 deaths per ton SO2 averted) 95% confidence interval 780 to 6100) Final CPP (2015 AEO) 1500 to 3530 Upper bound = deaths per ton SO2 averted Repeal (2017 AEO) 1900 to 4500 (all concentrations) Upper bound = deaths per ton SO2 averted Mid-point = 3200 (0.01 per ton SO2 averted) 1800 to 2400 (zero below LML of 5.8) Upper bound = to 450 (zero below NAAQS) 59
60 Change in projected NO X emissions (in 2030) from CPP implementation scenarios to potential rollback scenarios (thousand short tons) (positive values indicate increased emission from the CPPs (i.e., rows) to the rollback (i.e., columns) scenarios) CPP Existing sources only (PC06) No CPP - Reference (G1) No CPP High gas (G1c) No CPP, No ITC/PTC, no incremental EE (RC0) Reference Cases CPP mass based (banking) (G4f) Initials CPP with increased stringency (G5a)
61 Change in projected SO 2 emissions (in 2030) from CPP implementation scenarios to potential rollback scenarios (thousand short tons) (positive values indicate increased emission from the CPPs (i.e., rows) to the rollback (i.e., columns) scenarios) CPP Existing sources only (PC06) No CPP - Reference (G1) No CPP High gas (G1c) No CPP, No ITC/PTC, no incremental EE (RC01) Reference cases Initials CPP mass based (banking) (G4f) (12%) 278 (22%) 503 (34%) 557 (36%) CPP with increased stringency (G5a)
62 Change in SO 2 Emissions in 2030 Four Rollback Cases Compared to Clean Power Plan Existing Source Only CPP No CPP No CPP, High Gas Prices No CPP, No ITC/PTC, No new EE 62
63 Change in projected CO 2 emissions for four projected scenarios compared to the reference in 2030 (million short tons) 63
64 Change in projected CO 2 emissions for four projected scenarios compared to the reference (G5a) in 2030 (million short tons) 64
65 Change in projected NO x emissions for four projected scenarios compared to CPP reference in 2030 (thousand short tons) 65
 in 2030 (thousand short tons)")
66 Change in projected NO X emissions for four projected scenarios compared to the Increasde Stringency reference (G5a) in 2030 (thousand short tons) 66
67 Projected NO x emissions in
68 Projected NO x emissions in
69 Projected SO 2 emissions in

70 Projected SO 2 emissions in
71 From 2017 RIA We seek comment from the public on how best to use empirical data to quantitatively characterize the increasing uncertainty in PM2.5 co-benefits that accrue to populations who live in areas with lower ambient concentrations. 71
72 2015 RIA 72
73 Final CPP in Repeal RIA 73

74 2017 Repeal RIA 74
75 2015 FINAL RIA 75
76 Repeal RIA 76
Air Quality, Ecosystem, and Health Impacts of Power Plant Carbon Standards
 Air Quality, Ecosystem, and Health Impacts of Power Plant Carbon Standards Science Briefing House Sustainable Energy & Environment Coalition February 6, 2018 Today s Speakers Kathy Fallon Lambert Harvard
Power Sector Transition: GHG Policy and Other Key Drivers
 Power Sector Transition: GHG Policy and Other Key Drivers JENNIFER MACEDONIA ARKANSAS 111(D) STAKEHOLDER MEETING MAY 28, 214 5/23/14 POWER SECTOR TRANSITION: GHG POLICY AND OTHER KEY DRIVERS 2 Purpose
MODELING THE CO-BENEFITS OF CARBON STANDARDS FOR EXISTING POWER PLANTS
 MODELING THE CO-BENEFITS OF CARBON STANDARDS FOR EXISTING POWER PLANTS Charles T. Driscoll and Habibollah Fakhraei Syracuse University, Syracuse, NY, USA Kathy Fallon Lambert Harvard Forest, Harvard University,
Health Co-benefits of Carbon Standards for Existing Power Plants
 Health Co-benefits of Carbon Standards for Existing Power Plants Part 2 of the Co-Benefits of Carbon Standards Study September 30, 2014 Joel Schwartz, Harvard School of Public Health, Harvard University;
05/23/14. Power Sector Transition: GHG Policy and Other Key Drivers
 5/23/14 Power Sector Transition: GHG Policy and Other Key Drivers JENNIFER MACEDONIA, BLAIR BEASLEY, MEGHAN MCGUINNESS, STUART ILER MAY 214 5/23/14 POWER SECTOR TRANSITION: GHG POLICY AND OTHER KEY DRIVERS
Power Sector Transition: GHG Policy and Other Key Drivers. Technical Appendix
 5/23/14 Power Sector Transition: GHG Policy and Other Key Drivers Technical Appendix JENNIFER MACEDONIA, BLAIR BEASLEY, MEGHAN MCGUINNESS, STUART ILER MAY 214 5/23/14 Comparison of Coal Retirement Impacts
Preliminary Modeling of the Final Clean Power Plan
 Preliminary Modeling of the Final Clean Power Plan MSEER MEETING LITTLE ROCK, ARKANSAS OCTOBER 2, 215 TABLE OF CONTENTS Phase I Modeling Effort High-Level Insights Preliminary Modeling Results Appendix
Eastern Trends: Modeling the Evolving Power Sector and Impacts of the Final Clean Power Plan
 Eastern Trends: Modeling the Evolving Power Sector and Impacts of the Final Clean Power Plan JENNIFER MACEDONIA* POWER SECTOR TRENDS IN THE EASTERN INTERCONNECT ATLANTA, GEORGIA SEPTEMBER 13, 2016 *Excerpts
The Future of Greenhouse Gas Emissions Trading in North America
 The Future of Greenhouse Gas Emissions Trading in North America 14 th IEA-IETA-EPRI Annual Workshop on Greenhouse Gas Emission Trading Thursday October 9, 2014 Agenda California s AB 32 and Cap-and-Trade
The Future of Coal-fired Generation: Challenging the EPA
 Association Of Women In Energy Power Matters Conference The Future of Coal-fired Generation: Challenging the EPA MARK OURADA INDEPENDENT CONSULTANT Leadership A Leader is a Dealer in Hope Napoleon Power
CLOSING THE POWER PLANT CARBON POLLUTION LOOPHOLE: SMART WAYS THE CLEAN AIR ACT CAN CLEAN UP AMERICA S BIGGEST CLIMATE POLLUTERS
 CLOSING THE POWER PLANT CARBON POLLUTION LOOPHOLE: SMART WAYS THE CLEAN AIR ACT CAN CLEAN UP AMERICA S BIGGEST CLIMATE POLLUTERS We limit the amount of toxic chemicals like mercury and sulfur and arsenic
Modeling Proposed Clean Power Plan: Preliminary Results
 Modeling Proposed Clean Power Plan: Preliminary Results JENNIFER MACEDONIA NATIONAL GOVERNORS ASSOCIATION WORKSHOP READYING STATES FOR NEW GREENHOUSE GAS RULES IN THE ELECTRICITY SECTOR SEPTEMBER 22, 2014
EPA s Clean Power Plan Proposal Review of PJM Analyses Preliminary Results
 EPA s Clean Power Plan Proposal Review of PJM Analyses Preliminary Results Paul Sotkiewicz Chief Economist Muhsin Abdur-Rahman Senior Engineer, Market Simulation Members Committee Webinar November 17,
Comparison of CAIR and CAIR Plus Proposal using the Integrated Planning Model (IPM ) Mid-Atlantic Regional Air Management Association (MARAMA)
 Mid-Atlantic Regional Air Management Association (MARAMA)") Draft Report Comparison of CAIR and CAIR Plus Proposal using the Integrated Planning Model (IPM ) Prepared for Mid-Atlantic Regional Air Management Association (MARAMA) Prepared by ICF Resources, L.L.C.
Draft Report Comparison of CAIR and CAIR Plus Proposal using the Integrated Planning Model (IPM ) Prepared for Mid-Atlantic Regional Air Management Association (MARAMA) Prepared by ICF Resources, L.L.C.
State-Level Modeling of. Clean Power Plan. Compliance Pathways with EPRI s US-REGEN Model
 State-Level Modeling of Clean Power Plan Compliance Pathways with EPRI s US-REGEN Model Vic Niemeyer Senior Technical Executive Electric Power Research Institute RFF-EPRI Seminar on Modeling the Clean
EO12866_GHG State Guidelines 2060-AT67 RIA_
 EO12866_GHG State Guidelines 2060-AT67 RIA_20180817 Regulatory Impact Analysis for the Proposed Emission Guidelines for Greenhouse Gas Emissions from Existing Electric Utility Generating Units; Revisions
PJM Perspective of the EPA Clean Power Plan: Analysis
 PJM Perspective of the EPA Clean Power Plan: Analysis Consortium for Energy Policy Research Harvard University March 9, 2015 Cambridge, MA Muhsin K. Abdur-Rahman Senior Market Strategist Paul M. Sotkiewicz,
LCOEs and Renewables Victor Niemeyer Program Manager, Energy and Environmental Policy Analysis and Company Strategy Program
 LCOEs and Renewables Victor Niemeyer Program Manager, Energy and Environmental Policy Analysis and Company Strategy Program EIA LCOE/LACE Workshop July 25, 2013 EPRI Generation Options Report Provides
Clean Air Interstate Rule (CAIR)
") Clean Air Interstate Rule (CAIR) Reducing Power Plant Emissions for Cleaner Air, Healthier People, and a Strong America Office of Air and Radiation March 2005 Benefits of the Clean Air Interstate Rule
Clean Air Interstate Rule (CAIR) Reducing Power Plant Emissions for Cleaner Air, Healthier People, and a Strong America Office of Air and Radiation March 2005 Benefits of the Clean Air Interstate Rule
Overview EPA s Proposed Clean Power Plan and Impacts for Louisiana
 Overview EPA s Proposed Clean Power Plan and Impacts for Louisiana Clean Cities Coalition Meeting November 5, 2014 David E. Dismukes, Ph.D. Center for Energy Studies Louisiana State University CAVEAT:
WORKING PAPER. Carbon Standards Examined. A Comparison of At-the-Source and Beyond-the-Source Power Plant Carbon Standards
 August 2018 RFF WP 18-20 WORKING PAPER Carbon Standards Examined A Comparison of At-the-Source and Beyond-the-Source Power Plant Carbon Standards Amelia T. Keyes, Kathleen F. Lambert, Dallas Burtraw, Jonathan
PJM Analysis of the EPA Clean Power Plan
 PJM Analysis of the EPA Clean Power Plan PJM Interconnection October 6, 2016 PJM CPP Study Objectives Evaluate potential impacts to: Resource adequacy Transmission system operations PJM energy and capacity
Assessing the Effects of Technological & Economic Changes on the Location, Timing, and Ambient Air Quality Impacts of Power Sector Emissions
 Assessing the Effects of Technological & Economic Changes on the Location, Timing, and Ambient Air Quality Impacts of Power Sector Emissions Investigators Hugh Ellis (PI), Ben Hobbs The Johns Hopkins University
2015 Economic Planning Study Assumptions
 2015 Economic Planning Study Assumptions Erik Winsand, ATC Economic Planning May 13, 2015 atcllc.com Introduction Process Overview and Timeline MISO MTEP16 Futures Assumptions Next Steps atcllc.com 2 Process
EPA's Clean Power Plan Proposal: A Summary of Key Results from PJM's Economic Analysis
 EPA's Clean Power Plan Proposal: A Summary of Key Results from PJM's Economic Analysis National Association of State Utility Consumer Advocates June 9, 2015 www.pjm.com PJM as Part of the Eastern Interconnection
Overview of EPA s Platform v6 using IPM and Scenario Suite
 Overview of EPA s Platform v6 using IPM and Scenario Suite Serpil Kayin Clean Air Markets Division EPA Power Sector Modeling Platform v6 Using IPM June 2018 1 What s New on EPA s Website? EPA s Power Sector
Assessing the air quality, toxic and health impacts of the Lamu coal-fired power plants
 Assessing the air quality, toxic and health impacts of the Lamu coal-fired power plants Lauri Myllyvirta 1 & Clifford Chuwah 2 Greenpeace Research Laboratories 3 Technical Report 06-2017 June 2017 Summary
Wind Energy Update. Larry Flowers National Wind Technology Center, NREL Arizona - September, 2009
 Wind Energy Update Larry Flowers National Wind Technology Center, NREL Arizona - September, 2009 Installed Wind Capacities ( 99 09) *Preliminary data 1981 1982 1983 1984 1985 1986 1987 1988 1989 1990
Managing Risk and Volatility in Gas-Fired Generation
 Managing Risk and Volatility in Gas-Fired Generation The Institute for Regulatory Policy Studies May 1, 2008 Jay Dibble Director of Gas Regulatory Calpine Corporation TABLE OF CONTENTS CALPINE OVERVIEW
Overview and Background: Regulation of Power Plants under EPA s Proposed Clean Power Plan
 Overview and Background: Regulation of Power Plants under EPA s Proposed Clean Power Plan Jennifer Macedonia Council of State Governments Annual Meeting August 11, 2014 BACKGROUND: EPA S PROPOSED CLEAN
Event Speaker Lisa Jacobson. President, The Business Council for Sustainable Energy
 Event Speaker Lisa Jacobson President, The Business Council for Sustainable Energy About the BCSE The Business Council for Sustainable Energy (BCSE) is a coalition of companies and trade associations from
Driving Forces Behind Generation Fuel Mix In the Annual Energy Outlook 2006
 Driving Forces Behind Generation Fuel Mix In the Annual Energy Outlook 26 33 rd Annual PURC Conference February 24, 26 Energy Information Administration Independent statistical agency within the Department
ABOUT ENERGY VENTURES ANALYSIS
 ABOUT ENERGY VENTURES ANALYSIS EVA, Inc. is an energy consulting firm located in Arlington, VA. EVA is focused on economic, financial and risk analysis for the electric power, coal, natural gas, petroleum,
The Role of Health Co-Benefits in EPA s Regulatory Impact Analyses. Scott Bloomberg Vice President
 The Role of Health Co-Benefits in EPA s Regulatory Impact Analyses Scott Bloomberg Vice President SBCA 2016 Conference, Washington, DC March 18, 2016 Presentation Outline Introduction Background on Health
Reducing Air Pollution Protecting Public Health. U.S. Environmental Protection Agency Office of Air and Radiation
 Cross-State t Air Pollution Rule Reducing Air Pollution Protecting Public Health U.S. Environmental Protection Agency Office of Air and Radiation Overview of Action EPA is finalizing the Cross-State Air
Reducing Power Plant Emissions: EPA s New Proposed Rules For Mercury
 Reducing Power Plant Emissions: EPA s New Proposed Rules For Mercury U.S. Environmental Protection Agency Office of Air Quality Planning and Standards Research Triangle Park, North Carolina EPA Proposes
Click to edit Master title style. The Health Benefits of Renewable Energy Choices: A Role for Carbon Pricing Dr. Jonathan Buonocore, ScD
 Click to edit Master title style The Health Benefits of Renewable Energy Choices: A Role for Carbon Pricing Dr. Jonathan Buonocore, ScD NASA Earth Observatory NASA Earth Observatory 5% chance of meeting
The Impacts of the Green Communities Act on the Massachusetts Economy:
 The Impacts of the Green Communities Act on the Massachusetts Economy: A Review of the First Six Years of the Act s Implementation Paul J. Hibbard Susan F. Tierney Pavel G. Darling Analysis Group, Inc.
Demand side energy efficiency was not used in setting rate based targets although it still may be used for compliance.
 Annual Energy Outlook 2016 Full Release Dates: September 15, 2016 Next Early Release Date: January 2017 Report Number: DOE/EIA 0383(2016) Issues in Focus Effects of the Clean Power Plan Laura Martin and
Highlights and Key Results
 Highlights and Key Results June 15, 2015 Eric Lantz National Renewable Energy Laboratory 1 Program Name or Ancillary Text eere.energy.gov Wind Vision: Goals Understand the potential role of wind power
Potential Impacts of a Renewable and Energy Efficiency Portfolio Standard in Kentucky
 Potential Impacts of a Renewable and Energy Efficiency Portfolio Standard in Kentucky Prepared for the Mountain Association for Community Economic Development & the Kentucky Sustainable Energy Alliance
The Affordable Clean Energy Rule and the Impact of Emissions Rebound on Carbon Dioxide and Criteria Air Pollutant Emissions
 Environmental Research Letters ACCEPTED MANUSCRIPT OPEN ACCESS The Affordable Clean Energy Rule and the Impact of Emissions Rebound on Carbon Dioxide and Criteria Air Pollutant Emissions To cite this article
Air Quality and GHG Emission Impacts of Stationary Fuel Cell Systems
 Air Quality and GHG Emission Impacts of Stationary Fuel Cell Systems An assessment produced by the Advanced Power and Energy Program at UC Irvine Introduction. The increasing percentage of intermittent
Source Energy and Emission Factors for Building Energy Consumption
 Source Energy and Emission Factors for Building Energy Consumption Copyright 2009 American Gas Association All Rights Reserved Prepared for Natural Gas Codes and Standards Research Consortium 400 N. Capitol
Natural Gas and Power Sector Decarbonization Pathways: Three Snapshots from Recent JISEA Research
 and Power Sector Decarbonization Pathways: Three Snapshots from Recent JISEA Research Jeffrey Logan, Wesley Cole, and Jacquelyn Pless April 13, 216 Presenters Jeffrey Logan has over 2 years of experience
EPA Carbon Regulations Stakeholder Meeting
 EPA Carbon Regulations Stakeholder Meeting Arkansas DEQ/PSC August 28, 2014 Dan Byers Senior Director - Policy Institute for 21st Century Energy U.S. Chamber of Commerce Average U.S. Retail Electricity
The economic benefits of wind energy in the Southwest Power Pool
 The economic benefits of wind energy in the Southwest Power Pool November 2014 Introduction Wind energy provides the Southwest Power Pool region (Kansas, Oklahoma, Nebraska, and parts of New Mexico, Texas,
Future Opportunities for Coal Power. Science, Regulations, & Technology
 Future Opportunities for Coal Power Science, Regulations, & Technology Energy Crisis! Comparing U.S. Energy Reserves 6,000 Abundant Resources Relate to Stable Prices 5,000 4,000 3,000 2,000 1,000 0 US
EPA s Proposed Clean Power Plan: Rate to Mass Conversion
 EPA s Proposed Clean Power Plan: Rate to Mass Conversion JENNIFER MACEDONIA ARKANSAS STAKEHOLDER MEETING OCTOBER 1, 2014 EPA S PROPOSED CLEAN POWER PLAN: RATE TO MASS CONVERSION 2 EPA June Guidance on
NCSL Utility Business Model Session
 NCSL Utility Business Model Session Electric utility service has three components: generation, transmission, and distribution 2 Natural gas utility service has transmission and distribution components
The Clean Power Plan and Beyond
 The Clean Power Plan and Beyond Dr. Marilyn A. Brown Brook Byers Professor of Sustainable Systems Georgia Institute of Technology Update for Southeastern Climate and Energy Network May 11, 2016 May 11,
Update on EPRI s Energy and Economy Modeling
 Update on EPRI s Energy and Economy Modeling Francisco de la Chesnaye, Program Manager Energy & Environmental Analysis Group EPP and Center for Climate and Energy Decision Making, CMU Sponsored Seminar
The Ancillary Benefits of Greenhouse Gas Abatement in the United States. Nicholas Z. Muller Britt Groosman Erin Oneill-Toy June, 2009
 The Ancillary Benefits of Greenhouse Gas Abatement in the United States. Nicholas Z. Muller Britt Groosman Erin Oneill-Toy June, 2009 Purpose of this paper. Capture co-benefits of representative climate
Mid-Continent Independent System Operator (MISO) Overview. INCMA February 15, 2017
 Overview. INCMA February 15, 2017") Mid-Continent Independent System Operator (MISO) Overview INCMA February 15, 2017 1 2 ISO s/rto s manage flows on the transmission system by directing generator usage 3 North American Electric Grid Operators
Mid-Continent Independent System Operator (MISO) Overview INCMA February 15, 2017 1 2 ISO s/rto s manage flows on the transmission system by directing generator usage 3 North American Electric Grid Operators
CONTEXT AROUND RGGI DISCUSSIONS
 CONTEXT AROUND RGGI DISCUSSIONS RGGI STAKEHOLDER MEETING MICHEL DI CAPUA 19 SEPTEMBER 2011 PRESENTATION TO RGGI STAKEHOLDERS 19 SEPTEMBER 2011 1 CONTENTS Market size Power and renewables in RGGI territory
Assessing the Potential Economic and Distributional Impacts of a Tighter Ozone NAAQS
 Assessing the Potential Economic and Distributional Impacts of a Tighter Ozone NAAQS TCEQ Independent Workshop on Ozone NAAQS Science and Policy Austin, TX April 7-9, 2015 Anne E. Smith, Ph.D. NERA Economic
US Energy What's next... and beyond? September 2013
 US Energy What's next... and beyond? September 2013 What will shape US energy policy? Technologies Maturity, costs Security of supply oil imports Environmental target GHG, SOx, NOx.. Availability of resources
Renewable Energy 101. National Renewable Energy Marketing Conference Portland, Oregon October 20, 2010
 Renewable Energy 101 National Renewable Energy Marketing Conference Portland, Oregon October 20, 2010 Agenda 1. Introductions 2. Green Power Basics 3. Purchasing Green Power 4. Green Power Markets 5. Question
Estimating the Benefits of EPA s Air Pollution Regulations
 Estimating the Benefits of EPA s Air Pollution Regulations Amy Lamson U.S. Environmental Protection Agency Office of Air Quality Planning and Standards Presented at NC BREATHE Conference Breakout Session:
The Clean Power Plan and Beyond
 The Clean Power Plan and Beyond Dr. Marilyn A. Brown Brook Byers Professor of Sustainable Systems Georgia Institute of Technology Update for Stanford University June 1, 2016 June 1, 2016 1 Background June
Clean Power Plan. The Effect on Pennsylvania s Energy Outlook. Joshua Carey, Michael Spiessbach, and Pj Tatano
 Clean Power Plan The Effect on Pennsylvania s Energy Outlook Joshua Carey, Michael Spiessbach, and Pj Tatano Presentation Outline 1. Clean Power Plan (CPP) Summary 2. Projected Nationwide Emission Outlook
IMPACTS OF PROPOSED OIL PRODUCTION ON NEAR SURFACE OZONE CONCENTRATIONS IN THE CASPIAN SEA REGION
 IMPACTS OF PROPOSED OIL PRODUCTION ON NEAR SURFACE OZONE CONCENTRATIONS IN THE CASPIAN SEA REGION J. Wayne Boulton*, Jeff Lundgren, Roger Barrowcliffe, Martin Gauthier RWDI, Guelph, Ontario, Canada Zachariah
Natural Gas Solutions: Power Generation
 Natural Gas Solutions: Power Generation EPA Clean Power Plan Compliance Pathways -- Modeled Generation, Capacity and Costs 1220 L Street, NW Washington, DC 20005-4070 www.api.org 1 API Modeling of CPP
MISO/PJM Joint Modeling and Analysis of State Regulatory and Policy Drivers Case Study: Clean Power Plan Analysis
 MISO/PJM Joint Modeling and Analysis of State Regulatory and Policy Drivers Case Study: Clean Power Plan Analysis Muhsin Abdur-Rahman Senior Engineer, Emerging Markets Members Committee March 20, 2017
Nuclear Impact on NOX Emissions in Designated EPA Ozone Nonattainment Areas
 Nuclear Impact on NOX Emissions in Designated EPA Ozone Nonattainment Areas Dean Murphy and Mark Berkman May 2018 The EPA s recent release of ozone air quality designations augmented its previous designation
Coal s Strategic Position in the U.S. for the Next 10 Years. Gerald A. Hollinden, Ph.D. URS Corporation Pittsburgh Coal Conference September 24, 2002
 Coal s Strategic Position in the U.S. for the Next 10 Years Gerald A. Hollinden, Ph.D. URS Corporation Pittsburgh Coal Conference September 24, 2002 Topics Coal production and use over last 100 years Projections
Co-Benefits of Renewable Energy and Energy Efficiency in Utah
 Co-Benefits of Renewable Energy and Energy Efficiency in Utah Air Quality, Health and Water Benefits A Report to the State of Utah March 15, 2010 Jeremy Fisher, PhD; Jon Levy, ScD; Yurika Nishioka, ScD;
Prepared for Greenpeace. September 25, 2009
 An Evaluation of Potential Demand for Renewable Generation H.R. 2454 (Waxman-Markey) Renewable Electricity Standard vs. Existing State Renewable Portfolio Standards Prepared for Greenpeace September 25,
What is the Transport Rule?
 What is the Transport Rule? The Transport Rule will limit pollution from power plants that are located in 31 eastern, southern, and midwestern states and DC The CAA requires each state to be a good neighbor
Project 5: Projecting and Quantifying Future Changes in Socioeconomic Drivers of Air Pollution and its Health-Related Impacts
 Project 5: Projecting and Quantifying Future Changes in Socioeconomic Drivers of Air Pollution and its Health-Related Impacts Noelle E. Selin Associate Professor Institute for Data, Systems and Society
Perspectives on EPA s Proposed Clean Power Plan. Michigan Manufacturers Association. November 18, 2014
 Perspectives on EPA s Proposed Clean Power Plan Michigan Manufacturers Association November 18, 2014 Executive Summary EPA s proposed Clean Power Plan establishes state-by-state carbon dioxide (CO 2 )
Air Quality Rules Update: CAIR CAMR
 Air Quality Rules Update: CAIR CAMR Cindy L. Phillips, P.E. Cindy.Phillips@dep.state.fl.us FDEP Bureau of Air Regulation Environmental Partnering Workshop September 8, 2006 1 CAIR Federal Clean Air Interstate
Air Quality Modeling and Health Impacts Assessment for Southeastern North Carolina
 Southern Environmental Law Center Air Quality Modeling and Health Impacts Assessment for Southeastern North Carolina Technical Memorandum Prepared for Geoff Gisler, Southern Environmental Law Center 601
Assessment of Environmental Benefits (AEB) Modeling System
 Modeling System") Assessment of Environmental Benefits (AEB) Modeling System A coupled energy-air quality modeling system for describing air quality impact of energy efficiency Principal Investigator Bob Imhoff bob.imhoff@baronams.com
Assessment of Environmental Benefits (AEB) Modeling System A coupled energy-air quality modeling system for describing air quality impact of energy efficiency Principal Investigator Bob Imhoff bob.imhoff@baronams.com
The Future of Renewable Energy and Other Energy. By Peter Barth CH2M HILL Pittsburgh, PA
 The Future of Renewable Energy and Other Energy Sources By Peter Barth CH2M HILL Pittsburgh, PA Agenda EIA and PJM Energy Forecasts Shale Gas A Game Changer Renewable Energy Challenges Do State Renewable
The consumer and societal benefits of wind energy in Texas
 The consumer and societal benefits of wind energy in Texas November 2014 Introduction Texas wind energy provides the state with $3.3 billion in societal benefits per year. These benefits include reducing
Impacts of Announced Nuclear Retirements in Ohio and Pennsylvania
 Impacts of Announced Nuclear Retirements in Ohio and Pennsylvania Dean Murphy and Mark Berkman April 2018 The owners of four nuclear plants in Ohio and Pennsylvania have announced that these plants will
High Voltage Direct Current
 High Voltage Direct Current And Large Scale Wind Integration Iowa State University April 2014 Wayne Galli, Ph.D., P.E. Executive Vice President Transmission and Technical Services Clean Line Energy Partners
Fine Particles in the Air
 Fine Particles in the Air Presentation for STAPPA Outreach Committee Rich Damberg, EPA Office of Air Quality Planning and Standards April 6, 2004 Particulate Matter: What is It? A complex mixture of extremely
Greater Philadelphia Chapter of the Association of Energy Engineers
 Greater Philadelphia Chapter of the Association of Energy Engineers Stephen Boyle Director, State Gov. Affairs PJM Interconnection January 20, 2016 Key Statistics PJM as Part of the Eastern Interconnection
MISO/PJM Joint Modeling Case Study: Clean Power Analysis
 MISO/PJM Joint Modeling Case Study: Clean Power Analysis MISO PJM Interconnection March 10, 2017 This page is intentionally left blank. 2 P a g e Executive Summary... 5 Study focus and key observations...
Voluntary & Compliance Markets. Renewable Energy Markets 2010
 Voluntary & Compliance Markets Renewable Energy Markets 2010 Renewable Energy Certificate A commodity that represents the environmental attributes of electricity generated from renewable resources like
PJM Renewable Integration Study. Ken Schuyler Renewable Energy in West Virginia June 5, 2014
 PJM Renewable Integration Study Ken Schuyler Renewable Energy in West Virginia June 5, 2014 PJM as Part of the Eastern Interconnection 27% of generation in Eastern Interconnection 28% of load in Eastern
Discussion on the Threat of Electrification to Residential Natural Gas Demand
 Discussion on the Threat of Electrification to Residential Natural Gas Demand Prepared for the American Gas Association State Affairs Committee Tuesday, October 10 h, 2017 Mike Sloan Managing Director
EPRI Social Cost of Carbon Webcast Series
 EPRI Social Cost of Carbon Webcast Series Today: Social Cost of Carbon Pricing of Power Sector CO 2 August 16, 2017 EPRI Webcast Series July 25, 2017 (1:30-3 pm EDT) Understanding the Social Cost of Carbon:
GLIMPSE: A GCAM-USA-based tool for supporting coordinated energy and environmental planning
 GLIMPSE: A GCAM-USA-based tool for supporting coordinated energy and environmental planning Dan Loughlin, Chris Nolte, Carol Lenox, and Tai Wu, U.S. EPA Office of Research and Development Wenjing Shi,
MTEP18 Futures. Planning Advisory Committee June 14, 2017
 MTEP18 Futures Planning Advisory Committee June 14, 2017 Overview Objective: Present final MTEP18 Futures and an overview of stakeholder feedback Key Takeaways: Four Futures to be used in MTEP18 to consider
April 2, Tom Moore WRAP Air Quality Program Manager WESTAR Council. Fish Camp, CA
 April 2, 2015 Tom Moore WRAP Air Quality Program Manager WESTAR Council Fish Camp, CA 1 Topics Overview of WESTAR and WRAP regional organizations Key issues and areas of focus Ozone analysis: Results from
Assessing the air quality, toxic and health impacts of the Cayirhan coal-fired power plants
 Assessing the air quality, toxic and health impacts of the Cayirhan coal-fired power plants Lauri Myllyvirta 1 & Clifford Chuwah 2 Greenpeace Research Laboratories 3 Technical Report 08-2017 November 2017
100% Fossil Free Electricity. June 27, 2018
 100% Fossil Free Electricity June 27, 2018 Current Washington Emissions Levels 100 90 +7% 80 70 60 50-82% 40 30 20 10 0 1990 2013 2050 (goal) 2016 2017 2018 2019 2020 2021 2022 2023 2024 2025 2026 2027
Summary of Impacts of Environmental Regulations in the ERCOT Region. Warren Lasher Director, System Planning
 Summary of Impacts of Environmental Regulations in the ERCOT Region Warren Lasher Director, System Planning April 8, 2015 Study Purpose and Background Several new regulations have been proposed or finalized
Expanding Transmission Capacity: Options and Implications. Jennifer Curran Director Transmission Strategy April 30, 2009
 Expanding Transmission Capacity: Options and Implications Jennifer Curran (jcurran@midwestiso.org) Director Transmission Strategy April 30, 2009 The Transmission Design Challenge General Problem Statement
Consumer Impact Analysis: Proposed Assumption Framework
 Consumer Impact Analysis: Proposed Assumption Framework Timothy Duffy Manager, Economic Planning IPPTF Issue Track 5 May 21, 2018 Framework for Database Development This presentation provides stakeholders
Wind Energy Update. Larry Flowers National Wind Technology Center, NREL Appalachian Regional Commission - September, 2009
 Wind Energy Update Larry Flowers National Wind Technology Center, NREL Appalachian Regional Commission - September, 2009 Installed Wind Capacities ( 99 09) *Preliminary data Four Years of Strong Growth:
Overview of Clean Energy Development and Policies
 Overview of Clean Energy Development and Policies Ananth Chikkatur, Ph.D. Manager ICF International December 3, 2012 1 Overview ICF Background Clean Energy Definition and Drivers Overview of Clean Energy
Analysis of Potential Impacts of CO 2 Emissions Limits on Electric Power Costs in the ERCOT Region
 Analysis of Potential Impacts of CO 2 Emissions Limits on Electric Power Costs in the ERCOT Region May 12, 29 29 Electric Reliability Council of Texas, Inc. Table of Contents Executive Summary... 1 1.
Renewable Portfolio Standards U.S. Overview
 Renewable Portfolio Standards U.S. Overview David Mooney May 6, 2016 ACKNOWLEDGMENTS Jenny Heeter, Trieu Mai, Lori Bird, Alberta Carpenter, Garvin Heath, David Keyser, Jordan Macknick Ryan Wiser, Galen
Presentation To International Pittsburgh Coal Conference
 Presentation To International Pittsburgh Coal Conference The Future of Coal It Is Up To Us! Steven Winberg Vice President CONSOL Energy Inc. Research & Development September 15, 2011 Topics Summary of
Estimating present and future wildfire pollution in the U.S.
 Estimating present and future wildfire pollution in the U.S. (and a bit about the 2015 haze in Indonesia) Shannon N. Koplitz and Christopher G. Nolte USEPA/ORD/NERL/SED/EFAB In support of the Air Climate
Progress in Air Quality: Sustainable Improvements. NCSL Advisory Council on Energy June 18, 2007
 Progress in Air Quality: Sustainable Improvements NCSL Advisory Council on Energy June 18, 2007 Improving Regional Air Quality Investment/ Construction Economic Development Public Participation Operations