Nutrients From Cropland to Lake Erie: Perspectives from Detailed River Monitoring,
|
|
|
- Ophelia Fisher
- 6 years ago
- Views:
Transcription

 Heidelberg")
1 Indiana Certified Crop Advisor Conference Indianapolis Marriot East Indianapolis, Indiana December 12, 2017 Nutrients From Cropland to Lake Erie: Perspectives from Detailed River Monitoring, Dr. David Baker National Center for Water Quality Research (NCWQR) Heidelberg University Tiffin, Ohio 44883
2 A quick guide to viewing this presentation Many of the slides have animation to help sequence the topics included on the slide. Consequently viewing the slides as a slide show on your computer may be helpful in following the material on the slides. 2. I have added notes to many of the slides to cover my comments during the presentation or to add relevant information. To view these comments while observing the slides and related animation, it may be useful the print out the slides with the notes attached. Selected references have been added as a last slide.

3 Lake Erie has been plagued by a return of harmful algal blooms in recent years. Increased cropland runoff of dissolved phosphorus has been identified as the major cause. A satellite image of the western and central basins of Lake Erie Western Basin Central Basin But, by managing for a 40% reduction of both total and dissolved phosphorus we are likely putting too many resources on erosion control and insufficient resources on nutrient management. 3 Heidelberg NCWQR
4 Lake Erie Re-eutrophication --- How do we know it s cropland runoff? How do we know it s dissolved phosphorus? Why did dissolved phosphorus loading increase so much? What can be done about it? But first, 3 basics. 4


5 1. There are two major sources of water pollutants Point Sources associated with water use for domestic and industrial purposes. Examples municipal sewage treatment plants. The Sandusky River in Tiffin following a rainstorm Tiffin sewage treatment plant with discharge pipe to the Sandusky River Nonpoint Sources associated with the interaction of land use and rainfall or snow melt events. Examples cropland runoff, parking lot runoff 5
6 2. There are two major forms of phosphorus Total Phosphorus = Particulate + Phosphorus Dissolved Phosphorus Measure Calculate Measure 6


7 3. These two forms differ greatly in bioavailability Total Phosphorus = Particulate + Phosphorus ~ 25% Bioavailable Dissolved Phosphorus ~100% Bioavailable Bioavailable phosphorus readily supports algal growth. 7
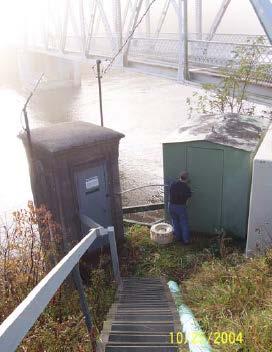
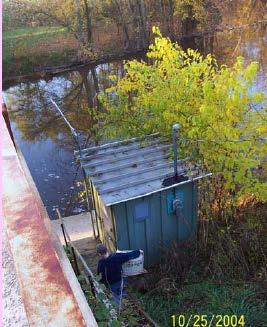
8 How do we know it s cropland runoff? First how is nonpoint pollution measured? The Watershed Approach Watershed boundary Point source input Stream gaging/monitoring station The Heidelberg Program Measure total watershed export Data on point source inputs from EPA-required monitoring by dischargers. Total watershed output - point source inputs nonpoint source output 8

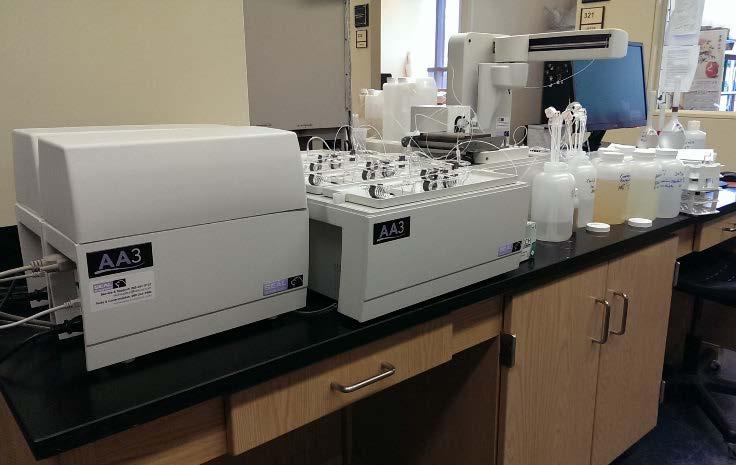


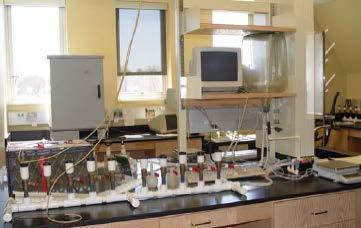
9 Colorimetry for TP, DRP, TKN, NH 4, Si Ion chromatography for NO 3, NO 2, Cl, Fl, SO 4 Suspended Sediments Samples collected 3x a day Analyzed for all major nutrients and suspended sediments 9
10 Sandusky River Start out with concentration data mg/l Add river flow rate data from U.S. Geological Survey cubic feet/second 10
 = (concentration) x (flow rate) Here is the TP loading rate in units of metric tons per")
11 Calculate the loading rate Amount time amount/unit time = amount/unit volume x volume/unit time (loading rate) = (concentration) x (flow rate) Here is the TP loading rate in units of metric tons per day 11

12 Calculate TP load over a particular time period metric tons = metric tons/day x days Add in each successive day to obtain cumulative loads for time period 12
 605 samples")

13 Apply the above procedures to data for an entire year Here the 2013 Water Year (10/01/ /30/2013) 605 samples were analyzed for the 2013 Water Year 610 metric tons of Total Phosphorus Adjust for missing samples 617 metric tons 13
14 Sandusky Monitoring Station above Fremont, OH OEPA Phosphorus Mass Balance (2013 Water Year) Total Phosphorus metric tons Total Watershed Export Point Source inputs National Pollutant Discharge Elimination System (NPDES) data Major Wastewater Sewage Treatment Plants 6.4 Smaller Wastewater Sewage Treatment Plants 9.4 Industrial Dischargers 0.1 Wet weather flows 3.8 Home Sewage Treatment Systems Maumee 13.2 Total Point Source Inputs 10.4% (5.3%) Nonpoint Source Export 89.6% (94.7%) Unit Area Nonpoint TP Load = 1.8 kg/ha (1.6 lbs/acre) Sandusky Watershed 14

15 Land Use in major Ohio watersheds in the Heidelberg Tributary Loading Program 15 Row crop agriculture dominates land use in Ohio tributaries draining into the Lake Erie Western Basin and Sandusky Bay
16 617 metric tons of Total Phosphorus for 2013 WY The Sandusky Fremont data set through the 2017 Water Year 43 Water Years ( ) 20,099 samples analyzed Note the large annual variability in TP loading. This variability complicates detection of loading trends in relation to BMP adoption. 16

17 Annual TP loads Annual River Discharge 17 This variability is primarily due to annual variations in discharge. Years with more rainfall and stream flow have higher TP loads.


18 Trends % TP Load +33% Water Volume -7% TP FWMC 18

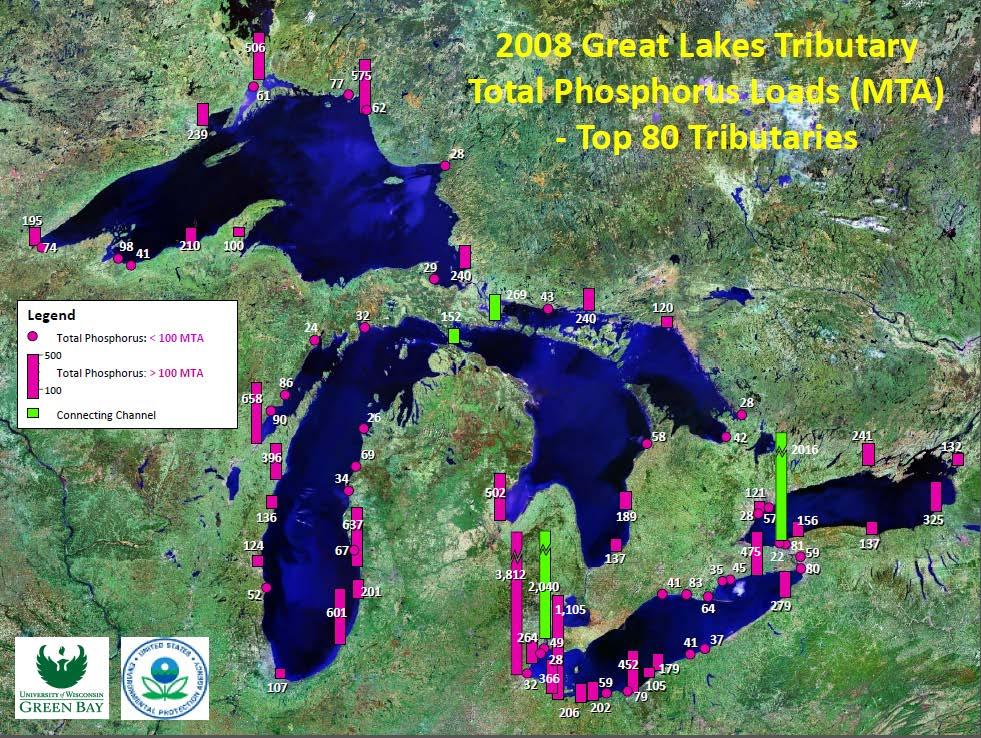
19 The Heidelberg University Tributary Loading Program A major application of the Heidelberg data has been to support phosphorus management for Lake Erie Currently 18 Stations Every sample is analyzed for: 1. Suspended Sediments 2. Total Phosphorus 3. Dissolved Reactive Phosphorus 4. Nitrate 5. Total Kjeldahl Nitrogen 6. Nitrite 7. Ammonia 8. Chloride 9. Silica 10.Sulfate 11.Conductivity 19

20 The Lake Erie Watershed: Sources of Phosphorus Loading Phosphorus Sources 1. Lake Huron 2. Atmosphere 3. Nonpoint Sources 4. Point Sources 20
21 21

22 Target for total phosphorus loads to Lake Erie set in 1978 at 11,000 metric tons per year. The target load was met for the first time in


23 Lake Erie Phosphorus Control - Phase 1. Emphasis on reducing point sources, started in mid-1970s Metric Ton Reductions Point Source ~ 10,000 ~ 84% TP loads, metric tons/year Nonpoint Source total phosphorus loading to Lake Erie, Nonpoint source ~ 900 ~ 13% 23
24 If total phosphorus loading has not increased in recent years, how can we blame re-eutrophication of Lake Erie on phosphorus loading? Algal Biomass (Kane et al., 2014) We have to look at two characteristics of TP loading 1. Separate the trends in particulate and dissolved phosphorus. 2. Consider the relative bioavailability of the two forms. 24
25 Agronomic Phosphorus Management Relationship between total phosphorus content of soils and Mehlich 3 P STP 25 Total Phosphorus Concentration in Soil (mg/kg) Crop Available Phosphorus Concentration (mg/kg) Agronomic management is based on bioavailable phosphorus as indicated by phosphorus soil test values.
26 Total phosphorus content of soil Incorrect concept of available phosphorus as a discrete fraction in the soil Unavailable Available Correct concept of phosphorus availability as a continuum in the soil Increasing availability 26 Fertilizers add highly available phosphorus to the soil After CAST, Issue Paper #15, June 2000 A B C Soil Test Extractants
27 Environmental Phosphorus Management: Point Sources Total phosphorus concentration in Point Source Effluent (mg/l) Bioavailable Phosphorus concentration in effluent (seldom measured) Point source management based on total phosphorus concentration measurement since most of the phosphorus in the effluent is bioavailable.* * The percent bioavailability decreases as the amount of P removal increases. 27
28 Environmental Phosphorus Management: Nonpoint Sources Total Phosphorus concentration in nonpoint source runoff (mg/l) Bioavailable Phosphorus concentration in runoff (seldom measured) Nonpoint source management is generally based on total phosphorus concentrations even though most of the nonpoint phosphorus in runoff in not bioavailable.* 28
29 Bioavailability of Total Phosphorus in Nonpoint Runoff: A closer look (approximate percentages, actual values vary) Particulate Phosphorus TP load 60% not bioavail. Dissolved Phosphorus 29 Settles out of water column? 25% Bioavail. 80% part. phos. 40% bioavail. 20% diss. phos. Chemical Positional bioavailability 100% Bioavail. 100% in water

 Our studies of storm water moving through the river and into the Lake suggest that much of the particulate phosphorus settles out of the storm water before reaching the river mouth, while DRP")
30 Location of tributary loading stations upstream from river mouths. The tributary monitoring stations are upstream from the lake. For example, the Maumee Waterville station is 26 river miles from the river mouth at Maumee Bay. 30 Heidelberg stations during storm water processing studies. During floods, are DRP and PP transported with equal efficiency between the sampling station and the river mouth? (i.e. equal locational bioavailability?) Our studies of storm water moving through the river and into the Lake suggest that much of the particulate phosphorus settles out of the storm water before reaching the river mouth, while DRP is unchanged. The models used to set target loads use Waterville data directly as daily input to the Lake, ignoring locational bioavailability.


31 40% Reduction in TP based on correlation between algal bloom severity and discharge/phosphorus loads The correlations between phosphorus loads and bloom severity are used to set the target loads for phosphorus. Sample Dose-Response curve 31 Bloom Severity But what form of phosphorus should be on the X-axis?
32 Y-axis is annual value as a percentage of mean value for each parameter. Covariance is due to role of discharge in load calculations. Management recommendations vary greatly depending on choice of x-axis phosphorus form. Bloom Size 32 Maumee spring total phosphorus load Western Lake Erie Ecosystem Model Annex 4 Ensemble Modeling Report Appendix B7-33 Maumee total bioavailable phosphorus load NOAA Western Lake Erie Model (Stumpf et al., 2016)
33 The targets of 40% reductions in both TP and DRP were based on models that used total phosphorus as the dose parameter at the monitoring station. Using Total Phosphorus for the X-axis Phosphorus Form Total Dissolved Particulate Phosphorus Phosphorus Phosphorus --- metric tons loads (base year) Target for acceptable bloom (40% reduction) Reduction to meet target Modelers noted that reducing dissolved phosphorus to zero would be insufficient to meet targets for TP reduction. So Annex 4 reduced both DP and PP by 40%. 33 Using Total Bioavailable Phosphorus for the X axis Phosphorus Form Total Bioavailable Phosphorus Bioavailable Dissolved Phosphorus Bioavailable Particulate Phosphorus --- metric tons loads (base year) Target for acceptable bloom (40% reduction) Reduction to meet target Which version fits the historical data? But if the X-axis is bioavailable phosphorus, reducing DP to zero is more than enough to reduce bioavailable P loading by 40%.
34 During the early 1990s, Lake Erie was viewed as a poster child for eutrophication control. During reeutrophication, particulate P loads did not increase while DRP loads increased dramatically. Furthermore, much of the PP doesn t make it to the Western Basin. Particulate Phosphorus Loads De-eutrophication recovery Re-eutrophication Should we base our management plans on models that suggest a need to reduce current loading of both particulate P and dissolved P by equal amounts (40%) to move toward conditions present in the early 1990s? We think not. Much more emphasis should be placed on reducing dissolved P. Dissolved Phosphorus Loads 34 Trends in spring (March-July) phosphorus concentrations from the Maumee River
35 3. Why did dissolved phosphorus loading increase so much? 4. What can be done about it? but first, another basic! 35

36 36 DRP runoff concentrations increase with increasing soil test levels

37 How does phosphorus move from cropland to streams, rivers and lakes? A diagram from the 1970s The concentration of dissolved P in cropland runoff is related to the phosphorus soil test levels in the zone of interaction. 37 Dissolved P released from soil in the zone of interaction represents chronic losses of legacy phosphorus.

38 Have views of phosphorus pathways to water changed? M a c r o p o r e s Matrix flow Dissolving and runoff of broadcast fertilizer granules before incorporation and entering soil phosphorus complex. Acute losses Tile drainage 38


39 What changes in crop management correlate with DRP loading trends? Percentage of conservation tillage for corn and soybeans Adoption of conservation tillage in the Sandusky Watershed Increase in dissolved phosphorus concentrations in the Sandusky River
40 Concentrations of dissolved phosphorus often increase under no-till management and other erosion control practices. Mostly rotational no-till Rotational no till 59% Continuous no till 8% Why does dissolved phosphorus loading increase with no-till? Increases phosphorus stratification in the soil More broadcasting of fertilizer Broadcasting contributes to stratification and is subject to acute runoff. Breakdown of crop residues adds phosphorus at soil surface More macropore formation leads to higher delivery of DRP to streams through tile lines. 40


41 Tributary monitoring does reveal acute losses at the watershed scale Fertilizer application just before precipitation Dates custom applicators were in fields. 41

42 Fertilizer application on frozen ground DRP, mg/l Lost Creek Snow Melt Runoff Events /15 2/20 2/25 3/2 3/7 3/12 Date, Discharge, cfs 42
43 We think chronic losses of dissolved phosphorus are more important than acute losses, in terms of recent increases in dissolved P export. Applications of fertilizer or manure on frozen ground or before predicted heavy rainfalls have been banned in Ohio. What management practices can reduce chronic DP losses? A closer look at stratification 43


44 Sandusky Watershed Stratified Soil Testing Program: A cooperative program with area CCAs Agronomic Soil Testing, 0 8 inches 44
45 Distribution of agronomic soil test levels in relation to Tri-State recommendations No additional P fertilizer recommended 14.8% 75.1% 10.1% Critical STP for corn and soybeans Critical STP for wheat and alfalfa 45
46 Some results from the stratified soil testing program -- On average, the environmental (surficial) soil test levels were 55% higher than the agronomic soil test levels. Do increases of Mehlich 3 P soil test levels of these amounts result in significant increases in DRP concentrations in runoff water? 46
 Breakdown of crop residues Breakdown of cover crops Source Management Practices (see 4Rs) Incorporate")
47 47 How do we manage environmental soil test levels, to reduce chronic dissolved phosphorus export? #1 Measure surficial soil test level! We can t fly blind! Zone of interaction, sources of surficial P Broadcast fertilizers and manures (un-incorporated) Breakdown of crop residues Breakdown of cover crops Source Management Practices (see 4Rs) Incorporate fertilizers or manures having broadcast application Band or inject fertilizers or manures Remove crop or winter cover residues Drawdown of agronomic P Average M3P Zone of interaction, P transport Reduce surface runoff and macropore flow Increase water infiltration into soil matrix and associated P leaching Use soil amendments to reduce P solubility Selective drawdown of surficial P? Targeted one-time inversion tillage (moldboard plowing), followed by practices that minimize subsequent development of stratification and reduce erosion.
 Targeted to fields with stratification increments")
48 Using inversion tillage to reduce risks of DRP runoff 28.7% of fields, >30 ppm 28.7% of fields with highest agronomic soil test 48 Effects of inversion tillage of risks of DRP runoff (no effect on agronomic soil tests) Targeted to fields with stratification increments >30 ppm 19.8% risk reduction Targeted to same # of fields with highest agronomic STP 10.8% risk reduction
49 Soluble nutrient runoff for WY in relation to average annual maintenance application rates in the Sandusky Watershed Nutrient Maintenance Application rate (as P) Average Annual Export rate Export Rate as a percent of maintenance rate lbs/acre lbs/acre Phosphorus (DRP) % Nitrogen, nitrate % A very small percentage of phosphorus fertilization rates are exported as dissolved phosphorus each year. Reducing that export by 40% (or more) does represent a challenge. 49
50 Conclusions/Recommendations 1. Action plans for reduction of algal blooms in Lake Erie should place much more emphasis on reducing dissolved phosphorus loading to Lake Erie than on particulate phosphorus reductions. 2. Management practices need to be selected or developed that reduce P-soil test levels in the zone of interaction (upper inch of soil). 3. Managing environmental soil test levels will require measuring environmental soil test levels, i.e. stratified soil testing. 4. As nutrient management advisors, CCAs have a major role in addressing bioavailable nutrient losses from cropland. 50


51 Heidelberg Tributary Loading Program Current Sponsors Sponsors of Current Research Projects
52 For copies of this power point, contact
53 Selected References Allen, B.L., A.P. Mallarino, J.G. Klatt, J.L. Baker, and M. Camara Soil and Surface Runoff Phosphorus Relationships for Five Typical USA Midwestern Soils. J. Environ. Qual. 35: Baker, D.B., R.B. Confesor, D.E. Ewing, L.T. Johnson, J.W. Kramer, and B.J. Merryfield. 2014a. Phosphorus loading to Lake Erie from the Maumee, Sandusky and Cuyahoga rivers: The importance of bioavailability. J. Great Lakes Res. 40: Baker, D.B., D.E. Ewing, L.T. Johnson, J.W. Kramer, and B.J. Merryfield, R.B. Confesor, R.P. Richards and A.A. Roerdink.2014b. J. Great Lakes Res. 40: Baker, D.B., L.T. Johnson, R. B. Confesor and J. P. Crumrine Vertical Stratification of Soil Phosphorus as a Concern for Dissolved Phosphorus Runoff in the Lake Erie Basin. J. Environ. Qual. 46: Kane, D.D., J.D. Conroy, R.P. Richards,D.B. Baker, and D.A. Culver Re-Eutrophication of Lake Erie: Correlations between tributary nutrient loads and phytoplankton biomass. J. Great Lakes Res. 40:xxx-xxx. Kleinman, P.J., A.N. Sharpley, R.W. McDowell, D.N. Flaten, A.R. Buda, L. Tao, L. Bergstrom, and Q. Zhu Managing agricultural phosphorus for water quality protection: principles for progress. Plant Soil 349: Logan, T.J and J.R. Adams The Effects of Reduced Tillage on Phosphate Transport from Agricultural Land. Lake Erie Wastewater Management Study, Technical Report Series. U.S. Army Corps of Engineers, Buffalo District, Buffalo, NY NRCS Rapid Watershed Assessment Data Profile for the Sandusky Watershed, draft of Columbus, Ohio Stumpf, R.P., L.T. Johnson, T.T. Wynne and D.B. Baker Forecasting annual cyanobacterial bloom biomass to inform management decisions for Lake Erie. J. Great Lakes Res Vadas, P.A., P.J.A. Kleinman, A.N. Sharpley, and B.L. Turner. 2005a. Relating Soil Phosphorus to Dissolved Phosphorus in Runoff: A Single Extraction Coefficient for Water Quality Modeling. J. of Environ. Qual. 34: Vitosh, M.L., J.L. Johnson, and D.B. Mengel Tri-State Fertilizer Recommendations for Corn, Soybeans, Wheat and Alfalfa. Extension Bulletin E-2567 (Michigan State University, The Ohio State University, Purdue University).
Trends in phosphorus loads from agricultural watersheds in Lake Erie and the prevalence of soil P stratification. Laura Johnson
 Trends in phosphorus loads from agricultural watersheds in Lake Erie and the prevalence of soil P stratification Laura Johnson Heidelberg Tributary Loading Program Algal blooms returned to Lake Erie in
Phosphorus Loading to Western Lake Erie: Trends and Sources
 Phosphorus Loading to Western Lake Erie: Trends and Sources Western Lake Erie Conference Toledo Yacht Club March 13, 28 Dr. David B. Baker National Center for Water Quality Research Heidelberg College
Trends in Dissolved Reactive Phosphorus in Lake Erie Tributaries
 Trends in Dissolved Reactive Phosphorus in Lake Erie Tributaries R. Peter Richards, David B. Baker, John P. Crumrine National Center for Water Quality Research Heidelberg College Tiffin, Ohio 44883 Windsor,
Rem Confesor Jr., PhD. NCWQR, Heidelberg University Great Lakes Sedimentation Workshop May 14 15, 2013
 THE NATIONAL CENTER FOR WATER QUALITY RESEARCH: F From Landscape L d to t Lake L k Erie Ei Continuum Rem Confesor Jr., PhD. NCWQR, Heidelberg University Great Lakes Sedimentation Workshop p May 14 15,
Topics. What was wrong with Lake Erie?
 Nutrient management, conservation tillage, adaptive management, and increased dissolved phosphorus export from Northwest Ohio agricultural landscapes R. Peter Richards, David B. Baker, Jack W. Kramer,
A Close Look at Lake Erie HABS and Current Research Efforts
 --- Ohio Water Environment Association --- OHIO SEA GRANT AND STONE LABORATORY A Close Look at Lake Erie HABS and Current Research Efforts Dr. Christopher J. Winslow Interim Director, Ohio Sea Grant College
Using Paired Edge of Field Data to Assess Impacts of Management on Surface and Subsurface P Loss
 Using Paired Edge of Field Data to Assess Impacts of Management on Surface and Subsurface P Loss Kevin W. King, Mark R. Williams, and Norm R. Fausey USDA ARS Soil Drainage Research Unit Columbus, OH Edge-of-field
Modeling the Influence of Agricultural Practices on Watershed Export of Phosphorus
 Modeling the Influence of Agricultural Practices on Watershed Export of Phosphorus Rem Confesor Jr., Ph.D. Sr. Research Scientist NCWQR, Heidelberg University 310 E. Market St., Tiffin, OH rconfeso@heidelberg.edu
Phosphorus for the Ontario CCA 4R Nutrient Management Specialty
 Ontario CCA 4R Nutrient Management Workshop Wednesday, 18 January 2017 Woodstock, Ontario, Canada Phosphorus for the Ontario CCA 4R Nutrient Management Specialty Tom Bruulsema, Phosphorus Program Director
4R Nutrient Stewardship Opportunities for Ontario
 Ontario Agri Business Association Crops Update London, Ontario 9 December 2014 4R Nutrient Stewardship Opportunities for Ontario Tom Bruulsema, Director, Northeast Region, IPNI Formed in 2007, the International
Phosphorus Transport From the Soil to Surface Water
 Phosphorus Transport From the Soil to Surface Water Field Observations Supported by a Review of Current Literature By: Rick Wilson Ohio EPA-Division of Surface Water April 12, 2008 Extra P application.
Western Lake Erie Watersheds
 Western Lake Erie Watersheds 7.1 Million Acres 70% Oh, 12% In, & 18% Mi About 76% Cropland, 3/4 Corn & Soybeans Maumee Drains 2/3 rds Area Average Annual Export From the Maumee WS is 1.1 Pounds of P per
Trends in water quality across Ohio watersheds
 Trends in water quality across Ohio watersheds Laura Johnson and Ken Krieger Ohio Water Resources Council Workgroup for Water Resources Monitoring 1 March 1 Heidelberg Tributary Loading Program 1 stations
Precision Phosphorus Application for the Lake Erie Watershed
 St. Louis, MO 30-31 July 2014 Precision Phosphorus Application for the Lake Erie Watershed Tom Bruulsema, Director, Northeast Region, IPNI Formed in 2007 from the Potash & Phosphate Institute, the International
FATE AND MANAGEMENT OF PHOSPHORUS IN AGRICULTURAL SYSTEMS. Andrew Sharpley
 FATE AND MANAGEMENT OF PHOSPHORUS IN AGRICULTURAL SYSTEMS Andrew Sharpley Blue Waters, Green Pastures, and the Elephant in the Room Today s presentation Why are we here? Source & transport Risk management
Phosphorus for the Ontario CCA 4R Nutrient Management Specialty
 Ontario CCA 4R Nutrient Management Workshop Thursday, July 21, 2016 Holiday Inn, Guelph Phosphorus for the Ontario CCA 4R Nutrient Management Specialty Tom Bruulsema, Phosphorus Program Director Lake Erie
OHIO SEA GRANT AND STONE LABORATORY OHIO SEA GRANT AND STONE LABORATORY
 OHIO SEA GRANT AND STONE LABORATORY Framing the Issue: Current State of Nutrient Management and Great Lakes Water Quality OSU s Island OHIO SEA GRANT AND STONE LABORATORY Campus Southernmost Image: Ohio
The 4Rs for the Lake Erie Watershed
 Ag Retailers Leading Improvements in Resource Management for Water Quality Toledo, OH 12 December 2013 The 4Rs for the Lake Erie Watershed Tom Bruulsema, Director, Northeast Region, IPNI Formed in 2007
Journal of Great Lakes Research
 Journal of Great Lakes Research 4 (214) 52 517 Contents lists available at ScienceDirect Journal of Great Lakes Research journal homepage: www.elsevier.com/locate/jglr Phosphorus loading to Lake Erie from
OHIO STATE UNIVERSITY EXTENSION. Soil Testing and Nutrient Application Practices of Ohio Agronomy Retailers
 OHIO STATE UNIVERSITY EXTENSION Soil Testing and Nutrient Application Practices of Ohio Agronomy Retailers Gregory A. LaBarge* and Steven C. Prochaska. Ohio State University Extension, The Ohio State University,
4R Phosphorus Management for Sustainable Crop Nutrition
 MVTL 2018 Agronomy Update New Ulm, MN February 1, 2018 4R Phosphorus Management for Sustainable Crop Nutrition Heidi Peterson Phosphorus Program Director Stillwater, Minnesota hpeterson@ipni.net The International
Land Application and Nutrient Management
 MODULE D Land Application and Nutrient Management Figure 34-13. Relationship between the concentration of dissolved P in subsurface drainage from 30 cm deep lysimeters and the Mehlich-3 extractable soil
To 4R or Not to 4R Is There an Option?
 To 4R or Not to 4R Is There an Option? August 3, 2014 Setting the Stage for 4R Nutrient Stewardship in Ontario Phosphorus in the Great Lakes with the focus on the western basin of Lake Erie. Multiple Point
Water Quality Assessment in the Thames River Watershed
 Water Quality Assessment in the Thames River Watershed Nutrient Trends Karen Maaskant, Upper Thames River Conservation Authority 2015 Lake St. Clair Conference October 21, 2015 Outline Thames River watershed,
Phosphorus Product Properties for 4R Nutrient Stewardship. Tom Bruulsema, Phosphorus Program Director, IPNI
 Phosphorus Product Properties for 4R Nutrient Stewardship Tom Bruulsema, Phosphorus Program Director, IPNI The International Plant Nutrition Institute is supported by leading fertilizer manufacturers.
Ohio Lake Erie CREP Program: Annual Report on Water Quality
 Ohio Lake Erie CREP Program: Annual Report on Water Quality Prepared by R. Peter Richards Senior Research Scientist Water Quality Laboratory Heidelberg College Tiffin, OH September 7, 2004 Page 1 of 8
2.g. Relationships between Pollutant Loading and Stream Discharge
 http://wql-data.heidelberg.edu/index2.html 9/27/5 2.g. Relationships between Pollutant Loading and Stream Discharge Introduction Graphs of the relationship between the concentration of a pollutant and
A Balanced Diet for Lake Erie: Reducing Phosphorus Loadings and Harmful Algal Blooms
 A Balanced Diet for Lake Erie: Reducing Phosphorus Loadings and Harmful Algal Blooms - Lake Erie Ecosystem Priority (LEEP) Report Overview - Council of Great Lakes Industries August 7, 2014 Raj Bejankiwar
Nutrient reduction strategies and ongoing research in Ohio
 Nutrient reduction strategies and ongoing research in Ohio Mark Williams & Kevin King USDA ARS Soil Drainage Research Unit, Columbus, OH 2014 SERA17 Meeting Des Moines, IA 2011 Phosphorus loading has been
4Rs for Healthy Soils & Healthy Waters
 4Rs for Healthy Soils & Healthy Waters C.S. Snyder, PhD, CCA Nitrogen Program Director, Conway, AR Healthy Soils and Healthy Waters Workshop Columbus, OH September15-16, 2014 www.ipni.net Acknowledging
Reducing Phosphorus Loss to Lake Erie: Application & Timing of Nutrients. Ontario Ministry of Agriculture, Food and Rural Affairs (OMAFRA)
") Reducing Phosphorus Loss to Lake Erie: Application & Timing of Nutrients Ontario Ministry of Agriculture, Food and Rural Affairs (OMAFRA) Great Lakes Commission Joint Action Plan The Great Lakes Commission
Reducing Phosphorus Loss to Lake Erie: Application & Timing of Nutrients Ontario Ministry of Agriculture, Food and Rural Affairs (OMAFRA) Great Lakes Commission Joint Action Plan The Great Lakes Commission
Phosphorus Kyle Minks Land and Water Resources Scientist Land Conservation Division
 Phosphorus Kyle Minks Land and Water Resources Scientist Land Conservation Division Overview Phosphorus 101 Phosphorus transport What is legacy phosphorus How phosphorus is managed to reduce environmental
Managing Phosphorus 4R Crops and Environment. Tom Bruulsema, Phosphorus Program Director
 Managing Phosphorus 4R Crops and Environment Tom Bruulsema, Phosphorus Program Director The International Plant Nutrition Institute is supported by leading fertilizer manufacturers. Formed in 2007 from
Ohio Lake Erie Phosphorus Task Force Meeting Minutes September 10, 2007 Riffe Center, Columbus, OH
 Ohio Lake Erie Phosphorus Task Force Meeting Minutes September 10, 2007 Riffe Center, Columbus, OH Meeting Objective: To explore the use of a phosphorus risk index to determine the phosphorus concentrations
Harmful Algal Blooms in Lake Erie
 An update on Harmful Algal Blooms in Lake Erie Thomas Bridgeman University of Toledo November 8, 2013 Outline Introduction, History and Lake Erie HABs 2002-2013 HAB forecast and early warning tools Ohio
Using No-till and Cover Crops to Reduce Phosphorus Runoff
 Using No-till and Cover Crops to Reduce Phosphorus Runoff How to Avoid SRP in Surface Water Dr. K. Rafiq Islam, Research Scientist Jim Hoorman, Assistant Professor, Agriculture and Natural Resources hoorman.1@osu.edu
Annex 4 Nutrients Great Lake Executive meeting June 24 25, 2015
 Annex 4 Nutrients Great Lake Executive meeting June 24 25, 2015 June 10,2015 Susan Humphrey Environment Canada Tinka Hyde United States Environmental Protection Agency. Overview of presentation Targets
Bob Broz University of Missouri Extension
 Bob Broz University of Missouri Extension brozr@missouri.edu 573-882-0085 What is the purpose on the nutrient reduction committee? Reduce nutrient loading into the Mississippi River and into the Gulf of
Improved Simulation of Soil and. Manure Phosphorus Loss in SWAT
 Improved Simulation of Soil and Manure Phosphorus Loss in SWAT SWAT Conference October, 2015 at Purdue University Amy S. Collick, Pete J. Kleinman, Tamie Veith, Daren Harmel, Mike White, Pete Vadas, USDA-ARS
Managing Phosphorus 4R Crops and Environment
 Indiana Certified Crop Adviser Conference 14 December 2016 Indianapolis, Indiana Managing Phosphorus 4R Crops and Environment Tom Bruulsema, Phosphorus Program Director The International Plant Nutrition
Alum and Gypsum Treated Poultry Manure and Fertilizer Phosphorus Losses with Runoff with or without Incorporation into the Soil
 Alum and Gypsum Treated and Phosphorus Losses with Runoff with or without Incorporation into the Soil Final Project Report to the Iowa Egg Council Antonio P. Mallarino and Mazhar U. Haq Department of Agronomy,
Comparison of Phosphorus and Nitrogen Loss in Surface Runoff versus Tile Flow in Wisconsin Tile Drained Landscapes
 Comparison of Phosphorus and Nitrogen Loss in Surface Runoff versus Tile Flow in Wisconsin Tile Drained Landscapes Eric Cooley Research Coordinator UW Discovery Farms What Are Discovery Farms? The Discovery
Given the complexities, we must look at practice-based metrics in conjunction with performance-based metrics when assessing results
 May 24, 2017 Ms. Madhu Malhotra, Manager Ministry of the Environment and Climate Change Climate Change and Environmental Policy Division Land and Water Policy Branch 40 St. Clair Avenue West, Floor 10
Phosphorus Placement for Corn, Soybeans, and Wheat
 Phosphorus Placement for Corn, Soybeans, and Wheat T.W. Bruulsema T.S. Murrell 42 nd Annual North Central Extension-Industry Soil Fertility Conference. 14-15 Nov. 2012. Des Moines, IA. Outline Theory of
Optimizing yield while minimizing phosphorus water quality impacts: Some do s and don ts
 13 Integrated Crop Management Conference - Iowa State University 165 Optimizing yield while minimizing phosphorus water quality impacts: Some do s and don ts Antonio P. Mallarino, professor and Extension
Toward a Great Lakes Watershed Ecological Sustainability Strategy (GLWESS): Modeling Workshop. Lansing, MI May 3, 2012
: Modeling Workshop. Lansing, MI May 3, 2012") Toward a Great Lakes Watershed Ecological Sustainability Strategy (GLWESS): Modeling Workshop Lansing, MI May 3, 2012 Presentation Outline Overview of ecological concerns General modeling overview How
Toward a Great Lakes Watershed Ecological Sustainability Strategy (GLWESS): Modeling Workshop Lansing, MI May 3, 2012 Presentation Outline Overview of ecological concerns General modeling overview How
Linking Ecological and Economic Models that Support Conservation Auctions to Reduce Harmful Algal Blooms in Lake Erie
 Linking Ecological and Economic Models that Support Conservation Auctions to Reduce Harmful Algal Blooms in Lake Erie Leah H. Palm-Forster *1, Scott M. Swinton 1, Robert S. Shupp 1, Frank Lupi 1, Todd
Fertilizer Application Patterns and Trends, and Their Implications for Water Quality in the Western Lake Erie Basin
 Fertilizer Application Patterns and Trends, and Their Implications for Water Quality in the Western Lake Erie Basin Prepared by Great Lakes Science Advisory Board Science Priority Committee Fertilizer
Strategies for Phosphorus Management on Cropland. Renee Hancock, NE NRCS State Water Quality Specialist
 Strategies for Phosphorus Management on Cropland Renee Hancock, NE NRCS State Water Quality Specialist Phosphorus Essential nutrient for growth of crops. Often needs to be applied to land for optimal crop
A Presentation of the 2011 IA MN SD Drainage Research Forum. November 22, 2011 Okoboji, Iowa
 A Presentation of the 2011 IA MN SD Drainage Research Forum November 22, 2011 Okoboji, Iowa 1 Phosphorus Loss Through Subsurface Tile Drainage A.P. Mallarino, M.U. Haq, M.J. Helmers, R.S. Kanwar, C.H Pederson,
The Ohio Lake Erie Phosphorus Task Force Phase II: Science-based Analysis for Policy Recommendations
 The Ohio Lake Erie Phosphorus Task Force Phase II: Science-based Analysis for Policy Recommendations Gail Hesse Ohio Lake Erie Commission July 30, 2013 Blue-green Algae Bloom circa 1970, Lake Erie
Northeast-Midwest Institute: The Lake Erie Nutrient Case Study
 Northeast-Midwest Institute: The Lake Erie Nutrient Case Study Anne Choquette U.S. Geological Survey Great Lakes Water Quality Agreement Annex 4 Loading Calculations Technical Symposium April 5-6, 2017
Soil Health, Nutrient Management and the New 590 Standard
 Soil Health, Nutrient Management and the New 590 Standard Mark Scarpitti, CCA State Agronomist, Ohio NRCS (740) 653-1500 ext 103 mark.scarpitti@oh.usda.gov February 25 th 2014 Helping People Help the Land
Recent Modeling in the Maumee Watershed and the Western Basin of Lake Erie
 LEMN Conference University of Windsor April 27-29, 2010 Recent Modeling in the Maumee Watershed and the Western Basin of Lake Erie J.V. DePinto, T.R. Redder, E.M. Verhamme, L. Weintraub LimnoTech, Ann
Analyzing Data to Characterize Your Watershed. November 29, Thomas Davenport
 Analyzing Data to Characterize Your Watershed November 29, 2017 Thomas Davenport tedavenport@comcast.net 1 Steps in the Watershed Planning and Implementation Process 2 Incorporation of the nine minimum
Summary of Water Monitoring Data
 Clay County Drainage Site Summary of Water Monitoring Data 2011 2015 Introduction The Red River Valley in northwestern Minnesota is experiencing an increase in the amount of agricultural subsurface drainage
Residue and Nutrient Management Under Reduced Tillage Systems
 Residue and Nutrient Management Under Reduced Tillage Systems Warren A. Dick* and Dean A. Martens *The Ohio State University dick.5@osu.edu OUTLINE 1. Introduction A.Historic Uses and Management of Residues
Phosphorus Dynamics and Mitigation in Soils
 Phosphorus Dynamics and Mitigation in Soils Umass Extension - Managing Phosphorus in Organic Residuals Applied to Soils: Composts, Biosolids, Manures and Others November 2, 2016 - Marlborough, MA Jennifer
Shawn P. McElmurry, Ph.D., P.E. Wayne State University Rem Confesor Jr.,PhD. NCWQR, Heidelberg University
 Shawn P. McElmurry, Ph.D., P.E. Wayne State University Rem Confesor Jr.,PhD. NCWQR, Heidelberg University Great Lake Great Challenges Forum 2013 Oakland University March 14, 2013 Review over 240 primary
Water Quality Monitoring for Lake Erie and the Great Lakes Nutrient Initiative (GLNI)
") Water Quality Monitoring for Lake Erie and the Great Lakes Nutrient Initiative (GLNI) 2011-2016 Water Quality Monitoring and Surveillance Division Alice Dove, Sean Backus, Vi Richardson Issues Facing the
Water Quality Monitoring for Lake Erie and the Great Lakes Nutrient Initiative (GLNI) 2011-2016 Water Quality Monitoring and Surveillance Division Alice Dove, Sean Backus, Vi Richardson Issues Facing the
Acidity and Alkalinity:
 Evaluation of Pollution Sources to Lake Glenville Quarterly Report December 2018 Kimberlee K Hall, PhD Environmental Health Program, Western Carolina University Summary Chemical and microbial analysis
Land application of manure for water quality protection : A play in three acts
 Land application of manure for water quality protection : A play in three acts Peter Kleinman USDA-ARS University Park, Pennsylvania Mark Goodson USDA-NRCS Harrisburg, Pennsylvania With a little help from
Phosphorus Fertilizer Decisions
 Phosphorus Fertilizer Decisions Tom Bruulsema, Phosphorus Program Director Malcolm Stambaugh, Crop Specialist & Stewardship Advocate Alan Madison, Producer & Stewardship Advocate The International Plant
Targeting and Incentivizing Environmentally Beneficial Conservation Practices in Great Lakes Agricultural Watersheds
 NCER 2013 CHICAGO, IL JULY 29-AUGUST 1, 2013 Targeting and Incentivizing Environmentally Beneficial Conservation Practices in Great Lakes Agricultural Watersheds Project: Great Lakes Watershed Ecological
Particulate Soil Phosphorus and Eutrophication in Lakes and Streams
 Particulate Soil Phosphorus and Eutrophication in Lakes and Streams Paul R. Bloom Soil, Water, & Climate Department University of Minnesota With contributions by John Moncrief, Carl Rosen and David Mulla
MANURE MANAGEMENT IMPACTS ON PHOSPHORUS LOSS WITH SURFACE RUNOFF AND ON-FARM PHOSPHORUS INDEX IMPLEMENTATION. AN OVERVIEW OF ONGOING RESEARCH
 MANURE MANAGEMENT IMPACTS ON PHOSPHORUS LOSS WITH SURFACE RUNOFF AND ON-FARM PHOSPHORUS INDEX IMPLEMENTATION. AN OVERVIEW OF ONGOING RESEARCH Antonio P. Mallarino, professor Brett. L. Allen and Mazhar
Discovery Farms Minnesota N and P, what is happened in Farm Fields? Jerome Lensing January 9, 10, 11, 2018 AgVise Labs
 Discovery Farms Minnesota N and P, what is happened in Farm Fields? Jerome Lensing January 9, 10, 11, 2018 AgVise Labs Jerome.lensing@hotmail.com Discovery Farms is a farmer led water quality research
Ohio EPA s Nutrient Mass Balance Study for Ohio s Major Rivers
 One Water Government & Regulatory Affairs Workshop March 9, 2017 Ohio EPA s Nutrient Mass Balance Study for Ohio s Major Rivers Guy Jamesson, PE, BCEE Senior Engineer Nutrient Mass Balance Study for Ohio
State of the Blanchard River Watershed in (condensed version)
") State of the Blanchard River Watershed in 2016 (condensed version) State of Watershed 2016 Report Introduction - The Total Maximum Daily Load (TMDL) Report for the Blanchard River watershed was adopted
State of the Blanchard River Watershed in 2016 (condensed version) State of Watershed 2016 Report Introduction - The Total Maximum Daily Load (TMDL) Report for the Blanchard River watershed was adopted
Executive Summary. 1.1 Case Study Question
 Water Data to Answer Urgent Water Policy Questions: Monitoring design, available data, and filling data gaps for determining the effectiveness of agricultural management practices for reducing tributary
Modeling soil P. Case study focusing on the Soil and Water Assessment Tool (SWAT) and ongoing research. Margaret Kalcic, Grey Evenson, Rebecca Muenich
 and ongoing research. Margaret Kalcic, Grey Evenson, Rebecca Muenich") Modeling soil P Case study focusing on the Soil and Water Assessment Tool (SWAT) and ongoing research Margaret Kalcic, Grey Evenson, Rebecca Muenich Phosphorus Field to Watershed Modeling Workshop, August
Modeling soil P Case study focusing on the Soil and Water Assessment Tool (SWAT) and ongoing research Margaret Kalcic, Grey Evenson, Rebecca Muenich Phosphorus Field to Watershed Modeling Workshop, August
Antonio Mallarino Professor, Department of Agronomy. Introduction
 2003 Integrated Crop Management Conference - Iowa State University 121 USING THE IOWA PHOSPHORUS INDEX FOR AGRONOMIC AND ENVIRONMENTAL MANAGEMENT OF FERTILIZER AND MANURE PHOSPHORUS Antonio Mallarino Professor,
Topics Background Findings Recommendations
 Ohio Lake Erie Phosphorus h Task Force Chris Riddle, Ohio EPA, Division of Drinking & Ground Waters for Gail Hesse, Ohio EPA, Division of Surface Water December 9, 2010 Topics Background Findings Recommendations
Applying Manure---The Right Rate at the Right Time
 Applying Manure---The Right Rate at the Right Time Amber Radatz UW-Discovery Farms Program Minnesota Nutrient Efficiency & Management February 15, 2011 Outline So I don t get lost either! Values and costs
Summary of Findings and Strategies to Move Toward a 40% Phosphorus Reduction. A White Paper 1
 Summary of Findings and Strategies to Move Toward a 40% Phosphorus Reduction A White Paper 1 By Kristen Fussell, Gail Hesse, Laura Johnson, Kevin King, Greg LaBarge, Jay Martin, Jeffrey Reutter, Robyn
Modeling Sediment and Nutrient Loads Input to Great Lakes and Effects of Agricultural Conservation Practices on Water Quality
 Modeling Sediment and Nutrient Loads Input to Great Lakes and Effects of Agricultural Conservation Practices on Water Quality C. Santhi and CEAP National Assessment Team Texas A&M University System, Temple,
Michalak et al Lake Erie and HABs Dan Warner
 Record-setting algal bloom in Lake Erie caused by agricultural and meteorological trends consistent with expected future conditions Michalak et al. 2013 Lake Erie and HABs Dan Warner Context and History
Impact of Degree of Fertilizer and Manure Incorporation and Timing of First Runoff Event on Phosphorus Losses to Surface Runoff
 Impact of Degree of Fertilizer and Manure Incorporation and Timing of First Runoff Event on Phosphorus Losses to Surface Runoff Ivan O Halloran University of Guelph, Ridgetown, ON Context The 4R Nutrient
Status of Water Quality in Ohio: The 2018 Integrated Report. April 25, 2018
 Status of Water Quality in Ohio: The 2018 Integrated Report April 25, 2018 Today s Topics Overview of the 2018 Integrated Report Purpose and requirements Assessment overview Differences from the 2016 Integrated
Ohio EPA s Nutrient Mass Balance Study of Ohio s Major Rivers
 August 15-17, 2017 Ohio EPA s Nutrient Mass Balance Study of Ohio s Major Rivers Guy Jamesson, PE, BCEE Senior Engineer Have you heard this? Nutrients come mostly from farm runoff Some do, BUT a huge amount
2016 HLWD WATER QUALITY RESULTS CATHERINE WEGEHAUPT WATERSHED TECHNICIAN JULY 2017 BOARD MEETING
 2016 HLWD WATER QUALITY RESULTS CATHERINE WEGEHAUPT WATERSHED TECHNICIAN JULY 2017 BOARD MEETING JACK CREEK 1200 2016 JACK CREEK HYDROGRAPH 1.80 1000 1.60 1.40 MEAN DAILY DISCHARGE (CFS) 800 600 400
Resources Conservation Practices Tillage, Manure Management and Water Quality
 Resources Conservation Practices Tillage, Manure Management and Water Quality T illage and manure application practices significantly impact surface and ground water quality in Iowa and other Midwestern
CHAPTER 6 AGRICULTURE, DRAINAGE, AND HABITAT
 CHAPTER 6 AGRICULTURE, DRAINAGE, AND HABITAT I. Introduction Land area in the Toledo Metropolitan Area Council of Governments (TMACOG) region is comprised mainly (80%) of agriculture and other rural uses
Pat Conrad, Joe Pallardy, Kristine Maurer Water Quality Monitoring Summary Report
 technical memo Project Name 2017 Water Quality Monitoring Date 4/9/2018 To / Contact info From / Contact info Regarding Kayla Bergman: Squaw Creek WMA Pat Conrad, Joe Pallardy, Kristine Maurer 2017 Water
Overview on Green Infrastructure Actions within the Draft Canada-Ontario Action Plan for Lake Erie
 Overview on Green Infrastructure Actions within the Draft Canada-Ontario Action Plan for Lake Erie Green Infrastructure Champions Workshop October 5, 2017 Ministry of the Environment and Climate Change
July 2009 WATER QUALITY SAMPLING, ANALYSIS AND ANNUAL LOAD DETERMINATIONS FOR THE ILLINOIS RIVER AT ARKANSAS HIGHWAY 59 BRIDGE, 2008
 July 29 WATER QUALITY SAMPLING, ANALYSIS AND ANNUAL LOAD DETERMINATIONS FOR THE ILLINOIS RIVER AT ARKANSAS HIGHWAY 59 BRIDGE, 28 LESLIE B. MASSEY, WADE CASH, AND BRIAN E. HAGGARD Submitted to Arkansas
Shifting the Norm Ohio s Grain Farmers and Water Quality
 Shifting the Norm Ohio s Grain Farmers and Water Quality 2017 OWEA One Water Government Affairs and Regulatory Workshop Columbus, Ohio Elizabeth Toot-Levy March 9, 2016 Lake Erie - 1971 From Understanding
The implications of environmental policy on nutrient outputs in agricultural watersheds
 The implications of environmental policy on nutrient outputs in agricultural watersheds Brent Sohngen AED Economics, Ohio State University 2120 Fyffe Rd Columbus, OH 43210 Sohngen.1@osu.edu Sei Jin Kim
Annual P Loss Estimator (APLE)
") Annual P Loss Estimator (APLE) User-friendly Model for Annual, Field-Scale Phosphorus Loss Peter Vadas USDA-ARS Madison, WI Phosphorus input to water bodies continues to be an issue Agriculture continues
Annual P Loss Estimator (APLE) User-friendly Model for Annual, Field-Scale Phosphorus Loss Peter Vadas USDA-ARS Madison, WI Phosphorus input to water bodies continues to be an issue Agriculture continues
Table S1. Partial budgets for stover collection scenarios modeled Stover harvest 8.42
 Table S. Partial budgets for stover collection scenarios modeled Scenario. -Beans, 38% Stover Removal Cost category Removal Yield change Description allocated to Cost Source Nutrient replacement 52.88
HYPOXIA ACTION PLAN: WHAT CAN MIDWEST AGRICULTURE DO? Dennis McKenna Illinois Department of Agriculture
 HYPOXIA ACTION PLAN: WHAT CAN MIDWEST AGRICULTURE DO? Dennis McKenna Illinois Department of Agriculture The hypoxic zone is an area in the northern Gulf of Mexico where dissolved oxygen concentrations
Objective 1: Manage the demonstration site using common agricultural practices and monitor runoff quantity and quality.
 Appendix B Objectives/Tasks Accomplishments By J. Kjaersgaard, South Dakota State University. Objective 1: Manage the demonstration site using common agricultural practices and monitor runoff quantity
Introduction. Manure Management Facts Prioritization and Rotation of Fields for Manure Application. July 2014
 Manure Management Facts Prioritization and Rotation of Fields for Manure Application July 2014 Introduction Farmers apply synthetic fertilizer and manure to their land to replace the nutrients removed
introduction Agdex 090-4
 Agdex 090-4 For more information on the beneficial management practices provided to help operators minimize the loss of phosphorus into surface water, please refer to the following link: Agdex FS090-3
Part B: Phosphorus Loss Potential due to Management Practices and P Source Characteristics
 not suffer from such impacts. Surface waters having high water quality may require the implementation of policies and management practices to protect them from deterioration due to excess inputs of nutrients.
PHOSPHORUS DYNAMICS & POLLUTION
 PHOSPHORUS DYNAMICS & POLLUTION (Source of some of the notes Zaimes & Shultz 2002 Phosphorus literature review Sharpley et al. 1999 Agricultural phosphorus & eutrophication) Introduction A major player
Natural Resources & Environmental Stewardship
 Natural Resources & Environmental Stewardship Fundamentals of Nutrient Management Melissa L. Wilson Department of Environmental Science & Technology Ag Nutrient Management Program University of Maryland,
Nitrogen Loss Potential at Pagel s Ponderosa Dairy
 Understanding Nutrient & Sediment Loss at Pagel s Ponderosa Dairy - 9 Summer 21 Nitrogen Loss Potential at Pagel s Ponderosa Dairy Eric Cooley, Dennis Frame and Aaron Wunderlin UW Extension/Discovery Farms
Unusually large loads in 2007 from the Maumee and Sandusky Rivers, tributaries to Lake Erie
 doi:1.2489/jswc.65.6.45 Unusually large loads in 27 from the Maumee and Sandusky Rivers, tributaries to Lake Erie R.P. Richards, D.B. Baker, J.P. Crumrine, and A.M. Stearns Abstract: During water year
This powerpoint has been adapted from a presentation at the Agronomy Society of America meetings in San Antonio, Texas in October 2011.
 This powerpoint has been adapted from a presentation at the Agronomy Society of America meetings in San Antonio, Texas in October 2011. More information is available in the following publication: Good,