TABLE OF CONTENTS Integrated Resource Plan
|
|
|
- Delilah Cross
- 6 years ago
- Views:
Transcription

1
2 TABLE OF CONTENTS 1. TO OUR CUSTOMERS INTRODUCTION Background The IRP Process Basis of this IRP Electricity Transformation EXECUTIVE SUMMARY OUR SITUATION EXISTING SYSTEM Load Forecast Generation Resources Transmission and Interconnections Load and Resource Balance Environmental and Sustainability Considerations Sustainability Pillar - Environment Sustainability Pillar - Social Sustainability Pillar - Economic Renewable Portfolio Standard Fuel Price Forecast Long-Term Financial and Economic Parameters General Introduction The Consumer Price Index The Construction Price Index The Foreign Exchange Rate The Weighted Average Cost of Capital SUPPLY OPTIONS Traditional Utility Supply Options Community and Personal Distributed Generation RESULTS OF SUPPLY ANALYSIS Levelized Cost of Electricity Levelized Cost of Electricity Methodology Private versus Public Financing Levelized Cost of Electricity Summary Supply-Side Plan Evaluation Least-Cost Methodology ENERGY EFFICIENCY, DEMAND MANAGEMENT AND SMART GRID... 64
3 8.1. Demand-Side Management Energy Smart NB DSM Plan 2019 to Beyond the First Three Years COMMUNITY DIALOG SESSIONS Overview of Public Consultation Process Our Energy Future NB Scope of Engagement Online Engagement Findings Customer Engagement Session Findings INTEGRATED DEMAND AND SUPPLY Introduction Integration Approach and Methodology Supply Assumptions Demand and Energy Reduction Assumptions from Energy Smart NB Integration Minimization Criteria Final Integration Results Sensitivity Analysis Capital Costs Fuel Prices Load Sensitivities GHG Regulation and Prices Scenario Evaluation CONCLUSION APPENDICES Appendix 1: IRP Public Engagement Program - What Was Said Final Report Appendix 2: List of assumptions for IRP Appendix 3: Fuel and Market Price Forecast Appendix 4: Supply Options Appendix 5: Project and Operating Cost Parameters Appendix 6: Sensitivity Analysis Expansion Plans Appendix 7: Glossary and Abbreviations


4 1. TO OUR CUSTOMERS The electricity industry is changing. NB Power is part of this change and in the process of reinventing what has remained the same for the last century. While the electricity system in New Brunswick is in the initial stages of change, NB Power will be focused on making sure customers are at the forefront of receiving safe reliable service while ensuring clean energy and a strong grid for generations to come. NB Power knows that our customers are looking for their utility to be a sustainable business and they want to have a say and a stake in how the system is planned. This Integrated Resource Plan (IRP) was developed with the consideration of customer priorities. These priorities are related to areas that are of concern to our customers: affordability; today and tomorrow, clean energy and the environment, and what part do customers play as new options and services are made available today and into the future. Affordability Clean Energy/ Environment Customer Options/ Programs & Services At the same time, NB Power has an obligation to deliver safe, reliable energy at low and stable rates achieve 40 per cent of electricity sales from renewable resources by 2020 ensure a sustainable energy supply plan for the future These obligations are entrenched within the Electricity Act and therefore become law for NB Power. These obligations are also foundational to this IRP. This IRP is built with the consideration of customer priorities that were identified through public input. This input was gathered through three public sessions and through an online survey as well as written submissions. This input will allow NB Power to develop solutions in the future that will respond to what customers care about most. A summary of what was said during the public sessions is provided in Section 9 Community Dialog Sessions. A separate document was also prepared entitled What was Said Final Report which can be found in Appendix 1 of this IRP. 1
5 2. INTRODUCTION Since 1920, NB Power has provided New Brunswick with a secure, reliable and competitively priced supply of electricity. Over the years, the supply mix has grown from a small, 5 MW hydroelectric generating station in Musquash to one of the most diverse systems in North America, which currently consists of 13 generating stations comprising nuclear, hydro, coal, oil and diesel, as well as power purchase agreements from various privately owned renewable and natural gas generating facilities. NB Power has more than 6,800 km of transmission lines, and over 21,000 km of distribution lines. NB Power is committed to providing safe, reliable and efficient power to over 400,000 direct and indirect customers in New Brunswick. NB Power s corporate mission, vision and values: MISSION VISION VALUES To Be Our Customers Partner of Choice for Energy Solutions Sustainable Energy for Future Generations Safety Quality Diversity Innovation The mission, vision and values define the long-term strategy for NB Power. The mission describes the purpose of the organization, while the vision paints a picture of what the desired future will look like. The values represent what is important to the company and how employees operate and behave while working with internal and external stakeholders to conduct business and work towards achieving the corporation s mission and vision. NB Power s mission has been, and continues to be, customer focused. NB Power s relationships with customers and stakeholders constantly evolve to enhance this focus. By continuously demonstrating its core values of safety, quality, diversity, and innovation, NB Power will become customers partner of choice for energy solutions. It is recognized that the electricity industry is changing, and as a result, NB Power s vision of Sustainable Energy for Future Generations will reflect this new priority. The Canadian Electricity Association defines sustainable electric utilities as those Pursuing progressive business strategies and activities that meet the needs of the present, while enhancing the environmental, social, and economic resources that will be needed in the future
6 At NB Power, sustainability is factored into every decision and every plan for the future. It s about balancing efforts to deliver competitively priced electricity while maintaining long-term corporate health. It s about harnessing the power of renewable energy sources and safeguarding the environment by moving away from fossil fuels. Sustainability represents goals embraced by NB Power as a company protecting low rates, reducing the carbon footprint and being responsible to the communities in which employees and customers work and live. With this in mind, NB Power continues to focus on the three pillars of sustainability: the environment, society and the economy. NB Power will continue to focus on identifying innovative environmental technologies that will benefit customers and further reduce its carbon footprint, by continuing to deliver electricity from a diverse mix of non-emitting resources such as wind, hydro, nuclear and other renewable resources and to ensure stable power rates and reliable supply. This report is intended to provide a plan for NB Power to move towards sustainable electricity. This plan represents a snapshot into the future that reflects current conditions, assumptions and forecasts. It is a plan that incorporates what our customers care about most: affordability, clean energy, and new personal options and services. The plan, however, will continually evolve as conditions change and as new sustainable opportunities emerge over time. It is intended that the plan be reviewed on a triennial basis to reflect the latest industry developments and information. While the assumptions in this IRP are based on best information available at the time of writing, analysis was performed to capture uncertainties associated with the major assumptions. This analysis can be found in the Sensitivity Analysis section of this report. With respect to Greenhouse Gas (GHG) regulation, NB Power has included within the base analysis, compliance with current federal regulation related to the reduction of carbon dioxide emissions from coal-fired electricity. The current regulation allows existing coal facilities to operate to their normal end of life. NB Power has included in this report a sensitivity that includes carbon pricing consistent with the Pan-Canadian Framework on Clean Growth and Climate Change. This pricing was then applied to a carbon tax system and a cap and trade system. Also included was a sensitivity of early coal shut down by The Government of New Brunswick is working with NB Power and the federal government to develop a made-in-new Brunswick GHG management strategy and to explore all options to minimize the cost to New Brunswickers. As the direction on the carbon strategy for New Brunswick becomes clearer, NB Power will review the necessity to refresh this IRP. 3
7 2.1. Background NB Power continues to work in pursuit of three key strategies as outlined in its 30-year Strategic Plan. 1. Become among the best at what we do. NB Power will target being a top performer (top 25 per cent) as compared to other similar public and private utilities in North America; 2. Reduce our debt so we can invest in the future. Systematically reduce debt to ensure NB Power is in a financial position to invest in new generation and transmission when necessary to ensure stable rates for New Brunswick; and 3. Reduce and shift electricity demand. Invest in technology, educate customers and promote efficiencies that will help reduce and shift demand for electricity and ultimately defer or remove required future investment in generation. These strategies are intended to allow NB Power to replace future generation as needed while taking advantage of future energy options and operating as efficiently as possible. They are also intended to help our customers understand how to reduce electricity consumption and shift demand patterns without affecting personal comfort. Operating under the authority of Electricity Act requires NB Power to file every three years with government and with the Energy and Utilities Board (EUB) an Integrated Resource Plan that outlines projected demand requirements and planned sources of supply. NB Power is directed by the Electricity Act, and regulated by the EUB to operate under the following policy objectives to provide low and stable rates to ensure a reliable system to meet the requirement of a Renewable Portfolio Standard (RPS) NB Power must submit annually an application before the EUB of its electricity sales rates and a ten year strategic, financial and capital investment plan. The EUB considers the IRP as an input into their decision-making process when reviewing a rate application. The EUB also considers the IRP when reviewing NB Power s application for approval of any capital project above $50 million. This IRP fulfils NB Power s renewed commitment to develop a long-term plan that considers economics, the environment, long-term societal interests, and various sensitivities of these features. 4
8 This IRP has been developed through a customer engagement process established to seek feedback from customers and to provide guidance to the plan through the following questions. 1. Affordability: What are your priorities related to rates and debt repayment, investing into more customer options, transitioning to a clean energy future, and purchasing renewable power from other jurisdictions versus promoting local supply? 2. Clean energy and the environment: What are your priorities related to moving away from fossil fuels, paying more for clean energy, NB Power being a leader in clean energy and energy efficiency, and whether it is important that electricity for New Brunswick is made in New Brunswick? 3. Customer Options: What are your priorities related to NB Power offering customer options to better manage their electricity use, personally investing in equipment and technology to save electricity, purchasing an electric car, generating your own electricity, participating in a time-of-use rate program, and is it NB Power s job to manage electricity use and costs? This IRP analysis is part of a continual process that requires periodic load and resource updates as conditions change and evolve over time provincially, nationally and even globally. It reflects the evolution of NB Power s strategic planning approach as it embarks on a strategy to more closely align the IRP development activities to the business planning process. As technologies and circumstances change, so will the recommendations presented in the IRP. The IRP helps set NB Power s vision of the future The IRP Process The planning process that encompasses the evaluation of supply and demand is called integrated resource planning. This IRP includes long-term strategies to ensure NB Power s obligation to supply in-province load is met, that renewable resource regulations are followed, and that resources comply with air emission standards. These long-term strategies provide long-term rate stability, reliability of supply, economic efficiency, environmental acceptability and financial viability. The development of this IRP required in-depth analysis in three key areas: 1. Energy efficiency and demand considerations (which reduce and shift demand) as well as supply considerations. 2. Reliability and security of supply. 3. Policy and regulatory considerations. 5
9 External feedback is an integral part of the IRP process. NB Power communicated and consulted with customers and key stakeholders including First Nations, to ensure an optimum long-term supply of electricity for New Brunswick. The analysis was done to ensure an appropriate balance of the three key areas listed above while considering economic, environmental and societal implications. Historically, the choices that were made to supply future electricity needs were based predominantly on the overall cost effectiveness of available options. These customarily encompassed a wide range of traditional generation technologies including hydro, nuclear, and fossil fuel generation such as coal, natural gas and oil. The cost effectiveness view continues to be prevalent today, but because of the uncertainty of the supply of imported hydrocarbon fuels and the volatility of corresponding fuel prices, combined with more stringent environmental requirements (including greenhouse gas (GHG) regulation and compliance with the renewable portfolio standard), a new focus of choosing environmentally preferred power generation will be required. The plan must be realistic and ensure that all supply-side options, including the environmentally preferred power generation choices, provide the appropriate level of reliability, and at reasonable costs. In addition to supply options, consideration was also given to energy efficiency and demand management programs that will help manage the load requirements for New Brunswick. These programs were developed to deliver demand reductions and achieve the appropriate level of cost-effectiveness to New Brunswick consumers. The demand reduction programs are part of an overall approach called Energy Smart New Brunswick or Energy Smart NB. This approach focuses primarily on reducing and shifting demand and includes investments to modernize the grid. The latter will allow the introduction of new technologies to help customers manage their electricity needs more effectively. Grid modernization will enable these new technologies while ensuring grid stability. Grid modernization will also allow NB Power to operate more efficiency and to provide increased reliability and enhanced service to customers. More detail related to Energy Smart NB is provided in the sections that follow. The IRP is NB Power s long-term plan that seeks to answer the following questions. 1. What is the current supply of electricity and what is the cost of delivering it using existing technology? 2. What impact does the current electricity supply have on the environment? 3. How do we ensure a reliable supply of power now and going forward? 4. How will changes in society and industry impact New Brunswick s future need for electricity? 5. What new technologies and techniques can NB Power use that will be the most costeffective, reliable and sustainable? 6
10 To create the IRP, NB Power follows a well-defined process that is standard across utilities. The following diagram depicts the key elements of a step-by-step process used to answer the questions identified above. Figure 1: IRP process The IRP process can be broken down into a series of steps. 1. Look at the existing system and make certain assumptions about the corresponding parameters (such as fuel prices or polices/regulations going forward). 2. Look at the life expectancy of the existing power plants and expiry dates of the power purchase agreements. 3. Determine the long-term forecast of in-province electricity requirements. 4. Compare long-term supply with long-term requirements, to identify the gap. 5. Research all future supply and demand options and rank them according to cost. 6. Check that the least-cost options are reliable and that the renewable portfolio standard is met. If so, the viable supply and/or demand option feeds back to 3) and 4) to meet the gap. 7. Provide energy literacy and seek input from stakeholders through a public engagement process to determine appropriateness of all supply and demand options. 7
11 8. Give consideration to any option identified through public engagement by checking against the criterion in Step 6 and, if appropriate, then feed these back to 3) and 4) to fill the gap Basis of this IRP The IRP assesses New Brunswick s future demand requirements based on population, customer expectations, electricity needs for households and businesses, and promoting economic growth in New Brunswick. The least-cost expansion plan responds to the in-province electricity needs including reserve requirements. As New Brunswick s electricity needs have changed, particularly with changes in industry, so has NB Power s grid. The figure below shows how NB Power s electricity requirements decreased in the 2008/09 and 2009/2010 periods. NB Power subsequently responded by removing two generation assets at Grand Lake (in 2010) and Dalhousie (in 2012). It is expected that with the reduction in historical demand from previous demand reduction programs, as well as new initiatives to reduce and shift demand in the future, new utility supply resources to meet peak demand will not be required until well into the future. The program to reduce and shift demand called Energy Smart NB, is discussed and evaluated in this IRP. The potential impact of the Energy Smart NB on future electricity requirements is also shown in the figure below. Figure 2: Historic and forecast future electricity requirements for New Brunswick Provincial Energy Requirements (GWh) 20,000 15,000 10,000 5,000 0 History Forecast without Energy Smart NB Forecast with Energy Smart NB 8
12 Ultimately, NB Power is responsible for ensuring that adequate electricity is available to serve New Brunswick customers today and tomorrow. In addition to this long-term load requirement, this IRP also seeks to establish a development plan that responds to the Electricity Act and operates under the policy objectives to provide low and stable rates, to ensure a reliable power system and to meet the requirements of the RPS. In the near-term, to contain costs, NB Power must optimize its existing assets and utilize its interconnections to buy and sell electricity. In the medium-term there is a requirement to meet the RPS that directs NB Power to supply 40 per cent of the electricity it sells in New Brunswick from renewable resources such as biogas, biomass, solar, hydro, wind or renewable purchases by Creating a more efficient system will also play a role to achieve the RPS through grid modernization, new customer options and reducing and shifting demand. Over the longer-term the end of life of existing resources must be recognized and the appropriate responses made for continued reliability of supply. This IRP presents the least-cost plan encompassing both supply and demand options to meet the forecasted NB Power in-province electricity requirements over a 25-year horizon. To meet this requirement, viable supply, energy efficiency and demand management options were analyzed extensively and incorporated into the plan with existing supply resources to determine the least-cost integrated (supply and demand) plan. This was done with consideration of environmental regulation and fuel price volatility. The resultant long-term plan was then measured against the vision of sustainable electricity supply, maintaining long-term rate stability and ensuring reliable electricity supply for New Brunswick. The IRP results and recommendations presented in this document are based on various assumptions and forecasts that are subject to change. Flexibility of the least-cost integrated plan is essential and that the mix of options selected in this portfolio remain robust with changes in critical assumptions. This IRP has performed sensitivity analysis to measure the impact of the variation of individual critical parameters as well as the effects of the variation of several parameters occurring at the same time. This provided greater assurance that the long term integrated plan remained the least-cost choice under the changed conditions. 9
13 2.4. Electricity Transformation Since the last IRP in 2014, the global electricity industry has seen unprecedented change. In particular, the distribution electricity system is changing in ways that have remained the same for the last century. As shown in Figure 3, the lexicon within the electricity industry is quite extensive and the electricity systems are becoming more complex but a theme has emerged to help explain the change. Figure 3: NB Power Transformation The primary driver to this change is the ever increasing availability of new customer options. These options will be part of the choices available by customers to satisfy a combined desire to lower their electricity costs and to be more environmentally sustainable all the while ensuring reliable supply. With the ever increasing presence of new technologies and digitalization, NB Power expects that more personalized choices will be available in the marketplace for our customers. NB Power is now thinking of new ways to foster this new ecosystem and so this becomes the starting point of electricity transformation. 10
14 The electricity system built in New Brunswick has essentially remained the same for almost 100 years. The system began to grow for the benefit of all New Brunswick starting in 1920 and today, a solid foundation is in place that includes a reliable and diverse generation supply along with a robust and stable transmission and distribution system. Electricity is sometimes taken for granted and often little thought is given to the source of the power that comes out of an electrical outlet. The electric power system was designed as the ultimate in plug-and-play convenience, seemingly as dependable as the sun rising and setting. But what is not realized is that the electricity system that has been built over the last 100 years traditionally operates by flowing electricity in one direction; from the central generators through the transmission and distribution systems and delivered to homes and businesses throughout New Brunswick. However, as customers begin their journey to personalize their electricity needs, the flow of electricity begins to travel in the opposite direction. This two way flow of electricity can cause the distribution system to become less stable and has reliability implications. So NB Power needs to think about redesigning the electricity system. And while the physical electricity system needs to change, so too does the business model. Today, NB Power s business of producing and delivering electricity relies heavily on the consumption of electricity from customers. As customers personalize their energy needs this can impact electricity sales and therefore revenues. This will impact NB Powers ability to recover costs as well as pay down debt. So NB Power needs to think about redesigning the business model. Consideration of this transformation is essential in this IRP analysis. The response to the physical and operational changes of the system as well as the business model enhancements begins with ensuring a solid foundation that includes reliability and security of supply as well as the integration of cost effective conservation, energy efficiency and renewable resources. This foundation will include smart grid infrastructure and grid modernization that will allow the development of a shared platform for customers to participate and connect to as they personalize their electricity needs and for NB Power to manage the operation of the system to ensure continued reliability at the lowest cost. What NB Power is embarking on is essentially building the energy pyramid as shown on the following page. The energy pyramid is built from the bottom up. At the base of the pyramid are foundational customer activities that ensure the most efficient electricity usage by providing educational messaging to customers to help them make simple behaviour changes. This is followed by introducing technologies to help customers and utilities to further manage demand. Smart grid or grid modernization technologies are introduced at this stage as well as related products and services that can be offered to customers. Emphasis is made on cost-effective conservation and energy efficiency measures that help to reduce the system requirement. This activity results in fuel savings and defers the need to build new capital intensive generating resources in the future. These activities also help to reduce customer s energy consumption which results in savings on their monthly bills. 11
15 Figure 4: Building the Energy Pyramid Smart grid development, also known as grid modernization is also categorized as an energy efficiency activity because it increases the efficiency of the electricity production and delivery systems through improved utilization and lower transmission and distribution losses. This is why smart grid development is sometimes referred to as intelligent efficiency by the American Council for an Energy-Efficient Economy. The development of smart grid has an added and important benefit because it becomes an enabler for the consideration of increased intermittent renewable resources such as wind and solar, as well as future electricity storage. These comprise of the renewable energy activities at the top of the pyramid and are activities available to both utility and customer. Energy Smart New Brunswick NB Power recognizes that advancements in technology are dramatically changing the way energy gets produced, delivered, and consumed, and we must change as well to provide our customers with the best that energy can offer. NB Power is also responsible for anticipating the energy needs of our province far into the future and is taking the right steps now to provide for sustainable energy for all New Brunswickers. NB Power is therefore implementing Energy Smart NB as a customer focused approach that will see investments made in three key areas and will lay the foundation for important long-term benefits for our customers. 12

16 Figure 5: Energy Smart NB Logo Energy Smart NB is designed to support NB Power s direction with a special emphasis on reducing and shifting demand. Formerly referred to as the Reduce and Shift Demand Program, this initiative was first launched in Energy Smart NB addresses a number of opportunities and challenges that require fundamental changes in the way NB Power operates and provides energy to its customers and includes three interrelated components. 1. Smart Grid: Investing in technologies, processes, and systems to build and operate a smarter, cleaner, more reliable and efficient power grid. 2. Smart Habits: Helping our customers develop habits that save energy and money. 3. Smart Solutions: Offering customers products and services that save time, energy, and money. Energy Smart NB is a direct response to NB Power s mandate, to promote the efficient use of energy and conservation of energy in the Province, by developing programs and initiatives in relation to energy efficiency, energy conservation, demand-side management, as well as integrating renewable energy. Energy Smart NB in its entirety is evaluated in this IRP. Section 8 (Energy Efficiency, Demand Management and Smart Grid) of this report provides an overview of Energy Smart NB. 13
17 3. EXECUTIVE SUMMARY The following results of this IRP provide information regarding the strategic course of action that NB Power should consider to meet future resource needs. The integrated plan shown in Figure 6 indicates: Energy efficiency, demand management and grid modernization through Energy Smart NB is vital to the IRP. This IRP has included an aggressive but cost-effective capacity and energy reduction schedule that assumes a savings of 621 MW and 2.3 TWh by 2041/42. This electricity reduction potential provides a net present value of approximately $1.1 billion to NB Power and to New Brunswick ratepayers over the study period. A significant change is occurring in the electricity industry because of new customer options and personalized choices that will change their electricity consumption. This trend will continue and a new partnership with customers will be developed in the near term. Energy Smart NB will be the catalyst to this new partnership. Through the Government of New Brunswick s Locally Owned Renewable Energy Projects that are Small Scale (LORESS) regulation, 80 MW of cost-effective community energy resources are targeted by In addition, 13 MW of Embedded Generation is also targeted by These programs along with Energy Smart NB will help meet the 40 per cent RPS requirement. GHG levels for the planning period remain below the 2005 historical levels. Millbank and Ste. Rose life extension is the most economic choice for continued peak load requirements in response to their retirement in Mactaquac Generating Station continued operation is reflected through life achievement activities that will extend the life of the facility to The planning period of the 2017 IRP extends to 2041/42, which includes the retirement of the Point Lepreau, Belledune and Coleson Cove generating stations. It is recognized that significant investment will be needed to replace these assets. NB Power will look for opportunities and options to separate and spread this investment over a broader period. NB Power will continue to monitor existing supply technology options and costing as well as emerging technologies to ensure latest information is available for subsequent IRP s and as the need for new supply requirement approaches. 14
18 Figure 6: Integrated expansion plan FY Ending Integrated Plan Scheduled Retirements 2018 Energy Smart NB (621 MW) Embedded Generation (13 MW) 2021 LORESS (80 MW) 2025 Grandview (-95 MW) 2026 Grand Manan (-26 MW) 2027 Bayside (-277 MW) 2031 Millbank / Ste Rose (3 x 99 MW) Millbank / Ste Rose (-496 MW) Mactaquac Life Achievement 2040 Lepreau Replace-in-kind (660 MW) Point Lepreau (-660 MW) Natural Gas Combined Cycle - NGCC (3 x 412 MW) Millbank / Ste Rose (2 x 99 MW) Belledune (-467 MW) Coleson Cove (-972 MW) In summary, the strategic direction recommended over the immediate term is: Continued development of the Locally-owned Renewable Energy Projects that are Small Scale (LORESS) and Embedded Generation programs to meet the RPS; Continuation of the Energy Smart NB plan with increased development in the long-term; and Continuation of technical work with regards to new generation options and business models that might be viable in New Brunswick, especially options from customer owned renewable resources. 15
19 4. OUR SITUATION New Brunswick s in-province electricity requirements, like most regions, combine the needs of residential, commercial, industrial and municipal customers. Like all electric utilities, NB Power s challenge is to match production with customers needs on an instant-by-instant basis as those needs change. However, New Brunswick s in-province load is unique in several ways: High penetration of electric space heating (approximately 63 per cent of residential customers; Nova Scotia, by comparison, has approximately 37 per cent electric space heating). High penetration of total load (historically in excess of 25 per cent) associated with relatively small number of energy-intensive industries (such as pulp and paper, and petroleum sectors). High penetration of electric water heater load (over 90 per cent of residential customers have electric water heaters). As a result, New Brunswick is very dependent on electricity with unique load characteristics that offer both challenges and opportunities. The use of electric heat in New Brunswick is largely responsible for peak load requirements on the coldest day of the year, nearly doubling the daily average peak load requirements during the summer period. Figure 7: New Brunswick load profile showing seasonal and daily variations 16
20 And within any day the load requirements may shift by 400 to 600 megawatts, mainly caused by electric space heating and/or electric water heating requirements. This daily variation is a challenge because it means that a power plant of this size must be available for as little as one hour. This contributes to low generation utilization averaging less than 50 percent which then can have a direct impact on electricity rates. Advances in technology provide opportunities to leverage this unused capacity, and those opportunities become even more compelling when customers become more knowledgeable and proactive energy consumers. This load profile creates a significant opportunity to improve system efficiency for NB Power since more than 50 per cent of the utility s generation is only required for three to four months of the year. Increasing the system load factor will also improve the load factor on the transmission and distribution system with additional potential for deferral of transmission and distribution capital requirements. Traditionally, NB Power has relied on its hydro resources (approximately 900 MW) to accommodate the majority of daily load variation. However, the availability of this hydro resource is sometimes limited because of the limited hydro storage capability. But just as important are the periods of high water flows, when hydro generation is operating at full capacity and therefore cannot be varied without spilling water. With the current capacity of about 300 MW of intermittent renewable wind resources on the New Brunswick system the limited hydro resources have become fully utilized and there are times when other more expensive generation such as oil is required to operate more often. For example, NB Power sometimes runs a 300 MW oil fired unit at Coleson Cove for system flexibility during very low or high river flow periods. To help achieve opportunities to improve system efficiency, NB Power s Energy Smart NB plan will reduce and shift demand that will better manage the varying load profile. Energy Smart NB taken in its entirety is a foundational approach meant to transform the way NB Power designs and operates the system. Energy Smart NB is comprised of demand-side programs that will promote lower consumption through conservation and energy efficiency for customers. In addition, investments into a smart grid program will be made that will modernize the NB Power distribution grid to: provide customers more granularity of their electricity usage accommodate and manage increasing amounts of distributed energy resources on the distribution circuits reduce distribution and transmission line losses improve restoration time and automate actions in the event of faults that disrupt power delivery on the circuits Energy Smart NB in its entirety will be evaluated in this IRP. 17
21 On the supply side, NB Power has a diverse generation mix of hydro, nuclear coal and oil both carbon and non-carbon emitting generation. In addition, NB Power has power purchase agreements with generators that use natural gas as well as power purchase agreements with renewable generation such as wind and biomass. The capacity from the entire supply resource available to NB Power currently stands at about 4000 megawatts. However over the course of the 25-year planning horizon, these supply resources will decline as generators age and retire and power purchase agreements expire. The following chart is useful to help understand how the current demand and supply situation will change over the planning period. Figure 8: Total load requirement 2 versus total available resources This situation establishes the starting point for this IRP analysis. This chart shows the need for new capacity starting in 2027 and increasing requirement over time. The remaining sections of this report will describe in greater detail the aspects of this chart as well as other critical factors used to determine the most appropriate plan that will include building new resources through an integrated approach comprised of both demand and supply options. These options will also consider those available to customers to manage their electricity consumption. 2 NB Power s total electricity requirement includes customer demand plus losses plus reserve capacity. In the event of emergencies, NB Power must provide reserve capacity equivalent to 20 per cent of its firm load or its largest unit (whichever is larger). 18
22 5. EXISTING SYSTEM 5.1. Load Forecast The load forecast for the IRP is based on the NB Power Load Forecast completed in the summer of For forecasting purposes, electrical load is divided into three main groups: residential, general service and industrial. The grouping reflects similarity in end uses of electricity requirements within the group. Also, the customers within each group are to some extent homogenous. As a result, electricity requirements within each group are affected by similar factors. The residential, general service and industrial forecasts are separated into six customer classifications 1. residential 2. general service 3. street lighting 4. industrial distribution 5. industrial transmission 6. wholesale (includes the sales to the preceding classifications by the municipal utilities in the cities of Saint John and Edmundston) The relative proportions of NB Power s energy sales in fiscal year 2016/17 to each of the six customer classifications are shown in Figure 9. Figure 9: NB Power energy sales in 2016/17 General Service 17.8% Residential 39.4% Industrial 33.1% Street Lights 0.3% Wholesale 9.4% 19

23 Residential The residential classification is made up mostly of year-round domestic (household) customers. It also includes some non-domestic customers such as farms and churches, which account for less than 3 per cent of the total residential energy requirements. Also included in the residential classification are seasonal customers that account for approximately 1 per cent of the residential electricity requirements. Figure 10: NB Power representative consulting with customers during a home show Increases in the residential forecast are driven mainly by the addition of new customers and increasing annual household usage, somewhat offset by reductions associated with energy efficiency and price elasticity. General Service Sales to the general service classification include commercial (retail/wholesale, hotel/motel/restaurants, offices, etc.) and institutional customers (hospitals, schools, universities, etc.). As of March 2017, there were approximately 26,000 general service customers served by NB Power, and an additional approximately 5,000 served by the wholesale utilities. Approximately 70 per cent of general service sales are commercial in nature and are therefore considered to be directly related to the level of provincial economic activity. The remaining 30 per cent of general service sales are to the institutional sector, which is indirectly related to the economic activity in the province. 20
24 Industrial New Brunswick's industrial customers consume about 35 per cent of the total in-province electrical energy. Industrial customers are divided into two groups: 1. Industrial transmission customers who are served at transmission voltages of 69 kv and above. There are 39 customers served at the transmission voltages. These customers constitute the majority of industrial sales. 2. Industrial distribution customers who are served at distribution voltages less than 69 kv. NB Power serves approximately 1,700 industrial customers at distribution voltages, while the wholesale utilities serve approximately 70 others. Together, they account for approximately 15 per cent of the total industrial electrical energy requirements. The major industrial distribution groups are wood industries, food and beverage, manufacturing, and other operations. Load Forecast Results The total customer load is the combined total of the electricity sales to the six customer classifications, plus the transmission and distribution losses related to those sales. In addition to the total annual energy, the maximum requirement in a one-hour period is also critical for system planning. The maximum energy requirement in a one-hour period is referred to as peak hour demand. NB Power is a winter-peaking system, driven by a combination of electric space heating and electric water heating in homes and businesses, with the peak demand normally occurring in January or February. Using forecasts for each customer sector, the data is combined to establish the total inprovince load forecast for the period 2017/18 to 2026/27. Beyond 2026/27, the forecast is escalated by class, using a technique that utilizes time-series regression models to project load growth. The forecast includes estimates of energy-efficiency measures that consumers are anticipated to naturally implement. Estimates of energy efficiency and demand reduction programs as part of the Energy Smart NB plan to reduce and shift demand have been removed from the forecast for the purpose of this IRP. This is done to establish the baseline by which the value of this strategy can be measured. The options that make up the overall program to reduce and shift demand will be evaluated and considered as part of the IRP process. The resulting forecast is shown in Figure
25 Figure 11: Total in-province load forecast excluding demand reduction programs 4,000 40,000 PEAK DEMAND Peak Hour Demand Forecast (MW) 3,000 2,000 1,000 Avg. annual growth = 0.5%/yr ANNUAL ENERGY Avg. annual growth = 0.7%/yr 30,000 20,000 10,000 Annual Energy Requirements (GWh) 0 0 Fiscal Year Ending March 31st Note that the loss of load in New Brunswick since its peak in 2004, particularly in the forest products manufacturing industry, leaves the current in-province load at the same level that the utility served in The average growth rate for peak demand is 0.5 per cent per year while the average growth rate for energy is 0.7 per cent per year. These growth rates are before the impact of the Energy Smart NB plan. 22

26 5.2. Generation Resources NB Power has a diverse portfolio of generation resources and power purchase agreements from a blend of hydro, nuclear, coal, natural gas, oil-fired thermal and combustion turbines, biomass and wind, as shown in the system map below. Figure 12: System map At this time, no new generation has been committed for construction with the exception of power purchase agreements associated with 13 MW of embedded generation projects and 80 MW of community energy projects, both of which are targeted for completion by The latter is part of a government program to promote locally owned renewable energy projects that are small scale. These programs in combination will help NB Power achieve its regulatory target to have 40 per cent of in-province electricity sales met by renewable energy by
27 Since the last IRP, NB Power has assessed options and a decision was made on the preferred option for future of the Mactaquac Generating Station. NB Power is proposing a project to ensure the station can operate to its intended 100-year lifespan with a modified approach to maintenance, and adjusting and replacing equipment over time. NB Power will seek the necessary environmental approvals from the province and follow application and review processes for financial approvals as defined by the Energy and Utilities Board. The current generation capacity and PPA portfolio, as well as other statistics of the NB Power system, is shown in Figure 13. Figure 13: Existing NB Power Net Generating Capacity 3,4 and other statistics 5 Generating Capacity Thermal Power Purchase Agreements (PPAs) Coleson Cove 972 MW Kent Hills (Wind) 150 MW Belledune 467 MW Caribou Mountain (Wind) 99 MW Total Thermal 1,439 MW Lameque (Wind) 45 MW Bayside (Natural Gas) 277 MW Generating Capacity Hydro Grandview (Natural Gas) 95 MW Mactaquac 668 MW Twin Rivers (Biomass) 39 MW Beechwood 112 MW St. George (Hydro) 15 MW Grand Falls 66 MW Edmunston Hydro 9 MW Tobique 20 MW Other Renewable 6 MW Nepisiguit Falls 11 MW Total Power Purchase Agreements 735 MW Sisson 9 MW Milltown 3 MW Number of Lines Total Hydro 889 MW Distribution Lines 21,121 km Transmission Lines 6,865 km Generating Capacity Nuclear Point Lepreau 660 MW Exporting and Importing Capacity Export Capacity 2,385 MW Generating Capacity Combustion Turbines Import Capacity 2,248 MW Millbank 397 MW Ste. Rose 99 MW Number of Customers Grand Manan 29 MW Direct Customers Total Combustion Turbines 525 MW Indirect Customers Total Customers Total Generating Capacity Thermal 1,439 MW Hydro 889 MW Nuclear 660 MW Combustion Turbines 525 MW Total Generating Capacity 3,513 MW 355,918 45, , MW from the Point Lepreau Generating Station is committed to Maritime Electric Company Limited (MECL) in PEI for the life of the unit. Total capability is 660 MW, which leaves 630 MW for in-province needs. 4 The contribution to capacity for wind generation is calculated as 21 per cent of the installed capacity (i.e., 294 MW installed wind capacity * 0.21 = 61.7 MW). This is due to the intermittency of this resource. 5 NB Power Annual Report: 24
28 This diverse mix of generation capability is expected to meet the electricity requirements of New Brunswick well into the future. In addition, NB Power is interconnected with neighbouring utilities for the purpose of importing and exporting electricity, and for increased system reliability. NB Power s electricity exports have contributed to lower rates for New Brunswick customers. The potential for interconnection imports have allowed NB Power to reduce costs by displacing higher-cost generation that would have been required to meet in-province electricity requirements. At times surplus electricity can also be sold that allows increased revenues and the associated profit margins are then used to ensure rate stability. Each PPA commitment has a term as defined in the applicable contract. Generally, these are fixed dates. The end-of-life dates for NB Power-owned generating stations are less certain. For accounting purposes, they have a life assigned that is based on typical experience for that type of facility. In actual practice, retirements are dependent on an economic evaluation for each unit as it approaches the end of its useful life. For purposes of this IRP, retirement schedules are initially based on the corresponding accounting life, with consideration of a reasonable extension period that could allow the facility to continue to operate without significant capital expenditure. Consideration of life extension potential was made through studies conducted by NB Power plant engineering experts and through economic analysis. The generating stations and PPA s with an end of life occurring within the study period horizon of the IRP are included in the table below. Figure 14: Retirement schedule Resource Fuel type Capacity (MW) End of life date Grandview PPA Natural gas /25 Grand Manan Diesel /26 Bayside PPA Natural Gas /27 Millbank Diesel /31 Ste. Rose Diesel /31 Point Lepreau Uranium /40 Belledune Coal /41 Coleson Cove Oil /41 Further detail is provided in Appendix 2 List of Assumptions for IRP 25
29 5.3. Transmission and Interconnections The NB Power transmission system is part of the power system infrastructure that lies between the sources of power supply and the substation load centres. The NB Power transmission system has been strategically designed to provide reliable electricity to in-province customers while also providing opportunities to buy and sell electricity with neighbouring jurisdictions. The NB Power transmission system includes all of the 345 kv, 230 kv, 138 kv and 69 kv transmission lines (6,865 kilometres in total), termination equipment and control equipment to permit the necessary operation of the interconnected transmission network. This system provides the means for delivery of electricity to meet forecast demand requirements under normal operating conditions. New transmission requirements are driven by a number of potential factors that can include: the need to connect new generation, to meet in-province load growth, maintaining or increasing imports and exports, improvements in system reliability and meeting industry Reliability Standards. The existing transmission system has evolved over the past century. It began mainly as 69 kv lines connecting small generating stations in municipal distribution systems in the first half of the 20 th century. Following the Second World War, and to keep up with the load growth through the 1960s, the 138 kv system was expanded to form a figure-eight network around the province and to interconnect with Nova Scotia for the first time. Expansion continued in the early 1970s with the completion of a 230 kv system connecting from the northeast (Dalhousie Bathurst Newcastle) area to Keswick in the west, and across the province to Salisbury in the southeast. The maximum system voltage increased to 345 kv with the completion of the New England interconnection and the Coleson Cove Generating Station in the late 1970s. Through the 1980s and 1990s, the 345 kv system expanded to encircle the province and extend into Nova Scotia. 26

30 Figure 15: NB Power 345 kv transmission tower NB Power continuously assesses the transmission system to ensure it meets all reliability standards and provides benefits to New Brunswickers. Sufficient transmission capacity is available for in-province load levels and for exports, assuming necessary generation is available in critical areas and during certain times of the year, and that special protection systems are in place in the event of loss of transmission and/or generation equipment. The transmission system was designed to deliver the existing generation economically to all inprovince customers, and to export surplus supply to neighbouring utilities. The ability to import electricity from Quebec, New England, and at times from Nova Scotia, has also been very important to NB Power s ability to lower its costs for the delivery of electricity to its customers. The next 20 years and beyond could see changes to the generation supply types and locations both within and outside New Brunswick. These potential changes in generation supply may require new transmission infrastructure to reliably and economically interconnect them with the NB Power system. The NB Power transmission system is a small part of a much larger bulk transmission system in the Eastern Interconnection (see Figure 16). NB Power belongs to the Northeast Power 27

31 Coordinating Council Inc. (NPCC). The NPCC mission is to promote and enhance the reliable and efficient operation of the international interconnected bulk power system. The geographic area covered by NPCC includes New York, the six New England states, Ontario, Québec and the Maritime provinces. Figure 16: North American regional reliability councils and interconnections Interconnected transmission lines can be used to transfer electricity from one jurisdiction to another under contractual arrangements, or on a spot market basis and during emergencies. NB Power has always placed major emphasis on developing strong interconnections with neighbouring systems for both economic and reliability reasons. Out-of-province electricity purchases and/or sales are made under short-term (daily and weekly) contracts or on a spot basis. Actual interconnection capabilities with neighbouring jurisdictions are dependent on system conditions in New Brunswick and other regions at the time of transfer. In the past, the interconnection with New England has enabled NB Power to construct larger, more economical generating units to allow for the purchase and sale of surplus electricity on both a short and long-term basis. NB is also interconnected with Quebec, 28

32 Nova Scotia and Prince Edward Island (PEI). The interconnections support the system with direct and indirect contributions to capacity reserves, thus reducing the requirement for additional capacity to serve in-province customers. The following chart shows the capabilities of NB Power s major interconnections. Figure 17: NB Power s winter total transmission import/export capabilities (MW) Depending on the in-province load and/or the generation dispatch, as well as the condition of the in-province transmission system, these limits cannot always be achieved. The limits can also vary depending on conditions within the interconnected jurisdiction. Transfer Capability between New Brunswick and Nova Scotia/PEI The New Brunswick to Nova Scotia and PEI transfer capabilities are a function of the transmission system s transfer capability into the southeastern region of New Brunswick, minus the southeastern region load (mainly Moncton, Dieppe, Riverview and surrounding areas). As the New Brunswick southeastern region load increases, the net electricity transfer capability available to PEI and Nova Scotia is reduced. Transfer Capability between New Brunswick and Quebec The NB Power to Hydro Quebec (HQ) transfer capability is the sum of the two high voltage direct current (HVDC) stations, one at Eel River (owned and operated by NB Power) and the second at Madawaska (owned and operated by HQ). The Eel River HVDC Station, shown in Figure 18, has an import/export capability of 350 MW. The total import/export transfer capabilities with HQ are as follows. 29

33 For import from HQ: Eel River HVDC Madawaska HVDC Radial ties at Eel River and Madawaska 6 For export to HQ: Eel River HVDC Madawaska HVDC 350 MW 420 MW 230 MW 350 MW 420 MW Figure 18: NB Power s Eel River HVDC Station Additional HVDC interconnections with HQ are a possibility in the future and will be considered with other regional transmission expansion and refurbishment options. The Eel River HVDC station underwent a life extension project in 2014 in order to maintain its 350 MW transfer capability. The Madawaska HVDC station underwent a life extension in Radial ties with HQ are interconnections that can serve a portion of New Brunswick load in isolation of the main NB Power grid. 30
34 Transfer Capability between New Brunswick and New England/Northern Maine The maximum transfer capability from New Brunswick to New England is 1,000 MW. This is the maximum reliable transfer capability assuming all transmission facilities in Maine and New Brunswick are in service. In December 2007, a second 345 kv interconnection was put into service. This development strengthened the New England New Brunswick interface since the additional interconnection increased transfer from 700 to 1,000 MW, and improved the reliability and reduced the likelihood of separation of the Maritimes from the interconnected New England power system. In addition to the major interconnections into New England, NB Power can serve isolated loads located in Northern Maine. These interconnections are smaller and serve loads in Northern Maine (approximately 125 MW) and Eastern Maine (approximately 15 MW). New Brunswick Transmission Requirements Although the current transmission system in New Brunswick is sufficient to reliably transfer electricity of the existing generation, potential upgrades may be necessary in the future, especially in the southeast of the province as load in the Moncton area grows. Also, the addition of more wind generation in New Brunswick will likely require new transmission to be built. The wind farms currently in service in New Brunswick required minimal transmission infrastructure due to their close proximity to existing terminals and transmission lines. If wind and other intermittent generation are added to the system, the integration of these resources can become more complex due to the balancing of generation, voltage and other power quality issues. NB Power continues to investigate solutions to future transmission constraints. Obvious solutions include both adding additional transmission as well as strategically locating generation closer to the load requirement such as distributed generation. Another solution exists that could preserve and extend the existing transmission system. This solution includes targeted demand reduction through smart grid technology. This, in conjunction with conservation and energy efficiency initiatives will reduce and shift demand and are intended not only to defer the need for new generation in the future, but also to potentially defer or reduce the need for new transmission infrastructure. More information related to reducing and shifting demand is provided in the sections that follow. The final solution to transmission constraints will be evaluated in a separate study. The results of this IRP will be used to establish the baseline of this study. 31
35 5.4. Load and Resource Balance Like other plants in North America, NB Power s fossil generating stations have normal life spans of approximately 45 years. This provides utility planners with a guide for making decisions on the timing and introduction of possible new generation. The final decision on whether a station will be refurbished or replaced cannot be made definitive until near the scheduled retirement of that station. Conditions (specific to both generation plant and external) will change over time, and this will require reassessment and adjustment of the plan. Assuming the future continuation of both the obligation as a regulated utility to provide reliable service to its customer base, as well as other known conditions such as environmental regulations and renewable standards, NB Power can provide a snapshot of the electricity requirement and assess what options may be available to meet that requirement. The chart shown in Figure 19 provides a snapshot of the electricity need for NB Power, assuming the generation resources are as described in Section 5.2 (Generation Resources) and depicted by the grey bars in the chart. This is then compared to the current load requirement and growth, including reserve requirements 7 as depicted by the orange line. Figure 19: Total load requirements and generation resources FY In the event of emergencies, NB Power must provide reserve capacity equivalent to 20 per cent of its firm load or its largest unit (whichever is larger). 32
36 In this load and resource assessment, energy efficiency and demand-side management estimates associated with NB Power s Energy Smart NB strategy have been removed from the load forecast. These estimates have been assumed in the official load forecast with the exception of naturally occurring demand-side management. The load and resource assessment provides the basis for the IRP assessment in which new cost-effective energy efficiency and demand-side management options will be considered. It provides the starting point for consideration of new generation supply as well as reaffirms the value of integrating demand management programs associated with NB Power s Energy Smart NB plan. From this assessment, the need for capacity will outstrip the resources starting in the 2027 time frame. NB Power s major generating stations at Point Lepreau, Belledune and Coleson Cove will reach the end of their lives and be scheduled for retirement towards the end of the period. When this occurs, NB Power s existing fossil fleet including generators from power purchase agreements (PPA s), representing a total of approximately 3,000 MW of capacity or about twothirds of NB Power s overall capacity, will be retired. The resources that remain in the very longterm will be hydro generating stations, which on average have 100-year life spans. It has been assumed in this IRP that all of the hydro assets will be replaced by an equivalent quantity of capacity and renewable energy, with the first replacement being the Mactaquac hydro station. The Mactaquac Generating Station is a run of the river hydro facility with an installed generation capacity of 660 MW. The facility began generating electricity in Since the 1980s, concrete portions of the hydro station have been affected by a chemical reaction called alkali-aggregate reaction. This reaction causes the concrete to swell and crack and has required substantial annual maintenance and repairs. NB Power is proposing a project to ensure the station can operate to its intended 100-year lifespan with a modified approach to maintenance, and adjusting and replacing equipment over time. It is expected that no more than one unit, approximately 112 MW will be unavailable at any one time during the replacement period. At the end of the replacement period, expected in 2033, all units will be fully available. This life achievement recommendation follows three years of expert research, including input from science, engineers, the public and First Nations. This approach will meet all safety and environmental requirements. It will allow NB Power to take into account changes in cost, technology and electricity demand while ensuring compliance with the Renewable Portfolio Standard of 40 per cent in the long term. The RPS requirement of 40 per cent translates to 75 per cent non-emitting when consideration is made for Point Lepreau production. To ensure long term compliance of this non-emitting target, it has been assumed that Point Lepreau would be replaced in kind after its retirement date. This will also provide long term base load capacity to ensure reliable supply to meet long term in-province load requirement as well as transmission support for continued security of supply in the southern region. NB Power recognizes that other options may be revealed over the next 25 years that could meet reliable base load requirements and non-emitting targets expected in the long term. As the IRP is refreshed, these available options will be considered and evaluated. 33
37 While the load and resource assessment shows a shortfall beginning in 2027, it also identifies a surplus of capacity during the transition period from 2018 to At its peak, the surplus reaches about 500 MW in 2021 and slowly reduces as load grows on the system. During this transition period from 2018 to 2026, the contribution of assets to the system will need to be evaluated and opportunities examined to find markets for the surplus generation other than in-province load. The generating plant that appears to present the greatest opportunity for obtaining savings during the transition period is the Coleson Cove Generating Station, which currently runs on heavy fuel oil. While this facility is designed as a baseload station, its forecast hours of operation are extremely limited. Its limited operation is a result of a fuel oil cost that makes this plant uncompetitive with other fuels, including purchases in the long term. The Coleson Cove Generating Station has a net output capacity of 972 MW, supplied by three equally sized generators. The plant was refurbished in Subsequent to that, Unit #3 was modified to cofire petroleum coke with heavy fuel oil at up to 20 metric tons per hour. At light loads, this represents in excess of 50 per cent of the fuel requirement for that unit. When Coleson Cove is called upon to supply electricity, it will typically be Unit #3 that is dispatched. Because of Coleson Cove s size and the need for this capacity in the winter months, this facility is an important asset to meeting in-province needs. The opportunity exists to convert two units to natural gas. Factors that will influence the final decision are the capital costs of the conversion, the projected capacity factor, natural gas infrastructure costs, the need to contract for firm natural gas supply and pricing for natural gas in the long term. NB Power continues to evaluate this opportunity. This IRP study has assumed Coleson Cove continues to operate on heavy fuel oil for the life of the facility. Because of the anticipated low operating hours, the condition of the facility will be such that it becomes a very good candidate for life extension at reasonable cost. This study, therefore, has also assumed that this facility is made available for an additional 10 years beyond its normal operating life, with the appropriate costs included for life extension. The Belledune Generating Station is the only coal-fired facility on the NB Power system. This facility operates at a high capacity factor because of its low cost fuel. The operation of this facility and its greenhouse gas (GHG) emission intensity are now regulated under the Canadian Environmental Protection Act. 8 This regulation sets a stringent performance standard for new coal-fired electricity generation units and those that have reached the end of their useful life, which is defined as 50 years in the regulation. In this study, Belledune is assumed to be retired in If GHG regulations change, these will be included in the next IRP. As mentioned, no new generation is required in the transition period 2014 to However, within the transition period, projects considered will include the addition of generation to meet the RPS. To date, wind generation has been the choice to meet this requirement. NB Power has
38 recently issued requests under government s Locally-Owned Renewable Energy Small Scale (LORESS) Program. This program will see an additional 80 MW of renewable energy installed by In addition, NB Power will also add approximately 13 MW under its embedded generation policy by Going forward, biomass opportunities, small hydro or photovoltaic may be developed. Section 6.1 (Traditional Utility Supply Options) and Appendix 4 (Supply Options) outlines two projects, Grand Falls and High Narrows, which may prove to be economic options during the transition period that will have an impact well beyond the transition period. The development of cost-effective renewable, locally owned community energy projects may contain a combination of renewable options that can also help meet the RPS requirement. Customers will also have new options in the future such as solar and batteries to help manage their electricity needs. These personal choices are available today and are expected to be part of the New Brunswick electricity system in the future Environmental and Sustainability Considerations NB Power has diversity of supply within its existing fleet of generating assets. This diversity minimizes risks attributed to changing regulations, and helps with security of supply and sustainability for the long term. Sustainable electricity, as defined by the Canadian Electricity Association, has three basic pillars: environment, social and economic. As set out in its corporate vision of Sustainable Electricity, NB Power is moving towards a more sustainable source of energy supply for the future, one that focuses on these three pillars. Each of the three pillars of sustainable energy includes specific principles. 1. Environment a. Environmental Impact b. Stewardship and Biodiversity c. Climate Change 2. Social a. First Nations Relations b. Communication and Engagement c. Health and Safety d. Workplace 3. Economic a. Economic Value b. Energy Efficiency c. Security of Supply 35
39 Sustainability Pillar - Environment There are several environmental considerations for NB Power s existing system that have to be factored into the IRP in the environmental pillar of sustainability. Aside from reducing the environmental impact of any new project and adopting a philosophy of strong stewardship and biodiversity, NB Power must also take into account pending changes to environmental regulation. These include: further GHG regulations (Carbon Dioxide CO2) beyond existing coal regulations, air pollutant regulations (Sulphur Dioxide SO 2, Nitrogen Oxide NO x, Total Particulate Matter TPM and Mercury Hg), possible changes to the Fisheries Act, and possible changes to the Species At Risk Act (SARA) Further GHG Regulations In addition to the current coal regulations, further GHG regulations could be applied to other fuels such as oil and natural gas. This could have an impact on current thermal (GHG emitting) assets including the Coleson Cove Generating Station, as well as on natural gas-fuelled power purchase agreements. On December 12, 2015, Canada inscribed in the Paris Accord its 2030 target of 30 per cent reduction in greenhouse gases from 2005 levels. To estimate the impact of GHG regulations on future plans of this IRP, NB Power has included a sensitivity that would contain some form of carbon pricing through either a carbon trading scheme or through carbon taxes that would then be used to capture the potential impact on the environment. Included in this sensitivity would be an assumption of the potential cost on the environment from the full carbon cycle of extraction and delivery of various fuels, to the utilization of these fuels to produce electricity. Also included was sensitivity of early coal shut down by The impact on GHG emissions and the associated costs of these sensitivities can be found in section 10.4 (Sensitivity Analysis) of this report. The Government of New Brunswick is working with NB Power and the federal government to develop a made-in-new Brunswick GHG management strategy and to explore all options to minimize the cost to New Brunswickers. Carbon Prices Within the sensitivity analysis for potential GHG regulation, carbon prices applied were consistent with the Pan-Canadian Framework on Clean Growth and Climate Change 9 approach to pricing carbon pollution. This approach specifies the price on carbon pollution for jurisdictions with an explicit price-based system, the carbon price should start at a minimum of $10 per tonne in 2018 and rise by $10 per year to $50 per tonne in
40 Pending Air Pollutant Regulations The two major thermal plants in NB Power s fleet, the Belledune and Coleson Cove generating stations, are equipped with environmental control equipment. Since the equipment was installed, starting in the early 1990s, emissions of SO 2, NO x and Total Particulate Matter (TPM) have been significantly reduced. The releases of SO 2, NO x and TPM are relatively low when compared to similar plants in other jurisdictions. New regulations could have an impact on NB Power s thermal assets and some further reductions may be required. NB Power is actively participating in this process with Environment Canada. The Fisheries Act and the Species at Risk Act (SARA) The purpose of Canada's Species at Risk Act (SARA) is to conserve, protect and recover endangered or threatened species, and to encourage the management of species of special concern to prevent them from becoming further at risk. The Act aims to prevent indigenous species from extirpation or extinction and preserve biodiversity within Canada. Consideration of the Fisheries Act and SARA are made in current and future thermal generating stations needing further cooling water as an operational requirement to avoid fish kill. Any changes to the Fisheries Act could have an impact on current and future hydro facilities with respect to fish passage. NB Power is proposing a project at Mactaquac to ensure the station can operate to its intended 100-year lifespan with a modified approach to maintenance, adjusting and replacing equipment over time. NB Power will continue to work with the Canadian Rivers Institute (CRI) and Fisheries and Oceans Canada to achieve targeted fish passage goals on the Saint John River as informed by science, ongoing studies, input from First Nations and stakeholders and future regulatory decisions. The proposed project at Mactaquac will allow for the addition of multi-species fish passage to the existing facilities, using improved technology and taking advantage of an improved understanding of fish behavior resulting from ongoing research by CRI. Environmental flow studies being undertaken by the CRI may lead to enhanced flow regimes. Funding has been allocated in the project budget of up to approximately $100 million to ensure installation of adequate multi-species fish passage. Under this option, environmental and social impacts during operations would be consistent with status quo, with potential for improvements Sustainability Pillar - Social There are four principles in the social pillar of sustainability, related to First Nations relations, communication and engagement, health and safety, and workplace. 37

41 Figure 20: Elder George Paul and NB Power employees participate in a cultural awareness and sensitivity workshop NB Power has recognized the need for renewed focus in First Nations relations, and communications and engagement with customers. These areas have been targeted for improvement as NB Power strives to become top quartile. NB Power recognizes the distinct interests, culture and significance of First Nations and work to build relationships with First Nations communities throughout New Brunswick. NB Power is committed to fostering positive and productive relationships, including the organizations, agencies and government departments that work with and represent First Nation individuals and communities. NB Power is committed to being one of the select utilities in North America, especially in safety. In November 2013, executive members of NB Power and IBEW Local 37 committed to the reestablishment of NB Power as one of the safest utilities in North America. By signing a renewed commitment, NB Power and the IBEW Local 37 will work together to keep safety as a top priority. NB Power has been recognized for workplace achievements and for its health and safety culture. This safety commitment also includes promoting electrical safety in the community and through public safety campaigns with radio, TV and newspaper ads as well as school education campaigns. NB Power also hosts contractor safety days for all contractors in the province. Safety champions also meet at least annually with first responder groups within fire departments and police groups to teach and inform them about downed or damaged electrical line safety. 38
42 Sustainability Pillar - Economic There are three principles in the economic pillar of sustainability economic value; energy efficiency; and security of supply. Important principles to NB Power are providing for economic value, energy efficiency and security of supply. Electricity rates in New Brunswick have been identified as some of the lowest in the region (lower than Central Maine Power, Public Service New Hampshire, Maritime Electric in PEI, and Hydro One in Ontario). Only Hydro Quebec and Newfoundland Power have lower residential rates. Figure 21 Residential electricity rates in the region Residential Rate 1,350 kwh/month As of Apr (exc. tax) $1 CAD = $0.75 USD /kwh (CAD) NH ME NS PE ON NB NL QC NB Power boasts a diverse energy supply that includes hydro, wind, nuclear, biomass and fossil fuel-based generation. This diversity minimizes the risk exposure of any one type of generating resource. This characteristic increases the security of supply for NB Power customers. Also important to security of supply is ensuring sufficient transmission and the distribution capacity for the reliable and efficient transfer of electricity. NB Power continues to enhance and 10 The foreign exchange rate indicated in this chart was current at the time of the publication of the chart, and may not be consistent with the exchange rates used in this study. 39
43 maintain the delivery infrastructure and has entered into a multi-year partnership with Siemens to modernize the grid. In the past, NB Power has achieved varying degrees of success in the area of energy efficiency and demand management. NB Power now has a renewed focus on efficiency and demand management through its Energy Smart NB strategy. This strategy involves demand reduction through energy efficiency programs, and demand shifting through the installation of smart grid infrastructure. Further detail on Energy Smart NB can be found in Section 8 (Energy Efficiency, Demand Management and Smart Grid) Renewable Portfolio Standard NB Power has one of the most diversified generation fleet of facilities in North America. Decisions to develop hydro and biomass resources, made decades ago, and the more recent development of wind resources, have enabled New Brunswick to become a North American leader in diverse renewable energy generation. NB Power currently supplies about 36 per cent of its in-province electricity requirements from renewable sources such as wind, biomass and hydro resources. The Government of New Brunswick has committed to increasing the development of further renewable energy by the Renewable Portfolio Standard (RPS). This standard is part of the Electricity Act that will require NB Power to ensure that by 2020, 40 per cent of its in-province electricity sales are provided from renewable energy. Renewable energy imports will also be eligible to meet the new Renewable Portfolio Standard. This will allow NB Power increased flexibility to meet its obligations under this new standard at the lowest possible cost, which will ensure alignment with its overarching strategy of reducing debt. Since the goal of the RPS is to reduce the use of fossil fuel generation, that objective can be met by reducing energy usage or by building renewable generation. In most cases, energy efficiency is a less expensive option than building new renewable generation. As a result, NB Power will be aggressively pursuing demand management programs to assist in meeting the RPS target. In the interest of continuing to improve New Brunswick s environmental performance, energy efficiency is an essential element. By shifting and reducing electricity demand through Energy Smart NB, NB Power will be able to reduce the need for generation from fossil-fuelled plants, thereby increasing the proportion of renewable energy on its system. Innovative programs that result in significant energy reduction will enable NB Power to achieve the 40 per cent RPS in the most cost-effective and efficient manner. Also helping to achieve the RPS goal of 40 per cent by 2020, additional renewable resources have been built into the IRP. NB Power has assumed that development of energy resources from local small-scale projects would occur as part of government s Locally-Owned Renewable Energy Small Scale (LORESS) program. Request for Expressions of Interests have been released 40
44 by NB Power that will see the development of incremental renewable capacity installed by This IRP has assumed a phased-in approach to the LORESS program so that by 2020, 80 MW of incremental renewable capacity will be added to the system. In addition to this, NB Power will also add another 13 MW of Embedded Generation. These programs will target the installation of renewable energy projects on the distribution system. To manage the integration of this development with the system, NB Power will focus on projects that provide dispatch flexibility and that can integrate with NB Power s smart grid initiative which is part of Energy Smart NB. This approach is explained in greater detail in Section 8 (Energy Efficiency, Demand Management and Smart Grid). Although not part of the renewable portfolio standard, non-emitting resources such as the Point Lepreau Nuclear Generating Station contribute significantly to reducing the use of fossil fuels. The Point Lepreau Generating Station, which returned to operation post-refurbishment in 2012, provides another 35 per cent of the provincial electricity requirements from non-emitting nuclear energy. Therefore, by 2020, it is expected that 75 per cent of New Brunswick s electricity requirements will be met by non-emitting or renewable sources. The balance of requirements will come from a mix of renewable and non-renewable resources in order to maintain a reasonable level of generation diversity. These resource options can be found in Section 6 (Supply Options). The key objectives served by the RPS are: Low and Stable Energy Prices Integrating additional renewable energy will help protect from the cost volatility of electricity generated from fossil fuels; Energy Security Developing additional indigenous renewable energy will lessen NB Power s dependence on imported fossil fuels; and Environmental Responsibility Additional renewable energy will reduce NB Power s greenhouse gas and associated emissions by reducing fossil fuel electricity generation. 41
45 5.7. Fuel Price Forecast It has been mentioned that NB Power has one of the most diverse power systems in North America. This means that there is a direct dependence on various sources of fuel including coal, oil and nuclear, and an indirect dependence on natural gas and biomass through power purchase agreements. NB Power purchases coal, #6 heavy fuel oil, #2 light fuel oil and nuclear fuel. It also has exposure through PPAs, to natural gas and to wholesale market prices for electricity purchases. NB Power s fuel and purchased power costs to serve in-province electricity requirements have averaged between about $500 to $600 million per year over the last 10 years. Hydrocarbon fuel prices have had a history of volatility and uncertainty. The graph shown in Figure 22 provides an indication of how fuel prices have varied since January By having a diverse fuel mix, NB Power mitigates the risk with much of these price variations. Figure 22: Fuel price indices history US$/MMBtu Brent Crude Oil Natural Gas - Maine CAPP Coal The indices are for trading hubs for the commodity indicated. There are many trading hubs for the various commodities, for example Brent Crude Oil an index that reflects world oil prices Natural Gas delivered in Maine CAPP Coal - thermal coal, from Central Appalachian region of the U.S. The natural gas prices in Maine are indicative of the price that NB Power pays for natural gas fuel, but are not exact in that they do not account for added transportation costs of getting the 42
46 fuel to the burner. Also note that the prices shown in the previous graph are for an average index price over the applicable month. Daily prices are more volatile than monthly prices. Fuel and purchased power prices have continually increased over the past several years with the increasing fuel and purchase power costs and increasing volumes of electricity sales. As shown in Figure 23, the average fuel and purchased power price has trended upwards over the past 10 years with an average annual growth of about 2 per cent per year. Note that the calculation excludes hydro generation to remove the impact of widely varying annual production. Figure 23: Historical average fuel and purchased power price C$/MWh Fiscal Year Ending March 31 The higher prices seen in the initial part of the period was related to the combination of fuel price variation and changes in the in-province electricity requirement. It was during the period 2008 to 2010 where in-province electricity requirement was negatively influenced because of a significant decrease in industrial load. The in-province electricity requirement then began to stabilize and increase slightly after Fuel prices also varied during this period as was shown in Figure 23. Looking forward, the primary source of information for the long-term fuel and market price forecasts used in this IRP study was based on forecasts obtained from Energy Ventures Analysis Inc., an external consultant specializing in this area. Energy Ventures Associates is a leading source for the price assessments of commodity markets and fuel prices used in this IRP. The first three years of the fuel price forecast used in this IRP was based on the most recent available NB Power budget. The budget forecast was based on the applicable forward prices at time of budget preparation. For the years beyond the available budget numbers, forecasts were obtained from Energy Ventures Associates. The resulting forecast is in US dollars of the applicable year (nominal dollars). The US dollar values were then converted to Canadian dollars 43
47 utilizing a forecasted exchange rate. The resulting fuel price forecast is shown in Figure 24 with the corresponding data provided in Appendix 3 (Fuel and Market Price Forecast). Figure 24: Fuel price forecast The market prices shown in the chart are Massachusetts Hub (Mass Hub) prices and are highly correlated to natural gas prices. The Mass Hub price index sets the base market price of electricity that NB Power buys and sells against. As mentioned, natural gas pricing is indicative of prices for natural gas delivery in Maine plus added costs for delivery to power plants. The source of gas could come from the remaining Sable off-shore reserves or from Marcellus shale gas region located mainly in Pennsylvania. Natural gas could also be sourced from western Canada. The availability and pricing of these sources rely on the sufficient availability of pipeline capacity in the future. Other sources in the future could come from LNG where transportation could be through a combination of ships, pipeline as well as trucking. Regardless of the source, it was assumed that delivered long term prices would be competitive. The decision to source specific gas relates more to security of long term supply and ensuring reliable delivery that is most cost effective. NB Power continues to investigate these alternative sources and transportation options. In addition to the above base fuel prices forecast, this IRP provided upper and lower bound price scenarios. This allowed for an analysis for possible future fuel prices that differ significantly from those assumed in the reference case. As a synthesis of the scenarios in this IRP, low fuel price and high fuel price cases were applied. The effect of these sensitivities is analysed in detail in Section 10.4 (Sensitivity Analysis). 44
48 5.8. Long-Term Financial and Economic Parameters General Introduction An estimate or projection of the values of certain financial parameters is required to determine the levelized cost of electricity (LCOE) of each of the potential generation options. LCOE is the net present value of the total cost stream of a given generation option over its economic life to generate 1 kwh of electricity, including the cost of capital, fuel, operation, maintenance and administration, external environmental costs as applicable, and income taxes payable. LCOE is used to evaluate and compare the relative economics of each of the potential generation options. Section 7 (Results of Supply Analysis) provides the results of the LCOE analysis. The financial parameters considered in this IRP include: the consumer price index the electric utility construction price index the foreign exchange rate, and the weighted average cost of capital (WACC) These financial parameters are also used in other analyses or applications, including those related to demand-side and energy efficiency management, Strategist modelling, 11 rate impacts and generally in other present value (PV) analyses. This section summarizes and documents how these estimates or projections were arrived at The Consumer Price Index The consumer price index, which is used to adjust operation, maintenance and administration costs in future years, is projected to increase by two per cent per year. The projection was informed by the most recent Bank of Canada Monetary Policy Report 12 that was published in January It was also informed by a review of the yield spread between Canada Long Bonds versus Canada Real Return Bonds. 11 Strategist (formally called PROSCREEN II) is a proprietary computer software program developed by Ventyx, an ABB company and is widely used by electric utilities for IRP purposes. The New Brunswick EUB has reviewed and approved the use of the PROSCREEN II model, the predecessor to the Strategist model, for system planning purposes
49 The Construction Price Index The electric utility construction price index has escalated on average between 3.2 and 3.6 per cent per year, depending on the type of development project. This history is taken the most recent information from Handy Whitman publication of Public Utility Construction Costs 13 and shown in Figure 25. Two historical construction price indices are shown, based on activities that include thermal generation projects and hydro projects. Figure 25: Historical Construction Price Index This chart shows that historical annual increases for plant construction costs have varied from a low of 1 percent to a high of 8 percent in any given year. As mentioned, the long term growth is very dependent upon whether consideration is made that includes thermal generation construction, which had higher cost increases over the last 20 years than hydro generation costs. This IRP has assumed a growth in construction prices consistent with this historical perspective. Distinct growth assumption was also applied consistent with historical trends for thermal generators as well as hydro generators. In arriving at these projections, it was assumed that the global requirement for electricity infrastructure investment would accelerate as capital stock turnover continues with ageing infrastructure during the 2017/18 to 2041/42 planning horizon. It is expected that the prices of industrial commodities (such as structural steel, copper, concrete, etc.) will continue to increase in response to this continuing demand
50 Sensitivity analyses have been performed in this IRP to capture uncertainties in the major assumptions. The effect of these sensitivities on future capital costs and the impact on the plan can be seen in Section 10.4 (Sensitivity Analysis) The Foreign Exchange Rate Many factors affect the exchange value of the Canadian dollar vis-à-vis the US dollar. The main factors are the terms of trade (i.e., the relative prices of oil and other commodities that Canada exports vis-à-vis product that Canada imports) interest rate differentials between Canada and the U.S., and purchasing power parity, i.e., the inflation rate in Canada vis-à-vis the U.S. The foreign exchange rate currently stands at approximately USD/CAD = This means that one US dollar will purchase 1.35 Canadian dollars. Over the short-term (next four years), this exchange rate is not expected to change significantly. The following is based on recent currency forwards. USD/CAD The long-run exchange rate has been assumed as USD/CAN = 1.18 beginning after the tenth year of the planning period. Foreign exchange rates have a direct impact on fuel and market prices since these are traded in US dollars. To capture uncertainty in exchange rates, sensitivity analysis was performed to capture changes in fuel and market prices The Weighted Average Cost of Capital A public investor such as a government-sponsored enterprise may have different costs of debt, debt ratios, etc., compared to a private investor. Therefore, the Weighted Average Cost of Capital (WACC) will have two different calculations, one that is representative of public investors, and one that is appropriate for private investors. 47
51 The Weighted Average Cost of Capital (WACC) is defined as follows: WACC = r x (1-t) x DebtRatio + ROE x EquityRatio where: r is the interest rate for debt t is the corporate income tax rate ROE is the return on equity (after tax) DebtRatio = Debt Debt + Equity EquityRatio = Equity Debt + Equity Figure 26 summarizes and documents how the WACCs for the two different classes of investors were calculated. Figure 26: Weighted average cost of capital 48
52 6. SUPPLY OPTIONS 6.1. Traditional Utility Supply Options The supply options available in this IRP comprise of a mix of generating choices that include different sizes, fuel supply, operating characteristics, and costs. The following list provides all supply options considered in this IRP. Included in the list are broad categories that include conventional supply options, alternative supply options and existing supply, life extension and conversion options. Conventional Supply Options o Nuclear o Natural Gas Combustion Turbines Combined Cycle o Hydro Grand Falls Additional Power High Narrows o Interconnection Purchases Lower Churchill Other Interconnection Purchases HQ Expansion Projects Alternative Supply Options o Small Hydro o Wind o Ocean Power Tidal Stream Wave o Combined Heat and Power Biomass Fuel Cells Microturbines o Biomass Bubbling Fluidized Bed o Municipal Solid Waste o Solar Photovoltaic o Enhanced Geothermal o Pumped Hydro Storage o Compressed Air Energy Storage Existing Supply, Life Extension and Conversion o Millbank and Ste. Rose Life Extension 49
53 These options include both conventional and renewable options, most of which have been in commercial operation. Consideration is also given to projects that are pre-commercial in nature, and high-level costs are provided for these options. It should be emphasized that these options and costs are based on information and experience available to date, and that no provision has been made to predict what new options may be available in the future, including potential improvement in costs. They reflect the most recent snapshot of available options and costs. All options, with detailed descriptions can be found in Appendix 4 (Supply Options). A summary of the input parameters and costs can be seen in tabular form in Appendix 5 (Project and Operating Cost Parameters). The supply option description and parameters provided in Appendix 4 (Supply Options) were obtained from Hatch Energy (Hatch) and NB Power staff. The study provides high-level estimates of plant performance and cost data for each proposed alternative. The estimates provided in this study are order-of-magnitude estimates and, accordingly, were based on limited and incomplete data. Therefore, while the work, results, estimates and projections within the study may be considered to be generally indicative of the nature and quality of the study, they are not definitive. This means that when making final decisions on selecting and implementing supply options, more detailed engineering will be performed to provide greater certainty in the final cost estimates. The cost estimates provided by Hatch reflect New Brunswick locations, although specific sites were not selected for the alternatives except in cases involving additions or modifications to existing NB Power generation assets. Each renewable power alternative estimated in this study assumed a generic site location in New Brunswick (on land or offshore with power transmitted into New Brunswick s grid). In certain cases, some judgments on the energy harvest technology suitable to the available resource were made based on the information available on the nature of the resource in the province. Performance of the thermal power alternatives were estimated at average ambient conditions and based on seawater once-through cooling. Carbon capture systems and costs of carbon were not included in the initial estimates. The impact of carbon pricing was analyzed separately in Section 10.4 (Sensitivity Analysis). Capital costs are based on Hatch in-house data from recent similar projects, and on publicly available industry data from conferences, reports, professional papers and other publications. Referenced historical project costs were adjusted for inflation and to 2013 Canadian dollars as needed. Costs associated with construction management, engineering and project management, as well as contingencies, are based on Hatch s own experience. Project costs include mobilization to the site, procurement and installation of the generating equipment, contingencies, permitting, engineering and management. 50
54 For some alternatives, a Capital Cost Range to be expected for projects in New Brunswick is provided. It is intended to account for site specific and project definition factors. Renewable power in general is harvested from relatively low energy density resources, and the methods of harvest and associated technology selection are factors contributing to a cost estimate range. The concept of a cost estimate range used in this study is not to be confused with estimate accuracy. Accuracy is a function of engineering content and can be improved by additional scope definition, site specific data and project cost elements obtained from vendor quotes (as an example). Capital costs provided by Hatch were expressed as overnight costs and did not account for escalation, overhead costs, owner s costs or interest during construction. However, NB Power included an interest rate during construction of 5.90 per cent, consistent with public-financed projects. Escalation was also applied to capital projects that reflected the electric utility construction price index, projected at 3.2 per cent per year for new hydro projects and 3.6 per cent per year for all other supply options. These price indices were determined from the Handy Whitman Index of Public Utility Construction Costs. All other costs, including operating and maintenance (O&M) costs were projected to increase at 2 per cent per year. Capital costs also did not include transmission interconnections or upgrade costs since these costs would be site specific. In most cases, overhead costs, owners costs and transmission costs would be small in comparison to the project capital costs. Therefore, the effect would be within the relative accuracy of the original estimate, which, as mentioned previously, is an order-of-magnitude estimate. Typical plant operations and operating modes are described in support of O&M cost estimates. Costs include operators of the facility, maintenance labour and materials, and the administrative costs to provide the facility service, but exclude taxes and royalties, owner s administrative costs at the corporate level, profit and overhead. All O&M costs presented are first year costs, not levelized costs. Operating costs do not include fuel costs. However, information is provided on typical heat rates for each thermal power technology. Operating costs may also include a provision for major capital renewals expressed in terms of cost per kw, per year. The present value of the expected capital renewal expense was used to derive these estimates Community and Personal Distributed Generation While the traditional planning approach for utilities has been to perform least cost planning using traditional utility supply options, we now must consider what part communities and individual customers play in the development of the plan. This section addresses opportunities for harnessing New Brunswick s natural resources in renewable energy. A recap of the potential supply-side options for distributed generation is provided. In addition, a discussion about programs enabling community-distributed generation 51
55 is provided as well as customers personal distributed generation options that will be available in the future. Existing Program Support The government of New Brunswick and NB Power have a variety of programs that encourage community distributed generation. These programs spur decentralized generation and broad geographical distribution of renewable energy sources. The following is a brief description of New Brunswick s community-distributed generation opportunities that include: Net Metering Embedded Generation program Community Energy Program (currently under development), and Customer Personalized Distributed Generation Options The supply options available for these distributed-generation programs can include: Small Hydro (see for additional information) Biomass (see for additional information) Small Wind of up to approximately 10 MW (see for additional information), and Solar Photovoltaic (see for additional information) NB Power promotes regionally distributed generation through power purchase agreements. Historically, these agreements have been procured through a Request for Proposal (RFP) process. The electricity produced from these programs allow NB Power to meet its renewable electricity targets. Net Metering NB Power has a net metering program that allows customers to produce their own renewable energy by connecting a generation unit of less than 100 KW to NB Power s distribution system. In order to qualify for this program, the generation units must come from renewable energy sources compatible with Environment Canada's Environmental Choice Program 14 and Ecologo Certification 15, and standards for renewable low-impact electricity products such as biogas, biomass, solar, small hydro or wind. A special net meter records the electricity NB Power delivers to the customer and the electricity NB Power receives back from the customer s generation unit. The customer is then billed for any net amount of electricity consumed and receives a credit for power sold into the grid. Any credits unused during the current billing period are carried forward to subsequent billing
56 periods until March 31 of each year, after which credits are reduced to zero. This enables the customer to offset some of their consumption by generating their own power. However, because of its limit of 100 KW, the net metering program is generally of interest to residential and small commercial operations only. Embedded Generation The Embedded Generation program allows potential developers or independent power producers to connect their environmentally sustainable generation to NB Power s 12 kv distribution system. Typical embedded generators may include landfills, biogas, biomass as well as solar, wind, hydro, and ocean technologies. The embedded generation facility may range in size from 100 kw to 3,000 kw. However, certain areas of the distribution system are more limited than others to accept the higher capacity and the generation output may be restricted in certain areas of the province. The initial allocation for these programs is currently set at 20,000 kw (20 MW). The embedded generation program is unlike the net metering program because the energy output of the independent power producer is not used to offset their existing electricity consumption. Rather, NB Power purchases the renewable energy and environmental attributes at an established Feed-in tariff. The Feed-in tariff is designed to make it easier for the independent power producer to sell their electricity to NB Power at a fixed and stable price under a long-term contract. The Feed-in tariff effective October 1, 2016 is $ per kwh. This is based on the cost of electricity supplied from the distribution system. NB Power understands that there is a growing appetite in New Brunswick for sustainable, renewable energy projects. The Embedded Generation Program supports these projects by allowing these small-scale, locally owned generators to connect to our distribution system and to supply renewable energy onto the grid. This IRP has assumed 13 MW of Embedded Generation will be added by 2020 to fulfill the total allocation of 20 MW. Community Energy Program NB Power has assumed the development of energy resources from local small-scale projects would occur as part of the Government of New Brunswick s Locally Owned Renewable Energy Projects that are Small Scale (LORESS) regulations. This regulation can be found on the Government of New Brunswick s website 16. The LORESS program will: 1. support local First Nations small-scale renewable projects 2. integrate current and future renewable generation in the most cost-effective and efficient manner, and
57 3. support promising solar, bio-energy and other emerging renewable energy technologies This IRP has assumed a phased in approach of this development so that by 2020, 80 MW (approximately 300 GWh) of incremental new renewable generation will be added to the system. To manage the integration of this development with the system, NB Power will focus on projects that provide dispatch flexibility and can integrate with NB Power s smart grid initiative. Customer Personalized Distributed Generation Options As part of NB Power future planning, consideration will be made to reflect customers desire to produce and store electricity for their own consumption and also have the flexibility to remain connected to the grid and to potentially contribute their surplus electricity to the grid. As part of the consultation process for this IRP, focus was given to what matters most for customers, and for customers to share their thoughts, connect ideas, listen to understand, and encourage participation. These discussions reinforced two high level priorities: Clean Energy o customers want NB Power to be a leader in energy efficiency o customers support using less fossil fuels and to transition to a cleaner energy future, and o New Brunswickers have a responsibility to make changes to help address climate change Customer Options o Customers are willing to personally invest in equipment and technology to manage their electricity use and costs. To achieve these priorities it will be important to prepare the landscape for all customers to participate. Energy Smart NB, which is evaluated in this IRP, forms the underpinning by which a new partnership with customers will be established. Over time, new business models will be developed that will introduce new technologies to achieve desired customer values. The investment towards grid modernization will enable customer owned equipment and technology to be plug-and-play and to provide customer visualization, communication and control of this equipment through a hand held device such as a smartphone. Although the business models are in the early stages of development for customer owned generation options, this IRP has attempted to capture the impact of high penetration of customer owned solar. This analysis was done in Section 10.4 (Sensitivity Analysis). 54
58 7. RESULTS OF SUPPLY ANALYSIS 7.1. Levelized Cost of Electricity The following sections provide a detailed analysis of all supply options included in this IRP. Each supply option was evaluated using the Levelized Cost of Electricity (LCOE) methodology, which is described in greater detail in the next section. This is an important step in the IRP process because it allows the system planner to rank and choose the appropriate supply option candidates from the larger portfolio of options. The analysis provides the total accounting life cost comparison of each project, which is expressed as an equivalent electricity price in dollars per megawatt hour ($ per MWh). The full accounting life cycle costs include capital, operating and maintenance (O&M), fuel and environmental costs. In this analysis, the levelized electricity prices were expressed in 2013 dollars so that they could be easily compared to NB Power s current costs of electricity generation Levelized Cost of Electricity Methodology The LCOE methodology is the economic assessment of the cost of the energy/generating option. It includes all of the costs over its lifetime, namely: initial investment OM&A cost of fuel (if applicable) cost of capital that includes interest and return on equity (if applicable) environmental costs (if applicable), and taxes (if applicable) The LCOE is the present value of the total cost stream of all the items listed above for a given generation option over its economic life to generate electricity. It was used to evaluate and compare the relative economics of each potential generation option. The LCOE is essentially the minimum price at which energy must be sold for an energy project to break even over the life of the project. No financial risks associated with future construction prices or operating risks were included in the LCOE analysis. This was left to production cost modelling and sensitivity analyses. Also, it is important to note that the supply options considered in this IRP are of various sizes, fuel types, and varying levels of reliability. The latter is of particular importance because extra costs may be required to ensure an intermittent or variable supply option (such as wind, solar, wave, and tidal power) is reliable, by providing a backup to that supply option in the event it is not 55
59 available. The costs presented here are simply the cost of the stand-alone option, or the sticker price of that option. However, the LCOE analysis has included the extra costs required for ancillary support such as load following of $10 per MWh. This ancillary cost has been applied to all intermittent options (wind, solar, and wave power). The full costs of any of the supply options presented here are captured through the production cost modelling phase of the analysis, since the system is dispatched in economic order, and the lowest cost options are selected as needed to meet the load and reserve requirements without the risk of rolling blackouts. It is during the production cost modelling that the appropriate level of backup and the associated cost is included to support any of the intermittent and variable supply option under consideration. The following chart provides the LCOE and ranking for the supply options assessed in this IRP. Figure 27 Levelized cost of electricity Interconnection Purchases Large Wind Small Wind Hydro - Grand Falls Large Combined Cycle Geothermal Small Combined Cycle Hydro - High Narrows LM6000PF Combined Cycle Small Hydro Nuclear Biomass Combined Heat and Power Pumped Storage Hydro Large Solar PV - Single Axis Tracking Large Solar PV - Fixed Tilt Racking Small Solar PV - Fixed Tilt Racking Biomass Bubbling Fluidized Bed Compressed Air Energy Storage Municipal Solid Waste Microturbines Millbank/Ste Rose Life Extension Tidal Stream Power Natural Gas Fuel Cells Gas Turbine - Mid Efficiency Gas Turbine - High Efficiency Wave Power $82/MWh $96/MWh $100/MWh $102/MWh $114/MWh $117/MWh $118/MWh $119/MWh $129/MWh $131/MWh $131/MWh $132/MWh $139/MWh $142/MWh $154/MWh $156/MWh $158/MWh $181/MWh $198/MWh $208/MWh $311/MWh $330/MWh $368/MWh $413/MWh $452/MWh $545/MWh 56
60 The options presented show a significant variation in electricity prices, from a low of about $80 per MWh to a high of about $550 per MWh. In many cases, the variations were due to the nature of the options and their level of maturity (commercialization). Another influencing factor was the assumed operating hours. Low operating hours of peaking units such as CT s, Millbank and Ste. Rose will tend to increase the LCOE. The most expensive renewable options are wave power and tidal power, which are well above $300 per MWh. Each of these options is in the very early phases of commercialization; therefore, the expected installation costs are high to account for the many unknowns such as technology choices and regulatory requirements. Although cost reductions are expected as technologies mature, recent trends highlight that high demand could lead to price increases. In this analysis, the projected installed costs of the various options were based on current experiences and costs but were escalated at the construction price index over time. The supply options presented, and resultant LCOE depicted in the previous chart, were based on applying public funding for capital requirements. Assuming this arrangement, some of the options and resultant LCOE prices could compete with NB Power s existing total system costs of about $80 to $100 per MWh over the near term (of which about $20 per MWh is for distribution). As a final note, the interconnection purchase option does not include capital costs for new transmission that may be required to support this option. Only the cost associated with firm energy and capacity is included for this option Private versus Public Financing As mentioned in Section (The Weighed Average Cost of Capital), the cost of capital for privately initiated power projects can be inferred from the most current actual experience of some of the major independent power producers (IPP s) located in Canada. Using this knowledge, this study assumed private projects average cost of debt to be 6.5 per cent 17 with an after-tax return on equity of 11 per cent, to which a 60:40 debt-to-equity structure is applied. This produces an after-tax weighted average cost of capital (WACC) of about 7.13 per cent, assuming a composite income tax rate of 30 per cent. Applying these parameters to the supply options tends to increase the LCOE in comparison to publicly financed projects. Figure 28 illustrates the effect of these assumptions. 17 This assumes a Government of Canada rate of 4.25 per cent plus a 225 basis point spread for private entities with Dominion Bond Rating System (DBRS) rating of BBB-. See Section (The Weighted Average Cost of Capital) 57
61 Figure 28: Levelized cost of electricity including the incremental cost of private financing: Interconnection Purchases Large Wind Small Wind Hydro - Grand Falls Large Combined Cycle Geothermal Small Combined Cycle Hydro - High Narrows LM6000PF Combined Cycle Small Hydro Nuclear Biomass Combined Heat and Power Pumped Storage Hydro Large Solar PV - Single Axis Tracking Large Solar PV - Fixed Tilt Racking Small Solar PV - Fixed Tilt Racking Biomass Bubbling Fluidized Bed Compressed Air Energy Storage Municipal Solid Waste Microturbines Millbank/Ste Rose Life Extension Tidal Stream Power Natural Gas Fuel Cells Gas Turbine - Mid Efficiency Gas Turbine - High Efficiency Wave Power $82/MWh $110/MWh $116/MWh $140/MWh $120/MWh $142/MWh $124/MWh $164/MWh $136/MWh $173/MWh $163/MWh $151/MWh $185/MWh $177/MWh $192/MWh $195/MWh $174/MWh $217/MWh $232/MWh $225/MWh $323/MWh $388/MWh $409/MWh $486/MWh $552/MWh $650/MWh On average, privately financed renewable projects will command a five to 40 per cent increase in electricity prices, depending on the project. On an individual basis, the following average increases in electricity prices are expected from private renewable projects: Solar 20 per cent Tidal 20 per cent Wind 15 per cent Hydro 40 per cent Fossil generating options such as natural gas vary from about five to 10 per cent, and nuclear will command an increase of approximately 20 per cent. The variability in the incremental prices is mainly due to the cost and weighting of the capital investment versus fuel and O&M. Therefore one would expect that renewable energy projects, as well as nuclear projects, would incur the highest impact because the capital costs make up a larger portion of the total project costs. 58
62 Levelized Cost of Electricity Summary Based on the LCOE analysis and the load and resource assessment performed previously, it is possible to formulate alternative system plans that can be evaluated in detail through production cost and financial modelling. All plans require options to address the current Renewable Portfolio Standard (RPS) requirements in the near term, as well as capital stock turnover in the longer term. The options required are a mix of base load and peaking requirements. In addition, the screening criterion has applied a price cap of $150 per MWh. This means that options with LCOE prices above this value would be culled. This criterion is selected to manage the number of options available to the Strategist model, which was used for production cost modelling. This model is explained in greater detail in Section 10 (Integrated Demand and Supply). Based on this screening criterion, the following options have been selected for further evaluation: Interconnection Purchases Wind Hydro - Grand Falls Natural Gas Combined Cycle Enhanced Geothermal Hydro High Narrows Small Hydro Nuclear Biomass Combined Heat and Power, and Large Solar PV Single Axis Tracking In addition, the following peaking options were selected for further evaluation: Simple Cycle Gas Turbines Mid-Efficiency, and Millbank / Ste. Rose 59
63 7.2. Supply-Side Plan Evaluation Expansion plan optimization analysis models the existing system as well as expansion options. It provides a total net present value cost as a key output for each expansion plan. The goal of supply-side evaluation is to find the least cost and environmentally acceptable supply plan that will reliably meet the electricity needs of New Brunswick. At this point of the evaluation, particular focus is given in Step 6 of the IRP process shown in Figure 29. Figure 29: IRP Process In developing the reference supply plan, all reasonable and feasible alternatives identified in the supply-side screening analysis described in Section 7.1 (Levelized Cost of Electricity) were provided as input and run through PROVIEW to find the least-cost supply plan to reliably meet the forecast future requirement of load and reserve within New Brunswick, with consideration of the RPS requirement of 40 per cent by PROVIEW is part of the Strategist suite of models developed by Ventyx Inc. of Atlanta, Georgia, to evaluate long-term resource plans. The PROVIEW model has been used by NB Power in developing previous IRPs and is used widely in 60
64 the electricity industry. It has been reviewed and accepted by the New Brunswick Energy and Utilities Board (EUB). PROVIEW produces thousands of combinations and permutations using dynamic programming techniques, and ranks the resulting expansion plans in order of increasing costs. Using the PROVIEW model, system planners were able to study the expansion plan options in detail. Economic dispatch implications associated with differing seasonal load requirements, limited hydro plant energies and storage capability, and environmental constraints were included to determine detailed year-by-year production costs for all plans. Expansion plan optimization analysis enables a quantifiable comparison of the expansion plans on a cost basis. In addition, comparison can also be made of system energy production, fuel usage, as well as emissions for each of the expansion plans. The flexibility of this modelling capability is not just used to determine a least-cost plan; it is also used to determine the plan s sensitivity and robustness to potential changes in different variables. In summary, the process for supply-side expansion plan evaluation includes: Determining the lowest-cost supply expansion plan using basic assumptions Calculating generation mix and GHG emissions, and Completing sensitivity analyses of different variables such as fuel prices Least-Cost Methodology The PROVIEW analysis determined the least-cost supply plan that would meet the immediate system needs prior to 2027 and in the longer term, to address the aging NB Power generation fleet. The results are shown in Figure 30. Consideration was also given to the least-cost plan that achieves the Renewable Portfolio Standard (RPS) under the Electricity Act. The RPS requires 40 per cent of NB Power in-province energy sales be obtained from renewable resources by The RPS requirement is a legal obligation for NB Power. The least-cost plan, including RPS, will be used as the Supply Plan. 61
65 Figure 30: Summary of least-cost supply plan FY Ending Supply Plan Scheduled Retirements Embedded Generation (13 MW) 2021 LORESS (80 MW) 2025 Grandview (-95 MW) 2026 Grand Manan (-26 MW) 2027 NGCC (412 MW) Bayside (-277 MW) 2031 Millbank / Ste Rose (4 x 99 MW) Millbank / Ste Rose (-496 MW) Mactaquac Life Achievement Total PVRR (2017 $) Lepreau Replace-in-kind (660 MW) PUR (175 MW) NGCC (3 x 412 MW) Millbank /Ste Rose (99 MW) $25.7 B Point Lepreau (-660 MW) Belledune (-467 MW) Coleson Cove (-972 MW) The supply plan includes 80 MW of Community Energy projects and 13 MW of Embedded Generation by This is to help meet the RPS target by this period. The supply plan also shows major development in the period between 2027 and 2042 to respond to existing facilities end-of-life schedules. The total present value of revenue requirement (PVRR) shown, is expressed in 2017 Canadian dollars and includes all costs (total fuel and purchased power, new and existing O&M and new and existing capital requirements, as well as total costs for transmission, distribution, products and services, and head office). These costs were captured within the study period as defined between 2017/18 and 2041/42. Inherent in the PVRR are the revenues associated with export sales of electricity and sales associated with products and services (such as water heater rentals and dusk to dawn lighting). These activities tend to reduce the total revenue requirement which translates to lowering rates. The development of the least-cost supply plan was based solely on meeting in-province electricity requirements plus any long term contractual obligations. The benefits associated with exporting surplus electricity were captured after this process was complete. This allowed the surplus electricity to be made available for export and to capture potential benefits that then reduced the total present value of revenue requirements. 62
66 It is noteworthy that the least-cost plan selects a natural gas combined cycle (NGCC) as the first new supply requirement to meet peak demand. This facility will require a long term supply of natural gas. It is assumed the source of supply for natural gas would be available at the prices assumed in this analysis see Section 5.7 (Fuel Price Forecast). The plan also shows several combustion turbines (CTs) and life extension of Millbank and Ste. Rose to meet peak load requirements. In addition to this, and to respond to the retirement of Point Lepreau, Belledune and Coleson Cove at the end of the period, it is assumed that Point Lepreau would be replaced in kind to maintain 75 per cent non-emitting resources in the long term and that a combination of natural gas generation and interconnection purchases would be required to continue to meet load obligations. It is recognized that a significant investment will be needed in the latter period of the plan. NB Power will look for opportunities and options to separate and spread this investment as this critical period approaches. Finally, it is assumed in this assessment that Mactaquac will undergo life achievement investment that will ensure the station can operate to its intended 100-year lifespan with a modified approach to maintenance and adjusting and replacing equipment over time and that the capacity from this facility will be fully available by This assumption follows three years of expert research, including input from science, engineers, the public and First Nations. 63
67 8. ENERGY EFFICIENCY, DEMAND MANAGEMENT AND SMART GRID 8.1. Demand-Side Management An important part of the integrated resource planning process is recognizing that conservation, energy efficiency and load demand management, also referred to as demand-side management, is a potential low-cost alternative to developing new power plants. Demand management is any attempt to change or influence the demand placed upon the system by the customer. It encompasses a broad range of techniques from the direct control of customer equipment to educating customers about conserving electricity. Figure 31 outlines the overall IRP study process. This section of the report outlines the detailed procedures employed in evaluating the demand-side options portion of Step 5 shown in Figure 31. As in the supply-side evaluation, Step 6 is also used to assess the effectiveness of demandside management. Refer to Section 2.2 (The IRP Process) for additional information. Figure 31: IRP Process 64
68 Although North American utilities have recognized the value of energy efficiency and demand management since the 1960s, management of demand side did not start until a decade later. In the early 1970s, inflation, environmental concerns and escalating fuel prices began to have significant effects on energy costs. In 1973, the Organization of Petroleum Exporting Countries (OPEC) shocked the world with an oil embargo. The high inflation that resulted caused the cost of electricity from new power plants to be as much as 10 times higher than that generated at existing plants. More focus was then given to energy efficiency and demand management in 1978 when the Public Utility Regulatory Policies Act (PURPA) was enacted in the United States. This Act was passed as part of the National Energy Act and was meant to promote energy conservation (reduce demand) and promote greater use of domestic energy and renewable energy (increase supply). This Act started the industry towards deregulation in which an open competitive market for bulk electricity supply was created along with the inclusion of an open non-discriminatory transmission system. The electricity industry in North America since 1978 has moved from what was once comprised predominately of vertically integrated monopolies to a fragmented industry comprised of separate generation and transmission companies as well as local distribution companies under various jurisdictional regulatory rules. Since 1978 and PURPA, utility planners were motivated by the vision of a sustainable energy future. They increased their focus on potential achievable conservation, energy efficiency and load demand management in conjunction with traditional generation alternatives to limit: negative effects on the environment the financial impact of fossil fuel prices, and future rate increases to customers The combination of supply-side and demand management options which incur the lowest costs, consistent with other important goals, has become known as least-cost, integrated resource planning and is actively used by many utilities, including NB Power. Prior to this plan, NB Power completed four internal IRPs: in 1990, 1995, 2002 and In addition, the first public IRP was completed in During the time of internal IRP s, NB Power was involved in several demand management studies conducted by the New Brunswick Department of Energy Energy Smart NB Energy efficiency and conservation is an integral part of a plan that NB Power continues to pursue to reduce and shift demand. This approach called Energy Smart NB is designed to provide benefit to the participating customers through direct savings on their power bills and to introduce new technologies that can be leveraged to help customers further manage their electricity consumption. This approach also provides a benefit to NB Power through immediate 65
69 fuel cost savings and through lower capital requirements in the long term by reducing the need for new supply in the future. This, then, provides indirect benefit to all customers by ensuring low and stable rates. Taken in its entirety, Energy Smart NB is a long-range, foundational strategy meant to transform the way NB Power operates while introducing a wide range of new customer benefits. Indeed, it is widely acknowledged that the electric utility industry is changing, and utilities must change along with it to meet their customers needs. A 2017 report issued by Utility Dive, an industry news and analysis firm, shows that nearly all of 600 North American industry executives surveyed believe utilities must make fundamental changes to the way they have operated for the past 100 years 18. Electrical utilities are incumbent players in a century-old industry dealing with disruption driven by new technologies, regulations and market realities, state the authors. In New Brunswick, the need for change is driven by the emergence of advanced technologies, changing customer preferences, and new energy economics. A key issue faced by NB Power is its projection that, starting in 2027, it will require new supply to meet customer demands. Instead of investing in new generation assets and/or power purchase agreements, NB Power is proposing to lower demand by investing in demand-side techniques and technologies. Another driver is that energy use throughout the Province is highly seasonal and swings significantly within any given day. The winter peak load is double the summer peak load and in any day the load requirements may shift by 400 and 600 megawatts, requiring a plant of this size to be available for as little as one hour. This contributes to low generation utilization averaging less than 50 percent which then can have a direct impact on electricity rates. Advances in technology provide opportunities to leverage this unused capacity, and those opportunities become even more compelling when customers become more knowledgeable and proactive energy consumers. At the same time, many components of the electricity grid are decades old and in need of updating. New smart technologies are available that can improve the efficiency, flexibility and reliability of the grid while enabling important new benefits. By modernizing the grid, NB Power can better understand how and when energy is being consumed and use that information to operate more efficiently and provide customers with better service, new energy-saving products and services, and more flexible rate plans. It is important to note that the New Brunswick Energy and Utilities Board has directed NB Power to improve its cost of service studies to explore more options for time-sensitive pricing State of the Electric Utility Survey Report, retrieved from 66
70 In addition, grid modernization lays the foundation for a wide range of reliability benefits, including more efficient outage response, which can greatly aid in storm restoration, and enhanced ability to detect and correct issues on the grid before they affect customers. Smart grid is also essential to the expansion of renewable and distributed energy sources. As more variable energy sources are connected to the grid, however, utilities face greater challenges in managing that variability to balance supply and demand while maintaining the stability of the grid. By building smart technologies into the grid, utilities can support greater customer participation in renewables while also improving reliability and efficiency and offer customers more choice, control, and convenience in other ways as well. Clearly, Energy Smart NB is a far-reaching initiative that touches virtually every function within the utility. That s why the initiative also includes extensive process changes and a sharp focus on improving business capabilities. Major Elements of Energy Smart NB Energy Smart NB consists of operational initiatives, enabling technology, and business process improvements. Enabling technology and business process improvements are required for implementation and success of the operational initiatives. Energy Smart NB has three main interrelated elements: Smart Grid: Grid modernization technology and software, including engineering and design work, along with the internal process changes and enhanced business capabilities required to implement and optimize the technology. This includes technologies such as Advanced Metering Infrastructure and Integrated Load Management that will enable NB Power to support the goal of reducing and shifting demand while laying the foundation for a wide range of additional benefits, including improved grid reliability and security, supporting the expansion of renewable and distributed energy sources, and providing customers with more choice, control, and convenience. Smart Habits: Energy efficiency and demand response programs that help customers reduce and/or shift their energy usage without compromising the overall value of electricity service. These include home insulation programs, a commercial building retrofit program, the Smart Habits product rebate program, and residential and commercial lighting programs. Demand response programs include smart hot water heaters, smart thermostats and the beat the peak education program. Smart Solutions: New products and services that leverage both DSM initiatives and smart grid technology to engage consumers as active participants in managing their electricity usage. Specific initiatives included in the new products and services program include the LED dusk to dawn program, the 67
71 hot water heater rental program, the LED street light program, and in the future, home energy generation such as solar, battery storage, electric vehicle charging and time-of-use rates. These three elements of Energy Smart NB are interdependent. The grid modernization efforts comprise the foundation enabling infrastructure of Energy Smart NB the enabling investments. This infrastructure drives development of efficiency and demand response programs, and development of products and services that drive the revenue programs and operational improvements in the field. In turn, the efficiency and demand response programs, the revenue programs, and the operational improvements drive customer benefits, which include lower costs and higher quality service compared to a future where Energy Smart NB were not in place. Therefore, Energy Smart NB can be regarded in its entirety as a unified set of initiatives. The following sections provide a short description of the programs and activities stemming from the Energy Smart NB plan. A balanced approach was taken in determining the areas of investments in order to capture cost-effective electricity efficiency measures across the sectors and to address new, innovative energy technologies and strategies. Based on sound management practices, the plan will be revisited on a regular basis by assessing program results and market conditions and by seizing new opportunities that may arise DSM Plan 2019 to 2021 It is important to stress demand-side management (DSM) resources, such as energy efficiency and demand response programs, can play a pivotal role in meeting New Brunswick s future power needs. These programs are foundational to the Energy Smart NB plan. Previous IRP s have shown that DSM provides benefit to both utility and customers and help to keep rates lower in the long term. The benefits are derived from avoided generation and capacity costs and higher overall efficiency. To participating customers, DSM lowers energy consumption and bills. This also has a direct benefit to the environment, through lower emissions. The three year DSM plan focuses on two categories of initiatives, aimed at reducing both energy and peak capacity needs: Energy efficiency Refers to initiatives that are focused on reducing loads, whether through more energy efficient technologies (e.g. efficient equipment, lighting, motors, and building envelopes) or through energy-conserving behaviour (e.g. switching off lights when leaving a room). While focused on energy savings, it is noteworthy that energy efficiency typically generates both energy and peak capacity savings. Demand response refers to initiatives that are focused on shifting loads, whether through more peak-efficient technologies (e.g. three-element water heaters that distribute loads more evenly), customer- 68
72 driven actions (e.g. responding to price signals by programming a dishwasher to launch outside of peak hours), or through NB Power-driven actions (e.g. controlling smart water heaters during the critical hours of the system). With some exceptions, demand response typically generates only capacity savings. NB Power s first DSM Plan was issued in December 2015 and filed with the Energy and Utilities Board. In it, NB Power proposed a portfolio of EE and DR initiatives from incentives to direct installations and pilots for the 2015/16 to 2017/18 timeframe along with enabling activities. The reductions achieved since the 2014 IRP are summarized below: Figure 32: Historical Achieved Energy and Demand Savings FY Ending MW GWh The three year DSM plan has been refreshed for this IRP and includes a detailed description of pilots and programs that include program priorities to achieve energy savings, cost effectiveness, and investments. This is done for three key strategic areas that include the residential sector, commercial and industrial sectors and an enabling strategy that include the activities and investment to drive program development. In addition, the plan includes a cost-effectiveness analysis for each program, relying on the Program Administrator Cost (PAC) test. Also, an evaluation, measurement and verification (EM&V) plan for the portfolio of programs is developed Beyond the First Three Years The three-year DSM plan was developed from a long-term view that determined approximately 600 MW of capacity and approximately 2 TWh of energy reductions are available. This plan puts NB Power and all of New Brunswick on the path to achieving these reductions. The analysis and research used to develop the three-year DSM plan, was used to inform the longer-term costs of the programs used in the integration process. As mentioned, the deployment of smart grid technology plays an important role to enable and enhance many of the programs required to achieve the capacity and energy reductions described above. Smart grid is part of grid modernization and will contribute to the increased integration of renewable resources, both centrally and as distribution generation, and to the increased efficiency of the grid operations. In combination, energy efficiency (reduce) and demand reduction (shifting) are foundational to Energy Smart NB. Energy Smart NB includes all costs to implement energy efficiency and 69
73 demand reduction programs as well as infrastructure costs for smart grid implementation and new product and service offerings to customers. The total cost of Energy Smart NB is projected to be in the order of $1.3 billion on a present value cost basis over the 25 year study period. The following reductions in electricity requirements are expected from this investment over the next 25 years. Figure 33: Potential Energy Smart NB reduction schedule Year MW GWh ,301 Note that these reductions are incremental to the reductions achieved since the 2014 IRP, previously shown in Figure
74 9. COMMUNITY DIALOG SESSIONS 9.1. Overview of Public Consultation Process Our Energy Future NB Section 100 of the Electricity Act, passed October 1, 2013, obliges NB Power to submit an Integrated Resource Plan (IRP) to the Energy and Utilities Board (EUB) as part of the utility s long-term planning process. The Act also obliges NB Power to include a description of the stakeholder consultations carried out by the Corporation in developing the integrated resource plan. To achieve the objectives set out in the legislation, and to achieve NB Power s own goals of improved transparency regarding our planning process, and improved energy literacy among our customers and stakeholders, NB Power carried out a broad multi-platform engagement approach with a wide variety of New Brunswickers that included an online survey, facilitated meetings and presentations. This program was called Our Energy Future NB. A full report on findings and input can be found in Appendix 1 (IRP Public Engagement Program What Was Said Final Report). As the planning period of the Integrated Resource Plan is 25 years, it was important to gain a deeper understanding of what s important to customers as they consider New Brunswick s electricity future, and the role they re willing to play to achieve those objectives. Customer engagement on the Integrated Resource Plan (IRP) was carried out between March 12, 2017 and May 15, The design of the engagement process was a collaborative effort between the NB Power team and NATIONAL, a communications services firm, with survey design and data analysis services provided by Thinkwell Research. The goal of the program was to gather values-based input from New Brunswickers about the province s electricity future to inform NB Power s. The objectives of the program were to: gain a deeper understanding of what is most important to customers as they consider the province s energy future, and the role they re willing to play to achieve those objectives gain a deeper understanding of what is most important to customers as they consider the province s energy future, and the role they re willing to play to achieve those objectives provide sufficient and appropriate contextual information, in an easy to understand format, about the province s energy landscape, the scope of the IRP process, and what can be influenced 71
75 host a values-based engagement process in person and online that allows New Brunswickers to contribute based on their own perspective, experience, ideas, and what is most important to them, and be transparent in sharing what emerges from the consultation effort 9.2. Scope of Engagement The engagement program consisted of an online survey hosted on the website OurEnergyFutureNB.ca and customer engagement sessions hosted in Fredericton, Moncton, and Beresford. Efforts to raise awareness of the engagement process and to invite customer participation were extended through: newspaper advertising, social media advertisements (Facebook, Twitter, and YouTube), media relations, direct invitations to stakeholders, and via NB Power s own communications channels (e.g. website, social media). Input was gathered from 1,221 New Brunswickers online and 52 people who attended engagement sessions. Formal submissions to the process were also received from 3 stakeholder organizations. Online engagement approach The online engagement experience was designed with a general public audience in mind. Content was developed to be concise and used plain language. An informational video was produced to provide context for the discussion and the questions posed. The survey was short and the questions direct. It explored the following topics: Affordability Clean Energy Customer Options Participants were also provided with an open-ended opportunity to share additional information regarding what was important to them, and those qualitative inputs were coded into conceptually meaningful categories and quantified with NB Power. In-person engagement approach The customer engagement sessions were hosted in a world café format. Representatives of the NB Power executive team served as hosts, and a presentation by Michael Bourque, Director of Integrated Resource Planning provided important context for the discussion. That presentation consisted of: an overview of the IRP, the current situation, 72
76 outcomes of the 2014 IRP process, possible options for the future, and the increased role customers might play. Participants were facilitated through an exploration of the following three questions: 1) When considering New Brunswick s electricity future, what s most important to you? 2) What do we need to be successful in advancing these priorities? 3) What can customers do to help advance these priorities? 9.3. Online Engagement Findings Summary The results of the online survey indicate that clean energy and affordable rates are both high priorities among New Brunswickers who participated. Respondents mostly agreed with statements related to these two considerations. The one exception is that there was less agreement overall with the statement I am personally willing to pay more for clean energy than other statements on this topic. This suggests that at least for some, there are limits to the degree to which they want NB Power to embrace this approach. There were also some clear age divides on several questions. younger respondents (under the age of 35) expressed higher and more intense levels of agreement with statements that endorse clean energy, while older (55+) respondents did the same for statements that related to managing costs (keeping rates as low as possible, investing in options to allow them to better manage their energy use, etc.). This should not be interpreted as meaning that younger respondents do not favour low rates, or that older respondents do not support clean energy. It does mean, however, that the age groups are more concerned and sensitive to one priority over the other. The statements New Brunswickers had the highest level of agreement with, were: Clean Energy o I want NB Power to be a leader in energy efficiency o I support using less fossil fuels as we transition to a cleaner energy future to meet out climate change commitments o New Brunswickers have a responsibility to make changes to help address climate change 73
77 Customer Options o I am willing to personally invest in equipment and technology to manage my electricity use and costs (e.g. insulation, programmable thermostats) The single largest group of respondents of the survey came from the middle age (35-54) category, at 45 per cent. The proportion of younger (under 35) and older (55+) respondents was relatively equal (25 per cent and 27 per cent respectively). Respondents were also provided with an opportunity to indicate how much of a priority they place on four priorities for NB Power, out of a possible 100 points. The highest weight was assigned to clean energy (36.1 average), followed very closely by the lowest rates (32.8). Customer options (16.5) and debt repayment (14.5) were not rated as strongly. Respondents from Maliseet and Mi kmaq communities consistently articulated clean energy as a high priority, and the ability to generate power for sale back to the grid. First Nations community representatives identified the following priorities during the Beresford engagement session: Inclusion of First Nations More green Energy Affordability The Environment Need for development in the North Opening markets Lower or eliminate carbon emissions Grants or incentives for wind/solar energy development 74
78 9.4. Customer Engagement Session Findings Summary Customers had deep discussions during the engagement sessions about their priorities when considering New Brunswick s energy future and what was most important to them. The general themes are reflected below. More detailed information and findings related to the IRP public engagement program can be found in a document called What Was Said Final Report which can be found in Appendix 1 (IRP Public Engagement Program What Was Said Final Report). 75
79 10. INTEGRATED DEMAND AND SUPPLY Introduction To best develop a least-cost expansion plan, neither the supply-side nor the demand-side analysis results can be used in isolation. One of the major components of least-cost planning is the integration of energy efficiency, demand response and smart grid programs sometimes referred to in combination as demand side management (DSM) programs. These programs are foundational to Energy Smart NB and are evaluated as an alternative to power plants in this IRP. The results of the supply-side analysis can now be used as a supply reference plan for DSM integration wherein this program has the opportunity to defer or displace a supply-side unit, based on competing economics of the DSM measure(s) and the generating unit(s). The first step in this integration process was a preliminary economic screening of the DSM measures under consideration. During this screening, certain simplifying assumptions about DSM options and their interactions with supply-side generating plants were made in order to screen out only those measures which were obviously not cost effective and therefore did not need to be subjected to more detailed analysis. The screening analysis assumed that avoided capacity and energy costs could be calculated by using combustion turbines for peaking needs identified in this plan as required beginning in 2027, and avoided energy costs based on the marginal system costs (fuel, purchased power and variable O&M) that would be displaced by energy reductions. Another simplifying assumption used in the screening analysis was that any increment of DSM capacity reduction, regardless of diversity, could defer an equivalent amount of supply capacity. In reality, only discrete blocks of supply capacity can be deferred. Therefore, in order for a DSM measure to successfully avoid the need for new capacity, it must be of sufficient size, either by itself or in combination with other economically desirable measures. In order to properly evaluate the screened-in DSM options, the simplifying assumptions listed above are removed and the DSM program and supply-side options are allowed to compete equally in a detailed and realistic simulation. The PROVIEW dynamic program expansion planning software model was used to evaluate the ability of DSM options to realistically avoid or defer generation requirements. PROVIEW is an automatic expansion-planning model that is used to determine the least-cost balanced demand and supply plan for a utility system under a prescribed set of constraints and assumptions. PROVIEW realistically simulates the operation of a utility system to determine the cost and reliability effects of adding resources to the system or of modifying the load through the DSM program. In this study, the dynamic programming process simulated full capital and production cost effects of thousands of feasible combinations of DSM and supply-side options. 76
80 10.2. Integration Approach and Methodology Supply Assumptions Based on the results of the supply-side analysis in Section 7.2 (Supply-Side Plan Evaluation), the least-cost supply-side resource plan outlined in Figure 34 was used for the evaluation of Energy Smart NB integration. Figure 34: Supply Plan FY Ending Supply Plan Scheduled Retirements Embedded Generation (13 MW) 2021 LORESS (80 MW) 2025 Grandview (-95 MW) 2026 Grand Manan (-26 MW) 2027 NGCC (412 MW) Bayside (-277 MW) 2031 Millbank / Ste Rose (4 x 99 MW) Millbank / Ste Rose (-496 MW) Mactaquac Life Achievement Lepreau Replace-in-kind (660 MW) PUR (175 MW) NGCC (3 x 412 MW) Millbank / Ste Rose (99 MW) Point Lepreau (-660 MW) Belledune (-467 MW) Coleson Cove (-972 MW) It should be noted that the retirements of Point Lepreau (660 MW), Belledune (467 MW) and Coleson Cove (972 MW) in 2039/40 and 2040/41 represent over half of the installed capacity of the system and typically supply over half of the province s electricity requirements. The simultaneous retirement of these plants will pose challenges for NB Power because of the large amount of capital and human resources that will be required to install replacement generation facilities in a short period of time. The resource plan during those years will be refined over the next 15 years, as the plants approach their end of life and consideration of retirement dates and construction schedules factored in. The resource plans that are shown in the following sections are representative of the relative costs and options made available and allow for appropriate comparison across scenarios and the evaluation of the Energy Smart NB option. The final supply plan and replacement schedule will continue to be revised over time. 77
81 At this stage, the alternatives in the Supply Plan will now compete with the DSM initiatives contained within the Energy Smart NB option to determine the least-cost mix of supply-side and demand-side options. DSM could defer or completely displace a supply-side resource option during the integration phase. However, the addition of the DSM initiatives obviously would not advance the timing of supply-side addition, nor would DSM cause more power sources to come online than in the Supply Plan. The exception to this would be that resources to meet the RPS requirement (having 40 per cent of New Brunswick s electricity sales come from renewables by 2020) would need to be maintained. This means that the resources such as the 80 MW of community energy under the LORESS program and the 13 MW embedded generation program would be needed to help meet the RPS and therefore would not have an opportunity to be deferred or eliminated with the integration of DSM contained within the Energy Smart NB option Demand and Energy Reduction Assumptions from Energy Smart NB The DSM measures that passed the cost-effective screening, either individually or grouped with similar measures were included in the Energy Smart NB option and offered as an alternative in the PROVIEW optimization. The logical groupings of measures were included within the option according to their nature, operating lives and levelized cost per kw. This was done to reduce the size of the dynamic programming problem within PROVIEW. The total amount of reductions available within the Energy Smart NB option was 621 MW of demand and 2,301 GWh of energy by the end of the study period in 2041/42. Note that these reductions are incremental to the reductions achieved since the 2014 IRP, summarized below: Figure 35: Historical Achieved Energy and Demand Savings FY Ending MW GWh For the integration phase of the analysis, NB Power system planners assumed a 25-year schedule for the Energy Smart NB option made available as an expansion plan alternative. This alternative was made available starting in 2017/18 at the earliest, and was allowed to slide, depending on the most economic timing. This was done for two reasons: to simplify the optimization problem and to avoid over-optimization of imperfect data estimates. The data used in the screening analyses included best estimates of probable impact and penetration. Also, a projected ramp-up schedule is modelled because Energy Smart NB takes time to implement and to reach its targeted reductions. It also requires continuous commitment to ensure its full impact on the generating system is achieved over a span of many years. The following schedule of potential demand and energy reductions was established and made available for integration. The cost to implement Energy Smart NB was estimated from the 78
82 energy efficiency study performed by Dunsky Energy Consulting to develop, implement and administer energy efficiency and demand response programs over the 25-year period, as well as the associated cost to implement NB Power s grid modernization strategy. The total cost of Energy Smart NB was projected to be $1.3 billion on a present value basis over the study period. It was assumed that this cost and the demand and energy reduction potential would continue at a constant level beyond the 25-year program period to represent capital replacement of at least equivalent or greater efficiency. This schedule would then have the flexibility to start anytime during the study period. This configuration was established as outlined in Figure 36. Figure 36: Potential Energy Smart NB reduction schedule Year MW GWh , Integration Minimization Criteria To determine the effect of Energy Smart NB integration on the supply plan analysis, a number of issues were studied. Initially, to examine how the Energy Smart NB compared with the proposed generating units in the supply plan, the dynamic programming module PROVIEW was used to find the least-cost plan in terms of total present value cost. In addition, the least-cost integrated plan was evaluated in terms of average cost of service per kwh or the annual average electricity price required recovering all costs to meet in-province energy requirements. The latter allows for comparison of electricity prices and therefore shows the potential rate impact. 79
83 10.3. Final Integration Results The integration analysis has resulted in the selection of Energy Smart NB early in the study period. The effect on resource requirements is depicted in Figure 37. As expected, this option has deferred the requirement of new capacity. Figure 37: Effect of including Energy Smart NB on the load and resource requirements The resulting least-cost integrated plan is outlined in Figure 38. In this plan, Energy Smart NB is included and selected by the PROVIEW model. The load and resource chart in Figure 37 shows new capacity requirement beginning in 2027, but with Energy Smart NB and with the additional capacity added early in the period to meet the RPS requirement, the need for new capacity to meet the new load now has been deferred to 2030/31. 80
84 Figure 38: Impact of integrating Energy Smart NB with supply options FY Ending Integrated Plan Supply Plan 2018 Energy Smart NB (621 MW) Embedded Generation (13 MW) Embedded Generation (13 MW) 2021 LORESS (80 MW) LORESS (80 MW) 2027 NGCC (412 MW) 2031 Millbank / Ste Rose (3 x 99 MW) Millbank / Ste Rose (4 x 99 MW) Mactaquac Life Achievement Mactaquac Life Achievement 2040 Lepreau Replace-in-kind (660 MW) Total PVRR (2017 $) NPV (2017 $) NGCC (3 x 412 MW) Millbank / Ste Rose (2 x 99 MW) Lepreau Replace-in-kind (660 MW) PUR (175 MW) NGCC (3 x 412 MW) Millbank / Ste Rose (99 MW) $24.6 B $25.7 B $1.1 B The total present value of revenue requirements (PVRR) shown, are expressed in 2017 Canadian dollars and includes all costs (total fuel and purchased power, new and existing OM&A and new and existing capital requirements, as well as total costs for transmission, distribution, products and services, and head office). These costs were captured within the study period as defined between 2017/18 and 2041/42. Inherent in the PVRR are the revenues associated with export sales of electricity and sales associated with products and services (such as water heater rentals and dusk to dawn lighting). In addition, the Integrated Plan includes the investment associated with Energy Smart NB. This is projected to be $1.3 billion on a present value cost basis over the study period. The projected revenues from products and services that are derived from Energy Smart NB are also included within the PVRR of the Integrated Plan. These activities reduce the total revenue requirement over the study period which translates to lowering rates. The Integrated Plan s present value of revenue requirements is approximately 4.5 per cent lower than that of the Supply Plan. This represents a net present value (NPV) of $1.1 billion associated with the introduction of Energy Smart NB and is attributable to the deferral or elimination of partial Millbank / Ste Rose life extension, the firm interconnection purchase and a natural gas combined cycle, replacement fuel and purchased power savings as well as other savings associated with grid modernization. 81
85 Normally the PROVIEW model will select a resource option when there is a need for new capacity or if there is a need for compliance to meet regulations such as the RPS. The model could also advance a resource option based on economics. The PROVIEW model had the option to add potentially lower cost energy resource options such as a wind energy project as part of the Integrated Plan but chose not to include this option. This option was not cost effective in the Integrated Plan and also not needed to meet the RPS requirement. The GHG emissions associated with the Integrated Plan is provided in Figure 39 and is compared to historical emissions to serve in-province load. Figure 39: In-province GHG emissions of the Integrated Plan, compared to actual emissions Historical GHG Emissions (Mt) Projected Calendar Year The emissions from the Integrated Plan remain below the 2005 levels and well below long-term historical levels seen in the decade starting in The emissions shown are associated with serving in-province load as well as emissions attributable to interconnection sales. The emissions associated with natural gas purchased power are also included in the above chart. The projected emissions starting in 2017 vary slightly on a two-year interval because of the Point Lepreau maintenance outages that occur every second year. The projected emission profile is based on current greenhouse regulation and assumes a cap of 4 Mt over the planning period. Current greenhouse gas regulations are related to coal-fired electricity generation adopted under the Canadian Environmental Protection Act (CEPA), 1999 and apply a performance standard to new coal-fired electricity generation units, and units that have reached the end of their useful life which is defined as 50 years. 82
86 In this IRP, NB Power s only coal facility located at Belledune is assumed to be retired in Although any further regulation related to future greenhouse gas regulation will be included in the next IRP, NB Power has captured the impact of several potential greenhouse regulation scenarios being considered by government. These are presented in Section 10.4 (Sensitivity Analysis) of this report. NB Power has built its system with consideration of fuel diversity to help reduce the risk and potential exposure to future fuel price fluctuations. In the future, new renewable resources along with the Energy Smart NB plan will improve this diversity and continue to provide continued mitigation to this risk. Exposure to GHG risk is also reduced since non-emitting resources approach 75% by 2020/21. Figure 40: Generation Mix 40% RPS Target 75% non-emitting 2020/21 Forecast 2017/18 Forecast 2016/17 Actuals 0% 20% 40% 60% 80% 100% Renewable Imports Bio-Fuels Wind Hydro Nuclear Emitting 83
87 10.4. Sensitivity Analysis Under the base assumptions, the integrated plan is the most economic. However, in order to assess the robustness of the Integrated Plan, it must be tested under varying key assumptions. The integrated expansion plan must not only be lowest cost for a single estimate of future conditions, but must be flexible by responding well to changes in major input assumptions. Robustness is the measure of the integrated plan s ability to remain the least-cost plan under changing conditions. The sensitivity analysis in this study involved re-optimization of supply options under changes to major input assumptions related to the given sensitivity. This process allowed supply options to compete once again, and allowed them to be replaced, deferred, advanced or removed in response to the changing conditions. In general terms, sensitivity analyses investigate the effects of uncertainty on a study or model. Within the context of this IRP, sensitivity analyses determine the robustness of the integrated plan by identifying what source of uncertainty weighs more on the study's conclusions. In most IRP studies, changes from the base assumptions are simply formulated as what if analyses, testing important input assumptions with high and low scenarios. In some instances, Monte Carlo simulation studies are then undertaken to address the issue of the likelihood of a critical input parameter occurring. However, this assumes that the probability distribution of the parameter is well behaved. Few parameters in finance or economics have well-defined probability distributions. This is especially true for parameters related to energy production and prices. In addition, full Monte Carlo simulations require intensive computation resources, compounding with each additional sensitivity parameter, leading to hundreds of simulation runs. For these reasons, this analysis has applied a knowledge-based approach where all quantifiable information is assembled and synthesized to form a reasonable upper and lower bounds of the critical parameter. The notable shortcomings of this type of analysis are the interactive effects of varying different parameters. Therefore, stress cases were developed that vary groups of input parameters that are linked under plausible future scenarios. The critical supply parameters that have the most relevance in this IRP are: Capital costs Fuel prices Load forecast GHG regulation and prices, and Stress case evaluation The key output of the scenario evaluation is the least-cost expansion plan. The sensitivities and scenarios aim to test the limits of the integrated plan to ensure that it is robust and remains the least cost plan over a wide range of possible assumptions. Certain expansion plan items are 84
88 included as base assumptions and therefore are outside the scope of the sensitivity analysis. These include Embedded Generation, LORESS and Mactaquac Life Achievement Capital Costs There are many factors that influence capital-related costs of projects. This study has isolated three key areas that influence NB Power: direct capital cost risk construction price escalation, and financing rates Direct Capital Cost Risk As with any capital project, there are risks of capital cost overruns. Power plant costs are relatively well defined because many times the components are large and often built offsite by the manufacturer. These component manufacturers are very competitive, and fixed-price contracts are normally specified. Therefore, a range of ±25 per cent was considered. Figure 41 provides the result of this sensitivity applied to the integrated plan. Figure 41: Cost summary of capital cost risks Integrated Plan All Capital +25% All Capital -25% PVRR ($2017) $ 24.6 B $ 24.9 B $ 24.3 B Additional Cost from Integrated Plan Average Annual GHG Emissions $ 0.3 B -$ 0.3 B 3.5 Mt 3.5 Mt 3.4 Mt In the All Capital +25 per cent sensitivity, the least-cost expansion plan aligns closely with the integrated plan. The key difference that one of the more capital intensive units (NGCC) is replaced with combustion turbines, having lower capital costs. In the All Capital -25 per cent sensitivity, some capital intensive, low fuel cost options become economic choices. A wind farm of 200 MW is included in 2031, as well as Grand Falls Expansion in 2040/41. The detailed expansion plans are included in Appendix 6 (Sensitivity Analysis Expansion Plans). Financing Rates The weighted average cost of capital (WACC) in the private sector has been assumed in this study at approximately 7.13 per cent, while the WACC assumed for public sector development in New Brunswick is 5.9 per cent (this rate was applied throughout this report). The cost of 85
89 capital in the public sector is lower due to government backing. Applying the higher WACC rate would increase the cost of all supply options. For additional information, refer to Section (Private Versus Public Financing). Figure 42 shows the effect of applying the private financing rates. Figure 42: Results for private financing sensitivity Integrated Plan Private Financing (WACC = 7.13 %) PVRR ($2017) $ 24.6 B $ 24.7 B Additional Cost from Integrated Plan Average Annual GHG Emissions $ 0.1 B 3.5 Mt 3.5 Mt The integrated plan remains the least-cost expansion plan under this sensitivity. The detailed expansion plan is included in Appendix 6 (Sensitivity Analysis Expansion Plans). Construction Price Escalation Some of NB Power s existing generating facilities will come to their end-of-life dates during the period of this study. Significant capital construction will be required to replace the aging infrastructure. The Handy-Whitman Index of Public Utility Construction Costs has been published regularly for over 90 years. The Handy-Whitman Index is commonly used in this industry to reflect costs for capital construction. The index is projected to escalate at 3.6 per cent per year, for thermal units and 3.2 per cent per year for hydro facilitates based on Figure
90 Figure 43: Handy-Whitman Index (1973 = 100) 19 See Section (The Construction Price Escalation) for additional information. The handy- Whitman Index is created using past history and is a reasonable cost projection for mature technologies. Some newer technologies have not fully matured and could stray from the benchmark 3.6 per cent. The levelized cost of wind projects has not grown at the same rate in recent years due to technological advances allowing the achievement of higher capacity factors. Figure 44 shows the effects of construction price escalation of 2 per cent per year for wind technologies. Figure 44: Results for low wind escalation sensitivity Integrated Plan Low Wind Escalation PVRR ($2017) $ 24.6 B $ 24.6 B Additional Cost from Integrated Plan Average Annual GHG Emissions $ 0.0 B 3.5 Mt 3.4 Mt 19 Cost Trends of Electric Utility Construction North Atlantic Region Handy-Whitman Bulletin No. 183 (2016). 87
91 The results show that if wind capital costs were to escalate at a lower than average rate, it becomes economic to install 600 MW in 2040/41, offsetting the need to build a natural gas combined cycle unit. The cost impact during the study period is minimal, and there is a slight decrease in GHG emissions. The expansion plan for the low wind escalation sensitivity is included in Appendix 6 (Sensitivity Analysis Expansion Plans). The integrated plan demonstrates its robustness against capital-related changes with very little variation in costs. The least-cost plan for the low capital sensitivity calls for new wind generation to be built in 2030/31. It will be important that NB Power continually evaluate the cost of wind generation as it compares to fuel and purchased power costs from the existing system especially as the requirement for new capacity approaches Fuel Prices Fuel is one of NB Power s largest expenses. The industry has experienced extreme volatility in fuel prices in recent years. Any long-term plan must address the risk of the cost of the fuels that will be used. Nuclear The price of nuclear fuel has historically remained stable and lower than fossil fuel prices. There is no indication that this will change. Therefore, a sensitivity of the fuel price of nuclear was not considered necessary. Heavy & Light Fuel Oil Heavy fuel oil (HFO) is utilized at NB Power s Coleson Cove Generating Station. However, the utilization of heavy fuel oil is relatively low due to high prices and relatively high heat rates (low thermal efficiency) of current and new, oil-fired thermal plants. Light fuel oil (LFO) is used at existing combustion turbine plants (Millbank, Ste Rose and Grand Manan). The utilization is also very low due to high fuel cost and high heat rates of the combustion turbine units. Typically they would only run for system stability or during contingencies. Therefore, oil is not considered to be an economic option for electricity generation in the future. Coal Coal is a relatively low-cost fuel used at NB Power s existing generation asset located in Belledune. Because of the relatively low price, there is little room for downward coal price movement. Also, when considering the associated GHG issues, price increases are unlikely. Due to new regulations regarding coal, no new coal plants were considered in this study. Therefore, a sensitivity of the fuel price of coal was not considered necessary. It is expected that the sensitivities around GHG management strategies will have a large impact on existing coal generation. 88
92 Natural Gas Natural gas is a premium fuel that is expected to be abundantly available into the future. Compared to other fuels such as nuclear and oil, natural gas has a high level of public acceptance. In the future, it is expected that natural gas will be the fuel of choice for electricity production as society transitions to a reduced GHG world. There is a strong correlation between the price of natural gas and the market price of electricity. This leads to the conclusion that the sensitivity analyses for natural gas prices and the market price of electricity should not be done in isolation. Therefore, sensitivities of +25 and -25 per cent were applied to natural gas and electricity market prices concurrently for this study. Figure 45: Results for natural gas and market price sensitivities Integrated Plan Gas and Market Prices +25% Gas and Market Prices -25% PVRR ($2017) $ 24.6 B $ 24.8 B $ 24.3 B Additional Cost from Integrated Plan Average Annual GHG Emissions $ 0.2 B -$ 0.3 B 3.5 Mt 3.7 Mt 2.9 Mt The high gas and high market price sensitivity results in the least-cost plan that includes two high capital, low fuel price technologies. 200 MW of wind is installed in 2030/31 and a 100 MW expansion to Grand Falls Hydro station is included in 2040/41. Increased prices for low emission electricity sources (market, natural gas) results in increased utilization of higher emitting coal and oil fired stations. Any emission reduction that would have been gained by the addition of renewables is more than offset by increases in generation from higher emitting fuels. The integrated plan remains the least-cost expansion plan under the low gas and low market price sensitivity. The plan relies heavily on market purchases and natural gas generation, so this scenario has the impact of lowering the costs. Additionally, the emissions are reduced as generation from the lower emission electricity sources (market and natural gas) increases, while generation from heavy fuel oil and coal decreases. Detailed expansion plans are included in Appendix 6 (Sensitivity Analysis Expansion Plans). Foreign Exchange Rates Most fuels purchased by NB Power are priced based on the US market, and therefore priced in US dollars (USD). The exchange rate between the Canadian dollar (CAD) and the USD is a major risk for NB Power. The integrated plan assumes a long-term exchange rate of 1.18 USD/CAD (i.e. 1USD = 1.18CAD). The historical foreign exchange rate (FOREX) is shown in Figure
93 Figure 46: 10-year historical foreign exchange rate and forecasts USD/CAD Exchange Rate USD/CAD 1.00 USD/CAD 0.50 The foreign exchange rate affects not only fuel prices, but also electricity market prices. Therefore, this sensitivity was applied to all fuels and all market-based transactions. The results are summarized below in Figure 47. Figure 47: Cost summary of foreign exchange sensitivities Integrated Plan FOREX +15% (USD/CAD) FOREX -15% (USD/CAD) PVRR ($2017) $ 24.6 B $ 25.3 B $ 23.9 B Additional Cost from Integrated Plan Average Annual GHG Emissions $ 0.7 B -$ 0.7 B 3.5 Mt 3.4 Mt 3.5 Mt The increased foreign exchange sensitivity results in the least-cost plan that includes two high capital, low fuel price technologies. 200 MW of wind is installed in 2030/31 and a 100 MW expansion to Grand Falls is included in 2040/41. Under the low foreign exchange sensitivity, the least cost plan is very close to the integrated plan. Detailed expansion plans are included in Appendix 6 (Sensitivity Analysis Expansion Plans). 90
94 The integrated plan demonstrates its robustness against fuel-related changes with little variation in cost and no significant changes to the expansion plan in the near term. The leastcost plans for the scenarios with higher fuel and market prices built 200 MW of wind generation in 2030/31. It will be important that NB Power continually evaluate the cost of wind generation as it compares to fuel and purchased power costs from the existing system in the future Load Sensitivities Load Forecast This study has used the most recent NB Power load forecast completed in August A 95 per cent confidence interval was used for the high and low forecasts, based on statistical analyses of historical and future trends. Figures 48 and 49 illustrate the impact on electricity requirements in New Brunswick. These charts also show historic load within New Brunswick. Figure 48: Changes to energy forecast (before Energy Smart NB reductions) Provincial Energy Requirements (GWh) 20,000 15,000 10,000 5,000 0 History High Load Forecast Low Load Forecast 91
95 Figure 49: Changes to peak demand forecast (before Energy Smart NB reductions) Peak Hour Demand Forecast (MW) 4,000 3,000 2,000 1,000 History High Load Forecast Low Load Forecast 0 Figure 50: Cost summary of load forecast sensitivities Integrated Plan High Load Forecast Low Load Forecast PVRR ($2017) $ 24.6 B $ 26.4 B $ 23.2 B Additional Cost from Integrated Plan Average Annual GHG Emissions $ 1.8 B -$ 1.4 B 3.5 Mt 3.7 Mt 2.8 Mt In all load forecast sensitivity plans, the options chosen are similar. The additional load requirement under the high load forecast advances the refurbishment of the remainder of the Millbank / Ste Rose units in 2030/31 and builds two additional combustion turbine units in 2040/41. The low forecast sensitivity builds one fewer natural gas combined cycle plant. Expansion plans are included in Appendix 6 (Sensitivity Analysis Expansion Plans). Overall, the least-cost plan is not sensitive to load changes in the short-to-medium horizon. 92
96 Energy Efficiency NB Power received three energy efficiency scenarios from Dunsky Consulting Ltd. The base scenario achieved a similar level of energy efficiency to what NB Power was previously targeting. Figure 51: Cost summary of energy efficiency sensitivities Integrated Plan High Energy Efficiency Extreme Energy Efficiency PVRR ($2017) $ 24.6 B $ 24.4 B $ 24.7 B Additional Cost from Integrated Plan Average Annual GHG Emissions -$ 0.2 B $ 0.1 B 3.5 Mt 3.2 Mt 3.1 Mt Traditionally, the energy efficiency programs rely on passing benefit-cost ratio tests. The energy efficiency programs that are over and above the base amount included in the integrated plan have significantly reduced benefit-cost ratios. This means that there is diminishing value associated with increased efficiency programs above the baseline amount. In the extreme energy efficiency sensitivity, there is no payback for the programs, and the net benefit is negative. Figure 52: Energy Smart NB and efficiency program net benefits Cost ($2017 PV) Gross Benefits ($2017 PV) Net Benefits ($2017 NPV) Base Energy Smart NB Plan Incremental Plan (High Sensitivity) Incremental Plan (Extreme Sensitivity) $ 1.3 B $ 0.8 B $ 1.6 B $ 2.4 B $ 1.0 B $ 1.5 B $ 1.1 B $ 0.2 B $-0.1 B The inclusion of additional energy efficiency programs is not deemed to be prudent at this time because of increased risk associated with high cost and low return of the programs. NB Power will continue to evaluate energy and demand reduction targets and set goals in the three year DSM plan that are flexible and can be adjusted over time. Detailed expansion plans are included in Appendix 6 (Sensitivity Analysis Expansion Plans). 93
97 Solar PV Projections The electricity sector is transforming as the availability of new customer options becomes available. One of the most significant impacts of this transformation in the future is the option for customers to own their generation. NB Power has evaluated a medium and high scenario for solar penetration based on forecasts received from Dunsky Energy Consulting Ltd. Both scenarios assume no change to the current net metering policy. Figure 53: Solar projections from Dunsky Energy Consulting Ltd. 500 Installed Solar PV (MW) High Projection Medium Projection Included in Load Forecast Figure 54: Cost summary of solar PV sensitivities Integrated Plan Medium Solar Penetration High Solar Penetration PVRR ($2017) $ 24.6 B $ 24.5 B $ 24.4 B Additional Cost from Integrated Plan Average Annual GHG Emissions -$ 0.1 B -$ 0.2 B 3.5 Mt 3.4 Mt 3.4 Mt The costs are not impacted significantly by the installation of customer owned solar PV. There is, however, a decrease to energy sales revenue which is higher than the decrease to the system cost. What this means is that the current net-metering program is not sending the correct price signal to customers looking for alternative electricity choices, and that large penetrations of solar PV will result in higher costs being borne by customers without solar PV. It will be important that NB Power continue to monitor this trend and evaluate the appropriate business model that provides appropriate price signals to customers. There were no significant changes to the least-cost expansion plan for the solar PV sensitivities. Detailed expansion plans are included in Appendix 6 (Sensitivity Analysis Expansion Plans). 94
98 GHG Regulation and Prices As indicated in Section 5.5 (Environmental and Sustainability Considerations), the possible GHG regulation remains very complex with many uncertainties. This study has assumed standard performance metrics for existing and new fossil units, to which various carbon regimes were then applied. The variability of carbon prices in existing markets and current studies are significant. Because of the risk associated with carbon prices and uncertainty with respect to allocation, three GHG management sensitivities were examined. The first two were simply caps for the entire electricity sector at 3.0 Mt and 2.5 Mt. The third includes a price on carbon as well as coal phase out as outlined by the federal government. Carbon Cap In lieu of a carbon price, a carbon cap was applied to system wide emissions. It was assumed that Belledune would be retired and coal phased out by The results are shown below. Figure 55: Cost summary of varying CO2 Cap levels Integrated Plan CO2 Cap: 3.0 Mt CO2 Cap: 2.5 Mt PVRR ($2017) $ 24.6 B $ 25.1 B $ 25.4 B Additional Cost from Integrated Plan Average Annual GHG Emissions $ 0.5 B $ 0.8 B 3.5 Mt 2.9 Mt 2.4 Mt As shown in Appendix 6 (Sensitivity Analysis Expansion Plans), the integrated plan remains robust against the 3.0 Mt cap level but to achieve the lower cap level of 2.5 Mt, new renewable resources must be added which increases the present value of revenue requirements by about 3 per cent versus the integrated plan. Federal GHG Regulation The federal government is contemplating two new rules related to greenhouse gas emissions. The first is to impose a carbon price starting at $10/tonne in 2018, ramping up to $50/tonne in This would be consistent with imposing a carbon tax. The second rule imposed would be to phase out coal by For purposes of this sensitivity, it is assumed that both of these standards come into effect. 95
99 Figure 56: Cost summary of the Federal GHG regulation sensitivity Integrated Plan Federal GHG Regulation PVRR ($2017) $ 24.6 B $ 27.1 B Additional Cost from Integrated Plan Average Annual GHG Emissions $ 2.5 B 3.5 Mt 2.5 Mt The costs resulting from the federal GHG regulation are high for the amount of emission reduction achieved. The average emissions are similar to those achieved in the 2.5 Mt cap sensitivity above, but the additional costs are tripled in comparison. There is also a potential cascading effect through the potential loss of industrial and commercial load as costs for compliance could be transferred to these customers. This sensitivity highlights the need for a made-in-new Brunswick GHG management strategy.. In this sensitivity, the least-cost plan requires new capacity in 2031 to replace the loss of Belledune. Much of this capacity is renewable based. Detailed expansion plans are included in Appendix 6 (Sensitivity Analysis Expansion Plans). The Government of New Brunswick is working with NB Power and the federal government to develop a made-in-new Brunswick GHG management strategy and to explore all options to minimize the cost to New Brunswickers. As the direction on the carbon strategy for New Brunswick becomes clearer, NB Power will review the necessity to refresh this IRP Scenario Evaluation The sensitivity analysis thus far has evaluated the robustness of the Reference Plan under a wide range of changing conditions on an individual and isolated basis. Further analysis was also performed using multiple sensitivities combined to once again determine the robustness of the Integrated Plan. Two different scenarios were developed. The first assumed that government policy and social pressures would result in increased electrification of the economy and limits on GHG emissions. This would have the effect of increasing load, increasing solar PV penetration and driving up demand (and price) for electricity and natural gas. A second scenario was developed that reflected a global recession case, where low cost energy was given priority, and environmental restrictions and regulations were relaxed. This scenario would result in lower load as well as decreased demand (and price) for natural gas and electricity. These scenarios and corresponding assumptions are summarized in Figure
100 Figure 57: Scenario analysis assumptions Scenario 1: High Electrification Scenario 2: Global Recession Load Forecast High Low Energy Efficiency No change No change Solar Penetration High No change Natural Gas Prices + 25 % - 25 % Market Prices + 25 % - 25 % Carbon Prices No change No change Carbon Cap 3.0 Mt No change Figure 58: Cost to the Integrated Plan associated with various scenarios Integrated Plan Low Emission / High Electrification Global Recession PVRR ($2017) $ 24.6 B $ 27.1 B $ 22.8 B Additional Cost from Integrated Plan Average Annual GHG Emissions $ 2.5 B -$ 1.8 B 3.5 Mt 2.9 Mt 2.4 Mt Under the high electrification case, the expansion plan includes a significant increase in renewable development. A 100 MW hydro unit at Grand Falls is installed in 2022/23 as well as 200 MW of wind installed in both 2020/21 and 2030/31. This is due to high fuel and market prices as well as GHG limits. In the global recession scenario case, the only major deviation from the integrated plan is that one fewer natural gas combined cycle unit is required in 2040/41. Detailed expansion plans are included in Appendix 6 (Sensitivity Analysis Expansion Plans). 97
101 11. CONCLUSION The results of this IRP study provide information regarding the strategic course of action that NB Power should consider to meet its future resource needs. The following statements reflect the IRP results: 1. New capacity will not be required until 2027 or later. 2. The most cost-effective future resource mix is composed of renewable resources in the initial period to meet the RPS requirement, with continued emphasis on Energy Smart NB. 3. The peaking resources can be provided most economically with a combination of the Energy Smart NB program, peak interconnection purchases and combustion turbines. 4. The amount of cost-effective capacity and energy reductions associated with the Energy Smart NB plan is projected to be 59 MW and 215 GWh respectively by 2019/20, and grows to 621 MW and 2,301 GWh by 2041/ The Energy Smart NB plan results in a $1.1 billion net decrease to the present value of NB Power s revenue requirements over the planning period. 6. In order to achieve sufficient Energy Smart NB capacity to avoid construction of new combustion turbines, the current Energy Smart NB plan schedule should continue with increasing effort over the long-term. 7. GHG levels to meet in-province load remain below the 2005 historical levels. 8. Base and intermediate load requirements required to meet the expiration of existing natural gas power purchase agreements are most economically achieved by new renewables and Energy Smart NB. 9. Millbank and Ste. Rose life extension is the most economic choice for continued peak load requirements after the current retirement date. 10. Mactaquac Generating Station continued operation is reflected through life achievement. 11. Continued examination of new and innovative technologies and business models will be necessary to ensure the latest information and customer options are available, and to ensure a diverse mix of generation in the long term. 12. Energy Smart NB will help reduce exposure to changes in future assumptions. In summary, the strategic direction recommended over the immediate term is: Continued development of the Locally-owned Renewable Energy Projects that are Small Scale (LORESS) and Embedded Generation Programs to meet the RPS; Continuation of Energy Smart NB plan with increased development in the long-term; and Continuation of technical work with regards to new generation options and business models that might be viable in New Brunswick, especially options from customer owned renewable resources. 98
102 12. APPENDICES Appendix 1: IRP Public Engagement Program- What Was Said Final Report Appendix 2: List of assumptions for IRP Appendix 3: Fuel and Market Price Forecast Reference Case Appendix 4: Supply Options Appendix 5: Project and Operating Cost Parameters Appendix 6: Sensitivity Analysis Expansion Plans Appendix 7: Glossary and Abbreviations 99

103 Appendix 1: IRP Public Engagement Program - What Was Said Final Report 100
104 101

105 102
106 103

107 104
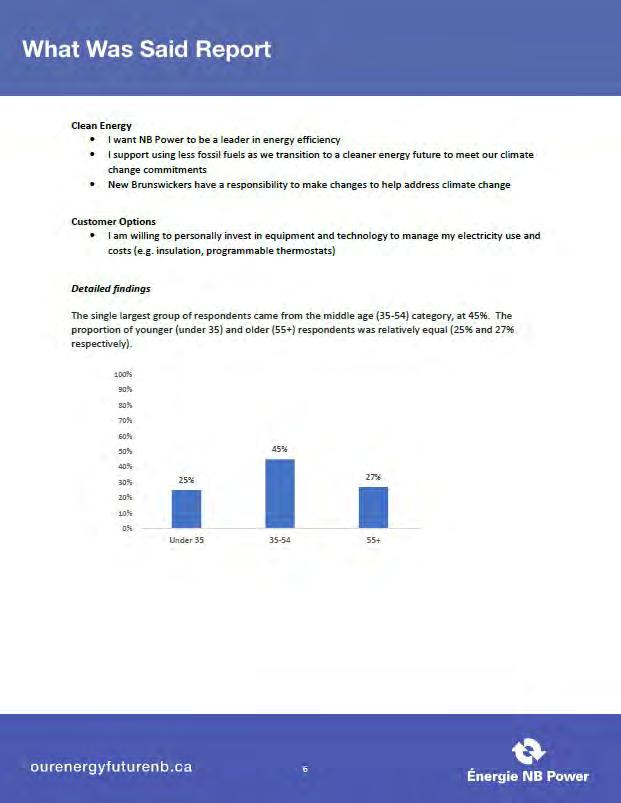
108 105
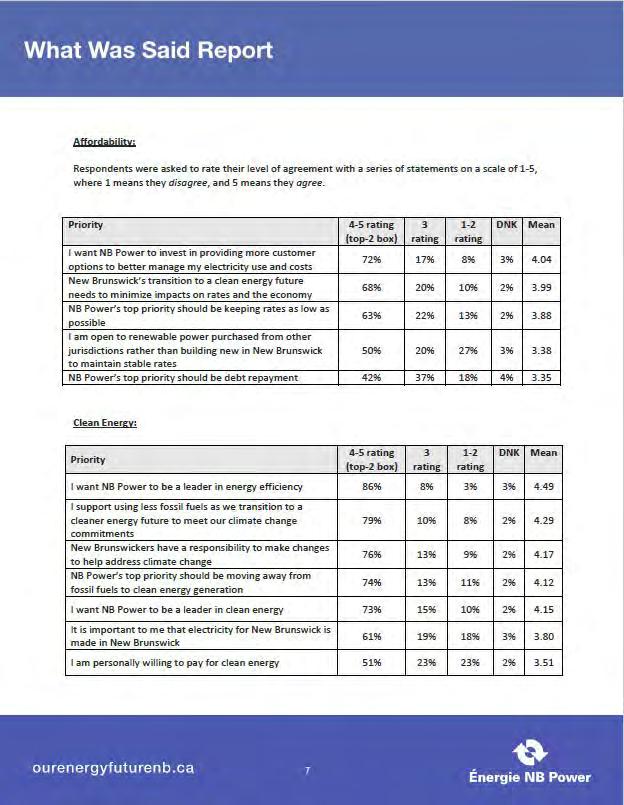
109 106

110 107
111 108
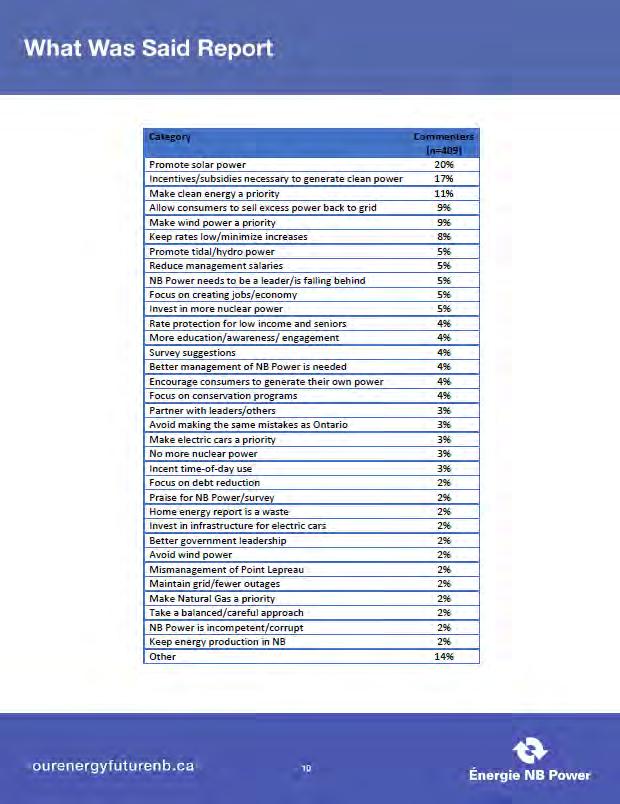
112 109
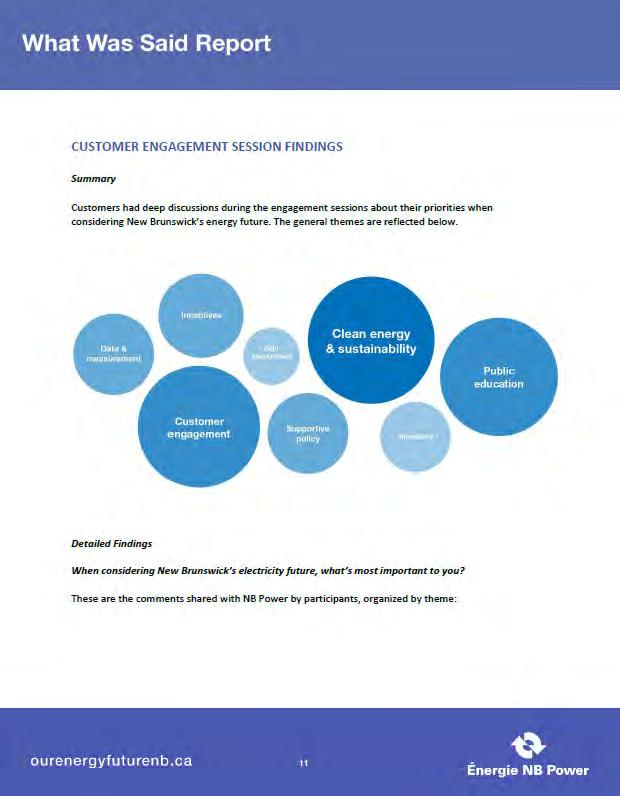
113 110
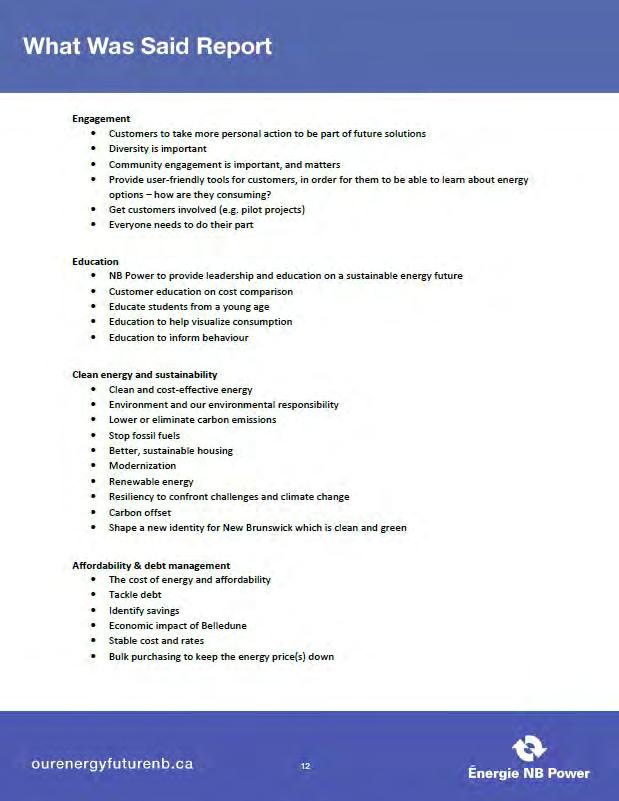
114 111
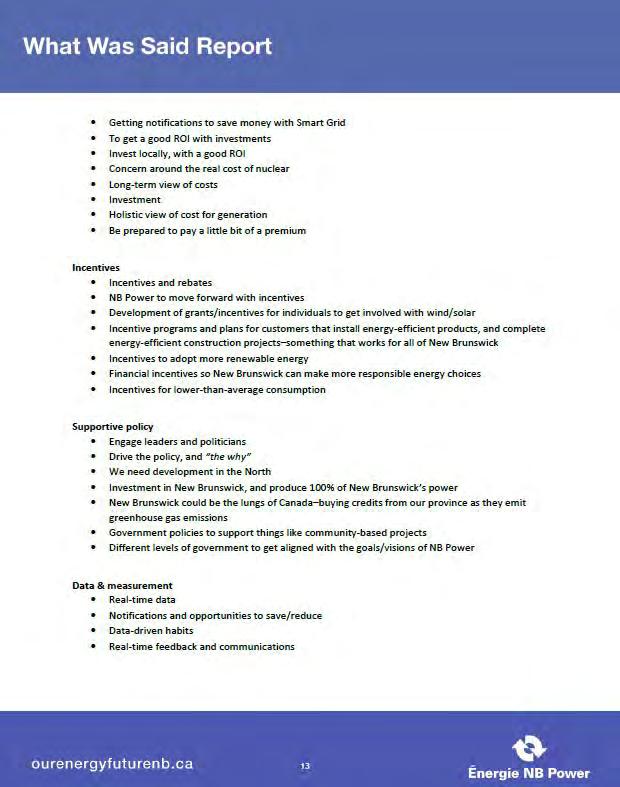
115 112
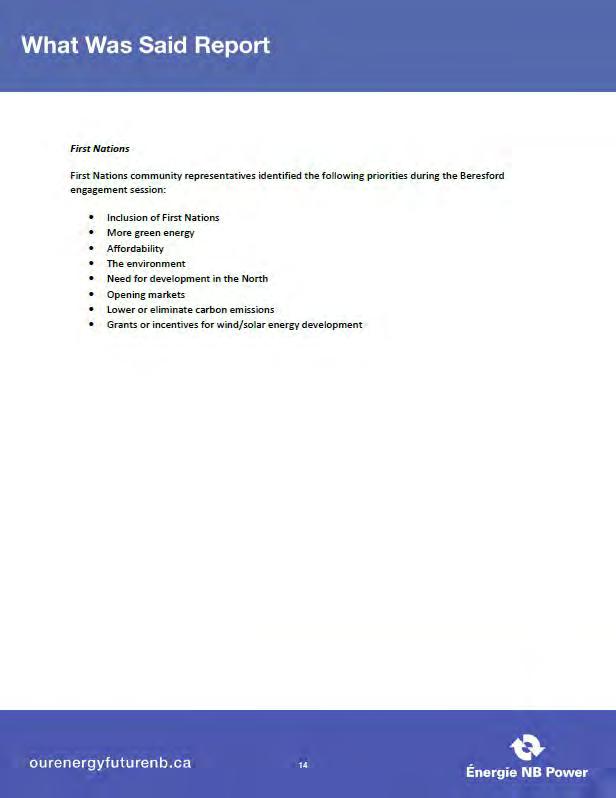
116 113

117 114
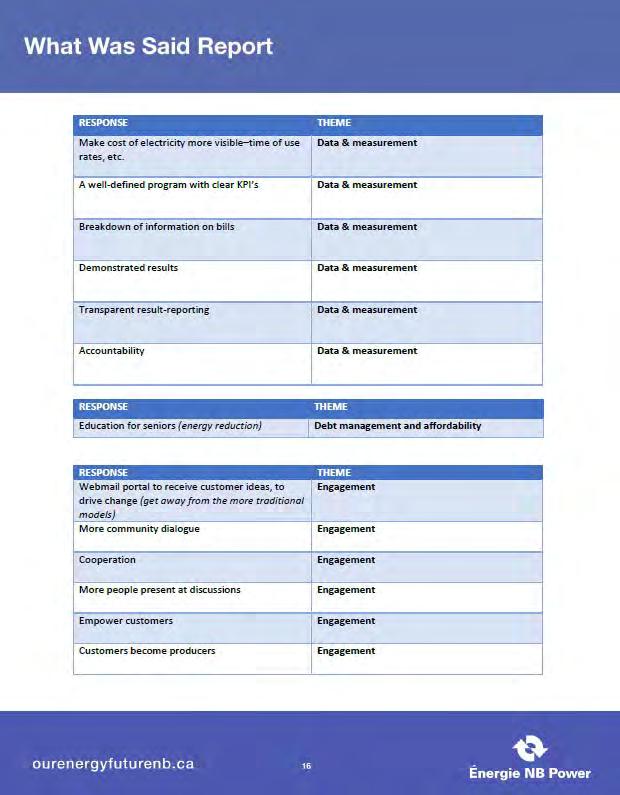
118 115
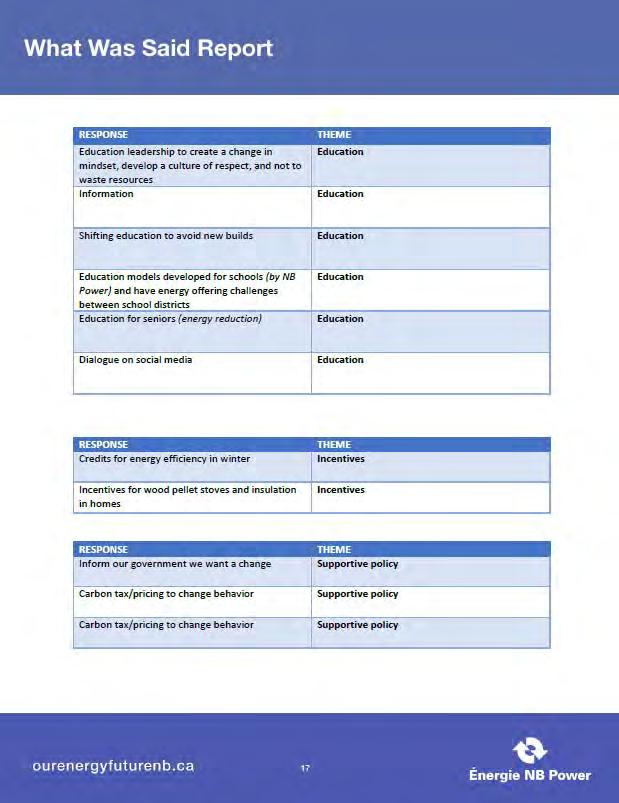
119 116
NB Power s 10-Year Plan Fiscal Years 2016 to 2025
 1 NB Power s 10-Year Plan Fiscal Years 2016 to 2025 Contents Highlights... 3 Corporate Overview... 4 Corporate Strategy... 5 Integrated Resource Plan... 7 10-Year Revenue Requirement... 9 In-Province Load...
ELECTRICITY TRADE AGREEMENT. An Assessment of the Ontario-Quebec Electricity Trade Agreement
 ELECTRICITY TRADE AGREEMENT An Assessment of the Ontario-Quebec Electricity Trade Agreement Spring 2018 About this Document Established by the Financial Accountability Officer Act, 2013, the Financial
the nineteen nineties and beyond
 This year marks the 70th anniversary of. There have been many changes in the utility over 70 years and there have been just as many changes in public expectations about s role in providing a service vital
NPCC MARITIMES AREA TRIENNIAL REVIEW OF RESOURCE ADEQUACY
 NPCC MARITIMES AREA TRIENNIAL REVIEW OF RESOURCE ADEQUACY NOVA SCOTIA POWER INCORPORATED NEW BRUNSWICK POWER CORPORATION MARITIME ELECTRIC COMPANY LIMITED December Maritimes Area Triennial Review of Resource
at BC Hydro Presentation to PNUCC Randy Reimann, Director of Energy Planning
 Integrated t Resource Planning at BC Hydro Presentation to PNUCC Randy Reimann, Director of Energy Planning Today s agenda 1. Our system 2. Integrated Resource Plan 3. Looking forward Our system Generation
Considering the future of MACTAQUAC
 A discussion paper from the utility s perspective Considering the future of MACTAQUAC March 2016 Table of Contents 01 02 04 06 08 10 19 22 23 25 Message from the CEO Introduction Overview History Public
CHAPTER 3: RESOURCE STRATEGY
 Seventh Northwest Conservation and Electric Power Plan CHAPTER 3: RESOURCE STRATEGY Contents Key Findings... 3 A Resource Strategy for the Region... 3 Summary... 3 Scenario Analysis The Basis of the Resource
Saint John Energy A Vision for the Future
 Saint John Energy A Vision for the Future October 16 th, 2017 Building a sustainable growth model while continuing to address evolving customer needs, transformative technologies and new government legislation
Presentation to the New Brunswick Energy Commission
 Presentation to the New Brunswick Energy Commission Eric J. Marr, P.Eng. 2011-02-17 Presentation to the NB Energy Commission February 17, 2011 Saint John, N.B. Good afternoon, My name is Eric Marr, President
2018 Integrated Resource Plan Executive Summary
 2018 Integrated Resource Plan Executive Summary At NIPSCO, we re proud that our work provides the energy that northern Indiana families and businesses rely on to power their daily lives. We work each day
21,363 MW 22,774 MW ONTARIO ENERGY REPORT Q JULY SEPT 2014 ELECTRICITY. Electricity Highlights Third Quarter Ontario s Power Grid
 ONTARIO ENERGY REPORT Q3 Y T ELECTRICITY Electricity Highlights Third Quarter Electricity Generation Output by Fuel Type (Q3) Nuclear Ontario Peak Demand (Q3) 21,363 MW 25.0 TWh 65.7% Hydro 8.8 TWh 23.1%
SOLUTIONS. New Clear Free
 New Clear Free SOLUTIONS The purpose of New Clear Free Solutions is to: provide energy oversight to the public and official decision makers using objective scientific, regulatory and financial information.
Energy : Expanding Clean Energy and Energy Efficiency Manitoba Helping the World
 Energy : Expanding Clean Energy and Energy Efficiency Manitoba Helping the World 16 Manitoba is fortunate to have access to many sources of renewable energy. Our provincial greenhouse gas (GHG) emissions
NPCC 2016 MARITIMES AREA COMPREHENSIVE REVIEW OF RESOURCE ADEQUACY Approved by RCC December 6, 2016
 NPCC 2016 MARITIMES AREA COMPREHENSIVE REVIEW OF RESOURCE ADEQUACY Approved by RCC December 6, 2016 NEW BRUNSWICK POWER CORP. NOVA SCOTIA POWER INCORPORATED MARITIME ELECTRIC COMPANY, LIMITED NORTHERN
NPCC 2018 MARITIMES AREA INTERIM REVIEW OF RESOURCE ADEQUACY. Approved by RCC December 4, 2018
 NPCC 2018 MARITIMES AREA INTERIM REVIEW OF RESOURCE ADEQUACY Approved by RCC December 4, 2018 NEW BRUNSWICK POWER CORP. NOVA SCOTIA POWER INC. MARITIME ELECTRIC COMPANY, LIMITED NORTHERN MAINE ISA, INC.
NPCC 2010 MARITIMES AREA COMPREHENSIVE REVIEW OF RESOURCE ADEQUACY
 NPCC 2010 MARITIMES AREA COMPREHENSIVE REVIEW OF RESOURCE ADEQUACY NEW BRUNSWICK SYSTEM OPERATOR NOVA SCOTIA POWER INCORPORATED MARITIME ELECTRIC COMPANY, LIMITED NORTHERN MAINE ISA, INC. August 2010 2010
2009 Power Smart Plan
 2009 Power Smart Plan July 2009 *Manitoba Hydro is a licensee of the Official Mark Executive Summary The 2009 Power Smart Plan forecasts Manitoba Hydro s costs and savings to the benchmark year of 2024/25
TasNetworks Transformation Roadmap 2025
 DRAFT TasNetworks Transformation Roadmap 2025 JUNE 2017 Trusted by our customers to deliver today and create a better tomorrow 2 TasNetworks Transformation Roadmap 2025 June 2017 Purpose We deliver electricity
SRP RESOURCES AND STEWARDSHIP FOR A SUSTAINABLE FUTURE FISCAL YEAR 2010
 SRP RESOURCES AND STEWARDSHIP FOR A SUSTAINABLE FUTURE FISCAL YEAR 2010 WHO WE ARE Serving central Arizona since 1903, SRP (Salt River Project) was created through provisions of the National Reclamation
NPCC 2013 MARITIMES AREA COMPREHENSIVE REVIEW OF RESOURCE ADEQUACY
 Approved by the RCC December 3, 2013 NPCC 2013 MARITIMES AREA COMPREHENSIVE REVIEW OF RESOURCE ADEQUACY NEW BRUNSWICK SYSTEM OPERATOR NOVA SCOTIA POWER INCORPORATED MARITIME ELECTRIC COMPANY, LIMITED NORTHERN
This analysis was prepared by Matt Gurnham under the direction of Peter Harrison and Jeffrey Novak.
 Nuclear Refurbishment An Assessment of the Financial Risks of the Nuclear Refurbishment Plan Fall 2017 About this Document Established by the Financial Accountability Officer Act, 2013, the Financial Accountability
Electricity Supply. Monthly Energy Grid Output by Fuel Type (MWh)
") For the first quarter of 2015, Ontario experienced overall demand that was typical for the province in winter, and strong generator output. Demand for Ontario electricity increased as a result of cold
For the first quarter of 2015, Ontario experienced overall demand that was typical for the province in winter, and strong generator output. Demand for Ontario electricity increased as a result of cold
SETTING THE CONTEXT. Overview: Nova Scotia s Electricity System
 SETTING THE CONTEXT Overview: Nova Scotia s Electricity System In Nova Scotia, most electricity is supplied by the public utility, Nova Scotia Power Inc. (NSPI). Nova Scotia has a vertically integrated
Carbon Pricing Plan. Prince Edward Island submission to Environment and Climate Change Canada on Carbon Pricing
 Carbon Pricing Plan Prince Edward Island submission to Environment and Climate Change Canada on Carbon Pricing September 2018 A large part of our efforts will be to engage Islanders directly in reducing
NEW BRUNSWICK ENERGY COMMISSION
 COMMISSION DE L ÉNERGIE DU NOUVEAU-BRUNSWICK Rapport final Commission de l énergie du Nouveau-Brunswick 2010-2011 Jeannot Volpé Bill Thompson Jeannot Volpé William M. Thompson New Brunswick Energy Commission
Greenhouse Gas Emissions. Climate Change: Taking Action for the Future
 Greenhouse Gas Emissions Climate Change: Taking Action for the Future The energy industry across the United States is undergoing a major transformation by seeking lower-carbon energy sources while meeting
1. Executive Summary Ameren Missouri
 Ameren Missouri Ameren's Energy Vision for the Future Ameren's vision is "Leading the Way to a Secure Energy Future," and its mission is "To Power the Quality of Life." At the center of that vision and
Reducing GHG Emissions in Canada: A Formidable Challenge
 Reducing GHG Emissions in Canada: A Formidable Challenge Trottier Energy Futures Project Results Presented by Douglas Ruth, PEng, PhD 8 September 2017 T Background TEFP Study sponsored by CAE and DSF Funding
The New Brunswick. Energy Blueprint. Final Progress Report Department of Energy and Mines August 2014
 The New Brunswick Energy Blueprint Final Progress Report Department of Energy and Mines August 2014 The New Brunswick Energy Blueprint Final Progress Report Department of Energy and Mines August 2014
The Hydro Province. *Manitoba Hydro is the licensee of the Trademark and Official Mark.
 The Hydro Province Manitoba Hydro is one of the largest integrated electricity and natural gas distribution utilities in Canada, serving 548,000 electric customers across Manitoba and 269,000 natural gas
INTERROGATORY RESPONSE (Rule 4.3)
") Matter No. 336 NEW BRUNSWICK ENERGY AND UTILITIES BOARD INTERROGATORY RESPONSE (Rule 4.3) In relation to an Application by New Brunswick Power Corporation In Accordance with Section 103(1) of the Electricity
Matter No. 336 NEW BRUNSWICK ENERGY AND UTILITIES BOARD INTERROGATORY RESPONSE (Rule 4.3) In relation to an Application by New Brunswick Power Corporation In Accordance with Section 103(1) of the Electricity
2012 Grid of the Future Symposium. Evolution of the US Power Grid and Market Operations through the next Decade
 21, rue d Artois, F-75008 PARIS CIGRE US National Committee http : //www.cigre.org 2012 Grid of the Future Symposium Evolution of the US Power Grid and Market Operations through the next Decade A. OTT,
PLANNING FOR TODAY, TOMORROW, AND THE FUTURE. P. 1
 PLANNING FOR TODAY, TOMORROW, AND THE FUTURE. P. 1 P. 2 RELIABILITY AND RESOURCE PLANNING Hydro s 2018 Reliability and Resource Adequacy Study addresses our long-term approach to providing continued least-cost,
2016 Integrated Resource Plan Executive Summary
 2016 Integrated Resource Plan Executive Summary The electric industry is in the midst of unprecedented change. Customer needs and the way energy is consumed continues to evolve. Technologies are rapidly
Energy Policy 2012 Annual Update
 Energy Policy 2012 Annual Update May 2013 Energy Policy 2012 Annual Update May 2013 1.0 Energy Policy Update This report provides an update of 2012 activities and results related to the City of Fort Collins
HYDRO-QUÉBEC A N AT U R A L A L LY F O R MA S S AC H U S E T T S E N E R G Y T R A N S I T I O N
 HYDRO-QUÉBEC A N AT U R A L A L LY F O R M A S S A C H U S E T T S E N E R G Y T R A N S I T I O N 1,090 M W O F N E W, FIRM CLEAN ENERGY FOR MASSACHUSE T TS In response to the Massachusetts Clean Energy
Integrated Resource Plan NOVEMBER EXECUTIVE SUMMARY
 Integrated Resource Plan NOVEMBER 2016 - EXECUTIVE SUMMARY Our goal is to be our customers trusted energy partner, meeting their need for safe, reliable, affordable electricity at home and in their businesses
LONG-TERM SOLUTIONS FOR NEW YORK S CLEAN ENERGY FUTURE
 Q U É B E C S H Y D R O P O W E R R E S O U R C E S P O W E R I N G T H E E M P I R E S TAT E LONG-TERM SOLUTIONS FOR NEW YORK S CLEAN ENERGY FUTURE Hydro-Québec, New York s energy partner for decades,
Zero Net Carbon Portfolio Analysis
 Zero Net Carbon Portfolio Analysis Prepared for: Platte River Power Authority December 12, 2017 www.paceglobal.com Agenda Background Methodology Assumptions Cases Findings and Recommendations Page 2 Background
Entergy New Orleans, Inc.
 . Entergy New Orleans, Inc. An Integrated Resource Plan (2009 2028) Scope and Structure This document describes Entergy New Orleans, Inc. s ( ENOI ) long-term integrated resource plan ( IRP ) 1 for the
The Impacts of the Green Communities Act on the Massachusetts Economy:
 The Impacts of the Green Communities Act on the Massachusetts Economy: A Review of the First Six Years of the Act s Implementation Paul J. Hibbard Susan F. Tierney Pavel G. Darling Analysis Group, Inc.
The Cost of a Cleaner Future
 The Cost of a Cleaner Future Dr. Daniel F. Muzyka President and Chief Executive Officer The Conference Board of Canada June 26, 2017 conferenceboard.ca 2 Targets vs. Scenarios Paris: limit rise in global
WATER AND WIND QUÉBEC S CLEAN, RENEWABLE ENERGY RESOURCES
 WATER AND WIND QUÉBEC S CLEAN, RENEWABLE ENERGY RESOURCES QUÉBEC HAS THE CLEAN ENERGY MASSACHUSETTS NEEDS Hydro-Québec is proposing a new source of clean energy to Massachusetts, in the form of firm deliveries
Regional Electricity Cooperation and Strategic Infrastructure (RECSI) ATLANTIC REGION. Summary AR-SPM FOR POLICY MAKERS
 ATLANTIC REGION. Summary AR-SPM FOR POLICY MAKERS") Regional Electricity Cooperation and Strategic Infrastructure (RECSI) ATLANTIC REGION Summary FOR POLICY MAKERS AR-SPM Aussi disponible en français sous le titre : Initiative de collaboration régionale
Regional Electricity Cooperation and Strategic Infrastructure (RECSI) ATLANTIC REGION Summary FOR POLICY MAKERS AR-SPM Aussi disponible en français sous le titre : Initiative de collaboration régionale
EOS ECO-ENERGY INC. Recommendations: Energy Plan for New Brunswick Balancing the Environment, Economy and Social Aspects
 EOS ECO-ENERGY INC. Balancing the Environment, Economy and Social Aspects Roland Chiasson Chair of the Board of Directors, EOS Eco-Energy Inc. January 27 th, 2011 2 Purpose The goal of this brief report
Implications of Policy-Driven Residential Electrification
 ENERGY Implications of Policy-Driven Residential Electrification An American Gas Association Study prepared by ICF July 2018 IMPORTANT NOTICE: This is an American Gas Association (AGA) Study. The analysis
Electricity Review Report. Final Report April
 Electricity Review Report Final Report April 30 2015 Electricity Review Report Final Report April 30 2015 TABLE OF CONTENTS Executive Summary 1 Project Overview: Electricity Reform (2013) Act 3 Renewable
Tomorrow s Energy Scenarios 2017 Summary Booklet
 Tomorrow s Energy Scenarios 2017 Summary Booklet Planning our Energy Future EirGrid Tomorrow s Energy Scenarios Summary Booklet Planning our Energy Future Page 1 Introducing scenario planning At EirGrid,
NEW BRUNSWICK AND CLIMATE CHANGE
 NEW BRUNSWICK AND CLIMATE CHANGE Progress Report Summary 2014 2015 DELIVERING SUSTAINED RESULTS NEW BRUNSWICK AND CLIMATE CHANGE Delivering sustained results Climate change represents an urgent and potentially
First Person A Blueprint to Electrify the Golden State
 EPRI JOURNAL May/June 2018 No. 3 25 First Person A Blueprint to Electrify the Golden State The Story in Brief When it comes to electrification, utilities need to think ahead, think hard, and think fast
Hydro One Experience with Renewable Distributed Generation & Advanced Distribution System Initiative
 Hydro One Experience with Renewable Distributed Generation & Advanced Distribution System Initiative Convention on the Electric Industry & Its Markets June 4, 2012 B. N. (Bob) Singh 1 Manager - Asset Strategy
Boardman to Hemingway Transmission Line Project
 Transmission Line Project Purpose and Need Meeting Summary South Advisory Area July 8, 2009 Four Rivers Cultural Center 676 SW 5th Avenue Ontario, OR 97914 Table of Contents Introduction... 3 Welcome and
Transforming America s Power Industry:
 Transforming America s Power Industry: The Challenge 21-23 Executive Summary Prepared by: Marc W. Chupka Robert Earle Peter Fox-Penner Ryan Hledik The Brattle Group Prepared for: For a copy of the full
EXHIBIT GG. DATE FILED: February 9, :29 PM FILING ID: 9B5E9BDEA737B CASE NUMBER: 2016CV144
 DATE FILED: February 9, 2017 4:29 PM FILING ID: 9B5E9BDEA737B CASE NUMBER: 2016CV144 DRAFT 2008 ENERGY POLICY CITY COUNCIL MEETING JANUARY 6, 2009 1 1 Electric Energy Business Environment
Analysis of Proposed Development of the Maritime Link and Associated Energy from Muskrat Falls Relative to Alternatives
 Analysis of Proposed Development of the Maritime Link and Associated Energy from Muskrat Falls Relative to Alternatives Prepared for: Nova Scotia Department of Energy January 16, 2013 poweradvisoryllc.com
PJM Analysis of the EPA Clean Power Plan
 PJM Analysis of the EPA Clean Power Plan PJM Interconnection October 6, 2016 PJM CPP Study Objectives Evaluate potential impacts to: Resource adequacy Transmission system operations PJM energy and capacity
Powering Progress WHAT IF? The modern electric grid is one of the 20th century s great achievements. Eliminate 1 million tons of carbon emissions
 Powering Progress The modern electric grid is one of the 20th century s great achievements. emissions of carbon dioxide and other greenhouse gases. Today, the role of the utility is evolving as we adjust
Energy Use in Ontario
 Every Joule Counts - Ontario s Energy Use and Conservation Year in Review Chapter Energy Use in Ontario Contents Abstract....17.1 Overall Energy Use Changes...18. Fuel-by-Fuel Use Changes...0..1 Transportation
NPCC 2017 Ontario Interim Review of Resource Adequacy
 NPCC 2017 Ontario Interim Review FOR THE PERIOD FROM 2018 TO 2020 APPROVED BY THE RCC ON DECEMBER 5, 2017 This page intentionally left blank. ii Document Change History Issue Reason for Issue Date 1.0
The New Brunswick. Energy Blueprint. Second Progress Report Department of Energy and Mines March 2014
 The New Brunswick Energy Blueprint Second Progress Report Department of Energy and Mines March 2014 The New Brunswick Energy Blueprint Second Progress Report Department of Energy and Mines March 2014
Lower Churchill Project
 Lower Churchill Project Prepared by: Nalcor Energy Muskrat Falls: building for the future in Newfoundland and Labrador The lower Churchill River is one of the most attractive undeveloped hydroelectric
10. Strategy Selection Ameren Missouri
 10. Strategy Selection Highlights Ameren Missouri has developed and is executing on a plan that is focused on transitioning its generation fleet to a cleaner and more fuel diverse portfolio in a responsible
2005 Integrated Electricity Plan
 2005 Integrated Electricity Plan Regional Workshops Round 1 Kitimat February 22, 2005 Workshop Objectives To provide a forum to learn, share and express regional preferences about future energy options
Clean, Reliable Solutions to Power Michigan s Future
 2019 INTEGRATED RESOURCE PLAN SUMMARY Clean, Reliable Solutions to Power Michigan s Future DTE INTEGRATED RESOURCE PLAN REPORT SUMMARY PAGE 1 Introduction Michigan is in the midst of an energy transformation.
DATA, BENCHMARKING AND RATIONALE
 DATA, BENCHMARKING AND RATIONALE BC Hydro relies on various data sources for relevant and accurate reporting of its Performance Measures. This includes, but is not limited to, internal financial records,
Tomorrow s Energy Scenarios 2017
 Tomorrow s Energy Scenarios 2017 Planning our Energy Future EirGrid Tomorrow s Energy Scenarios Report Planning our Energy Future Page 1 Disclaimer EirGrid has followed accepted industry practice in the
2009 Integrated Resource Plan. PNUCC Board of Directors Meeting. January 7, Copyright 2010 Portland General Electric. All Rights Reserved.
 2009 Integrated Resource Plan PNUCC Board of Directors Meeting January 7, 2011 1 Copyright 2010 Portland General Electric. All Rights Reserved. IRP Public Process 2 2009 IRP / Boardman Public Process:
SECTOR ASSESSMENT (SUMMARY): ENERGY
: ENERGY") Country Partnership Strategy: Armenia, 2014 2018 SECTOR ASSESSMENT (SUMMARY): ENERGY A. Sector Performance, Problems, and Opportunities 1. Sector performance. Armenia has no proven reserves of oil or natural
Country Partnership Strategy: Armenia, 2014 2018 SECTOR ASSESSMENT (SUMMARY): ENERGY A. Sector Performance, Problems, and Opportunities 1. Sector performance. Armenia has no proven reserves of oil or natural
IQALUIT HYDROELECTRIC PROJECT
 IQALUIT HYDROELECTRIC PROJECT Table of Contents Renewable Energy in Nunavut...2 Iqaluit Hydroelectric Project...2 Benefits...3 Current Status...4 Financial Analysis...4 Overview of Expenditures... 4 Contributions...
Public Utility Regulatory Policy Act Standards
 Document Type: EA Administrative Record Index Field: Final Environmental Document Project Name: PURPA Standards Project Number: 2007-4 FINAL ENVIRONMENTAL ASSESSMENT TENNESSEE VALLEY AUTHORITY Public Utility
The Lower Churchill Project
 The Lower Churchill Project Overview The Lower Churchill project 1 is a two phase development of the 2250 MW Gull Island hydro generating station, the 824 MW Muskrat Falls hydro generating station and
PASADENA WATER AND POWER MEMORANDUM. August 9, 2016
 PASADENA WATER AND POWER MEMORANDUM August 9, 2016 To: Environmental Advisory Committee From: Gurcharan Bawa Interim General Manager Subject: Pasadena Solar Program Updates This report is for information
Emerging Trends In North American Energy: Focusing On New England s Electricity Market
 Emerging Trends In North American Energy: Focusing On New England s Electricity Market June 7, 2017 www.poweradvisoryllc.com Prepared for East Coast Energy Connection Content & Contact What s driving change?
Proposed Business Plan: CleanPowerSF Build-out of Local Renewable Energy Resources
 Proposed Business Plan: CleanPowerSF Build-out of Local Renewable Energy Resources Based on Local Power, Inc. preliminary financial model and implementation scenarios and other documents prepared for the
Missed Opportunities for Efficiency in Virginia
 Missed Opportunities for Efficiency in Virginia Prepared for Consumers Union Authors: Elizabeth A. Stanton, PhD Rachel Wilson Bryndis Woods February 1, 2018 www.aeclinic.org Executive Summary Dominion
Designing Energy Solutions
 Designing Energy Solutions without Borders Energy, Environmental Policy, & the Recession Impact of Proposed Federal Policies Illinois State University April 30, 2009 John Flynn, Managing Director-AEP Transmission
Platforms and Performance Drivers
 Platforms and Performance Drivers Capstone marked its tenth anniversary in 2014, a milestone that presents an occasion to review the company s strategy and market position as we enter our second decade
Planning for the Future. Jackie Sargent, General Manager Northern Colorado Renewable Energy Society August 20, 2013
 Planning for the Future Jackie Sargent, General Manager Northern Colorado Renewable Energy Society August 20, 2013 1 Platte River Power Authority Estes Park Fort Collins Longmont Loveland 2 Local Decision
A summary Yukon Energy s 2016 Resource Plan
 2016 resource plan YUKON ENERGY A summary Yukon s 2016 Resource Plan June 2017 Imagine what life in Yukon might be like 20 years from now. What s the state of the economy? Are there mines operating here,
Building a Modern Grid. September 24, New Jersey Energy Master Plan Stakeholder Meetings. Summary Comments of the Enel Group Companies
 Building a Modern Grid September 24, 2018 New Jersey Energy Master Plan Stakeholder Meetings Summary Comments of the Enel Group Companies I. Introduction The Enel Group appreciates the opportunity to provide
Impact of Regional Greenhouse Gas Initiative and Renewable Portfolio Standards on Power System Planning
 Impact of Regional Greenhouse Gas Initiative and Renewable Portfolio Standards on Power System Planning Panel on Impacts of GHG Programs and Markets on the Power Industry PESGM2006 Montreal June 21, 2006
2018 ENVIRONMENTAL, SOCIAL, GOVERNANCE AND SUSTAINABILITY REPORT. Compliant with Edison Electric Institute (EEI) Template
 Template") 2018 ENVIRONMENTAL, SOCIAL, GOVERNANCE AND SUSTAINABILITY REPORT Compliant with Edison Electric Institute (EEI) Template 2018 ENVIRONMENTAL, SOCIAL, GOVERNANCE, AND SUSTAINABILITY REPORT CMS ENERGY & CONSUMERS
2018 ENVIRONMENTAL, SOCIAL, GOVERNANCE AND SUSTAINABILITY REPORT Compliant with Edison Electric Institute (EEI) Template 2018 ENVIRONMENTAL, SOCIAL, GOVERNANCE, AND SUSTAINABILITY REPORT CMS ENERGY & CONSUMERS
Canadian Wind Energy Association Operations and Maintenance Summit
 Canadian Wind Energy Association Operations and Maintenance Summit David Short P.Eng. Director Power System Assessments January 30, 2018 Agenda Health and Safety Introduction and Context Operability Needs
ISO New England Regional Electricity Outlook
 F E B R U A R Y 7, 2 0 1 7 B E R L I N, C T ISO New England Regional Electricity Outlook Association of Energy Engineers, Connecticut Chapter Stephen J. Rourke V I C E P R E S I D E N T, S Y S T E M P
Atlantic Link: An Update. June 6, 2017
 Atlantic Link: An Update June 6, 2017 About Emera Publicly traded (TSX: EMA); approximately CDN$29 billion in assets Constructing the 500 MW Maritime Link a 170-kilometre subsea HVdc cable between Newfoundland
WHAT WE HEARD FROM STAKEHOLDERS
 WHAT WE HEARD FROM STAKEHOLDERS The Department of Energy invited key stakeholders to attend informal round table meetings, and provide formal submissions for public release. The department asked that submissions
Presented by: Danielle S. Powers. The Canadian Institute s Atlantic Power Symposium. June 15, 2011
 The New England Energy Market What Does the Future Hold? Presented by: Danielle S. Powers The Canadian Institute s Atlantic Power Symposium June 15, 2011 Introduction New England Energy Market Today Energy
Pacific Northwest Low Carbon Scenario Analysis
 Pacific Northwest Low Carbon Scenario Analysis Achieving Least-Cost Carbon Emissions Reductions in the Electricity Sector November 8, 2017 Arne Olson, Partner Nick Schlag, Sr. Managing Consultant Jasmine
ELECTRICITY & AFFORDABILITY
 lowest possible long term cost. The Government should seek to develop mechanisms and provide support for significant projects that assist in achieving measurable and verifiable demand and energy savings
Improving the way we price our network services. Consultation paper
 Improving the way we price our network services Consultation paper October 2015 Table of Contents 1 Overview... 4 2 Background... 6 3 Purpose... 7 4 Network tariff strategy... 7 4.1 Network tariff reform
Electricity prices are changing.
 Electricity prices are changing. Find out why. Paid for by the Government of Ontario Like in a lot of places around the world, electricity prices in Ontario are going up. Ontario has shut down 8 coal units
General overview for investors in Hungary s energy market
 General overview for investors in Hungary s energy market WHY INVEST IN THE HUNGARIAN GREEN INDUSTRY? Competitive investment environment Competitive energy prices Favorable implementation costs Government
Ontario s Changing Energy Landscape
 Ontario s Changing Energy Landscape Terry Young Vice-President, Policy, Engagement and Innovation January 23, 2018 IESO: Who we are and what we do Reliably operate Ontario s province-wide system 24/7 Support
BC Hydro 2015 Carbon Neutral Action Report. BC Hydro 2015 Carbon Neutral Action Report
 This Carbon Neutral Action Report for the period January 1, 2015 to December 31, 2015 summarizes our emissions profile, the total offsets purchased to reach net zero emissions, the actions we have taken
New England Power Sector Overview
 USAID/NARUC East Africa Regional Regulatory Partnership Exchange: New England Power Sector Overview Andrew Greene Massachusetts Dept. of Public Utilities Energy Facilities Siting Board Dar es Salaam, Tanzania
Energy Policy 2013 Annual Update
 Energy Policy 2013 Annual Update August 2014 Energy Policy Update This report provides an update of 2013 activities and results related to the City of Fort Collins Energy Policy, adopted in January 2009.
NALCOR ENERGY. Comments on Draft Request for Proposals for Clean Energy and Transmission
 Comments on Draft Request for Proposals for Clean Energy and Transmission Submitted to the CT DEEP, Mass. DOER, Eversource Energy, National Grid and Unitil March 27, 2015 Nalcor Energy (Nalcor), a provincial
HYDRO-QUÉBEC ELECTRICITY: CLEAN, RENEWABLE AND RELIABLE. November 2015
 HYDRO-QUÉBEC ELECTRICITY: CLEAN, RENEWABLE AND RELIABLE Update from HQUS November 2015 Today s Energy Challenges Global Warming Solutions Act Role of large hydropower: multiple system benefits in a single
Non-Technical Summary
 Non-Technical Summary I. Introduction Southern Indiana Gas and Electric Company d/b/a Vectren Energy Delivery of Indiana, Inc. ( Vectren ) engaged in a planning exercise during 2016 to evaluate its electric
Entergy Louisiana, LLC
 . Entergy Louisiana, LLC An Integrated Resource Plan (2009 2028) Scope and Structure This document describes Entergy Louisiana, LLC s ( ELL ) long-term integrated resource plan ( IRP ) 1 for the period