BAYESIAN-LOPA METHODOLOGY FOR RISK ASSESSMENT OF AN LNG IMPORTATION TERMINAL
|
|
|
- Blaise Stokes
- 6 years ago
- Views:
Transcription
1 BAYESIAN-LOPA METHODOLOGY FOR RISK ASSESSMENT OF AN LNG IMPORTATION TERMINAL A Thesis by GEUN WOONG YUN Submitted to the Office of Graduate Studies of Texas A&M University in partial fulfillment of the requirements for the degree of MASTER OF SCIENCE December 2007 Major Subject: Chemical Engineering
2 ii BAYESIAN-LOPA METHODOLOGY FOR RISK ASSESSMENT OF AN LNG IMPORTATION TERMINAL A Thesis by GEUN WOONG YUN Submitted to the Office of Graduate Studies of Texas A&M University in partial fulfillment of the requirements for the degree of MASTER OF SCIENCE Approved by: Chair of Committee, Committee Members, Head of Department, M. Sam Mannan Kenneth R. Hall César O. Malavé Michael Pishko December 2007 Major Subject: Chemical Engineering
3 iii ABSTRACT Bayesian-LOPA Methodology for Risk Assessment of an LNG Importation Terminal. (December 2007) Geun Woong Yun, B.S., SungKyunKwan University; M.S., YonSei University Chair of Advisory Committee: Dr. Sam Mannan LNG (Liquefied Natural Gas) is one of the fastest growing energy sources in the U.S. to fulfill the increasing energy demands. In order to meet the LNG demand, many LNG facilities including LNG importation terminals are operating currently. Therefore, it is important to estimate the potential risks in LNG terminals to ensure their safety. One of the best ways to estimate the risk is LOPA (Layer of Protection Analysis) because it can provide quantified risk results with less time and efforts than other methods. For LOPA application, failure data are essential to compute risk frequencies. However, the failure data from the LNG industry are very sparse. Bayesian estimation is identified as one method to compensate for its weaknesses. It can update the generic data with plant specific data. Based on Bayesian estimation, the frequencies of initiating events were obtained using a conjugate gamma prior distribution such as OREDA (Offshore Reliability Data) database and Poisson likelihood distribution. If there is no prior information, Jeffreys noninformative prior may be used. The LNG plant failure database was used as plant specific likelihood information.
4 iv The PFDs (Probability of Failure on Demand) of IPLs (Independent Protection Layers) were estimated with the conjugate beta prior such as EIReDA (European Industry Reliability Data Bank) database and binomial likelihood distribution. In some cases EIReDA did not provide failure data, so the newly developed Frequency-PFD conversion method was used instead. By the combination of Bayesian estimation and LOPA procedures, the Bayesian-LOPA methodology was developed and was applied to an LNG importation terminal. The found risk values were compared to the tolerable risk criteria to make risk decisions. Finally, the risk values of seven incident scenarios were compared to each other to make a risk ranking. In conclusion, the newly developed Bayesian-LOPA methodology really does work well in an LNG importation terminal and it can be applied in other industries including refineries and petrochemicals. Moreover, it can be used with other frequency analysis methods such as Fault Tree Analysis (FTA).
5 v DEDICATION To my wife, Soon-Yung, and my son, Jeong-Wook To my father and mother To my family To my friends
6 vi ACKNOWLEDGEMENTS I would like to thank my committee chair, Dr. Mannan, and my committee members, Dr. Hall and Dr. Malave, for their wonderful guidance and support throughout the course of this research. Thanks also to my friends, colleagues, and the department faculty and staff for making my time at Texas A&M University a great experience. Especially, I would like to thank to the members and staff of the Mary Kay O Connor Process Safety Center for full support and help. Furthermore, I also extend my gratitude to the Korea Gas Safety Corporation, which is the company I have been working for since 1996 and provided the financial support for my study. Additionally, I really appreciate the Vision Mission Church and the Korean Student Association in the Department of Chemical Engineering. Finally, thanks to my wife and son for their patience and love. And, thanks to God.
7 vii TABLE OF CONTENTS Page ABSTRACT... iii DEDICATION...v ACKNOWLEDGEMENTS...vi TABLE OF CONTENTS...vii LIST OF FIGURES...ix LIST OF TABLES...xii NOMENCLATURE... xiii 1. INTRODUCTION The Importance of Research Literature Review LNG Hazards and Description of an LNG Terminal LOPA Bayesian Logic METHODOLOGY DESCRIPTION HAZOP LOPA Bayesian Logic Frequency of an Initiating Event Probability of Failure on Demands (PFD) of IPLs THE DEVELOPMENT OF BAYESIAN-LOPA METHODOLOGY Overall Research Flow The Summary of Failure Data The Development of an Improved LNG Plant Failure Rate Data Base EIReDA OREDA CCPS Others Bayesian Estimation for Initiating Events Bayesian Estimation for IPLs Effect of Common Cause for Multiple Components Bayesian-LOPA Spreadsheet...73
8 viii Page 4. RESULTS OF BAYESIAN-LOPA METHODOLOGY AND VALIDATION The Results of HAZOP Study and Scenario Making Look-up Table of Failure Rates Results of Risks Unloading Arm Area (Node 1) Recondenser and HP Pump Area (Node 2) Storage Tank (Node 3) Validation of Results SUMMARY AND CONCLUSIONS Summary Conclusion Recommendations for Further Studies LITERATURE CITED APPENDIX A. PROCESS FLOW DIAGRAM AND P&IDs APPENDIX B. HAZOP SPREADSHEETS APPENDIX C. BAYESIAN-LOPA SPREADSHEETS VITA...274
9 ix LIST OF FIGURES Page Figure 1.1 Process flow diagram of the LNG terminal...13 Figure 1.2 Relationship between HAZOP and LOPA information...17 Figure 1.3 Structure of flopa...18 Figure 2.1 Protective layers against an incident scenario...30 Figure 2.2 An event tree of an incident scenario in LOPA...32 Figure 2.3 Relationship between LOPA and CPQRA...33 Figure 2.4 LOPA steps...34 Figure 2.5 Figure 2.6 Example of LOPA spreadsheet...37 Example of prior distribution and posterior distributions...42 Figure 2.7 Jeffreys non-informative prior distribution for an initiating event...44 Figure 2.8 Jeffreys non-informative prior distribution for PFD...48 Figure 3.1 The flow diagram of this research...50 Figure 3.2 Summary of major failures in LNG plant failure rate data base...55 Figure 3.3 Example from EIReDA data bank...56 Figure 3.4 Figure 3.5 Figure 3.6 Figure 3.7 Example from OREDA database...57 The schematic diagram of Bayesian estimation for initiating events with informative prior...62 The schematic diagram of Bayesian estimation for initiating events with Jeffreys non-informative prior...63 The schematic diagram of Bayesian estimation for IPLs with informative prior of EIReDA...66 Figure 3.8 Frequency-PFD conversion method...69 Figure 3.9 The schematic diagram of Bayesian estimation for IPLs with informative prior of OREDA...70 Figure 3.10 The schematic diagram of Bayesian estimation for IPLs with Jeffreys non-informative prior...71 Figure 4.1 Frequency of a loading arm failure corresponding to Bayesian estimation 83 Figure 4.2 PFDs of a gas detector corresponding to Bayesian estimation...84
10 x Page Figure 4.3 PFDs of a flame detector corresponding to Bayesian estimation...85 Figure 4.4 Figure 4.5 Figure 4.6 Figure 4.7 Figure 4.8 Figure 4.9 PFDs of an ESD valve corresponding to Bayesian estimation...86 Total PFDs of an IPL 2 corresponding to Bayesian estimation...86 Risk values of scenario 1 by LOPA...88 Frequency of a spurious trip to close of a block valve corresponding to Bayesian estimation...90 PFDs of a TSV corresponding to Bayesian estimation...91 Risk values of scenario 2 by LOPA...93 Figure 4.10 Frequency of a spurious trip to close of a block valve corresponding to Bayesian estimation...95 Figure 4.11 PFDs of a pressure alarm corresponding to Bayesian estimation...96 Figure 4.12 PFDs of an ESD valve corresponding to Bayesian estimation...97 Figure 4.13 Total PFDs of the IPL corresponding to Bayesian estimation...98 Figure 4.14 Risk values of scenario 3 by LOPA Figure 4.15 Frequency of a spurious full open of a FCV corresponding to Bayesian estimation Figure 4.16 PFDs of a temperature alarm corresponding to Bayesian estimation Figure 4.17 PFDs of a gas detector corresponding to Bayesian estimation Figure 4.18 Risk values of scenario 4 by LOPA Figure 4.19 Frequency of a rollover corresponding to Bayesian estimation Figure 4.20 PFDs of a FCV corresponding to Bayesian estimation Figure 4.21 Total PFDs of the IPL 1 corresponding to Bayesian estimation Figure 4.22 PFDs of a pressure alarm corresponding to Bayesian estimation Figure 4.23 PFDs of an ESD valve corresponding to Bayesian estimation Figure 4.24 Total PFDs of the IPL 2 corresponding to Bayesian estimation Figure 4.25 PFDs of a PRV corresponding to Bayesian estimation Figure 4.26 Total PFDs of the IPL 3 with a common pipeline corresponding to Bayesian estimation Figure 4.27 Total PFDs of the IPL 3 with independent pipelines corresponding to Bayesian estimation...115
11 xi Page Figure 4.28 Risk values of scenario 5 by LOPA Figure 4.29 Frequency of human errors corresponding to Bayesian estimation Figure 4.30 PFDs of a level alarm corresponding to Bayesian estimation Figure 4.31 Total PFDs of the two level alarms considering common cause factor corresponding to Bayesian estimation Figure 4.32 Total PFDs of the IPL 1 corresponding to Bayesian estimation Figure 4.33 PFDs of a level detector corresponding to Bayesian estimation Figure 4.34 Total PFDs of the two level detectors considering common cause factor corresponding to Bayesian estimation Figure 4.35 PFDs of an ESD valve corresponding to Bayesian estimation Figure 4.36 Total PFDs of the IPL 2 corresponding to Bayesian estimation Figure 4.37 Risk values of scenario 6 by LOPA Figure 4.38 Frequency of a spurious trip to close of a block valve corresponding to Bayesian estimation Figure 4.39 PFDs of a pressure alarm corresponding to Bayesian estimation Figure 4.40 PFDs of a compressor corresponding to Bayesian estimation Figure 4.41 Total PFDs of IPL 1 corresponding to Bayesian estimation Figure 4.42 PFDs of a pressure detector corresponding to Bayesian estimation Figure 4.43 PFDs of a compressor corresponding to Bayesian estimation Figure 4.44 Total PFDs of IPL 2 corresponding to Bayesian estimation Figure 4.45 PFDs of a VRV corresponding to Bayesian estimation Figure 4.46 Total PFDs of the IPL 3 corresponding to Bayesian estimation Figure 4.47 Risk values of scenario 7 by LOPA Figure 4.48 PFDs of a pressure alarm corresponding to Bayesian estimation Figure 4.49 Risk values of scenario 5 by LOPA Figure 4.50 Failure frequency of an initiating event (Example only) Figure 4.51 PFD of IPL 1 (Example only) Figure 4.52 PFD of IPL 2 (Example only) Figure 4.53 Failure frequency of an incident scenario (Example only) Figure 5.1 The risk value graphs of seven incident scenarios...149
12 xii LIST OF TABLES Page Table 1.1 The number of LNG facilities...2 Table 1.2 Test intervals of equipment and protection devices...9 Table 1.3 Comparison of classical and Bayesian estimation...22 Table 2.1 Guide words of HAZOP study...26 Table 2.2 Valid guide words for process pipelines...27 Table 2.3 Valid guide words for process vessels...27 Table 2.4 Typical HAZOP form...28 Table 2.5 Summarized conjugate relationships...40 Table 3.1 The comparison of failure data sources...59 Table 3.2 The format of LOPA spreadsheet of this research...74 Table 4.1 HAZOP nodes in a LNG terminal...76 Table 4.2 LOPA incident scenarios...77 Table 4.3 Look-up table of failure frequencies of initiating events...79 Table 4.4 Look-up table of failure probabilities of IPLs...80 Table 4.5 LOPA spreadsheet of incident scenario Table 4.6 LOPA spreadsheet of incident scenario Table 4.7 LOPA spreadsheet of incident scenario Table 4.8 LOPA spreadsheet of incident scenario Table 4.9 LOPA spreadsheet of incident scenario Table 4.10 LOPA spreadsheet of incident scenario Table 4.11 LOPA spreadsheet of incident scenario Table 5.1 The risk summary of incident scenarios...147
13 xiii NOMENCLATURE AIChE BOG BV CA CCPS CPQRA EIReDA ESReDA ETA FA FAR FCV FMEA FTA HAZOP LNG LOPA MKOPSC MTBF PFD OREDA PHA P&ID PRA PRV SIF American Institute of Chemical Engineers Boil-Off Gas Block Valve Consequence Analysis Center for the Chemical Process Safety Chemical Process Quantitative Risk Analysis European Industry Reliability Data Bank European Safety and Reliability Research and Development Association Event Tree Analysis Frequency Analysis Fatal Accident Rate Flow Control Valve Failure Mode and Effect Analysis Fault Tree Analysis Hazard and Operability Liquefied Natural Gas Layer of Protection Analysis Mary Kay O Connor Process Safety Center Mean Time Between Failure Probability of Failure on Demand Offshore Reliability Data Process Hazard Analysis Piping and Instrument Diagram Probability Risk Analysis Pressure Relief Valve Safety Instrumented Function
14 xiv SIL SIS TSV VRV Safety Integrity Level Safety Instrumented System Temperature Safety Valve Vacuum Relief Valve
15 1 1. INTRODUCTION 1.1. THE IMPORTANCE OF RESEARCH Liquefied Natural Gas (LNG) refers to natural gas converted into liquid state by super cooling to -260 ( ). LNG commonly consists of 85% - 98% methane with the remainder as a combination of nitrogen, carbon dioxide, ethane, propane, and other heavier hydrocarbon gases. It is highly flammable when it forms a 5 15% volumetric concentration mixture with air at atmospheric conditions. Based on its properties and that the volume compresses 600 times from gas phase into its liquid phase, the super cooling process of LNG is performed at a temperature of -260 under atmospheric pressure. It provides cost-effective LNG containment, and the liquid phase also permits cost effective LNG transportation across great distances onshore and offshore, at atmospheric pressure. Moreover, LNG is environmental friendly because of clean burning. Therefore, LNG demand has been growing to diversify the energy portfolios and fulfill the energy demand for LNG as a fuel of heating, cooling, cooking and power generation, etc. LNG may play an important role in filling the gap between supply and demand of energy in North America. With increasing demand for LNG, there are at least 113 currently active LNG facilities across the U.S., including importation terminals, operating and storage facilities for use during periods of peak natural gas demand ( peak shaving ) or as a baseload source of natural gas (see Table 1.1). In addition, there are also a number of proposed projects for LNG terminals in North America. In order to fulfill the LNG demand, it is necessary to build and operate more LNG importation terminals to import LNG from other countries. Thus, this research will focus on the LNG importation terminals. This thesis follows the style of Process Safety Progress.
16 2 Although the LNG industry speaks to the excellent safety record of the past 40 years, the risk related with LNG facilities may be increased with the growing LNG industry. It is important to continue this safety record given that one major accident could severely impact one community and the entire industry. In that light, risk-based decisions founded on sound science are very important. Emergency plans can be improved by application of risk-based criteria. Table 1.1 The number of LNG facilities No. of Classification Facilities (2006) Export terminal (baseload) 1 Receiving terminal (importation) 5 Peak-shaving plant 39 Satellite plant 58 Description The natural gas coming by pipe from one or several gas fields is liquefied and then stored for subsequent transport to other destinations. LNG carriers (ships) are unloaded. LNG is stored in tanks, vaporized and sent to the gas networks or gas consumers. LNG receiving terminals can have loading stations for road, rail, barge or small LNG carriers. This plant is connected to a gas network. During the period of the year when gas demand is low, natural gas is liquefied and LNG is stored. LNG is vaporized during short periods, when gas demand is high. This plant is connected to a gas network or gas consumers. LNG is supplied by road tankers, rail, barge or small LNG carriers. LNG is stored in insulated pressure vessels, vaporized and sent to the network [1].
17 3 Therefore, it is essential to control the risk related to LNG facilities to ensure their safety and reliability so that countries can enjoy the benefits of LNG. In order to control and quantify the risk, it is important to apply risk assessment methodology such as the layer of protection analysis (LOPA). From this quantification of risk and the application of recommendations for the LNG importation terminal, the LNG safety can be improved. LOPA is one of the risk assessment methods, which is called semi-quantitative method because it can provide quantified results of frequency even though it can present qualitative results of consequence or severity. LOPA is a simplified form of risk assessment which uses initiating event frequency, consequence severity, and the probability of failure on demand (PFD) of independent protection layers (IPLs) to estimate the risk of a possible incident scenario. The method is very straightforward and systematic to get the risk values rather than quantitative risk assessment (QRA). In other words, it does not demand a lot of time or man hours for the LOPA application and is very cost-effective: thus, it has been used widely in the process industry. Applying LOPA methodology to LNG facilities needs failure data of equipment and facilities to quantify the risk. However, these plant specific data are very sparse in LNG industries because there have been only a few incidents in the history of LNG industry and historical failure data have not been well gathered yet. The risk values estimated with these insufficient data may not show exactly the condition of a specific LNG facility. Generic failure data from other industries such as refineries, petrochemicals, and nuclear industries may be used for the LNG industry to estimate the risk. However, these data also may not give appropriate results of risk in LNG industries because the operational condition and environment of LNG facilities are quite different from those of other industries. Thus, it is necessary to use the Bayesian logic to find out more reliable risk values using both scarce plant specific data and generic data from other industries. Bayesian logic can produce the updated failure data with the prior information of generic failure data and the likelihood information of LNG plant specific data. The updated data can reflect both statistical failure data from generic data which have sufficient and long-
18 4 term historical database and the LNG plant specific data which have been gathered from the LNG industry. Using Bayesian logic may produce more reliable data because it is based on systematic logic and statistics. Consequently, as the demands of LNG facilities increase, the need to estimate the risk of the facilities is also growing. LOPA is one of the systematic risk assessment methodologies which can provide quantified risk values quickly with failure data of equipment and facilities. For industries with sparse failure data such as LNG or space industry, the Bayesian-LOPA methodology, which is a combination with LOPA and Bayesian logic, can give more accurate and reliable results of risk assessment by considering both generic data with long-term historical records and plant specific data from that facility. Therefore, in this research, Bayesian-LOPA methodology will be developed and then be applied to an LNG importation terminal to estimate the risk with generic data and LNG plant specific data. Finally, the method will serve as a risk decision measure and a tool to make some recommendations for safety enhancement LITERATURE REVIEW Changing economic outlook, energy demand, and environmental factors have resulted in increased demand for liquefied natural gas (LNG). The availability, profitability, and relatively low environmental impact of LNG will drive many capital projects for LNG facilities over the next several years. With so many facilities being brought to operation by numerous firms and operators, there is need of guidance by risk assessment methods such as LOPA to ensure that proven safety fundamentals are incorporated into the projects and also the facilities are satisfied with the risk criteria. LNG is an extremely cold, nontoxic, non-corrosive substance that is stored at atmospheric pressure. It is refrigerated, rather than pressurized, which enables LNG to be an effective, economical method of transporting large volumes of natural gas over long distance. LNG itself poses little danger as long as it is contained within storage
19 5 tanks, piping, and equipment designed for use at LNG cryogenic conditions. However, if it is accidentally released in an uncontrolled manner from its containment system, LNG may cause dangerous events from its flammable and cryogenic characteristics. In order to use the LOPA to LNG terminals, the following information is required: hazard identification to find out possible hazards, failure rates and probability of failure on demands (PFD) by using Bayesian logic. Thus, it is necessary to review LNG characteristics (i.e. properties, hazards) and terminals, LOPA applications, and Bayesian logic applications for LOPA application of LNG terminals LNG HAZARDS AND DESCRIPTION OF AN LNG TERMINAL West and Mannan [2] identified the LNG hazards [3] and summarized the history of LNG incidents. Among the many hazards, vapor cloud flash fires and pool fires are two main types of hazards that have potential impact on a plant that handles LNG and the adjacent area. For petroleum-based liquids and gases, the well recognized hazards are those associated with the flammability. However, LNG presents a few special hazards due to its low temperature characteristics. The hazard identification which can identify what hazards may exist at LNG facilities and make possible incident scenarios is the preliminary step of LOPA, and therefore it is important to know what hazards may exist in LNG terminals. West and Mannan considered several hazards such as cryogenic, over-pressurization, vapor cloud flash fire, unconfined vapor cloud explosion (UVCE), confined space explosion, pool fire, torch fire, BLEVE (Boiling Liquid Expanding Vapor Explosion), Rollover, and RPT (Rapid Phase Transition). However, they described UVCE may not be a potential hazard in LNG facilities because normally LNG facilities, which do not have condensed piping and equipment, may not be able to cause vapor clouds. Cryogenic hazards include the cryogenic burns associated with the freezing of skin because of direct contact with LNG (-260 F), cold gas, or cold surfaces. Another
20 6 important hazard is the impact of low temperatures on containment materials and structural materials. For example, if carbon steel contacts LNG, it loses ductility and then the impact strength (ability to withstand an impact force) decreases. The potential for over-pressurization is a recognized hazard in facilities that handle refrigerated or liquefied gases. It is often possible to isolate a vessel or a portion of a pipe by closing valves at both ends while the vessel or pipe contains a significant quantity of cryogenic liquid. If the temperature of the liquid is increased due to heat leak through an insulating cover, the liquid will expand due to the temperature increase and will vaporize. The vapor generation will cause the pressure within the vessel or pipe to increase and may ultimately result in vessel or pipe rupture, particularly if safety protective equipment such as pressure relief valves is unavailable. Whenever LNG is released from its containment system, the liquid will be heated by the surroundings, and then cause the liquid gas to vaporize. The vapor generated by this boiling liquid will start to mix with the surrounding air and will be carried downwind with the air, and then create a vapor cloud. As the vapor continues to be carried downwind, it will mix with additional air and be further diluted. Some portion of the vapor cloud will be within the flammable limits (about 5-15% by volume). If this flammable portion encounters a source of ignition, the vapor cloud may ignite. The flame might then propagate through the cloud, back to the source of the vapor, particularly if the flammable portion of the cloud is continuous. In closed areas, ignition of a flammable natural gas mixture may cause an explosion, with the resulting damaging overpressures. If LNG or its vapor may be leaked into an enclosure (control room, compressor building, etc.), the possibility of an explosion is markedly increased. This is due to the pressure increase within the enclosure caused by the fire heating the air, and the increase in gas volume during combustion. Most buildings will withstand very little internal pressure and when the pressure limit is reached, the building literally explodes. An LNG leak or spill of sufficient size may result in an accumulation of liquid on the ground. If ignited, the resulting fire is known as a pool fire. Ignition can occur at the
21 7 pool location (either immediately or after some delay), or the pool can be ignited by a vapor cloud fire. Objects directly contacted by the flame above the pool can be severely damaged or destroyed, and exposed personnel would receive extensive burn injuries. Objects and personnel outside the actual flame volume also can be damaged or injured by the radiant heat emitted by the flame. Compared to a vapor cloud fire, the effects are more localized, but of longer duration. When a flammable liquid is accidentally released from pressurized containment, the leak may take the form of a spray of liquid droplets and vapor. If ignited, the resulting fire is termed a torch fire. The fire can also result from a pressurized vapor leak. Torch fires present the same types of hazards as pool fires, i.e., direct flame contact and radiant heating. However, the radiant heating power of a torch fire is often greater than that of a pool fire of similar size. A BLEVE (Boiling Liquid Expanding Vapor Explosion) is the catastrophic failure of a pressurized container when its contents are above their boiling point temperature. The most common type of BLEVE occurs when an un-insulated pressurized vessel is exposed to an adjacent fire. The fire increases the internal pressure and weakens the vessel until it can no longer contain the pressure. The vessel then ruptures violently, and parts of it may be propelled great distances. The released liquid flashes and atomizes immediately, often resulting in a large fireball. The fireball can cause very widespread damage due to flame contact and thermal radiation. Although the fireball lasts only a few seconds, its effects can be devastating. The probability of a BLEVE of an LNG storage tank is extremely small; since the main tank is protected by the outer tank and insulation that would prevent the heat transfer from a fire to reach the main tank. Furthermore, most LNG storage tanks are designed for relatively low operating pressures. Therefore, if the tanks are exposed to fire, they will not get BLEVE since they will fail at a fairly low internal pressure and, at the time of failure, the LNG would not be heated sufficiently to cause any significant quantity of liquid to flash to vapor.
22 8 LNG is a mixture primarily of methane and higher hydrocarbons. Weathering within an ocean going tanker or a peak shaving storage tank can produce a density variation in the LNG. Addition of a new cargo of LNG can stratify within a storage tank, unless mixing procedures are adequate. After a period, the stratified layer may equalize in density with above layers and suddenly rollover to the surface of the tank. This type of sudden vaporization can cause tank over-pressurization. The 49 CFR regulation [4] specifically addresses this hazard. A flameless vapor phase explosion is caused by the sudden vaporization of a cold liquid upon contact with a much warmer material. The phenomenon of rapid vapor formation with loud bangs has been observed when LNG is released on water. This non-flaming physical interaction is referred to as Rapid Phase Transition or Flameless Explosion. It is believed that RPT will not propagate into a significantly larger damaging scenario [2]. The specification of LNG terminals is given in the industrial standards such as NFPA and EN standard as well as regulatory codes such as CFR (Code of Federal Regulations). EN 1473 [1, 5], which is European Standard, specifies the design requirements of LNG facilities as well as key requirements of hazard assessment guidelines and criteria to be used in the design for siting and safety. EN 1473 highlights the methodology of hazard assessment, identification of hazards and scenarios, and estimation of probabilities. The standard also shows the specification of LNG facilities including importation terminals and also gives detail requirements of equipment and systems such as storage systems, pumps, vaporization systems, pipelines, control systems and also protection systems. NFPA 59A [6], which is the U.S. standard of National Fire Protection Association, includes the design requirements and specification of plant layout, materials, storage containers, protection devices and instrumentation devices of LNG facilities. It also shows test intervals of equipment and protection devices as shown in Table 1.2.
23 9 Table 1.2 Test intervals of equipment and protection devices [6, 7] System or equipment Test intervals Reference Control systems (control valves, sensing, automatic 1 year [6] shutdown devices) Stationary LNG tank relief valves 2 years [6] Other relief valves 5 years [6] Emergency power sources 1 month [6] Hoses 1 year [6] Gas detector 1 month [7] Fire detector 6 months [7] Pressure alarm 1 month [7] Temperature alarm 1 month [7] ESD logic system 3 months [7] Vacuum breaker (VRV) 1 year [7] Level detector 1 year [7] Temperature sensor (base-slab) 1 year [7] Brine heating system 1 year [7] Control valve 1 year [7] Pressure relief valve (PRV) 1 year [7] ESD valve 1 month [7] Pump 1 month [7] Compressor 1 month [7] The test intervals may be used to estimate the number of demands to compute the probability of failure on demand. The part 193 of 49 CFR [4] covers the regulatory requirements of LNG facilities. It defines that control system is a component, or system of components functioning as a
24 10 unit, including control valves and sensing, warning, relief, shutdown, and other control devices, which is activated either manually or automatically to establish or maintain the performance. It also specifies the test periods of control systems in service, but not normally in operation as such that relief valves and automatic shutdown devices should be tested once each calendar year, and control systems that are intended for fire protection should be tested at least two times each year. The test period is similar to the one of NFPA, but CFR requires more frequent test intervals in control system for fire protection system. LNG has been transported and used safely in the U.S. and worldwide for roughly 40 years. Safety in the LNG industry is accomplished by providing multiple layers of protection for both the safety of LNG industry workers and the safety of communities that surround LNG facilities. These layers were summarized by Alderman [5]. This information may be used to determine the IPL of incident scenarios. Primary containment which can affect the frequency of initiating events is the first and most important requirement for containing the LNG product. This first layer of protection which is a part of inherent safer design involves the use of appropriate materials for LNG facilities as well as proper engineering design of LNG containers onshore, offshore, and on LNG ships. Both NFPA 59A [6] and EN 1473 [1] contain requirements for container design, including seismic criteria, thermal insulation, foundations, instrumentation, relief devices, and connections. The material selected for tanks, piping, and other equipment that comes in contact with LNG are high nickel content steels, aluminum, and stainless steels, which prevent embrittlement and material failures. Secondary containment ensures that if leak or spills occur at the LNG facility, the LNG can be fully contained and isolated. In many installations, a second tank such as secondary concrete or metal wall is used to surround the LNG container and serves as the secondary containment. Secondary containment systems are designed to exceed the volume of the LNG container for ground installations and dikes surrounding the LNG container are built to capture the product in case of a spill. NFPA 59A [6] requires that
25 11 LNG containers be provided with a natural barrier, dike impounding wall, or combination to contain a leak or spill of LNG. Additionally, a drainage system can be used to remove the LNG to a holding area where the LNG can vaporize safely. LNG operations use technologies such as high level alarms and multiple backup systems, which include Emergency Shutdown (ESD) systems, for safety protections. Fire and gas detection and fire fighting systems all combine to limit effects if there is a release. The LNG facility operator then takes actions by establishing necessary operating procedures, training, emergency response systems, and regular maintenance to protect people, property, and the environment from any release. It is very important to detect a leak of LNG or natural gas for emergency response actions to begin. Hydrocarbon gas detectors can be used to detect a natural gas leak if properly located. Hydrocarbon detectors need to be located higher than suspected leak points because natural gas is lighter than air. Hydrocarbon detectors are generally located over vaporizers, in metering stations, and in buildings where natural gas is processed. However, hydrocarbon detectors may not detect a LNG spill because vapors are insufficient. To back up the hydrocarbon detectors, temperature detection is used to sense a spill of LNG. The set point for the alarm is set low enough that ambient freezing conditions do not cause a fault trip. In some instances, the temperature detection is used to activate a high expansion foam system that helps control vaporization. Emergency Shutdown (ESD) systems are required to shut off operations in the event that certain specified fault conditions or equipment failures occur. They should be designed to prevent or limit significantly the amount of LNG and natural gas that could be released. The ESD system should be kept to fail to a safe condition. All LNG terminals should include a fire water system. The amount of water will be determined by the number of fire protection systems and demand for these systems. Fire protection systems for LNG facilities consist of water spray, high expansion foam, dry chemical, or a combination of these. Water spray is used to control radiant heat exposure on equipment and structures. LNG pool fires are neither controlled nor extinguished by water. High expansion foam can be used to control the vaporization rate
26 12 on the surface of an LNG spill. The foam works by warming the LNG vapors and reducing the fire thermal radiation back to the LNG pool, thereby reducing the LNG burning rate. High expansion foam is generally provided for impounding areas or where a LNG pool can form. Dry chemical extinguishing systems are used to extinguish an LNG fire. The dry chemical should be applied such that the surface is not agitated, which will allow additional vaporization. Dry chemical systems have been installed at unloading area, LNG pumps, boil-off compressors, and LNG vaporizers. LNG facility designs are required to maintain separation distances, named Safety Exclusion Zones, to separate land-based facilities from communities and other public areas. Federal regulations (49 CFR 193, [4]) have always required that LNG facilities are sited at a safe distance from adjacent industries, communities, and other public areas. The safe distances or exclusion zones are based on LNG vapor dispersion data, thermal radiation contours, and other considerations as specified in regulations. En Sup Yoon et al [8] addressed the LNG process as following simplified process diagram of the LNG terminal is shown in Figure 1.1. LNG is transferred from the tanker (ship) into the LNG storage tank driven by ship pumps. During unloading operations, boil-off gas is returned from the tanks to the ship by compressors, or pressure differential to balance the pressure between storage tanks and ship tanks. Generally, LNG is vaporized by using heat source such as natural gas, seawater or process water. The natural gas after vaporizing is sent out to the distribution pipelines through a metering station.
![13 Figure 1.1 Process flow diagram of the LNG terminal [8] They also suggested some recommendations for safety enhancement.](/docs-images/77/74797844/images/27-0.jpg "The following recommendations may be cited for safety improvement methods for the LNG terminal of this research.")
27 13 Figure 1.1 Process flow diagram of the LNG terminal [8] They also suggested some recommendations for safety enhancement. The following recommendations may be cited for safety improvement methods for the LNG terminal of this research. Inert gas systems are useful for extinguishing fires and preventing explosions in enclosed spaces. Fixed inerting systems are recommended for handling flammable fluid in enclosed areas. It is imperative to train facility personnel in emergency response procedures and the utilization of emergency equipment. All project personnel will receive intensive training in emergency response strategies prior to assuming their duties. Training may include realistic simulations of emergency situations. Refresher courses as well as safety meetings can be held at regular intervals. In addition, written manuals outlining approved procedures in various emergency situations will be prepared and issued to all terminal personnel.
28 LOPA In the 1990s, companies and industry groups developed standards to design, build, and maintain Safety Instrumented System (SIS, [9]). A key input for the tools and techniques required to implement these standards was the required Probability of Failure on Demand (PFD) for each Safety Instrumented Function (SIF). Process Hazard Analysis (PHA) teams and project teams struggled to determine the required Safety Integrity Level (SIL) for the SIFs [10]. The concept of layers of protection and an approach to analyze the number of layers needed was first published by the Center for Chemical Process Safety (CCPS), which is an AIChE (American Institute of Chemical Engineers) Industry Technology Alliance, in the 1993 book Guidelines for Safe Automation of Chemical Processes. Based on those concepts, several companies developed internal procedures for Layer of Protection Analysis (LOPA), and CCPS published Layer of Protection Analysis-Simplified Process Risk Assessment in 2001 [11]. According to Dowell [12], LOPA is an effective way to determine the required Safety Integrity Level (SIL, [13], [14]) for Safety Instrumented Systems (SIS) based on the risk of the undesired event. Dowell extended the LOPA concepts to show the effect of inherently safer features. Inherently safer features in a process design can reduce the required SIL of the SIS, or can eliminate the need for the SIS, and then reduce cost of installation and maintenance. Dowell s paper may be useful to find out the recommendations for safety improvement after LOPA application for LNG terminals. After LOPA application, it may be recommended to add additional IPLs in the plant in order to satisfy the risk criteria. However, CCPS [11] suggested that such additional barriers have disadvantages: The barriers can be expensive to design, build, and maintain, and The hazard is still present in the process, and failures of enough layers of protection can still result in an incident.
29 15 Therefore, it is desirable to reduce or eliminate hazards by applying inherently safer concepts to the process design and chemistry. In order to reduce risk, one can reduce the severity of the consequence, reduce the frequency of the consequence occurrence, and strengthen the layer of protection. The inherently safer design strategies of minimize, substrate, moderate, and simplify can be applied to reduce incidents. In order to reduce initiating cause frequency, following recommendations may be applied. Examples: Reduce flange leaks by eliminating flanges Eliminate pump seal leaks by eliminating the pump or replacing into non-seal pump (pump with high sealing capability) Reduce operational errors by changing the design of the procedure and the equipment to make them error tolerant [15]. For example, if opening valves in a particular sequence is important, the valve operators can be keyed such that the valves can only be opened in the correct sequence [16]. For each layer of protection, it can be considered to make the layer inherently stronger, or less likely to fail. For example, a process design that sends a tank overflow back to the supply tank may be inherently safer than a high level alarm and sensor that operates a shut-off valve. The process should be designed to handle the maximum overflow and should not introduce any contamination into the supply tank. Another way to improve the protection layer is to reduce the time of operator response to an alarm. This alarm should be independent of the SIS and the BPCS (Basic Process Control System). This IPL can be improved by making the alarm clear, by making the response to the alarm quick and by training personnel in the correct procedures. Additionally, the sensor, logic solvers, and annunciators for operator response should be tested periodically. An SIS can be designed to minimize human error during operation and maintenance. An SIL can be upgraded to strengthen the SIS performance. The additional mitigation category of IPLs includes pressure relief systems, restricted access, explosion suppression systems, fire protection systems, flame arrestors,
30 16 etc. The relief valve that is piped to a high elevation may be safer for the operators than the relief valve that discharges near the workplace. Moreover, relief valves may also vent to catch tanks, scrubbers, and/or flares. For example, suppose a relief valve can be manually isolated from the process which is intended to protect. The relief valve may not prevent high pressure when it is needed because the manual isolation valve may be closed. An inherently safer design might eliminate isolation valves around the relief valve. Alternatively, a three-way valve might be installed that ensures full flow to both dual relief valves during the switching process. Dowell and Williams [17] detailed the concept of automatically generating LOPA scenarios from a process hazard analysis (PHA) conducted using the hazard and operability (HAZOP) methodology. This concept makes the process of going from PHA results to LOPA results a lot less time consuming. It avoids retyping and reduces the risk of overlooking scenarios. An approach to develop LOPA scenarios is to simply screen spreadsheets in the HAZOP methodology. Each consequence is ranked for its severity, and the associated causes for the consequence are placed into categories for their unmitigated frequencies, that is, the frequency without considering safeguards. The risk associated with a scenario a cause and consequence pair is estimated by the intersection of the consequence severity and the cause frequency on the risk matrix. Translation of HAZOP information into LOPA scenario is given graphically in Figure 1.2. Note that not all information from the HAZOP is included in the LOPA. Consequences that do not meet the risk matrix criteria are omitted and very low frequency causes may be omitted because applying LOPA of some major incident scenarios is more time efficient and reasonable. Safeguards that do not meet the IPL criteria will not be considered as IPLs in the LOPA. Additional IPLs may be added or existing IPLs be strengthened for safer measures [12] as a result of the LOPA study.
31 Figure 1.2 Relationship between HAZOP and LOPA information [17] 17
32 18 Markowski and Mannan [18, 19] developed the Fuzzy Logic System (FLS) applicable in the framework of the Layer of Protection Analysis (LOPA) to reduce the uncertainty and imprecision of the result of LOPA. They developed the fuzzy LOPA model as shown in Figure 1.3. Markowski described LOPA as well as Fuzzy Logic System in his book, Layer of Protection Analysis for the Process Industries [19]. Bayesian logic has also a similar function with that of Fuzzy logic. So Markowski s paper may also provide some references to LOPA application of LNG terminals associated with Bayesian logic. Figure 1.3 Structure of flopa [18, 19] BAYESIAN LOGIC Named for Thomas Bayes, an English clergyman and mathematician, Bayesian logic is a branch of logic applied to decision making and inferential statistics that deals with probability inference: using the knowledge of prior events to predict future events.
33 19 Bayes' theorem provided, for the first time, a mathematical method that could be used to calculate, given occurrences in prior trials, the likelihood of a target occurrence in future trials. According to Bayesian logic, the only way to quantify a situation with an uncertain outcome is through determining its probability. Bayes' Theorem is a means of quantifying uncertainty. Based on probability theory, the theorem defines a rule for refining a hypothesis by factoring in additional evidence and background information, and results in a number representing the degree of probability ([20], [21]). Bayesian logic may be used to reduce the uncertainty and imprecision of failure data of IPLs with sparse failure data including both historical data and corporate memory. That is, the updated failure data from Bayesian logic may be more reliable than generic data or plant specific data because they can reflect both historical experiences from generic sources and plant specific experiences from plant data. Modarres [22] showed the Bayes theorem which follows directly from the concept of conditional probability in his book. The equation of Bayes theorem is Pr( A) Pr E A Pr A E = (1.1) Pr( E) The generalized form of the above equation, which can be used for discrete variables, is Pr( Aj) Pr E Aj Pr Aj E = n (1.2) Pr( Ai) Pr E Ai i= 1 The right-hand side of generalized Bayes equation consists of Pr(Aj), which is called prior probability, and the rest term, which is called relative likelihood, which is based on evidential observations. Pr Aj E is called the posterior probability given event E, which is updated probability of event Aj. Definitely, the more evidence is available, the further the posterior probability can be updated. For continuous variables, the form of the generalized Bayes equation is
34 20 f λ t = h( λ) l h( λ) l t λ t λ dλ (1.3) Where h(λ) is continuous prior probability density function (pdf), and l t λ is the likelihood function based on sample data t, and then f λ t is the posterior pdf of λ. That is, the fundamental relationship of Bayes theorem is posterior distribution prior distribution likelihood = (1.4) marginal distribution where marginal distribution acts as a normalizing constant. According to Sandia National Laboratories [23], Bayesian estimation can incorporate the degree of belief from generic data and information in the sampled data from plant specific data. The prior belief which is referred to as the prior distribution describes the state of knowledge about the parameter before getting the data sample. Bayesian estimation can be composed of two areas. The first area is to take advantage of available data to assign a subjective prior distribution from historical reliability data. The second area is to use specific data from specific plants or industries to update an existing prior distribution. Bayesian estimation can give the credible interval estimate of the parameter directly from the posterior distribution. In other words, the interpretation of 90% credible interval (a, b) of Bayesian posterior probability is that, with 90% subjective probability, the parameter belongs to the interval (a, b), given the prior and sampling distribution. Bayesian estimation includes following four steps. The first step is to identify the parameters to be estimated such as failure rate or probability. Second is to develop a prior distribution that properly shows the knowledge or degree of belief concerning the unknown reliability data. The third step is to collect the data sample from a specific plant or industry as a likelihood function. The final step is to combine the prior distribution with the sampled data using Bayes theorem to make the desired updated posterior distribution.
35 21 Typically, the selection of prior distribution may be seen to be a little subjective. The choice of a prior distribution should be evaluated to determine the sensitivity to failure rates. Thus, conjugate prior is very useful to choose the prior distribution more objectively or technically. Conjugate prior distribution can make a posterior distribution that is a member of the same family of distributions. Therefore, the conjugate prior distribution is very easy to compute the posterior parameters from prior distribution. The beta distribution is the conjugate prior distribution for probability of failure of a device in a binomial sample situation as a likelihood function. That is, beta distribution can be a prior distribution of a probability of failure on demand (PFD), which is one of the demand-related failures, with a binomial likelihood function, and then it will produce beta posterior distribution. For the failure frequency or rate which is one of the timerelated failures, the gamma distribution is the conjugate prior distribution with either Poisson or exponential data and then it will make a gamma distribution of posterior data. When there is very little prior information of a parameter, non-informative prior, which can be a part of uniform distribution, may be used as a prior distribution. For example, if failure rates of some equipment are not available in the generic historical sources, the non-informative prior distribution may be used to get posterior data. One of the commonly used non-informative prior distributions is the Jeffreys prior distribution in probability risk analysis (PRA). According to Sandia National Laboratories [23], Jeffreys method is to transform the model into a parameterization in terms of a location parameter, which slides the distribution sideways without changing its shape. And then the method uses the uniform distribution as the non-informative prior for the location parameter. Table 1.3 shows the difference between the classical and Bayesian estimation with some advantages and disadvantages.
36 22 Table 1.3 Comparison of classical and Bayesian estimation [22] Class Classical estimation Bayesian estimation Advantages Results depend only on the data With large quantity of data, produce good estimation Easier to understand and use Provides a logical approach to estimation. Measure uncertainty about parameters using probabilities. With accurate prior distribution, good parameter estimates. Provides a formal method of introducing prior information and knowledge into the analysis. Useful when sample data are scarce, as in the case of rare events. Permits the use of various types of relevant generic data. Interprets uncertainty about a parameter using a subjective probability interval. Reasoning process is straightforward Applicable to a larger class of situations likely to be encountered in risk assessment. Disadvantages A confidence interval cannot be directly interpreted Relevant information may exist outside the sample data The available data are often a mix of various data sources and types. A suitable prior distribution must be identified and justified subjectively Sensitive to the choice of a prior distribution More effort to understand and use
37 23 Shafaghi [24] showed how to update the equipment failure data using Bayesian estimation in the 2006 MKOPSC (Mary Kay O Connor Process Safety Center) Symposium. In his paper, he provided the concept of Bayesian statistics, how to choose prior distribution and likelihood function, and a case study related to failure rates of pressure vessels. In order to get the posterior failure rates, he used a gamma distribution as a conjugate prior and a Poisson distribution as a likelihood function, and this resulted in the posterior gamma distribution. His method may be used to find out the posterior failure rates of initiating events in LOPA methodology. However, the way to compute the posterior PFDs was not given in his paper.
38 24 2. METHODOLOGY DESCRIPTION Section 2 shows the brief description of methods which will be used in this research. Some contents may be similar to the literature review of Section 1 and methodology development of Section 3. However, the purpose of this Section is to provide brief ideas about several methods related to the research and help to understand this research. Section 3 will focus on the development of Bayesian-LOPA methodology. Additionally, the detail procedures and several diagrams for the method will be provided and explained in Section HAZOP HAZOP study, Hazard and Operability study, is one of the procedures to identify hazards in chemical process facilities. The procedure is also one of the qualitative risk assessments. HAZOP study is very effective and systematic method to find out hazards as opposed to other methods such as FMEA, What-If, and checklists because it uses the systematic guide words for the process parameters and well-organized spreadsheets. Thus it is well accepted in the industries. For the HAZOP study, it is necessary to get detail process information including process flow diagram, piping and instrumentation diagram (P&ID), equipment specifications, process conditions, MSDS and properties of chemicals, and materials of construction. The HAZOP study requires a team which consists of people who have experiences of a plant, technical knowledge, and safety expertise. The team may be composed of a HAZOP leader who serves as the committee chair, a scriber who is in charge of recording the results, process engineers, safety engineers, operators, external consultants, and so on. Crowl [25] showed HAZOP procedures to complete an analysis:
39 25 1) Start with the flow sheet such as process flow diagram. Break the process flow diagram into several process units such as reactor units, storage tank units, etc. The units can be a number of nodes. Select a unit for study. 2) Choose a study node such as vessels, reactors, pipelines, etc. 3) Describe the design intent of the study node. 4) Select a process parameter among following parameters ; level, temperature, flow, pressure, concentration, ph, viscosity, state (solid, liquid, or gas), reaction, volume, component, start, stop, stability, power, inert, agitation. 5) Apply every guide word to a process parameter. Table 2.1 shows several guide words and their meanings. Additionally, Table 2.2 provides valid guide words for process parameters. 6) If the deviation, which is the guide words of a parameter, is applicable, find out possible causes and consequences, and note any protection systems or safeguards against the incident cases. 7) Recommend some actions to mitigate the consequences or reduce the frequencies of the incident (if any). 8) Record all information and documentation.
40 26 Table 2.1 Guide words of HAZOP study [25] Guide words Meaning Comments NO, NOT, NONE The complete negation of the intention No part of the design intention is achieved, but nothing else happens MORE, HIGHER, GREATER Quantitative increase Applies to quantities such as pressure and flow rate and to activities such as reaction and heating LESS, LOWER Quantitative decrease Applies to quantities such as pressure and flow rate and to activities such as reaction and heating AS WELL AS Qualitative increase All the design and operating intentions are accomplished with some additional activities such as contamination of process streams PART OF Qualitative decrease Only some of the design intentions are accomplished, some are not. REVERSE The logical opposite of Most applicable to activities such as flow or chemical reaction. OTHER THAN Complete substitution No part of original intention is accomplished the original design intention is replaced by something else. Table 2.2 shows the valid guide words of process parameters for process pipelines, and valid guide words for process vessels are shown in Table 2.3.
41 27 Table 2.2 Valid guide words for process pipelines [25] No, More, As Process Less, Part Other not, higher, well Reverse parameters lower of than none greater as Flow Temperature Pressure Concentration ph Viscosity State Table 2.3 Valid guide words for process vessels [25] No, More, As Process Less, Part Other not, higher, well Reverse parameters lower of than none greater as Level Temperature Pressure Concentration ph Viscosity Agitation Volume Reaction State
42 28 Sometimes it is hard to apply some guide words such as AS WELL AS, PART OF, and OTHER THAN. The guide word AS WELL AS is that something else happens additionally together with the design intention. For example, this may be boiling of a liquid or transfer of some additional component unexpectedly. In the case of PART OF, examples may be that some of the components are missing or some part of streams has gone to somewhere. OTHER THAN means that a chemical may be substituted for the unexpected material and is transferred somewhere else. Table 2.4 presents a typical form of HAZOP spreadsheets. Several commercial HAZOP programs are available now, and also HAZOP can be done easily in the general spreadsheet software. Table 2.4 Typical HAZOP form Process parameters Study node name (or number) : Deviations Possible Possible causes (guide words) consequences Action required The methodology of HAZOP can be easily understood and quite systematic to apply. However, the successful results of HAZOP may be significantly dependent on the experiences and expertise of interested facilities of a HAZOP team and the quality of gathered information is also very important to the success. Thus, setting up a quality HAZOP team and gathering required all information must not be disregarded for HAZOP study. For LOPA applications, HAZOP results are required to make possible incident scenarios combined with the causes and consequences. If HAZOP results which are
43 29 previously done by some teams and allowed to use for LOPA application are available, they may be used directly for LOPA analysis so that analysts can save their time and/or money. Otherwise, conducting HAZOP study by ourselves is one of the prerequisites for LOPA LOPA Layer of Protection Analysis (LOPA) is one of the risk assessment methodologies. It is called semi-quantitative risk assessment because it can provide quantified results of frequency even though it can present qualitative results of consequence or severity. LOPA is a simplified form of risk assessment which uses initiating event frequency, consequence severity, and the probability of failure on demand (PFD) of independent protection layers (IPLs) to estimate the risk of a possible incident scenario. Typically, LOPA builds on the information developed during process hazard analysis (PHA) such as HAZOP, FMEA, Check-list and What-if methods. The results of PHA can be used to make possible incident scenarios by combination of causes and consequences for LOPA applications. The purpose of LOPA is to estimate the risk level of interested facilities and to make risk decisions compared to tolerable risk criteria. The purpose can be to determine whether the facilities have sufficient layers of protections against an incident scenario or not. LOPA may be used to make risk ranking among incident scenarios and then give some maintenance or safety measure priorities to some equipments which have higher risks than others. Figure 2.1 illustrates many types of protective layers. Applying to how many layers of protection is dependent on the process complexity and potential severity of an incident scenario. Since no layer is perfectly effective, sufficient layers of protection should be provided to prevent possible incidents or mitigate consequences. These protective safeguards can be one of the IPLs. However, not all safeguards are IPLs, but
44 30 all IPLs are safeguards. According to CCPS [11], in order to be considered as an IPL in a LOPA application, these protective layers should meet the following three IPL rules. 1) Effective in preventing the consequence when it functions as designed. 2) Independent of the initiating events and the components of any other IPLs already credited for the same scenario 3) Auditable, that is, the assumed effectiveness in terms of consequence prevention and PFD should be able to be validated by documentation, review, testing, and so on. Post-release physical protection (dike) Physical protection (relief valve) Safety instrumented function (SIF) Alarms and human intervention Basic process control systems V-2 Process Equipment E-1 Figure 2.1 Protective layers against an incident scenario
45 31 An incident scenario can be made with a cause-consequence pair. The LOPA scenario represents one path which is worst case through an event tree. CCPS [11] shows an event tree for an initiating event in Figure 2.2. In this case, three IPLs are provided against the incident scenario. Once an initiating event occurred, every IPL should prevent the undesirable consequence. However, the effectiveness of each IPL is not perfect, thus all IPLs may have some probabilities of failure on demand. If one of the IPLs succeeds to work the designed function, the safe outcome or undesired but tolerable outcome can be obtained. The undesired but tolerable outcome is called mitigated consequence. However, if all IPLs fail to stop the incident and work properly, consequences exceeding tolerable criteria may be occurred as a bold line is shown in Figure 2.2. The risk of an incident scenario can be computed by multiplying the frequency of an initiating event and all PFDs of IPLs. This calculated frequency is called mitigated frequency. If the frequency is not acceptable compared to tolerable risk criteria, additional IPLs, improving SIFs or other safety measures should be considered to reduce the risk. As shown in Figure 2.2, the thickness of arrow represents frequency of the consequence. As the arrow pass through IPLs, the thickness grow thinner. Thus, this means that the more IPLs, the less frequency of consequence. However, practically, adding IPLs results in high cost, so practical approach is necessary to determine the sufficiency of IPLs by comparing to tolerable risk criteria which may be set up by organizations or by countries.
46 32 IPL1 IPL2 IPL3 Consequence occurs Initiating event Estimated frequency f i Note Impact event SUCCESS SUCCESS Safe outcome Undesired but tolerable outcome SUCCESS Undesired but FAILURE tolerable outcome PFD 1 =p 1 f 1 = f i * p 1 FAILURE LOPA path Consequences PFD 2 = p 2 f 2 = f i * p 1 * p FAILURE exceed criteria 2 PFD 3 = p 3 f 3 = f i * p 1 * p 2 * p 3 Frequency Figure 2.2 An event tree of an incident scenario in LOPA [11] LOPA is typically used after a PHA such as HAZOP and FMEA to estimate and quantify the potential risks. According to CCPS [11], LOPA can also be applied when hazard analysis team Believes that a scenario is too complicated to make a good risk judgment using qualitative method, or The consequences are too severe to rely on qualitative risk judgment. LOPA can also be used to screen the incident scenarios prior to quantitative risk assessment (Chemical process quantitative risk assessment, CPQRA) method. CPQRA is more rigorous than LOPA, and it is a very detailed method to determine the risks which may be composed of consequence analysis (CA) for the physical effects and frequency analysis (FA) for the probability (or frequency) of incident scenarios. The results of CPQRA may be compared to risk criteria such as individual risk (e.g. FAR; Fatal


47 33 Accident Rate) or societal risk (e.g. f-n curve) to determine the risk. CPQRA can make very detailed and reasonable risk calculation, however, it demands a lot of time, manhours and detailed information. Thus, typically CPQRA may be applied to the highly dangerous incident scenarios screened by LOPA or PHA. CCPS [11] provided the spectrum among various risk assessment methods included LOPA and CPQRA as shown in Figure 2.3. Figure 2.3 can show easily the relationship between LOPA and CPQRA, and can be used to determine when we may use LOPA or CPQRA. Figure 2.3 Relationship between LOPA and CPQRA [11]
48 34 LOPA can be done with several steps. CCPS [11] shows the LOPA steps with a diagram as shown in Figure 2.4. Each incident case should be done through all steps for LOPA applications. That is, LOPA can be applied to a scenario at a time. Figure 2.4 LOPA steps [11] Step 1: Identify the consequence to screen the scenarios. LOPA can be applied to all incident scenarios found by PHA. However, it is not practical, so some scenarios which may result in high magnitude of severity can be selected to apply LOPA. This screening tool may be based on consequences identified during PHA such as HAZOP study.
49 35 Step 2: Pick an incident scenario. The scenario can be made with a single causeconsequence pair in the PHA results. Step 3: Identify the initiating event of the scenario and obtain the frequency of the initiating event. The initiating event which may be found in causes of PHA results should result in the consequence. The initiating event frequency from the interested facility, which is called plant specific data, is most preferable, but generally it is not easily obtained. Even though it is available, if it is not long-term accumulated data, it may have some statistical shaky grounds because of short-term history. A second option is to get the frequency data from the generic data which is long-term and historical based data from similar industries such as OREDA and CCPS database. They are very statistically reliable, but they may not have the same environments with the interested facility. A third option is to update the frequency data from both generic data and plant specific data by using Bayesian logic. These updated data can reflect long-term statistical grounds as well as the specific conditions in the interested facilities. Detail information will be addressed in Section 3. Step 4: Identify the IPLs and obtain PFD of each IPL. This is the very important step for LOPA application because the success of LOPA application is highly dependent on this step. Existing safeguards should be screened to be an IPL with IPL rules; independence, effectiveness and auditability. After identifying the IPLs, the PFD of each IPL should be estimated from the obtained information as such initiating event frequency in step 3. Step 5: Estimate the risk by the following mathematical calculation combining the initiating event frequency and PFDs of IPLs. f f c i c i J I = f i j= = f I i PFDi j 1 (2.1) PFD i1 PFD i2... PFD ij Where f c i = frequency for consequence C for initiating event i f I i = initiating event frequency for initiating event i
50 36 PFD ij = Probability of failure on demand of the jth IPL that protects against consequence C for initiating event i. Step 6: Make risk decisions concerning about the scenario. The estimated risk values can be compared to the tolerable risk criteria given by companies, industries, or government. CCPS [11] presents risk criteria of two cases. One is the case with considering human harm in the incident scenario. Maximum tolerable risk criteria is less 5 4 than 1 10 / year and action required criteria is less than 1 10 / year. The other case is without considering human harm, that is, only consider consequences such as release, 5 fire or explosion. Maximum tolerable risk criteria is less than 1 10 / year and action 3 required criteria is less than 1 10 / year. LOPA analysts may use these criteria given by CCPS. CCPS [11] provides the example LOPA sheet as shown Figure 2.5.

51 Figure 2.5 Example of LOPA spreadsheet [11] 37
52 BAYESIAN LOGIC According to Wan [26], Bayesian estimation is based on the subjective definition of probability as degree of belief and on Bayes theorem, and it is the basic tool for assigning probabilities to hypothesize combining a prior judgment and experimental information. Bayesian logic may be used to reduce the uncertainty and imprecision of failure data of IPLs with sparse failure data including both historical data and corporate memory. That is, the updated failure data from Bayesian logic may be more reliable than generic data or plant specific data because they can reflect both historical experiences from generic sources and plant specific experiences from plant data. Modarres [22] showed the Bayes theorem which follows directly from the concept of conditional probability in his book. The equation of Bayes theorem is Pr( A) Pr E A Pr A E = (2.2) Pr( E) The generalized form of the above equation, which can be used for discrete variables, is Pr( Aj) Pr E Aj Pr Aj E = n (2.3) Pr( Ai) Pr E Ai i= 1 The right-hand side of generalized Bayes equation consists of Pr(Aj), which is called prior probability, and the rest term, which is called relative likelihood, which is based on evidential observations. Pr Aj E is called the posterior probability given event E, which is updated probability of event Aj. The above equation means that the probability data can be updated with the prior probability and the relative likelihood based on some evidences. Definitely, the more evidence is available, the further the posterior probability can be updated. For continuous variables, the form of the generalized Bayes equation is
53 39 f λ t = h( λ) l h( λ) l t λ t λ dλ (2.4) Where h(λ) is continuous prior probability density function (pdf), and l t λ is the likelihood function based on sample data t, and then f λ t is the posterior pdf of λ. That is, the fundamental relationship of Bayes theorem is posterior distribution prior distribution likelihood = (2.5) marginal distribution where marginal distribution acts as a normalizing constant. According to Sandia National Laboratories [23], Bayesian estimation can incorporate the degree of belief from generic data and information in the sampled data from plant specific data. The prior belief, referred to as the prior distribution, describes the state of knowledge about the parameter before getting the data sample. Bayesian estimation can be composed of two areas. The first area is to take advantage of available data to assign a subjective prior distribution from historical reliability data. The second area is to use additional or specific data from specific plants or industries to update an existing prior distribution. Bayesian estimation can give the credible interval estimates of the parameter directly from the posterior distribution. That is, the interpretation of 90% credible interval (a, b) of Bayesian posterior probability is that, with 90% subjective probability, the parameter belongs to the interval (a, b), given the prior and sampling distribution. Bayesian estimation includes following four steps: First step: identify the parameters to be estimated such as failure rate or probability. Second step: develop a prior distribution that properly shows the knowledge or degree of belief concerning the unknown reliability data. Third step: collect the data sample from a specific plant or industry as a likelihood function.
54 40 Fourth step: combine the prior distribution with the sampled data using Bayes theorem to make the desired updated posterior distribution. Typically, the selection of prior distribution may be seen to be a little subjective. The choice of a prior distribution should be evaluated to determine the sensitivity to failure rates. Thus, conjugate prior is very useful to choose the prior distribution more objectively or technically. Conjugate prior distribution can make a posterior distribution that is a member of the same family of distributions. Therefore, the conjugate prior distribution is very easy to compute the posterior parameters from prior distribution. The beta distribution is the conjugate prior distribution for probability of failure of a device in a binomial sample situation as a likelihood function. That is, beta distribution can be a prior distribution of PFD, which is one of the demand-related failures, with a binomial likelihood function, and then it will produce beta posterior distribution. For the failure frequency or rate, which is one of the time-related failures, the gamma distribution is the conjugate prior distribution with either Poisson or exponential data and then it will make a gamma distribution of posterior data. Table 2.5 summarizes conjugate relationships of frequencies of initiating events and PFDs of IPLs respectively. Table 2.5 Summarized conjugate relationships Class. Prior distribution Likelihood function Posterior distribution Frequency of initiating event Gamma Poisson Gamma PFD of IPL Beta Binomial Beta
55 41 In order to apply Bayesian logic to LOPA, the frequency of an initiating event and the PFD of IPLs should be obtained respectively. Detail information about how to get posterior values with conjugation relationships will be addressed in Section FREQUENCY OF AN INITIATING EVENT For the frequency of an initiating event, analyst should know the maximum likelihood estimation and Bayesian estimation. First, the maximum likelihood estimate (MLE), which is called also point estimate, is the most commonly used frequentist estimate. MLE is the value of λ that maximizes the likelihood or frequency, where λ can be the frequency of an initiating event. MLE of λ is λ = x / t (2.6) where x is the observed number of failures and t is the observed time period. This equation is very simple and natural. The hat notation indicate that the MLE is an estimate calculated from the data unknown λ. Second, in order to update the data, the Bayesian estimation can be used. Bayesian estimation consists of prior distribution which is the prior belief about λ and likelihood function which can be made from the collected data. Likelihood function is given by Equation 2.7 for initiating events. Pr( X λt x e ( λt) = x) = (2.7) x! This equation is the formula for the Poisson distribution, and the probability of x initiating events in time t for any particular number x. Posterior distribution is made by combining the prior distribution and likelihood function through Bayes theorem. Equation 2.5 can be modified as such f ( λ) likelihood ( λ) f ( λ) (2.8) post prior where the symbol denotes is proportional to.
56 42 Figure 2.6 shows the example graphs of prior distribution and posterior distributions corresponding to three hypothetical data sets. Figure 2.6 Example of prior distribution and posterior distributions [23] Corresponding to Figures 2.6, the posterior distribution looks similar to the prior for a small data set. Therefore, as the data set becomes larger, following summary can be possible: the posterior distribution set apart more and more from the prior distribution, since the data contribute the dominant information, the posterior distribution becomes more concentrated, meaning the better accuracy, less uncertainty, and the posterior distribution becomes approximately centered around the MLE.
57 43 As shown in Table 2.6, the conjugate family of Poisson data is the family of gamma distributions. For Bayesian estimation, the equation 2.9 which is gamma distributions with two parameterizations is more convenient one. f β Γ( α) α α 1 λβ ( λ) = λ e (2.9) Where, λ has units of 1/time and β has units of time, thus the product λβ is unitless. The parameter β is kind of scale parameter which corresponds to the scale of λ. The other parameter α is shape parameter which is unitless and corresponds to the distribution shape of λ. In this parameterization, the mean of gamma distribution, E(λ) is α/β and the variance, var(λ) is α/β 2. Equation 2.9 can be rewritten after stripping of all the normalizing constants as such f α 1 λβ ( λ) λ e (2.10) For Bayesian estimation, equation 2.7, 2.8 and 2.10 can be combined each other, and then posterior distribution is f ( λ) e f ( λ) λ λt ( λt) x! e ( x+ α ) 1 x λ α 1 λ( t+ β ) e λβ (2.11) Equation 2.11 shows the posterior distribution is also a gamma distribution from the gamma prior. This is the meaning of conjugate. The updated formula in the posterior gamma distribution is α = x + α, β = t + β (2.12) post prior post prior Therefore, the posterior mean is α post /β post and the variance, var(λ) is α post /β 2 post. That is, the value of posterior mean can be calculated with prior parameters (α prior, β prior ) like equation µ post α post x + α prior = = (2.13) β t + β post prior In order to make sure the uncertainty, the credible interval of the posterior distribution may be calculated. The equation of (100p)th percentile is 2 λ p χ p (2α post ) / 2 = β (2.14) post
58 44 2 Where χ p (2α post ) is the pth quantile of a chi-squared distribution with 2 α post degrees of freedom. The values of a chi-squared distribution can be easily obtained in the statistics or reliability engineering literatures. When there is very little prior information of a parameter, non-informative prior which can be a part of uniform distribution may be used as a prior distribution. For example, if failure rates of some equipment are not available in the generic historical sources, the non-informative prior distribution may be used to get posterior data. One of the commonly used non-informative prior distributions is the Jeffreys prior distribution in probability risk analysis (PRA). According to Sandia National Laboratories [23], Jeffreys method is to transform the model into a parameterization in terms of a location parameter, which slides the distribution sideways without changing its shape. And then the method uses the uniform distribution as the non-informative prior for the location parameter. With Poisson data as a likelihood function, the Jeffreys non-informative prior distribution can be a gamma distribution which shape parameter, α, is equal to ½ and scale parameter, β, is equal to zero. If the normalizing constant in equation 2.9 is ignored, 1/ 2 a function that is proportional to λ can be yielded and it is shown in Figure 2.7. As shown in Figure 2.7, the distribution might be considered as a uniform distribution. Figure 2.7 Jeffreys non-informative prior distribution for an initiating event [23]
59 45 Corresponding to equation 2.12, formal application of the updated formulas for Jeffreys non-informative prior is α = x + 0.5, β t (2.15) post post = Thus, posterior mean of Jeffreys prior is α post x µ post = = (2.16) β t post And, if equation 2.15 is put into equation 2.14, the equation of (100p)th percentile is 2 λ = χ p (2x + 1) / t (2.17) p PROBABILITY OF FAILURE ON DEMANDS (PFD) OF IPLs For the probability of failure on demands of IPLs, analysts should know the maximum likelihood estimation and Bayesian estimation. First, the maximum likelihood estimate (MLE), which is called point estimate, is the most commonly used frequentist estimate. MLE is the value of p that maximizes the likelihood or probability, where p can be the probability of failure on demand of an IPL. MLE of p is p = x / n where x is the observed number of failures and n is the observed number of demands. Second, in order to update the data, the Bayesian estimation can be used. Bayesian estimation consists of prior distribution which is the prior belief about p and likelihood function which can be made from the collected data. Likelihood function is given by equation 2.19 for PFD. n p x (2.18) x n x Pr( = ) = (1 ) (2.19) X x p
60 46 Where the binomial coefficient is defined as n n! = (2.20) x x!( n x)! This equation is the formula for the Binomial distribution, and the PFD, p, consists of x failures in n demands. Posterior distribution is made by combining the prior distribution and likelihood function through Bayes theorem. As shown in Table 2.6, the conjugate family of Binomial data is the family of beta distributions. For Bayesian estimation, the equation 2.21 which is beta distributions with two parameterizations is more convenient one. ( ) Γ( α + β ) Γ( α) Γ( β ) α 1 β 1 f p = p (1 p) (2.21) The shape of beta distribution is dependent on the size of the two parameters, α and β. In this parameterization, the mean of beta distribution and the variance are α µ = (2.22) α + β αβ µ (1 µ ) Variance = = (2.23) 2 ( α + β ) ( α + β + 1) ( α + β + 1) such Equation 2.21 can be rewritten after stripping of all the normalizing constants as α 1 β 1 f ( p) p (1 p) (2.24) And, equation 2.5 can be modified as such f ( p) Pr X x p f ( p) (2.25) post = prior Therefore, equation 2.24 and equation 2.19 can be combined as f post ( p) p p x (1 p) x+ α 1 n x (1 p) p α 1 n x+ β 1 (1 p) β 1 (2.26) Equation 2.26 shows the posterior distribution is also beta distribution from the beta prior with a binomial likelihood function. The updated formula in the posterior beta distribution is
61 47 α = x + α, β = ( n x) + β (2.27) post prior post prior Therefore, the value of the posterior mean and variance can be calculated as such equation 2.22 and That is, the value of posterior mean can be calculated with prior parameters (α prior, β prior ) as such equation µ post α post x + α prior = = (2.28) α + β n + α + β post post prior prior In order to make sure the uncertainty, the credible interval of the posterior distribution may be calculated. The equation of (100q)th percentile is pq 2 2 = χ q (2α ) /(2β + χ q (2α )) (2.29) post post post 2 Where χ q (2α post ) is the qth quantile of a chi-squared distribution with 2 α post degrees of freedom. In case of beta distribution (α, β) with β>>α, the qth quantile can be approximated by chi-squared distribution as shown in equation In this research, the chi-squared distribution percentiles of equation 2.29 may be used to obtain credible interval of a beta distribution instead of the beta distribution percentiles since every posterior β parameter is much larger than α parameter as shown in Appendix C. As such the case of the frequency of initiating event, when there is very little prior information of a parameter, Jeffreys non-informative prior may be used as a prior distribution. With Binomial data as a likelihood function, the Jeffreys non-informative prior distribution can be a beta distribution which both parameter α and β are equal to ½. If the normalizing constant in equation 2.21 is ignored, a function that is proportional to 1/ 2 1/ 2 p (1 p) can be yielded and it is shown in Figure 2.8. As shown in Figure 2.8, the distribution might be considered as a uniform distribution.
62 48 Figure 2.8 Jeffreys non-informative prior distribution for PFD [23] Corresponding to equation 2.27, formal application of the updated formulas for Jeffreys non-informative prior is α = x + 0.5, β = n x (2.30) post post Thus, posterior mean of Jeffreys prior is α post x µ post = = (2.31) α + β n + 1 post post Bayesian credible interval can be calculated as such equation 2.29.
63 49 3. THE DEVELOPMENT OF BAYESIAN-LOPA METHODOLOGY The purpose of the section is to show how to combine Bayesian logic and LOPA method and how to develop the Bayesian-LOPA methodology. Additionally, this section demonstrates how to convert the prior information into posterior data with likelihood data. This section is based on the method description of Section 2 as well as the literature review of Section 1, so some contents may be similar OVERALL RESEARCH FLOW Bayesian-LOPA methodology, which is a new terminology developed in this research, is the advanced LOPA method combined with Bayesian estimation. The developed methodology may give more statistically reliable or concrete results of risk in a LNG facility than the normal LOPA methods. LNG industry has been keeping good safety records since it had been introduced in the industry. However, the operational history of the LNG industry is not enough to make sure the statistical stability of failure data as opposed to other industries such as refineries or petrochemical industries. That is, the failure data in the LNG facilities has statistically shaky grounds due to short-term based operational time and the number of demands. Therefore, in order to improve the reliability data in LNG industry, Bayesian estimation which can update plant specific data from LNG facilities with the generic data which have long-term historical experience can be one of the best progressions for risk assessments. Figure 3.1 shows the flow diagram of this research, and it also shows the every step for Bayesian-LOPA methodology. The Bayesian-LOPA methods can be applied to other industries which may have some uncertainties about the statistical reliability of failure data in risk assessments due to insufficient failure samples or shot-term operational time, e.g. aerospace industries.
64 50 Process information Process Flow Diagram, P&ID, Process Data Process Hazard Analysis (PHA) HAZOP Estimate Consequence & Severity Category approach Develop Scenarios From PHA results Scenario : Initiating event + Consequence Identify Initiating Event Frequency Identify Related IPLs & Estimating PFDs of IPLs Bayesian Engine Generic Data & Plant Specific Data IPL : Independence, Effectiveness, Auditability PFD of IPLs : Generic, plant specific data Estimate Scenario Frequency f f c i c i J I = f i j = 1 = f I i PFD PFD i1 i j PFD i 2... PFD ij Risk Ranking, Make Risk Decisions Risk Ranking Compare with tolerable risk criteria Recommendations for Safety Enhancement Add IPLs or safety measures Figure 3.1 The flow diagram of this research LOPA is the method of simplified process risk assessment which is typically applied after a process hazard analysis such as HAZOP study. For LOPA applications, the results of PHA are necessary to develop incident scenarios in the interested facilities such as a LNG importation terminal. HAZOP study is one of the most reliable qualitative hazard identification methods. Thus, HAZOP method will be used to identify
65 51 the incident scenarios in a LNG importation terminal. For HAZOP study, it is necessary to obtain the process information about a LNG terminal. This information may include process flow diagram, piping and instrument diagram (P&ID), and process data. Typically, it is very hard to obtain these kinds of process information. Even if the information is available, usually it is impossible to open to the public due to some copyright issues. Thus, in this research, generalized and simplified process flow diagrams and P&IDs were used. However, they still include the basic design concept and minimum specification adopted from the industrial standards such as NFPA 59A [6] and EN 1473 [1] of a LNG terminal. After getting the process information, a HAZOP team should be required to do HAZOP study. A HAZOP team was composed of a professor, 2 post doctors, and 7 graduate students. The HAZOP study was done by the team following the methodology mentioned in Section 2.1. The incident scenarios found in HAZOP study will be estimated according to severity by a category method. The category method is the qualitative way to classify the consequences with engineering expert judgments. This category may be decided by the expected amount of release, the risk level of possible consequences (material loss, fire, explosion, or toxic effects). The category method will screen the possible incident scenarios with respect to the severity of consequences, and only the screened risky scenarios which may result in fatalities or large property damage will be applied to Bayesian-LOPA methodology. The next step is to develop the possible incident scenarios based on the HAZOP results. The incident cases screened by the severity of consequence can be made to incident scenarios combining the causes and consequences in HAZOP study. Typically, this process can be quite easily done if the PHA results are available previously. Causes found in HAZOP results may be initiating events of incident scenarios. After identifying an initiating event of a scenario, the frequency of the initiating event should be obtained for a LOPA application. There are three categories of data sources for initiating events. The first one is the generic data which are historical data from the same or similar industries such as refineries or petrochemical industries have long-term
66 52 operational time and also sufficient population of sampling data enough to stabilize the statistical view of failure data. However, it cannot reflect the characteristics and conditions of the plant that the equipment is operated under. Second is the plant specific data which can be obtained from LNG facilities can reflect the exact circumstances that the equipment is used under. However, LNG industry has not quite long enough history in gathering failure data and operational time rather than refineries and petrochemical industries. Thus, they are very hard to obtain due to confidential issues among industries and are very sparse due to a short-term operational time and history. Moreover, they may have statistically weak grounds due to a short duration or limited population of data collection. Therefore, one of the best options for high reliable risk assessments is to use the Bayesian engine (or estimation) which can be third category of data sources. Bayesian estimation can make the failure data updated with prior information from generic data and plant specific data from LNG industry. That is, the updated posterior data will reflect both the long-term operational history from generic data and the specific environments which the equipment (or facility) is operating under. Thus, Bayesian engine will be used to find out the frequencies of initiating events. The mathematical formulas and calculation diagram are addressed in Section 3.3. After getting the frequency data of an initiating event, it is necessary to identify Independent Protection Layers (IPLs). The IPL can be found and chosen in the list of safeguards of every incident case in HAZOP results. However, even though all IPLs can be safeguards, not all safeguards are IPLs because IPLs should meet the three requirements: independence, effectiveness, and auditability. Thus, very careful consideration should be taken to choose a safeguard as an IPL. Detail information of IPL is addressed in Section 2.2. Now, the probability of failure on demand (PFD) of each IPL should be obtained. Generally, this procedure is very similar to the Bayesian estimation of the frequency of initiating events. However, there are a few differences in the detailed mathematical calculations and distributions. The differences are addressed in the Sections 3.3 and 3.4.
67 53 The next step is to determine the frequency of an incident scenario. This step is very straightforward using spreadsheet programs or manual calculations. In this research, Microsoft EXCEL software is used. The last step is to make risk decisions by comparing an obtained frequency to tolerable risk criteria. These risk criteria may be given by companies, industries, or government. Two risk criteria presented by CCPS [11] are used in this research. One is the case with considering human harm in the incident scenario. In the case, maximum 5 tolerable risk criteria is less than 1 10 / year and action required criteria is less than / year. The other is case without considering human harm, that is, only consider consequences such as release, fire or explosion. Maximum tolerable risk criteria is less 5 4 than 1 10 / year and action required criteria is less than 1 10 / year. If the estimated frequency cannot meet the tolerance criteria, some recommendations which may include additional IPLs or more frequent proof tests should be given to reduce the incident frequency or mitigate the severity of consequence. The procedure of recommendations will be treated in each incident case. As shown in Figure 3.1, these steps will be repeated to each incident scenario. The frequency of each incident scenario will be estimated and then all frequencies can be compared each other to rank the risks among incident scenarios. This risk ranking may be used to find out the priority of maintenance (or repair) or safety measures.
68 THE SUMMARY OF FAILURE DATA In order to use the Bayesian engine and obtain the updated failure data, generic data and plant specific data should be available. For this research, several data sources were gathered and some of them will be used. Brief introduction of each data source may be useful to choose appropriate data sources THE DEVELOPMENT OF AN IMPROVED LNG PLANT FAILURE RATE DATA BASE Johnson and Welker [27] have reported a survey of events on LNG plants. The data were obtained from 27 separate LNG facilities including LNG base loads or satellite facilities. The plant in-service time is approximately 1,626,000 hours. The data base provided operating hours, the number of failures, and mean time between failures (MTBF) of major equipments as shown in Figure 3.2. The data source will be used as plant specific data of likelihood function in Bayesian estimation.
69 55 Figure 3.2 Summary of major failures in LNG plant failure rate data base [27] EIReDA The EIReDA (European Industry Reliability Data Bank) is operated by ESReDA (European Safety and Reliability Research and Development Association). The data were collected from nuclear power plants operated by Electricite de France and analyzed using Bayesian logic. It provides the mean values of frequency and PFD as well as distribution parameters. In the data source, gamma distribution was used for failure frequency and the values of α and β parameters were provided. For probability of failure on demand, beta distribution and its values of α and β parameters were provided as shown in Figure 3.3. EIReDA will be used as generic data of a prior distribution in Bayesian estimation, especially for the PFDs of IPLs.
70 Figure 3.3 Example from EIReDA data bank [28] 56
71 OREDA OREDA (The Offshore Reliability Data) is based on the off-shore installations such as platforms. It gives the number of failures, operational time, failure rates, standard deviations, and mean repair time as shown Figure 3.4. It also provides lower, mean, and upper values based on gamma distribution for the huge number of items. It will be used as one of the generic data of prior distribution in Bayesian estimation for initiating event frequencies as well as PFDs of IPLs. Figure 3.4 Example from OREDA database [28]
72 CCPS CCPS (The Center for Chemical Process Safety) provided Guidelines for process equipment reliability data with data tables for process equipment, process systems, and chemical manufacturing operations. It provides failure frequencies with lower, mean, and upper as well as PFDs. It used the lognormal distribution to identify the credible intervals. However, it didn t provide the number of failures and number of demands OTHERS Other data sources which may be used for risk assessments have been founded: Idaho Chemical Processing Plant Failure Rate Database [28], SES Long Beach LNG Import Project (Quantitative Risk Analysis) [29], and Comparative Risk Assessment of LNG Tank Designs Training [7]. Table 3.1 shows the comparison among several data sources which may show their own characteristics and given types of data.
73 59 Table 3.1 The comparison of failure data sources Class. base Frequency of initiating events PFDs of IPLs Mean failure time Data source Repair No. of Operating No. of mean Distribution S.D. EF mean distribution S.D. EF MTBF MTTR time(man failure time demand hour) EIReDA Gamma(α,β) Beta(α,β) OREDA Gamma CCPS Lognormal Lognormal Idaho Lognormal Lognormal LNG data base QRA Long beach LNG Comparative LNG tank Gamma Normal (KGS) 59
74 BAYESIAN ESTIMATION FOR INITIATING EVENTS The frequencies of initiating events can be estimated by Bayesian engine. The gamma distribution is used as a conjugate prior distribution with Poisson distribution as a likelihood function. The posterior data of failure frequency also are obtained from gamma distribution according to conjugate concept. OREDA data made from gamma distribution are used as a prior distribution. LNG plant failure rate database which is a plant specific data is used as a likelihood function of Poisson distribution. The updated posterior failure frequencies of initiating events will be estimated by Bayesian logic (or engine). However, OREDA data have one different parameter in the gamma distribution which is used in Bayesian estimation with a gamma conjugate prior. The equation 3.1 (which is also shown in Section 2.1) is the equation of the gamma distribution in Bayesian estimation for initiating events and equation 3.2 is the equation of gamma distribution of OREDA database. f β Γ( α) α α 1 λβ ( λ) = λ e (3.1) 1 α λ ( ) 1 1 ( ) λ α 1 γ γ α 1 γ f ( λ) = λ e = λ e (3.2) α γ Γ( α) Γ( α) By comparing equation 3.1 and 3.2, one difference can be found in a parameter and the parameter relationship is 1 β = (3.3) γ When equation 3.3 is substituted into equation 2.12, the equations of posterior parameters are α = x + α, β = t + β = t +1/ γ (3.4) post prior post prior prior Then, mean frequency of posterior distribution is µ post α post x + α prior x + α prior = = = (3.5) β t + β t +1/ γ post prior prior
75 61 Other procedures are same within Section 2.3.1, and Figure 3.5 shows the schematic diagram of the Bayesian estimation for failure frequencies of initiating events. When there is little belief of prior distribution or generic data are not available for some equipment, Jeffreys non-information prior may be used. As shown in Section 2.3.1, the Jeffreys non-informative prior distribution can be a gamma distribution which shape parameter, α, is equal to ½ and scale parameter, β, is equal to zero. Thus, posterior parameters for Jeffreys non-informative prior is α = x + 0.5, β t (3.6) post post = Thus, posterior mean of Jeffreys prior is α post x µ post = = (3.7) β t post Other procedures are the same within Section 2.3.1, and a schematic diagram for Jeffreys non-informative prior is shown in Figure 3.6.
76 62 Frequency of initiating event with informative prior Prior distribution (frequency) Gamma distribution α β α 1 λβ f ( λ) = λ e Γ( α) α prior OREDA µ µ V σ = =, γ = = 2 prior V σ µ µ Likelihood function (probability) Poisson distribution λt x e ( λt) Pr( X = x) = x! LNG facility failure data x : No. of failures t : time to failure OREDA 1 α ( γ ) α 1 f ( λ) = λ e Γ( α ) β = γ 1 1 λ ( γ ) Bayesian Engine f post λ ( x+ α prior ) 1 λ ( t+ β prior ) e Posterior distribution (frequency) Gamma distribution, α post = x + α prior, β post = t + β prior = t + 1/ γ prior Mean of Posterior frequency α post x + α prior x + α prior µ post = = = β t + β t +1/ γ post prior prior 90% Bayes credible interval λ χ α β λ χ (2α ) / 2β 2 ( 2 post ) / 2 post, = = post post Figure 3.5 The schematic diagram of Bayesian estimation for initiating events with informative prior
77 63 Frequency of initiating event with non-informative prior Prior distribution (frequency) Jeffreys Non-informative prior Gamma distribution (0.5, 0) α prior 0.5, β = 0 = prior Likelihood function (probability) Poisson distribution λt e ( λt) Pr( X = x) = x! LNG facility failure data x : No. of failures t : time to failure x Bayesian Engine Posterior distribution (frequency) Gamma distribution ( x+ 0.5) 1 λ ( t ) f post λ e, α post = x + 0.5, β post = t Mean of Posterior frequency α post x µ post = = β t post λ 90% Bayes credible interval 2 = χ 0.05( 2x + 1) / 2t, λ = χ (2x 1) / 2t Figure 3.6 The schematic diagram of Bayesian estimation for initiating events with Jeffreys non-informative prior
78 BAYESIAN ESTIMATION FOR IPLs The PFDs of IPLs can be estimated by Bayesian engine. The beta distribution is used as a conjugate prior with binomial distribution as likelihood function. The posterior data of PFD also are obtained from beta distribution according to conjugate concept. EIReDA data made from beta distribution for PFD are used as a prior distribution preferentially. When PFD values and two parameters (α and β) of beta distribution of some pieces of equipment are available in EIReDA database, they can be used directly as the information of prior distribution in the Bayesian estimation. However, when there is no failure data about some pieces of equipment in EIReDA, OREDA may be used after converting frequency into PFD using the frequency-pfd conversion method. LNG plant failure rate data base which is a plant specific data is used as a likelihood function of binomial distribution. However, even though some failure rate data are available in LNG plant data base, it didn t provide the number of demands. The number of demands is one of the essential information to the binomial distribution together with the number of failures. Thus, it may be estimated by correlation between the equation of a point estimate and the PFD estimating equation. After that, the updated posterior PFD of an IPL will be estimated by Bayesian logic (or engine) with beta distribution. According to Sandia National Laboratories [23], if it is assumed that the probability is not dependent on the starting time of the period, t, and failures of systems during standby periods are independent of each other, the probability that a system is failed when observed at time t is p λt = 1 e (3.8) where λ is the failure rate. If it is assumed that there is periodic test of equipment and the unplanned demands occur at a random time within the testing cycle, in other words, the failures are revealed by the test, the PFD can be approximately estimated by PFD λt test = (3.9) 2
79 65 where T test is the proof test interval. The information of test intervals was shown in Table 1.2 and it will be used to obtain PFDs for this research. As shown in Section 2.3.2, a point estimate of p which is the most commonly used frequentist estimate is demands. PFD = x / n where x is the observed number of failures and n is the observed number of (3.10) According to Crowl [25], if it is assumed that failure rate, λ, is constant, MTBF which means the time interval between two failures of the component is given by 1 MTBF = (3.11) λ If it is assumed that the PFD value of point estimate in equation 3.10 is the same mean value in equation 3.9, the correlation of equation 3.9, 3.10 and 3.11 can give the equation of the number of demands as such 2x n = λ T 2xMTBF = test T test (3.12) By using the equation 3.12, the number of demands of operation can be estimated with the number of failures, MTBF, and proof test interval. Now, the posterior mean of PFD can be calculated using equation 2.28 and a schematic diagram of Bayesian estimation for PFD of an IPL is given in Figure 3.7.
80 66 PFD of IPL with informative prior α prior Prior distribution (probability) Beta distribution Γ( α + β ) α 1 f ( p) = p (1 p) Γ( α) Γ( β ) β 1 EIReDA µ (1 µ ) µ (1 µ ) = µ [ 1], β prior = (1 µ )[ 1] V V n Likelihood function (probability) Binomial distribution n x Pr( X = x) = p (1 p) x n x LNG facility failure data x : No. of failures, n : No. of demands x MTBF = 2 T test : proof test interval T test Bayesian Engine f post ( p) p ( x+ α prior ) 1 Posterior distribution (probability) Beta distribution (1 p) ( n x+ β prior ) 1, α post = x + α prior, β post = ( n x) + β prior µ post Mean of Posterior PFD α post x + α prior = = ( α + β ) n + α + β post post prior 90% Bayes credible interval 2 λ = χ 0.05( 2α ) /[2β + χ (2α )], λ = χ (2α ) /[2β + χ (2α 0.05 post post post 0.95 post post post prior )] Figure 3.7 The schematic diagram of Bayesian estimation for IPLs with informative prior of EIReDA
81 67 When EIReDA does not provide failure data about some pieces of equipment, OREDA may be used after converting frequency into PFD using the frequency-pfd conversion method as shown in Figure 3.8. OREDA is failure frequency data based on gamma distribution, but it is necessary to get PFD based on beta distribution. OREDA provides frequency intervals with lower (5% credible), mean, and upper (95% credible). It is possible to convert failure frequency into PFD using equation 3.9. By using equation 3.9, PFD interval from frequency interval can be obtained. Beta distribution is a flexible family of distributions that is useful for modeling phenomena that can range from 0 to 1. Probability shall range from 0 to 1. Thus, it may be assumed that obtained PFD intervals follow the beta distribution. In other words, the PFD values of lower, mean, and upper follow the beta distribution. In a beta distribution, there are two parameters (α, β) and equation of a mean value is α µ = (3.13) α + β If equation 3.13 is rewritten by β, the equation is α( 1 µ ) β = (3.14) µ If three factors which are the lower PFD value (5% credible), parameter α, and parameter β described with α and µ, parameter α can be calculated by Betadist( PFD Betadist( PFD L L, α, α(1 µ ) / µ ) = 0.05, α, α(1 µ ) / µ ) 0.05 = 0 (3.15) where betadist is the abbreviation of cumulative beta probability density function. In equation 3.15, PFD L and µ are already known and α is the only unknown variable, thus α can be found in an equality equation. Several spreadsheet programs such as MS/EXCEL provide the function of beta distribution and the solver function. Thus, the parameter α can be obtained using these software packages. If the obtained value of α parameter and known mean value, µ, are put into the equation 3.14, the value of β parameter can be found. Therefore, the obtained two parameters (α, β) can be used for the information of prior beta distribution in Bayesian estimation.
82 68 As shown in Figure 3.9, after getting two parameters of prior beta distribution, the procedures of likelihood function and posterior distribution estimated by Bayesian logic is same with the EIReDA case as a prior distribution (see Figure 3.7). When there is little belief of prior distribution or generic data are not available for some equipment, Jeffreys non-information prior may be used. As shown in Section 2.3.2, the Jeffreys non-informative prior distribution can be a beta distribution which both parameter, α, and parameter, β, are equal to ½. Thus, posterior parameters for Jeffreys non-informative prior is α = x + 0.5, β = n x (3.16) post post Thus, posterior mean of Jeffreys prior is α post x µ post = = (3.17) α + β n + 1 post post Other procedures are same with the case of informative prior, and a schematic diagram for Jeffreys non-informative prior is shown in Figure 3.10.
83 69 Convert frequency into PFD, and get α, β Frequency of OREDA (Gamma distribution) Frequency Lower (5%) Mean Upper (95%) PFD=λT test /2 PFD of OREDA PFD PFD L (Lower, 5%) µ (Mean) PFD U (Upper, 95%) Assume Beta distribution PFD (Beta distribution) α µ = α + β α( 1 µ ) β = µ EXCEL S/W Beta distribution (PFD L, α, α(1-µ)/ µ)-0.05=0 SOLVER Find α, and then α ( 1 µ ) β = Use α, β parameters of PFDs of a prior µ distribution Figure 3.8 Frequency-PFD conversion method
84 70 PFD of IPLs with informative prior Prior distribution (probability) Beta distribution Γ( α + β ) α 1 f ( λ) = p (1 p) Γ( α) Γ( β ) OREDA β 1 Using Frequency-PFD conversion method (see Figure 3.8) Likelihood function (probability) Binomial distribution n x Pr( X = x) = p (1 p) x n x LNG facility failure data x : No. of failures, n : No. of demands x MTBF n = 2 T test : proof test interval T test Bayesian Engine f post ( p) p ( x+ α prior ) 1 Posterior distribution (probability) Beta distribution (1 p) ( n x+ β prior ) 1, α post = x + α prior, β post = ( n x) + β prior µ post Mean of Posterior PFD α post x + α prior = = ( α + β ) n + α + β post post prior prior 90% Bayes credible interval 2 λ = χ 0.05( 2α ) /[2β + χ (2α )], λ = χ (2α ) /[2β + χ (2α 0.05 post post post 0.95 post post post )] Figure 3.9 The schematic diagram of Bayesian estimation for IPLs with informative prior of OREDA
85 71 PFD of IPLs with non-informative prior Prior distribution (probability) Jeffreys non-informative prior Beta distribution (0.5, 0.5) α prior 0.5, β = 0.5 = prior n Likelihood function (probability) Binomial distribution n x Pr( X = x) = p (1 p) x n x LNG facility failure data x : No. of failures, n : No. of demands x MTBF = 2 T test : proof test interval T test Bayesian Engine f post ( p) p ( x+ 0.5) 1 Posterior distribution (probability) Beta distribution (1 p) ( n x+ 0.5) 1, α post = x + 0.5, β post = ( n x) Mean of Posterior PFD α post x µ post = = ( α + β ) n + 1 post post 90% Bayes credible interval 2 λ = χ 0.05( 2α ) /[2β + χ (2α )], λ = χ (2α ) /[2β + χ (2α 0.05 post post post 0.95 post post post )] Figure 3.10 The schematic diagram of Bayesian estimation for IPLs with Jeffreys noninformative prior 3.5. EFFECT OF COMMON CAUSE FOR MULTIPLE COMPONENTS According to Summers [30], common cause failure is the failure of a device or occurrence of an event that results in the failure of an entire system or subsystem. When the common cause failure occurs, it may affect other device or system. In the process industry, multiple components or devices may be installed to reduce the failure rate or
86 72 probability as a redundancy. For example, two pressure relief valves should be installed in a LNG storage tank required by NFPA 59A [6]. The valves may have common cause failures due to same manufacturer s production or same operational environments. Even though they may not be independent each other and two valves may not be considered as respective IPLs, the use of two pressure relief valves provides additional safety than the installation of only one valve. Thus, it is necessary to set up the estimation methods of PFD for multiple devices. In the LNG industry, several types of multiple protections may be found as such 1oo2 (one out of two) and 2oo3 (two out of three). 1oo2 means that if only one of two devices work properly, the system will run successfully: in other words, both devices should fail for the system failure. In case of 1oo2 system, the average of PFD is 2 βλttest PFD = ( PFD1 oo1) + ( + βλmttr) (3.18) 2 Where β is the common cause factor, λ is the failure rate, T test is the proof test interval, and MTTR is the mean time to repair. If it is assumed that MTTR is much less than T test, the last term of the equation 3.18 may be negligible. Practically, this assumption is reasonable because test interval is a lot larger than the repair time. Then equation 3.18 may be simplified as PFD = ( PFD = ( PFD 1oo1 1oo1 ) ) 2 2 βλttest + ( ) 2 + β ( PFD 1oo1 ) (3.19) The second term on the right-hand side of equation 3.19 represents the effect of common cause failure. In case of 2oo3 system, the average PFD is PFD = 3( PFD = 3( PFD 1oo1 1oo1 ) ) 2 2 βλttest + ( ) 2 + β ( PFD 1oo1 ) (3.20) According to Summers [30], the common cause factor, β, has not been published yet to support the selection of beta factor. The selection may be decided by experience-
87 73 based expert judgment. However, if the multiple devices are designed to minimize the potential for common cause failure, the beta factor can be ranged from 0.1% to 5% for field device modeling. Corresponding to industrial expert judgments, the beta factor used for valves may be 0.1% and for sensors may be 5%. This estimation method for common cause failure will be used for multiple items in this research. As a reference, following measures may be used to reduce the common cause effects: Diversity For example, use of different type of valves, sensors, or different technologies, different manufacturers. Suitability Use the devices where they make sense. Simplicity The simpler system is, the less common cause failures exist BAYESIAN-LOPA SPREADSHEET After obtaining the frequencies of initiating events and PFDs of IPLs, the data can be plugged into a LOPA spreadsheet as shown in Table 3.2. The spreadsheet can automatically compute the frequency of an incident scenario when the required data are input. The estimated frequency is compared to tolerable risk criteria, and whether it meets the criteria or not will be recorded in a space of criteria met? For every incident scenario, the same procedure will be applied and then the frequency values obtained from each scenario can be compared each other to rank the risk.
88 74 Table 3.2 The format of LOPA spreadsheet of this research Scenario No. Scenario Title : Node No. Date Description Probability Frequency (per year) Consequence Description/Category Risk Tolerance Criteria (Frequency) Initiating event (frequency) Enabling event or condition Action required Tolerable < 1x10⁻³ < 1x10⁻⁵ Conditional modifiers (if applicable) Frequency of Unmitigated Consequence Independent Protection Layers Total PFD for all IPLs Frequency of Mitigated Consequence Risk Tolerance Criteria Met? (Yes/No) Actions required to meet Risk Tolerance Criteria Notes References
89 75 4. RESULTS OF BAYESIAN-LOPA METHODOLOGY AND VALIDATION 4.1. THE RESULTS OF HAZOP STUDY AND SCENARIO MAKING The HAZOP study was conducted by a team which consisted of one professor, two post doctors, and seven graduate students from the Artie Mcferrin department of chemical engineering at Texas A&M University and the Mary Kay O Connor Process Safety Center on July 19, The results are shown in Appendix B. However, the HAZOP study was not fully completed because of insufficient process information and use of simplified process flow diagram and P&ID. In other words, the study was focused on a few incident cases which may have outcomes with major dangerous consequences. For the HAZOP study, three nodes were considered in an LNG importation terminal as shown in Table 4.1. The HAZOP study created approximately twenty incident cases. Each scenario of LOPA was created by combination of a cause and a consequence in the HAZOP results. For LOPA study, seven scenarios, as shown in Table 4.2, were chosen according to the severity of consequences and the importance of equipment. Two scenarios were chosen in the unloading arm area (node 1) and recondenser & HP pump area (node 2), and three scenarios were selected in the storage tank system (node 3).
90 76 Table 4.1 HAZOP nodes in a LNG terminal Node Description/design intent Design conditions/parameters 1. LNG liquid unloading from ship to tank 2. LP LNG pump discharge to recondenser & HP pump suction 3. LNG tank system LNG unloads from tanker (ship) to a storage tank LP LNG pump feeds LNG to HP LNG pump to boost. This LNG is passed through recondenser to condense BOG. LNG will be stored in this tank and then be sent through recondenser to vaporizer. A shutdown valve is provided at the unloading arm LP pump is provided in each tank to supply LNG to HP pump which boosts this liquid to higher pressure. Pressure of a tank is almost atmospheric pressure and insulation is provided to keep LNG cool.
91 77 Table 4.2 LOPA incident scenarios Scenario Node Causes Consequences Scenarios No. No. 1 1 Loading arm failures due to flange joint or Release of LNG due to loading arm failures LNG leakage from loading arms during unloading swivel joint failures resulting from swivel joints failure and flange joints failures 2 1 During unloading, BV-1 spurious trip closure Pressure increase of unloading arm Pressure increase of unloading arm due to BV-1 failed closure during unloading 3 2 BV-32 spurious failed closure HP pump damage leading to possible leakage and fire HP pump cavitation and damage due to lower pressure of recondenser resulting from BV-32 failed closure. Leakage and fire. 4 2 FCV-33 spurious full open LNG level increase and leads to carryover into annular space resulting in possible overpressure in tank Higher temperature in recondenser due to more BOG input resulting from FCV-33 spurious full open. Cavitation and pump damage leading to leakage 5 3 Rollover due to stratification Overpressure in tank and possible damage Overpressure in tank due to rollover resulting from stratification and possible damage in tank 6 3 Human errors (operator lines up the wrong tank) LNG level increases and leads to carryover into annular space resulting in possible overpressure in tank LNG level increases and leads to carryover into annular space of LNG because operator lines up the wrong tank. Possible overpressure in tank. 7 3 LP pump-out without BOG input due to BV-25 spurious failed closure Underpressure in tank and possible damage of tank Underpressure in tank due to pump-out without BOG input resulting from BV-45 fail closure. Possible damage of tank
92 LOOK-UP TABLE OF FAILURE RATES The look-up table shows all failure data of frequency or probability of failure on demands of equipment or operational systems which were used in this research. In other words, the look-up table may be the summary sheet of failure data so that researchers or analysts can easily look at failure rate or probability data of equipment which were used in a research or risk analysis and apply to risk assessment methods. It provides generic failure data as a prior distribution and LNG plant specific data as a likelihood function. For the prior information, either EIReDA or OREDA data base was used according to data availability. For the likelihood information, LNG plant failure rate data base collected from LNG facilities was used. It was classified into two parts; the frequencies of initiating event and the PFDs of IPLs. Table 4.3 provides the frequency data of initiating events and Table 4-4 shows PFDs of IPLs. Moreover, those look-up tables also include alpha and beta parameter values of gamma and beta distribution for some pieces of equipment.
93 79 Table 4.3 Look-up table of failure frequencies of initiating events Class. Prior information likelihood information event min mean(/y) max S.D. reference & note operating years rollover 6.50E E E E-03 [7], KGS, p E+02 4 Shut-off Valve (BV) fail close human errors in filling procedures FCV fail to regulate loading arm failure 8.64E E E E E E E E-02 [31], OREDA, p.788 (spurious operation) [31], OREDA, p.732 (fail to regulate) no.of failures 0.00E E E E-03 [31], OREDA, p E+02 5 reference & note [27], cryogenic storage systems, major 7.27E+02 4 [27], cryogenic valves, major 5.53E [27], human errors, major 7.27E+02 4 [27], cryogenic valves, major [27], truck loading and unloading, overall 79
94 80 Table 4.4 Look-up table of failure probabilities of IPLs Class. Prior information likelihood information event PRV, VRV EMOV, BV (stop valve) FCV (Solenoid valves) pressure alarm density monitor PFD lower 3.00E E E E- 03 PFD mean 4.70E E E E- 03 PFD upper 6.00E E E E- 02 Alpha beta SD 2.90E E E E E E E- 03 Lower (/y) 1.73E- 04 fire detector (flameinfrared) gas detector (hydrocarbon gas) 3.46E E- 02 Mean (/y) 4.22E E E- 02 Upper (/y) 1.62E E E- 02 SD 5.96 E E E- 02 reference [32], EIReDA p.105 [32], EIReDA p.127 [32], EIReDA p.99 [31], OREDA p.559 [7], KGS, p.323 [31], OREDA p.520 [31], OREDA p.526 No. of failure MTBF (year) 1.82E E E E E +01 reference [27], cryogenic valves, major [27], cryogenic valves, overall [27], cryogenic valves, major test interval (year) N.A [27], flame detector, major [27], gas detectors, major
95 81 Table 4.4 Continued Class. Prior information likelihood information event HP, LP pump BOG compressor reciprocating level detector and alarm operator fail to shutdown on high level alarm temperature alarm PFD lower 1.10E E E- 04 PFD mean 1.90E E E- 04 PFD upper 2.70E E E- 02 alpha beta SD 8.80E E E E E- 03 Lower (/y) 1.28E E- 04 Mean (/y) 4.02E E- 02 Upper (/y) 8.00E E- 01 SD 2.11 E E- 02 reference [32], EIReDA p.53 [32], EIReDA, p.28 [31], OREDA p.544 [7], KGS, p.337 [31], OREDA p.560 No. of failure MTBF (year) 4.75E E E E +02 reference [27], cryogenic pump, minor [27], compressor systems, major [27], process control system, major [27], low temp. detector, major test interval (year)
96 RESULTS OF RISKS UNLOADING ARM AREA (NODE 1) prepared. In the unloading arm area (node 1), two Bayesian-LOPA incident scenarios were SCENARIO 1 (LNG LEAKAGE FROM LOADING ARMS DURING UNLOADING) LNG may leak during the unloading operation if there are failures of flange or swivel joints in unloading arms. The consequence of liquid line failure will be much more severe than the one of vapor return line failure because LNG can be vaporized into gas with the volume of 600 times of gas phase. Careful measures should be taken in the unloading arm area because arms have several joints which may be likely to be leakage sources and be vulnerable to external impacts such as bad weathers or ship tanker movements. The frequency of the loading arm failures as an initiating event may be estimated with the OREDA data and LNG facility failure data base. OREDA provides the failure frequency of a flowline including joints, pipe spool, isolation valve, and pipe. It is used as prior information of generic data in Bayesian estimation. The LNG failure database gives the operating hours, number of failures, and MTBF of the truck loading and unloading facilities. The data of truck loading facilities does not exactly fit unloading arms of a ship tanker, but it still can be used for a ship tanker because the configuration and design of truck loading arms are similar to the one of tanker unloading arms. Thus, the failure data of truck unloading arms are used as likelihood information of plant specific data. The estimated frequency data (per year) are shown in Figure 4.1. Figure 4.1 shows that the posterior value of failure frequency is between prior and likelihood
97 83 values. It means that the posterior values is updated with prior and likelihood information. That is to say, it means that the posterior value reflects both long-term based historical data from generic data and short-term based plant specific data. The vertical line of posterior column indicates the 90% Bayesian credible interval ranged from /year to /year. The detail information of these calculations is given in Appendix C. Frequency comparison Frequency (/year) Prior Likelihood Posterior Figure 4.1 Frequency of a loading arm failure corresponding to Bayesian estimation For this scenario, two IPLs may be considered. One is the gas detector and human intervention. The other is the fire detector and ESD valve. It is assumed that the functions of gas detector and fire detector are independent each other, and human intervention can be performed perfectly. IPL 1 is the gas detector and human intervention. The PFD of gas detector failures can be estimated with the OREDA data and LNG facility failure data base. OREDA provides the failure frequency of a hydrocarbon gas detector. These data should be converted into PFD by using Frequency-PFD conversion method as shown in Figure
98 The method can produce PFD as well as two parameter values of α and β of beta distribution. The parameter values are used as prior information. The LNG failure database provides the operating hours, number of failures, and MTBF of the gas detector which can be used as likelihood information of LNG plant specific data. The estimated PFDs of gas detectors are shown in Figure 4.2. The value is considered as the PFD of the IPL 1 because of the assumption of perfect human performance. Figure 4.2 shows that the posterior value of PFD is located between prior and likelihood values. The vertical line of posterior column indicates the 90% Bayesian credible interval ranged from to PFD comparison PFD Prior Likelihood Posterior Figure 4.2 PFDs of a gas detector corresponding to Bayesian estimation IPL 2 is the fire detector and the ESD valve. The PFD of fire detector failures can be estimated with the OREDA data and LNG facility failure data base. OREDA provides the failure frequency of a flame infrared fire detector. These data should be converted into PFD by using Frequency-PFD conversion method. The LNG failure database provides the operating hours, number of failures, and MTBF of the flame detector which
99 85 can be used as likelihood information. The estimated PFDs of flame detectors are shown in Figure 4.3. The vertical line of the posterior column indicates the 90% Bayesian credible interval ranged from to PFD comparison PFD Prior Likelihood Posterior Figure 4.3 PFDs of a flame detector corresponding to Bayesian estimation However, IPL 2 consists of the fire detector and the ESD valve. The PFD of ESD valve should be estimated also to identify the PFD of IPL 2. The PFD of an ESD valve can be estimated with the EIReDA data and LNG facility failure data base. EIReDA provides the mean value of PFD and parameter values of α and β in beta distribution for the electric motor operated stop valve (EMOV). They are used as prior information. The LNG failure database gives the operating hours, number of failures, and MTBF of the cryogenic valves. The estimated PFDs of an ESD valve are shown in Figure 4.4. The vertical line of the posterior column indicates the 90% Bayesian credible interval ranged from to
100 86 The failure case of IPL 2 shall be either failure of fire detector or an ESD valve. Thus, if it is assumed that fire detector and ESD valve is independent each other, following Boolean algebra equation can be used to estimate PFD of IPL 2. Pr( A B) = Pr( A) + Pr( B) Pr( A) Pr( B) (4.1) Therefore, total PFDs of IPL 2 are shown in Figure 4.5. PFD comparison PFD Prior Likelihood Posterior Figure 4.4 PFDs of an ESD valve corresponding to Bayesian estimation PFD comparison of IPL 2 PFD Prior Likelihood Posterior Figure 4.5 Total PFDs of an IPL 2 corresponding to Bayesian estimation
101 87 Consequently, the mitigated failure frequency of scenario 1 can be estimated with the LOPA spreadsheet as shown in Table 4.5. Table 4.5 LOPA spreadsheet of incident scenario 1 Scenario No. 1 Scenario Title: Posterior (Bayesian estimation) LNG leakage from Loading arms during unloading Date Description Probability Consequence Description/Category Risk Tolerance Criteria (Frequency) Release of LNG due to loading arm failures resulting from swivel joints failure and flange joints failures Action required Tolerable Node No. 1 Frequency (per year) > 1.00E-3 < 1.00E-5 Initiating event (frequency) Loading arm failures due to flange joint or swivel joint failures 2.75E-02 Frequency of Unmitigated Consequence 2.75E-02 Independent Protection Layers Gas detectors at the jetty and human intervention Fire detector and ESD 9.75E E-03 Total PFD for all IPLs Frequency of Mitigated Consequence (/year) Risk Tolerance Criteria Met? (Yes/No) Actions required to meet Risk Tolerance Criteria YES 1. Test intervals should be kept as following to keep the PFD (ESV and gas detector: 1 month, fire detector: 6 months). 2. The logic solver of gas and fire detector should be independent to get full credits of IPLs. Otherwise, one of them cannot be an IPL. 3.59E E-08 Notes
102 88 The comparison of risk values of scenario 1 among prior, likelihood, and posterior information is given in Figure 4.6. Figure 4.6 shows that the posterior value of failure frequency is located between prior and likelihood values. However, this trend is not always followed to all risk values estimated by LOPA for incidents. The posterior value of each initiating event or IPL should exist between the prior and likelihood values if an informative prior distribution is used for Bayesian estimation. If an initiating event and all IPLs have the same trend as shown in Figure 4.6, the final risk values estimated by LOPA will have the same trend because the values are multiplied each other. But, if an initiating event or some IPLs have different trends with Figure 4.6, the posterior values of risks may not be located between prior and likelihood values. In other words, some scenarios may have ascending or descending trends among prior, likelihood, and posterior values. The detail explanation and an example are shown in Section 4.4. Frequency comparison of incident scenario 1.60E E E-07 Frequency (/year) 1.20E E E E E E E E-08 Prior (only generic) Likelihood (only plant specific) 9.87E-08 Posterior (with Bayesian) Figure 4.6 Risk values of scenario 1 by LOPA
103 89 For the risk determination, the estimated posterior risk value, 9.87E-8, can be compared to the tolerable criteria, less than 1.00E-5. Thus, the risk decision is that scenario 1 is tolerable if the test intervals and independency between gas and fire detector given in the actions of Table 4.5 will be kept SCENARIO 2 (PRESSURE INCREASE OF UNLOADING ARM DUE TO BV-1 FAILED CLOSURE DURING UNLOADING) A block valve, BV-1, is installed to stop the flow of LNG in the LNG unloading pipeline in case of emergency. However, if the valve is closed accidentally due to spurious trip of the valve during unloading procedure, the pressure within unloading arms and pipelines will be increased to shut-off pressure of ship pumps. It may cause the undesirable consequences in the arms or pipelines. The frequency of the spurious trip to close of a block valve as an initiating event may be estimated with the OREDA data and LNG facility failure data base. OREDA provides the failure frequency of a spurious operation for a shut-off valve. It is used as prior information of generic data in Bayesian estimation. The LNG failure data base gives the operating hours, number of failures, and MTBF of the cryogenic valves which can be used as likelihood information of plant specific data. The estimated frequency data (per year) are shown in Figure 4.7. Figure 4.7 shows that the posterior value of failure frequency is located between prior and likelihood values. It means that the posterior values is updated with prior and likelihood information. That is to say, the posterior reflect both long-term based historical data from generic data and short-term based plant specific data. The vertical line of the posterior column indicates the 90% Bayesian credible interval ranged from /year to /year. The detail information of these calculations is given in Appendix C.
104 90 Frequency comparison Frequency (/year) Prior Likelihood Posterior Figure 4.7 Frequency of a spurious trip to close of a block valve corresponding to Bayesian estimation For this scenario, one IPL may be considered. It is the temperature safety valve (TSV). The PFD of a TSV can be estimated with the EIReDA data and LNG facility failure data base. EIReDA provides the mean value of PFD and parameter values of α and β in beta distribution for the pressure relief valve (PRV). The TSV has almost the same design configuration with PRV, so the failure data of PRV will be used. They are used as prior information. The LNG failure database provides the operating hours, number of failures, and MTBF of the cryogenic valves. The data base did not give the specific failure data of pressure relief valves. However, it provides the failure data of cryogenic valves. Thus, cryogenic valve data will be used for the pressure relief valves in this research. The estimated PFDs of a TSV are shown in Figure 4.8. The vertical line of the posterior column indicates the 90% Bayesian credible interval ranged from to
105 91 PFD comparison PFD Prior Likelihood Posterior Figure 4.8 PFDs of a TSV corresponding to Bayesian estimation Consequently, the mitigated failure frequency of scenario 2 can be estimated with the LOPA spreadsheet as shown in Table 4.6. The comparison of risk values for scenario 2 is given in Figure 4.9. Figure 4.9 shows that the posterior value of failure frequency is located between prior and likelihood values.
106 92 Table 4.6 LOPA spreadsheet of incident scenario 2 Scenario No. Scenario Title: Posterior (Bayesian estimation) Pressure increase of unloading arm due to BV-1 2 failed closure during unloading Date Description Probability Node No. 1 Frequency (per year) Consequence Description/Category Pressure increase of unloading arm Risk Tolerance Criteria (Frequency) Action required Tolerable > 1.00E-3 < 1.00E-5 Initiating event (frequency) During unloading, BV-1 spurious trip close 5.51E-03 Enabling event or condition N/A Conditional modifiers (if applicable) Frequency of Unmitigated Consequence N/A N/A 5.51E-03 Independent Protection Layers A TSV along transfer line 5.26E-04 Total PFD for all IPLs Frequency of Mitigated Consequence (/year) Risk Tolerance Criteria Met? (Yes/No) YES 5.26E E-06 Actions required to meet Risk Tolerance Criteria 1. A PSV may be installed before TSV, unless TSV can operate as a PSV in case of overpressure. Notes 1. Unloading arm and pipe were designed to bear the shut-off pressure of ship pump. References
107 93 Frequency comparison of incident scenario 3.50E E E-05 Frequency (/year) 2.50E E E E E E E E+00 Prior (only generic) Likelihood (only plant specific) Posterior (with Bayesian) Figure 4.9 Risk values of scenario 2 by LOPA For the risk determination, the estimated posterior risk value, 2.90E-6, can be compared to the tolerable criteria, less than 1.00E-5. Thus, risk decision is that scenario 2 is tolerable.
108 RECONDENSER AND HP PUMP AREA (NODE 2) SCENARIO 3 (HP PUMP CAVITATION AND DAMAGE DUE TO LOW PRESSURE OF RECONDENSER RESULTING FROM BV- 32 FAILED CLOSURE. POSSIBLE LEAKAGE AND FIRE) If the pressure of the recondenser is very low due to BV-32 spurious trip to close, the HP pump which is located downstream from the recondenser may be damaged due to cavitation resulting in possible leakages. The frequency of the spurious trip to close of a block valve as an initiating event may be estimated with the OREDA data and LNG facility failure data base as such scenario 2. OREDA provides the failure frequency of a spurious operation of a shut-off valve. The LNG failure data base gives the operating hours, number of failures, and MTBF of the cryogenic valves which can be used for likelihood information as plant specific data. The estimated frequency data (per year) are shown in Figure Figure 4.10 shows that the posterior value of failure frequency is between prior and likelihood values. The vertical line of the posterior column indicates the 90% Bayesian credible interval ranged from /year to /year. The detail information of these calculations is given in appendix C.
109 95 Frequency comparison Frequency (/year) Prior Likelihood Posterior Figure 4.10 Frequency of a spurious trip to close of a block valve corresponding to Bayesian estimation For this scenario, one IPL may be considered. It is the low pressure alarm and HP pump trip to stop. The PFD of a pressure alarm can be estimated with the OREDA data and LNG facility failure database. OREDA provides the failure frequency of a pressure sensor. These data should be converted into PFD by using Frequency-PFD conversion method for prior information. The LNG failure database gives the operating hours, number of failures, and MTBF of the process control system which includes any occurrence which caused a loss of function of the process control system. That is, process control system can include the pressure sensors. Thus, the data are used as the likelihood function. The estimated PFDs of a pressure alarm are shown in Figure The vertical line of posterior column indicates the 90% Bayesian credible interval ranged from to
110 96 PFD comparison PFD Prior Likelihood Posterior Figure 4.11 PFDs of a pressure alarm corresponding to Bayesian estimation However, IPL 1 consists of the pressure alarm and HP pump trip. The PFD of HP pump also should be estimated to find out the PFD of IPL 1. The PFD of an HP pump can be estimated with the EIReDA data and LNG facility failure data base. EIReDA provides the mean value of PFD and parameter values of α and β in beta distribution for a pump. The LNG failure database gives the operating hours, number of failures, and MTBF of the cryogenic pumps. The estimated PFDs of an HP pump are shown in Figure The vertical line of posterior column indicates the 90% Bayesian credible interval ranged from to
111 97 PFD comparison PFD Prior Likelihood Posterior Figure 4.12 PFDs of an ESD valve corresponding to Bayesian estimation The failure case of IPL 1 shall be either failure of a low pressure alarm or HP pump. Thus, if it is assumed that pressure alarm and HP pump is independent each other, the Boolean algebra equation can be used to estimate PFD of IPL 1 as given in equation 4.1. Therefore, total PFDs of IPL 1 are shown in Figure 4.13.
112 98 PFD comparison of IPL PFD Prior Likelihood Posterior Figure 4.13 Total PFDs of the IPL corresponding to Bayesian estimation Consequently, the mitigated failure frequency of scenario 3 can be estimated with the LOPA spreadsheet as shown in Table 4.7.
113 99 Table 4.7 LOPA spreadsheet of incident scenario 3 Scenario No. 3 Scenario Title: Posterior (Bayesian estimation) HP pump cavitation and damage due to low pressure of recondenser resulting from BV-32 failed closure. Possible leakage and fire. Date Description Probability Consequence Description/Category Risk Tolerance Criteria (Frequency) Initiating event (frequency) Enabling event or condition Conditional modifiers (if applicable) Frequency of Unmitigated Consequence Independent Protection Layers HP pump damage leading to possible leakage and fire Action required Tolerable BV-32 spurious fail close N/A N/A N/A Low pressure alarm and HP pump trip 2.48E-03 Node No. 2 Frequency (per year) > 1.00E-3 < 1.00E E E-03 Total PFD for all IPLs Frequency of Mitigated Consequence (/year) Risk Tolerance Criteria Met? (Yes/No) Actions required to meet Risk Tolerance Criteria Notes NO 1. HP pump should be tripped in case of low-low level of recondenser 2. It is better that the HP pump is an auto circulation type to control the pump out and prevent cavitation. 3. The test intervals of pressure alarm and HP pump should be kept 1 month, respectively. 2.48E E-05 References
114 100 The comparison of risk values of scenario 3 is given in Figure Figure 4.14 shows that the posterior value of failure frequency is located between prior and likelihood values. Frequency comparison of incident scenario 7.00E E E-05 Frequency (/year) 5.00E E E E E E E E+00 Prior (only generic) Likelihood (only plant specific) Posterior (with Bayesian) Figure 4.14 Risk values of scenario 3 by LOPA For the risk determination, the estimated posterior risk value, 1.37E-5, can be compared to the tolerable criteria, less than 1.00E-5. Thus, risk decision is that scenario 3 is not tolerable, so additional IPLs should be required. Two recommendations are suggested as shown in the actions of Table 4.7. First, the HP pump should be tripped in case of low-low level of the recondenser to prevent the cavitation of HP pump, and second, the HP pump may be an auto circulation type to control the pump out and prevent cavitation. If these actions are applied to the equipment, the risk value will be reduced to meet the tolerable criteria.
115 SCENARIO 4 (HIGHER TEMPERATURE IN RECONDENSER DUE TO MORE BOG INPUT RESULTING FROM FCV-33 SPURIOUS FULL OPEN. POSSIBLE CAVITATION AND DAMAGE OF HP PUMP LEADING TO LEAKAGE) If the temperature of the recondenser is higher than normal conditions due to more BOG input resulting from FCV-33 spurious full open, the unexpected overflowing BOG may lead to cavitation of the HP pump. Additionally, it may result in possible damage of the pump and leakage of LNG and natural gas. The frequency of the spurious full open of a flow control valve (FCV) as an initiating event may be estimated with the OREDA data and LNG facility failure data. OREDA provides the failure frequency of the fail-to-regulate case of a FCV. The LNG failure database gives the operating hours, number of failures, and MTBF of the cryogenic valves. The estimated frequency data (per year) are shown in Figure Figure 4.15 shows that the posterior value of failure frequency is located between prior and likelihood values. The vertical line of the posterior column indicates the 90% Bayesian credible interval ranged from /year to /year. The detail information of these calculations is given in Appendix C.
116 102 Frequency comparison Frequency (/year) Prior Likelihood Posterior Figure 4.15 Frequency of a spurious full open of a FCV corresponding to Bayesian estimation For this scenario, two IPLs may be considered. One is the high temperature alarm and human intervention. The other is the gas detector and human intervention. It is assumed that the functions of the temperature alarm and gas detector are independent each other, and human intervention can be performed perfectly. IPL 1 is the high temperature alarm and human intervention. The PFD of a temperature alarm can be estimated with the OREDA data and LNG facility failure data base. OREDA provides the failure frequency of a temperature sensor. These data should be converted into PFD by using Frequency-PFD conversion method as shown in Figure 3.8. This method can produce PFD as well as two parameter values of α and β in beta distribution. The values of parameters are used as prior information. The LNG failure database gives the operating hours, number of failures, and MTBF of the temperature detector. The estimated PFDs of a temperature alarm are shown in Figure The value is considered as the PFD of the IPL 1 because of the assumption of perfect human performance. Figure 4.16 shows that the posterior value of PFD is located between prior
117 103 and likelihood values. The vertical line of the posterior column indicates the 90% Bayesian credible interval ranged from to PFD comparison PFD Prior Likelihood Posterior Figure 4.16 PFDs of a temperature alarm corresponding to Bayesian estimation IPL 2 is the gas detector and human intervention. The PFD of a gas detector can be estimated with the OREDA data and LNG facility failure data base. OREDA provides the failure frequency of a hydrocarbon gas detector. These data should be converted into PFD by using Frequency-PFD conversion method as shown in Figure 3.8. The LNG failure database gives the operating hours, number of failures, and MTBF of a gas detector. The estimated PFDs of a gas detector are shown in Figure The value is considered as the PFD of the IPL 1 because of the assumption of perfect human performance. Figure 4.17 shows that the posterior value of PFD is located between prior and likelihood values. The vertical line of the posterior column indicates the 90% Bayesian credible interval ranged from to
118 104 PFD comparison PFD Prior Likelihood Posterior Figure 4.17 PFDs of a gas detector corresponding to Bayesian estimation Consequently, the mitigated failure frequency of scenario 4 can be estimated with the LOPA spreadsheet as shown in Table 4.8.
119 105 Table 4.8 LOPA spreadsheet of incident scenario 4 Scenario No. 4 Scenario Title: Posterior (Bayesian estimation) Higher temperature in recondenser due to more BOG input resulting from FCV-33 spurious full open. Possible cavitation and damage of HP pump leading to leakage. Date Description Probability Consequence Description/Category Risk Tolerance Criteria (Frequency) Initiating event (frequency) Frequency of Unmitigated Consequence Independent Protection Layers LNG level increase and lead to carryover into annular space resulting in possible overpressure in tank Action required Tolerable FCV-33 spurious full open High temperature alarm and human intervention Gas detector and human intervention 3.34E E-04 Node No. 2 Frequency (per year) > 1.00E-3 < 1.00E E E-03 Total PFD for all IPLs Frequency of Mitigated Consequence (/year) Risk Tolerance Criteria Met? (Yes/No) Actions required to meet Risk Tolerance Criteria Notes YES 1. Gas detector should shut-off the BV-32 and BV-23 in case of gas detection. 2. Temperature alarm and gas detector should be independent each other in order to be considered as an IPL respectively. Otherwise, one of them cannot be credited fully as an IPL. 3. The test intervals of temperature alarm and gas detector should be kept 1 month. 3.26E E-09 References
120 106 The comparison of risk values of scenario 4 is given in Figure Figure 4.18 shows that the posterior value of failure frequency is located between prior and likelihood values. Frequency comparison of incident scenario 1.60E E E-07 Frequency (/year) 1.20E E E E E E E+00 Prior (only generic) 1.43E-09 Likelihood (only plant specific) 1.88E-09 Posterior (with Bayesian) Figure 4.18 Risk values of scenario 4 by LOPA For the risk determination, the estimated posterior risk value, 1.88E-9, can be compared to the tolerable criteria, less than 1.00E-5. Thus, risk decision is that scenario 4 is tolerable if the test intervals and independency between temperature alarm and gas detector given in the actions of Table 4.8 will be kept. In order to improve safety more, one recommendation may be suggested that gas detector should shut-off the BV-32 and BV-23 in case of gas detection to block the LNG input to recondenser.
121 STORAGE TANK (NODE 3) SCENARIO 5 (OVERPRESSURE IN TANK DUE TO ROLLOVER RESULTING FROM STRATIFICATION AND DAMAGE OF TANK) If rollover phenomena occur from stratification due to density difference, it may make a lot of BOG and lead to overpressure within a LNG storage tank. The overpressure may result in the damage of storage tank. Detail information about rollover effect is mentioned in Section The frequency of the rollover as an initiating event may be estimated with the KGS data [7] and LNG facility failure data base. KGS provides the failure frequency of the rollover with mean and standard deviation values. LNG failure data base gives the operating hours, number of failures, and MTBF of the cryogenic storage systems which may include the failure data of stratification. The estimated frequency data (per year) are shown in Figure Figure 4.19 shows that the posterior value of failure frequency is between prior and likelihood values. The vertical line of the posterior column indicates the 90% Bayesian credible interval ranged from /year to /year. The detail information of these calculations is given in Appendix C.
122 108 Frequency comparison Frequency (/year) Prior Likelihood Posterior Figure 4.19 Frequency of a rollover corresponding to Bayesian estimation For this scenario, three IPLs may be considered. First one is the density monitoring and jet mixing. Second one is the high pressure alarm and the trip function of ESD valve. Last one is the two pressure valves. It is assumed that the functions of density monitoring and pressure alarm are independent each other. IPL 1 is the density monitoring and jet mixing with a FCV. The PFD of density monitoring systems is given in the KGS data with mean and standard deviation values. However, LNG failure data base does not provide the failure data of density monitoring systems. Thus, in this case, the PFD from KGS data is used only. In other words, for the density monitoring, Bayesian estimation will not be used because there is no plant specific data. KGS provides the PFDs of density monitoring systems with a mean value of 8.00E-3 and a standard deviation value of 4.00E-3. However, IPL 1 consists of the density monitoring and jet mixing with a FCV. The PFD of a FCV which controls the jet mixing function should be estimated also. The PFD of a FCV can be estimated with the EIReDA data and LNG facility failure data base. EIReDA provides the mean value of PFD and parameter values of α and β in beta distribution for a FCV. LNG failure data base gives the operating hours, number of
123 109 failures, and MTBF of the cryogenic valves. The estimated PFDs of an FCV are shown in Figure The vertical line of the posterior column indicates the 90% Bayesian credible interval ranged from to PFD comparison PFD Prior Likelihood Posterior Figure 4.20 PFDs of a FCV corresponding to Bayesian estimation The failure case of IPL 1 shall be either failure of a density monitoring system or a FCV. Thus, if it is assumed that the functions of density monitoring and FCV are independent each other, Boolean algebra equation can be used to estimate PFD of IPL 1 as given in equation 4.1. Therefore, total PFDs of IPL 1 are shown in Figure 4.21.
124 110 PFD comparison of IPL PFD Prior Likelihood Posterior Figure 4.21 Total PFDs of the IPL 1 corresponding to Bayesian estimation IPL 2 is the high pressure alarm and the trip function of an ESD valve. The PFD of a pressure alarm can be estimated with the OREDA data and the LNG facility failure database. OREDA provides the failure frequency of a pressure sensor. These data should be converted into PFD by using Frequency-PFD conversion method. The LNG failure database gives the operating hours, number of failures, and MTBF of the process control system which includes any occurrence which caused a loss of function of the process control system. That is, a process control system can include the pressure sensors. Thus, the data are used for the likelihood function. The estimated PFDs of a pressure alarm are shown in Figure The vertical line of posterior column indicates the 90% Bayesian credible interval ranged from to
125 111 PFD comparison (Pressure Alarm) PFD Prior Likelihood Posterior Figure 4.22 PFDs of a pressure alarm corresponding to Bayesian estimation However, IPL 2 consists of the pressure alarm and an ESD valve. The PFD of ESD valve should be estimated also. The PFD of an ESV can be estimated with the EIReDA data and LNG facility failure database. EIReDA provides the mean value of PFD and parameter values of α and β in beta distribution for an ESV. LNG failure data base gives the operating hours, number of failures, and MTBF of the cryogenic valves. The estimated PFDs of an ESD valve are shown in Figure The vertical line of the posterior column indicates the 90% Bayesian credible interval ranged from to
126 112 PFD comparison (ESV) PFD Prior Likelihood Posterior Figure 4.23 PFDs of an ESD valve corresponding to Bayesian estimation The failure case of IPL 2 shall be either failure of a high pressure alarm or an ESV. Thus, if it is assumed that pressure alarm and ESV are independent each other, the Boolean algebra equation can be used to estimate PFD of IPL 2 as given in equation 4.1. Therefore, total PFDs of IPL 2 are shown in Figure PFD comparison of IPL 2 PFD Prior Likelihood Posterior Figure 4.24 Total PFDs of the IPL 2 corresponding to Bayesian estimation
127 113 IPL 3 is two pressure relief valves (PRV). The PFD of a PRV can be estimated with the EIReDA data and the LNG facility failure database. EIReDA provides the mean value of PFD and parameter values of α and β in beta distribution for a PRV. The LNG failure database gives the operating hours, number of failures, and MTBF of the cryogenic valves. The estimated PFDs of a PRV are shown in Figure The vertical line of the posterior column indicates the 90% Bayesian credible interval ranged from to PFD comparison PFD Prior Likelihood Posterior Figure 4.25 PFDs of a PRV corresponding to Bayesian estimation If two PRVs are installed to a storage tank and it is assumed that one PRV has the sufficient relief capacity of all possible overpressures, then the benefit of two valves should be considered to estimate the PFD of IPL 2. However, if the valves are the same type, common cause factor (β) should be considered. As mentioned in Section 3.5, the average PFD of 1oo2 voting multiple systems is
128 114 PFD = ( PFD = ( PFD 1oo1 1oo1 ) ) 2 2 βλttest + ( ) 2 + β ( PFD 1oo1 ) (4.2) According to expert judgments, β factor for valves with a common pipe connection to a storage tank may be 30% because valves are connected to a shared pipeline which may contribute the common cause failures of them. However, β factor for valves with independent pipelines to a storage tank may be 0.1% much less than the case with a common pipeline. By plugging the value of β factor and PFD as shown in Figure 4.25, PFD of two PRVs with a common pipeline and with independent pipe connections to a storage tank is given in Figures 4.26 and 4.27, respectively. PFD comparison of two PRVs with a common pipe 1.80E E E E E-03 PFD 1.00E E E E E E E-04 PFD1oo2(Prior) 1.58E-04 PFD1oo2(Likelihood) PFD1oo2(Posterior) Figure 4.26 Total PFDs of the IPL 3 with a common pipeline corresponding to Bayesian estimation
129 115 PFD comparison of two PRVs with independent pipes 4.00E E E E E-05 PFD 2.00E E E E E E E-07 PFD1oo2(Prior) PFD1oo2(Likelihood) PFD1oo2(Posterior) Figure 4.27 Total PFDs of the IPL 3 with independent pipelines corresponding to Bayesian estimation Consequently, the mitigated failure frequency of scenario 5 can be estimated with the LOPA spreadsheet as shown in Table 4.9.
130 116 Table 4.9 LOPA spreadsheet of incident scenario 5 Scenario No. Scenario Title: Posterior (Bayesian estimation) Overpressure in tank due to rollover resulting from 5 stratification and possible damage in tank Date Description Probability Node No. 3 Frequency (per year) Consequence Description/Category Overpressure in tank and possible damage Risk Tolerance Criteria (Frequency) Action required Tolerable > 1.00E-3 < 1.00E-5 Initiating event (frequency) Rollover due to stratification 1.50E-02 Enabling event or condition Frequency of Unmitigated Consequence Independent Protection Layers N/A Density monitoring and jet mixing(fcv) High pressure alarm and trip inlet line valve(emov) Two pressure relief valves 8.34E E E E-02 Total PFD for all IPLs Frequency of Mitigated Consequence (/year) Risk Tolerance Criteria Met? (Yes/No) Actions required to meet Risk Tolerance Criteria Notes YES 1. If each PRV has its own pipeline connection to a storage tank to be independent each other, the PFD of two PRVs can be reduced. 2. The logic solver of density monitoring and pressure alarm should be independent to get full credits of IPLs. Otherwise, one of them cannot be an IPL. 4.56E E-11 References
131 117 The comparison of risk values of scenario 5 is given in Figure Figure 4.28 shows that the posterior value of failure frequency is located between prior and likelihood values. Frequency comparison of incident scenario 9.00E E-10 Frequency (/year) 8.00E E E E E E E E E E E+00 Prior (only generic) Likelihood (only plant specific) Posterior (with Bayesian) Figure 4.28 Risk values of scenario 5 by LOPA For the risk determination, the estimated posterior risk value, 6.12E-11, can be compared to the tolerable criteria, less than 1.00E-5. Thus, the risk decision is that scenario 5 is tolerable if the test intervals and independency between density monitoring and pressure alarm given in the actions of Table 4.9 will be kept. In order to improve safety more, one recommendation may be suggested that each PRV has an independent pipeline connection to a storage tank to minimize the common cause factor.
132 SCENARIO 6 (LNG LEVEL INCREASES AND LEADS TO CARRYOVER INTO ANNULAR SPACE BECAUSE OPERATOR LINES UP THE WRONG TANK. POSSIBLE OVERPRESSURE IN TANK) If operators line up the wrong tank which is already filled with a high level of LNG, it may result in level increase and then carryover into the annular space of LNG. Additionally, this may also result in overpressure and possible damage of the tank. The frequency of operator errors is not provided in generic data sources. In this case, Jeffreys noninformative prior may be used to update the plant specific data. It is assumed that the prior follows the gamma distribution with parameter α is equal to 0.5 and β is zero. As a likelihood function, the LNG failure database gives the operating hours, number of failures, and MTBF of the human errors. The estimated frequency data (per year) are shown in Figure Figure 4.29 shows that the posterior value of failure frequency is a little larger than the likelihood value after updating. The vertical line of the posterior column indicates the 90% Bayesian credible interval ranged from /year to /year. The detail information of these calculations is given in Appendix C.
133 119 Frequency comparison Frequency (/year) Prior Likelihood Posterior Figure 4.29 Frequency of human errors corresponding to Bayesian estimation For this scenario, two IPLs may be considered. One is the two independent level alarms and human intervention. The other is the two high-high level detectors and an ESD valve. It is assumed that the functions of level detector and alarms are independent each other. IPL 1 is two independent level alarms and human intervention. In this case, it is not assumed that human performance is perfect because the storage tank may have high severity and also human error data are available. OREDA provides the failure frequency of a level alarm. These data should be converted into PFD by using Frequency-PFD conversion method. The LNG failure database gives the operating hours, number of failures, and MTBF of the process control system which can include level sensors. Thus, the data are used as the likelihood function. The estimated PFDs of a level alarm are shown in Figure The vertical line of the posterior column indicates the 90% Bayesian credible interval ranged from to
134 120 PFD comparison PFD Prior Likelihood Posterior Figure 4.30 PFDs of a level alarm corresponding to Bayesian estimation A modification to this scenario would be to have two level alarms installed to a storage tank. If the valves are same types, common cause factor (β) should be considered. According to Section 3.5, the average PFD of 1oo2 voting level alarm systems can be calculated. In this case, β factor for level alarms may be assumed to 5% according to expert judgments. By plugging the value of β factor and PFD as shown in Figure 4.30, the PFD of two level alarms is given in Figure 4.31.
135 121 PFD comparison of two level alarms 2.50E E E E-03 PFD 1.50E E E E E+00 PFD1oo2(Prior) PFD1oo2(Likelihood) PFD1oo2(Posterior) Figure 4.31 Total PFDs of the two level alarms considering common cause factor corresponding to Bayesian estimation However, IPL 1 consists of two level alarms and human intervention. The PFD of human intervention should be estimated. KGS provides the probability data in the case that an operator fails to shutdown on high level alarm with a mean of 8.00E-4 and standard deviation of 1.30E-3. The failure case of IPL 1 shall be either failure of two level alarms or human intervention. Thus, the Boolean algebra equation can be used to estimate the PFD of IPL 1 as given in equation 4.1. Therefore, total PFDs of IPL 1 are shown in Figure 4.32.
136 122 PFD comparison of IPL PFD Prior Likelihood Posterior Figure 4.32 Total PFDs of the IPL 1 corresponding to Bayesian estimation IPL 2 is the two high-high level detectors and an ESD valve. The PFD of a level detector can be estimated with the OREDA data and LNG facility failure database. OREDA provides the failure frequency of a level sensor. These data should be converted into PFD by using Frequency-PFD conversion method. The LNG failure database gives the operating hours, number of failures, and MTBF of the process control system. Thus, the data are used as the likelihood function. The estimated PFDs of a level detector are shown in Figure The vertical line of the posterior column indicates the 90% Bayesian credible interval ranged from to
137 123 PFD comparison PFD Prior Likelihood Posterior Figure 4.33 PFDs of a level detector corresponding to Bayesian estimation In this case, two independent level detectors are installed to a storage tank. If the valves are same types, common cause factor (β) should be considered. According to Section 3.5, the average PFD of 1oo2 voting level detectors can be calculated. In this case, β factor for level alarms may be assumed to 5% according to expert judgments. By plugging the value of β factor and PFD as shown in Figure 4.33, the PFDs of two level alarms is given in Figure 4.34.
138 124 PFD comparison of two level alarms 2.50E E E E-03 PFD 1.50E E E E E+00 PFD1oo2(Prior) PFD1oo2(Likelihood) PFD1oo2(Posterior) Figure 4.34 Total PFDs of the two level detectors considering common cause factor corresponding to Bayesian estimation However, IPL 2 consists of two level detectors and an ESD valve. The PFD of an ESD valve should be estimated. The PFD of an ESV can be estimated with the EIReDA data and LNG facility failure database. EIReDA provides the mean value of PFD and parameter values of α and β in beta distribution for an ESV. The LNG failure data base gives the operating hours, number of failures, and MTBF of the cryogenic valves. The estimated PFDs of an ESD valve are shown in Figure The vertical line of the posterior column indicates the 90% Bayesian credible interval ranged from to
139 125 PFD comparison (ESV) PFD Prior Likelihood Posterior Figure 4.35 PFDs of an ESD valve corresponding to Bayesian estimation The failure case of IPL 2 shall be either failure of two high-high level detectors or an ESV. Thus, if it is assumed that level detectors and ESV is independent each other, Boolean algebra equation can be used to estimate PFD of IPL 2 as given in equation 4.1. Therefore, total PFDs of IPL 2 are shown in Figure 4.36.
140 126 PFD comparison of IPL PFD Prior Likelihood Posterior Figure 4.36 Total PFDs of the IPL 2 corresponding to Bayesian estimation Consequently, the mitigated failure frequency of scenario 6 can be estimated with the LOPA spreadsheet as shown in Table 4.10.
141 127 Table 4.10 LOPA spreadsheet of incident scenario 6 Scenario No. 6 Scenario Title: Posterior (Bayesian estimation) LNG level increases and leads to carryover into annular space of LNG because operator lines up the wrong tank. Possible overpressure in tank. Date Description Probability Consequence Description/Category Risk Tolerance Criteria (Frequency) LNG level increases and leads to carryover into annular space resulting in possible overpressure in tank Action required Tolerable Node No. 3 Frequency (per year) > 1.00E-3 < 1.00E-5 Initiating event (frequency) Human errors (operator lines up the wrong tank) 3.53E-02 Enabling event or condition N/A Conditional modifiers (if applicable) Frequency of Unmitigated Consequence Independent Protection Layers Total PFD for all IPLs Frequency of Mitigated Consequence (/year) Risk Tolerance Criteria Met? (Yes/No) Actions required to meet Risk Tolerance Criteria N/A N/A Two independent level alarms and human intervention Two high-high level detector and ESD of BV-40 YES 1. The test intervals of level alarm and detector should be kept 1 year and BV should have 1 month test interval. 2. Level alarms and detectors should be independent each other in order to keep the risk value. 2.57E E E E E-07 Notes References
142 128 The comparison of risk values of scenario 6 is given in Figure Figure 4.37 shows that the posterior value of failure frequency is a little less than likelihood value, and prior value is not shown because Jeffreys noninformative prior is used. Frequency comparison of incident scenario 3.50E E E E-07 Frequency (/year) 2.50E E E E E E+00 undefined Prior (only generic) Likelihood (only plant specific) Posterior (with Bayesian) Figure 4.37 Risk values of scenario 6 by LOPA For the risk determination, the estimated posterior risk value, 2.80E-7, can be compared to the tolerable criteria, less than 1.00E-5. Thus, risk decision is that scenario 6 is tolerable if the test intervals and independency between level alarms and detectors given in the actions of Table 4.10 will be kept.
143 SCENARIO 7 (UNDERPRESSURE IN TANK DUE TO PUMP- OUT WITHOUT BOG INPUT RESULTING FROM BV-45 FAILED CLOSURE. DAMAGE OF TANK) If the BV-45 spuriously trips to close during pumping out of LNG by LP pumps and results in BOG input stop, it may cause possible underpressure within a tank. The underpressure may result in the damage of the storage tank. The frequency of the spurious trip to close of a block valve as an initiating event may be estimated with the OREDA data and LNG facility failure database. OREDA provides the failure frequency of a spurious operation of a shut-off valve. It is used for prior information as generic data in Bayesian estimation. The LNG failure data base gives the operating hours, number of failures, and MTBF of the cryogenic valves which can be used as likelihood information of plant specific data. The estimated frequency data (per year) are shown in Figure Figure 4.38 shows that the posterior value of failure frequency is located between prior and likelihood values. The vertical line of the posterior column indicates the 90% Bayesian credible interval ranged from /year to /year. The detail information of these calculations is given in Appendix C.
144 130 Frequency comparison Frequency (/year) Prior Likelihood Posterior Figure 4.38 Frequency of a spurious trip to close of a block valve corresponding to Bayesian estimation For this scenario, three IPLs may be considered. First, is the low pressure alarm and BOG compressor trip. Second, is the low-low pressure detector and LP pump trip. The last IPL is the two vacuum relief valves. It is assumed that the functions of the pressure alarm and pressure compressors or pumps are independent each other. IPL 1 is the low pressure alarm and BOG compressor trip. The PFD of a pressure alarm can be estimated with the OREDA data and LNG facility failure database. OREDA provides the failure frequency of a pressure sensor. These data should be converted into PFD by using Frequency-PFD conversion method. The LNG failure data base gives the operating hours, number of failures, and MTBF of the process control system which includes any occurrence which caused a loss of function of the process control system. That is, process control system can include the pressure sensors. Thus, the data are used as the likelihood function. The estimated PFDs of a pressure alarm are shown in Figure The vertical line of the posterior column indicates the 90% Bayesian credible interval ranged from to
145 131 PFD comparison PFD Prior Likelihood Posterior Figure 4.39 PFDs of a pressure alarm corresponding to Bayesian estimation However, IPL 1 consists of the pressure alarm and compressor trip. The PFD of a compressor should be estimated to find out the PFD of IPL 1. The PFD of a compressor can be estimated with the EIReDA data and LNG facility failure database. EIReDA provides the mean value of PFD and parameter values of α and β in beta distribution for a compressor. The LNG failure database gives the operating hours, number of failures, and MTBF of compressors. The estimated PFDs of a BOG compressor are shown in Figure The vertical line of the posterior column indicates the 90% Bayesian credible interval ranged from to
146 132 PFD PFD comparison Prior Likelihood Posterior Figure 4.40 PFDs of a compressor corresponding to Bayesian estimation The failure case of IPL 1 shall be either failure of a low pressure alarm or a BOG compressor. If it is assumed that the functions of a pressure alarm and a compressor are independent each other, the Boolean algebra equation can be used to estimate PFDs of IPL 1 as given in equation 4.1. Therefore, total PFDs of IPL 1 are shown in Figure PFD comparison of IPL PFD Prior Likelihood Posterior Figure 4.41 Total PFDs of IPL 1 corresponding to Bayesian estimation
147 133 IPL 2 is the low-low pressure detector and LP pump trip. The PFD of a pressure sensor can be estimated with the OREDA data and LNG facility failure database. OREDA provides the failure frequency of a pressure sensor. These data should be converted into PFD by using Frequency-PFD conversion method. The LNG failure database gives the operating hours, number of failures, and MTBF of the process control system which includes any occurrence which caused a loss of function of the process control system. The estimated PFDs of a pressure detector are shown in Figure The vertical line of the posterior column indicates the 90% Bayesian credible interval ranged from to PFD comparison PFD Prior Likelihood Posterior Figure 4.42 PFDs of a pressure detector corresponding to Bayesian estimation However, IPL 2 consists of the pressure detector and LP pump trip. The PFD of a pump should be estimated also to find out the PFD of IPL 2. The PFD of a pump can be estimated with the EIReDA data and LNG facility failure database. EIReDA provides the mean value of PFD and parameter values of α and β in beta distribution for a pump. The LNG failure database gives the operating hours, number of failures, and MTBF of
148 134 cryogenic pumps. The estimated PFDs of a BOG compressor are shown in Figure The vertical line of the posterior column indicates the 90% Bayesian credible interval ranged from to PFD comparison PFD Prior Likelihood Posterior Figure 4.43 PFDs of a compressor corresponding to Bayesian estimation The failure case of IPL 2 shall be either failure of a low-low pressure detector or a LP pump. Thus, if it is assumed that the functions of a pressure detector and a pump are independent each other, the Boolean algebra equation can be used to estimate PFDs of IPL 2 as given in equation 4.1. Therefore, total PFDs of IPL 2 are shown in Figure 4.44.
149 135 PFD comparison of IPL PFD Prior Likelihood Posterior Figure 4.44 Total PFDs of IPL 2 corresponding to Bayesian estimation IPL 3 is two vacuum relief valves (VRV). The PFD of a VRV can be estimated with the EIReDA data and LNG facility failure data base. Specific data on the failure rate of avrv are not specified in generic data sources. However, VRVs are essentially pressure relief valves (PRVs), except operating in underpressure, not in overpressure. Thus, the failure data of a PRV are used to get PFD of a VRV. EIReDA provides the mean value of PFD and parameter values of α and β in beta distribution for a PRV. LNG failure data base gives the operating hours, number of failures, and MTBF of the cryogenic valves. The estimated PFDs of a VRV are shown in Figure The vertical line of posterior column indicates the 90% Bayesian credible interval ranged from to
150 136 PFD comparison PFD Prior Likelihood Posterior Figure 4.45 PFDs of a VRV corresponding to Bayesian estimation By the way, two VRVs are installed to a storage tank. If it is assumed that one VRV has the sufficient relief capacity of all possible cases of underpressure, the benefit of two valves should be considered to estimate PFD of IPL 3. However, if the valves are the same type, common cause factor (β) should be considered. According to Section 3.5, the average PFD of 1oo2 voting VRVs can be calculated. In this case, β factor for valves may be assumed to 0.1% according to expert judgments. By plugging the value of β factor and PFD as shown in Figure 4.45, the PFD of two VRVs is given in Figure 4.46.
151 137 Total PFD comparison 4.00E E E E E-05 PFD 2.00E E E E E E E-07 PFD1oo2(Prior) PFD1oo2(Likelihood) PFD1oo2(Posterior) Figure 4.46 Total PFDs of the IPL 3 corresponding to Bayesian estimation Consequently, the mitigated failure frequency of scenario 7 can be estimated with the LOPA spreadsheet as shown in Table 4.11.
152 138 Table 4.11 LOPA spreadsheet of incident scenario 7 Scenario No. Scenario Title: Posterior (Bayesian estimation) Underpressure in tank due to pump-out without 7 BOG input resulting from BV-45 failed closure. Possible damage of tank Date Description Probability Node No. 3 Frequency (per year) Consequence Description/Category Underpressure in tank and possible damage of tank Risk Tolerance Criteria (Frequency) Action required Tolerable > 1.00E-3 < 1.00E-5 Initiating event (frequency) LP pump-out without BOG input due to BV-25 spurious failed closure 5.51E-03 Enabling event or condition Frequency of Unmitigated Consequence Independent Protection Layers N/A Low pressure alarm and BOG compressor trip Low-low pressure detector and LP pump trip Two vacuum relief valves 5.01E E E E-03 Total PFD for all IPLs Frequency of Mitigated Consequence (/year) Risk Tolerance Criteria Met? (Yes/No) Actions required to meet Risk Tolerance Criteria Notes References YES 1. The logic solver of pressure alarm and detector should be independent to get full credits of IPLs. Otherwise, one of them cannot be an IPL. For two vacuum relief valves, common cause factors were considered, but the PFD of them is still very small because the common cause factor is only 0.1% according to expert judgments. 9.98E E-14
153 139 The comparison of risk values of scenario 7 is given in Figure Figure 4.47 shows that the posterior value of failure frequency is located between prior and likelihood values. Frequency comparison of incident scenario 5.00E E E E-11 Frequency (/year) 3.50E E E E E E E E E-14 Prior (only generic) Likelihood (only plant specific) 5.50E-14 Posterior (with Bayesian) Figure 4.47 Risk values of scenario 7 by LOPA For the risk determination, the estimated posterior risk value, 5.50E-14, can be compared to the tolerable criteria, less than 1.00E-5. Thus, the risk decision is that scenario 7 is tolerable if the test intervals and independency between pressure alarm and detector given in the actions of Table 4.11 will be kept.
154 VALIDATION OF RESULTS Using the Bayesian estimation means that updated posterior values will be obtained with prior and likelihood data. In other words, posterior values should exist between the prior and likelihood data in case of using informative prior. As shown in Section 4.3, all posterior values are located between prior and likelihood values. It indicates that posterior values reflect both generic data as prior information and LNG plant specific data as a likelihood function. For example, the posterior mean value of failure frequency of a pressure alarm as shown in Figure 4.48, which is addressed already in Section 4.3, is located between mean values of prior and likelihood data. It indicates that the posterior value is updated correctly. Therefore, a conclusion can be made that all posterior values of each item mentioned in Section 4.3 are reasonable and valid. PFD comparison PFD Prior Likelihood Posterior Figure 4.48 PFDs of a pressure alarm corresponding to Bayesian estimation
155 141 However, the above conclusion is not always true to the final frequency values of incident scenarios estimated by LOPA methodology. The frequency values are obtained by multiplying the failure frequency of an initiating event and PFDs of IPLs as shown in equation 2-1. In some cases as shown in Figure 4.49, the posterior value of failure frequency of a incident scenario is located between prior and likelihood values because the failure frequency of an initiating event and PFDs of all IPLs as shown in Figures 4.19, 4.20, 4.22, 4.23 and 4.25 have the same data trend among prior, likelihood, and posterior values. Frequency comparison of incident scenario 9.00E E-10 Frequency (/year) 8.00E E E E E E E E E E E+00 Prior (only generic) Likelihood (only plant specific) Posterior (with Bayesian) Figure 4.49 Risk values of scenario 5 by LOPA However, this trend is not always followed to all risk values for incidents estimated by LOPA. If an initiating event or some IPLs have different trends than each other, the posterior values of risks may not exist between prior and likelihood values. In other words, some scenarios may have ascending or descending trends among prior, likelihood, and posterior values. For example, the failure frequency of an initiating event
156 142 as shown in Figure 4.50 and the PFD of IPL 2 as shown in Figure 4.52, respectively, have the same data trend among prior, likelihood and posterior values. However, the PFD of IPL 1 as shown in Figure 4.51 has the opposite trend with others. Even though all posterior values of an initiating event and IPLs exist between the prior and likelihood values, the posterior frequency of an incident scenario estimated by Bayesian-LOPA as shown in Figure 4.53 is not located between the prior and likelihood data. The failure data of Figures 4.50 to 4.53 are just examples to show the cases which do not follow the norm. Frequency of an initiating event (Example) Frequency (/year) 1.20E E E E E E E E E E-03 prior likelihood posterior Figure 4.50 Failure frequency of an initiating event (Example only)
157 143 PFD of IPL 1 (Example) PFD 1.20E E E E E E E E E E-03 prior likelihood posterior Figure 4.51 PFD of IPL 1 (Example only) PFD of IPL 2 (Example) PFD 6.00E E E E E E E E E E-03 prior likelihood posterior Figure 4.52 PFD of IPL 2 (Example only)
158 144 Failure frequency of an incident scenario (Example) Frequency (/year) 8.00E E E E E E E E E-06 prior likelihood posterior Figure 4.53 Failure frequency of an incident scenario (Example only) In conclusion, all posterior values of initiating events or PFDs of IPLs are always located between prior and likelihood data in the case of using informative prior distribution. The posterior values of incident scenarios estimated by Bayesian-LOPA methodology may exist between the prior and likelihood values only if the failure frequencies of initiating events and PFDs of IPLs have the same data trend among prior, likelihood, and posterior values. Otherwise, posterior values of some incident scenarios may not be located between the prior and likelihood values.
159 SUMMARY AND CONCLUSIONS 5.1. SUMMARY LNG is one of the fastest growing energy sources in the U.S. to fulfill the increasing energy demands and diversify the energy portfolio. In order to meet the growing demands of LNG, many LNG facilities including LNG importation terminals are operating currently. Moreover, there are many proposed projects concerning LNG importation terminals to fill the gap between supply and demand of LNG in North America. Therefore, it is very important to control and estimate the latent risks in LNG terminals to keep them safe. One of the most cost effective ways to estimate the risk is LOPA because it can provide quantified risk results with less time and efforts than other methods. Thus, LOPA was applied in this research. For the LOPA application, failure data are essential to compute risk frequencies. However, the failure data from the LNG industry are very sparse and have statistically shaky grounds due to insufficient sample data and relatively short-term operational history. Bayesian estimation is identified as one of the better methods to use to compensate for the weaknesses found in the LNG industry s failure data. It can update the generic data with plant specific data. That is to say, the data updated by Bayesian logic can reflect both long-term based historical experiences from generic data and plant specific conditions from plant specific data.
160 146 Thus, in this research, the new Bayesian-LOPA methodology was developed, and it was applied to an LNG importation terminal to estimate the potential risks. Finally, by the method, risk determinations and risk ranking were made to several incident scenarios and some recommendations for safety enhancement were suggested. By the HAZOP study done by a team, seven possible incident scenarios were identified in an LNG terminal. The failure frequencies of initiating events and PFDs of IPLs were estimated using Bayesian estimation. The Bayesian-LOPA methodology provided the quantified risk values of the incident scenarios. By comparing to the risk criteria given by CCPS, risk decisions were made for the scenarios. In view of probabilistic risk assessment, risk ranking among incident scenarios was decided to provide priority of additional safety measures. Moreover, in order to improve the safety, some recommendations were suggested. Table 5.1 shows the summary of the risk values, risk ranking, risk determinations, and recommendations. Additionally, Figure 5.1 shows risk value graphs of seven incident scenarios comparing to prior, likelihood, and Bayesian posterior values.
161 147 Table 5.1 The risk summary of incident scenarios No. of scenario Scenarios LNG leakage from Loading arms during unloading Pressure increase of unloading arm due to BV-45 failed closure during unloading HP pump cavitation and damage due to low pressure of recondenser resulting from BV-32 failed closure. Possible leakage and fire. Higher temperature in recondenser due to more BOG input resulting from FCV-33 spurious full open. Possible cavitation and damage of HP pump leading to leakage. Overpressure in tank due to rollover resulting from stratification and possible damage of tank Failure frequency (/year) Risk ranking Criteria met? 9.87E-08 4 YES 2.90E-06 2 YES 1.37E-05 1 NO 1.88E-09 5 YES 6.86E-11 6 YES Recommendations 1. Gas detector and fire detector should be independent each other in order to be considered as an IPL, respectively. 2. The test intervals of gas and fire detectors should be kept 1 month. 1. A PSV may be installed before TSV, unless TSV can operate as a PSV in case of overpressure. 1. HP pump should be tripped in case of low-low level of recondenser 2. It is better to have HP pump of auto circulation type to control the pump out and prevent cavitation. 3. The test intervals of pressure alarm and HP pump should be kept 1 month, respectively. 1. Gas detector should shut-off the BV-32 and BV-23 in case of gas detection. 2. Temperature alarm and gas detector should be independent each other in order to be considered as an IPL respectively. 3. The test intervals of temperature alarm and gas detector should be kept 1 month. 1. If each PRV has its own pipeline connection to a storage tank to be independent of each other, the PFD of two PRVs can be reduced. 2. The logic solver of density monitoring and pressure alarm should be independent to get full credits of IPLs.
162 148 Table 5.1 Continued No. of scenario Scenarios Failure frequency (/year) Risk ranking Criteria met? Recommendations 6 7 LNG level increase and lead to carryover into annular space of LNG because operator lines up the wrong tank. Possible overpressure in tank. Underpressure in tank due to pump-out without BOG input resulting from BV-45 failed closure. Possible damage of tank 2.80E-07 3 YES 5.50E-14 7 YES 1. The test intervals of level alarm and detector should be kept 1 year and BV should have 1 month test interval. 2. Level alarms and detectors should be independent of each other in order to keep the risk value. 1. The logic solver of pressure alarm and detector should be independent to get full credits of IPLs. Otherwise, one of them cannot be an IPL.
163 149 Comparison of scenario risk 1.00E E-01 Prior Likelihood Posterior 1.00E E-03 frequency (/year) 1.00E E E E E E E E E E E E E E E E E E E E E E E E E E E-11 scenario 1 scenario 2 scenario 3 scenario 4 scenario 5 scenario 6 scenario E E E E-14 Figure 5.1 The risk value graphs of seven incident scenarios
164 CONCLUSION Bayesian-LOPA methodology was developed to use for risk assessments in this research and it produced valid results of risk determination as shown in Table 5.1. In order to apply the methodology to a LNG importation terminal, HAZOP study was conducted at first by a team and it identified potential hazards. The HAZOP results were used to make possible incident scenarios by a combination with initiating events and consequences for LOPA application. The generic failure data and LNG plant specific data were gathered to be used as prior and likelihood information. Based on Bayesian estimation, the frequencies of initiating events were obtained using a conjugate gamma distribution as the prior information and Poisson distribution as likelihood function. OREDA database was used for a prior distribution because it was produced from a gamma distribution. If there is no prior information, Jeffreys noninformative prior may be used. LNG plant failure data base was used as plant specific likelihood information. The PFDs of IPLs were estimated with conjugate beta prior distribution and binomial likelihood distribution. EIReDA data book was used for prior information because it provided the failure data made by beta distribution. In some cases EIReDA did not provide failure data in some cases, the newly developed Frequency-PFD conversion method was used instead. By the combination of Bayesian estimation and LOPA procedures, the Bayesian-LOPA methodology was developed. The method was applied to an LNG importation terminal. For seven incident scenarios, it can produce the valid risk values of all scenarios. The posterior values of every initiating event or IPL are located between prior and likelihood values. This means that the posterior values are valid and well-updated. However, the fact is not always true to the risk values of incident scenarios estimated by LOPA method. If the frequency data of an initiating event and PFDs of IPLs have different data trend among prior, likelihood, and posterior values, the fact may not be true. The found risk values were compared to tolerable risk criteria to make risk decisions. All scenarios excluding scenario 3 could meet the criteria. For Scenario 3,
165 151 which is related to HP pump cavitation damage, some recommendations were suggested to reduce the risk. For other scenarios, some recommendations were also given to improve the safety. Finally, the estimated risk values of seven incident scenarios were compared to each other to make a risk ranking in view of probabilistic risk analysis which considers only failure frequency without considering consequence analysis. In conclusion, the newly developed Bayesian-LOPA methodology as one of the risk assessment methods really does work well in an LNG importation terminal and it can be applied in other industries including refineries, petrochemicals, nuclear plants, and space industries. Moreover, it can be used with other frequency analysis methods such as Fault Tree Analysis (FTA) and Event Tree Analysis (ETA). As the good safety records of LNG industries speak, in this research, it can be generally concluded that the LNG terminal has very good safety protections to prevent dangerous events. However, some parts such as HP pump area have not sufficient safeguards. Thus, suggested recommendations should be applied. By the way, careful caution should be taken that the estimated results are only based on the information which is available to public, so the results or recommendations may not reflect completely on a real LNG terminal. Therefore, this research must not be used for legal activities.
166 RECOMMENDATIONS FOR FURTHER STUDIES The Bayesian-LOPA methodology can produce more reliable estimated risk values than the normal LOPA method. Moreover, the developed method can also provide the credible intervals of failure frequencies or probabilities to show uncertainties. However, it cannot produce credible intervals of final risk values for incident scenarios and IPLs which are composed of multiple components. In order to obtain credible intervals, it is necessary to find the distribution products and summations since the final risk values of incident scenarios are computed by multiplication of gamma distribution and beta distribution (s); and the PFDs of multi-component IPLs are calculated by the multiplication and summation with Boolean algebra. The final credible intervals for incident scenarios can be used to show the uncertainties of estimated values. Sometimes, initiating events can occur with several basic events. For example, suppose that an initiating event is the failure of unloading arms. Unloading arms consist of pipe, flanges with gaskets, swivel joints and valves. The failure rate of the loading arm should be composed of the failure rates of each component. In this case, in order to find out loading arm failure rate, Fault Tree Analysis (FTA) or Event Tree Analysis (ETA) can be used. Therefore, Bayesian-LOPA methodology can be combined with FTA or ETA to get more reliable initiating event frequencies. LOPA can be used to determine the sufficiency of Safety Instrumented System (SIS) of facilities or plants. Typically, SIS, which is one of the IPLs, consists of sensors, logic solvers, and final elements such as valves. Safety Integrity Level (SIL) is used to show the reliability of SIS. Thus, SIL verification will be required to obtain the failure rate of SIS. In this research, the SIL verification was not fully conducted because of insufficient reliability data. However, SIL verification may be considered to estimate the risks more accurately by LOPA. Thus, SIL verification can be associated with the Bayesian-LOPA methodology. Currently, in this research, Microsoft Excel software was used to compute the failure data in the Bayesian-LOPA estimation. However, it is not a fully automatic
167 153 calculation because some information should be handled manually. Thus, computeraided Bayesian-LOPA methodology can be developed so that results and graphs are produced automatically. In the future, a specific program may be developed for the Bayesian-LOPA method. Finally, in the current LOPA method, only independent protection layers can be considered as IPLs to reduce the risk. However, in the industries, some protection layers or safeguards can be dependent to each other. These dependent layers should be credited for risk assessments to some extent, respectively. Therefore, dependency-based LOPA methodology should be developed to make up the weakness. Summarized below are potential areas for future: Obtaining the credible intervals of incident scenarios and multi-component IPLs Combining the Bayesian-LOPA methodology with FTA or ETA for the more reliable frequencies of initiating events Conducting SIL verification with Bayesian-LOPA methodology Developing the computer-aided Bayesian-LOPA methodology Developing dependency-based LOPA methodology
168 154 LITERATURE CITED 1. Committee of European Nations (CEN), Installation and Equipment for Liquefied Natural Gas - Design of Onshore Installations, EN-1473, Paramus, NJ, Mannan, S.M. and H. West, LNG Safety Practice & Regulations: From the 1944 East Ohio Tragedy to Today's Safety Record, 2001 AIChE Meeting, Houston, TX, British Petroleum (BP), LNG Fire Protection & Emergency Response, Fire Booklet 7, pp. 1-75, Aylesbury, UK, Code of Federal Regulation (CFR), Liquefied Natural Gas Facilities: Federal Safety Standards, 49 CFR Part 193, Alderman, J.A., Introduction to LNG Safety, Process Safety Progress, 24(3), pp , National Fire Protection Association (NFPA), Standard for the Production, Storage, and Handling of Liquefied Natural Gas (LNG), NFPA 59A, Quincy, MA, Korea Gas Safety Corporation (KGS), Comparative Risk Assessment of LNG Tank Designs Training, pp , Shiheung Si, Korea, Yoon, E.S., M.S. Mannan, K. Park, and K. Kim, Safety Analysis for LNG Terminal Focused on the Consequence Calculation of Accidental and Intentional Spills, the Mary Kay O'Connor Process Safety Center Symposium, pp , College Station, TX, The Instrumentation & Systems and Automation Society (ISA), Application of Safety Instrumented Systems to the Process Industries, ANSI /ISA 84.01, Research Triangle Park, NC, Dowell, A.M., Layer of Protection Analysis for Determining Safety Integrity Level, Isa Transactions, 37(3), pp , Center for Chemical Process Safety (CCPS), Layer of Protection Analysis - Simplified Process Risk Assessment, pp 1-258, New York, NY, 2001.
169 Dowell, A.M., Layer of Protection Analysis and Inherently Safer Processes, Process Safety Progress, 18(4), pp , Bhimavarapu, K. and P. Stavrianidis, Safety Integrity Level Analysis for Process: Issues and Methodologies, Process Safety Progress, 19(1), pp 19-24, Marszal, E.M., B.A. Fuller, and J.N. Shah, Comparison of Safety Integrity Level Selection Methods and Utilization of Risk Based Approaches, Process Safety Progress, 18(4), pp , Baybutt, P., Layers of Protection Analysis for Human Factors (LOPA-HF), Process Safety Progress, 21(2), pp , Center for Chemical Process Safety (CCPS), Inherently Safer Chemical Processes: A Life Cycle Approach, American Institute of Chemical Engineers, New York, NY, Dowell, A. and T. Williams, Layer of Protection Analysis: Generating Scenarios Automatically from HAZOP Data, Process Safety Progress, 24(1), pp 38-44, Markowski, A.S. and M.S. Mannan, Fuzzy Logic Application for LOPA, the Mary Kay O'Connor Process Safety Center, College Station, TX, Markowski, A.S., Layer of Protection Analysis for the Process Industries, Polska Akademia Nauk, Piotrkowska, Poland, Whatis?com (Bayesian Logic Definition), September International Society for Bayesian Analysis (ISBA), September Modarres, M., Risk Analysis in Engineering - Techniques, Tools, and Trends, pp , Taylor&Francis, Boca Raton, FL, Sandia National Laboratories, Handbook of Parameter Estimation for Probabilistic Risk Assessment, Albuquerque, NM, Shafaghi, A., Equipment Failure Rate Updating Bayesian Estimation, the Mary Kay O'Connor Process Safety Center Symposium, pp , College Station, TX, 2006.
170 Crowl, D.A. and J.F. Louvar, Chemical Process Safety - Fundamentals with Applications, 2nd edition, pp , Prentice Hall PTR, Upper Saddle River, NJ, Wan, Z., Bayesian Primer, zrwan@physics.rutgers.edu, Piscataway, NJ, Johnson, D.W. and J.R. Welker, Development of an Improved LNG Plant Failure Rate Data Base, Applied Technology Corp., Norman, OK, Alber, T., R.C. Hunt, S. Fogarty, and J. Wilson, Idaho Chemical Processing Plant Failure Rate Database, Idaho National Engineering Laboratory, Idaho Falls, ID, Marine Research Specialists, SES Long Beach LNG Import Project - Quantitative Risk Analysis, California Coastal Commission, San Francisco, CA, Summers, A.E., SIL Verification, SIS-TECH Solutions, Houston, TX, SINTEF Industrial Management, OREDA: Offshore Reliability Data, SINTEF Industrial Management, Trondheim, Norway, Procaccia, H., S.P. Arsenis, and P. Aufort, EIReDA 1998: European Industrial Reliability Data Bank, Crete University Press, Crete, Greece, 1998.
171 157 APPENDIX A. PROCESS FLOW DIAGRAM AND P&IDs 157
172
173
174
175
176
177 163 APPENDIX B. HAZOP SPREADSHEETS Node List Node Description/design intent Design conditions/parameters 1. LNG liquid unloads from ship to tank LNG unloads from tanker (ship) to a storage tank A shutdown valve is provided at the unloading arm 2. LP LNG pump discharge to recondenser & HP pump suction LP LNG pump feeds LNG to HP LNG pump to boost. This LNG is passed through recondenser to condense BOG. LP pump is provided in each tank to supply LNG to HP pump which boosts this liquid to higher pressure. 3. LNG tank system LNG is stored in this tank and then sent through recondenser to vaporizer. The Pressure of a tank is almost atmospheric pressure and insulation is provided to keep LNG cool. 163
178 164 Node 1 LNG liquid unloading from ship to tank Deviation Causes Consequences Safeguards Severity- Probability (H, M, L) Actions Final severity- Probability (H, M, L) No flow BV-1 closure at the jetty Pressure increase of unloading arm and jetty piping up to ship pump shut-off pressure or higher pressure due to surge conditions 1.Arm and piping were designed to bear this pressure 2.One TSV along the transfer line 3.Valve closing time is based on surge analysis L-L A PSV before TSV may be installed, unless TSV can operate as a PSV as well as a TSV. L-L No flow Manual valve close due to human error Pressure increase of unloading arm and jetty piping up to ship pump shut-off pressure or higher pressure due to surge conditions 1.Arm and piping were designed to bear this pressure L-L operation procedure L-L More flow Higher ship pump capacity Possible overpressure in tank PCV to flare and PSV to flare on tank to discharge any excess vapors L-L A flow meter added and connected to PCV L-L Higher temperature Blocked condition in LNG transfer line results in more temperature, heat leak and thermal expansion Possible overpressure in line TSV along the transfer line L-L L-L 164
179 165 Node 1 Continued Deviation Causes Consequences Safeguards Severity- Probability (H, M, L) Actions Final severity- Probability (H, M, L) Higher pressure Blocked condition during unloading Possible overpressure up to shut off pressure of ship pump Piping designed to bear this pressure L-L L-L Misdirected flow Wrong tank lined-up for unloading High level of tank may be reached quicker than normal due to inadvertent lined-up. Overfilling of tank may be possible 1. High level alarm and highhigh level trip of inlet to tank 2.Operation procedure to trip the ship pump by human intervention 3. automatic diversion systems among tanks H-L H-L Start up hazard Operator fails to cool-down unloading arms and directly start unloading Thermal shock on unloading arms and piping may be possible and lead to potential leakage from joints Unloading operating procedures require cool-down before unloading M-L 1. very experienced operators with quality training M-L Transfer operation hazards Loading arm failure and leakage (swivel joints failure, flange joints failures) Possible leakage, vapor cloud, ignition, and fire 1. Excess movement detectors which will initiate shutdown and disconnection 2. N 2 connection to swivel joints 3. Gas detectors at the jetty 4. Fire detectors at the jetty which will initiate shutdown M-L M-L 165
180 166 Node 2 LP LNG pump discharge to recondenser & HP pump suction Deviation Causes Consequences Safeguards Severity- Probability (H, M, L) Actions Final severity- Probability (H, M, L) No flow No flow LP LNG pump discharge due to closure of BV-32 or FCV-20 The suction pressure of HP pump may decrease leading to cavitation and damage to pump. Possible leakage, vapor cloud, ignition, and fire due to HP pump failure 1.Low pressure alarm at HP pump suction 2.Opearating procedure (i.e. LP pump more running than HP pump) M-L 1. It is better that the HP pump is auto circulation type. 2.HP pump should be trip in case of lowlow level of recondenser 3.check the number of pumps (redundancy) 4.One PSV installed after HP pump L-L More flow More flow due to FCV-20 full open Level build-up in recondenser leading to LNG carryover to BOG header 1.High level alarm 2.High-high level alarm, LIA- 2 HH will close BV-32 of LP LNG inlet and BV-21 of HP pump kickback line. L-L 1. independency among alarms L-L Lower temperature No issue 166
181 167 Node 2 Continued Deviation Causes Consequences Safeguards Severity- Probability (H, M, L) Actions Final severity- Probability (H, M, L) Higher temperature More flow from BOG due to FCV-33 full open in the recondenser inlet Lots of BOG leads to cooling failure in recondenser and result in LNG temperature increase of HP pump suction leading to cavitation and damage to pump. Possible leakage, vapor cloud, ignition, and fire due to HP pump failure 1.High temperature alarm along the suction line of HP pump. 2.Gas detector M-L M-L Lower pressure No flow LP LNG pump discharge due to closure of FCV- 20 The suction pressure of HP pump may decrease leading to cavitation and damage to pump. Possible leakage, vapor cloud, ignition, and fire due to HP pump failure 1.Low pressure alarm at HP pump suction 2.Opearating procedure (i.e. LP pump more running than HP pump) M-L M-L Higher pressure More flow of BOG due to FCV-33 full open in the BOG inlet while less LNG input from LP pump Possible overpressure of recondenser Pressure relief valve, PSV-34 L-L L-L 167
182 168 Node 3 LNG tank system Deviation Causes Consequences Safeguards Severity- Probability (H, M, L) Actions Final severity- Probability (H, M, L) reference Lower temperature Lower temperature in foundation of tank due to bottom heating failure Possible freezing moisture in the ground may lead to unstable foundation. Foundation temperature monitoring and low temperature alarm. H-L 1. Check redundancy of TIA-4 2. Check emergency electricity (power) 3.Check automatic ON/OFF system H-L Higher temperature Operating error leading to overheating of the bottom heating system Overpressure in tank Foundation temperature monitoring and high, and high-high temperatures alarm leading to shutoff L-L L-L Lower pressure Lower pressure due to pump-out without BOG input due to failure of BV-45 (closure) Underpressure in tank may lead to vacuum condition. Possible collapse of tank 1.Low pressure alarm (PIA-4) and BOG compressor trip 2.Low low pressure trip of LP pump 3.Two vacuum relief valves on tank(vrv- 46, VRV-47) H-L H-L EN-1473 (1997) 168
183 169 Node 3 Continued Deviation Causes Consequences Safeguards Severity- Probability (H, M, L) Actions Final severity- Probability (H, M, L) reference Higher pressure Rollover due to stratification Overpressure in tank and possible damage of tank 1. Two pressure relief valves 2. High pressure alarm (PIA-3) 3. Density monitoring (DI-3) to prevent stratification 4. Recirculation from other tank to prevent stratification 5. Jet mixing line to prevent stratification H-L 1. Each PSV should has independent pipe connection to tank H-L EN-1473 (1997) Lower level Lower level due to continuous pumpout Lower level may cause cavitation and damage to LP pump Low level alarm and low-low level trip of LP pump L-L L-L Higher level Higher level due to operator failure. Operator lines up the wrong tank Level increases and leads to carryover into annular space of LNG causing vaporization and then overpressure within the tank 1. Two independent level measuring and alarm systems (H, HH) 2. High-high level detection initiate the ESD function for feed pumps and valves in feed and recirculation line H-L H-L EN-1473 (1997) 169


184 170 APPENDIX C. BAYESIAN-LOPA SPREADSHEETS C.1 SCENARIO 1 C.1.1 BAYESIAN ESTIMATION SHEETS Initiating event

185 171 Frequency comparison Frequency (/year) Prior Likelihood Posterior
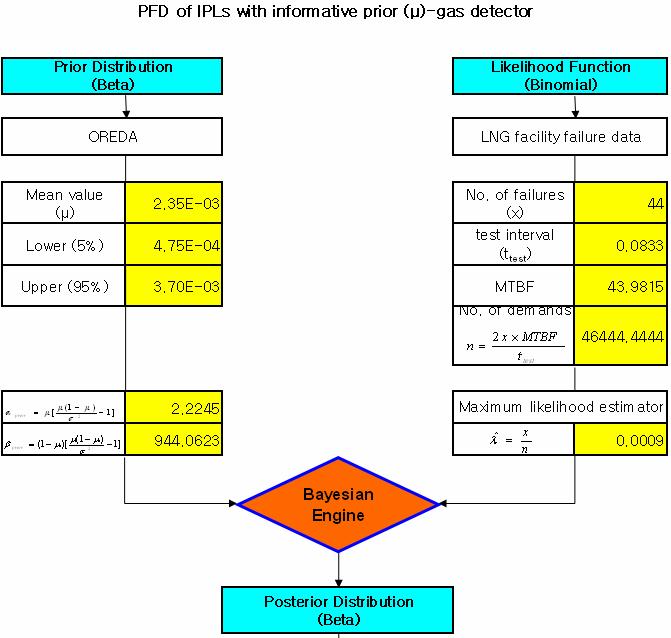
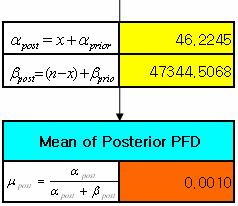
186 IPL 1 172
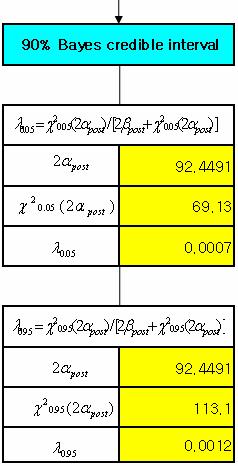
187 173
188 174 PFD comparison PFD Prior Likelihood Posterior
189 IPL 2 175
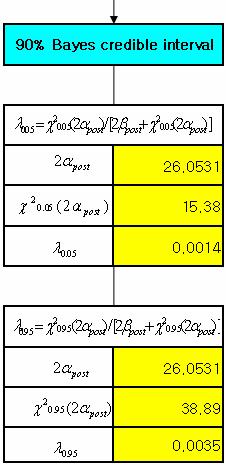
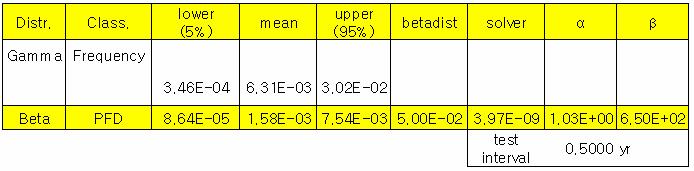
190 176
191 177 PFD comparison PFD Prior Likelihood Posterior
192 178

193 179 PFD comparison PFD Prior Likelihood Posterior

194 180 PFD comparison of IPL 2 PFD Prior Likelihood Posterior
195 181 C.1.2 LOPA SPREADSHEETS Scenario No. 1 Scenario Title: Posterior (Bayesian estimation) LNG leakage from Loading arms during unloading Date Description Probability Consequence Description/Category Risk Tolerance Criteria (Frequency) Release of LNG due to loading arm failures resulting from swivel joints failure and flange joints failures Action required Tolerable Node No. 1 Frequency (per year) > 1.00E-3 < 1.00E-5 Initiating event (frequency) Loading arm failures due to flange joint or swivel joint failures 2.75E-02 Enabling event or condition Frequency of Unmitigated Consequence Independent Protection Layers N/A Gas detectors at the jetty and human intervention Fire detector and ESD 9.75E E E-02 Total PFD for all IPLs Frequency of Mitigated Consequence (/year) Risk Tolerance Criteria Met? (Yes/No) Actions required to meet Risk Tolerance Criteria YES 1. Test intervals should be kept as following to keep the PFD (ESV: 1 year, gas and fire detector: 1 month). 2. The logic solver of gas and fire detector should be independent to get full credits of IPLs. Otherwise, one of them cannot be an IPL. 3.59E E-08 Notes References
196 182 Scenario No. 1 Scenario Title: generic data (Prior) LNG leakage from Loading arms during unloading Node No. 1 Date Description Probability Consequence Description/Category Risk Tolerance Criteria (Frequency) Release of LNG due to loading arm failures resulting from swivel joints failure and flange joints failures Action required Tolerable Frequency (per year) > 1.00E-3 < 1.00E-5 Initiating event (frequency) Loading arm failures due to flange joint or swivel joint failures 3.80E-03 Enabling event or condition Frequency of Unmitigated Consequence Independent Protection Layers N/A Gas detectors at the jetty and human intervention Fire detector and ESD 2.35E E E-03 Total PFD for all IPLs Frequency of Mitigated Consequence (/year) Risk Tolerance Criteria Met? (Yes/No) Actions required to meet Risk Tolerance Criteria YES 1. Test intervals should be kept as following to keep the PFD (ESV: 1 year, gas and fire detector: 1 month). 2. The logic solver of gas and fire detector should be independent to get full credits of IPLs. Otherwise, one of them cannot be an IPL. 6.43E E-08 Notes References
197 183 Scenario No. 1 Scenario Title: Plant specific data (Likelihood) LNG leakage from Loading arms during unloading Node No. 1 Date Description Probability Consequence Description/Category Risk Tolerance Criteria (Frequency) Release of LNG due to loading arm failures resulting from swivel joints failure and flange joints failures Action required Tolerable Frequency (per year) > 1.00E-3 < 1.00E-5 Initiating event (frequency) Loading arm failures due to flange joint or swivel joint failures 3.74E-02 Enabling event or condition Frequency of Unmitigated Consequence Independent Protection Layers N/A Gas detectors at the jetty and human intervention Fire detector and ESD 9.47E E E-02 Total PFD for all IPLs Frequency of Mitigated Consequence (/year) Risk Tolerance Criteria Met? (Yes/No) Actions required to meet Risk Tolerance Criteria YES 1. Test intervals should be kept as following to keep the PFD (ESV: 1 year, gas and fire detector: 1 month). 2. The logic solver of gas and fire detector should be independent to get full credits of IPLs. Otherwise, one of them cannot be an IPL. 3.62E E-07 Notes References
198 184 Class. Prior (only generic) Likelihood (only plant specific) Posterior (with Bayesian) Frequency of incident scenario (/year) 2.45E E E-08 Frequency comparison of incident scenario 1.60E E E-07 Frequency (/year) 1.20E E E E E E E E E+00 Prior (only generic) Likelihood (only plant specific) Posterior (with Bayesian)


199 185 C.2 SCENARIO 2 C.2.1 BAYESIAN ESTIMATION SHEETS Initiating event
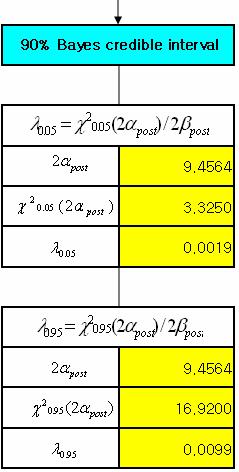
200 186
201 187 Frequency comparison Frequency (/year) Prior Likelihood Posterior
202 IPL 1 188

203 189 PFD comparison PFD Prior Likelihood Posterior
204 190 C.2.2 LOPA SPREADSHEETS Scenario No. Scenario Title: Posterior (Bayesian estimation) Pressure increase of unloading arm due to BV-1 2 failed closure during unloading Date Description Probability Node No. 1 Frequency (per year) Consequence Description/Category Pressure increase of unloading arm Risk Tolerance Criteria (Frequency) Action required Tolerable > 1.00E-3 < 1.00E-5 Initiating event (frequency) During unloading, BV-1 spurious trip close 5.51E-03 Enabling event or condition Frequency of Unmitigated Consequence N/A 5.51E-03 Independent Protection Layers A TSV along transfer line 5.26E-04 Total PFD for all IPLs Frequency of Mitigated Consequence (/year) Risk Tolerance Criteria Met? (Yes/No) YES 5.26E E-06 Actions required to meet Risk Tolerance Criteria 1. A PSV may be installed before TSV, unless TSV can operate as a PSV in case of overpressure. Notes 1. Unloading arm and pipe were designed to bear the shut-off pressure of ship pump. References
205 191 Scenario No. 2 Scenario Title: generic data (Prior) Pressure increase of unloading arm due to BV-1 failed closure during unloading Node No. 1 Date Description Probability Frequency (per year) Consequence Description/Category Pressure increase of unloading arm Risk Tolerance Criteria (Frequency) Action required Tolerable > 1.00E-3 < 1.00E-5 Initiating event (frequency) During unloading, BV-1 spurious trip close 5.53E-03 Enabling event or condition Frequency of Unmitigated Consequence N/A 5.53E-03 Independent Protection Layers A TSV along transfer line 4.70E-04 Total PFD for all IPLs Frequency of Mitigated Consequence (/year) Risk Tolerance Criteria Met? (Yes/No) YES 4.70E E-06 Actions required to meet Risk Tolerance Criteria 1. A PSV may be installed before TSV, unless TSV can operate as a PSV in case of overpressure. Notes 1. Unloading arm and pipe were designed to bear the shut-off pressure of ship pump. References
206 192 Scenario No. 2 Scenario Title: Plant specific data (Likelihood) Pressure increase of unloading arm due to BV-1 failed closure during unloading Node No. 1 Date Description Probability Frequency (per year) Consequence Description/Category Pressure increase of unloading arm Risk Tolerance Criteria (Frequency) Action required Tolerable > 1.00E-3 < 1.00E-5 Initiating event (frequency) During unloading, BV-1 spurious trip close 5.50E-03 Enabling event or condition Frequency of Unmitigated Consequence N/A 5.50E-03 Independent Protection Layers A TSV along transfer line 5.51E-03 Total PFD for all IPLs Frequency of Mitigated Consequence (/year) Risk Tolerance Criteria Met? (Yes/No) NO 5.51E E-05 Actions required to meet Risk Tolerance Criteria 1. A PSV may be installed before TSV, unless TSV can operate as a PSV in case of overpressure. Notes 1. Unloading arm and pipe were designed to bear the shut-off pressure of ship pump. References
207 193 Class. Prior (only generic) Likelihood (only plant specific) Posterior (with Bayesian) Frequency of incident scenario (/year) 2.60E E E-06 Frequency comparison of incident scenario 3.50E E E-05 Frequency (/year) 2.50E E E E E E E E+00 Prior (only generic) Likelihood (only plant specific) Posterior (with Bayesian)
208 194 C.3 SCENARIO 3 C.3.1 BAYESIAN ESTIMATION SHEETS Initiating event

209 195 Frequency comparison Frequency (/year) Prior Likelihood Posterior
210 IPL 1 196
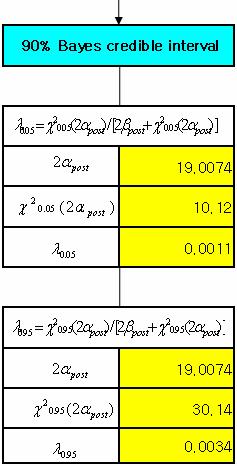
211 197
212 198 PFD comparison PFD Prior Likelihood Posterior
213 199

214 200 PFD comparison PFD Prior Likelihood Posterior
215 201 PFD comparison of IPL PFD Prior Likelihood Posterior
216 202 C.3.2 LOPA SPREADSHEETS Scenario No. 3 Scenario Title: Posterior (Bayesian estimation) HP pump cavitation and damage due to low pressure of recondenser resulting from BV-32 failed closure. Possible leakage and fire. Date Description Probability Consequence Description/Category Risk Tolerance Criteria (Frequency) Initiating event (frequency) Enabling event or condition Frequency of Unmitigated Consequence Independent Protection Layers HP pump damage leading to possible leakage and fire Action required Tolerable BV-32 spurious failed close N/A Low pressure alarm and HP pump trip 2.48E-03 Node No. 2 Frequency (per year) > 1.00E-3 < 1.00E E E-03 Total PFD for all IPLs Frequency of Mitigated Consequence (/year) Risk Tolerance Criteria Met? (Yes/No) Actions required to meet Risk Tolerance Criteria NO 1. HP pump should be tripped in case of low-low level of recondenser. 2. It is better to have HP pump of auto circulation type to control the pump out and prevent cavitation. 3. The test intervals of pressure alarm and HP pump should be kept 1 month, respectively. 2.48E E-05 Notes References
217 203 Scenario No. Scenario Title: Generic data (Prior) HP pump cavitation c and damage due to low 3 pressure of recondenser resulting from BV-32 failed closure. Possible leakage and fire. Date Description Probability Node No. 2 Frequency (per year) Consequence Description/Category HP pump damage leading to possible leakage and fire Risk Tolerance Criteria (Frequency) Action required Tolerable > 1.00E-3 < 1.00E-5 Initiating event (frequency) BV-32 spurious failed close 5.53E-03 Enabling event or condition Frequency of Unmitigated Consequence Independent Protection Layers N/A Low pressure alarm and HP pump trip 1.95E E-03 Total PFD for all IPLs Frequency of Mitigated Consequence (/year) Risk Tolerance Criteria Met? (Yes/No) Actions required to meet Risk Tolerance Criteria NO 1. HP pump should be tripped in case of low-low level of recondenser. 2. It is better to have HP pump of auto circulation type to control the pump out and prevent cavitation. 3. The test intervals of pressure alarm and HP pump should be kept 1 month, respectively. 1.95E E-05 Notes References
218 204 Scenario No. Scenario Title: Plant specific data (Likelihood) HP pump cavitation and damage due to low 3 pressure of recondenser resulting from BV-32 failed closure. Possible leakage and fire. Date Description Probability Node No. 2 Frequency (per year) Consequence Description/Category HP pump damage leading to possible leakage and fire Risk Tolerance Criteria (Frequency) Action required Tolerable > 1.00E-3 < 1.00E-5 Initiating event (frequency) BV-32 spurious failed close 5.50E-03 Enabling event or condition Frequency of Unmitigated Consequence N/A 5.50E-03 Independent Protection Layers Low pressure alarm and HP pump trip 1.09E-02 Total PFD for all IPLs Frequency of Mitigated Consequence (/year) Risk Tolerance Criteria Met? (Yes/No) Actions required to meet Risk Tolerance Criteria NO 1. HP pump should be tripped in case of low-low level of recondenser. 2. It is better to have HP pump of auto circulation type to control the pump out and prevent cavitation. 3. The test intervals of pressure alarm and HP pump should be kept 1 month, respectively. 1.09E E-05 Notes References
219 205 Class. Prior (only generic) Likelihood (only plant specific) Posterior (with Bayesian) Frequency of incident scenario (/year) 1.08E E E-05 Frequency comparison of incident scenario 7.00E E E-05 Frequency (/year) 5.00E E E E E E E E+00 Prior (only generic) Likelihood (only plant specific) Posterior (with Bayesian)
220 206 C.4 SCENARIO 4 C.4.1 BAYESIAN ESTIMATION SHEETS Initiating event

221 207 Frequency comparison Frequency (/year) Prior Likelihood Posterior
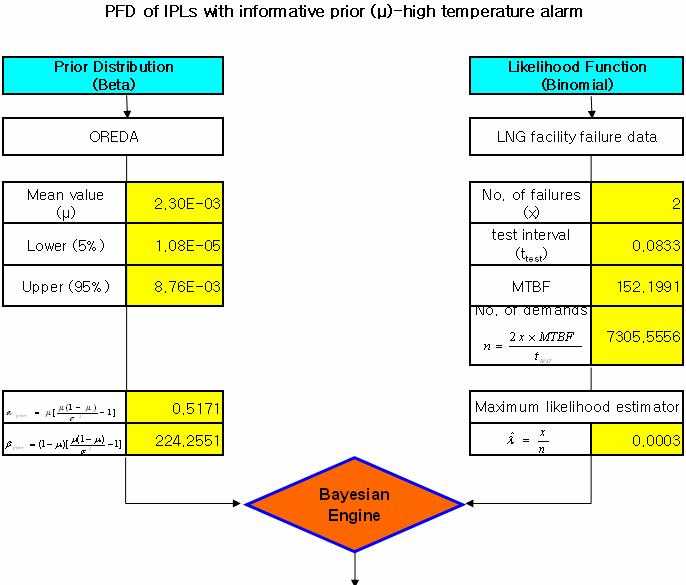
222 IPL 1 208

223 209
224 210 PFD comparison PFD Prior Likelihood Posterior
225 IPL 2 211
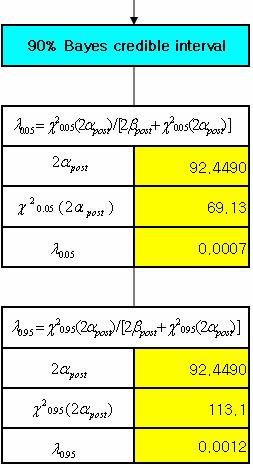
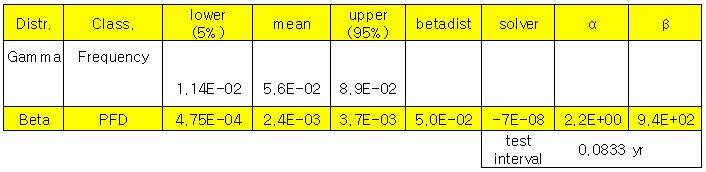
226 212
227 213 PFD comparison PFD Prior Likelihood Posterior
228 214 C.4.2 LOPA SPREADSHEETS Scenario No. 4 Scenario Title: Posterior (Bayesian estimation) Higher temperature in recondenser due to more BOG input resulting from FCV-33 spurious full open. Possible cavitation and damage of HP pump leading to leakage. Date Description Probability Consequence Description/Category Risk Tolerance Criteria (Frequency) Initiating event (frequency) Enabling event or condition Frequency of Unmitigated Consequence Independent Protection Layers Total PFD for all IPLs Frequency of Mitigated Consequence (/year) Risk Tolerance Criteria Met? (Yes/No) Actions required to meet Risk Tolerance Criteria References LNG level increases and leads to carryover into annular space resulting in possible overpressure in tank Action required Tolerable FCV-33 spurious full open N/A High temperature alarm and human intervention Gas detector and human intervention YES 1. Gas detector should shut-off the BV-32 and BV-23 in case of gas detection. 2. Temperature alarm and gas detector should be independent each other in order to be considered as an IPL, respectively. Otherwise, one of them cannot be credited fully as an IPL. 3. The test intervals of temperature alarm and gas detector should be kept 1 month. 3.34E E E-07 Node No. 2 Frequency (per year) > 1.00E-3 < 1.00E E E E-09
229 215 Scenario No. 4 Scenario Title: Generic data (Prior) Higher temperature in recondenser due to more BOG input t resulting from FCV-33 spurious full open. Possible cavitation and damage of HP pump leading to leakage. Date Description Probability Consequence Description/Category Risk Tolerance Criteria (Frequency) LNG level increases and leads to carryover into annular space resulting in possible overpressure in tank Action required Tolerable Node No. 2 Frequency (per year) > 1.00E-3 < 1.00E-5 Initiating event (frequency) FCV-33 spurious full open 2.73E-02 Enabling event or condition Frequency of Unmitigated Consequence Independent Protection Layers N/A High temperature alarm and human intervention Gas detector and human intervention 2.30E E E-02 Total PFD for all IPLs Frequency of Mitigated Consequence (/year) Risk Tolerance Criteria Met? (Yes/No) Actions required to meet Risk Tolerance Criteria Notes YES 1. Gas detector should shut-off the BV-32 and BV-23 in case of gas detection. 2. Temperature alarm and gas detector should be independent each other in order to be considered as an IPL, respectively. Otherwise, one of them cannot be credited fully as an IPL. 3. The test intervals of temperature alarm and gas detector should be kept 1 month. 5.41E E-07
230 216 Scenario No. 4 Scenario Title: Plant specific data (Likelihood) Higher temperature in recondenser due to more BOG input resulting from FCV-33 spurious full open. Possible cavitation and damage of HP pump leading to leakage. Date Description Probability Consequence Description/Category Risk Tolerance Criteria (Frequency) LNG level increases and leads to carryover into annular space resulting in possible overpressure in tank Action required Tolerable Node No. 2 Frequency (per year) > 1.00E-3 < 1.00E-5 Initiating event (frequency) FCV-33 spurious full open 5.50E-03 Enabling event or condition Frequency of Unmitigated Consequence Independent Protection Layers N/A High temperature alarm and human intervention Gas detector and human intervention 2.74E E E-03 Total PFD for all IPLs Frequency of Mitigated Consequence (/year) Risk Tolerance Criteria Met? (Yes/No) Actions required to meet Risk Tolerance Criteria Notes YES 1. Gas detector should shut-off the BV-32 and BV-23 in case of gas detection. 2. Temperature alarm and gas detector should be independent each other in order to be considered as an IPL, respectively. Otherwise, one of them cannot be credited fully as an IPL. 3. The test intervals of temperature alarm and gas detector should be kept 1 month. 2.59E E-09
231 217 Class. Prior (only generic) Likelihood (only plant specific) Posterior (with Bayesian) Frequency of incident scenario (/year) 1.48E E E-09 Frequency comparison of incident scenario 1.60E E E-07 Frequency (/year) 1.20E E E E E E E+00 Prior (only generic) 1.43E-09 Likelihood (only plant specific) 1.88E-09 Posterior (with Bayesian)
232 218 C.5 SCENARIO 5 C.5.1 BAYESIAN ESTIMATION SHEETS Initiating event

233 219 Frequency comparison Frequency (/year) Prior Likelihood Posterior
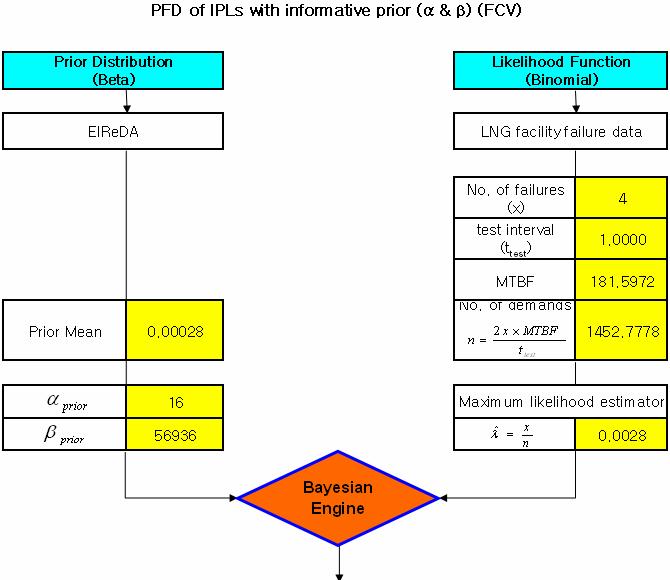
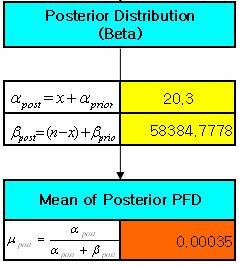
234 IPL 1 220

235 221 PFD comparison PFD Prior Likelihood Posterior
236 222 PFD comparison of IPL PFD Prior Likelihood Posterior
237 IPL 2 223
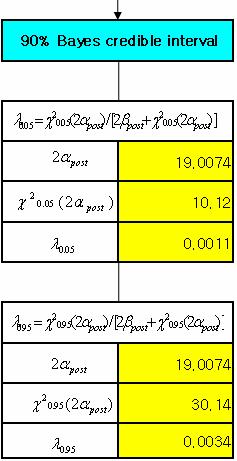
238 224
239 225 PFD comparison (Pressure Alarm) PFD Prior Likelihood Posterior
240 226

241 227 PFD comparison (ESV) PFD Prior Likelihood Posterior

242 228 PFD comparison of IPL 2 PFD Prior Likelihood Posterior
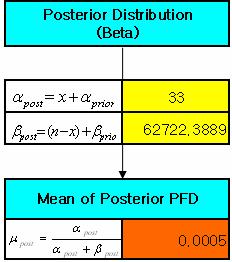
243 IPL 3 229

244 230 PFD comparison PFD Prior Likelihood Posterior
245 231 PFD comparison of two PRVs with a common pipe 1.80E E E E E-03 PFD 1.00E E E E E E E-04 PFD1oo2(Prior) 1.58E-04 PFD1oo2(Likelihood) PFD1oo2(Posterior)
246 232 PFD comparison of two PRVs with independent pipes 4.00E E E E E-05 PFD 2.00E E E E E E E-07 PFD1oo2(Prior) PFD1oo2(Likelihood) PFD1oo2(Posterior)
247 233 Comparison of PFD with no. of PRVs 6.00E E E E-04 PFD 3.00E E E E E+00 PFD1oo1(one PRV) PFD1oo2(two PRVs, common pipe) 8.02E-07 PFD1oo2(two PRVs, independent pipe)
248 234 C.5.2 LOPA SPREADSHEETS Scenario No. 5 Scenario Title: Posterior (Bayesian estimation) Overpressure in tank due to rollover resulting from stratification and possible damage in tank Node No. 3 Date Description Probability Consequence Description/Category Risk Tolerance Criteria (Frequency) Initiating event (frequency) Enabling event or condition Frequency of Unmitigated Consequence Independent Protection Layers Total PFD for all IPLs Frequency of Mitigated Consequence (/year) Risk Tolerance Criteria Met? (Yes/No) Actions required to meet Risk Tolerance Criteria Overpressure in tank and possible damage Action required Tolerable Rollover due to stratification N/A Density monitoring and jet mixing(fcv) High pressure alarm and trip inlet line valve(emov) Two pressure relief valves YES 1. If each PRV has its own pipeline connection to a storage tank to be independent each other, the PFD of two PRVs can be reduced. 2. The logic solver of density monitoring and pressure alarm should be independent to get full credits of IPLs. Otherwise, one of them cannot be an IPL. 8.34E E E E-09 Frequency (per year) > 1.00E-3 < 1.00E E E E-11 Notes References
249 235 Scenario No. 5 Scenario Title: generic data (Prior) Overpressure in tank due to rollover resulting from stratification and possible damage in tank Node No. 3 Date Description Probability Consequence Description/Category Risk Tolerance Criteria (Frequency) Initiating event (frequency) Enabling event or condition Frequency of Unmitigated Consequence Independent Protection Layers Total PFD for all IPLs Frequency of Mitigated Consequence (/year) Risk Tolerance Criteria Met? (Yes/No) Actions required to meet Risk Tolerance Criteria Overpressure in tank and possible damage Action required Tolerable Rollover due to stratification N/A Density monitoring and jet mixing(fcv) High pressure alarm and trip inlet line valve(emov) Two pressure relief valves YES 1. If each PRV has its own pipeline connection to a storage tank to be independent each other, the PFD of two PRVs can be reduced. 2. The logic solver of density monitoring and pressure alarm should be independent to get full credits of IPLs. Otherwise, one of them cannot be an IPL. 8.28E E E E-09 Frequency (per year) > 1.00E-3 < 1.00E E E E-11 Notes References
250 236 Scenario No. 5 Scenario Title: Plant specific data (Likelihood) Overpressure in tank due to rollover resulting from stratification and possible damage in tank Node No. 3 Date Description Probability Consequence Description/Category Risk Tolerance Criteria (Frequency) Initiating event (frequency) Enabling event or condition Frequency of Unmitigated Consequence Independent Protection Layers Total PFD for all IPLs Frequency of Mitigated Consequence (/year) Risk Tolerance Criteria Met? (Yes/No) Actions required to meet Risk Tolerance Criteria Overpressure in tank and possible damage Action required Tolerable Rollover due to stratification N/A Density monitoring and jet mixing(fcv) High pressure alarm and trip inlet line valve(emov) Two pressure relief valves YES 1. If each PRV has its own pipeline connection to a storage tank to be independent each other, the PFD of two PRVs can be reduced. 2. The logic solver of density monitoring and pressure alarm should be independent to get full credits of IPLs. Otherwise, one of them cannot be an IPL. 1.07E E E E-08 Frequency (per year) > 1.00E-3 < 1.00E E E E-09 Notes References
251 237 Class. Prior (only generic) Likelihood (only plant specific) Posterior (with Bayesian) Frequency of incident scenario (/year) 4.43E E E-11 Frequency comparison of incident scenario 1.20E E-09 Frequency (/year) 1.00E E E E E E E-11 Prior (only generic) Likelihood (only plant specific) 6.86E-11 Posterior (with Bayesian)

252 238 C.6 SCENARIO 6 C.6.1 BAYESIAN ESTIMATION SHEETS Initiating event

253 239 Frequency comparison Frequency (/year) Prior Likelihood Posterior
254 IPL 1 240
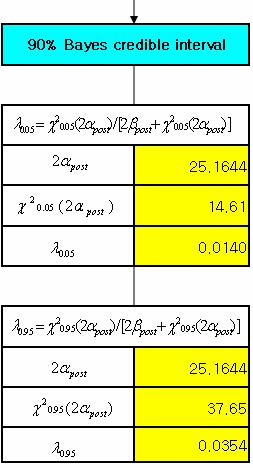
255 241
256 242 PFD comparison PFD Prior Likelihood Posterior

257 243 PFD comparison of two level alarms 2.50E E E E-03 PFD 1.50E E E E E+00 PFD1oo2(Prior) PFD1oo2(Likelihood) PFD1oo2(Posterior)


258 244 PFD comparison of IPL PFD Prior Likelihood Posterior
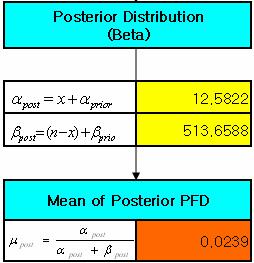
259 IPL 2 245
260 246 PFD comparison PFD Prior Likelihood Posterior
 PFD1oo2(Likelihood) PFD1oo2(Posterior)")
261 247 PFD comparison of two level detectors 2.50E-03 PFD 2.00E E E E E E E E+00 PFD1oo2(Prior) PFD1oo2(Likelihood) PFD1oo2(Posterior)
262 248

263 249 PFD comparison (ESV) PFD Prior Likelihood Posterior

264 250 PFD comparison of IPL PFD Prior Likelihood Posterior
265 251 C.6.2 LOPA SPREADSHEETS Scenario No. 6 Scenario Title: Posterior (Bayesian estimation) LNG level increases and leads to carryover into annular space of LNG because operator lines up the wrong tank. Possible overpressure in tank. Date Description Probability Consequence Description/Category Risk Tolerance Criteria (Frequency) Initiating event (frequency) Enabling event or condition Frequency of Unmitigated Consequence Independent Protection Layers LNG level increases and leads to carryover into annular space resulting in possible overpressure in tank Action required Tolerable Human errors (operator lines up the wrong tank) N/A Two independent level alarms and human intervention Two high-high level detector and ESD of BV E E-03 Node No. 3 Frequency (per year) > 1.00E-3 < 1.00E E E-02 Total PFD for all IPLs Frequency of Mitigated Consequence (/year) Risk Tolerance Criteria Met? (Yes/No) YES 7.94E E-07 Actions required to meet Risk Tolerance Criteria 1. The test intervals of level alarm and detector should be kept 1 year and BV should have 1 month test interval. 2. Level alarms and detectors should be independent of each other in order to keep the risk value. Notes References
266 252 Scenario No. 6 Scenario Title: Generic data (Prior) LNG level increases and leads to carryover into annular space of LNG because operator lines up the wrong tank. Possible overpressure in tank. Date Description Probability Consequence Description/Category Risk Tolerance Criteria (Frequency) LNG level increases and leads to carryover into annular space resulting in possible overpressure in tank Action required Tolerable Node No. 3 Frequency (per year) > 1.00E-3 < 1.00E-5 Initiating event (frequency) Human errors (operator lines up the wrong tank) undefined Enabling event or condition Frequency of Unmitigated Consequence Independent Protection Layers N/A Two independent level alarms and human intervention Two high-high level detector and ESD of BV E E-03 undefined Total PFD for all IPLs Frequency of Mitigated Consequence (/year) Risk Tolerance Criteria Met? (Yes/No) Actions required to meet Risk Tolerance Criteria 1. The test intervals of level alarm and detector should be kept 1 year and BV should have 1 month test interval. 2. Level alarms and detectors should be independent of each other in order to keep the risk value. 5.66E-06 undefined Notes References
267 253 Scenario No. 6 Scenario Title: Plant specific data (Likelihood) LNG level increases and leads to carryover into annular space of LNG because operator lines up the wrong tank. Possible overpressure in tank. Date Description Probability Consequence Description/Category Risk Tolerance Criteria (Frequency) LNG level increases and leads to carryover into annular space resulting in possible overpressure in tank Action required Tolerable Node No. 3 Frequency (per year) > 1.00E-3 < 1.00E-5 Initiating event (frequency) Human errors (operator lines up the wrong tank) 3.44E-02 Enabling event or condition Frequency of Unmitigated Consequence Independent Protection Layers N/A Two independent level alarms and human intervention Two high-high level detector and ESD of BV E E E-02 Total PFD for all IPLs Frequency of Mitigated Consequence (/year) Risk Tolerance Criteria Met? (Yes/No) Actions required to meet Risk Tolerance Criteria YES 1. The test intervals of level alarm and detector should be kept 1 year and BV should have 1 month test interval. 2. Level alarms and detectors should be independent of each other in order to keep the risk value. 9.21E E-07 Notes References
268 254 Class. Prior (only generic) Likelihood (only plant specific) Posterior (with Bayesian) Frequency of incident scenario (/year) undefined 3.16E E-07 Frequency comparison of incident scenario 3.50E E E E-07 Frequency (/year) 2.50E E E E E E+00 undefined Prior (only generic) Likelihood (only plant specific) Posterior (with Bayesian)

269 255 C.7 SCENARIO 7 C.7.1 BAYESIAN ESTIMATION SHEETS Initiating event
270 256 Frequency comparison Frequency (/year) Prior Likelihood Posterior
271 IPL 1 257
272 258 PFD comparison PFD Prior Likelihood Posterior
273 259

274 260 PFD PFD comparison Prior Likelihood Posterior
275 261 PFD comparison of IPL PFD Prior Likelihood Posterior
276 IPL 2 262

277 263 PFD comparison PFD Prior Likelihood Posterior
278 264

279 265 PFD comparison PFD Prior Likelihood Posterior
ABS TECHNICAL PAPERS 2007
 Fire Risk Assessment of Gas Turbine Propulsion System for LNG Carriers *Kiho Moon 1, Seok-Ryong Song 1, Jorge Ballesio 2, Gary Fitzgerald 3, Gregory Knight 3 ( 1 Hyundai Heavy Industries, 2 American Bureau
A Short Report Determination of Safety Integrity Level (SIL) using LOPA method in the Emergency Shutdown System (ESD) of Hydrogen unit
 using LOPA method in the Emergency Shutdown System (ESD) of Hydrogen unit") A Short Report Determination of Safety Integrity Level (SIL) using LOPA method in the Emergency Shutdown System (ESD) of Hydrogen unit Iraj Alimohamdadi 1, Majid Jalilian 2*, Mansour Nadi 3 1) School of
A Short Report Determination of Safety Integrity Level (SIL) using LOPA method in the Emergency Shutdown System (ESD) of Hydrogen unit Iraj Alimohamdadi 1, Majid Jalilian 2*, Mansour Nadi 3 1) School of
Natural Gas. and the Liquefaction Process
 Natural Gas and the Liquefaction Process Table of Contents Cameron LNG.................... 2 Liquefied Natural Gas................ 4 LNG Safety...................... 5 Environmental Safety................
COMPARISON OF PROCESS HAZARD ANALYSIS (PHA) METHODS
 METHODS") COMPARISON OF PROCESS HAZARD ANALYSIS (PHA) METHODS by Primatech Inc. The hazard and operability (HAZOP) study is the most commonly used process hazard analysis (PHA) method. However, there are many other
COMPARISON OF PROCESS HAZARD ANALYSIS (PHA) METHODS by Primatech Inc. The hazard and operability (HAZOP) study is the most commonly used process hazard analysis (PHA) method. However, there are many other
Fire Risk Assessment for Ammonia Onshore Export Terminal
 4B-2 6th Asia-Oceania Symposium on Fire Science and Technology 17-20, March, 2004, Daegu, Korea Fire Risk Assessment for Ammonia Onshore Export Terminal Yu. N. Shebeko, I. A. Bolodian, V. P. Molchanov,
ABIOSH INT L CERTIFICATE IN HAZARD AND OPERABILITY -HAZOP- AND HAZARD IDENTIFICATION (HAZID) STUDIES - HAZOP/HAZIDCert
 STUDIES - HAZOP/HAZIDCert") ABIOSH INT L CERTIFICATE IN HAZARD AND OPERABILITY -HAZOP- AND HAZARD IDENTIFICATION (HAZID) STUDIES - HAZOP/HAZIDCert COURSE OVERVIEW This course is a dual certification course focusing on Hazard and
ABIOSH INT L CERTIFICATE IN HAZARD AND OPERABILITY -HAZOP- AND HAZARD IDENTIFICATION (HAZID) STUDIES - HAZOP/HAZIDCert COURSE OVERVIEW This course is a dual certification course focusing on Hazard and
Qualitative & Quantitative Hazard Analysis
 Qualitative & Quantitative Hazard Analysis Guidelines for Chemical Process Quantitative Risk Analysis, CCPS / AIChE Guidelines for Hazard Evaluation Procedure, CCPS / AIChE Risk Analysis Methodology 1.
Transportation and Transfer of Ethanol-Blended Fuels
 Instructor Manual Module 3 Transportation and Transfer of Ethanol-Blended Fuels Module Objective Upon the completion of this module, participants will be able to describe how ethanol-blended fuels are
Estimation of Boil-off-Gas BOG from Refrigerated Vessels in Liquefied Natural Gas Plant
 International Journal of Engineering and Technology Volume 3 No. 1, January, 2013 Estimation of Boil-off-Gas BOG from Refrigerated Vessels in Liquefied Natural Gas Plant Wordu, A. A, Peterside, B Department
Session Nine: Functional Safety Gap Analysis and Filling the Gaps
 Session Nine: Functional Safety Gap Analysis and Filling the Gaps Presenter Colin Easton ProSalus Limited Abstract Increasingly regulatory and competent authorities are looking to hazardous Installation
Liquefied natural gas
 Liquefied natural gas Liquefied natural gas or LNG is natural gas, consisting primarily of methane (CH 4 ), that has been converted into liquid form for ease of transport and storage. More simply put,
Safety & Security. Introduction. Chemical transportation. Chemical transportation risk management. Resources. Chemical Transportation
 Introduction Chemical Transportation Safety & Security Chemical transportation Safety risks Security risks Chemical transportation risk management SAND No. 2011-0547C Sandia is a multi-program laboratory
Use of CFD in the Performance-Based Design for Fire Safety in the Oil and Gas Sector
 Use of CFD in the Performance-Based Design for Fire Safety in the Oil and Gas Sector Camille Azzi* and Lars Rogstadkjenet camille.azzi@gexcon.com GexCon AS Bergen, Norway ABSTRACT This paper addresses
Natural Gas STAR Methane Challenge Program: Supplementary Technical Information for ONE Future Commitment Option
 Natural Gas STAR Methane Challenge Program: Supplementary Technical Information for ONE Future Commitment Option 1 Contents Introduction... 4 Methane Challenge Program Reporting... 4 Emission Sources...
CLASSIFICATION OF SYSTEMS, STRUCTURES AND COMPONENTS OF A NUCLEAR FACILITY
 CLASSIFICATION OF SYSTEMS, STRUCTURES AND COMPONENTS OF A NUCLEAR FACILITY 1 Introduction 3 2 Scope of application 3 3 Classification requirements 3 3.1 Principles of safety classification 3 3.2 Classification
Source Characterization of Ammonia Accidental Releases for Various Storage and Process Conditions
 For Presentation at the Air & Waste Management Association s 90 th Annual Meeting & Exhibition, June 8-13, 1997, Toronto, Ontario, Canada 97-MP8.05 Source Characterization of Ammonia Accidental Releases
Brazed aluminium heat exchangers (BAHXs), also referred to
, also referred to") Brazed aluminium heat exchangers (BAHXs), also referred to as plate fin heat exchangers, are at the heart of many of the processes used for the liquefaction of natural gas. They are deployed across the
Brazed aluminium heat exchangers (BAHXs), also referred to as plate fin heat exchangers, are at the heart of many of the processes used for the liquefaction of natural gas. They are deployed across the
THREATS AND RISKS DURING TRANSPORTATION OF LNG ON EUROPEAN INLAND WATERWAYS
 TRANSPORT PROBLEMS 2017 Volume 12 Issue 1 PROBLEMY TRANSPORTU DOI: 10.20858/tp.2017.12.1.7 Keywords: LNG; emergency incidents; guidelines; Rhine Corridor; waterways Andrea GALIERIKOVÁ*, Tomáš KALINA, Jarmila
Creating Optimal LNG Storage Solutions. 40 in detail
 [ MARINE / IN DETAIL ] [ MARINE / IN DETAIL ] Creating Optimal LNG Storage Solutions AUTHOR: Sören Karlsson, Business Development Manager, Wärtsilä Marine Solutions mail: soren.karlsson@wartsila.com 40
Environmental, Health, and Safety Guidelines for Liquefied Natural Gas (LNG) Facilities
 Facilities") for Liquefied Natural Gas (LNG) Facilities Introduction The Environmental, Health, and Safety (EHS) Guidelines are technical reference documents with general and industryspecific examples of Good International
for Liquefied Natural Gas (LNG) Facilities Introduction The Environmental, Health, and Safety (EHS) Guidelines are technical reference documents with general and industryspecific examples of Good International
Gas Access To Europe
 Gas Access To Europe 2 3 LNG is cool and hot Import- and throughput of LNG at Gate terminal Close to the port entrance on the Maasvlakte, right at the corner of the North Sea, an LNG import and throughput
Ammonia Terminals Risk Management Improvements
 Ammonia Terminals Risk Management Improvements Through a series of corporate acquisitions, Agrium has assembled a number of anhydrous ammonia distribution terminals. Prior to Agrium s acquisition, the
COAL - HAZOP SYSTEMS ANALYSIS GRINDING AND FIRING
 COAL GRINDING AND FIRING SYSTEMS - HAZOP ANALYSIS JAGRUT UPADHYAY, PEC CONSULTING GROUP LLC, US, OUTLINES AND EXPLAINS THE USE OF THE HAZOP STUDY WITHIN COAL GRINDING AND FIRING SYSTEMS. A Process Hazard
CO2 Transport via Pipeline and Ship
 CO2 Transport via Pipeline and Ship Stanley Santos IEA Greenhouse Gas R&D Programme Cheltenham, UK CCOP EPPM Workshop on CCS September 2012 CO 2 Transport Pipeline Mode of Transport Motor Trucks Rail Ships
Pipeline Risk Management
 trebol_52_ing 19/2/10 14:19 P gina 11 Pipeline Risk Management Ricardo Rodrigues Chemist, Executive Director do ITSEMAP Brazil 10/ 52 / 2010 trebol_52_ing 19/2/10 14:19 P gina 12 Major advances in Brazil
Magnetically Coupled Submerged Cryogenic Pumps and Expanders for Ammonia Applications
 Paper 4d Magnetically Coupled Submerged Cryogenic Pumps and Expanders for Ammonia Applications Liquefied Ammonia, or Liquid NH3, is (like LNG or liquefied natural gas) a cryogenic fluid and production
Evolution of an LNG Terminal: Senboku Terminal of Osaka Gas
 23 rd World Gas Conference, Amsterdam 2006 Evolution of an LNG Terminal: Senboku Terminal of Osaka Gas Main author Toshiro Otsuka Japan TABLE OF CONTENTS 1. Abstract 2. Body of Paper 3. List Tables 4.
New Lloyd s Register Rules for Natural Gas Fuelled Ships
 Lloyd s Register s Gas Seminar New Lloyd s Register Rules for Natural Gas Fuelled Ships Edward Fort Global Head of Engineering Systems April 2013 New Rules for Natural Gas Fuelled Ships OVERVIEW Our Complex
Introduction to the Safe Design of LNG, CNG and Hydrogen Refueling Stations
 Introduction to the Safe Design of LNG, CNG and Hydrogen Refueling Stations Presentation to SFPE Northern California and Nevada Chapter March 16, 2007 by Jack Woycheese, PE, FSFPE Background Existing LNG
How are Industry Standards, Engineering Codes, Best Management Practices and Other Measures of Compliance Being Met by Facilities?
 How are Industry Standards, Engineering Codes, Best Management Practices and Other Measures of Compliance Being Met by Facilities? More on what we re seeing at inspections 1 RMP Facility Chemicals Ammonia
With the recent proliferation of its use in
 With the recent proliferation of its use in construction and automotive fields, and as a general diesel/gas replacement, LNG is now delivered and stored in smaller quantities instead of the pipelines of
Fire Precautions and Fire Fighting
 Organometallics Fire Precautions and Fire Fighting Fire Precautions Preventative fire precautions are particularly important in dealing with metal alkyls and their preparations. Plants in which metal alkyls
OPERATING INFORMATION SYSTEM FOR LNG FACILITIES Sanggyu Lee, R&D Division, KOGAS Young-myung Yang, R&D Division, KOGAS
 OPERATING INFORMATION SYSTEM FOR LNG FACILITIES Sanggyu Lee, R&D Division, KOGAS Young-myung Yang, R&D Division, KOGAS 1. INTRODUCTION Natural gas is a naturally occurring mixture of hydrocarbon and non-hydrocarbon
Environmental Testing of an Advanced Flare Tip for a Low-Profile Flare Burning Ethylene
 American-Japanese Flame Research Committee Joint International Symposium Advances in CombustionTechnology: Improving the Environment and Energy Efficiency Marriott Waikoloa, Hawaii October 22-24, 2007
Improving Natural Gas Liquefaction Plant Performance with Process Analyzers
 Process Analytics Improving Natural Gas Liquefaction Plant Performance with Process Analyzers LNG is natural gas in its liquid state with high energy density, which makes it useful for storage and transportation
HOW TO OSHA-PROOF YOUR PHAs
 HOW TO OSHA-PROOF YOUR PHAs David A. Walker Dale F. Nawrocki Thomas R. Williams William G. Bridges JBF Associates, Inc. 1000 Technology Park Center Knoxville, Tennessee 37932-3353 (615) 966-5232 The Occupational
Qualitative Phase Behavior and Vapor Liquid Equilibrium Core
 2/22/2017 Qualitative Phase Behavior and Qualitative Phase Behavior Introduction There are three different phases: solid, liquid, and gas (vapor) Energy must be added to melt a solid to form liquid If
CHAPTER 7: PREVENTION PROGRAM (PROGRAM 3)
") CHAPTER 7: PREVENTION PROGRAM (PROGRAM 3) Many of you will need to do little that s new to comply with the Program 3 prevention program, because you already have the PSM program in place. However, if your
CHAPTER 7: PREVENTION PROGRAM (PROGRAM 3) Many of you will need to do little that s new to comply with the Program 3 prevention program, because you already have the PSM program in place. However, if your
QUANTITATIVE RISK MAPPING OF URBAN GAS PIPELINE NETWORKS USING GIS
 QUANTITATIVE RISK MAPPING OF URBAN GAS PIPELINE NETWORKS USING GIS P. Azari a *, M. Karimi a a Faculty of Geodesy and Geomatics Engineering, K.N.- Toosi University of Technology, Tehran, Iran (peymanazari1993@gmail.com;
LNG SAFETY AND SECURITY
 LNG SAFETY AND SECURITY Michelle Michot Foss, Ph.D. Chief Energy Economist and CEE Head 1650 Highway 6, Suite 300 Sugar Land, Texas 77478 Tel 281-313-9763 Fax 281-340-3482 energyecon@beg.utexas.edu www.beg.utexas.edu/energyecon/lng
Formal Safety Assessment - LNG -IMO/MSC86 Review
 Formal Safety Assessment - LNG -IMO/MSC86 Review London June 1st 2009 Rolf Skjong, Dr Chief scientist, DNV Authors, Reviewers, Partners, Data, Etc Hazid: Authors: I Østvik (LMG), E. Vanem (DNV), F. Castello
Barrier Design Guidance For HUD Assisted Projects Near Hazardous Facilities Guidebook 6600.G
 Barrier Design Guidance For HUD Assisted Projects Near Hazardous Facilities Guidebook 6600.G Environmental Planning Division Office of Environment and Energy Table of Contents Pages I Introduction 1-2
APPLICATION OF COMPUTATIONAL FLUID DYNAMICS IN THE FORCED DISPERSION MODELING OF LNG VAPOR CLOUDS. A Dissertation BYUNG KYU KIM
 APPLICATION OF COMPUTATIONAL FLUID DYNAMICS IN THE FORCED DISPERSION MODELING OF LNG VAPOR CLOUDS A Dissertation by BYUNG KYU KIM Submitted to the Office of Graduate Studies of Texas A&M University in
Semi Quantitative Risk Assessment of a Hydrogen Production Unit
 2008-5435/13/53-101-108 INTERNATIONAL JOURNAL OF OCCUPATIONAL HYGIENE Copyright 2013 by Iranian Occupational Health Association (IOHA) IJOH 5: 101-108, 2013 ORIGINAL ARTICLE Semi Quantitative Risk Assessment
LNG Facilities Changing Regulations
 LNG Facilities Changing Regulations Alfonso Ibarreta, Ph.D., PE, CFEI, Delmar Trey Morrison, Ph.D., PE, CFEI, Ryan Hart, Ph.D., PE, CFEI, and Harri Kytomaa, Ph.D., PE, CFEI Exponent, Inc. aibarreta@exponent.com
Introduction to Level 2 PSA
 Introduction to Level 2 PSA Dr Charles Shepherd Chief Consultant, Corporate Risk Associates CRA PSA/HFA FORUM 13-14 September 2012, Bristol Accident sequences modelled by the PSA INITIATING EVENTS SAFETY
Teknologi Pemrosesan Gas (TKK 564) Instructor: Dr. Istadi (http://tekim.undip.ac.id/staf/istadi )
 Instructor: Dr. Istadi (http://tekim.undip.ac.id/staf/istadi )") Teknologi Pemrosesan Gas (TKK 564) Instructor: Dr. Istadi (http://tekim.undip.ac.id/staf/istadi ) Email: istadi@undip.ac.id id Instructor s t Background BEng. (1995): Universitas Diponegoro Meng. (2000):
Teknologi Pemrosesan Gas (TKK 564) Instructor: Dr. Istadi (http://tekim.undip.ac.id/staf/istadi ) Email: istadi@undip.ac.id id Instructor s t Background BEng. (1995): Universitas Diponegoro Meng. (2000):
Fluid Mechanics, Heat Transfer, Thermodynamics. Design Project. Production of Ammonia
 Fluid Mechanics, Heat Transfer, Thermodynamics Design Project Production of Ammonia Your assignment is to continue evaluating the details of a process to produce 50,000 tonne/y of ammonia from a syngas
Natural Gas Processing
 Natural Gas Processing Technology and Engineering Design Alireza Bahadori, Ph.D. School of Environment, Science and Engineering, Southern Cross University, Lismore, NSW, Australia AMSTERDAM BOSTON HEIDELBERG
Objectives. Emerging Risks Response Awareness Training. Liquefied Natural Gas
 Emerging Risks Response Awareness Training Liquefied Natural Gas Objectives Provide background information on LNG production and transportation methods Provide response considerations Provide an overview
Are You Being Honest With Yourself Regarding IPL Integrity?
 Are You Being Honest With Yourself Regarding IPL Integrity? Mr. Andrew C. Madewell, P.E. Cognascents Consulting Group, Inc. 11777-A Katy Freeway, Ste 438 Houston, TX 77079 andrew.madewell@cognascents.com
Preliminary Hazard Analysis and Risk Assessment for the Wood Centre Development, Southwood Resources - Huon
 Preliminary Hazard Analysis and Risk Assessment for the Wood Centre Development, Southwood Resources - Huon TABLE OF CONTENTS PRELIMINARY HAZARD ANALYSIS AND RISK ASSESSMENT... 4 INTRODUCTION... 4 METHODOLOGY...
Chlorinated Organics Closed Loop Unloading of Solvent Tank Trailers
 Chlorinated Organics Closed Loop Unloading of Solvent Tank Trailers Closed loop unloading systems are designed to minimize solvent vapor emissions during transfer by exchanging the liquid solvent in the
Reliability of Safety-Critical Systems Chapter 2. Concepts and requirements
 Reliability of Safety-Critical Systems Chapter 2. Concepts and requirements Mary Ann Lundteigen and Marvin Rausand mary.a.lundteigen@ntnu.no & marvin.rausand@ntnu.no RAMS Group Department of Production
LNG amendments to UN Regulation No. 110: Some background on specific issues
 Submitted by expert from the LNG Task Force (Netherlands) Informal document GRSG-104-33 (104 th GRSG, 15 19 April 2013 agenda item 8) LNG amendments to UN Regulation No. 110: Some background on specific
Available online at ScienceDirect. Procedia Engineering 86 (2014 )
") Available online at www.sciencedirect.com ScienceDirect Procedia Engineering 86 (2014 ) 597 605 1st International Conference on Structural Integrity, ICONS-2014 Corrosion Risk Analysis, Risk Based Inspection
Available online at www.sciencedirect.com ScienceDirect Procedia Engineering 86 (2014 ) 597 605 1st International Conference on Structural Integrity, ICONS-2014 Corrosion Risk Analysis, Risk Based Inspection
TECHNICAL PAPER. Selection of HAZOP or PHR for Retrospective Hazard Reviews (RHRs)
") TECHNICAL PAPER Selection of HAZOP or PHR for Retrospective Hazard Reviews (RHRs) 2 SELECTION OF HAZOP OR PHR FOR RHRs TECHNICAL PAPER Many companies in the high hazard process industries have a requirement
TECHNICAL PAPER Selection of HAZOP or PHR for Retrospective Hazard Reviews (RHRs) 2 SELECTION OF HAZOP OR PHR FOR RHRs TECHNICAL PAPER Many companies in the high hazard process industries have a requirement
Braemar Technical Services
 Braemar Technical Services Cargo Handling and Emergency Shutdown Systems in an LNG cargo vessel - What is the Connection? By Ray Martyn 20 th April 2017 Overview Introduction to the Cargo Handling System
A World of Solutions Visit Product Storage Terminals for Bulk Liquids
 A World of Solutions Visit www.cbi.com Product Storage Terminals for Bulk Liquids United Arab Emirates The most global experience of any tank company CB&I has more than eight decades of experience designing
STANDARD FOR THE STORAGE AND HANDLING OF LIQUEFIED NATURAL GAS (LNG) OISD STD 194
 OISD STD 194") OISD STANDARD 194 FOR RESTRICTED CIRCULATION ONLY STANDARD FOR THE STORAGE AND HANDLING OF LIQUEFIED NATURAL GAS (LNG) OISD STD 194 Oil Industry Safety Directorate Government of India Ministry of Petroleum
OISD STANDARD 194 FOR RESTRICTED CIRCULATION ONLY STANDARD FOR THE STORAGE AND HANDLING OF LIQUEFIED NATURAL GAS (LNG) OISD STD 194 Oil Industry Safety Directorate Government of India Ministry of Petroleum
Study on Performance-based Safety Design of Chemical Facility Layout
 Available online at www.sciencedirect.com Procedia Engineering 11 (2011) 319 324 The 5 th Conference on Performance-based Fire and Fire Protection Engineering Study on Performance-based Safety Design of
More on Vapor Cloud Explosions and Fires
 More on Vapor Cloud Explosions and Fires The Chemical Safety Board, which is the federal organization that investigates chemical accidents at facilities in the United States, has recently identified two
Strategies and Intervention tactics - FC stationary installations
 3 rd Pilot Training Session, 06-10 June 2016, ENSOSP, Aix-en-Provence, France Strategies and Intervention tactics - FC stationary installations Franck Verbecke, AREVA Energy Storage Agenda Hydrogen behavior
LNG VACUUM INSULATED PIPE SOLUTIONS.
 LNG VACUUM INSULATED PIPE SOLUTIONS www.chartlng.com Your Proven, One-Stop LNG VIP Solutions Provider Chart delivers the broadest portfolio and deepest expertise for the full range of bulk transport applications.
DRAFT Procedures for Quantifying Fugitive VOC Emission Sources at Petroleum Facilities
 San Joaquin Valley Unified Air Pollution Control District DRAFT Procedures for Quantifying Fugitive VOC Emission Sources at Petroleum Facilities Approved By: Seyed Sadredin Director of Permit Services
HAZOP and What-If Analyses
 14 HAZOP and What-If Analyses 14.1 INTRODUCTION The hazard and operability (HAZOP) study and the what-if analysis are analytical techniques that have their roots in the petrochemical industry. The HAZOP
Enabling safe and reliable offshore LNG transfer operations By Vincent Lagarrigue, Marketing & Project Manager within Trelleborg Industrial Solutions
 Enabling safe and reliable offshore LNG transfer operations By Vincent Lagarrigue, Marketing & Project Manager within Trelleborg Industrial Solutions Executive Summary Moving liquefied natural gas (LNG)
49 CFR Part Liquefied Natural Gas Facilities: Federal Safety Standards
 49 CFR Part 193 - Liquefied Natural Gas Facilities: Federal Safety Standards Provided by ViaData LP Publishers of WinDOT The Pipeline Safety Encyclopedia History: Current through Amendment 193-25, January
Use of failure rate databases and process safety performance measurements to improve process safety
 Journal of Hazardous Materials 104 (2003) 75 93 Use of failure rate databases and process safety performance measurements to improve process safety N. Keren, H.H. West, W.J. Rogers, J.P. Gupta, M.S. Mannan
Chapter 11. Direct Reduced Iron (DRI)
") Chapter 11 Direct Reduced Iron (DRI) The world market for steel is expected to continue to increase. The volume of steel produced by the, now old-fashioned, blast furnace process is already very low and
Chapter 11 Direct Reduced Iron (DRI) The world market for steel is expected to continue to increase. The volume of steel produced by the, now old-fashioned, blast furnace process is already very low and
K-Sim Engine Diesel Electric Dual Fuel Cruise Ferry. Evy Kristine Sæter Product Advisor Engine Room Simulator
 K-Sim Engine Diesel Electric Dual Fuel Cruise Ferry Evy Kristine Sæter Product Advisor Engine Room Simulator International Maritime Organization - Legislation 2017 1 January 2017 SOLAS IGF Code International
The latest issues on gas fuelled ship (including New IGF Code)
") The latest issues on gas fuelled ship (including New IGF Code) S. S. LEE December 2015 Contents 1. How to decide gas fuelled ship for new shipbuilding? 2. Selection of gas fuel tanks 3. Use LNG as fuel
The latest issues on gas fuelled ship (including New IGF Code) S. S. LEE December 2015 Contents 1. How to decide gas fuelled ship for new shipbuilding? 2. Selection of gas fuel tanks 3. Use LNG as fuel
THE APPLICATION OF EXPANSION FOAM ON LIQUEFIED NATURAL GAS (LNG) TO SUPPRESS LNG VAPOR AND LNG POOL FIRE THERMAL RADIATION.
 TO SUPPRESS LNG VAPOR AND LNG POOL FIRE THERMAL RADIATION.") THE APPLICATION OF EXPANSION FOAM ON LIQUEFIED NATURAL GAS (LNG) TO SUPPRESS LNG VAPOR AND LNG POOL FIRE THERMAL RADIATION A Dissertation by JAFFEE ARIZON SUARDIN Submitted to the Office of Graduate Studies
THE APPLICATION OF EXPANSION FOAM ON LIQUEFIED NATURAL GAS (LNG) TO SUPPRESS LNG VAPOR AND LNG POOL FIRE THERMAL RADIATION A Dissertation by JAFFEE ARIZON SUARDIN Submitted to the Office of Graduate Studies
Design study of ship LNG storage and engine feeding system. Gerasimos Theotokatos NAOME, University of Strathclyde
 Design study of ship LNG storage and engine feeding system Gerasimos Theotokatos NAOME, University of Strathclyde Introduction This study focuses on the design of the LNG storage and feeding system of
FIRST LNG BUNKERING VESSEL TO SUPPLY THE LNG BUNKERING MARKET FROM ZEEBRUGGE
 FIRST LNG BUNKERING VESSEL TO SUPPLY THE LNG BUNKERING MARKET FROM ZEEBRUGGE Martial CLAUDEPIERRE Business Development Manager LNG BUREAU VERITAS Laurent RAMBAUD - Vice President Business Development Retail
Purpose: To demonstrate the ability to create a single line foam stream using an in-line eductor and foam nozzle (or attachment).
.") Volume 16, Number 182 Weekly Fire Drill Basic Foam Operation Objective: To perform the proper sequence of steps to safely place an initial foam line in service, using units and staffing of the average
Volume 16, Number 182 Weekly Fire Drill Basic Foam Operation Objective: To perform the proper sequence of steps to safely place an initial foam line in service, using units and staffing of the average
Minimize the Risk of Fire During Distillation Column Maintenance
 Minimize the Risk of Fire During Distillation Column Maintenance Christoph Ender Koch-Glitsch, Inc. Dana Laird Koch-Glitsch, Inc. Prepared for presentation at the 2002 AIChE Spring National Meeting, New
GROWTH OF LNG GAS MARKET AS ALTERNATIVE FUEL IN TRANSPORT
 RESEARCH JOURNAL OF THE UNIVERSITY OF GDAŃSK Transport Economics and Logistics Vol. 71 (2017) DOI 10.5604/01.3001.0010.5727 Adam Bogusz Department of Finance and Management in Bydgoszcz, WSB University
COLD NEUTRON SOURCE AT CMRR
 COLD NEUTRON SOURCE AT CMRR Hu Chunming Shen Wende, Dai Junlong, Liu Xiankun ( 1 ) Vadim Kouzminov, Victor Mityukhlyaev / 2 /, Anatoli Serebrov, Arcady Zakharov ( 3 ) ABSTRACT As an effective means to
26 PROCESS SAFETY MANAGEMENT
 26 PROCESS SAFETY MANAGEMENT QUIZ 1 (20 POINTS) True/False (5 points) 1. SARA Title III required companies to develop emergency preparedness plans; recognition, knowledge, and inventories of hazardous
A Study on Re-liquefaction Process of Boil-off Gas of LCO 2 Transfer Ship
 A Study on Re-liquefaction Process of Boil-off Gas of LCO 2 Transfer Ship Yeongbeom Lee, Sanggyu Lee, Youngsoon Sohn, Kyusang Cha Korea Gas Corporation R&D Division 364, SongDo-Dong, Yeonsu-Gu, Incheon-City,
PHYSICAL AND CHEMICAL PROPERTIES
 2 SECTION OXYGEN FUEL IGNITION PHYSICAL AND CHEMICAL PROPERTIES OF PROPANE 10 OBJECTIVES SECTION 2 Physical and Chemical Properties of Propane 1) List the two major flammable gases used in the Liquefied
Towards More Consistent Computer Analysis in Evaluating Sustained Stress in Operation Cases
 International Journal of Mechanical & Mechatronics Engineering IJMME-IJENS Vol:16 No:06 78 Towards More Consistent Computer Analysis in Evaluating Sustained Stress in Operation Cases Amir Ahmad 1, Faizul
CONDENSATION INDUCED WATER HAMMER
 CONDENSATION INDUCED WATER HAMMER RISKS AND ISSUES ASSOCIATED WITH SAGD OPERATIONS Jeff Dancey, P. Eng. Baker Engineering and Risk Consultants, Inc. OUTLINE CONDENSATION INDUCED WATER HAMMER (CIWH) - EXPLANATION
OPTIMIZING TURNAROUND MAINTENANCE PERFORMANCE
 OPTIMIZING TURNAROUND MAINTENANCE PERFORMANCE Farag Elfeituri 1*, Salah Massoud Elemnifi 2 1 Department of Industrial & Manufacturing Systems Engineering University of Garyounis P.O. Box 9476 Benghazi,
LNG SAFETY AND SECURITY
 LNG SAFETY AND SECURITY Michelle Michot Foss, Ph.D. Chief Energy Economist and CEE Head 1650 Highway 6, Suite 300 Sugar Land, Texas 77478 Tel 281-313-9763 Fax 281-340-3482 energyecon@beg.utexas.edu www.beg.utexas.edu/energyecon/lng
MOLECULAR GATE TECHNOLOGY FOR (SMALLER SCALE) LNG PRETREATMENT
 LNG PRETREATMENT") MOLECULAR GATE TECHNOLOGY FOR (SMALLER SCALE) LNG PRETREATMENT Presented at the 2010 Gas Processors 89 th Annual Convention Austin, TX March, 2010 Michael Mitariten, P.E. Guild Associates, Inc. Dublin,
MOLECULAR GATE TECHNOLOGY FOR (SMALLER SCALE) LNG PRETREATMENT Presented at the 2010 Gas Processors 89 th Annual Convention Austin, TX March, 2010 Michael Mitariten, P.E. Guild Associates, Inc. Dublin,
Atmospheric Above Ground Tank Storage of Methanol
 Atmospheric Above Ground Tank Storage of Methanol INTRODUCTION Guidelines for designing, fabricating, constructing, repairing, and safeguarding above-ground methanol storage tanks is essentially the same
COMPLETING THE LNG VALUE CHAIN
 COMPLETING THE LNG VALUE CHAIN Reidar Strande, Director, LNG, Wärtsilä Oil & Gas Systems Tord Johnsson, Area Business Development Manager, Oil and Gas Business, Wärtsilä Power Plants [ ENERGY & MARINE
A Comparison: ASME B31.1 Power Piping versus ASME B31.3 Process Piping
 A Comparison: ASME B31.1 Power Piping versus ASME B31.3 Process Piping Don Frikken, PE BECHT ENGINEERING COMPANY, INC. 1 Topics Discussed B31 History Scopes Organization of the Codes Bases for Allowable
BEFORE THE PIPELINE AND HAZARDOUS MATERIALS SAFETY ADMINISTRATION
 P-1697 BEFORE THE PIPELINE AND HAZARDOUS MATERIALS SAFETY ADMINISTRATION PETITION FOR RULEMAKING TO ALLOW METHANE, REFRIGERATED LIQUID TO BE TRANSPORTED IN RAIL TANK CARS SUBMITTED BY THE ASSOCIATION OF
Process Safety Management of Highly Hazardous & Explosive Chemicals. EPA Clean Air Act - CAA 112 (r) Risk Management Plans
 Risk Management Plans") Process Safety Management of Highly Hazardous & Explosive Chemicals EPA Clean Air Act - CAA 112 (r) Risk Management Plans Risk Management Plans Risk Management Plans Many Times Companies Who Must Comply
Process Safety Management of Highly Hazardous & Explosive Chemicals EPA Clean Air Act - CAA 112 (r) Risk Management Plans Risk Management Plans Risk Management Plans Many Times Companies Who Must Comply
Fluid Mechanics, Heat Transfer, Fluid Mechanics Design Project. Production of Ethanol
 Fluid Mechanics, Heat Transfer, Fluid Mechanics Design Project Production of Ethanol Your assignment is to continue evaluating the details of a process to produce 30,000 tonne/y of ethanol from ethylene.
LNG LIQUEFIED NATURAL GAS TECHNOLOGIES
 LNG LIQUEFIED NATURAL GAS TECHNOLOGIES Air Liquide Group Air Liquide Engineering & Construction The world leader in gases, technologies and services for Industry and Health Air Liquide is present in 80
State of the Art in Equipment for Polyurethane Formulation and Injection using: PENTANE, METHYLAL, METHIL FORMATE, HFOs, WATER
 State of the Art in Equipment for Polyurethane Formulation and Injection using: PENTANE, METHYLAL, METHIL FORMATE, HFOs, WATER Mauricio Schmuziger Schmuziger Representacoes Fabrizio Brambilla Impianti
Environmental, Health and Safety Policy for Contractors
 Environmental, Health and Safety Policy for Contractors The attached policy is a tool to help contractors understand and comply with RBC's Environmental, Health and Safety rules. The information that follows