Effect&of&Low&Voltage&on&the&Aging&of&Fuel&Cells&! &!
|
|
|
- Alyson Boone
- 6 years ago
- Views:
Transcription
 Francois Lapique (ENSIC) & &")
1 Effect&of&Low&Voltage&on&the&Aging&of&Fuel&Cells& & A Major Qualifying Project Report submitted to the faculty of WORCESTER POLYTECHNIC INSTITUTE in partial fulfillment of the requirements for the Degree of Bachelor of Science Submitted to: Professor Stephen Kmiotek By: Sarah Kapelner Mercedes Kuzina March 28 th 2015 Co&Advised-by: Caroline Bonnet (ENSIC) Francois Lapique (ENSIC) & & 1
2 Abstract& Proton exchange membrane fuel cells (PEMFC) are an attractive source of current in many applications when coupled with supercapacitors. Supercapacitors operate via several charge and discharge cycles. When a supercapactitor is discharged, or at near zero voltage, the fuel cell must work at near zero voltage to supply the current. The effects of low voltage operation on the aging of PEMFCs are widely unknown. This major qualifying project conducted at ENSIC in Nancy, France, seeks to investigate these effects by studying the degradation of a PEMFC operating at low voltage. This experiment achieved low voltage operation by short-circuiting the fuel cell using a copper bracket. The cell operated for a total of six weeks where weekly characterization tests were conducted to evaluate the health of the membrane. The degradation of the fuel cell MEA was characterized by polarization curves, impedance spectroscopy, linear sweep voltammetry, and cyclic voltammetry. Research determined that over the course of the experiment the performance of the fuel cell decreased. However, voltammetry testing indicated that the membrane and catalyst layer degraded little over the course of six weeks. It is recommended to continue investing the lifetime of the MEA at low voltage operation. In future experiments, other characterization tests should be conducted weekly to monitor the performance of other aspects of the fuel cell such as electrodes and gas diffusion layers. Table&of&Contents& Abstract... 2 Table of Figures... 3 Table of Tables... 4 Nomenclature... 4 Greek Symbols
3 Acknowledgements... 5 Background... 6 Introduction... 6 Types of Fuel Cells... 7 Proton Exchange Membrane Fuel Cell... 8 History of Proton Exchange Membrane Fuel Cells... 8 Fundamentals of the PEMFC... 9 Plates Membrane Electrode Assembly Application of Faradays Law Assessment of Fuel Cell Performance Polarization Curves Electrochemical Impedance Spectroscopy Cyclic voltammetry (CV) Linear Sweep Voltammetry Prospective applications Methodology Equipment Fuel Cell Procedures Polarization Curve and Electrochemical Impedance Spectroscopy Cyclic Voltammetry and Linear Sweep Voltammetry Results Polarization Curves Performance Curve Electrochemical Impedance Spectroscopy Cyclic Voltammetry and Linear Sweep Voltammetry Conclusions and Recommendations Appendix I: Reactant flow rate calculations Flowrate of Hydrogen Flowrate of Oxygen Appendix II: Calibration of Flow Meters Appendix III: Raw Data A. Expected Current and Measured Current Values B. Polarization Curves C. EIS References Table&of&Figures& Figure 1: Layered components of a single PEMFC from UBzM Germany Figure 2: Example of a membrane electrode assembly (MEA)(Paxi Tech,2015) Figure 3: MEA Component Assembly (Larminie & Dicks, 2003) Figure 4: Example structure of a sulphonated fluoroethylene (Larminie & Dicks, 2003) Figure 5: A typical polarization curve showing regions of current at which different voltage losses occur (Wang, 2012)
4 Figure 6: Sinusoidal Response of Current to Electric Potential (Gamry Instruments, 2015) Figure 7: A Nyquist plot (Dandekar and Mandonca, 2012) Figure 8: A Nyquist plot with maximum frequency, charge transfer resistance and electrolyte resistance shown. (Wang, 2012) Figure 9: Voltage Sweeps between two voltage limits,v1 and V2 (Gouws, Shawn. 2012) Figure 10: Typical Voltammogram (Wu, Jinfeng et al., 2012) Figure 11: Cyclic voltammogram of PEM fuel cell catalyst (Cooper, Kevin. 2009) Figure 12: Typical LSV curve measured at 60 C for a commercial Nafion membrane under 100% humidity (Wu, Jinfeng et al., 2012) Figure 13: Schematic of fuel cell coupled with a supercapacitor Figure 14: Schematic of fuel cell bench Figure 15: Actual Fuel Cell test bench Figure 16: Fuel Cell current as a function of hydrogen flow rate Figure 17: Short-Circuit Resistance for 2-Feb Figure 18: Polarization Curves for PEM Fuel Cell at 55 C Figure 19: Performancedecreased over the course of the 6 weeks Figure 20: Values for ohmic resistance as determine by fitting EIS data to a model Values for charge transfer resistance were obtained in addition to those for ohmic Figure 21: Values for charge transfer resistance at the cathode Figure 22: Values for charge transfer resistance at the anode Figure 23: Diffusion resistance values over seven week timeframe Figure 24: Pseudocapacitance at the cathode Figure 25: Pseudocapacitance at the anode Figure 26: Exponent of charge of constant phase element at the cathode Figure 27: Exponent of charge of constant phase element at the cathode Figure 28: Average Actual Flow Rate versus Desired Flow Rate Table&of&Tables& Table 1: Various types of Fuel cells and their applications... 8 Table 2: ECSA values at a scan rate of 30 mv/s Table 3 : Hydrogen Crossover over six week period Table 4: Flow rates for hydrogen and air calculated with Faraday s Law Nomenclature& CV cyclic voltammetry E potential (V) E o standard thermodynamic voltage (V) ECSA electrochemical catalyst surface area (cm 2 Pt/g Pt) EIS electrochemical impedance spectroscopy F Faraday s constant (96,485 C mol -1 ) 4
5 I fuel cell current (A) i fuel cell current density (A cm -2 ) i H2 hydrogen crossover current LSV linear sweep voltammetry n reactant stoichiometric coefficient na constant phase element parameter at anode nc constant phase element parameter at cathode OCV open circuit voltage P atmospheric pressure (101,325 kpa) P d power density PEMFC proton exchange membrane fuel cell Q a pseudo capacitance anode Q c pseudo capacitance cathode Q i volumetric flow rate (L s -1 ) Q v flow of hydrogen crossover R gas constant (J mol -1 K -1 ) R a charge transfer resistance at anode R c charge transfer resistance at cathode R ct charge transfer resistance R d diffusion resistance R sc Short circuit resistance R W Ohmic resistance T temperature (K) V fuel cell voltage (V) Z real impedance Z imaginary impedance Greek&Symbols& α β l γ v i charge transfer coefficient for redox reaction charge transfer coefficient for redox reaction flow meter correction factor activity of reacting species stoichiometric coefficient of species i Acknowledgements&& We would like to thank ENSIC for their partnership and collaboration on this project. A special acknowledgment to Francois Lapicque, Caroline Bonnet and Stephen Kmiotek for their guidance, knowledge, and support throughout the duration of this project. 5
6 Background& Introduction& A fuel cell is a device that converts chemical energy into electrical energy via several electrochemical reactions. Fuel cell technology has the ability to significantly reduce the amount of pollutants, such as green house gases in the atmosphere compared to traditional combustion-based power generation technologies. In addition, fuel cells have the advantage of being more efficient compared to traditional combustion engines because a fuel cell is not restricted by the Carnot limitation. A fuel cell generates electricity, heat and water via an irreversible electrochemical reaction. The overall chemical reaction for generating electricity is: All fuel cells are comprised of two porous carbon electrodes: a positively charged anode and negatively charged cathode. At the anode, hydrogen is oxidized to form protons via the following oxidation reaction: At the cathode, oxygen reacts with electrons taken from the electrode and the H + irons from the electrolyte to form water. Below is the reduction reaction that occurs at the cathode: Bothofthesereactionsproceedcontinuouslyandelectronsthatare producedattheanodemustpassthroughtheelectricalcircuittothecathode,which producesacurrentor load.inaddition,h + ionsmustpassthroughtheelectrolyte (Larminie&Dicks,2003).ThepotentialofthecellislimitedbythetwoHredox 6
7 reactions.thechangelinkedtooxidationandtheanodeisequalto0v,butthe changelinkedtoreductionatthecathodeproduces1.23v.however,duetoseveral resistancesthisfuelcellpotentialisunobtainable(lapicque,2015). Types&of&Fuel&Cells& The main disadvantages of fuel cells include the slow reaction rates as well as the availability of hydrogen. A slow reaction rate is overcome by the application of a highly porous electrode with a platinum catalyst and/or operating at a high pressure. Hydrogen is more regarded as an energy carrier rather than an energy source because it is not found naturally in a pure uncombined form. Hydrogen is also difficult to store and transport. These disadvantages have resulted in the manufacturing of several different types of fuel cells. The six different types of fuel cells are typically differentiated by the electrolyte used and the operating temperature range (Larminie & Dicks, 2003) Basic information regarding the various types of fuel cells is summarized in Table 1 on the following page. 7
8 Fuel Cell Type Electrolyte Operating Applications Temperature ( C) Alkaline (AFC) KOH Space vehicles Proton exchange membrane (PEMFC) Polymer Vehicle and mobile applications Low power Direct Methanol (DMFC) Phosphoric Acid (PAFC) Molten carbonate (MCFC) Solid oxide (SOFC) CHP systems Polymer Low power portable electronics Phosphoric Acid ~220 High power CHP Systems Molten ~650 Medium to high Carbonate power CHP Systems Solid Oxide Suitable all power CHP systems Table1:VarioustypesofFuelcellsandtheirapplications Proton&Exchange&Membrane&Fuel&Cell&& The proton exchange membrane fuel cells (PEMFC) are the simplest and most widespread fuel cells in the automotive and mobile appliance industry due to their efficiency, power density, and durability (Larminie & Dicks, 2003). History&of&Proton&Exchange&Membrane&Fuel&Cells& General Electric developed the first PEMFC, also known as the solid polymer fuel cell, in the 1960 s for NASA. However, an issue of water management in the electrolyte resulted in NASA utilizing the alkaline fuel cell in their spacecraft s. At this time, GE did not pursue commercializing the PEMFC due to the cost being higher than other fuels cells, such as the Phosphoric Acid fuel cell. The further development of the PEMFC went 8
9 stagnant during most of the 1970s and 1980s. However toward the late 1980 s and early 1990 s, Ballard Power Systems began to research and improve PEMFC technology. Their developments were able to increase the current densities of the fuel cell, while also reducing the use of platinum by a factor of 100, from 28 to.2. As a result of these advances, PEMFC are now a preferred option for NASA spacecraft s. It can be argued that PEMFC s exceed all other electrical generating technologies with the broad scope of their applications. Research is being conducted to apply PEMFC technology to automobiles, mobile phones, computers, boats, busses, and industrial equipment (Larminie & Dicks, 2003). Fundamentals&of&the&PEMFC&& A PEMFC consists of several layers that all serve a unique purpose in the operation of the fuel cell. The assembly and characteristics of each layer facilitate the flow of reactants and products, which result in the creation of electrical energy. Figure 1 on the following page demonstrates the various layers of a single fuel cell manufactured by UBzM in Germany. 9
, two electrodes and an electrolyte membrane.")
10 Figure1:&LayeredcomponentsofasinglePEMFCfromUBzMGermany A fuel cell consists of two different parts: the plates and the membrane electrode assembly (MEA). The plates include end plates, current collecting plates and flow plates. The MEA contains several layers, namely the gas diffusion layers (GDLs), two electrodes and an electrolyte membrane. Plates& The outermost plates of the fuel cell are called the end plates, which hold the cell together. These plates have inlet and outlet openings to allow for the flow of hydrogen, oxygen, and water. Following the endplates on either side are the current collecting plates, which collect and conduct electron flow from the electrodes. The current collecting plates also have a contact lead to establish an external circuit. Following the current collecting plates are the channel plates, which are comprised of carbon and polymer based materials. The unique patterns and ducts in the channel plates direct the flow of water and oxygen. Channel plates can either be double-sided or single-sided. In a double-sided channel plate, the gas flow channel is located on one side and the water 10

11 flow channel on the other. In a single-sided channel plate, two channel plates are needed: one to direct gas flow and the other to direct water flow. The gas channel plates serve to distribute the gases onto the MEA. The water channel plates regulate the temperature of the cell and also allow electrical contact between the final plate and the catalyst layers. In a fuel cell stack, it is necessary to have two single-sided channel plates to direct the flow of water and one double-sided gas channel plate, also known as bipolar plate, which has flow patterns for gases on either side to direct the flow of hydrogen to the anode and oxygen to the cathode (Larminie & Dicks, 2003). Membrane&Electrode&Assembly& The membrane electrode assembly (MEA) is the core component of a fuel cell. The MEA is composed of gas diffusion layers (GDLs), electrodes, and a polymer electrolyte membrane (PEM). The figure below depicts a typical MEA used in a PEM fuel cell. Figure2:&Exampleofamembraneelectrodeassembly(MEA)(PaxiTech,2015) The MEA can be assembled via two different processes: the separate electrode method and the direct method. In the separate electrode method, each electrode is adhered to a GDL then each assembly is hot pressed on to either side of the PEM. In the 11
 The outermost layer of the MEA is the gas diffusion layer GDL.")
12 direct method, the electrode is built directly onto the electrolyte. Both methods yield the equivalent MEA construction. The layout of an MEA is depicted in Figure 3 below: Figure3:&MEAComponentAssembly(Larminie&Dicks,2003) The outermost layer of the MEA is the gas diffusion layer GDL. The GDL joins the electrode with the current collecting plate. These layers located on both sides of the MEA, allow gas access from the fluid flow channel to the catalyst layer and also allow removal of gaseous products. In addition, the GDL also provides a passage for water removal from the electrode to the flow field. The GDL had a high electrical and heat conductivity and is comprised of carbon paper, which provides protection and mechanical support to the inner MEA (Hartnig & Roth, 2012; Larminie & Dicks, 2003). Every fuel cell has two electrodes, which are termed the anode and cathode. The anode and cathode are located on either side of the electrolyte membrane and are the 12

13 locations in which the oxidation and reduction half reactions occur. Both half reactions are catalyzed by platinum particles fixed on finely divided carbon powder. Between both electrodes, is the electrolyte layer, which is theoretically impermeable to electrons and porous to the transportation of water and protons. The electrolyte layer is the central aspect of the PEMFC. Most membranes are composed of a sulphonated fluoropolymer. Figure 4 below, is an example of a sulphonated fluoroethylene polymer. The most common and well known is Nafion, which is produced by DuPont. Figure4:Examplestructureofasulphonatedfluoroethylene(Larminie&Dicks,2003) The polymer electrolyte membrane is produced using polyethylene, but substituting fluorine for hydrogen modifies its structure. This modified polymer is called polytetrafluoroethylene, or PTFE. The bonds between fluorine and carbon are strong, which make the membrane durable and resistant to chemical attack. In addition, the carbon-fluorine bonds are highly hydrophobic, which removes water from the electrode and prevents flooding of the fuel cell. Sulphonic acid, HSO3, is added as a side-chain on the PTFE polymer. This sulphonic acid side chain is highly hydrophilic, which results in large consumptions of water. In these hydrated regions, the protons are slightly attracted 13
14 to the resulting in a conductive dilute acid where protons can move freely. Overall, the electrolyte membrane is comprised of dilute acid regions surrounded by tough hydrophobic structure (Larminie & Dicks, 2003). Application&of&Faradays&Law& The necessary reactant flow rates needed to achieve a desired current were calculated using the following form of Faraday s Law: Q (1) Where Q (L/s) is the reactant flow rate, I (A) is the current, F is Faraday s constant, R is ideal gas constant, T (K) temperature, P (Kpa) pressure and n is the reactant stoichiometric coefficient. The reactant stoichiometric coefficient for hydrogen and oxygen were determined given by the following overall oxidation and reduction reactions: 2H 2 4H + +4e - O 2 +4H + +4e - 2H 2 O The stoichiometric coefficient value for hydrogen is equal to 2 and for oxygen is equal to 4. It is preferable to use air instead of pure oxygen since air is more abundant and oxygen reduction is sluggish (Lapicque, 2015). In this case, the equation below yields the flow rate of oxygen given an air composition equal to 21 % oxygen and 79% nitrogen. (2) 14
15 To account for any flow meter error and ensure that both reactants are in excess, the resulting flow rates were multiplied by a correction factor of 1.4 for hydrogen and 2.4 for oxygen. These correction factors ensure a forty percent excess of hydrogen and a one hundred forty percent excess of oxygen in air. Overall, the information derived from Faraday s Law was used to determine the necessary reactant flow rates in order for the fuel cell to supply a specific electrical current (Bonnet, 2014). Assessment&of&Fuel&Cell&Performance& There are several classical techniques that can be used to assess the health of fuel cells. Fuel cell performance is, in part, based on the power output of the cell, which can be determined given the following equation: P = I*V (3) In analyzing and characterizing fuel cell performance it is necessary to use techniques that track both voltage and current. It is also useful to study the charge of hydrogen for during desorption on the platinum catalyst and hydrogen crossover within the cell to evaluate the effectiveness of the catalyst and degradation of the MEA. Polarization&Curves& Polarization curves, plots of cell voltage versus current density, are used to assess fuel cell performance in various ways. One way is to use polarization curves to determine the power output of fuel cells. In addition, several polarization curves recorded at different points in time can be compared to obtain information on fuel cell performance. Polarization curves are often created under the condition of Open Circuit Voltage (OCV), which is the voltage produced by a fuel cell when there is no electrical load on 15
16 the cell (Wang, 2012). The OCV is almost always lower than the theoretical voltage of a fuel cell. The theoretical voltage for a PEMFC is also given by the Nernst Equation: (4) where E 0 is the standard thermodynamic voltage at 25 C, R is the universal gas constant, F is Faraday s constant, γ is the activity of the product or reactant, v i is the stoichiometric coefficient of species i, n is the electron transfer number for the reaction and T is the absolute temperature (Wang, 2012). The difference between OCV and theoretical voltage is called irreversible voltage loss, which is caused by mass transfer limitations during crossover from the anode to the cathode. There are different forms of voltage or electric potential losses that occur in the fuel cell at different current density levels. These losses are reflected in polarization curves. The three losses taking place include: activation loss, ohmic loss and mass transport loss. The regions of the polarization curve where each type of loss occurs is evidenced in Figure 5 below. Figure5:Atypicalpolarizationcurveshowingregionsofcurrentatwhichdifferent voltagelossesoccur(wang,2012). 16
17 The vertical distance between the polarization curve and the theoretical maximum voltage is indicative of the power output of the fuel cell. The shorter this distance, the greater the power output. As the cell ages, the polarization curve shifts downward and the power output decreases for all current values. This is indicative of a decrease in fuel cell performance. Activation losses or charge transfer resistance takes place in the low current density region of the polarization curve. This type of loss is due to sluggish charge transfer at the electrode of the fuel cell during the redox reaction. This type of loss is described by the Butler-Volmer equation: (5) Where α and β are transfer coefficients, i 0 is the exchange current density, i is current density and η act is the activation loss/charge transfer resistance (Wang, 2012). Irreversible voltage loss is just one type of loss that occurs in PEMFCs. In the intermediate current range of a polarization curve, ohmic losses or ohmic resistance mainly causes the voltage drop. Ohmic resistance consists of the internal resistance of electric contact resistance among fuel cell components, such as an interface connected by a bolt, and proton resistance across the MEA. In a PEMFC the proton resistance plays a greater role in ohmic resistance than electric contact resistance (Wang, 2012). Mass transport in a PEMFC is comprised of the advection and diffusion of reactants and products. This leads to mass transport loss or diffusion resistance. It occurs in the high current density range of polarization curves and is due to the fact that the amount of reactant that can react is equal to the amount that reaches the platinum catalyst layer in the fuel cell (Wang, 2012). Some common scenarios preventing the reactants 17
18 from reaching this layer include: a low concentration gradient, in the case of diffusion, and interference of fluid flow in the case of advection. Diffusion is described by Fick s Law (equation 5) and advection is described by the advection equation (equation 4) shown below: (5) where for 2 or more dimensions is the diffusion coefficient and "is the concentration of the diffusing species. (6) where, u is the velocity and ѱ is a scalar quantity. The theoretical voltage losses resulting from mass diffusion are called Nernst Losses, which can be calculated with the following equation: (7) where is the bulk concentration of reactant, is the concentration of reactant on the catalyst layer and α is a transfer coefficient. In the case of PEMFCs, there will be significant diffusion resistance if hydrogen and air flow is inhibited. Polarization curves can be recorded under steady-state or transient conditions. In the case of steady-state conditions polarization curves, the voltage or electric potential is recorded as the current is varied. The rate of change of current must be relatively low for 18
19 steady-state recording. Alternatively, a polarization curve can be created under transient conditions using a slow current sweep rate (Wang, 2012). Polarization curves are a widely used technique to assess the power output of fuel cells. However, recording polarization curves is a time-consuming process. For this reason it is preferable to use different techniques, such as those discussed in the following sections. Electrochemical&Impedance&Spectroscopy& Electrochemical Impedance Spectroscopy (EIS) is another technique used to study the health of fuel cells. EIS involves obtaining the impedance of a fuel cell and generating a plot called a Nyquist plot, which shows the relationship between the imaginary part of the impedance and the real part of the impedance. EIS gives further information on the three different types of resistance: charge transfer resistance, ohmic resistance and diffusion resistance by providing parameters representing these resistances. In addition, EIS gives parameters for electrode capacitance within the fuel cell (Dandekar and Mandonca, 2012). By analyzing resistance and capacitance values over time information can be obtained on charge transfer, reaction mechanisms, electrode properties and aging/degradation of the fuel cell (Wang, 2012). Creating a Nyquist plot involves one of two things. Either electric potential (E) is imposed and current (I) is measured over time or I is imposed and E is measured over time. The first method is called Potentiostatic Electrochemical Impedance Spectroscopy (PEIS) and it involves setting the amplitude of the potential, which is a sinusoidal signal. The current response is then measured. Figure 6 on the following page illustrates the imposed sinusoidal potential and the resulting sinusoidal current response that occurs in PEIS. The second method is called Galvanostatic Electrochemical Impedance 19
20 Spectroscopy (GEIS) and it involves setting the amplitude of the current and measuring the potential response. Considering PEIS, electric potential is given by Equation 8 as follows: (8) where is the amplitude of the function E(t) and is the radial frequency. I is given by Equation 9 below: (9) where I is the amplitude of the sinusoidal function, is the radial frequency and is the phase shift between the I(t) and E(t) curves shown in Figure 6 below. The phase shift is representative of the current response to the electrical potential (Gamry Instruments, 2015). If current were imposed instead of electric potential as in GEIS a similar phase shift would exist in Equation 8 instead of in Equation 9 and on the sinusoidal plot of potential rather than on the sinusoidal plot of current, opposite of what is shown in Figure 6. Figure6:SinusoidalResponseofCurrenttoElectricPotential(GamryInstruments,2015) The phase shift and the ratio of electric potential to nominal operating current, are both used in the equation for complex impedance, Z =, where j=. The Real 20
21 impedance Z is obtained by taking the ratio of AC voltage to AC current. Values of impedance at different frequencies, f=, make up a Nyquist plot (Shudmacher, 2012). Once the values of Z and Z have been obtained a Nyquist plot can be created. An example of a Nyquist plot is shown in Figure 7 below. The opposite of the imaginary part of the impedance is plotted versus the real part of the impedance and the frequency decreases from left to right. Figure7:ANyquistplot(DandekarandMandonca,2012). A Nyquist plot can be divided into three areas that represent the three losses previously discussed: activation losses, ohmic losses and mass transport losses. The leftmost loop, or higher frequency loop, is the region of the plot that describes the activation losses or charge transfer resistance. The second loop, or lower frequency loop, describes mass transport losses or diffusion resistance (Torrents, Mason and Garboczi, 2000). Ohmic losses or ohmic resistance is also represented on the Nyquist plot as the distance from the origin to the point at which the spectra crosses the x-axis 21
22 (Dandekar and Mondonca, 2012). Although not typically shown on Nyquist plots, frequencies increase along the x-axis (Vermeeren and Michiels, 2011). For simple processes where the impedance consists only of the charge transfer resistance (R ct ), ohmic resistance (shown as electrolyte resistance in Figure 8 below, R el ) and double layer capacitance (C dl ) the impedance calculation is simple. R ct can be taken directly from the Nyquist plot as the diameter of one of the loops. Figure 8 shows where R ct and R el can be found on the Nyquist plot. The maximum frequency, f max, can also be taken from the Nyquist plot. Figure8:ANyquistplotwithmaximumfrequency,chargetransferresistanceand electrolyteresistanceshown.(wang,2012) With R ct and f max, the double layer capacitance, C dl, can be determined from the equation: These values for resistance and capacitance can then be used in analysis of fuel cell performance. (10) The above method is not sufficient to calculate the impedance for more complicated processes where impedance consists of more than just the charge transfer resistance, ohmic resistance and capacitive phenomena. For these processes it is 22
23 necessary to use software that calculates the impedance (Wang, 2012). Then the resulting Nyquist plot is fitted to a model to obtain parameters for resistance and capacitance (Dandekar and Mandonca, 2012). Electrochemical Impedance Spectroscopy is a widely used technique for analyzing the performance of fuel cells. It is a non-invasive, steady-state technique that gives a wide range of information on fuel cell characteristics. EIS is a well-established technique in studying single fuel cells, under both load and OCV (Dandekar and Mandonca, 2012). Lastly, EIS is an emerging technique for studying stacks of fuel cells (Wang, 2012). Cyclic&voltammetry&(CV)& Cyclic Voltammetry (CV) is a widely used technique to obtain qualitative information regarding the fuel cell catalyst and the electrochemical reactions occurring within the MEA (Andrienko, Denis, 2003). CV tests are conducted with hydrogen being fed to the cathode and an inert gas being fed to the anode. This electro-analytical technique is based on linear voltage sweeps between an initial value, V 2, to a predetermined potential limit, V 1, where the direction of the scan is reversed. These linear sweeps between V 1 and V 2 are repeated for a specific duration of time. (Gouws, Shawn. 2012). The linear voltage sweeps in a CV scan are illustrated in Figure 9 on the following page. 23
24 Figure9:VoltageSweepsbetweentwovoltagelimits,V1andV2(Gouws,Shawn.2012) The current response as a result of this polarization is plotted as a function of the applied potential, which is submitted to cyclic linear scanning between two potential values. The scan rate of the potential can vary over a wide range, but the rate ultimately depends on the projected flow rate of water. This current-voltage curve is referred to as the cyclic voltammogram (Kumpulainen, Heikki et al., 2002). Such a curve is depicted in Figure 10 below: Figure10:TypicalVoltammogram(Wu,Jinfengetal.,2012) 24
25 A cyclic voltammogram can be divided into two regions to represent the oxidation and reduction reactions within the MEA. Region 1, is present from mv and represents the oxidation of hydrogen and its transport through the membrane. Region 2, represents the reduction reaction, which occurs between mv. At approximately 50 mv molecular hydrogen is formed at the cathode. Figure 11 below illustrates a PEM cyclic voltammogram with specified regions (Cooper, Kevin. 2009). Figure11:CyclicvoltammogramofPEMfuelcellcatalyst(Cooper,Kevin.2009) This qualitative information is applied to determine the electrochemical catalyst surface area (ECSA), which an estimate based upon the relationship between the total number of reactive surface sites and the charge needed to remove a monolayer of adsorbed hydrogen on the electrode, as determined from the cyclic voltammetry measurement. The charge is determined by integrating the current density in the cathodic or anodic scan of the hydrogen adsorption/desorption region of the cyclic voltammogram and substituting the capacitive contribution taken between 0.4 V and 0.6 V. The H 2 adsorption charge on a smooth Pt electrode has been measured to be 210 of Pt loading in the catalyst layer. The ECSA is calculated using the following equation (Wu, Jinfeng et al.,2012): 25
26 (11) Linear&Sweep&Voltammetry&& Linear sweep voltammetry (LSV) is an electrochemical method to estimate gas crossover through the membrane in a PEM fuel cell. More generally, LSV consists of measuring the current variation when the potential is submitted to a slow scan rate. The information derived from an LSV scan is a useful method to determine fuel cell membrane degradation over a period of time. During an LSV scan, fully humidified hydrogen is fed to the cathode while an inert gas is fed to the anode. The anode serves as the reference electrode (RE) as well as the counter electrode (CE). The cathode serves as the working electrode (WE). Using a power supply, the WE is swept by a linear potential scan from the initial potential to the final potential at a low scan rate, typically 4. Commonly, potentials range from 0 V to.5 V. Any potential higher than.8 V is avoided to prevent irreversible platinum or carbon oxidation. Figure 12 below demonstrates a typical LSV curve obtained in the lab. Figure12:TypicalLSVcurvemeasuredat60 CforacommercialNafionmembrane under100%humidity(wu,jinfengetal.,2012) 26
27 When the applied potential of the fuel cell is controlled there is electrochemical activity occurring in the form of current, which is monitored through both the electrodes. Under the chosen high potential, hydrogen has crossed though the membrane from the anode to the cathode. Nitrogen or another inert gas is introduced in the cathode, so any current generated is assumed to correspond to electrochemical oxidation of hydrogen gas that has crossed over from the anode to the cathode, which allows for the estimate of hydrogen crossover from the anode to the cathode. At 0.4 V, hydrogen oxidation occurs and the crossover currant is observed. This current when applied to Faraday s Law, Equation 12, can determine the flow of hydrogen at crossover, thus determining the permeability of the membrane (Zhang, Shengsheng et al., 2012). (12) Prospective&applications& Fuel cells are currently one of the most promising alternative sources of electric power. Fuel cells have a capacity to revolutionize the power industry through offering a cleaner, more-efficient alternative to the combustion of gasoline and other fossil fuels. Fuel cells have the potential to replace internal-combustion engine in vehicles and provide power in both stationary and portable applications because they are energyefficient, clean, and fuel-flexible (Fuel Cell Technologies Office, DOE). PEM fuel cells are a potential alternative for both automobiles and mobile applications due to their high power density and low temperature operation. In addition, a PEMFC is lightweight, compact and relatively inexpensive to manufacture due to researchers finding new ways to cut costs without sacrificing performance. (Rael, Fox ). 27
28 A major limitation in fuel cell development and commercialization is the limited lifetime. Depending on the fuel cells applications, the lifetime of a fuel cell stack varies from 2,000 to 10,000 hours, which is still considered insufficient (Lapicque, 2015). Another major disadvantage of a PEMFC is a delayed voltage supply due to reactant gas flow limitations. A possible solution to this problem is coupling a fuel cell with a battery or supercapacitor. Figure 13 below represents a fuel cell coupled with a capacitor to allow for low voltage operation, which was utilized throughout the duration of this experiment. Figure13:Schematicoffuelcellcoupledwithasupercapacitor The fuel cell serves as a current source to charge the supercapacitor or battery. The superconducting coil or supercapacitor would provide zero resistance, thus reducing the fuel cell voltage to approximately zero. The combination of a fuel cell with a battery or supercapacitor is an attractive possibility especially in the automotive industry. In several previous experiments, PEMFCs were forced to operate at low voltage via CA testing and also via a superconducting coil. Both experiments determined that fuel cells could produce a sufficient current while operating at low voltage. In addition, it was 28
29 found that the expected current was correlated to the inlet hydrogen flow rate, thus following Faraday s Law. This report explored the effects of membrane degradation when a fuel cell is operating in short-circuit. Previousexperimentsdeterminedthatfuelcellswereable toprovideacurrentatalowvoltage,buttheeffectsoflowvoltageoperationonthe fuelcellmembranehasyettobedetermined.thisresearchintendedtodetermine theeffectswithinthemeaoffuelcelloperationcoupledwithasuperconducting coil. Methodology&& Equipment&& Fuel&Cell&& ThesinglePEMfuelcellconsistsoftwoendplates,twocurrentcollecting plates,twochannelflowplates,abipolarflowplateandamea.themeaconsistsof afivehlayerassembly.themembraneusedwasapmembrainh400(umicore) purchasedfromubzmgermany.oneithersideofthemea,weretwothinelectrodes containing0.4mgofplatinumpersquarecentimeter,acarbonlayer,andtwo Sigracet 30BCGDLs.Figure14onthefollowingpageillustratesthebenchsetup forthedurationofthisexperiment. 29
30 Figure14:Schematicoffuelcellbench Airandhydrogenenterthecellfromthehousesupplyviavalvesand regulators.athreehwayvalveislocateddownstreamoftheairflowpathwaytoallow forargonflowduringvoltammetrytesting.allflowratesarecontrolledusing Brooks massflowcontrollers.airflowsfromthehousesupplyintotheair humidifierviainsulatedtubes.thehousehmadehumidifierisconnectedtoawater bathtohumidifytheair.oncehumidified,theairentersthefuelcellatthecathode. Foralloperations,thehydrogengaswaskeptdryandenteredthefuelcellatthe anode.thefuelcelltemperaturewasmaintainedat55 Cusingpreheatedwaterin thecell swatercirculationsystem.waterwascollectedandrecycledfromthe anodeandcathodeusingabeaker.figure15onthefollowingpageisaphotoofthe actualfuelcellbench. 30

31 Figure15:ActualFuelCelltestbench On the right of the fuel cell bench is the load and below the load is the potentiostat/galvanostat (PGSTAT). These two pieces of equipment were used together to obtain the level of current necessary for some of the electrochemical experiments. While in galvanostatic mode the PGSTAT is used to control the current between the cathode and anode in the PEM fuel cell (Metrohm Autolab, 2015). However, the PGSTAT can only provide a signal for current between 1 and 2 amps. Using the load the current can be amplified to higher values necessary for the experiments. Procedures& Polarization&Curve&and&Electrochemical&Impedance&Spectroscopy& A steady-state polarization curve and a GEIS scan of electrochemical impedance spectra (Nyquist plot) were generated weekly to assess the state of health of the fuel cell. 31
32 The measurements for these graphs were obtained for different fixed values of current ranging from 10 A 120 A. Flow rates for hydrogen and air were increased each time the current was increased using stoichiometric factors of 1.4 for hydrogen and 2.4 for air. The measurements used to make these graphs were cell voltage, imaginary impedance and real impedance. To obtain the necessary measurements, the desired flowrates were set on the regulator on the fuel cell bench. The desired current value was set in NOVA software. However, the desired current value had to be negated when input into the software. The amplitude of the sinusoidal curves was also set in the NOVA software. The amplitude was set to ten percent of the current value. This has been shown to keep the electrochemical system linear while allowing for sufficient accuracy in measurements (Lapicque, 2015). Measurement recoding for voltages less than 700 mv occurred over a duration of 5 minutes and for voltages greater than 700 mv measurements were taken over 10 minutes. From these measurements cell voltage was plotted versus time and the impedance spectra were plotted on a Nyquist plot. Cyclic&Voltammetry&and&Linear&Sweep&Voltammetry&& ForCyclicVoltammetry(CV)andLinearSweepVoltammetry(LSV),theflow ofairtothehumidifierwasclosedviaathreehwayvalveallowingfortheflowof argongasintothehumidifier.waterbathtemperatureswereincreasedto60 Cto allowfor100%relativehumidityconditions. Results&& The objective of this experiment was to explore the degradation of a single-cell PEM fuel cell while operating at low voltage. This section compiles the results from the various characterization techniques. 32
33 The data obtained from the week of January 20 th was disregarded because the data obtained during the week of January 26 th indicated more accurate representation of fuel cell performance due to the maturation of the system and membrane conditioning. Comparison&of&Expected&Current&and&Measured&Current&Values& The difference between the expected values of current for corresponding flow rates calculated via Faraday s Law and the measured values of current exhibit a general trend of increasing values of current with an increasing flow rate. This trend is exhibited in Figure 16 below: Figure16:FuelCellcurrentasafunctionofhydrogenflowrate At higher hydrogen flow rates there was a larger deviation from the general trend of increasing current with increasing flow rate. Specifically for current values of 140A and 150A. See Appendix 3.A. These deviations could be linked to the probe used to take the measurements or the humidification conditions inside the fuel cell. Figure 17 on the following page shows the short circuit resistance (R sc ) or the ratio of measured voltage to measured current for the week of February 2,
34 Figure17:ShortaCircuitResistancefor2aFeba2015 The resulting short circuit resistance (R sc ) is the slope of the line generated by plotting the measured voltage versus the measured current. For the week of February 2, 2015 the R sc is equal to As evidenced in Appendix 3.B, the value of R sc remained fairly constant throughout the six weeks of testing. This relatively constant value of R sc exemplifies that the cell generates constant resistance while operating in short circuit over the course of 6 weeks. Polarization&Curves& It was found that the voltage decreases with increasing current density. The rate at which the voltage decreased became greater as the weeks progressed. At low current densities between.1 and.3 A/cm 2 the deviation in the voltage between the different weeks was not as large as it was at high current densities between.4 and 1.3 A/cm 2. The polarization curves containing results for each week are shown in Figure
35 Voltage((V) Polarization(curves 20,Jan,15 26,Jan,15 02,Feb,15 10,Feb,15 17,Feb,15 23,Feb,15 02,Mar, Current(density((A/cm²) Figure18:PolarizationCurvesforPEMFuelCellat55 C Performance&Curve& From the polarization curve data the performance curve of power density (P d ) versus current density was plotted. As can be seen in Figure 19 below: 0.6 PERFORMANCE/CURVE Power/Density/(W/cm2) Current/Density/(A/cm2) 20GJanG15 26GJanG15 2GFebG15 10GFebG15 17GFebG15 23GFebG15 2GMarG15 Figure19:Performancedecreasedoverthecourseofthe6weeks 35
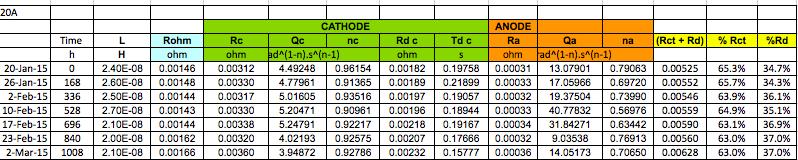
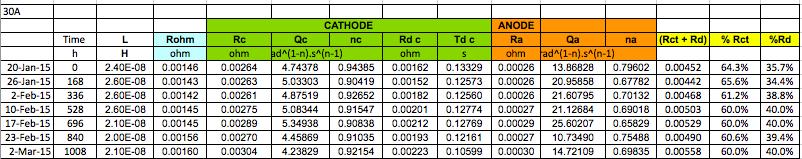
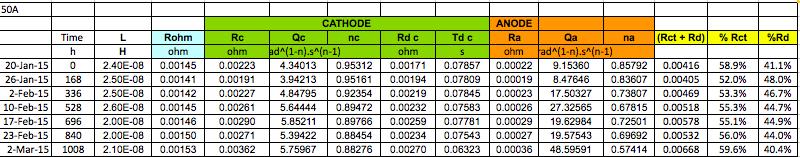
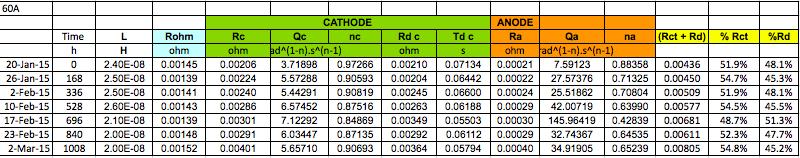
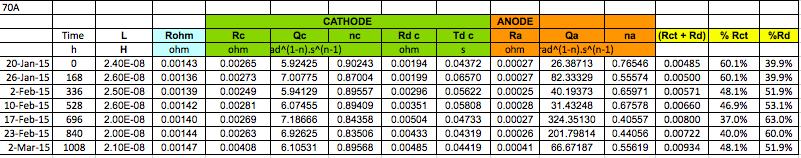
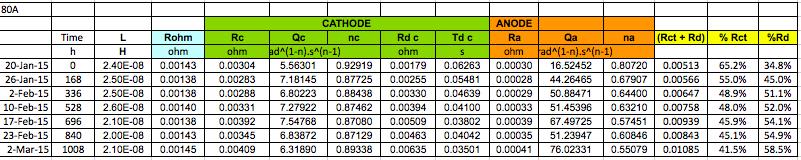
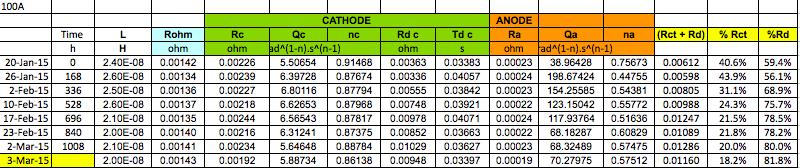
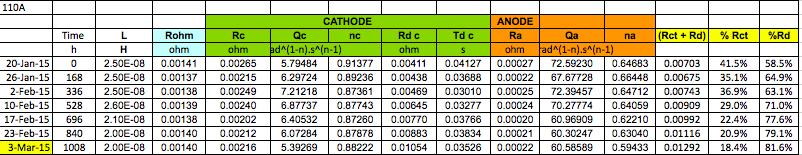
36 Electrochemical&Impedance&Spectroscopy& The ohmic resistance values are shown in Figure 20, below, as a function of time. Ohmic resistance fluctuated greatly initially but as time increased the ohmic resistance began to increase as can be seen on the right half of Figure 20. This increase in ohmic resistance with time indicates decreased conductivity in the fuel cell. The initial decrease in ohmic resistance may be related to the level of humidity in the cell and the conditions under which the cell was conditioned. An over-humidified or under-humidified MEA may not be an environment conducive to maximum conductivity. Figure20:ValuesforohmicresistanceasdeterminebyfittingEISdatatoamodel Valuesforchargetransferresistancewereobtainedinadditiontothoseforohmic resistance. Both values of charge transfer resistance at the cathode (R c ) and charge transfer resistance at the anode (R a ) were obtained. R c is plotted as a function of time in Figure 21 on the following page. R c remains quite constant for a given value of current as time progresses. This indicates that there is not a significant change in hydrogen reduction at the cathode. 36
37 Figure21:Valuesforchargetransferresistanceatthecathode. Results similar to those of R c are shown for R a in Figure 22. It was assumed that R a was ten percent of R c. Since the values for these resistances are constant the conductufuty of the fuel cell can not be attributed to any changes in fuel cell performance within the time frame of these experiments. Figure22:Valuesforchargetransferresistanceattheanode. 37
38 The final type of resistance that was determined with EIS was diffusion resistance. As can be seen in Figure 23 below, diffusion resistance increases with time in almost a linear fashion, especially at current levels below 70A. This increase may be attributed to the cell components becoming more compressed an gas flow more difficult, thus hindering mass transfer. Diffusion resistance increases with current as well (greater than 70 A) where there is an average of a 2.4 fold increase in diffusion resistance over the time interval. The average diffusion resistance values are greater at higher levels of current indicating a greater hinderance to mass transfer possibly due to reaching the limiting current i l, at which the resistance to reaction is mainly controlled by diffusion resistance as opposed to charge transfer resistance. Figure23:Diffusionresistancevaluesoversevenweektimeframe. The pseudocapacitance, which is a double layer capacitance is shown in Figure 24 and Figure 25 at the cathode and the anode. At the cathode the pseudocapacitance 38
39 increases and then decreases over time whereas at the anode it reamains fairly constant for values of current below 40 A and for 90 A and 120 A. The variaton in pseudocapacitance is slight, however, so no conclusions can be drawn from the capacitance within the time frame of this experiment. Figure24:Pseudocapacitanceatthecathode Figure25:Pseudocapacitanceattheanode 39
40 Two model parameters used in the equivalent circuit model for the pseudo capacitance calculation do give some insight into the effect of capacitance on the fuel cell indirectly and these are the exponents of charge of constant phase element at the cathode (nc) and at the anode (na). These parameters represent how well the electrode can accommodate pseudo capacitance and are shown in Figure 26 and Figure 27 below: Figure26:Exponentofchargeofconstantphaseelementatthecathode Figure27:Exponentofchargeofconstantphaseelementatthecathode. 40
41 A low nc of around.5 and.6 means the electrode interface is not well defined. Both nc and na decrease overall overtime and with increasing levels of current even though some fluctuations are present. The exponent for the anode decreases more than the exponent for the cathode as time increases. Nc does not decrease by more than.1 whereas na decreases by values between.1 and.3. The cathode interface is consistently more defined and more stable than the anode interface but overall there is not a significant change in either electrode. Cyclic&Voltammetry&and&Linear&Sweep&Voltammetry&& mv/s. Table 2, summarizes the ESCA values obtained via CV testing at a scan rate of 30 Date 20(Jan(15 26(Jan(15 2(Feb(15 10(Feb(15 17(Feb(15 23(Feb(15 2(Mar(15 Time(h) ECSAin cm²pt/cm² Table2:ECSAvaluesatascanrateof30mV/s The data obtained from the week of January 20 th was disregarded because the value of ESCA is sensitive to the hydration of the membrane. The ESCA value obtained from the data collected on the week of February 17 th is slightly lower than what is anticipated. The expected value should be around 140 cm²pt/cm². This lower ESCA value could be due to a low inlet gas temperature entering the fuel cell. There were no significant changes in the ESCA value. This suggests that the catalyst suffered little during the aging process while the fuel cell operated at low voltage. Table 3 on the following page summarizes the hydrogen crossover results obtained from LSV. 41
42 Date 20(Jan(15 26(Jan(15 2(Feb(15 10(Feb(15 17(Feb(15 23(Feb(15 2(Mar(15 Time(h) H2crossover (ma) Table3:HydrogenCrossoveroversixweekperiod The value of hydrogen crossover suggests the membrane capacity to be porous or nonporous. The value for hydrogen crossover remains fairly constant, so there was no considerable membrane aging during low voltage operation. These results suggest that there is no membrane degradation, since the permeability is virtually unchanged. It is suggested to continue running weekly characterization tests for a longer duration of time because the general trend for fuel cell aging is a steady slow decline followed by rapid aging. For both LSV and CV, there were larger changes in ESCA and hydrogen crossover from the week of February 23 rd to March 2 nd compared to the changes in other weeks. During the final week of testing, the ESCA value suggests greater catalyst degradation than previous weeks. In addition during the final week of testing for LSV, there was a slight decrease in fuel crossover, which suggests an increase in porosity or aging of the membrane. Conclusions&and&Recommendations&& Characterization of the fuel cell membrane while in short-circuit operation yielded no significant degradation on the health of the fuel cell. The results from the electrochemical impedance spectroscopy (EIS) and polarization curve results illustrate a decrease in fuel cell performance over the course of this experiment. However, the results obtained during voltammetry testing imply there were no significant changes in the catalyst health and membrane porosity. 42
43 These results suggest that there are another phenomena responsible for the fuel cells decrease in performance. The EIS diffusion resistance results suggest that there was an increasing mass transport limitation over the course of the experiment. The mass transport limitation could be due to the degradation of the electrodes and/or GDLs. The fuel cell is assembled tightly, so this compression over a long period of time could result in the degradation of other parts of the fuel cell, which would result in a decrease in performance. Characterization of the fuel cell yielded very comparable results from the MQP project completed by Veronica Goldsmith and Lindsey Mitchel last year titled Effects of Low Voltage Testing on PEM Fuel Cell with Current Control by Hydrogen Flow. Their experimentation proved the validity of Faraday s law by controlling the current density through the flow of hydrogen feed. In addition, their results suggested that there was minimal MEA damage caused by low voltage operation over a long duration of time. Overall, the experimental results from both this report and last years report suggest that conjunction of a fuel cell with a supercapacitor is an attractive application. Since, the current density is controlled by hydrogen flow this allows for a simple efficient process that is easily controllable. In addition, the ability to couple a fuel cell with a supercapacitor allows the cell to charge the supercapacitor, which decreases the reactant flow rate limitation thus controlling the power output. It is recommended to continue the four weekly characterization tests on the fuel cell until the membrane dies. Over the course of the six weeks, the membrane showed insignificant degradation. However, the typical aging of a fuel cell is a slow plateau followed by a rapid decline in health. It is also recommended to investigate the effect of short circuit operation on a fuel cell stack. This experiment focused on a single stack. 43
44 However in order to apply fuel cells to power a given application multiple cell stacks are typically needed. In future experiments, it would be beneficial to also conduct weekly tests to monitor of the health of the electrodes and GDLs to determine if these fuel cell components are adversely effected by short-circuit operation. Overall, this research provides information of the long-term health of a single MEA operating at low voltage. It is important to analyze and understand the factors that hinder fuel cell technology in order to continue making improvements. & & & & & & & & 44
45 Appendix&I:&Reactant&flow&rate&calculations& Using a form of Faraday s Law,, flowrates at various currents were calculated. The following oxidation reduction reactions taking place in the fuel cell were also considered in these calculations. 2H 2 4H + +4e - O 2 +4H + +4e - 2H 2 O Flowrate&of&Hydrogen& If I = 10 A, Q H2 * at STP, where 2 is the number of electrons involved in hydrogen oxidation, F = 96485, R = and from the Ideal Gas Law:. To obtain the actual flowrate of hydrogen the was multiplied by a correction factor, l=1.4. This ensured a forty percent excess of hydrogen. Q H2actual =. Flowrate&of&Oxygen& If I = 10 A,Q O2 * at STP, where 4 is the number of electrons involved in oxygen reduction, F = 96485, R = and from the Ideal Gas Law:. 45
46 To obtain the actual flowrate of air was multiplied by a correction factor, l=2.4. This correction factor corresponds to a one hundred forty percent excess of oxygen in air. Calculations yielded Table 4 on the following page: I (A) Q H2 (NmL/min) 1.4 Q air (NmL/min) Table4:FlowratesforhydrogenandaircalculatedwithFaraday slaw & 46
47 Appendix&II:&Calibration&of&Flow&Meters&& Before starting the experiments the hydrogen and air flow meters were calibrated. The appropriate calibration unit (different calibration units had different max flows that they could handle) was hooked up to the flowmeter being calibrated. The regulator was set to the desired flowrate set point. An average of ten readings, shown on the regulator screen, for the flowrate was recorded. This was repeated for twelve set points ranging from minimum to maximum flowrates for each calibration unit. The maximum flow rate for a particular calibration unit was indicated on the calibration unit and the minimum flow rate was the maximum divided by fifty. The average flow rates obtained were graphed versus the desired flow rate set points and the correction factor for the flow meter was taken as the equation of the resulting line. An example correction factor is shown in Figure 28 below: Figure28:AverageActualFlowRateversusDesiredFlowRate 47
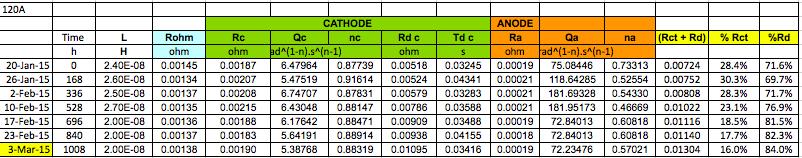
48 Appendix&III:&Raw&Data& A.&Expected&Current&and&Measured&Current&Value 20(Jan(15 26(Jan(15 Q(H2)& I&expected& I&measured& I&difference& U& I&measured& I&difference& U& NmL/min& A& A& A& mv& A& A& mv& notdone Rsc 1.44 mohm 2(Feb(15 10(Feb(15 Q(H2)& I&expected& I&measured& I&difference& U& I&measured& I&difference& U& NmL/min& A& A& A& mv& A& A& mv& Rsc 1.18 mohm Rsc 1.14 mohm 48
49 17(Feb(15 23(Feb(15 Q(H2)& I&expected& I&measured& I&difference& U& I&measured& I&difference& U& NmL/min& A& A& A& mv& A& A& mv& Rsc 1.47 mohm Rsc 1.27 mohm 2(Mar(15 Q(H2)& I&expected& I&measured& I&difference& U& NmL/min& A& A& A& mv& ( ( ( ( ( ( ( Rsc 1.2 mohm & & 49
50 B.&Polarization&Curves&& 20(Jan(15 26(Jan(15 2(Feb(15 10(Feb(15 17(Feb(15 23(Feb(15 2(Mar(15 i& (A/cm²)& U&(V)& U&(V)& U&(V)& U&(V)& U&(V)& U&(V)& U&(V)& && March 3rd


51 &C.EIS& 51

52 52
53 53
Fuel Cell Technology
 Fuel Cell Technology 1. Technology overview 2. Fuel cell performance 3. Fuel cell systems 4. Sample calculations 5. Experiment using PEM cell Goal: To provide a better understanding of the fuel cell technology,
Advanced Analytical Chemistry Lecture 10. Chem 4631
 Advanced Analytical Chemistry Lecture 10 Chem 4631 What is a fuel cell? An electro-chemical energy conversion device A factory that takes fuel as input and produces electricity as output. O 2 (g) H 2 (g)
ENVIRONMENT-FRIENDLY HYDROGEN GAS AS FUEL IN FUEL CELL AND ITS CHALLENGES
 ENVIRONMENT-FRIENDLY HYDROGEN GAS AS FUEL IN FUEL CELL AND ITS CHALLENGES Hydrogen is the simplest and lightest element. Storage is one of the greatest problems for hydrogen. It leaks very easily from
FUEL CELLS: Types. Electrolysis setup
 FUEL CELLS: Types History of the technology The fuel cell concept was first demonstrated by William R. Grove, a British physicist, in 1839. The cell he demonstrated was very simple, probably resembling
Efficient Use of Energy Converting Applications. Nadine Jacobs
 Efficient Use of Energy Converting Applications Agenda Introduction NEXT ENERGY EURECA Principal objectives Research areas Test protocols Stacktest Stadardisation DEMMEA Degradation Mechanisms in HT-PEM
Accelerated Stress Tests in PEM Fuel Cells: What can we learn from it?
 Accelerated Stress Tests in PEM Fuel Cells: What can we learn from it? D.P. Wilkinson 1,3, W. Merida 2,3 1 st Workshop : Durability and Degradation Issues in PEM Electrolysis Cells and its Components Fraunhofer
Lateral Current Density Variation in PEM Fuel Cells with Interdigitated Flow Fields
 University of Miami Scholarly Repository Open Access Dissertations Electronic Theses and Dissertations 2014-04-21 Lateral Current Density Variation in PEM Fuel Cells with Interdigitated Flow Fields Song
Construction of Improved HT-PEM MEAs and Stacks for Long Term Stable Modular CHP Units. NEXT ENERGY EWE Forschungszentrum für Energietechnologie e.v.
 FCH JU Grant Agreement number: 325262 Project acronym: CISTEM Project title: Construction of Improved HT-PEM MEAs and Stacks for Long Term Stable Modular CHP Units Work package: 2 - Materials beyond State
Modeling of HTPEM Fuel Cell Start-Up Process by Using Comsol Multiphysics
 Modeling of HTPEM Fuel Cell Start-Up Process by Using Comsol Multiphysics Y. Wang *1,2, J. Kowal 1,2 and D. U. Sauer 1,2,3 1 Electrochemical Energy Conversion and Storage Systems Group, Institute for Power
Modeling and analysis of electrochemical hydrogen compression
 Modeling and analysis of electrochemical hydrogen compression N.V. Dale 1,*, M. D. Mann 1, H. Salehfar 2, A. M. Dhirde 2, T. Han 2 Abstract One of the challenges to realizing the hydrogen economy is hydrogen
Effect of Mass Flow Rate and Temperature on the Performance of PEM Fuel Cell: An Experimental Study
 Research Article International Journal of Engineering and Technology ISSN 2277-4106 2013 INPRESSCO. All Rights Reserved. Available at http://inpressco.com/category/ijcet Effect of Mass Flow Rate and Temperature
PEM Fuel Cell Accelerated Stress Tests and Durability Test Protocols. October 2014
 PEM Fuel Cell Accelerated Stress Tests and Durability Test Protocols October 2014 Membrane Chemical Stability Kunz & Fenton (UConn) USFCC (DuPont) U.S. Drive Fuel Cell Tech Team W.L. Gore & Associates
PROTON EXCHANGE MEMBRANE (PEM) FUEL CELL PARAMETRIC STUDY VIA MATHEMATICAL MODELING AND NUMERICAL SIMULATION
 FUEL CELL PARAMETRIC STUDY VIA MATHEMATICAL MODELING AND NUMERICAL SIMULATION") PROTON EXCHANGE MEMBRANE (PEM) FUEL CELL PARAMETRIC STUDY VIA MATHEMATICAL MODELING AND NUMERICAL SIMULATION By Rihab Jaralla B.Eng., University of Technology, Baghdad, Iraq, 1993 MASc., Ryerson University,
PROTON EXCHANGE MEMBRANE (PEM) FUEL CELL PARAMETRIC STUDY VIA MATHEMATICAL MODELING AND NUMERICAL SIMULATION By Rihab Jaralla B.Eng., University of Technology, Baghdad, Iraq, 1993 MASc., Ryerson University,
The flow-field pattern Optimization of the Bipolar Plate for PEMFC Considering the Nonlinear Material
 Int. J. Electrochem. Sci., 10 (2015) 2564-2579 International Journal of ELECTROCHEMICAL SCIENCE www.electrochemsci.org The flow-field pattern Optimization of the Bipolar Plate for PEMFC Considering the
Water Transport through a Proton-Exchange Membrane (PEM) Fuel Cell Operating near Ambient Conditions: Experimental and Modeling Studies
 Fuel Cell Operating near Ambient Conditions: Experimental and Modeling Studies") Energy & Fuels 2009, 23, 397 402 397 Water Transport through a Proton-Exchange Membrane (PEM) Fuel Cell Operating near Ambient Conditions: Experimental and Modeling Studies D. S. Falcão, C. M. Rangel,
Energy & Fuels 2009, 23, 397 402 397 Water Transport through a Proton-Exchange Membrane (PEM) Fuel Cell Operating near Ambient Conditions: Experimental and Modeling Studies D. S. Falcão, C. M. Rangel,
Experimental and Modelling Studies of Cold Start Processes in Proton Exchange Membrane Fuel Cells
 Experimental and Modelling Studies of Cold Start Processes in Proton Exchange Membrane Fuel Cells by Kui Jiao A thesis presented to the University of Waterloo in fulfillment of the thesis requirement for
Supporting Information
 Supporting Information Experimental Methods Pt ALD. The precursor used for ALD was trimethyl-methylcyclopentadienyl-platinum(iv) (MeCpPtMe 3 ) (Strem Chemicals, 99%), which has been widely reported for
Methanol Steam Reformer High Temperature PEM Fuel Cell System Analysis
 Annex 3 to EDA Comm N 12/027 Methanol Steam Reformer High Temperature PEM Fuel Cell System Analysis Andrej LOTRIČ (Mebius d.o.o., Na jami 3, SI-1000 Ljubljana, Slovenia) and Stanko HOČEVAR (Mebius d.o.o.,
An Investigation into Proton Exchange Membrane Fuel Cell Performance. By John S. Rahman. B.S. Chemistry, Northeastern University
 An Investigation into Proton Exchange Membrane Fuel Cell Performance By John S. Rahman B.S. Chemistry, Northeastern University A thesis submitted to The Faculty of The College of Science of Northeastern
An Introduction to Fuel Cells and Related Transport Phenomena
 An Introduction to Fuel Cells and Related Transport Phenomena Matthew M. Mench, Chao-Yang Wang and Stefan T. Thynell Electrochemical Engine Center Department of Mechanical and Nuclear Engineering The Pennsylvania
Performance Optimization of Direct Methanol Fuel Cell
 Performance Optimization of Direct Methanol Fuel Cell Abstract Direct Methanol Fuel Cells (DMFCs) sustain an electrochemical reaction which converts the chemical energy stored in methanol directly into
CHEM 521 Analytical Electrochemistry TOPIC 4 Nov 28, Electrochemical energy storage and conversion
 CHEM 521 Analytical Electrochemistry TOPIC 4 Nov 28, 2016 Electrochemical energy storage and conversion Batteries and Electrochemical Capacitors Daniel A. Scherson and Attila Palencsár The Electrochemical
Progress in the Understanding of PEFC Degradation related to Liquid Water interactions
 Progress in the Understanding of PEFC Degradation related to Liquid Water interactions K. Andreas Friedrich, German Aerospace Center (DLR), Institute of Technical Thermodynamics Outline Introduction to
STAYERS FCH-JU Stationary PEM fuel cells with lifetimes beyond five years. Jorg Coolegem Nedstack fuel cell technology
 STAYERS Stationary PEM fuel cells with lifetimes beyond five years FCH-JU 256721 Programme Review Day 2011 Brussels, 28 November Jorg Coolegem Nedstack fuel cell technology 0. Project description Stationary
Corrosion Rate Measurement on C-Steel
 Measurements of corrosion rate on Carbon-steel using Electrochemical (potentiodynamic Polarization, EIS etc.) technique. Corrosion Rate Measurement on C-Steel Abdullah Al Ashraf 1. Introduction: The degradation
New Energy Conservation Technologies
 Queensland University of Technology & University of Queensland Jan 2004 New Energy Conservation Technologies By Julian Dinsdale Executive Chairman, Ceramic Fuel Cells Limited ABSTRACT During the next one
Workshop on Fuel Cells for Automotive Applications
 Workshop on Fuel Cells for Automotive Applications A.M. Kannan (amk@asu.edu) Arizona State University Chulalongkorn University December 8, 2016 Thermal Electricity Electrocatalysis for Water Electrolyzer,
Neural network based control for PEM fuel cells
 IOSR Journal of Electronics & Communication Engineering (IOSR-JECE) ISSN(e) : 2278-1684 ISSN(p) : 2320-334X, PP 47-52 www.iosrjournals.org Neural network based control for PEM fuel cells Vinu.R 1, Dr.Varghese
Characteristic and efficiency of PEM fuel cell and PEM electrolyser
 Related topics Electrolysis, electrode polarisation, decomposition voltage, galvanic elements, Faraday s law. Principle and task In a PEM electrolyser, the electrolyte consists of a protonconducting membrane
Effect of Operating Parameter on H2/CO2 Gas Separation using Electrochemical Cell
 Effect of Operating Parameter on H2/CO2 Gas Separation using Electrochemical Cell Fung Yun Ru 1, Nurul Noramelya Zulkefli 2, Nur Yusra Mt Yusuf 3 and Mohd Shahbudin Masdar 4,* 1,2,3,4 Department of Chemical
A LIQUID WATER MANAGEMENT STRATEGY FOR PEM FUEL CELL STACKS
 A LIQUID WATER MANAGEMENT STRATEGY FOR PEM FUEL CELL STACKS By Trung Van Nguyen * Chemical & Petroleum Engineering Department The University of Kansas Lawrence, KS 66045 and Mack W. Knobbe TVN Systems,
A NOVEL REACTANT DELIVERY SYSTEM FOR PEM FUEL CELLS
 Proceedings of FuelCell2008 6th International Fuel Cell Science, Engineering & Technology Conference June 16 18, 2008, Denver, USA FuelCell2008-65142 A NOVEL REACTANT DELIVERY SYSTEM FOR PEM FUEL CELLS
SPIRAL-WOUND PEM FUEL CELLS FOR PORTABLE APPLICATIONS. T.J. Blakley, K.D. Jayne, and M.C. Kimble
 SPIRAL-WOUND PEM FUEL CELLS FOR PORTABLE APPLICATIONS T.J. Blakley, K.D. Jayne, and M.C. Kimble MicroCell Technologies, LLC, 410 Great Rd, C-2, Littleton, MA 01460 Lighter weight and compact fuel cells
Electricity. Characteristic and efficiency of PEM fuel cell and PEM electrolyser Stationary currents. What you need:
 Stationary currents Electricity Characteristic and efficiency of PEM fuel cell and PEM electrolyser What you can learn about Electrolysis Electrode polarisation Decomposition voltage Galvanic elements
Electrolysis, electrode polarisation, decomposition voltage, galvanic elements, Faraday s law.
 Characteristics and efficiency of PEM fuel cell TEP Related Topics Electrolysis, electrode polarisation, decomposition voltage, galvanic elements, Faraday s law. Principle In a PEM electrolyser, the electrolyte
Numerical Studies of PEM Fuel Cell with Serpentine Flow-Field for Sustainable Energy Use
 Numerical Studies of PEM Fuel Cell with Serpentine Flow-Field for Sustainable Energy Use Sang-Hoon Jang 1, GiSoo Shin 1, Hana Hwang 1, Kap-Seung Choi 1, Hyung-Man Kim 1,* 1 Department of Mechanical Engineering
PEMFC Lifetime and Durability an overview. Thessaloniki, September Frank de Bruijn
 PEMFC Lifetime and Durability an overview Thessaloniki, September 21 2011 Frank de Bruijn PEMFC in real life 2007 Passenger vehicle: 2,375 hrs operated on 1 stack Daimler in DoE programme 2011 City Bus
2 nd International Workshop on Degradation Issues of Fuel Cells Thessaloniki, Greece
 Overview of the FP7 Project Results and Recommendations K. Andreas Friedrich 2 nd International Workshop on Degradation Issues of Fuel Cells Thessaloniki, Greece Degradation Workshop, Thessaloniki, 21
Tutorial Corrosion II. Electrochemical characterization with EC-Lab techniques
 Tutorial Corrosion II Electrochemical characterization with EC-Lab techniques 1 OUTLINE 1. Introduction 2. Types of corrosion a) Uniform corrosion b) Localized corrosion 3. Corrosion experiment 4. EC-Lab
Safe, Inexpensive, Long Life, High Power and Efficiency Batteries For Grid Scale Energy Storage Applications
 Safe, Inexpensive, Long Life, High Power and Efficiency Batteries For Grid Scale Energy Storage Applications Investigators Yi Cui, Associate Professor; Robert Huggins, Professor; Mauro Pasta, Postdoctoral
A FEASIBILITY STUDY OF FUEL CELL COGENERATION IN INDUSTRY
 A FEASIBILITY STUDY OF FUEL CELL COGENERATION IN INDUSTRY Scott B. Phelps and J. Kelly Kissock Department of Mechanical Engineering University of Dayton Dayton, Ohio ABSTRACT Up until now, most of the
Récupération et Stockage d énergie Energétique 5A
 Récupération et Stockage d énergie Energétique 5A TP Evaluation théorique d un système pile à combustible Daniela CHRENKO 1. Introduction A fuel cell uses hydrogen and oxygen to create electricity by an
WATER AND HEAT MANAGEMENT FOR IMPROVED PERFORMANCE OF PROTON EXCHANGE MEMBRANE FUEL CELLS
 UNIVERSITY OF SPLIT FACULTY OF ELECTRICAL ENGINEERING, MECHANICAL ENGINEERING AND NAVAL ARCHITECTURE MECHANICAL ENGINEERING POSTGRADUATE STUDIES DOCTORAL QUALIFYING EXAM WATER AND HEAT MANAGEMENT FOR IMPROVED
An Investigation of GDL Porosity on PEM Fuel Cell Performance
 37 A publication of VOL. 42, 2014 CHEMICAL ENGINEERING TRANSACTIONS Guest Editors: Petar Sabev Varbanov, Neven Duić Copyright 2014, AIDIC Servizi S.r.l., ISBN 978-88-95608-33-4; ISSN 2283-9216 The Italian
Iron Cation Contamination Effect on the Performance and Lifetime of the MEA
 Iron Cation Contamination Effect on the Performance and Lifetime of the MEA Dr Ahmad El-kharouf Centre for Hydrogen and Fuel Cells Research www.fuelcells.bham.ac.uk Hydrogen Days 2016, Prague Content Motivation
Mass Transport Effects on Electroreduction of Carbon Dioxide
 Mass Transport Effects on Electroreduction of Carbon Dioxide Tiek Aun Tan 1, Sara Yasina binti Yusuf 1 and Umi Fazara Muhd Ali 1 1 Universiti Malaysia Perlis Abstract: The electrochemical reduction of
System Level Modeling of Thermal Transients in PEMFC Systems
 System Level Modeling of Thermal Transients in PEMFC Systems Bryan W. Shevock Thesis submitted to the faculty of the Virginia Polytechnic and State University in partial fulfillment of the requirements
Phosphoric Acid Distribution after Load Cycling at high Current Densities with Different Types of HT-PEM MEAs
 Phosphoric Acid Distribution after Load Cycling at high Current Densities with Different Types of HT-PEM MEAs Nadine Pilinski, Vietja Tullius, Dr. Wiebke Germer, Peter Wagner, Dr. Alexander Dyck 08.04.2016
Wet Cells, Dry Cells, Fuel Cells
 page 2 page 3 Teacher's Notes Wet Cells, Dry Cells, Fuel Cells How the various electrochemical cells work Grades: 7-12 Duration: 33 mins Program Summary This video is an introductory program outlining
Control of High Efficiency PEM Fuel Cells for Long Life, Low Power Applications Part 2
 Control of High Efficiency PEM Fuel Cells for Long Life, Low Power Applications Part 2 Jekanthan Thangavelautham Postdoctoral Associate Field and Space Robotics Laboratory Outline Review PEM Fuel Cell
Liquid Water Transport in the Reactant Channels of Proton Exchange Membrane Fuel Cells
 Rochester Institute of Technology RIT Scholar Works Theses Thesis/Dissertation Collections 9-2014 Liquid Water Transport in the Reactant Channels of Proton Exchange Membrane Fuel Cells Rupak Banerjee Follow
International Journal of Mechanical & Mechatronics Engineering IJMME-IJENS Vol:15 No:05 83
 International Journal of Mechanical & Mechatronics Engineering IJMME-IJENS Vol:15 No:05 83 The Model Development of Gas Diffusion Layer for PEM Fuel Cell Dahiyah Mohd Fadzillah, Chin Lee Nee & Masli Irwan
COMPUTATIONAL FLUID DYNAMICS MODEL OF HIGH PERFORMANCE PROTON EXCHANGE MEMBRANE FUEL CELL WITHOUT EXTERNAL HUMIDIFICATION
 COMPUTATIONAL FLUID DYNAMICS MODEL OF HIGH PERFORMANCE PROTON EXCHANGE MEMBRANE FUEL CELL WITHOUT EXTERNAL HUMIDIFICATION Željko Penga, Frano Barbir Faculty of electrical engineering, mechanical engineering
Programme Review Day Brussels, 28 & 29 November. Premium Act
 /1 PREdictive Modelling for Innovative Unit Management and ACcelerated Testing procedures of PEFC (256776) Sylvie Escribano CEA Duration: from 3/211 to 2/214 Total budget: 5 37 19 - FCH contribution: 2
CREATING TOMORROW S SOLUTIONS MOBILITY. e-novation FOR FUEL CELLS POWERED BY SILICONES
 CREATING TOMORROW S SOLUTIONS MOBILITY e-novation FOR FUEL CELLS POWERED BY SILICONES PUTTING FUEL CELLS IN THE FAST LANE A fuel-cell vehicle (FCV) or fuel-cell electric vehicle (FCEV) is an electric vehicle
Amherst. University of Massachusetts Amherst. Yash Sanghai University of Massachusetts Amherst. Masters Theses February 2014
 University of Massachusetts Amherst ScholarWorks@UMass Amherst Masters Theses 1911 - February 2014 2013 Techno-Economic Analysis of Hydrogen Fuel Cell Systems Used as an Electricity Storage Technology
Development of PEM Fuel Cell Stack Reference Test Procedures for Industry Stack-Test (FCH-JU GA: )
") Development of PEM Fuel Cell Stack Reference Test Procedures for Industry Stack-Test (FCH-JU GA: 303345) Ludwig Jörisssen Zentrum für Sonnenenergie- und Wasserstoff-Forschung Baden- Click to add title
Development of PEM Fuel Cell Stack Reference Test Procedures for Industry Stack-Test (FCH-JU GA: 303345) Ludwig Jörisssen Zentrum für Sonnenenergie- und Wasserstoff-Forschung Baden- Click to add title
Optimization of channel geometry in a proton exchange membrane (PEM) fuel cell
 fuel cell") UNLV Theses, Dissertations, Professional Papers, and Capstones 2009 Optimization of channel geometry in a proton exchange membrane (PEM) fuel cell Jephanya Kasukurthi University of Nevada Las Vegas Follow
UNLV Theses, Dissertations, Professional Papers, and Capstones 2009 Optimization of channel geometry in a proton exchange membrane (PEM) fuel cell Jephanya Kasukurthi University of Nevada Las Vegas Follow
Fuel cell: from principle to application to the electric vehicle. Yann BULTEL, GINP Marian Chatenet, GINP Laurent Antoni, CEA Jean-Paul Yonnet, CNRS
 Fuel cell: from principle to application to the electric vehicle Yann BULTEL, GINP Marian Chatenet, GINP Laurent Antoni, CEA Jean-Paul Yonnet, CNRS PLAN 1. Fuel Cell Introduction 2. Fuel Cell Principle
Heat Transfer Analysis of PEMFC System Using FEM
 POLITECNICO DI MILANO Polo Regionale di Lecco Faculty of Engineering Mechanical Engineering Department Heat Transfer Analysis of PEMFC System Using FEM A Thesis Submitted to the Mechanical Engineering
ESFUELCELL MAXIMIZING THE USE OF PLATINUM CATALYST BY ULTRASONIC SPRAY APPLICATION
 PROCEEDINGS OF ASME 2011 5TH INTERNATIONAL CONFERENCE ON ENERGY SUSTAINABILITY & 9TH FUEL CELL SCIENCE, ENGINEERING AND TECHNOLOGY CONFERENCE ESFUELCELL2011 AUGUST 7-10, 2011, WASHINGTON, DC, USA ESFUELCELL2011-54369
Thermoset Solutions for Fuel Cell Seals
 Thermoset Solutions for Fuel Cell Seals Daniel Ramrus, Sr. Research Scientist, PhD. Daniel.Ramrus@ballard.com* Paul Kozak, R&D Manager, P. Eng., MBA. Paul.Kozak@ballard.com* Date of presentation: September
Performance and Durability of PEM Fuel Cells: A Review
 Performance and Durability of PEM Fuel Cells: A Review G Hinds September 2004 Crown copyright 2004 Reproduced by permission of the Controller of HMSO ISSN 1744-0262 National Physical Laboratory Teddington,
FLUENT 6.3 Fuel Cell Modules Manual
 FLUENT 6.3 Fuel Cell Modules Manual September 2006 Copyright c 2006 by Fluent Inc. All rights reserved. No part of this document may be reproduced or otherwise used in any form without express written
IN SITU MONITORING OF REINFORCEMENT CORROSION BY MEANS OF ELECTROCHEMICAL METHODS
 ABSTRACT IN SITU MONITORING OF REINFORCEMENT CORROSION BY MEANS OF ELECTROCHEMICAL METHODS Oskar Klinghoffer, M.Sc. FORCE Institute, Park Allé 345, DK-2605 Brøndby, Denmark The well-known and usually adapted
Electronic Supplementary Material (ESI) for Chemical Communications This journal is The Royal Society of Chemistry 2013
 for Chemical Communications This journal is The Royal Society of Chemistry 2013") Sodium-ion battery based on ion exchange membranes as electrolyte and separator Chengying Cao, Weiwei Liu, Lei Tan, Xiaozhen Liao and Lei Li* School of Chemical and Chemistry Engineering, Shanghai Jiaotong
Sodium-ion battery based on ion exchange membranes as electrolyte and separator Chengying Cao, Weiwei Liu, Lei Tan, Xiaozhen Liao and Lei Li* School of Chemical and Chemistry Engineering, Shanghai Jiaotong
Programme Review Day 2012 Brussels, 28 & 29 November
 http://www.fch-ju.eu/ Programme Review Day 2012 Brussels, 28 & 29 November Fuel Cells and ydrogen Joint Undertaking DEMMEA (245156) Understanding the Degradation Mechanisms of Membrane Electrode Assembly
Multiphysics Modeling of Assembly Pressure Effects on Proton Exchange Membrane Fuel Cell Performance
 Y. Zhou G. Lin A. J. Shih S. J. Hu e-mail: jackhu@umich.edu Department of Mechanical Engineering, The University of Michigan, Ann Arbor, MI 4809-225 Multiphysics Modeling of Assembly Pressure Effects on
Hydrogen, Methanol and Ethanol PEM Fuel Cell Development at IRTT
 Hydrogen, Methanol and Ethanol PEM Fuel Cell Development at IRTT Hazem Tawfik, Ph.D., P.E., C.Mfg.E. SUNY Distinguished Service Professor Director of the Institute for Research and Technology Transfer
Ultralow Degradation Rates in HT-PEM Fuel Cells. Oldenburg, Carl-von-Ossietzky Str. 15, Oldenburg, Germany. Czech Republic
 Ultralow Degradation Rates in HT-PEM Fuel Cells M. Rastedt a, F.J. Pinar a, P. Wagner a, H.R. García b, T. Steenberg b, H.A. Hjuler b, M. Paidar c and K. Bouzek c a NEXT ENERGY EWE Research Centre for
Morphology controlled synthesis of monodispersed manganese. sulfide nanocrystals and their primary application for supercapacitor
 Electronic Supplementary Material (ESI) for Chemical Communications. This journal is The Royal Society of Chemistry 2015 Morphology controlled synthesis of monodispersed manganese sulfide nanocrystals
PEM Water Electrolysis - Present Status of Research and Development
 PEM Water Electrolysis - Present Status of Research and Development Review Lecture Session HP.3d Tom Smolinka Fraunhofer-Institut für Solare Energiesysteme ISE 18 th World Hydrogen Energy Conference 2010
System Level modelling of fuel cell driven electric vehicles. Master s thesis in Electric Engineering ALBERT CERDÁN CODINA
 System Level modelling of fuel cell driven electric vehicles Master s thesis in Electric Engineering ALBERT CERDÁN CODINA Elteknik Power Electronics Department CHALMERS UNIVERSITY OF TECHNOLOGY Gothenburg,
Chapter 2 Fuel Cells Operating and Structural Features of MCFCs and SOFCs
 Chapter 2 Fuel Cells Operating and Structural Features of MCFCs and SOFCs 2.1 Introduction The current movement toward environmentally friendlier and more efficient power production has caused an increased
Challenges in Material Development for PEMFC
 Challenges in Material Development for PEMFC N.Rajalakshmi Presented by K S Dhathathreyan Centre for Fuel cell Technology ARC-International (ARCI) 120, Mambakkam Main Road Medavakkam, Chennai at the National
Parameters Affecting the Thermodynamic Efficiency of PEM Single Cell and Stack of Cells (Two Cells)
") Iraqi Journal of Chemical and Petroleum Engineering Iraqi Journal of Chemical and Petroleum Engineering Vol.17 No.3 (September 2016) 91-100 ISSN: 1997-4884 University of Baghdad College of Engineering
Iraqi Journal of Chemical and Petroleum Engineering Iraqi Journal of Chemical and Petroleum Engineering Vol.17 No.3 (September 2016) 91-100 ISSN: 1997-4884 University of Baghdad College of Engineering
Electrochemical impedance study of initial lithium ion intercalation into graphite powders
 Electrochimica Acta 46 (2001) 1793 1813 www.elsevier.nl/locate/electacta Electrochemical impedance study of initial lithium ion intercalation into graphite powders Chunsheng Wang a, *, A. John Appleby
Thermal Analysis of Methanol Reforming Proton Exchange Membrane. Fuel Cell System. Zhang 1, Jingjing Xu 1
 5th International Conference on Advanced Design and Manufacturing Engineering (ICADME 2015) Thermal Analysis of Methanol Reforming Proton Exchange Membrane Fuel Cell System Jialin Zhao 1, Yongwen Yang
Supporting Information. Christina W. Li and Matthew W. Kanan* *To whom correspondence should be addressed.
 Supporting Information CO 2 Reduction at Low Overpotential on Cu Electrodes Resulting from the Reduction of Thick Cu 2 O Films Christina W. Li and Matthew W. Kanan* *To whom correspondence should be addressed.
Second Act Simulation, statistics and Experiments Coupled to develop Optimized and Durable µchp systems using ACcelerated Tests (GA )
") Second Act Simulation, statistics and Experiments Coupled to develop Optimized and Durable µchp systems using ACcelerated Tests (GA 621216) Sylvie Escribano CEA Liten, Grenoble, France www.second-act.eu
Second Act Simulation, statistics and Experiments Coupled to develop Optimized and Durable µchp systems using ACcelerated Tests (GA 621216) Sylvie Escribano CEA Liten, Grenoble, France www.second-act.eu
a) The self-diffusion coefficient of a metal with cubic structure can be expressed as
 The self-diffusion coefficient of a metal with cubic structure can be expressed as") EXERCISES KJM5120 Chapter 5; Diffusion 1. Random (self) diffusion a) The self-diffusion coefficient of a metal with cubic structure can be expressed as 1 n D = s 6 t 2 where n/t represents the jump frequency
EXERCISES KJM5120 Chapter 5; Diffusion 1. Random (self) diffusion a) The self-diffusion coefficient of a metal with cubic structure can be expressed as 1 n D = s 6 t 2 where n/t represents the jump frequency
A Comparison of Two Engines. Benefits of an Electric Motor
 Fuel Cells (http://www.stanford.edu/group/fuelcell/images/fuel%0cell%0components.jpg) Lecture prepared with the able assistance of Ritchie King, TA 1 A Comparison of Two Engines Internal-combustion engine
Experimental study assessment of mitigation of carbon formation on Ni/YSZ and Ni/CGO SOFC anodes operating on gasification syngas and tars
 Experimental study assessment of mitigation of carbon formation on Ni/YSZ and Ni/CGO SOFC anodes operating on gasification syngas and tars Clean Coal Technologies Conference 2009 19 May 2009 Joshua Mermelstein
Synthesis and Evaluation of Electrocatalysts for Fuel Cells
 Synthesis and Evaluation of Electrocatalysts for Fuel Cells Jingguang Chen Center for Catalytic Science and Technology (CCST) Department of Chemical Engineering University of Delaware Newark, DE 19711
Teaching Chemistry with Hydrogen and Fuel Cells. Maia Willcox. SEPUP Lawrence Hall of Science UC Berkeley. WSST Madison Friday, March 9, 2012
 Teaching Chemistry with Hydrogen and Fuel Cells Maia Willcox SEPUP Lawrence Hall of Science UC Berkeley WSST Madison Friday, March 9, 2012 SCHATZ ENERGY RESEARCH CENTER Please fill out the blue contact
Impact of Air Contaminants on Subscale Single Fuel Cells and an Automotive Short Stack
 Journal of Electrical Engineering 3 (2015) 70-79 doi: 10.17265/2328-2223/2015.02.003 D DAVID PUBLISHING Impact of Air Contaminants on Subscale Single Fuel Cells and an Automotive Short Stack Anja Talke
HEAT AND WATER MANAGEMENT IN AN ALKALINE FUEL CELL
 8th International Conference on Heat Transfer, Fluid Mechanics and Thermodynamics HEFAT2011 8 th International Conference on Heat Transfer, Fluid Mechanics and Thermodynamics 11 13 July 2011 Pointe Aux
Electroactive Polymer for Controlling Overcharge in Lithium-Ion Batteries
 PSI-SR-1261 Electroactive Polymer for Controlling Overcharge in Lithium-Ion Batteries A. Newman R. Pawle K. White J. Lennhoff A. Newman, R. Pawle, K. White, J. Lennhoff, "Electroactive Polymer for Controlling
APPLICATIONS OF ELECTROCHEMISTRY
 APPLICATIONS OF ELECTROCHEMISTRY SPONTANEOUS REDOX REACTIONS APPLICATIONS OF ELECTROCHEMICAL CELLS BATTERIES A galvanic cell, or series of combined galvanic cells, that can be used as a source of direct
ELECTROCHEMICAL SYNTHESIS OF POLYPYRROLE (PPy) and PPy METAL COMPOSITES ON COPPER and INVESTIGATION OF THEIR ANTICORROSIVE PROPERTIES
 and PPy METAL COMPOSITES ON COPPER and INVESTIGATION OF THEIR ANTICORROSIVE PROPERTIES") ELECTROCHEMICAL SYNTHESIS OF POLYPYRROLE (PPy) and PPy METAL COMPOSITES ON COPPER and INVESTIGATION OF THEIR ANTICORROSIVE PROPERTIES Sibel Zor, Hatice Özkazanç Kocaeli University, Department of Chemistry,
ELECTROCHEMICAL SYNTHESIS OF POLYPYRROLE (PPy) and PPy METAL COMPOSITES ON COPPER and INVESTIGATION OF THEIR ANTICORROSIVE PROPERTIES Sibel Zor, Hatice Özkazanç Kocaeli University, Department of Chemistry,
Green usage of fossil fuels with solid oxide fuel cell
 211 2nd International Conference on Environmental Science and Development IPCBEE vol.4 (211) (211) IACSIT Press, Singapore Green usage of fossil fuels with solid oxide fuel cell H.Kazemi Esfeh Faculty
2. Wet Corrosion: Characteristics, Prevention and Corrosion Rate
 2. Wet Corrosion: Characteristics, Prevention and Corrosion Rate Mighty ships upon the ocean suffer from severe corrosion. Even those that stay at dockside are rapidly becoming oxide Alas, that piling
Corrosion Control and Cathodic Protection Data Sheet
 Data Sheet CORROSION CONTROL Corrosion control is the application of engineering principles and procedures to minimise corrosion to an acceptable level by the most economical method. It is rarely practical
Tantalum Wet Electrolytic Capacitor
 INTRODUCTION The structure of a Tantalum Wet Electrolytic Capacitor consists of four main elements: a primary electrode (anode), dielectric, a secondary electrode system (cathode) and a wet (liquid) electrolyte.
IV.H Electrolysis. DOE Technology Development Manager: Matt Kauffman Phone: (202) ; Fax: (202) ;
 ; Fax: (202) ;") IV.H Electrolysis IV.H.1 Low-Cost, High-Pressure Hydrogen Generator Cecelia Cropley (Primary Contact), Tim Norman Giner Electrochemical Systems, LLC 89 Rumford Ave. Newton, MA 02466 Phone: (781) 529-0506;
IV.H Electrolysis IV.H.1 Low-Cost, High-Pressure Hydrogen Generator Cecelia Cropley (Primary Contact), Tim Norman Giner Electrochemical Systems, LLC 89 Rumford Ave. Newton, MA 02466 Phone: (781) 529-0506;
Electronic supplementary information. Efficient energy storage capabilities promoted by hierarchically MnCo 2 O 4
 Electronic Supplementary Material (ESI) for RSC Advances. This journal is The Royal Society of Chemistry 2014 Electronic supplementary information Efficient energy storage capabilities promoted by hierarchically
HYDROGEN FUEL CELL POWERTRAIN LEVELIZED COST OF ELECTRICITY
 HYDROGEN FUEL CELL POWERTRAIN LEVELIZED COST OF ELECTRICITY Mario Valentino Romeri Independent Consultant, Italy, Valentino.Romeri@Alice.it Overnight Costs and Levelized Costs of Generating Electricity
Redox Flow Batteries
 Redox Flow Batteries Dr. Nathaniel P. Dugos Ric Madison U. Cua Energy Storage Problem: Fossil Fuels depletes very fast and emits GHGs Solution: Solar Energy and Wind Energy Problem: Highly dependent on
Status and Trends for Stationary Fuel Cell Power Systems
 Status and Trends for Stationary Fuel Cell Power Systems Dan Rastler Technical Leader, Distributed Energy Resources Program drastler@epri.com 650-855-2521 Discussion Topics Review Technical and R&D Status
BIOGAS PURIFICATION AND UTILIZATION. ENVE 737 Anaerobic Biotechnology for Bio-energy Production
 BIOGAS PURIFICATION AND UTILIZATION ENVE 737 Anaerobic Biotechnology for Bio-energy Production 1 Biogas Utilization 2 Biogas Utilization Production of Heat & Steam Electricity Production o o o Internal