Long term sustainable management of living marine resources in the Northern Seas Bergen, March 2016
|
|
|
- Candace Gibson
- 6 years ago
- Views:
Transcription


1 T IE R E IN JO R S I M R / PI NRO S EP O R T Proceedings from the 17th Russian Norwegian Symposium Long term sustainable management of living marine resources in the Northern Seas Bergen, March 2016 Institute of Marine Research - IMR Polar Research Institute of Marine Fisheries and Oceanography - PINRO
2 Earlier Norwegian-Russian Symposia: 1. Reproduction and Recruitment of Arctic Cod Leningrad, September 1983 Proceedings edited by O.R. Godø and S. Tilseth (1984) 2. The Barents Sea Capelin Bergen, August 1984 Proceedings edited by H. Gjøsæter (1985) 3. The Effect of Oceanographic Conditions on Distribution and Population Dynamics of Commercial Fish Stocks in the Barents Sea Murmansk, May 1986 Proceedings edited by H. Loeng (1987) 4. Biology and Fisheries of the Norwegian Spring Spawning Herring and Blue Whiting in the Northeast Atlantic Bergen, June 1989 Proceedings edited by T. Monstad (1990) 5. Interrelations between Fish Populations in the Barents Sea, Murmansk August 1991 Proceedings edited by B. Bogstad and S. Tjelmeland (1992) 6. Precision and Relevance of Pre-Recruit Studies for Fishery Management Related to Fish Stocks in the Barents Sea and Adjacent Waters Bergen, June 1994 Proceedings edited by A.Hylen (1995) 7. Gear Selection and Sampling Gears Murmansk, June 1997 Proceedings edited by V. Shleinik and M Zaferman (1997) 8. Management Strategies for the Fish Stocks in the Barents Sea Bergen, June 1999 Proceedings edited by T. Jakobsen (2000) 9. Technical Regulations and By-catch Criteria in the Barents Sea Fisheries Murmansk, August 2001 Proceedings edited by M. Shlevelev and S. Lisovsky (2001) 10. Management Strategies for Commercial Marine Species in Northern Ecosystems Bergen, August 2003 Proceedings edited by Å. Bjordal, H. Gjøsæter and S. Mehl (2004) 11. Ecosystem Dynamics and Optimal Long-Term Harvest in the Barents Sea Fisheries Murmansk, August 2005 Proceedings edited by Vladimir Shibanov (2005) 12. Long term bilateral Russia-Norwegian scientific co-operation as a basis for sustainable management of living marine resources in the Barents Sea Tromsø, August 2007 Proceedings edited by Tore Haug, Ole Arve Misund, Harald Gjøsæter and Ingolf Røttingen 13. Prospects for future sealing in the North Atlantic Tromsø August 2008 Proceedings edited by Daniel Pike, Tom Hansen and Tore Haug 14. The Kamchatka (red king) crab in the Barents Sea and its effects on the Barents Sea ecosystem Moscow, August 2009 Abstract volume compiled by VNIRO, Moscow 15. Climate change and effects on the Barents Sea marine living resources Longyearbyen, 7-8 September 2011 Proceedings edited by Tore Haug, Andrey Dolgov, Konstantin Drevetnyak, Ingolf Røttingen, Knut Sunnanå and Oleg Titov 16. Assessment for management of living marine resources in the Barents Sea and adjacent waters a focus on methodology Sochi, Russia, September Proceedings edited by Knut Sunnanå, Yury Kovalev, Harald Gjøsæter, Espen Johnsen, and Evgeny Shamray


3 Proceedings from The 17 th Russian-Norwegian Symposium Long term sustainable management of living marine resources in the Northern Seas Bergen, March 2016 Organizers: The Institute of Marine Research (IMR), Bergen, Norway and The Polar Research Institute of Marine Fisheries and Oceanography (PINRO), Murmansk, Russia Editors: Gjøsæter, H., Bogstad, B., Enberg, K., Kovalev, Yu, Shamrai, E. 3
4 Preface The 17 th Norwegian Russian symposium titled Long term sustainable management of living marine resources in the Northern Seas, was organised in Bergen, Norway from 16 th to 17 th March contributions were presented, of which 5 were invited talks and the rest presentations of papers by registered participants. The theme of the symposium attracted people from science institutions, people dealing with fisheries management, as well as people from the fishing industry, and the program included invited talks from all these disciplines. A total of 45 persons attended the symposium. The timing for discussing these matters was perfect. In 2015, the Joint Norwegian Russian Fisheries Commission sent a request to ICES and asked for an evaluation of the harvest control rules for stocks that are managed by the commission; capelin, haddock and cod, which has been in force for some years. The evaluation process in ICES took place during autumn 2015 and spring 2016 and resulted in an advice that was made public four days ahead of the symposium. Several contributions naturally dealt with the outcome of these evaluations. Also more generic questions relating to the theme were taken up in some of the papers presented, and most of the invited talks had a more general scope. The presentations spawned several interesting discussions and a general feedback to the organizers from the participants were positive. Many of the participants emphasised that above all, the mixture of marine scientists, economists, managers, and fishers added great value to the symposium and made the event informative for all the participants. The Proceedings contain contributions in a mixture of formats, chosen by the contributors. Some opted for an abstract or an extended abstract to be presented, others wrote a full paper to be included, and all presenters agreed to make their presentations available to the public, either as presented during the symposium, or slightly edited by the authors after the symposium. If a full paper or an extended abstract was submitted, that paper is included here. There has been no peer review process, the submitted manuscripts are included without any changes, apart from some modest language editing. If no manuscript was submitted, the presentation is included, as printouts with six slides per page. Two registered participants could not come to the symposium, but submitted their manuscripts, which were read by title during the symposium. They are both included in the Proceedings. The presentations are also available as pdf files under the symposium webpage, here: no Bergen/Murmansk 12 April 2016 The editors Individual papers in the proceedings should be cited as: <Author(s)>2016. <Title of paper>. In: Gjøsæter, H. Bogstad, B., Enberg, K., Kovalev, Yu, Shamrai, E. (eds.) Long term sustainable management of living marine resources in the Northern Seas. The proceedings from the 17 Norwegian Russian symposium, Bergen, Norway, March IMR/PINRO Report series
5 Table of Contents Preface... 4 Opening and Introduction Opening speech... 6 Theme session I: Evaluating long term management plans... 7 Session 1 contribution 1: Management plans, fisheries management strategies and HCRs... 7 Session 1 contribution 2: HCRs in a multispecies world: the Barents Sea and beyond...10 Session 1 contribution 3: Estimates of mortality and reproduction, including uncertainty, for the Northeast Arctic cod stock a method to be used for long term prediction of stock status...14 Session 1 contribution 4: Overview of new management approach for crab fisheries in Russian waters. Far East and Barents Sea...16 Session 1 contribution 5: Twenty years with harvest control rules in ICES what now?...19 Session 1 contribution 6: Harvest control Rules in Modern Fisheries Management...26 Session 1 contribution 7: The practical experience of NEA cod implementation Pros and cons...28 Theme session II: Harvest control rules in theory and practice...43 Session 2 contribution 1: Harvest Control Rules a perspective from a scientist working in the provision of ICES advice...43 Session 2 contribution 2: Harvest Control Rule evaluation for Barents Sea Capelin...48 Session 2 contribution 3: Evaluation of Northeast Arctic haddock Harvest Control Rules...52 Session 2 contribution 4: A decade of experience with HCR for NEA cod...59 Session 2 contribution 5: Evaluation of NEA cod HCR challenges and reality check...76 Session 2 contribution 6: Evaluation of NEA cod harvest control rules...81 Session 2 contribution 7: Impact of limitation in interannual variations of cod yield...84 Session 2 contribution 8: Evaluating a harvest control rule of the NEA cod considering capelin...93 Session 2 contribution 9: The rise of the beaked redfish Theme session III: Sustainable and optimal management Session 3 contribution 1: HCRs Norwegian managers' perspective Session 3 contribution 2: HCRs Comments on the Harvest Control Rules in the Barents Sea Session 3 contribution 3: The usefulness of Stable quotas on the international market Session 3 contribution 4: About science and industry cooperation in evaluation of biological stocks, improvement of fishing control and management measures Session 3 contribution 5: Integrated ecosystem assessment of the Barents Sea: Recent findings and relevance to management Session 3 contribution 6: Krill, Climate, and Contrasting Future Scenarios for Arctic and Antarctic Fisheries Session 3 contribution 7: Trawling impact on megabenthos and sediment in the Barents Sea: use of satellite tracking and video
6 Opening and Introduction Opening speech By Harald Gjøsæter Welcome to the 17th Norwegian Russian symposium with title Long term sustainable management of living marine resources in the Northern Seas. When I look at the program, I must say that I am proud to be among the conveners of this symposium! Since our institute, the Institute of Marine Research here in Bergen, as well as our sister institute PINRO in Murmansk have a clear management focus, several symposia in this series, that started back in 1983, have also dealt with fisheries management issues. This time, such a theme is very relevant, because the Norwegian Russian fisheries commission last year asked ICES to evaluate the harvest control rules for cod, haddock and capelin in the Barents Sea, that has been in use for about ten years or so. It so happened, that this advisory process was finalised a couple of days ago, and several papers deals with various aspects of this North eastarctic management plan process. We are proud to welcome to this symposium not only scientists from PINRO and IMR, but also representatives from other research institutes, like for instance the Norwegian School of Economy, the University of Tromsø, the University of southern Denmark, and ICES, as well as representatives from the Norwegian Directorate of Fisheries, the Norwegian Department of Trade, Industry and Fisheries, the Norwegian Seafood Federation, the Norwegian Fishing Vessel Owners Association and the Norwegian Fishermen s Organisation. We had also invited a representative from a Russian Fisheries organisation but unfortunately this person informed us yesterday that he could not come. My co conveners are Bjarte Bogstad and Katja Enberg from IMR, and Evgeny Shamrai, and Yury Kovalev from PINRO.. Let this be enough as an introduction, I will now give the word to Yury Kovalev, who will be chairing this first session of the symposium. 6


7 Theme session I: Evaluating long term management plans Session 1 contribution 1: Management plans, fisheries management strategies and HCRs By Bjarte Bogstad and Harald Gjøsæter, Institute of Marine Research, Bergen, Norway Presentation 7


8 8


9 9
10 Session 1 contribution 2: HCRs in a multispecies world: the Barents Sea and beyond By Daniel Howell, Institute of Marine Research, Bergen, Norway Extended abstract Harvest Control Rules in a multispecies world: the Barents Sea and beyond Daniel Howell Institute of Marine Research (IMR), Postboks 1870 Nordnes, 5817 Bergen, Norway, daniel.howell@imr.no Abstract Harvest Control Rules (HCRs) represent the current gold standard in ICES fisheries management, combining an approximation to Maximum Sustainable Yield (MSY) with a degree of precaution against recruitment overfishing and stock collapse. However, most of the work designing, evaluating, and implementing existing HCRs has been carried out in a single species context. Within the actual ocean, harvest rates of different species interact with each other, and simply combining a number of single species HCRs within an ecosystem may have unforeseen consequences. Furthermore, the current policy in many countries and within ICES is to move towards a more ecosystem based approach to fisheries management. Both of these require HCRs to be evaluated in a multispecies context as a basis for sound management. This presentation outlined some of the issues, challenges, and opportunities associated with HCRs in a multispecies context. Changing the biomass of key species in an ecosystem can be expected to impact on the natural mortality and productivity (and hence the outcomes of HCRs) of the direct predators and preys, as well as on competing species. Factors such as size selectivity or inter annual variation on catches may perform differently in a single species and multispecies analysis. A distinction is drawn between using multispecies models to assess single species HCRs, and HCRs designed explicitly to account for multispecies interactions. The Barents Sea is at the forefront of multispecies fisheries management, with multispecies HCRs for several species being either in place (capelin) or under consideration (cod), as well as several instances where multispecies interactions are accounted for in the single species assessment model (cod, haddock). This presentation covered examples from the Barents Sea and other ecosystems around the world to highlight some of the multispecies and ecosystem implications of HCRs. 10
11 Introduction Single species HCRs have proven highly successful in providing high yield with low probability of stock collapse. They provide a formal setting for evaluating the outcomes of different fishing strategies while also providing a degree of predictability to fishers and managers. They act to some extent to remove the political negotiation considerations of fisheries management away from the actual quota setting and rather to setting the principles on which the fishery will be based. However, it is obvious to all concerned that fish stocks do not exist in isolation. The stocks interact with each other, as prey, predators and competitors. They are influenced by environmental variations, in different ways at different stages of their lives. And they are impacted by other human influences beyond simply fishing induced mortality, either indirect fishing effects (e.g. trawl disturbance of the sea bed) or non fishing activities. It is now generally recognized that the goal of fisheries management should be to account for these holistic ecosystem interactions. Multispecies management is often seen as the first step down this route, being of high importance, relatively constrained problem, and not least something we have already been doing for some species. Existing Multispecies management Explicit multispecies management in the Barents Sea has now been going on for 25 years. The current management for capelin uses the survey results on the feeding grounds in the autumn together with estimated cod predation to assess the stock arriving at the spawning grounds the following year. The HCR then specifies that an escapement rule fishery, 95% certain to have escapement above Blim. In other words, the cod will eat whatever they eat, and we will harvest a safe fraction of the remaining stock. The key factors here are that following the first capelin collapse it was recognized that cod predation is an important and variable source of mortality that needs to be accounted for in managing the stock. A non important source of mortality need not be considered, while a non variable source can be incorporated as part of the fixed mortality M. To some extent the current cod HCR accounts for such a variable and important mortality. Although the HCR is couched in single species terms, it requires a three year projection of stock in order to translate F into quota. This in turn requires cod cannibalism to be included in the model. Hence the final quota is influenced by predation mortalities. This is an important point to make, HCRS need not be explicitly multispecies in order to account for multispecies interactions. Forthcoming multispecies HCRs A number of explicitly multispecies HCRs are under development or have been reviewed around the world. In the Barents Sea one of the proposed new cod HCRs requires setting the cod F (and quota) higher if there is a high biomass of cod and a low biomass of capelin. This is justified as fishing down a stock during period when it could be expected to experience food limited reductions in productivity. The converse is under consideration on the east coast of the US, where a HCR for herring is under development which should consider its role in the ecosystem. This is similar to idea behind the Barents Sea capelin HCR, but the herring provide food for a wide range of predators and escapement fishing is likely to be poorly suited to a longer lived species such as herring. 11
12 Ecosystem affecting single species HCRs The section above presented examples of cases where the ecosystem (specifically multispecies) effects are believed to be important enough require the HCRs to be designed explicitly to account for them. However, even where the HCR is written in a single species context, the ecosystem may impact on the performance of that HCR. One example is presented elsewhere in this volume (Filin and Howell: Impact of limitation in interannual variations of cod yield on its stock dynamics) detailing how the effects of the interannual stability constraint on change in quotas in the Barents Sea cod HCR gives different results if modeled in single or multispecies contexts. In particular, the multispecies model suggests that the stability constraint may actually lead to increased yields but reduced stability, due to interactions with the ecosystem. Single species HCRs affecting the ecosystem All fisheries impact on the ecosystem in which that fishery occurs. All fishery management is therefore ecosystem management. Considered in this light it is clearly important to develop methods to investigate and visualize the impact of different management options on a range of ecosystem components. One method being developed is the radar plot (figure 1), which shows the impact of different management options on a range of different axes. These plots do not identify the best option, they serve to make the trade offs clear to managers and stakeholders. Figure 1. Example of a radar plot, showing the impact of different management options on several different outcomes. Kaplan and Leonard, 2012 Discussion It is important to distinguish between stock assessments (which try to identify the current stock size) and HCRs (which specify what catch should be taken given the stock assessment). In general stock assessments would only need multispecies considerations if the absence of these was producing 12
13 strong retrospective patterns in the assessment. For example, a strong and variable predation mortality, or periodic starvation events, would probably need to be in a stock assessment model in order to give an accurate picture of stock development. The is a much greater need for multispecies considerations in HCRs. However, one principle unites stock assessments and HCRs keep things as simple as possible. Thus multispecies considerations does not imply that all HCRs should be written to be multispecies. Rather it implies that all HCRs should be evaluated in a multispecies context. In some cases (such as Barents Sea capelin) it is clear that the HCR needs to contain multispecies elements. In others it may well be that single species HCRs perform well provided they have been evaluated considering a wider context. It is obviously not possible for modelers to include all possible ecosystem effects into the Management Strategy Evaluations (MSE). The simulations should therefore work in conjunction with Integrated Ecosystem Assessments (IEAs), and use the IEA to identify the key drivers that should be included in the detailed modeling. The Barents Sea capelin HCR illustrates another key factor in considering HCRs in a multispecies context: the trade off between fisheries on different species. Fishing on a prey cannot be separated from fishing on the corresponding predator. In the capelin case a decision has been made to prioritize the importance of capelin as a food for cod, and only harvest the surplus. An alternate choice to fish the capelin harder (or earlier in their life cycle) could be valid and give higher capelin yields, but would likely result in lower cod biomasses and catches. These trade offs need to be considered, not everything in an ecosystem can be fished at its (single species) maximum. One of the tasks for fisheries scientists in the new ecosystem management world is to analyse these trade offs and present them to managers. Although IMR and PINRO have a long history of performing single species MSEs to analyse HCRs, IMR has not had the capacity to easily perform detailed multispecies evaluations of HCRs. A newly started project ( REDUS, REDucing Uncertainty in Stock assessment) includes a WP to develop MSE tool that can incorporated multispecies assessment models, and thus provide this capability. References Kaplan, I. C., J. Leonard From Krill to Convenience Stores: Forecasting the Economic and Ecological Effects of Fisheries Management on the US West Coast. Marine Policy, 36:


14 Session 1 contribution 3: Estimates of mortality and reproduction, including uncertainty, for the Northeast Arctic cod stock - a method to be used for long term prediction of stock status By Knut Sunnanå, Institute of Marine Research, Bergen, Norway Presentation 14

15 15


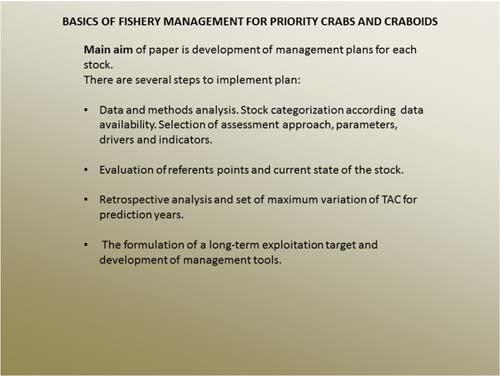
16 Session 1 contribution 4: Overview of new management approach for crab fisheries in Russian waters. Far East and Barents Sea By Sergey Bakanev, Polar Institute for Fisheries and Oceanography Presentation 16


17 17


18 18
19 Session 1 contribution 5: Twenty years with harvest control rules in ICES what now? By Dankert Skagen, Independent consultant in fishery Science Paper Twenty years with harvest control rules in ICES - what now? Presented at The 17 th Russian-Norwegian Symposium, Bergen, March 2016 by Dankert W. Skagen Independent consultant in Fishery Science dankert@dwsk.net; www. dwsk.net In the ICES area, the first harvest control rules were introduced in the mid 1990ies. The very first rule that was agreed by managers was probably that for North Sea Herring in Thus, almost 20 years have passed,which may be a fair occasion to look at how this field has evolved and where it is heading. This presentation is not intended as a comprehensive review of the development of harvest control rules. Rather it is some observations and some thoughts by a scientist who has been involved to a variable degree in most of the development of harvest control rules in ICES. A harvest control rule is a 'formula' for deciding on the exploitation of a stock for the coming year(s), using information from an assessment of the state of the stock. A harvest control rule is part of the broader concept of a management strategy, which covers all that is needed to manage a stock properly, including data collection, data analysis ('assessment'),decisions on exploitation, implementation of the decisions, control and legal framework. The rule typically leads to a total allowable catch (TAC), but may also specify for example some effort regulation. A management strategy, including a harvest control rule is decided by competent management bodies, and normally is regarded as binding to the decision makers. The North Sea herring rule which was agreed late 1997 and implemented in 1998 was an agreement to derive the TAC according to a fixed F-value. The important breakthrough was the international agreement on a low fishing mortality (and a separate F for young herring) and that the choice of F-level was based on an evaluation of the risk to the MBAL (ICES 1997), which at the time was regarded as a precautionary limit biomass. Present state of affairs. According to the ICES advice for 2016, out of the approximately 200 stocks for which ICES gave advice, the advice was according to an agreed and approved management plan in 21stocks. In addition, there were six stocks where plans were mentioned as under revision and seven with plans under development. Six plans might be regarded as failures according to the description in the advice for The failures were mostly poorly designed harvest control rules, that did not prevent fishing mortalities from remaining at very high levels. These rules were decided by managers without proper testing, and were not approved by ICES. The reasons for revisions in this material was mostly that stock dynamics had changed and was now 19
20 outside the range that was assumed when the plan was developed, or that the definition of stock units were altered. In addition, one should expect revisions simply because rules have a revision clause, and sometimes because stakeholders try to avoid unwanted effects or want to include new elements. A common example of unwanted effects is cases where a low TAC could only be increased very slowly when the stock improved because of a constraint on year to year change in TAC. There were no examples of failures caused by underestimation of uncertainty or biological variation. For some stocks, biological properties changed outside the range that had been assumed when the rule was tested. In such cases, the rule was amended accordingly and no disasters occurred. Except for escapement rules for very short lived species, the rules all prescribe a fixed fishing mortality F or harvest rate HR, with reduction if the spawning stock biomass (SSB) or total biomass for ages above A years (B A+) falls below a trigger level. Very often, there was also some kind of stabilizer for the TAC. One may speculate why just this kind of rule is so popular. It may simply be that a fixed F rule is a quite good one, in particular if it is supplemented with a stabilizer to dampen the effect of fluctuations due to assessment uncertainty and biological variation. Then, as strong incentives to look for alternatives are lacking, perhaps combined with some conservatism and institutional habits, application of almost standardized rules may be a natural response. General template for rule design. Despite the relatively uniform rules that are adopted at present, alternative rules are being discussed for several stocks for example Blue whiting recently (ICES advice 2013b). These may represent other ways to adapt to strong fluctuations in biological dynamics, rules that can handle data poor stocks or rules that take ecosystem considerations into account. Likewise, multi-stock, multi-fleet, multi-area rules are sometimes relevant A step in that direction is the TAC setting rule for herring in Division IIIa and Subarea IV (ICES 2015). For a more general discussion of how harvest control rules can be formulated, the following general four component template is suggested as a feasible framework: A decision basis which is some measure of the state of the stock, in one or multiple dimensions. Often it will be the SSB at some time, total biomass, a trend in biomass, but it could also be for example a combination of physical and biological factors that may influence stock productivity. A rule that defines some measure of exploitation as a function of the basis. This measure can be an F-value, a harvest rate, a TAC or some other measure. A mechanism that translates the exploitation measure into some operational measure, for example by deriving a TAC from the decided F. Additional elements to modify the TAC, most often a constraint on percentage change from last year. additionally a maximum and/or a minimum TAC It is fully possible to extend both the basis and the rule to multiple dimensions. The basis may include multiple factors that influence stock productivity and the exploitation measure may be a vector covering several stocks and/or areas. Simple process for simple rules The normal procedure when designing and evaluating a rule is to simulate its performance. This is discussed further below. However, if the ambition is just to find a feasible fishing mortality level and a reduction rule if the stock becomes low, one may perhaps do that with simple means. One key to this is the recognition that the production curve (Yield per recruit times recruitment as function of the fishing mortality) usually is quite flat topped. TheN, there is a broad range of F-values that lead to almost the same long term yield. That is also increasingly recognized by ICES and EU (ICES 2014). One may now apply a three step procedure: 1. Construct a deterministic production curve, i.e. a yield per recruit curve combined with a stock - recruit relation will normally be rather flat-topped. Typically, the plateau can be taken from about F0.1 until the SSB becomes low enough to lead to reduced recruitment according to the stockrecruit function. If the objective is to maximize long term yield, the F should correspond to the plateau. If also a low risk of recruitment failure is wanted, the F should be at the left hand side of 20
21 the plateau. 2. Yield and SSB will not be constant but vary according to variations in growth, maturity and in particular recruitment. If the distribution of these parameters under constant exploitation can be assumed, that translates into stationary distributions of SSB and yield. If there is a limit SSB that shall be avoided, that value should be at the low end of the distribution of SSB for the candidate F. 3. Finally, there will be assessment errors so the basis for decisions and the stock estimate that translates a decided F to catch will have errors with some distribution. If that distribution can be assumed or is estimated, the realized F when using a noisy assessment should be within the limit decided above. The distributions and probabilities may be found by simulations, but may also be derived directly, which should be sufficient to decide on a feasible fishing mortality. A further safety net may be provided by have in a rule to reduce the F if the estimated SSB is below some trigger, which may just be set at some relatively low percentile in the distribution of assessed SSB. Simulations and simulation tools. Simulations is the normal procedure when evaluating a harvest control rule. In the twenty years since harvest control rules were introduced in the ICES community, simulations have been refined both conceptually and with regard to computer software and ICES has developed standards for evaluations of management plans (ICES 2005, 2006, 2007, 2008, 2013). Conceptually, we have come to recognize a simulation setup as a test-bench. In that, we create a collection of realities in terms of stock histories, and we apply the candidate rules to them. Hence, the key principle for constructing the population model is that it shall provide a plausible range of realities. The acceptance criterion for a rule is that within that range, it shall perform satisfactorily. The simulation is done in an annual loop. Figure 1 shows one way of illustrating the loop. It has a real world consisting of an population model, and a managers world where decisions are made. In the population model, the stock is a collection of year classes. Each is started by a recruitment and reduced in numbers by natural mortality and implemented removals. The 'true' stock is converted by an observation model to a perceived stock as seen by managers. Decisions are made by applying the harvest control rule to the perceived stock in a decision model. The decided removals are converted to real removals by an implementation model. The population model reduces the stock according to the real removals. Real world External factors Population model True stock Real removals Observation model Implementation model Perceived stock Decided removals Decision model Managers world Figure 1. Outline of the components in a harvest control rule simulation framework. Blocks in italics is information flow, blocks in standard font is model components. The loop is run for a number of years, typically 20-30, sometimes longer, as a bootstrap with randomly drawn elements as specified, to cover a range of uncertainties. The uncertainties can be grouped in two: Uncertain biology, which is initial numbers recruitment, weight and maturity at age and natural mortality. This is the plausible range of realities. 21
22 Observation and implementation error, which is the discrepancy between true and perceived stock, as well as the deviation of what is removed from intended removals. This deviation can include uncertain selection at age as well as actual catches deviating from the TAC, and represents how well one can expect the rule to be followed. There is a clear analogy to the uncertainties in modern state-space type of assessment models, where there is a stochastic process with error terms and noisy observations of the process. There has been some dispute as to how to generate the observation error. Some prefer to generate noisy catch and survey 'observations' and apply an assessment procedure to get perceived stock numbers. A simpler approach is to add random error to the true stock numbers. The latter approach can be refined by including auto-correlations and models to imitate the structure in assessment errors that has been observed for the stock. This approach seems to become more common, for two reasons. One is that modern assessment methods get too time consuming to include them in a bootstrap loop, where typically thousands of assessments are required. The other is that generating noisy observations in a way that will lead to the kind of errors that have been experienced for the stock is not straight forward. In ICES, there has been examples where survey or catch at age data were derived from the true stock, iid (independent, identically distributed) random noise was added to that and assessments were made with a simpler and faster method than used normally. Such practices have now largely been abandoned. On the other hand, how to model observation error should depend on the purpose of the study. In some cases, the purpose will be to evaluate a full management plan, including which surveys to include, sampling regimes etc, and part of the investigation is to ensure that the management infrastructure supporting the harvest control rule is satisfactory. If so, all these components may have to be included, (see e.g. Punt & al, 2015). But then these components have to be properly represented. When the infrastructure is quite standardized, as is the case with most data-rich ICES stocks, and the performance of the assessment is fairly well known, a full examination of the assessment performance may be outside the purpose of the study, also because it should be possible to revise the rule if the uncertainty turns out to be under-rated or exaggerated. In the population model, the initial numbers matter most for the early part of the simulation period, and the recruitment for the later part. Growth and maturity may matter a good deal if they are variable, or if there is marked density dependence. The initial numbers are usually taken from an assessment, by either applying the distribution of the assessment numbers as estimated, using the outcome of a bootstrapped assessment or by applying the observation model to the assessed stock numbers. Recruitment will normally be according to a fitted stock-recruit (SR) function, of a combination of several SR functions. Noise is added according to the distribution of historical residuals around the SR-function. A further development is to use the assessment bootstrap replicas as the collection of plausible realities discussed above. One will then also derive individual stock-recruitment relations for each member of the collection. This introduces a conceptually new practice, that has not been extensively discussed so far. Previously, one considered one stock, with some uncertainty about the current state and some on future recruitment, but with given dynamical properties, in particular the SR function. It is then required that the harvest control rule shall work for that stock with high probability. The development now is in the direction of having a large collection of stocks each with its own dynamics, and require that the rule shall work for most of them most of the time. This may be a logical approach, but it has some stumble blocks. First, in the collection of bootstrapped assessments there may be some that immediately would have been rejected or triggered some methodological action. Likewise, some stock-recruit data may lead to estimates of SR functions that are hardly viable, for example an almost straight line through the origin. More generally, the quality control of the individual assessments is missing in a bootstrap run, and that quality control may be well justified. Furthermore, the contents of such a collection will of course depend on how the bootstrap is made. For example, producing new assessment data by drawing random residuals from the primary run will violate possible structures in the errors, and lead to a collection that may not be representative for the stock. The ultimate problem is whether the bootstrap provides the plausible range of realities, or a range that is too wide, too narrow and/or skewed. The experience so far is that underestimating the uncertainty when simulating the effect of a harvest control rule on a stock is not a major problem. If it turns out that the stock moves out of the assumed range, the rule may have to be revised, and with a proper revision clause and well prepared decision processes, the management and stakeholders seem to be ready for that. It should also be borne in mind that nature is not 22
23 stable. Changes in productivity beyond what could be expected from the history of the stock is quite common, and would also require revisions of the rule. SR-functions Probably the least predictable factor in a simulation is the recruitment. Most simulation tools assume that the recruitment depends on the spawning stock biomass in some way, with stochastic deviations around that function. This is problematic, because it is quite clear that the spawning stock biomass is a poor predictor for recruitment in most stocks. On the other hand, the whole concept of precautionary approach and maximum sustainable yield relies on the hypothesis that if the SSB is reduced, the recruitment will be impaired. The formal definition of the precautionary limit biomass is just the level of SSB below which the recruitment is impaired. Clearly, if there are no parents, there will be no offspring. On the other hand, it is elementary that the recruitment cannot be linearly dependent on the SSB, if it were the stock would either disappear or grow into infinity. So, there has to be some dependence. However, assuming that a certain SSB will be optimal for recruitment is not necessarily wrong but it may be a quite brave assumption. One pragmatic approach is to assume that above some break point, the SSB does not matter. Below the break point, a linear decline towards the origin is often assumed, which is a quite conservative assumption that also implies that the stock will collapse if the fishing mortality exceeds that corresponding to the break point. A stock-recruit function is obtained by fitting a function to a set of SR points. There may be some discussions which pairs to use. It is still common practice to use all pairs that are available. However, as the time span covered by an assessment has increased, it has become more clear that the SR relation may not be stable. There may be regime shifts or cyclic variations, and occasional very large year classes may appear that will dominate the stock perhaps for decades. Figure 2 provides one example of multiple regimes, where the fitted SR function does not appear to be a good predictor of recruitment Recruit B-H Figure 2. An example of a set of stock-recruit pairs where a Beverton-Holt function has been fitted that explains the recruitment variation poorly. In such cases, just assuming a stock - recruit relationship may be too naive.,first, one should ensure that the distribution of the residuals is what has been assumed (log-normal in most cases). Then one should examine if the residuals really are entirely independent, or if there are some autocorrelations in them. Going even further, one may think of some stochastic model (like an ARMA model) for the residuals The constant term in such a model will then substitute the SR function.. Uncertainties and risks As this field has evolved, some paradoxes have appeared that are briefly discussed below. A key performance criterium is the risk to the limit biomass, which is the key requirement according to the precautionary approach. In the first place it may be noted that this is not risk in the conventional sense, where risk is the product of probability and cost. Rather, the term is used for the probability of passing below the limit biomass. It took a long time to clarify this concept precisely, since everybody seemed to make their own definitions. Now it is agreed to consider the highest annual probability (i.e. fraction of bootstrap replicas) below the limit in a specified period. 23
24 Following this argument, one might include the cost of passing Blim. A measure of the cost might be the actions needed to rebuild the stock to above Blim. To evaluate that, one would need some assumption on how recruitment will behave below Blim. Lacking evidence for that, then as discussed above, the 'hockey stick' assumption would be a rather conservative one, at least compared to standard SR functions which are all convex. A performance criterium could then be the distribution of the time it would take to recover the stock. There are a few examples where this has been considered, for example for Sardine (ICES advice 2013a). As noted elsewhere, the uncertainty can be split in process uncertainty and observation uncertainty. The concept of risk comes in a new perspective with some of the developments in simulation frameworks, where process uncertainty is represented as a collection of realities, with individual dynamics. We only 'know' that the real stock is somewhere in that set. However, the limit biomass (Blim) is defined as an absolute number, derived from some assessment in the past. Hence, Blim is defined according to one member in a broader collection of 'stocks'. When modeling the uncertainty in stock dynamics as a collection of realities, each member of the collection should probably have its own Blim, which might be for example the SSB in a certain year, or the smallest observed. It is customary to relate the risk to the 'true' stock, i.e. the stock in the population model. This is the measure that is relevant for future stock dynamics. However, management action is determined by the observed SSB from some assessment, which may be quite different. There may be situations where action has to be taken very often even though the stock is in a good shape. One may perhaps consider a harvest control rule that responds less to the observation error. This is one purpose of the stabilizers that are a common element in harvest control rules. To facilitate the understanding of the two types of error, one suggestion would be to separate more clearly the process error and observation error when presenting results of simulations. Very often, the Blim is set at the lowest observed SSB. The argument is that below that level, stock dynamics are unknown. However, this may become unduly restrictive if the value represents the range of natural fluctuations in a stock that is quite gently exploited. To avoid that value with high probability might preclude a rational utilization of the resource. In the broader perspective, the purpose with a biomass limit is to avoid a situation where the productivity of the stock is reduced by the fishery. So far, international agreements have put a strong emphasis on keeping the spawning biomass high. However, the link between spawning biomass level and stock productivity is not very strong, as illustrated by the poor relation between SSB and recruitment. It is suggested that future criteria for sustainable fisheries should be more directed towards such fishery related factors that actually influence stock productivity. This may include age and size composition, interactions in the ecosystem, response to environmental changes, population structure in terms of stock components and probably many others. Considering some such factors have been suggested, sometimes strongly. There is probably a long way to go before the understanding is good enough for such measures to take over, but that should not preclude such considerations where that may be clearly relevant. The strong position of the biomass limit in peoples mind and in legislation may appear as an obstacle to such new thinking.. Summary Some experience with harvest control rules in ICES over the last 20 years has been presented. In general, these rules perform well in keeping the stocks in a good shape. Clearly, harvest control rules have come to stay, but they can still be improved and developed further. Some directions for future development are suggested. There are many other aspects that also deserve attention, for example ecosystem management and bio-economic aspects, this presentation just covers points that were presented at the symposium. References ICES 1997: Report of the Herring Assessment Working Group for the Area South of 62 o N ICES CM 1997/ASSESS:8 24
25 ICES SGMAS Report 2005 Report of the Study Group on Management Strategies ICES CM 2005 /ACFM:09 ICES SGMAS Report 2006 Report of the Study Group on Management Strategies ICES CM 2006 /ACFM:15 ICES SGMAS Report 2007 Report of the Study Group on Management Strategies ICES CM 2007 /ACFM:04 ICES SGMAS Report 2008 Report of the Study Group on Management Strategies ICES CM 2008 /ACFM:24 ICES WKGMSE REPORT 2013 Report of the Workshop on Guidelines for Management Strategy Evaluations (WKGMSE) ICES CM 2013/ ACOM:39 ICES Report of the Joint ICES MYFISH Workshop to consider the basis for FMSY ranges for all stocks (WKMSYREF3) ICES CM 2014/ACOM:64 ICES Advice 2013a, Book Special request: Management plan evaluation for sardine in Divisions VIIIc and IXa ICES Advice 2013b, Book Special request: NEAFC request to ICES to evaluate the extra harvest control rule options for the long term management plan for blue whiting ICES Advice 2015, Book 9, EU and Norway request to evaluate the proposed Long Term Management Strategy for herring (Clupea harengus) in the North Sea and the Division IIIa herring TAC setting procedure Punt A.E., Butterworth, D.S., de Moor, C.L., De Oliveira, J.A.A., and Haddon, M Management Strategy Evaluation: Best Practices. Fish and Fisheries, DOI: /faf


26 Session 1 contribution 6: Harvest control Rules in Modern Fisheries Management By S. Kvamsdal, A. Eide, N. A. Ekerhovd, K. Enberg, A. Gudmundsdottir, A.H. Hoel, K.E. Mills, F. Mueter, L. RAvn Jonsen, L.K. Sandal, J.E. Stiansen, N. Vestergaard Presentation 26


27 27
28 Session 1 contribution 7: The practical experience of NEA cod implementation Pros and cons By: V.M. Borisov and V.N. Shibanov Paper The practical experience of NEA cod HCR implementation. Pros and cons. V.M. Borisov, V.N. Shibanov Russian Federal Research Institute of Fisheries and Oceanography (VNIRO), Moscow, Russian Federation In NEA cod commercial stock (CS) decreased from 2360,000 t to 1100,000 t and spawning stock (SSB) from 887,000 t to 240,000 t. JRNFC seen the IUU cod fishery as main reason of that negative process. During the the annual catches has grown from 212,000 t to 762,000 t, when F exceeded both F pa = 0.4, and F lim = There was a real need to limit the cod fishery for the stock recovery. Implementation of the NEA cod HCR made the positive effect on the stock status. In the middle of the first decade of 2000s CS stabilized at the level of 1500, , 000 t. In subsequent years, the indisputable advantages of the implementation of the new cod fishery legal regime became even more pronounced. In 2011 the CS exceeded the level of 3300,000 t and by 2013 became comparable to that of the post war period in At the same time F for cod decreased from 0.67 in 2005 to 0.27 in 2012 at the achievement to TAC relative stability (±10%), what made a positive effect on stock status undoubtedly. Unfortunately this strategy led to accumulation of large escaped trawl cod specimen in the population, to increment of its preying, to significant increase in cannibalism and, consequently, to reduction of recruitment level on the background of super rich spawning stock. Adequate growth of the TAC could prevent the development of such negative processes. However, existing HCR does not provide the possibility of increasing F at the multiple excess by SSB the level of B pa. The paper proposes the following improvement of the existing cod HCR: some elements of ecosystem approach focused on the maintenance of the ecosystem health to be included to the HCR strategy part; F=F pa=0.4 when SSB is between 1B pa to 2B pa; F=0.6 when SSB 5B pa; linear F increase from 0.4 to 0.6 when SSB between 2B pa to 5B pa; TAC change limitation (±10%) to be excluded. Key words: NEA cod, stock dynamics, HCR improvement, fishery mortality, spawning stock, recruitment, cannibalism, ecosystem approach 28
29 Introduction The analysis of North Eastern Arctic cod (NEA cod) stock size dynamics for the period of 70 years ( ) allows to study the influence of the cod annual catches, of cod spawner s biomass (SSB) and of some environmental factors on the cod commercial stock size and its reproduction rates. It is possible also to compare the current NEA cod population status to the historical dynamics of the stock, with it s well known ups and downs. There is a possibility also to study the reaction of the cod stock on the new fisheries management measures implementation and the efficiency of them. Such analysis may serve as a basis for the improvement of fisheries management measures implemented, when necessary. Harvest Control Rule (HCR) for cod introduced by the Joint Russian Norwegian Fisheries Commission (JRNFC) in 2003, initially was focused foremost to the recovery of depleted cod stock. The cod stock development, folded in the last decade ( ), just indicates that HCR indisputably played its positive role. However, the HCR was a serious obstacle to the adequate TAC increase after the year 2006, during the period of the rapid stock recovery and stock growth. The paper attempts to evaluate the current HCR biological validity and to suggest the ways of HCR improvement for the universal use both during the NEA cod stock decline and during the growth periods. Materials The databases of NEA cod international catch statistics, cod commercial stock and spawning stock estimations, the annual numbers of cod recruits (3+ year old specimen), and annual fishing mortality (F) calculations for the period , were extracted from the ICES AFWG annual reports (Report, ICES AFWG, 2015). The Barents Sea water temperature data set was used also (Stock status..., 2015). The annual NEA cod TACs and fishing regulatory and management measures adopted by the Joint Russian Norwegian Fisheries Commission were extracted from the respective Protocols of the Commission (JRNFC Protocols, ). The work is based on the traditional statistical comparison of the above mentioned data sets. In a sense, it can be considered an original approach to the selection of the optimal level of SSB, based on a commonly used correlation analysis of the link between the recruit s number and spawning stock biomass (SSB). The explanation for this approach is given in the appropriate part of the article. Authors regularly participated at the sessions of JRNFC and at the AFWG meetings as members of Russian delegations. Results The cod stock variability. The long term dynamics of NEA cod commercial stock and spawning stock biomass along with the total annual cod catch are presented on Figure 1. Four periods of relatively high cod stock level ( , , , ) and three periods of notable cod stock failures ( , and ) may be considered. 29
30 4500 max. = min. = thou.t thou.t SSB Fish. Stok Catch Figure 1. Barents Sea cod stocks and cod international catch dynamics The abundance of new cod generations entering into stock makes the most significant variable data input for the stock fluctuations marked above. The power of generations recruiting the cod commercial stock (the number of 3+ year old fish) are naturally related not only with the original amount of spawned eggs, but depends largely on the success of eggs incubation and subsequent larvae and juveniles survival also. The cod survival at the early stages of the life cycle, in turn, depends on environmental conditions prevailing in a particular year and on the abundance of necessary food resources (Orlova, Boitsov, Nesterova, 2010; Drinkwater et al., 2011). To the complex of these factors can be added the number of cod juveniles consumed both by predators and by adult cod (Dolgov et al., 2011). These causes, acting at the same time and often in different impact directions along with variability of the data specific weight of each of them, make it difficult to identify the specific quantitative parameters of cause and effect relationships. These issues are presented in detail in the monographs: "The Barents Sea Cod: Biology and fishing" (2003), The Barents Sea. Ecosystem, resources, management (2011). Our paper focuses on the fact of significant interannual fluctuations of the cod commercial stock in connection with the analysis of the current fishery management strategies (HCR) which is focused on the relative cod TAC stability (Protocol JRNFC, 2004). Judging by the long term dynamics of the cod stock (Figure 1), the maximum stock value in 1946 was 5.6 times greater than the minimum in The variation coefficient of the commercial stock biomass for the period is 44%. From the standpoint of variation statistics the data series with data variation of more than 33% are considered heterogeneous (Statistical..., 2015). This indicates that the NEA cod population should be attributed to the high fluctuating fish stocks, despite its long life cycle when the lifespan of individuals may reach 25 years and even more. As described above, these stock size fluctuations are mainly due to a high amplitude of interannual changeability of the commercial stock recruitment. The historical maximum abundance of the generation born in 1973 (1.849 billion. ind.) exceeds the poorest one in 1969 (116 mill. ind.) 16 times. The abundance variation coefficient of 68 cod generations observed at the recruitment age (3+) attains 59% (Figure 2). 30
31 mln.ind max min year Figure 2. Recruit abundance of NEA cod in The cod stock recruitment abundance often varies considerably even in neighbouring years. The relative abundance increase in some individual pairs of adjacent years reached %, and the relative reduction 57 87%. In 3 4 years after the three year olds becomes a main component of the commercial stock. A strong generation, respectively, will provide the appreciable growth of the commercial stock, a weak recruitment only faint one. Very substantial stock fluctuations were observed not only by the periods, but between adjacent years also (Figure 3). % 70 62% % 48% % -27% -29% -20% year Figure 3. Cod commercial stock biomass change in the current year regarding the previous year value (%) 31
32 Thus, the stock biomass in 1966 exceeded the previous year (in 1965) stock size by 52.6%, the difference between years 1973 and 1972 was 48.1%, and between 1991 and %. The relative drop in the stock biomass in adjacent years was very noticeable also and reached up to 22 29% at some years. During the period , only 28 observations (41%) of the stock interannual changes from the total of 65 were inside of ±10% "corridor" that required by HCR. These stock changes are induced by the oscillating survival of cod eggs, larvae and juveniles at annually unstable environmental conditions. They are common, inevitable and quite natural. These facts, well known to biologists, must be taken into account by fisheries managers too, who are interested in maintaining a TAC at the relatively stable level. Historically, the period between the second half of the 40's early 60 ies was distinguished by a very high level of cod commercial stock, assessed at million tons. The limited scope of the fishery during the World War 2 and during the postwar period promoted the cod stock increase. However, in the years fast growing international fishing fleet was able to take annually an average of 896 thousand. tonnes of Barents Sea cod. Fishing mortality (F) in some years reached 0,83 0,94, which made a significant adverse impact on the status of the stock. The cod commercial stock fell from 3.4 mln. t in 1968 to 740 thou. t in As a result, the total international Barents Sea cod catch in 1984 was reduced to 278 thou.t. from 1102 thou. t in Norway then caught only 230 thou. t, and Russia just 22.2 thou. t. Situation had improved at the beginning of 90 s only, being supported by a relatively reach cod year classes of , which began to recover the stock in (AFWG Report, 2015). In the mid 90s the cod stock was at the level of mill. t. The annual catch has increased, from thousand tons to thou. t. The fishing mortality zoomed to 0,7 0,99 (Figure 4). Such fishing level was too high, undoubtedly. As a result, in 2000 the commercial stock has dropped to 1 mill. t., and SSB to 240 thou. t. Being seriously concerned about the situation, Russian and Norwegian fishery managers in the framework of JRNFC jointly adopted a significant TAC reduction from 890 thou. t. to 430 thou. t. over the next three years. In the year 2001 the JRNFC adopted a decision to develop the new fisheries management strategy titled as "Regulations on the basic principles and criteria for the long term, the Barents and Norwegian Seas sustainable management of living resources" (JRNFC Protocol, 2001). Harvest Control Rule for NEA Cod. JRNFC adopted the fisheries management strategy on the basis of the principles developed previously. The strategy is aimed at creating supportive environment for the cod stock recovery and for the obtaining long term high yields and at achieving relative stability of TAC. Implementation of the strategy should be based on all available scientific information about the current and projected state of the stock. Following this strategy, in 2004 JRNFC adopted a special Harvest Control Rule for the fisheries management (HCR) (Protocol JRNFC, 2004). TAC for the next year is obtained by averaging the TACs calculated for the following three years at F pa = 0,4. In order to achieve a relative inter annual TAC stability, the HCR limits changing the TAC for each of the following year by ± 10 % of the current year TAC. If the spawning stock biomass (SSB) falls below the B pa=460 thou. t., the linear reduction of fishing 32
33 mortality should enter into force proportionally to the observed SSB reduction, from F pa = 0.4 to F = 0 when SSB = 0 (Figure 6a). Favourable environmental conditions (Barents Sea warming) and the TAC limitation influenced in same direction led quickly to a positive results. In 2007, for example, SSB has increased to a level of 1.5 times higher than B pa (Figure 1). Cod commercial stock from early 2000 s to 2007 increased by 1.8 times. At the same time, the total cod catch was restrained in accordance with the Rule, by the achievement to the interannual TAC stability. As a result, the catch increased from 426 thou. t in 2001 to 641 thou. t in 2005, and in 2008 dropped again to 464 thou. t, i.e. almost returned to its initial level. In subsequent years, the continuing stock growth in the conditions of TAC containment has resulted in that the actual fishing mortality, ranging between F = 0.3 in 2008 and F = 0.23 in 2012), was significantly lower that biologically justified reference point F pa = 0.4 (Figure 4). The current HCR framework does not provide the possibility of fishing mortality return of to a biologically safe F pa = 0.4 level at so large scale fishing and spawning stock growth up to 3.6 mln. t and 1.9 mln. t, in 2013, respectively. Therefore in 2009 JRNFC introduced a significant addition to HCR: «If the TAC, by following such a rule, corresponds to a fishing mortality (F) lower than 0.30 the TAC should be increased to a level corresponding to a fishing mortality of 0.30» (Protocol JRNFC, 2009). F F lim = F pa = 0.4 F new = year Figure 4. The cod fishing mortality dynamics in
34 Discussion and suggestions for the HCR improvement Comments to the TAC relative stability. The main objective of the fisheries management strategy, adopted by JRNFC, was to protect the cod population from overfishing. With this the Strategy provides also to achieve a high long term yield from the stock exploitation seeking to minimize the interannual TAC differences. During the first years after the HCR adoption, when the cod commercial stock has been relatively stable ( thou. t), the strategy has worked quite well. However, in some years after 2006, the commercial stock annual increments reached 300 thou. t, 500 thou. t, and even more than 600 thou. t, there was an increased need to adapt the HCR in the new environment. As shown above (Figure 3), the interannual stock changes are often significantly higher than limited by the HCR interannual differences for the TAC. On the other hand, the TAC change restrictions are in conflict with the need to follow the precautionary fishing mortality level (F pa=0.4). The simultaneous use of F pa and the TAC changes limitation adopted by the Commission, is absolutely unrealistic at present time because of unavoidable cod stock changes on natural reasons. In practice, what happens. The Commission may use one of two possible options only: either to ignore the ICES recommendations regarding F pa=0,4, or to change annual TAC to extent that it would correspond to F pa. The second option is more preferable it whereas meets the primary objective of the Strategy obtaining the high long term yield from the stocks. But the solution to this problem is possible only with the obtain of the biologically allowable catches maximums for every year. Conversely, when the stability of annual catches difficult to achieve a high long term yield due underfishing, when stocks are high whereas in cases when stock falls more than 10% the risk of overfishing will increase. Undoubtedly, the HCR part concerned to interannual TAC relative stability was included in the Strategy for the initiative of the economists and industry representatives who, due understandable reasons, are not interested in the essential distinctions TAC from year to year. This ignores the inevitability of the regular, natural and often significant commercial stock biomass fluctuations. The reason of the contradiction between achievement of stability in TAC and high long term yield from the stock is an unsuccessful attempt to "settle under one roof" objectively competing against each other the biological and the industrial requirements to TAC. In this connection there is the obvious need to introduce a two step procedure for setting the TAC by analogy with the US experience (Safina et al, 2005; Rosenberg, Swasey, Bowman, 2006; NOAA.., 2013). At the first stage the biological criteria "works" only. Fisheries biologists should assess the current and projected stock status and should estimate how many fish can be taken by the fishing fleet without prejudice to the population. This assessment should be taken as the maximum permissible value of the fishing exemption by biological positions. At the second stage the basic value of the potential catch may be adjusted (reduced only) in accordance with various factors such as market conditions, fishing fleet capabilities, storage and fish processing capacity, as well as other economic, social, political issues. 34
35 In the period after 2006, when the fishing stock has increased rapidly, the fishing mortality regularly fell not only below 0.4 but below 0.3 also (Figure 4). Therefore, JRNFC actually took the decision to reduce the biological reference point F pa = 0.4 to F = 0.3 for the deterring TAC growth despite the substantial increase of the fishing stock. Such situation, on the contrary, would be allowed to increase the fishing mortality. This management measure would serve as an example of the actual fishing stock management, which is usually declared only, but is not implemented in practice. In addition, the unreasonable and artificial reduction of the fishing mortality value from the level of reference point F pa=0.4 to F = 0.3 are not consistent with the HCR provided the mandatory use of new scientific data on stock dynamics. New scientific data indicated the substantial cod stock growth, which allowed to increase the annual catches, but instead the opposite decision was made in favour of the market. Adoption of TAC in two steps would ensure the necessary objectivity and transparency of the decision making process. On the need for integration of the ecosystem approach to HCR. The final part of the existing HCR for cod begins with the words: if the spawning stock falls below B pa. This statement was very important in the period of , when SSB remained at the level of thou. t, well below the B pa = 460 thou. t. However, in subsequent years, SSB grew consistently and reached the level of 1943 thou. t at 2013, and exceeded the B pa more than 4 times. The increase in fishing mortality with such a high SSB value could reduce the negative impact of cod stock on some components of the Barents Sea ecosystem. The reality of such negative impact is illustrated by the substantially increased amount of fishes consumed by cod, including valuable commercial species (Table 1). Table 1. NEA cod stock's consumption of main prey species (thou. t) based on ICES AFWG 2015 data by A.V. Dolgov, 2015 Prey species Period Capelin Polar cod Cod young Haddock Long rough dab Other Total SSB Average for Average for During the period of the average annual aquatic organisms consumption by the cod population (almost 7 mln. t) increased by 1.5 times compared to previous years (4.7 mln. t). The cod SSB increased by 2.4 times over the same period. The difference in the amount of forage fishes 35
36 consumed by adult cod during these periods could be even greater if the cod spawning stock, as a main fish predator, not minimized such stocks as, for example, capelin, polar cod, herring. The food deficit for cod adults is largely compensated by the mass cannibalism (Table 2). Table 2. Amount of young cod (mln.) consumed by adult cod and natural mortality of young cod (M2) due to cannibalism based on ICES AFWG 2015data Period Age of young cod Σ Natural mortality of young (M2) cod due to cannibalism During the same periods, the average annual cod consumption of their own juveniles aged 1 5 years increased by 3.5 times. The mortality of juvenile cod aged 3 5 years due to cannibalism, increased particularly noticeable. In this connection a natural question arises: is not the cannibalism the main reason that the rich cod generations of 2004 and of 2005 with the abundance at age 3+ more than 1.2 bill. recruits were produced by thou. t of SSB whereas in subsequent years the much bigger SSB (over 1000 thou. t) produced less than 0.7 bill. recruits? This happened despite the fact that the environmental conditions favourable for the survival of eggs, larvae and juvenile cod were observed during both periods mentioned above (Stock status..., 2015). But these favourable conditions could not be fully realized due to cannibalism sharp increase on the background of a spawning stock significant growth. The process of juveniles consumption by the cod adults may be considered as an example of the population abundance self regulation. Figure 5 shows the distribution of the recruits number versus the parent stock biomass. The cloud of points in the figure was divided into two regions under certain assumptions. The regression equations were calculated and the corresponding graphs were plotted for both of these areas. The pattern analysis allowed to formulate curious conclusion. 36
37 y = x+378 R 2 = y = x R 2 = R (mln.ind.) Bpa Bpa SSB (thou.t) Figure 5. Comparison of cod recruits abundance (at age 3+) and SSB (Proposed SSB optimal zone is obscured by oblique hatching) When the spawning stock biomass varies in the range of 100, ,000 t, the recruitment of the commercial stock may vary from 447 mln. specimen up to 816 mln. (in line with the equation y = 0.690x + 378). When a spawning stock increases further from 640,000 t to 1,300,000 t the interrelation changes and the recruitment decreases from 816 to 632 mln. spec. (in line with equation y = 0.690x + 378). In this regard, it would be logical to express doubts about the advisability of the fisheries management measures to ensure the accumulation of unjustified high spawning stock, which would greatly exceed a certain SSB range for this population. The fishing mortality increase when SSB is beyond the upper limit of the proposed optimal zone may serve an effective fisheries management measure, consequent weakening the negative pressure of very high SSB on its own recruitment, and on the abundance of prey species (Borisov, 2013, 2015). It is obvious that the minimum boundary of a zone of optimal spawning stock biomass is B pa = 460 thou. t. Unfortunately, the maximum limit of optimal SSB range set can not be accurately determined. However, in accordance with the distribution of the points in Figure 5 and based on the precautionary approach principle, the SSB at the level of 2B pa, i.e. 920 thou. t may be accepted as a maximum boundary of SSB optimal zone. If it is accepted, the fishing mortality should remain constant at F pa = 0.4 for the cases when the spawning stock biomass is between B pa and 2B pa (Figure 6). 37
38 Figure 6. Existing (a) and proposed (b) diagrams of fishing mortality depending on cod SSB Further, subject to all stated above F may be increased further linearly from the point F pa = 0.4 when SSB = 2B pa = 920 thou. t to the point F = 0.6 while the SSB = 5B pa = 2300 thou. t. The F max reference point was selected as the average observed F value for the period The SSB max was selected as close to the actually observed in 2013 SSB historical maximum. These and other author's proposals for the cod HCR improvement are presented in Annex. Conclusion 1. Analysis of the long term dynamics of the Barents Sea cod stock shows its considerable variability, both by periods and between neighbouring years, despite the facts that the population age structure is represented by substantial number of generations and that the lifetime of individuals reaches up to 25 years. The reason is due to the high survival variability of cod eggs, larvae and young specimen which in turn is determined by the highly changeable environmental conditions. The most numerous cod generations may exceed the poorest ones times at the age of recruitment "3+". Hence, the natural inevitability of huge inter annual stock biomass changes requires adequate annual changes of TAC. Therefore, adopted by JRNFC strategy of achievement of long term maximum benefit from stocks under conditions of simultaneous inter annual TAC stability could not be fully implemented. 38
39 2. Declared in HCR ±10% limitation of TAC changes does not correspond always to essential changes in cod stock biomass, which adds doubt on the suitability to use of such restrictions. The HCR setting was aimed initially at limiting of possible TAC increase to stop further the cod stock decrease and to ensure its recovery. This task has been successfully implemented by the beginning of the 2000s. Later, the period with environmental conditions favourable for the survival of new cod generations promoted it too. A significant increase of cod fishing stock and spawning stock biomass was recorded in compared to the previous period of The replacement of a biological reference point F pa = 0.4 to F = 0.3 at high SSB level, significantly exceeding B pa level, was not justified by the biological point of view. It has been dictated probably by the economic factor by the desire to keep high market prices for the cod products. Therefore, such a substitution should be considered outside the biologically based TAC. In addition, the decision on fishing mortality reduction when SSB significant grew up was not consistent with the requirement of mandatory use of new scientific data on stock dynamics. 4. To reduce the contradiction between biological demands to the TAC, on the one hand and industrial economic and socio political requirements on the other hand, the process of establishing TAC should be carried out in two stages. Biologically based catch opportunity may be estimated by scientists of two countries under ICES umbrella as a first stage. JRNFC managers may make the TAC adjustments taking into account any other non biological factors, with the assistance of appropriate expertise as a final step. 5. The reduction of fishery press pertaining mainly to large cod of older age groups which escape trawl relatively easy, compared to 3 7 yr old fish, has resulted in accumulation in the population of large size individuals, potential consumers of their own juveniles (cannibalism) and other ecosystem components, such as capelin, haddock, herring, polar cod, shrimp. 6. The fisheries management practice by JRNFC in recent years has shown that the current cod HCR does not have enough versatility. It stipulates only the F reduction when the spawning stock falls below B pa with the purpose of its recovery. The rule worked perfectly during the cod stock depression period. The HCR does not provide the opportunity of biologically substantiated fishing mortality increase at high SSB values. 7. Authors offer the HCR improvement, aimed at the possibility of fishing mortality increase at high cod SSB. This will reduce the negative impact of the growing population of cod to other elements of the Barents Sea ecosystem (see Appendix). It is proposed to include in the cod fishing regulation the possibility of F increase when the spawning stock is 2 times or more exceeds the precautionary level of B pa established for cod. The proposed option should not be considered as the sole and final years of experience in the application of existing HCR has shown the urgent need for the inclusion into it some additional elements for flexible prompt fisheries management. This allows to respond quickly and transparently to unexpected changes of cod stock (not covered by the biological forecast sometimes), and to the economic, social or environmental challenges. To this end, HCR should be evaluated regularly (for example every 5 year) and either to be updated or to be extended. 39
40 Annex Existing and proposed HCR versions Existing Proposed The Parties agreed that the management strategies for cod and haddock should take into account the following: The Parties agreed that the management strategy of cod fishery should: conditions for high long term yield from the stocks achievement of year to year stability in TACs full utilization of all available information on stock development provide the achievement of biologically acceptable maximum annual catches; take into account all available information on current and predicted stock status; keep such management regime of fishery that maintains the healthy status of all elements in the ecosystem On this basis, the Parties determined the following decision rules for setting the annual fishing quota (TAC) for Northeast Arctic cod (NEA cod): estimate the average TAC level for the coming 3 years based on F pa. TAC for the next year will be set to this level as a starting value for the 3 year period the year after, the TAC calculation for the next 3 years is repeated based on the updated information about the stock development, however the TAC should not be changed by more than +/ 10% compared with the previous year s TAC. At the TAC setting for the next year it is necessary to estimate the average TAC level for the three years after current, based on projections of the commercial stocks for these three years at the F pa = 0,4. The Principle of the 3 year moving average for the TAC calculations in subsequent years is repeated taking into account new information on stock development. * The beginning of this part of the existing HCR is shifted to the end of the previous proposed one. The sentence about inadmissibility of TAC changes in the adjacent years (+/ 10%) is proposed to exclude. * In Italics it is not proposed changes but only comments to them * The sentence about acceptable change of reference point F pa = 0,4 by having no biological sense index F = 0,3 should be removed. * In Italics it is not proposed changes but only comments to them 40
41 if the spawning stock falls below Bpa, the procedure for establishing TAC should be based on a fishing mortality that is linearly reduced from Fpa at Bpa, to F= 0 at SSB equal to zero. At SSBlevels below Bpa in any of the operational years (current year, a year before and 3 years of prediction) there should be no limitations on the year to year variations in TAC. If predicted SSB in any of three years following the current year falls below B pa, establishing of TAC should be based on a linear reduction of fishing mortality from F pa when SSB = B pa to F = 0 when SSB = 0. When SSB is between 1B pa to 2B pa the fishing mortality remains constant at F pa =0.4. Further, when SSB increases from 2B pa to 5B pa, the fishing mortality increases linearly from 0,4 to 0,6. In some special cases for economic, social or ecological reasons (in particular, in the need to implement measures to conserve biodiversity of the ecosystem) the JRNFC may adopt the decisions unforeseen in the HCR. The HCR should be evaluated after every 5 year and may be updated or prolonged. Reference Borisov V. M Analysis of scientific justification for NEA cod management. WD 11. Report ICES AFWG. CM 2013/ACOM:05. ICES Headquarters, Copenhagen April p. 22. Borisov V.M Dynamics of stock and the existing harvest control rule of NEA cod Trudy VNIRO. V. 155, p Dolgov A.V Consumption of various prey species by cod in Working document to the Arctic Fisheries Working Group. Hamburg, Germany, April pp. Dolgov, A.V.; Bogstad, B.; Johannesen, E.; Skern Mauritzen, M An overview of trophic interactions in the Barents Sea, in: Jakobsen, T. et al. (Ed.) (2011). The Barents Sea: ecosystem, resources, management: Half a century of Russian Norwegian cooperation. pp Drinkwater, K.; Loeng, H.; Titov, O.V.; Boitsov, V.D Climate impacts on the Barents Sea ecosystem, in: Jakobsen, T. et al. (Ed.) (2011). The Barents Sea: ecosystem, resources, management: Half a century of Russian Norwegian cooperation. pp
42 NOAA Fisheries Status of stocks Annual report to Congress on the Status of U.S. fisheries. Publ. US Department of Commerce. 8 p. Orlova E., Boitsov. V., Nesterova V, The influence of Hydrographic Conditions on the Structure and Functioning of the Trophic Complex Plankton Pelagic Fishes Cod. Edited by Paul E. Renaud. Murmansk 190 p. Protocol 30 th session JRNFC, 2001, Ålesund, Norway. Protocol 33 th session JRNFC, 2004, St. Petersburg, Russia. Protocol 38 th session JRNFC, 2009, Sochi, Russia. Report of the Arctic Fisheries Working Group (AFWG) ICES CM 2014/ACOM:05. Hamburg, Germany April p. Rosenberg A.A., Swasey J.H., Bowman M. Rebuilding US fisheries: progress and problems // Front Ecol. Environ V. 4. 6, P Safina C., Rosenberg A.A., Myers R.A. et al. US ocean fish recovery: keepers, throwbacks, and staying the course // Science V. 309, P, Statistical analysis. Electronic resource i praktika/10 variatsiya/15 dispersiya standartnoe otklonenie koeffitsient variatsii.html Stock status description of fishing objects in the North Atlantic regions, in the seas of North fishery basin and adjacent Arctic regions in 2014 and prognosis of possible catches in , Murmansk. Publishing PINRO 385 p. (in Russian) The Barents Sea cod: biology and fishery / V.D. Boitsov, N. I. Lebed, V. P. Ponomarenko, I. Ya. Ponomarenko, V. V, Tereshenko, V. L. Tretyak, M, S, Shevelev and N, A, Yaragina, Second edition. Murmansk: PINRO Press. 296 pp. (in Russian) 42


43 Theme session II: Harvest control rules in theory and practice Session 2 contribution 1: Harvest Control Rules a perspective from a scientist working in the provision of ICES advice By Carmen Fernandez, ICES Presentation 43


44 44


45 45


46 46


47 47


, Samuel Subbey (IMR)")
48 Session 2 contribution 2: Harvest Control Rule evaluation for Barents Sea Capelin By Bjarte Bogstad (IMR), Dmitry Prozorkevich (PINRO), Samuel Subbey (IMR) Presentation 48


49 49


50 50
51 51
52 Session 2 contribution 3: Evaluation of Northeast Arctic haddock Harvest Control Rules By A Russkikh (PINRO), A Chetyrkin (PINRO), Yu. Kovalev (PINRO), G. Dingsør (IMR), B. Bogstad (IMR) Paper Evaluation of Northeast Arctic haddock Harvest Control Rules Alexey Russkikh 1, Anatolii Chetyrkin 1, Yury Kovalev 1 Gjert Endre Dingsør 2, and Bjarte Bogstad 2 Abstract In this paper we present the main findings and results of the evaluation of Harvest Control Rules (HCRs) for the Northeast Arctic haddock (NEA haddock) stock. Stochastic long-term simulations for the existing HCR and five alternative variants were performed. Simulations show that all of the proposed HCRs keep the spawning stock at safe biological levels, but the existing HCR performs best in terms of average yield, stability of yield and precautionarity. Introduction A number of new HCRs for NEA haddock were proposed by the Joint Russian-Norwegian Fishery Commission (JRNFC) in 2015 and ICES was requested to test them in correspondence to Precautionary Approach. In addition, it requested to provide information about yield, variability, risk levels, stock levels and size/age composition of catch and stock in a short, medium and long-term perspective. During special workshops in (ICES 2015b, ICES 2016) where all of the authors participated, the main relationships of the NEA haddock population dynamics were decided on. Based on this a stochastic model of population dynamics was set up in a program (NE_PROST) realized in Excel at PINRO (Murmansk) and long-term simulations were done for the existing HCR and five alternative variants. NE_PROST allows implementing some additional features of population, which were not available in the program PROST (Åsnes, 2014), previously used for this purpose. The yield and the dynamics of stock size and fishing mortality were calculated. In addition, the probability of the spawning stock falling below certain thresholds (Blim, Bpa) for each rule was assessed. 52
53 Data series used The time series of stock abundance, biomass, weight (in catch and in stock), maturity, fishing mortality and natural mortality at age used in the analyses were taken from the AFWG 2015 report (ICES 2015a). The time series covers the period However, in this series the stock weight at age and maturity at age is constant for the period , the catch weight at age is constant for and the natural mortality is constant for the period Thus, only the period 1983(1984)-2014 were used for analyses depending on these data. We used age range in the simulations, in order to be consistent with AFWG However, as real data on stock weight and catch weight for the oldest age groups are sparse and have low sample size, we assumed that maturity at age and selection pattern for ages 12 and 13 were equal to the values for age 11. Population model settings Stock-recruitment relationship From the experience of previous studies, it is known that a large variability of recruitment is a characteristic feature of the NEA haddock stock as well as for other haddock stocks. The stock-recruitment relationship of NEA haddock is very weak. Abundant generations may by generated both by high and low spawning biomasses. At the same time, relatively weak generations can been produced by high spawning biomasses (Fig. 1). R SSB NEA haddock Recruitemnet age 3 millions SSB (1000 Tonnes) Figure 1. Stock recruitment relationship of Northeast arctic haddock , open diamonds are forecast of abundance of the three last year classes ( ) estimated by surveys. It was concluded that there was no reasonable stock - recruitment model at hand and instead we looked for an empirically based approach that would for the purpose of the simulation generate a realistic recruitment time series. It was decided to use a hockey stick recruitment function with break point of Bloss = tonnes and a recruitment (age 3) plateau of 136 million (geometric mean of historic recruitment) with log-normal error structure. In addition, bad or good year-classes are shown to come consecutively, with a first order autocorrelation of log(r) around 0.5. It was considered that this might best be simulated by 53
54 introducing some form of autocorrelation between years, i.e. that a bad year-class is more likely than not to be followed by another bad year-class. On the other hand, occasionally very strong year-classes occur something that traditionally is simulated by assuming that the process is generating log-normal residuals. Finally experimenting with such models realized that this process would occasionally generated unrealistic large year-classes and therefore some cap on the largest possible year-class would need to be introduced in the process. The cap was set to 1400 million, slightly above the highest observed. Natural mortality The natural mortality (M) was set to 0.2 for age groups 7+. For age 3-6, average ( ) M including cod predation was applied (table 1). Table 1. M values for age 3 6. M AGE 3 M AGE 4 M AGE 5 M AGE 6 Average ( average) Weight at age in stock and catch The period of the time series when survey weights are available (stock weights in vs. total stock biomass in ) were used to fit a density-dependent model for weight at age (kg) in the stock wsa,y for ages The model is of the form ws TSB a, y a y 1 a (1), where TSBy is the total stock biomass in year y, a is age, and αa and βa are constants. The range of possible values of haddock weight was truncated, in order to avoid unrealistic values due to extrapolations. The highest/lowest observed values of haddock weight at each age were used as upper/lower bounds in the model. For simplicity, uncertainty from the regression has not been included in simulations. Weight at age in catch is modelled as a function of weight at age in stock, using equation 2: wc a, y awsa, y a (2) The regressions are based on data from , when observations of stock weights at age from surveys and catches are available. Uncertainties associated with the regression were not taken into account. For ages 9 and older weight at age in the catch is set equal to weight at age in the stock. Maturation Maturity at age was modeled as a function of weight at age in the stock in the same year for ages 3-10 for the whole time series: 54
55 P a ( ) P wsa, y ( ws w ) (3), y a a, y 50, a 1 e For age 3 P=0.016 is used and for ages 10, 11,12 and 13+ P=1. Exploitation pattern 1 The selection pattern used previously was last 3-year average. Such a short time period can give an unstable average. There have not been major changes in minimum sizes, gear types or division of quota on gear types in the last 20 years ( ). Thus, as expected the selection pattern for ages 4-7 has not changed much during this period. We have used the last twenty years average as the default exploitation pattern S(a) (Table 2). Table 2. Default exploitation pattern (normalized to obtain F4-7=1.0). Age Selection Assessment and implementation errors Assessment error/bias included in these simulations, by going years back and calculate the discrepancy between stock abundance calculated in the assessment year and the current perception of stock size in that year and estimated value CV=0.25. Implementation error was not applied. Simulation settings For each rule, 5000 simulations 100 years into the future were made. The average values for the last 80 years of the period were used, in order to avoid the influence of the initial values. In all simulations recruitment, weight and maturity depend on population density, natural mortality taken as average for period Assessment error was included (CV=0.25 for all age groups, uncorrelated). Implementation error is not included (see above). RequestThe agreed HCR for haddock with last modifications is as follows (Protocol of the 40 th Session of The Joint Norwegian Russian Fishery Commission, 14 October 2011: TAC for the next year will be set at level corresponding to F msy=0.35. The TAC should not be changed by more than +/- 25% compared with the previous year TAC. If the spawning stock falls below B pa, the procedure for establishing TAC should be based on a fishing mortality that is linearly reduced from F msy at B pa to F= 0 at SSB equal to zero. At SSB-levels below B pa in any of the operational years (current year and a year ahead) there should be no limitations on the yearto-year variations in TAC. JNRFC asked ICES to explore the consequences of the following harvest control rules: 1. The existing harvest control rule, but with Ftarget =0.27 instead of The existing harvest control rule 3. The existing harvest control rule, but with Ftarget =0.43 instead of The existing harvest control rule, but with a constraint of maximum 10% TAC variation from year to year instead of a 25% constraint which is presently used 55
56 5. The existing harvest control rule, but with no constraint of maximum TAC variation from year to year 6. The existing harvest control rule, with a constraint of -25% in TAC reduction from year to year but with no constraint for increases in TAC. MSY investigations Because no model was found to represent the stock-recruitment relationship adequately for Northeast arctic haddock, there was no justification for changing the current biological biomass reference points. Blim is based on Bloss = t which gives Bpa = t. According to ICES guidelines for calculating MSY reference points MSY Btrigger for NEA haddock was set equal to Bpa. Long-term simulations using the same settings as applied for HCR investigations with different target Fs were done in the NE_PROST program. Runs were made using constant F at all SSB levels instead of a HCR where F is reduced linearly from Ftarget at Bpa as done in all proposed HCRs. Assessment error was not included. The results indicate that it is not likely to increase the yield by increasing the current target F=0.35 and the simulations indicate a reduced yield in tonnes at lower fishing mortalities (Fig. 2). Figure 2. Mean catch with corresponding F target and probability of SSB<Blim (5000 iterations). Analysis shows that the yield is stable in the range F=0.3 to F=0.6, but F=0.4 and F=0.5 gives a higher yield than the other values. In same time 95% probability of SSB>Bpa correspond to the range F=0.3 to F=0.4. Thus the current Fmsy=0.35 seems to be appropriate. Results of evaluation The results of simulations are shown in Table 3. According ICES recommendation (ICES, 2013) prob1 (average probability that SSB is below Blim, where the average of the annual probabilities is taken across ny years) was used as criteria for precautionarity. 56
57 Based on the prob 1 estimates, all rules are within precautionary approach (prob 1 < 5%). However, only rule 1 is above Bpa in more than 95% of the years. There are small differences in median catches between the rules, thousand tones. These values are a little lower than the median historic catch (130 kt), which may be related to the low target Fs and different selection patterns throughout the time series. Table 3. Results of long-term stochastic simulations stock biomass, recruitment and yield. Probabilities of SSB < Blim and Bpa and overview of how often different parts of HCR are applied. Values for the 5000 simulations with assessment error performed for each run. HCR No Target F TAC Constraint % (SSB > Bpa) ±25 ±25 ±25 ±10 N/A + :N/A; 25 Mean F realised Prob (SSB<Blim) in % Prob (SSB<Bpa) in % Mean catch Median catch Standard deviation of catch Median TSB Median SSB Median annual change in Catch, % Mean weight in catch, kg % of years + TAC constraint applied N/A N/A % years - TAC constraint applied N/A 22.8 The rule with the highest probability of SSB< Blim is rule 3 (F=0.43, max 25% year-to year change in TAC), with prob 1 = 4.9 %. This rule can also be used as a reality check. The average value of F for the period is 0.46, and the average values of total biomass, SSB, landings are 464, 175 and 136 thousand tonnes, respectively. The average recruitment at age 3 is 255 million. The mean stock sizes and catches from rule 3 are close to these historical averages. This indicates that the model performs reasonably well at this level of fishing mortality. As expected, median SSB is above historic median due to lower target F in the later period. The selection pattern has also changed throughout the time series. In the beginning of the period, there was higher fishing pressure at younger ages. It is also seen that using a max 10% year-to year change in TAC increases (rule 4) the probability of SSB < Blim and Bpa similar to increasing of F target. All rules give variable catches from year to year, caused by the high variability in recruitment. However, rules 3, 5, and 6 give the most variable catches (Figure 4.13, Table 4.8). The runs with F=0.27 with 25% TAC variation (rule 1) and rule 5 with F=0.35 and no limit on maximum year-to-year-change in TAC gave the lowest probability of SSB < Blim and Bpa. Conclusions Simulations of long-term variations of SSB and catch using settings of current and proposed HCRs show that all rules are within precautionary approach (prob 1 < 5%). Increasing target F from F =0.35 to 0.43 leads to increasing probability of SSB< Blim (4.9%) and using a max 10% 57
58 year-to year change in TAC increases the probability of SSB < Blim and Bpa similar to increase of F target and decreasing mean catch. The run with F=0.35 and no upper limit or without year-to-year-change in TAC (rule 5 and 6) gave the low probability of SSB < Blim and Bpa, but give the most variable catches. Running MSY evaluations leads to maximum yield at range F=0.4 to F=0.5, but in same time 95% probability of SSB>Bpa correspond the range F=0.3 to F=0.4. From the above we conclude: Among the six HCRs tested, the current HCR (rule 2) performs best in terms of average yield, stability of yield and precautionarity. References: ICES. 2013a. Report of the Workshop on Guidelines for Management Strategy Evaluations (WKGMSE), January 2013, ICES HQ, Copenhagen, Denmark. ICES CM 2013/ACOM:39, 121 pp. ICES. 2015a. Report of the Arctic Fisheries Working Group (AFWG), April 2015, Hamburg, Germany. ICES CM 2015/ACOM: pp. ICES. 2015b. Report of the first workshop on Management Plan Evaluation on Northeast Arctic cod and haddock and Barents Sea capelin (WKNEAMP-1), November 2015, Murmansk, Russia. ICES CM 2015/ACOM:60, 26 pp. ICES Report of the second workshop on Management Plan Evaluation on North-east Arctic cod and haddock and Barents Sea capelin (WKNEAMP-2), January 2016, Kirkenes, Norway. ICES CM 2016/ACOM: pp. Åsnes, M. N PROST users guide. In: ICES Report of the Workshop on Redfish Management Plan Evaluation (WKREDMP), January, Copenhagen, Denmark. ICES CM 2014/ACOM: pp. 58
59 Session 2 contribution 4: A decade of experience with HCR for NEA cod By Yu. Kovalev (PINRO), Bjarte Bogstad (IMR), N. Yaragina (PINRO) Paper A decade of experience with HCR for NEA cod Authors: Yury A. Kovalev 1, Bjarte Bogstad 2, Natalia A. Yaragina 1 1 PINRO, Murmansk, Russia 2 IMR, Bergen, Norway Introduction The history of fishery of the Northeast arctic (NEA) cod goes back more than thousand years (Rollefsen 1966). The history of the stock management is also rather long (over 100 years) and its important milestones were published elsewhere (Øiestad 1994; Nakken 1998, 2002; Hylen 2002; Hylen et al. 2008; Yaragina & Aglen 2002; Aglen et al. 2004, 2005; Kovalev & Drevetnyak 2011; Yaragina et al. 2011; Kjesbu et al. 2014; Gullestad et al. 2015). Issues on management strategies for the fish stocks in the Barents Sea were considered at Joint Symposia several times previously (in 1999, 2001, 2003, 2005, 2007, 2013) with different aspects and from different angles. However, large changes in the management system of the NEA cod stock have occurred during the last years and need to be described and interpreted revealing their merits and shortcomings. Material and Methods Data are taken from the annual ICES reports (ACFM/ACOM reports) as well as the Joint Russian-Norwegian Fisheries Commission (JRNFC) protocols (available on Each year ICES produces an updated version of the assessment of the stock size in all previous years, and we have compared the results from the annual assessments, i.e. the assessment that was the basis for the advice on next year s TAC, with the results from the most recent (2015) assessment (ICES 2015a) for the same years. Also, several runs by means of the program NE_PROST used for the evaluation of a number of alternative harvest control rules for Northeast Arctic cod were conducted. The program NE_PROST is described in detail in the report of the special ICES Workshop (WKNEAMP) 59
60 on Management Plan Evaluation of the three Barents Sea stocks cod, haddock and capelin (ICES, 2016). Results and Discussion The analysis is mainly focused on the last decade of the NEA cod management under auspices of the JRNFC. Concerns on adequacy of the existing management for the NEA cod emerged in the beginning of the 21 st century following a period of decrease of spawning stock biomass (SSB) and total stock biomass (TSB). Reasons on dissatisfaction of fisheries regulations were connected with facts that year-specific total allowable catch (TAC) was usually fixed higher than scientific advice for subjective motives, TAC was overestimated due to scanty knowledge of stocks and insufficient assessment methodology, and TAC was overfished due to IUU (illegal, unreported and unregulated) catch practice (Kovalev & Drevetnyak 2011). In parallel, and motivated by the situation with depression of many stocks in the main areas of the World Ocean, a broad international scientific discussion on acceptable levels of SSB of different stocks to provide safe and long-term fisheries took place. The precautionary approach intended to determine levels of TAC, which can ensure maintenance of reproductive capacity of populations under conditions of uncertain stock estimates and fisheries data. Within frames of the precautionary approach (PA) paradigm biological reference points were determined, which have been used by ICES to provide recommendations for commercial species exploitation in the Barents Sea and adjacent waters. Later, since 2011, the PA paradigm has been incorporated into the maximum sustainable yield (MSY) framework (ICES 2010, 2011). In these conditions, the decision to formulate appropriate management strategies was reached on the 30 th session of JRNFC in 2001 as a further step in optimizing the cod fishery (Table 1). It was agreed that Russian and Norwegian scientists would compose a Basic Document regarding the main principles and criteria for long term, sustainable management of living marine resources in the Barents and Norwegian seas. The 31st session of JRNFC in 2002 approved the Basic Document that remains to be a handbook or guideline for managers in the wide sense and possibly not only for the Barents Sea region. It is worth to outline its structure that included several important sections). 60
61 1. Introduction: with the reference to international laws (including FAO Code of conduct for Responsible Fisheries and bilateral agreements). 2.Terms and definitions: with important definitions to achieve a common understanding between scientists, managers and fishermen (e.g. Cost of regulation, Ecosystem based fishery management, Harvest control rule, Limit biological reference points, Population, Precautionary approach to fisheries management, Safe biological limits, Shared stocks, stock and recruitment, Sustainable management). 3. Principles and scientific basis for management decisions 3.1. Management obligations: with intentions to base their work on scientific recommendation from ICES, apply the Precautionary Approach, however maintain their right to make independent decisions, taking into account the socio-economic aspects Research activities as a basis for management decisions: with a list of necessary data in the fields of biological research for stock assessment, catch statistics and bioeconomic analysis of fishery (monitor environmental conditions, investigations on recruiting year classes, carry out systematic surveys of stocks, conduct biological analyses, etc.) 4.Management objectives: with four concrete objectives for national fisheries policy such as: 1) to attain high sustainable catches from exploited stocks ; 2) to keep exploited stocks within safe biological limits; 3) to ensure sustainable development of fishing industry; 4) to attain social development of maritime regions. 5. Decision-making criteria: with an admission of possible conflicts between objectives in the short term and the long term strategy. A need for evaluating of some indicators representing the various objectives in an accurate manner was expressed. The JRNFC agreed (in 2002) on management strategies for cod and haddock based on PA reference points and short term forecast (3 years) in order to improve management and reduce interannual changes in TAC. The Parties agreed that the management strategies for cod (and haddock) should take into account the following: conditions for high long-term yield from the stocks; achievement of year-to-year stability in TACs; full utilization of all available information on stock development. 61
62 The first TAC value for NEA cod computed based on Harvest Control Rules (HCR) (Catch rules, Parts 1-3) was established for the year 2004 at the 32 nd session of the JNRFC in The HCR for NEA cod was at first formulated in this way: - estimate the average TAC level for the coming 3 years based on Fpa. TAC for the next year will be set to this level as a starting value for the 3 year period (Part 1); - the year after, the TAC calculation for the next 3 years is repeated basing on the updated information about the stock development, however the TAC should not be changed by more than +/- 10% compared with the previous year s TAC (Part 2); - if the spawning stock falls below Bpa, the Parties should consider a lower TAC than the decision rules would imply (Part 3). The first amendment of the HCR was made to Part 3 in Part 3 now looks as follows: - if the spawning stock falls below Bpa, the procedure for establishing TAC should be based on a fishing mortality that is linearly reduced from Fpa at Bpa, to F=0 at SSB equal to zero. At SSB-levels below Bpa in any of the operational years (current year, a year before and 3 years of prediction) there should be no limitations on the year-to- year variations in TAC (revised Part 3). ICES approved the HCR as corresponding to Precautionary Approach, and since 2004 the basis of ACFM/ACOM advice on NEA cod has been the HCR proposed by JRNFC (Table 1). The second amendment to the HCR was the inclusion of the additional condition (Catch rule, Part 4) to the HCR (addition after Catch rule, Part 2) in 2009 as the situation with stock size was favorable, and 10% limit on annual change in TAC resulted in rather low Fs (less than 0.30). It sounds as follows: If the TAC, by following such a rule, corresponds to a fishing mortality (F) lower than 0.30 the TAC should be increased to a level corresponding to a fishing mortality of 0.30 (Table 1). Updated biological reference points (BRP) for NEA cod were evaluated in 2003 at SGBRP (ICES 2003), and have been used as the criteria in decision-making since then. All available scientific information was included in the process of the BRP elaboration such as 62
63 the updated time series on weight at age and maturity at age for the historical period ( ). Summaries on implementation of the HCR in terms of which parts of the catch rules were in operation during are presented in Table 2. It should be noted that values of TAC were adopted according to HCR approximately in 70 % of the cases. At that, Catch rule, Part 1 was applied most frequently (Table 2), whereas Catch rule, Part 2 (± 10% change) and Catch rule, Part 4 (F constraint) were less frequently applied. Fortunately, there was no need to apply Catch rule, Part 3, as the SSB-levels never dropped below Bpa during this period. Deviation from HCR in accordance with the rights to independent decisions (see Basic Document, part 3.1) was undertaken four times due to different reasons, e.g. uncertainty in level of unreported catches (2008); benefit of fishery in a period of economic uncertainty (2009) and aim to decrease the predation pressure on cod s prey (2016). Advantages of HCRs are their transparency and that they give a basis free from subjective decisions (not like previous advices of the type large reduction in F (1989) or healthy stock (1993) or no long-term gains in increased F ( ) or reduce F towards Fpa (1999) i.e. without concrete recommendations). Also, the present cod HCR is complete in the sense that it determines the TAC level exactly at all stock levels, while the first version was incomplete as it did not prescribe what to do for SSB < Bpa. Disadvantages of the HCR are connected with its somewhat inflexible reaction to the rapid stock increase, especially in a transition period from a high to a low (and more stable F) and these were corrected in 2009 by introduction of the additional condition F>=0.30 (Catch rule, Part 4) and furthermore in 2014 by the application of ± 10% annual quota flexibility (or borrowing and banking). Implementation of the HCR made it possible (in addition to other reasons, e.g. favorable environmental conditions as well as the elimination of the IUU catches problem) to contribute to stock growth followed by catch increase and relative catch stability. Improvements of stock structure and changes in age- (weight-) characteristics of catches are illustrated by data in Table 3. The dynamics of total and spawning stocks of NEA cod, changes in cod recruitment at age 3 years, catch and fishing mortality for three different periods: , and are presented in Table 3 with comparisons of the average values (also minimum, maximum, coefficient of variation (CV) of some important performance measures). 63
64 It should be mentioned that the fishing mortality over the period (before the HCR implementation) averaged F=0.73, which was higher than long term mean value (F=0.61). Accordingly, average total and spawning stock biomasses below the long term means (420 vs. 502 kt and 1369 vs kt correspondingly) were observed. Average recruitment was lower than the long term mean (538 vs. 778 million at age 3); average catch was reduced to 487 kt in comparison with the long term mean catch (662 kt), in spite of high fishing pressure which was close to Flim (=0.74). It is, however, interesting to note that the strong decrease in fishing mortality from 1989 to 1990 corresponds to hypothetical implementation of the present HCR starting in 1990 (F in 1990 is estimated to 0.27 while the SSB in 1990 was 316 kt which also corresponds to an F of 0.27 with the present HCR). Introduction of HCR led to a more optimistic picture of the stock in as the average fishing mortality was F=0.42 (Figure 1). Spawning and total stock biomass averaged 1132 and 2637 kt correspondingly. Average recruitment was close to the long term mean (748 vs. 778 million at age 3), average catch was 661 kt, i.e. was comparable with the long term mean catch. Variability of annual catch was reduced (CV of catch: 26.9% in vs. 34.5% in ) as well as variability of recruitment numbers (39.9% in vs. 45.9% in ). Also the structure of the stock has been altered resulting in increase of mean fish size/ weight in catches (Table 3). Several calculations have been done using NE_PROST model (ICES 2016) with density dependent growth, cannibalism and target F (Table 4) to illustrate a hypothetical development of the stock if the HCR had not been implemented and stock exploitation would have remained at the same level as in the pre-hcr regime (with F ~ 0.73). Several assumptions were made concerning maturation and recruitment functions, which influence the results strongly. It was shown that for Run 4, based on observed values, with the high level of exploitation, a minor modelled increase in catch is obtained, while the SSB would have been more than halved (Table 4), and TSB reduced by 30 %. This might augment a risk of undermining the stock recruitment. Also, the stock structure may be altered, mean weight in catch would have been reduced by 22 % in comparison with the Run 3 (HCR) results (Table 4). The same tendencies were shown for modelled values of growth/cannibalism/recruitment (Run 5 and 6). Advised, agreed and actual catch in are presented in Figure 2. It should be noted that the difference between advised and agreed catch was rather high in some years before 2004 and was then reduced to close to zero at the end of examined period. Also, the difference 64
65 between actual and advised catch was high especially in , mainly due to IUU fishery (Table 5). Since 2009 the problem with IUU catch is reported to have been solved due to introduction of port state control within the NEAFC area from May 1, 2007 onwards. Stock assessments used as a basis for TAC recommendations in (Figure 3) were without any clear biases (negative or positive). As for fishing mortality predictions in single years, they were equally both over- and under- estimates to some extent in this period (Figure 4) in comparison with the last (2015) assessment. Recruitment abundance tended to be underestimated at the annual assessment; especially the year classes 2004 and 2005 (Figure 5). This underestimation might be connected with an incomplete coverage of young cod distribution area in some years due to incomplete survey coverage or/and extension of migratory routes of pre-recruits in warm years (Table 5). NEA cod stock regulations in the 2000s were a real challenge; some scientific and management issues have been successfully solved but others are still waiting their solutions (Table 5). Analytical mathematical method (VPA/XSA) adopted within ICES is the most objective method to assess stock size at the moment (ICES 2015 benchmark, ICES 2015b), but it still has its shortcomings: it is strongly depends on some prior settings (Table 6-7); the tuning process is sensitive to survey results. However, we now have a time series with a much larger range in survey observations, in particular for older fish, than before, and thus such problems related extrapolating the relationship between survey abundance and stock size to outside the range of previous observations should be less of an issue than in the period up to The shortening of national catch sampling programs is worrying, as it is considered necessary to have a solid scientific basis for the management (point 3.2 of Basic Document ). Summary Implementation of HCR was made in a timely manner; it helps to prevent future crisis of the stock. The harvest control rules formulated by JNRFC resulted in the fulfilment of the main stated tasks: - currently, the NEA cod is exploited approximately at the theoretical maximum sustainable level (FMSY); 65
66 - year-to-year relative stability of TAC has been achieved; Decreased CV in catches is observed; - all biological information available for the stock was used. References Aglen A, Drevetnyak K, Sokolov K Cod in the Barents Sea (North-East Arctic cod), a review of the biology and the history of fisheries and management. In Management Strategies for Commercial Marine Species in Northern Ecosystems. Proceedings of the 10th Norwegian-Russian Symposium, Bergen, August 2003, pp Ed. by Å. Bjordal, H. Gjøsæter and S. Mehl. Institute of Marine Research, Bergen, Norway. Aglen A, Nakken O, Sokolov KM, Yaragina NA Retrospective review of the advice on management of the North-East Arctic cod stock. In Ecosystem dynamics and optimal long-term harvest in the Barents Sea fisheries: Proceedings of the 11th Russian- Norwegian Symp. (Murmansk, Aug. 2005). Murmansk : PINRO Press, p gullestad P, Blom G, Bakke G, Bogstad B The Discard Ban Package : experiences in efforts to improve the exploitation pattern in Norwegian fisheries. Marine Policy 54(5): 1-9. Hylen A Fluctuations in abundance of Northeast Arctic cod during the 20th century. ICES Marine Science Symposia, 215: Hylen A, Nakken O, Nedreaas K Northeast Arctic cod: fisheries, life history, stock fluctuations and management. In Norwegian Spring-spawning Herring and Northeast Arctic Cod. 100 Years of Research and Management, pp Ed. by O. Nakken. Tapir Academic Press, Trondheim. ICES Report of the Study Group on Biological Reference Points for Northeast Arctic Cod. ICES CM 2003/ACFM: pp. ICES Report of the Workshop on Implementing the ICES Fmsy framework (WKFRAME1). ICES CM 2010/ACOM:54. ICES Report of the Workshop on Implementing the ICES Fmsy Framework (WKFRAME-2). ICES CM 2011/ACOM:33. ICES. 2015a. Report of the Arctic Fisheries Working Group. ICES CM 2015/ACOM: 05, 590 pp. 66
67 ICES. 2015b. Report of the Benchmark Workshop on Arctic Stocks (WKARCT). ICES C. M. 2015/ACOM:31, 126 pp. ICES Report of the second workshop on Management Plan Evaluation on Northeast Arctic cod and haddock and Barents Sea capelin (WKNEAMP-2). ICES CM 2016/ACOM: 47, 76 pp. Kjesbu OS, Bogstad B, Devine JA, Gjøsæter H, Howell D, Ingvaldsen R, Nash RDM, Skjæraasen JE Synergies between climate and management for Atlantic cod fisheries at high latitudes. Proceedings National Academy of Science 111 (9): Kovalev YuA, and Drevetnyak KV The Barents Sea cod: from regulation of fisheries to stock management. Journal Rybnoye Khoziaystvo (Fisheries), the special jubilee issue: (in Russian). ISSN Nakken O Past, present and future exploitation and management of marine recourses in the Barents Sea and adjacent areas. Fisheries research 37: Nakken O Retrospective review of management advice and TAC for some stocks. In T.Jakobsen [ed.] Management strategies for the fish stocks in the Barents Sea. Proceedings of the 8th Norwegian-Russian Symp., Bergen, June IMR/PINRO Joint Report Series No 5/2002. Rollefsen G Norwegian fisheries Research. FiskDir. Skr. Ser. HavUnders., 14(1):1-36. Yaragina NA and Aglen A Basis of stock assessment and management advice. In T.Jakobsen [ed.] Management strategies for the fish stocks in the Barents Sea. Proceedings of the 8th Norwegian-Russian Symp., Bergen, June IMR/PINRO Joint Report Series, No 5/ 2002, p Yaragina NA, Aglen A, Sokolov KM Chapter 5.4. Cod. In The Barents Sea Ecosystem, Resources, Management. Half a Century of Russian Norwegian cooperation. pp Edited by T. Jakobsen and V. Ozhigin. Tapir Academic Press, Trondheim. Øiestad V Historic changes in cod stocks and cod fisheries: Northeast Arctic cod. ICES mar. Sci. Symp. 198: p
68 Table 1. The history of development of HCR applied on the Northeast Arctic cod fishery Year No. of JNRFC session Description Decision on investigation of HCR Adoption of the management strategies and HCR The first TAC approved due to HCR (Catch rules, parts 1 3) for the year The amendment of the HCR, part 3. ICES approved HCR as corresponding to Precautionary Approach Introduction of an additional condition to HCR (Catch rule part 4) / 10% annual quota flexibility Table 2. Number of years when different parts of HCR were applied in Catch rule part 1 The mean value of catch for the coming 3 years at F pa=0.40 Catch rule part 2 +/ 10% change of TAC compared with the previous year s TAC Catch rule part 3 the procedure when SSB levels below B pa Catch rule part 4 TAC at F=0.30 Not according to HCR for different reasons* ( 10%) ( 10%) *The reasons given here are those (if any) which are stated in the protocol. Elements of uncertainty in the stock assessments connected with different estimates of catch used by JRNFC and ICES (2008) Increase of TAC will benefit fishery of both countries in a period of economical uncertainty (2009) Unknown (2013) Decrease of predatory pressure on cod s prey (2016) 68
69 Table 3. Dynamics of NEA cod stock and catch values in different time periods Index Mean TSB, kt Min max TSB Mean SSB, kt Min max SSB Mean % of mature fish in the stock (SSB/TSB, %) Min max % of mature fish in the stock (SSB/TSB, %) Mean number of recruits at age 3, mill. sp. Min max number of recruits at age 3, mill sp. CV of recruitment, % Mean catch Min max catch CV of catch, % F Min max F Mean age of cod in catch, years Min max (mean age in catch) Mean weight of cod in catch, kg Cannibalism mortality of cod at age
70 Table 4. Calculations done using NE_PROST model with density dependent growth, cannibalism and target F Parameter Run 1 Run 2 Run 3 Run 4 Run 5 Run 6 Data average for period: Maturation function average for period densitydependent cohortbased function observed observed average for period average for period R function recruitm ent model recruitme nt model R observed R observed recruit ment model recruit ment model Growth function growth model growth model observed observed growth model growth model Cannibalism model model observed observed model model F/HCR Constant F Constant F HCR (0.40) Constant F (0.73) HCR (0.40) Constan t F (0.73) iterations Mean TSB, 10 3 t TSB at the end of period (2014), 10 3 t Mean SSB, 10 3 t SSB at the end of period (2014), 10 3 t Mean SSB/TSB, % Mean number of recruits at age 3, 10 6 sp Mean catch, 10 3 t Mean F Mean weight of cod in catch, kg
71 Table 5. Scientific and management challenges connected with NEA cod stock regulations in the 2000s Challenge Description Year Scientific Introduction of a new time series on weight at age and maturity at age since 1946 AFWG 2001 Updated biological reference points SGBRP 2003 Introduction of a full uniform time series on cod cannibalism back to 1946 Introduction of a hybrid model on cod recruitment for forecasts Different analytical models testing Annual National and Joint surveys conduction Extension of survey area Stock size of old fish outside previous range of survey observations AFWG 2015 AFWG 2008 VPA/XSA, Flexibest/Gadget, ADAPT, TISVPA, SAM In , 2002, and 2009 the whole distribution area was not covered due to different reasons 2010 and onwards Management Sorting grid implementation 1997 Elimination of IUU catches problem Solved in 2009 Agreement on marine border delimitation 2010 Joint measures on minimal legal fish size and mesh size in trawls 2011 Table 6. Merits and shortcomings of methods and data available for NEA cod stock assessment Assessment method Surveys Data Merits Analytical mathematical method (VPA/XSA) adopted within ICES Annual stock surveys used for tuning and calculating biological parameters of the stock Data on growth, maturity, feeding, condition, catch age/size distribution Shortcomings XSA is sensitive to the age range chosen, for which fish catchability depends on the abundance of year classes Not full coverage of the stock distribution in some years Downscaling of national catch sampling programs 71
72 Table 7. Merits and shortcomings of management measures Technical measures Merits Uniform measures for mesh size, minimum legal size, maximum bycatch of undersized fish for the whole area Shortcomings Difficulties of fishing fleet activity control Unknown discards Quota limits HCR implementation Illegal catch if any 72
73 73 Figure 1. NEA cod stock dynamics over different periods TOTALBIO TOTSPBIO RECRUITS LANDINGS TOTALBIO TOTSPBIO FBAR TOTALBIO TOTSPBIO
74 Figure 2. NEA cod. Advised (1), agreed (2) and actual catch (3) in , kt Figure 3. NEA cod. Assessment results both from annual assessments and from the 2015 assessment. Spawning stock biomass, kt 74
75 Figure 4. NEA cod. Assessment results both from annual assessments and from the 2015 assessment. Fishing mortality. Figure 5. NEA cod. Assessment results both from annual assessments and from the 2015 assessment. Recruitment at age 3, million spec. 75


76 Session 2 contribution 5: Evaluation of NEA cod HCR challenges and reality check By Yu. Kovalev (PINRO) Presentation 76


77 77


78 78


79 79

80 80

, Yu.")
, A.")
81 Session 2 contribution 6: Evaluation of NEA cod harvest control rules By B. Bogstad (IMR), Yu. Kovalev (PINRO), N. Yaragina (PINRO), A. Aglen (IMR), A. Chetyrkin (PINRO) Presentation 81

82 82


83 83
84 Session 2 contribution 7: Impact of limitation in interannual variations of cod yield By A. Filin (PINRO) and D. Howell (IMR) Paper IMPACT OF LIMITATION IN INTERANNUAL VARIATIONS OF COD YIELD ON ITS STOCK DYNAMICS ABSTRACT Anatoly A. Filin, Senior Scientist, PhD Polar Research Institute of Marine Fisheries and Oceanography (PINRO), 6 Knipovich St., , Murmansk, Russia, filin@pinro.ru Daniel Howell, Senior Scientist, PhD Institute of Marine Research (IMR), Postboks 1870 Nordnes, 5817 Bergen, Norway, daniel.howell@imr.no In general analysis of harvest control rules (HCRs) has suggested that these represent a compromise, with greater stability being achieved at the cost of lower overall yield. However, such analyses have been conducted in a single species context. We analyse the impact of the current 10% limitation of year-to-year variations in the annual fishing quota (TAC) for NEA cod using a multispecies STOCOBAR model. This model simulates stock dynamics of cod and capelin in the Barents Sea imitating HCRs and trophic interactions. The cod stock dynamics in the model are described through modelling the main biological processes in the cod population: growth, feeding, maturation, recruitment, natural mortality (including cannibalism) and fishing mortality. The simulated capelin stock dynamics are based on stochastic distribution and statistical relations derived from the observed data. Management scenarios for the cod fishery in the model were established by analogy with the existing harvest control rule (Fpa=0,40 and Bpa = 460 thousand tones). They differed only in range of limitations on interannual variations in TAC for cod. The modelling results show that the restrictions on year-to-year variations in TAC within ± 30 % or higher shall have no impact on the long-term dynamics of cod stock. If such limits are ± 25 % or lower, the long-term mean of stock size and TAC are expected to increase. The cause of changes in pattern of long-term dynamics of cod stock under the limitation on annual variations in TAC is considered. The model outputs support that a limitation of year-to-year variations in TAC of cod facilitates to a more rapid adaptation of its population to changes in the environmental conditions, in particular to changes in prey abundance (capelin stock size). More generally, these results show the importance of including multispecies considerations in evaluating the impact of HCRs. 84
85 Introduction Stability constraints on catches within HCRs are generally of the form TAC will vary by no more than x% per year, provided the stock remains above the precautionary reference point. The aim of such provisions is to provide stability and predictability for fishers, by avoiding as much as possible rapid swings in catch (and hence revenue). It is generally accepted that the trade-off for the stability gains is a reduction in the overall long term yield. The loss of yield arises because the constraint means under fishing at times of peak biomass and overfishing at times of minimum biomass (assuming this to remain above limit reference point). The gains at the low end of the stock are smaller than the losses at the high end, and the overall yield is thus somewhat reduced. Often fishers are prepared to accept this trade-off, and stability constraints are a common feature of HCRs. The above analysis summarizes the traditional view of stability constraints, which has arisen from simulation studies in a single species context. Obviously species do not exist in isolation, and the results may be different if analysed in a multispecies context. This presentation outlined one such novel multispecies analysis for the stability constraint in the Barents Sea cod HCR. The stability constraint here dictates that TAC shall change by no more than 10% annually providing that the stock remains above Bpa. There is also a floor to avoid inefficient fishing during times of rapid stock rise, Fbar shall remain at or above 0.3. There is no equivalent ceiling during times of stock decline. Methods The analysis was conducted using the STOCOBAR model (Howell et al. 2013). This model is well suited to the task of examining HCRs in a wider context than traditional single species analyses. The Model simulates stock dynamics of cod in the Barents Sea, taking fishery, trophic interactions and environmental influence into accounts. It is designed as a tool for prediction and exploration of cod stock development as well as for evaluation of harvest strategies and recovery plans under different ecosystem scenarios. STOCOBAR is an age-structured, singlearea and single-fleet model with one-year time step. The cod stock dynamics in the model are described through modelling the main biological processes in the cod population: growth, feeding, maturation, recruitment, natural mortality (including cannibalism) and fishing mortality. Growth and feeding are temperature-dependent processes, due to the increased metabolic rate resulting from higher temperatures. Cod recruitment (R) at age 3 was modeled based on its number at age 1 taking into account cannibalism mortality. A Ricker recruitment 85
86 equation was used to couple the cod spawning stock biomass (SSB) and cod abundance at age 1. Uncertainties associated with the recruitment were implemented by including residuals in the simulated data. The model can include cod as predator and one or more prey species. The simplest version of the model that includes only cod and capelin was used in this study. Capelin are modeled using statistical properties, to allow for a realistically varying capelin biomass. Capelin is an important factor in influencing cod stock development, as cod cannibalism has been higher in years with low capelin stocks. Although the model does not explicitly include the concept of carrying capacity, the capelin abundance impacts on the cod growth and (negatively) on the cod cannibalism, and thus acts a proxy for good and poor environmental conditions. The outline of the model structure is presented in Figure 1. Water temperature Residual natural mortality Fishing pattern Harvest control rules Recruitment at age 1 Total stock biomass Total abundance Fishable stock abundance Fishable stock biomass Spawning stock biomass Fishing mortality by age Yield Weight by age in catch Weight by age in stock Length by age Maturation ogive Ration Fatness Cannibalism Cod biomass at age 1-5 Capelin stock biomass Input data Model outputs Figure 1. Structure of the STOCOBAR model 86
87 Results and discussion Management scenarios in the model differed only in the degree of limitation on interannual variations in TAC for cod. A total of 9 management scenarios were used for a modelling testing. There was no limit for year-to-year changes in TAC in the basic scenario, in other scenarios its limits (±) were as follows: 5 %, 10 %, 15 %, 20 %, 25 %, 30 %, 40 % and 50 %. The length of the modeled period was 120 years for each model run. The results obtained for the first 20 years of the modeled period were not taken into account in order to reduce the impact of initial values of starting year on model outputs. It should be noted that these approximate to the actual Barents Sea cod HCR, but are not identical. The three year forecast specified in the HCR is not applied (F is simply applied to current biomass to obtain TAC), and the floor of F=0.3 is not implemented here. The results for three scenarios, the base case (no limit on catch variation), one with a 20% constraint and one with a 10% annual constraint, are shown in Figures 2-4. The biomass becomes increasingly unstable as constraints are tightened, with much higher peak to trough variations. As a result the TAC also becomes more variable. This increase in variability in TAC is the opposite of the intended effect of the catch constraint. It can be seen that increasing the severity of the constraint raises the variability in F (Figure 4). This is to be expected, the purpose of the constraint is to allow variations in F. However the high spikes at times of declining biomass are concerning, and could raise the risk of stock collapse. Figure 2. Fishable (3+) stock biomass under 1. no interannual restriction on catches, 2. 20% interannual restriction and 3. 10% interannual restriction on catches. Average values over 25 iterations. 87
88 Figure 3. TAC under 1. no interannual restriction on catches, 2. 20% interannual restriction and 3. 10% interannual restriction on catches. Average values over 25 iterations. Figure 4. TAC under 1. no interannual restriction on catches, 2. 20% interannual restriction and 3. 10% interannual restriction on catches. Average values over 25 iterations. 88
89 A more detailed analysis of the 10% rule is presented in Figure 5, showing how the stock biomass and F vary through time. It can be seen that F becomes out of sync with the stock, rising during times of stock decline, and peaking at low stock levels before dropping rapidly once Bpa is reached Stock biomass, millions tons Modelled period, years Fbar commercial stock fishing mortality rate Figure 5. Commercial (3+) stock and fishing mortality through time under a 10% constraint on rate of change in TAC, and give higher average stock biomass, SSB and recruitment. Tables 1 and 2 show the overall performance under a range of stability constraints. It can be seen that increasingly strict constraints raise the overall catch. However they also increase the likelihood of moving beyond the limit reference points, both in terms of Fpa and Bpa. The extra average yield and biomass comes from the more extreme peaks induced on the stock, while the extra risk comes from the more extreme troughs. 89
90 Table 1. Stock parameters (Total 3+ Stock Biomass; Spawning Stock Biomass; TAC; Recruitment) under different interannual constraints. Parameter Limitation on interannual variations in TAC (±) no 50 % 40 % 30 % 25% 20 % 15 % 10 % 5 % TSB, mil. t 2,27 2,25 2,30 2,25 2,37 2,56 2,78 2,99 3,17 SSB, mil. t 1,08 1,07 1,09 1,06 1,13 1,24 1,38 1,49 1,63 TAC, thous. t 684,1 678,5 691,1 667,7 701,5 752,7 805,0 836,2 800,5 R, mil. specimens 700,4 690,2 704,7 680,4 707,8 733,9 743,5 764,1 755,2 Table 2. Perfomance against different reference points under different interannual constraints (%). Limitation on interannual variations in TAC (±) Parameter / Reference point None 50 % 40 % 30 % 25% 20 % 15 % 10 % 5 % F bar >F pa (0,40) 0,0 0,0 0,2 2,4 10,4 17,0 24,2 23,5 20,1 F bar >F lim (0,74) 0,0 0,0 0,1 0,1 0,3 2,4 6,5 8,7 8,3 SSB <B pa (460 тыс. т) SSB <B lim (220 тыс. т) 0,65 0,3 1,0 1,4 3,1 8,1 15,7 19,7 18,3 0,0 0,0 0,1 0,1 0,3 0,7 3,4 6,5 5,4 90
91 Conclusions Overall it can be seen that it is not necessarily true that stability constraints on TAC in the HCR will actually stabilize TACs. In the example presented here they have had the opposite effect over the long-term. This arises because the mismatch between F and stock size acts to accentuate the natural swings in the biomass. It is also not necessarily the case that stability constraints will lower overall catches. In the example here the effect is driven by cycles in the capelin population (a proxy for swings in carrying capacity). The ideal response to variations in stock size driven by variations in carrying capacity would be to fish lightly while the stock was rising (i.e. the stock is below Bmsy, allow it reach its Bmsy level as rapidly as possible) and then fish hard while the stock declines (i.e. the stock is now above Bmsy, fish it down rapidly to that level to avoid loosing yield). The interannual stability constraints inadvertently achieve exactly this. At the same time, the high F during times of stock decline intensifies that decline, and raises the risk of breaching limit reference points. This study did not look at methods of mitigating this risk, but there a number of (not exclusive) possibilities. Imposing a ceiling on F (e.g. F shall not rise above 0.6 ) would prevent the spikes in F seen during stock decline, and hence reduce the risk of collapse. A different approach might be to suspend the stability constraints at level above Bpa. The 3 year look ahead in the Barents Sea cod HCR achieves a similar result via a different method: if the stock is currently above Bpa but on a steeply downward trend the HCR will curtail F before Bpa is actually reached. It is also important to note that different drivers of stock size may interact with stability constraints in different ways. In this modeled example the key driver was capelin biomass, which could be considered a proxy for carrying capacity, productivity or general environmental conditions. In other stocks, or other model formulation for the same stock, different drivers could be key. For example a stock could be primarily controlled by variations in fishing mortality, in recruitment or in predation. It is therefore important that the models selected to evaluate a given HCR should be designed to capture the key dynamics operating on that particular stock. This is a single example from a single parameterization of a single model, and we would not suggest changing management of the Barents Sea cod based on this study. However it does highlight a number of general points that should be considered when designing and analysing HCRs containing stability constraints. 91
92 1. Stability constraints may or may not actually reduce variability in the catch, and should not be included without a careful examination of their effects 2. The perceived impact of stability constraints may be different between single species and multispecies models. MSEs of such HCRs should not be conducted in a purely single species context 3. HCRs with a stability constraint should also include a ceiling on F to avoid dangerously high fishing mortality at times of declining stock 4. HCRs with a stability constraint should include mechanisms to reduce the risk of going below Bpa. Reference: Howell, D., Filin, A. A., Bogstad, B., and Stiansen, J. E Unquantifiable uncertainty in projecting stock response to climate change: example from NEA cod. Journal of Marine Science,doi: /
93 Session 2 contribution 8: Evaluating a harvest control rule of the NEA cod considering capelin By A. Filin (PINRO) Paper EVALUATING A HARVEST CONTROL RULE OF THE NEA COD CONSIDERING CAPELIN A.A. Filin, PINRO INTRODUCTION Northeast Arctic cod (Gadus morhua) and capelin (Mallotus villosus) are key species for both fisheries and ecosystem in the Barents Sea. These species are connected by trophic interactions. Cod is the main predator on capelin, and capelin is the main prey for cod (Gjøsæter et al., 2009). Therefore, the capelin stock is managed to ensure that the capelin provides an adequate food resource for the cod. The current harvest control rule (HCR) for capelin incorporates consumption of capelin by cod, taking uncertainties into account (Gjøsæter et al., 2002). However, the current harvest control rule (HCR) for cod, unlike that for capelin, ignores multispecies consideration. Capelin is a principle food source for cod, and an inverse relationship between capelin abundance and cod cannibalism has been observed (Gjøsæter et al., 2002). Cod recruitment to the fishery at age 3 correlates inversely with cannibalism on the young fish (Yaragina et al. 2009). Consequently, changes in capelin stock size may alter the overall cod mortality due to cannibalism, and hence lead to changes in cod stock size. Apart from this, both the rate of growth of Northeast Arctic cod and the age at which the fish become mature are also influenced by capelin abundance (Hylen et. al., 2008). Cannibalism is an important population mechanism to control the cod abundance in response to environment variations. Although the young cod is a prey item for many predators in the Barents Sea, cannibalism is a major contribution to the total natural mortality of the Northeast Arctic cod at age 1-3 (Dolgov, 1999; Bogstad et. al, 2000). Mortality of juvenile cod induced by cannibalism may strongly influence the year-class strength. Thus, in , when the capelin stock was low, cannibalism reduced the 1985 and 1986 yearclasses, which were very abundant as 0-group while abundance became much lower than average at age 3 (Hylen et. al., 2008). 93
94 There is growing interest in implementation of the multispecies considerations for the cod fishery management. One example is the request in 2015 from the Russian-Norwegian Fisheries Commission to ICES to evaluate a cod HCR with decreased cod fishing mortality when cod stock size is high and capelin stock is low. ICES performed this evaluation by using a single-species model (ICES, 2016). However, evaluation of cod HCRs that take capelin into account cannot be fully considered if a single-species model is used, this would require multispecies modelling. Inclusion of capelin as a management element in cod HCR is relevant not only due to interaction between these two stocks, because the impact of cod as a predator on other commercial species increase when capelin stock is low. The aim of this study is a multispecies model evaluation of long-term effects of capelin-dependent HCRs on cod stock dynamics and harvesting. MATERIAL AND METHODS The multispecies STOCOBAR model (Filin, 2005) was used in this study. Although all multispecies models for the Barents Sea are able to simulate the interaction between cod and capelin, only STOCOBAR is currently suitable for the evaluation of the capelindependent HCR for cod. Other models are not designed for this purpose (Bogstad and Filin, 2011). STOCOBAR simulates cod stock dynamics and harvesting of cod, taking multispecies interactions and environmental influence into account (Filin, 2005; Filin, 2012; Howell et. al., 2013). This is an age-structured, single-area and single-fleet model with one-year time step. The block schema of the model is shown in Figure 1. The simplest version of the model that includes only cod and capelin was used in this study to focus on evaluation of interactions of these two species. The cod stock dynamics are described through modelling cod growth, feeding, maturation, recruitment, cannibalism and fishing mortality. All these processes are influenced by temperature, which is present in the model via a temperature scenario. Capelin impacts on cod stock dynamics through the changes in cod growth, feeding, maturation and natural mortality induced by cannibalism. Capelin also influences the cod stock indirectly through changes in fishing mortality rate when a capelin-dependent HCR for cod is used in simulations. The simulation of capelin stock dynamics, unlike the process-oriented simulation of cod stock, is based on statistical links only. According to the historical data annual variations 94
95 in stock size of capelin depends concurrently on cod spawning stock biomass and capelin stock size in previous year (Figure 2). This relationship was applied together with the acoustic survey data for capelin, to simulate capelin stock biomass. There is a low probability of the appearance of a large capelin stock if cod spawning stock in previous year was high. Figure 2 also shows that the capelin stock is mainly above average if its size in the previous year was more than 3 million tonnes. Based on the above, the available historical data on capelin stock biomass were split into four groups, depending on being above or below 500 thousand tonnes cod spawning stock biomass in previous year, and above or below 3 million tonnes capelin stock biomass in previous year. To produce capelin stock projections, historical replicates are drawn with equal probability from these four datasets depending on modelled cod and capelin stocks in previous year. This procedure is repeated for each modeled year. Capelin stock Cod stock HCR (management scenario) Cod recruitment, growth, feeding, maturation and natural mortality Temperature scenarios Figure 1. The block schema of the STOCOBAR model. 95
96 Figure 2. Capelin stock biomass vs. cod spawning stock biomass (SSB) in previous year. Observed data, (ICES, 2015). Large brown circles denote years when capelin stock biomass in previous year was > 3 million tonnes. A stochastic temperature scenario is applied in the model. The data on water temperature of the Kola section for the period from 1951 to 2014 were used for simulation of the interannual dynamics of the water temperature in the Barents Sea. This is based on consecutive random selection from 3 historical datasets corresponding to cold, moderate and warm periods. The warm period included years when the annual mean temperature of the Kola Section exceeded 4.2 C, the cold period included years when the annual mean temperature was below 3.6 C and the moderate period included intermediate values of the annual mean temperature. The duration of such periods varied randomly between 1 to 5 years. A stochastic Ricker recruitment equation was used to couple spawning stock biomass of cod and abundance at age 1. Uncertainties associated with the recruitment were implemented by including residuals in simulated data. Cod mortality caused by cannibalism depends in the model on capelin stock biomass, cod stock size and age composition. Temperature can also influence simulated cod consumption by cod, through temperatureinduced changes in cod feeding activity (Filin, 2012; Howell et. al., 2013). In order to make the model more realistic, limitations on mortality rate due to cannibalism were introduced. Based on the model tuning, the maximum levels of cannibalism mortality for cod at the age 1, 2 and 3 were taken equal to be 85%, 60% and 40% respectively (the mortality was calculated as a ratio of cod number consumed by cod during the year to its modeled number at the beginning of a year). 96
97 The model parameters are estimated by fitting the modeled data to the observed data on cod abundance, weight, length, maturation, fatness and diet. The historical data were used for the model tuning. These data were derived from the report of the ICES Arctic Fisheries Working Group (ICES, 2015), the Russian-Norwegian database on the diet of cod in the Barents Sea (Dolgov et. al, 2008), and PINRO database on water temperature in the Kola Section. The cod HCRs, which correspond to the request of the Russian-Norwegian Fisheries Commission to ICES, were chosen for the model evaluation (ICES, 2016). Two categories of harvest control rules for cod were tested. One category, the basic HCR, corresponds to the existing management strategy, without taking capelin into consideration. This HCR is based on the precautionary approach (if cod SSB Bpa then Fbar set equal to 0.40; if SSB < Bpa, then F is linearly reduced to F equal to 0 at a SSB equal 0 tonnes). Another category, capelindependent HCR, included additional management action: if capelin stock is less than or equal to 1 million tonnes then if cod SSB 2Bpa but 3Bpa, F is linearly increased from F = 0.40 at SSB = 2*Bpa to F=0.60 at SSB=3Bpa; if SSB 3Bpa then F=0.60. Both HCRs were investigated in two variants: 1 - without any constraint on year-to-year changes in TAC (rules 5 and 9, respectively, in 2015 JNRFC request to ICES) 2 - with +/- 20% constraint on year-to-year changes in TAC when SSB > Bpa, min F=0.30. (rules 4 and 8, respectively, in 2015 JNRFC request to ICES) 100 model runs for each HCR were made. Duration of the modelled period was 120 years. To avoid the influence of the initial data, the first 20 modelled years were excluded from calculations of the mean long-term values. To focus on the investigation of consequences of inclusion of capelin in cod HCR, uncertainties associated with fishery management and cod stock assessment were not implemented in model estimations. The temperature scenario was set the same for all model runs to exclude temperature impact on comparative assessment of investigated HCRs. Fishing selectivity (fishing pattern) for cod was set as fixed in the model and corresponds to the values in the starting year. In order to make the model more realistic, the restriction on maximum fishing mortality rate, when the constraint on interannual variation in TAC is used (Fbar), was set equal to be 1.7 (the current HCR has no a limitation on the upper level of Fbar). 97
98 RESULTS AND DISCUSSION To be sure that model works realistically, a simple reality check was performed. The mean values of the modelled and observed stock characteristics were compared. The historical period was chosen for the model testing due to two reasons. Firstly, this period is long enough for calculation of comparative mean values, taking fluctuation in capelin and cod stocks dynamics into account. Secondly, the time-series since 2007 was not used in the model parameterization. Applying fully independent data in the model testing would make results more credible. In our case, the use of historical data of for the model testing is a reasonable compromise between the competing demands of a long enough duration of the historical period and a desire to apply an independent time-series that was not used in the model tuning. Table 1 shows the model outputs compared with the observations. Mean values over 100 model iterations were used in comparison. Temperature and fishing mortality rate for these simulations were taken from the observed data. Result of the testing allows us to consider that STOCOBAR simulations as being reasonably realistic, accounting the stochastic approach to simulations of the cod recruitment and the capelin stock biomass. The discrepancy between mean values of the modelled and observed stock characteristics is mainly within ± 10%. Table 1. Comparison of the modelled and observed stock parameters. 98
99 Mean annual values for the Modelled Observed Discrepancy, Stock characteristics (ICES, 2015) (%) Fishable stock biomass, million tonnes 2,27 2,31-1,95 Spawning stock biomass, million tonnes 1,01 0,94 7,6 Recruitment at age 3, million individuals 605,0 700,5-13,6 Fishable stock abundance, 10 9 individuals 1,64 1,96-16,1 Average body weight at age 4-6, kg 1,36 1,28 6,2 Portion of mature fishes at age 6, % 28,2 31,3-9,9 Portion of mature fishes at age 7, % 62,0 63,3-2,0 TAC (Landings), thousand tonnes 568,5 613,2-7,3 Capelin stock biomass, million tonnes 2,38 2,61-8,8 The simulated long-term changes in cod fishing mortality rate (Fbar) and total allowable catch (TAC) under the different HCRs are shown in Figure 3. The mean values for the 100 iterations are considered. It can be seen that the capelin-dependent HCR, in comparison with the basic HCR, demonstrates changes in both these parameters. The top and bottom levels of the fluctuations of these parameters increases if capelin-dependent HCR is used in simulations. The discrepancies between the basic HCR and the capelin-dependent HCR regarding Fbar and TAC are more pronounced if constraint on TAC variation is applied. The simulations indicate mainly a marginal difference in cod stock dynamics under the two HCRs if the constraint on changes in TAC is not applied. However, if 20% constraint on TAC variations is used in simulations, difference in cod stock size between the two HCRs becomes more pronounced (Figure 4). The long-term dynamics of cod recruitment at age 3 is similar for the two HCRs if constraint on TAC is not used in simulations. Cod recruitment increases if the capelin-dependent HCR is used alongside a restriction on variations in TAC (Figure 5). Cod mortality induced by cannibalism decreases in response to the inclusion of capelin in cod HCR. This is particularly true if the constraint on TAC variation is used in simulations (Figure 5). According to the simulations, inclusion of capelin in the cod HCR does not affect growth and maturation of cod (Figure 6). The capelin-dependent HCR for cod lead in the model to a rise in capelin stock only if constraint on TAC is used (Figure 7). 99
100 No constraint on variation in TAC Fbar % constraint on variation in TAC 0.5 Fbar TAC, 1000 tonnes No constraint on variation in TAC TAC, 1000 tonnes % constraint on variation in TAC Duration of the modelled period, years HCR capelin dependent HCR basic Figure 3. Simulated long-term dynamics of cod fisheries mortality rate (Fbar) and total allowed catch (TAC) under the different HCRs. Average values for the 100 iterations 100
101 SSB, 1000 tonnes No constraint on variation in TAC SSB, 1000 tonnes % constraint on variation in TAC FSB, 1000 tonnes No constraint on variation in TAC FSB, 1000 tonnes % constraint on variation in TAC Duration of the modelled period, years HCR capelin dependent HCR basic Figure 4. Simulated long-term dynamics of the cod spawning stock biomass (SSB) and fishable stock biomass (FSB) under the different HCRs. Average values for the 100 iterations. 101
102 Recruitment, mln. ind. Recruitment, mln. ind No constraint on variation in TAC % constraint on variation in TAC Annual mortality, % No constraint on variation in TAC Annual mortality, % % constraint on variation in TAC Duration of the modelled period, years HCR capelin dependent HCR basic Figure 5. Simulated long-term dynamics of the cod recruitment at age 3 and mortality due to cannibalism at age 3 under the different HCRs. Average values for the 100 iterations. 102
103 1.4 No constraint on variation in TAC Weight, kg % constraint on variation in TAC Weight, kg No constraint on variation in TAC Portion, %% % constraint on variation in TAC 0.7 Portion, %% Duration of the modelled period, years HCR capelin dependent HCR basic Figure 6. Simulated long-term changes in average body weight of cod at age 4-6 and portion of mature fishes at age 7 under the different HCRs. Average values of the 100 iterations. 103
104 Stock biomass, 1000 tonnes No constraint on variation in cod TAC Duration of the modelled period, years HCR capelin dependent HCR basic Stock biomass, 1000 tonnes % constraint on variation in cod TAC Modelled period, years HCR capelin dependent HCR basic Figure 7. Simulated long-term dynamics of the capelin stock under the different HCRs. Average values for the 100 iterations. The modelled long-term consequences of a replacement of the basic HCR of cod by the capelin-dependent HCR are summarized in Table 2. The model evaluations conducted here show that only negligible changes in growth and maturation rate of cod is likely to be induced by capelin-dependent HCR. These changes cannot affect cod stock dynamics. We could expect a decrease in cannibalism, particular if constraint on TAC interannual changes is used. Cod stock biomass will change insignificantly in the long-term perspective in spite of a rise in the fishing mortality. TAC of cod could be expected to increase if a constraint on its year-to-year changes is introduced. The simulated capelin stock size demonstrates growth of around 10%, but only if a constraint on changes in the cod TAC is used. 104
105 Modelling results support the assumption that the HCR that includes increasing cod fishing mortality when cod SSB is high and capelin stock is low will facilitate keeping a balance between stock of cod growth and its food supply. This will lead to a decrease of cannibalism in cod stock and therefore to an increase in recruitment at age 3. As a result, increased fishing mortality of cod will be compensated, at least partly, by increased recruitment. This explains why the impact of increasing Fbar on cod stock size would be less pronounced if the capelin-dependent HCR of cod is to be used instead of the basic HCR. The Table 3 shows changes in variability of the cod TAC and SSB depending on the choice of HCR. The coefficient of variation and mean interannual changes in TAC increase significantly if a capelin-dependent HCR with TAC constraint is used in the simulations. This is caused by a rise in the probability of decline of cod SSB below Bpa., and in this situation the constraint on the variation in TAC is suspended. The last leads to interannual changes in TAC that are greater than the specific constraint in the HCR. For this reason, the mean value of the variability in the TAC increases. A rise in the number of years in which cod SSB falls below Bpa is related to fluctuations in the cod stock dynamics. The amplitude of these fluctuations increases in the model when the capelin-dependent HCRs for cod is used. In this case, the proportion of young individuals in the cod stock increases due to an increase in fishing mortality and a reduction in cannibalism. The TAC is expressed in units of biomass, but fishing mortality is related with units of numbers. Thus, if a constraint on variability in TAC is in place, the interannual changes in Fbar increased as the proportion of young cod in the cod stock increased. Increased variability in Fbar would lead to increased variability in stock size, which results in a rise in the probability of decline of the cod SSB below Bpa. 105
106 Table 2. Simulated long-term consequences of using the capelin-dependent HCR instead of the basic HCR. Stock parameters No constraint on TAC 20% constraint on TAC Cod growth rate *No change No change Cod maturation rate No change No change Cannibalism in cod stock Decrease Decrease Cod fishable stock biomass **Decrease insignificantly **Increase insignificantly Cod spawning stock biomass Decrease insignificantly No change Cod fishing mortality Increase insignificantly Increase Cod TAC No change Increase (around 8%) Capelin stock biomass No change Increase (around 10%) *No change means the discrepancy between the mean long-term values within ± 1,5%. **Decrease (Increase) insignificantly means the discrepancy between the mean long-term values within ± 4%. Table 3. Comparison of variability of simulated cod SSB and TAC. Average values for the No restriction on variation 20% restriction on variation Parameters in cod TAC in cod TAC HCR basic HCR capelindependendependent HCR basic HCR capelin- Coefficient variation of TAC 23,3% 27,3% 25,4% 37,8% Mean interannual changes in ±8,1% ±10,3% ±8,9% ±12,3% TAC Probability of SSB < Bpa 0,2% 0,3% 0,8% 8,9% 100 iterations. 106
107 The underlying cause of increases in the long-term mean TAC of cod under the constraint on its interannual variation was considered in a previous study (Filin, 2015) and described in Filin and Howell in this volume. When HCRs limit variations in TAC, the fishing mortality of cod is reduced below Fpa when the stock increases and vice versa, it rises above Fpa when the stock decreases. This results in a more rapid adaptation of the population to changes in the environmental conditions. The stock tends to increase when the ecosystem conditions are favorable for the development of abundant year-classes and there is a sufficient food supply to satisfy food demands for the increasing population of cod. Therefore, when the cod stock increases, the decrease in the fishery rate allows the population to efficiently use the ecosystem potential to increase its abundance faster and to a greater extent. The limitation on TAC for cod that results in an increase in its fishing mortality when the commercial stock decreases allows the cod population quickly reaches the level corresponding to the carrying capacity. This rise in catch should give no additional risk for the reproductive potential of the population because the limitations on TAC only take effect if SSB exceeds Bpa. As a result, the mortality of cod juveniles caused by cannibalism, as well as adverse impacts on the growth and maturity of fish under insufficient food supply are reduced. In the model, the capelin stock size can be considered as a proxy of the carrying capacity. The obtained results show that the capelin-dependent HCR of cod would increase effect of the constraint on variation in TAC, which are described above. This is because the additional increase in fishing mortality of cod takes place mainly when the stock is around a maximum level or decreases. In general, the results of the performed model analysis allow us to conclude the following: 1. Increase of cod fishing mortality from F=0.40 to 0.60, when cod SSB is high and capelin is low will not have negative long-term consequences for cod stock and cod fishery. 2. This will not lead to major changes if constraint on interannual variations in cod TAC is not introduced. 3. This will support increased long-term mean of cod TAC and capelin stock, but will reduce stability of cod TAC, if 20% constraint on interannual changes in TAC is applied REFERENCES 107
108 Bogstad B., Haug T. and Mehl S Who eats whom in the Barents Sea?: NAMMCO Sci. Publ. 2: Bogstad B, Filin A.A Multispecies and ecosystem modelling as tools for fishery management. Chapter 12.1 in: Jakobsen T, Ozhigin VK, editors. The Barents Sea. Ecosystem, Resources, Management. Half a Century of Russian-Norwegian Cooperation. Trondheim: Tapir Academic Press, p Dolgov AV The impact of predation on recruitment dynamics of the Barents Sea cod. In: Biology and Regulation of Fisheries of Demersal Fish in the Barents Sea and North Atlantic. Murmansk: PINRO Press. P (in Russian). Dolgov A.V, Yaragina N.A., Orlova E.L. Bogstad, B., Johannesen, E.,and Mehl, S th anniversary of the PINRO-IMR cooperation in the investigations of feeding in the Barents Sea. Results and perspectives / // Long-term Bilateral Russian-Norwegian Scientific Cooperation as a Basis for Sustainable Management of Living Marine Resources in the Barents Sea: proc. of the 12th Norwegian-Russian Symposium (Tromsø, August 2007) / IMR, PINRO; ed. T.Haug [et al.]. Bergen, p Gjøsæter, H., Bogstad, B., and Tjelmeland, S Assessment methodology for Barents Sea capelin, Mallotus villosus (Mueller). ICES Journal of Marine Science, 59: Gjøsæter, Harald, Bogstad, Bjarte and Tjelmeland, Sigurd Ecosystem effects of the three capelin stock collapses in the Barents Sea',Marine Biology Research,5:1,40 53 Filin AA STOCOBAR model for simulation of the cod stock dynamics in the Barents Sea considering the influence of ecosystem factors. In: Ecosystem Dynamics and Optimal Long Term Harvest in the Barents Sea Fisheries. Proceedings of the 11th Russian- Norwegian Symposium, Murmansk, August Murmansk: PINRO, p Filin A.A Modelling of the relationship between cod and capelin in the Barents Sea ecosystem: theoretics and practical importance. / A.A. Filin // Voprosy rybolovstva, Vol. 13, Issue No. 2 (50), p (in Russian). Filin A. A The impact of interannual limitation of the Barents Sea cod catches on its stocks dynamics. /A.A. Filin // Fisheries , p (in Russian). 108
109 Howell, D., Filin, A. A., Bogstad, B., and Stiansen, J. E Unquantifiable uncertainty in projecting stock response to climate change: example from NEA cod. Journal of Marine Science, doi: / Hylen A., Nakken O. and Nedreaas K Northeast Arctic cod: fisheries, life history, fluctuations and management. In book Norwegian Spring-spawning Herring and Northeast Arctic Cod, 100 Years of Research and Management Nakken O. (editor). P ICES Report of the Arctic Fisheries Working Group // ICES CM /ACOM: p. ICES Report of the second workshop on Management Plan Evaluation on Northeast Arctic cod and haddock and Barents Sea capelin (WKNEAMP-2), January 2016, Kirkenes, Norway. ICES CM 2016/ACOM: pp. Yaragina NA, Bogstad B, Kovalev YuA Reconstructing the time series of abundance of Northeast Arctic cod (Gadus morhua), taking cannibalism into account. In: Haug T, Røttingen I, Gjøsæter H, Misund OA, guest editors. Fifty Years of Norwegian- Russian Collaboration in Marine Research. Thematic issue No. 2, Marine Biology Research 5:


110 Session 2 contribution 9: The rise of the beaked redfish By B. Planque (IMR) Presentation 110


111 111


112 112


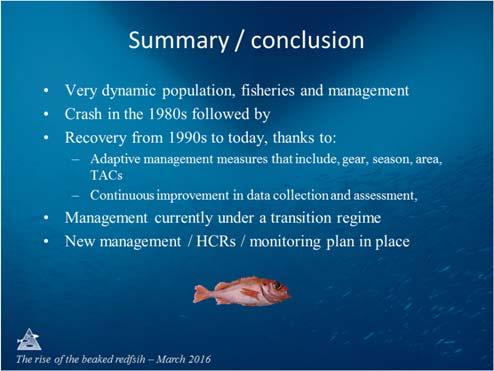
113 113
114 Theme session III: Sustainable and optimal management Session 3 contribution 1: HCRs - Norwegian managers' perspective By P. Gullestad (Norwegian Directorate of Fisheries) Paper Invited talk The 17 th Norwegian Russian Symposium Long term sustainable management of living marine resources in the Northern Seas Harvest Control Rules a manager s perspective Specialist director Peter Gullestad For more than a hundred years, overfishing has been recognized as a potential management problem, and ICES established a special Committee dealing with the topic already in However, the two World Wars and lack of international agreements on shared stocks was important reasons why it took more than 70 years to get a scientific advisory system for fisheries management into routine operation. Fig 1 The change came with the new Law of the Sea regime. From the mid 1970s, the ICES Liaison Committee issued annual advice for several commercially important fish stocks, and this has continued and been developed and refined by its successors ACFM (the Advisory Committee for Fisheries Management), and nowadays by ACOM (the Advisory Committee on Management). In the period , the focus was to reduce growth overfishing, and the advice was based mainly on fishing mortality reference points derived from calculation 114
115 of yield per recruit (F max, F0.1). From 1987 additional fishing mortality reference points derived from stock recruitment relationships (F med, F low, F high) were used for the advice. This reflects concerns about reduced reproduction capacity caused by too low spawning stock. The same concerns motivated introduction of the Minimum Biological Acceptable Level (MBAL) in In the period, clear and specific advice was given only in cases when the spawning stock was below MBAL. When the stock was within safe biological limits, that is above MBAL, the advice was left open to the manager s choice; phrases like the stock sustains current fishing were used when the situation appeared rather stable, or no long term gain in increasing F in cases when F was well above F max or F med. The precautionary approach, stating that lack of full scientific certainty shall not be used as an excuse for postponing measures to prevent environmental degradation, was one of the main outcomes of the 1992 Rio Conference on Sustainable Development. For fisheries, Rio was followed up by the UN Fish Stocks Agreement and by the FAO Code of Conduct for Responsible Fisheries, both from In subsequent years, ICES through its various working groups developed limit reference points for the major fish stocks in the Northeast Atlantic. Limit reference points refer to stock specific, minimum levels of spawning stock biomass (B lim) and maximum fishing mortality levels (F lim), limits that should be avoided. To take care of the uncertainty in data and assessment models, precautionary reference points (B pa, F pa) were defined. These reference points formed the basis for introducing the Precautionary Approach (PA), and subsequently Harvest Control Rules, into the advisory process. While the limit reference points are a strictly scientific concern, in principle the precautionary limits are for management to decide, reflecting the acceptable degree of risk one is willing to take in managing a particular stock. Management bodies in the Northeast Atlantic, based on guidance from science, seem to have accepted and adopted precautionary levels generally reflecting the objective of keeping spawning stocks above B lim and fishing mortality below F lim with a probability of 95 %. In this manner uncertainty has become an argument for exercising a greater degree of caution in fisheries management. Earlier uncertainty had very often been used, not least by industry, as an argument for increasing quotas, the argument being that the stock might be larger than assessed by the scientists. Evidently, the very existence of accepted precautionary limits in combination with a general growing environmental awareness has over time led to increased political costs for non precautious or unsustainable fisheries management practices. Development and construction of Harvest Control Rules based on reference points proposed by ICES followed for major commercial fish stocks in the Northeast Atlantic. The first one I believe was for Norwegian Spring Spawning Herring, agreed on in For Barents Sea species such as cod, haddock and capelin it all started in 1997 when the Joint Norwegian Russian Fisheries Commission (JNRFC) decided that the theme of the eight Norwegian Russian Symposium, to be convened in Bergen in 1999, should be Management Strategies for Barents Sea fish stocks. 115


116 Fig 2 The symposium, with high level representation from both Norway and Russia, revealed no basic disagreement between the parties, the industries included, with regard to long term policy objectives for the management of Barents Sea stocks. For cod there seemed to be broad consensus, at least at the theoretical level, that a management strategy should include: Fig 3 116

117 It took however, another three years before the Commission in 2002 managed to agree on Harvest Control Rules for cod, as well as for haddock and capelin. In 2001, the JNRFC established a joint working group on management strategies. The group met in 2002, and delivered their first report to the JNRFC prior to its meeting in The group also met in 2003 and 2004 to evaluate and amend the HCR (the rebuilding part when SSB<Bpa) adopted by JNRFC that autumn. Personally, I consider the agreement on HCRs as one of the greatest, although still vulnerable, achievements in the development of the Barents Sea fisheries cooperation between Norway and Russia. The very short term needs and perspectives that until then had been guiding the setting of TACs, had resulted in unquestionable and well documented detrimental effects both for stocks and not least for all the people whose livelihood depend on fisheries from these stocks. Quota setting based on predetermined HCRs with a long term perspective, scientifically tested for robustness by ICES, has obvious advantages compared with the previous shortterm, ad hoc arrangements: Fig 4 Not only in theory but also in practical terms is it fair, in addition to favorable environmental conditions for Barents Sea stocks, to pay credit to the HCRs being a major contributor to the remarkable positive results in recent years. For cod and haddock, the average spawning stocks the last ten years are 2.6 and 3.5 times higher than in the previous 20 year period, at the same time producing increased average annual catches by 35 % for cod and 96 % for haddock. Does this mean that we can sit back, congratulate ourselves and pronounce, Mission accomplished? By no means. In my opinion, there are two distinct areas for improvement. 117


118 One is the need of an even stronger rooting of the HCRs in JNRFC's work than what is the case today. If we take a closer look at to which extent the Commission has actually followed its own, jointly agreed HCRs the last 13 years, the following picture emerge: Fig 5 It turns out that for cod, the Commission has set the annual TAC higher than what follows from the HCR in 5 out of 13 years, for haddock in 3 out of 13 years and lower in one year. For capelin, the situation is better, and even the one red dot in 2015 one could argue deserves a green colour. On two occasions, the agreed quotas followed from amended and presumably improved HCRs for cod and haddock, formally agreed upon by JNRFC, later tested, and found in accordance with the Precautionary Approach by ICES. For the years , the deviation from HCRs are explained by factual disagreement between JNRFC and ICES about the magnitude of IUU estimates included in ICES assessment and advice. In the period , it is however difficult to find good reasons why the HCRs have not been followed for cod and haddock in altogether 4 out of 8 cases. Let me stress that this is not a proof or a question of irresponsible setting of quotas by the JNRFC. The cod and haddock stocks have in later years been in good health and has sustained the fishing pressure. The question is rather whether it is wise to deviate from the agreed HCR, without taking the intellectual trouble of actually improving and formally agree on new and presumably better harvest control rules, as was done for haddock in 2009 and for cod in Economic theory tells us that predictable government ruling based on predetermined rules are beneficial for the economy and the well functioning of markets. This should certainly be the case for the decisions on TACs in fisheries, already subject to so much uncontrollable uncertainty from sources in both nature and global markets. 118


119 The setting of TACs will always be subject to lobbying and pressure from short term needs and interests, needs that are easily conflicting with the long term interests of the Parties. In my opinion, the deviation from HCRs in recent years is a reflection of the fact that our joint Barents Sea fisheries management after 40 years is still a young, vulnerable and developing cooperation. Having said this, such immaturity is by no means a rarity for the Norwegian Russian cooperation. In the European Union, as an outcome of the 2013 reform of the Common Fisheries Policy, legal steps have been taken to limit the Council of Ministers' well known practices of horse trading and frequently agreeing on quotas at unsustainable high levels. Fig 6 The wording of the CFP-Regulation indicate that the EU has a longer way to go than what is the case of the Joint Norwegian-Russian Fisheries Commission, but the question still remain: Harvest Control Rules, are they really rules or are they only guidelines? My position is clear. Although I can foresee the exceptional cases, where for good and welldocumented reasons the decision on TAC could deviate from the HCR, I firmly believe it is for the common good to stick to the rules until formally amended, and not treating them as just guidelines. In this respect, there is still a job to do for all good forces from both Parties, in science, in industry, in management and at the political level. Now, turning to the question of possible improvements in HCRs I will firstly stress that improvements in data, models, assessments and predictions to reduce uncertainty are probably even more important for better management than changes in present HCRs. 119
 of possible large")
120 Fig 7 Secondly, I have a statement or maybe a question to science about the three-year rule for cod. In addition to curbing real stock-fluctuations, which I assume is good for industry and market, it also function as a precautionary measure moderating the effect (both up and down) of possible large unexpected errors in last assessment. Thirdly, I have a question to industry about their general experiences with the 10/25 % rule related to market planning, prices, stability and so on. Finally to science about the effect of this provision if the HCR was not adhered to the previous year(s). Do you risk being on the wrong development path for future stock and quotas? The management strategies for cod and haddock have the objective maximizing the long-term output from the stocks. The strategies do not specify whether it is tons or rubles and kroner we are talking about, that is Maximum Sustainable Yield (MSY) or Maximum Economic Yield (MEY). However, commercial fishers do not fish for fun or food; they fish to earn an income. In my opinion, we are talking about money and therefore Ftarget in the HCR should in principle rather be Fmey than Fmsy. In the case of a single species HCRs, what is the practical implications of this? 120

121 Fig 8 For demersal stocks the catching costs per kilo may be reduced with increasing stock levels. This is certainly an important factor behind improved economic results of demersal fleets in recent years. Because of schooling behaviour the same effect is not always so salient for pelagic fisheries. A positive discount rate means that a catch of one kilo today has a higher value than a kilo tomorrow or next year. For the individual fisher with economic problems the discount rate can be extremely high; a bird in the hand is better than two birds in the bush (in Norwegian the proverb reads even clearer: a bird in the hand is better than ten birds on the roof). For society as a whole however, the rate is much lower. It could even be argued that for a perpetual renewable common resource like fish society s discount rate should be set to 0. The short term political pressure to increase TACs may best be analyzed and understood as a result of differences in discount rates. The two different forces pushes MEY away from MSY but in opposite directions, and the difference between single species MSY and MEY are in most cases probably minor, at least compared to the usually large uncertainty in scientific assessments and stock projections. This means that it may be permissible not to take economics explicitly into the calculation of Ftarget. Even more so since Fmsy seldom is a clear peak on the yield curve, it is most often a range, and economic considerations may be included when deciding on a target value within the range. The yield curve for haddock may illustrate the point. The curve is flat for F values between 0,4 and 0,5 and nearly flat for all F values between 0,35 and 0,6 (values with higher yields than 97,5 % of Fmsy). Fpa=0,47 is however representing an upper limit for a permissible target F, leaving the choice of target F to the range between 0,35 and 0,
122 Fig 9 So far I have not touched upon species interactions. We already have some information and knowledge of these interactions which are integrated in fisheries management, in particular the codcapelin relationship. And we will definitely know more of the kind in the future. For management it will however, still be the case that TACs have to be set for each individual species. The question is then how such multispecies knowledge could possibly affect Ftarget in HCRs for individual species. I have one example. The HCR for Northeast Arctic saithe was established in 2007 after a thorough and lengthy discussion about whether or not multispecies interaction should be taken into account. The process started in 2004 with a joint working group report from the Institute of Marine Research (IMR) and the Directorate of Fisheries (DoF) discussing optimal HCR in a single species context, whereas additional elements like multispecies interaction, price formation for saithe and harvesting costs were discussed on a qualitative level. The report, arguing for a HCR with a target F=0.30, was sent on public hearing. The industry, quite rightly pointed to the fact that the simulations had not taken into account that saithe is a predator on herring. It was argued that in a multispecies context it might be more rewarding to increase F on the predator stock, leaving a lower predator stock in the sea and thus lifting the biomass and potential yield of the prey stock. New bioeconomic simulations were made including predation on herring, indicating a possible but still marginal increase in overall economic yield from the two stocks by increasing F for saithe to a level between 0,30 and 0,35. However, considering the increase in risk by setting Ftarget=Fpa=0,35 IMR/DoF maintained their advice of Ftarget=0,30. It is part of the history that the Ministry finally decided on Ftarget=0,35, a decision which were eventually amended to 0,32 in In general terms: 122


123 Fig 10 Summing up, the HCRs consist of two basic elements. It is a target F with mechanisms for reduction when B<Bpa, and it is mechanisms to curb annual variation in TAC. With regard to the latter, the 3 years average for cod assimilates expected stock changes two years ahead, and is furthermore a safety measure against unexpected large errors in assessment and predictions. The 10/25 % provision is equally a safety measure, in addition to curbing large variations in annual TAC that very often may be unfortunate from a market perspective. With regard to the implications of MSY, MEY and multispecies considerations on target F, my considerations may summarize as follow: Fig 11 Thank you for your attention 123
 Paper Invited talk Good morning, my name is Jan Ivar Maråk, and I have worked for the Norwegian fishing vessel owners association, or Fiskebåt, for")
124 Session 3 contribution 2: HCRs - Comments on the Harvest Control Rules in the Barents Sea By J.I. Maråk (Norwegian Fishing Vessel Owners association) Paper Invited talk Good morning, my name is Jan Ivar Maråk, and I have worked for the Norwegian fishing vessel owners association, or Fiskebåt, for nearly 30 years. Fiskebåt organizes the majority of the seagoing fishing vessels in Norway, and is also a part of the Norwegian Fishermans Association, Norges Fiskarlag. I have been in charge of the whitefish sector most of this time, and have been watching what is happening in the Barents Sea with special interest. During this period we have had a lot of interesting discussions with the Institute of Marine Resources (IMR), not least with regards to the harvest control rules. I will try to give some comments from the fishing industry on harvest control rules. 124


125 Let me initially ascertain you that the fishing industry welcomes harvest control rules. I believe the introduction of harvest control rules represent the most important breakthrough for fisheries management in recent times, both nationally and internationally. Not least eases this already difficult negotiations internationally. 125


126 With imperfect knowledge about fish biology, incomplete fishery data, natural variability, and the challenge using models to count fish in a population, stock assessments are very uncertain. That means the results can vary considerably from one assessment to another. ICES advice can therefore include a wide range of management options. Harvest control rules is important to offset the natural variability and scientific uncertainty. HCR reduces also the possibility of political influence, both nationally and internationally. Not least the past can be important in a situation where different countries have different strategies when it comes to determining TACs in quota negotiations. An example of this is some countries strategy in the mackerelnegiotiations, where they advocate a low total quota of mackerel to ensure continued large mackerel stock and presence in their own waters. It is of course also many other benefits of HCR. Not least that they implement the precautionary approach. HCRs also helps to avoid that most of the time in international fisheries negotiations is occupied by discussions of the TACs. It frees time to discuss other challenges, and it also helps to contribute to a better climate in the negotiations. 126


127 HCR provides market predictability. There can be some controversies between the fishing fleet and the industry about how stable the quotas should be, but the disagreement are not greater than that we should be able to find compromises. Easily explained the industry and the exporters are most concerned about stable quotas for markets reasons, while the fishing fleet is more keen to follow the biology of the stock. Sverre Johansen will probably say a little more about this in the next lecture. Stability and predictability are of course also important for the shipowners when planning structuring and newbuildings. Back in the late 1980 almost all factory trawlers in Norway were renewed. The triggering factor for this was very optimistic forecasts about the cod qouta from the scientists. The new boats were delivered about at the same time as the scientists turned full retreat and recommended record low cod quotas in 1989, and especially 1990 and Many traditional fishing companies went bankrupt in the wake of this. It is still a discussion about how big the cod quota should have been in this period. What in any case is certain is that we would probably avoided this situation if we had had a reasonable HCR, and maybe better assessments. HCR is also important to provide different stakeholders insight into the background for the quota determination (although it sometimes seems that many still do not understand it), and HCR is often a condition to certify fisheries to various environmental standards, as the Marine Stewardship Council standard. 127


128 What should we require of a harvest control rule: Based on good stock assessments Has legitimacy in the fishing industry, and other stakeholders Provides maximum sustainable yield Have extraordinary mechanisms when the stock moves under certain trigger values Have stability items that also takes into account the dynamics of the fish stock I will comment on some aspects of this. There is little point to harvest control rules if stock estimates are based on incorrect data, or are very uncertain. I will stress the fact that stock assessments must be based on relevant and good survey and catch data. The managers have a responsibility to ensure that this is put in place. We have over many years experienced considerable uncertainty to the stock assessments for haddock, and is still not completely comfortable with the current situation, despite the fact that it happened a significant revaluation of the haddock stock in The capelin assessment rests on a single survey, and we have recently experienced great uncertainty about this survey, not least because of the lack of coverage of its range. 128


129 Also as regards to cod there has been great uncertainty about stock estimates, partly because of lack of coverage of its range. There have also been made, after my opinion, many more or less dubious adjustments to the assumptions in the stock model, during the years the HRC have been operated. This has not always been thrustworthy. I believe that Norway and Russia have a major responsibility to ensure that the stock assessments for the Barents Sea are reliable. It should be determined an overall and long-term plan to ensure the necessary survey and catch data for the most important stocks. It is unfortunate (outrageous) when research vessels from one of the countries are denied access to the other country's economic zones. This is not satisfactory, and we need to assure that the cooperation between the parties is predictable. Not least fish stock assessments relies on stabilizing time series. There is a strong call from the fishing industry that political authorities ensure that we avoid similar incidents in the future. It is also important to be aware that when confidence in the stock assessments are missing, it is easier to argue to waive the quotas the HCR recommend. Reliable stock estimates are therefore the most important condition for sustainable management of fish stocks. 129

130 It is important that management strategies have legitimacy in the fishing industry. A condition for this is of course that the industry has confidence in the stock assessments that underlie the result the HCR provides. Secondly, it is important that the industry can participate in the process to establish harvest control rules. I note that Norway and the EU have traditionally been better at incorporating the fishing industry in discussions on management strategies than Norway and Russia have been. (That almost nothing happen after the meetings with EU is another question ) So far we have no reason to complain about the participation of the fishing industry in this evaluation, and I hope the managers will include the fishing industry throughout the decision making process. We believe that the HCRs primarily should aim to ensure a maximum optimal sustainable yield of a stock. In determining the strategy it should be taken into account how the stock affects other stocks. For predator stocks such as cod there are good arguments to lie in the upper range for the fishing mortality that is expected to provide a maximum sustainable yield. In determining fishing mortality it can also be taken into account that big fish stocks is expected to give lower costs of fishing a fixed quota than a smaller one, but this relationship is however, not always obvious. 130


131 We have seen that there are arguments, for many reasons, to have some stability elements included in a harvest control rule (management strategies). However, we must be aware that the stronger our requirements for stability, the less will the long-term yield of the stock be (after yesterday, I am not sure if this last statement hold, but so far this has been true). Reference points are benchmarks used to compare the current status of a fishery management system to a desirable state. Limit reference points define the danger zone, the point beyond which fishing is no longer sustainable. The fishing industry accepts of course the need for action when we go beyond limit reference points. In such circumstances there should be no limitations on the year to year variations in TAC. But we may need some extra mechanisms that can bring the quotas faster back to a normal situation when the stock recovers (the 0,3 constraint for the fishing mortality in the HCR for cod is an example of this). There might of course be a discussion about how strong a rebuilding of a stock shall be, but we believe it is found a reasonable compromise around this through the mechanisms already enshrined in current rules. We will at the same time stress the need for regular evaluations of the trigger values. And we should keep in mind that both target and limit reference points are set more conservative as uncertainty increases. This illustrates again how important it is to reduce uncertainty in the stock assessment 131


132 We have previously underlined the importance of stability mechanisms in a HCR. However, there might in some cases be a difficult weighing between different interests. It should be no surprise that we find the 10% stability clause in the HCR for Northeast Arctic Cod too strict. Already when the management strategy was adopted, we argued for 20% stability clause. Funnily enough, the IMR argued against this, probably because they were afraid of too rapid growth in quotas. Our main argument was that there should be some similarity between the dynamics of the stock and stability element. If there is a big discrepancy here, we quickly run into problems. It should be noted that the objections was taken into account when the additional condition that the fishing mortality should not fall below 0.30 when the stock was sustainable was included in the HCR in 2009/2010. It is however, still a mystery why scientists only have proposed a such exception in periods of positive stock trends, and not by stock decline. We can illustrate some of our points in a figure. 132

133 The red line shows how the quota developments would have been with only a 10% rule from 2007 to 2016 (we have not included the F constraint of 0,3 here). The green line shows the ICES advice, and the blue one the approved total quota. The difference between the quota the 10% rule generates, and the TAC, amounts for tonnes (2,3 millions) of cod in the current 10 - year period. This illustrates the importance of harmonizing the HCR with the dynamics of the stock. If we get a sharp stock decline for cod, we fear that the HCR we use today might advice to high quotas in the period before the stock go beyond the reference limit points that excludes the stability clause. This is something that after my opinion should be changed in the revision of the rule. We must conclude that it has not gone too bad in the Barents Sea in recent years. Probably nature must take most of the credit for this, but we must also have confidence that the harvest control rules, and other regulations, have contributed positively. 133


134 It also implies that there isn t any need for great changes when it comes to the HCRs. We think however that it is possible to make some improvements for cod, which will also affect the other stocks. I will make some comments on this. 134
135 The investigations ICES has done shows that we have relatively wide latitude in the choice of fishing mortalities in the HCR for cod. A reduction in fishing mortality to 0.3 will give 7% less quotas on average, while an increase to 0.5 will give 4% higher quotas on average. Meanwhile, quota variations from one year to another will increase by larger fishing mortality, and average spawning stock will be reduced. Regarding the stability clause we suggest as before that it is raised from 10% to 20%. And with a 20% stability clause, I am not sure we still need the extra condition to not go below a fishing mortality of 0,30 in a normal stock situation. The three year average rule reduces the annual variations, and works as a stability element as well. We recommend that the three year rule continues in a new HCR. We also recommends to continue mechanisms that provide a lower fishing mortality when the spawning stock fall below certain values. ICES has also tested out options where fishing mortality rises when the spawning stock increase beyond certain values, or where fishing mortality increases when the capelin stock is weak. The fishing industry has previously advocated such strategies, but I'm not quite sure this is the right way to go. The more elements we include in the harvest control rules, the more complicated and unpredictable they will be. For my own part, I have concluded that harvest control rules should be made as simple as possible. We think there are good arguments for increasing fishing mortality in the HCR rule for cod from 0.4 to 0.5. Over time this will provide a higher long-term yield of cod, and it will also contribute to a higher yield of stocks that are on the cod's menu, such as capelin, shrimp, haddock and redfish. ICES has not carried out executions with fishing mortality of 0.50, and a stability element of 20%, and this should maybe be done before concluding. My only objection is whether we right now are in an unfortunate situation for changing the harvest control rules. There may be signs of heading into a situation of stock decline for cod, and it can be a bad time to increase fish mortality. Some stakeholders may use such an increase as explanation for the decline, and the new HCR will have a bad start. The reports from this 135


136 year's winter expedition on good capelin registrations and low cod recruitment was surprising, and does maybe not provide strong argument for an increase in fishing mortality now. All in all, I think that the current HCR for haddock is good, and that there is no need for changes. The results from ICES shows that there is relatively little to gain by increasing or decreasing fishing mortality. Haddock is not an big predator of other key populations, and this reduces the need for increased fish mortality. ICES have also found, not surprisingly, that the average quotas will be reduced if the current stability element of 25% is reduced. Our recommendation is therefore to retain the current HCR with a fishing mortality of 0.35 and access to 25% annual variation. We have however noted that ICES writes that the current MSY fishing mortality of 0.35 may be a conservative estimate for Fmsy for haddock. This indicates that there is nothing in the way for increasing fishing mortality to 0,

137 ICES concludes that none of the investigated changes are sustainable for capelin. This means that it is not relevant to change the 95% claim in the HCR for capelin. What is not examined is the limit reference point of 200,000 tons of spawning capelin, and this belongs maybe in a benchmark process. Anyway I have nothing qualified to say about this at this moment. I also note that ICES has not investigated whether there could be a extra condition that it always will be a minimum capelin quota of 50,000 tons, eventually in combination with raising the limit of tons. The fishing industry have for many years advocated this, but personally I think it will be problematic to argue for a capelin quota when the stock is very poor. I doubt also that this will be sustainable. All in all, our recommendation is to continue the HCR for capelin. We believe also that an increase in fishing mortality for cod to 0.5, will be the most important contribution to ensure higher capelin stock (and quotas). 137

138 Some consider the current HCRs as first generation rules, and hope that new rules will benefit from significantly new knowledge about stocks. I possibly see a little different on this. As mentioned I believe we have more to gain by making HCRs as simple as possible, and instead use more resources ensuring better stock assessments. I think we never ever will fully understand the natural fluctuations in different fish stocks. We should reduce the ambition to be able to take account of everything in a HCR. It is better to make ad hoc measures if we observe that the development is completely different from what we expected. I think multispecies considerations, or ecosystem approach, instead should be taken into account for example by setting the fishing mortality for predator stocks higher than we would otherwise have done, as we have proposed for Northeast arctic cod. 138


139 Recent developments, including Greenpeace`s Arctic report on fishing in the northern Barents Sea around Svalbard, have shown us that it is not always enough to manage the stocks well. We also need to ensure that fisheries do not harm the rest of the ecosystem, or damage bottom habitats. Norwegian fishermen have played an active and significant role in identifying and mapping benthic habitats and communities, including those vulnerable to adverse impacts from bottom fishing. The industry has co-operated with management to establish protection of vulnerable habitats through area closures and fishing restrictions. We will continue this process. We might have our personal view about this, and the concern about benthic habitats sometimes take hysteric proportions compared to what is accepted on land. However, it is not very interesting what we personally think, when the market respond negatively. Norway and Russia have long tradition for managing its fisheries, and works continuously to achieve a strong science-based management, balancing environmental responsibility and economic sustainability. It is important that this work continues. I am pleased that this question is on the agenda later in this symposium. I will try to summarize! 139


140 Norway and Russia have managed Barents Sea well in recent years, and there is no great need for changes in HCRs. We recommend however to allow a slightly higher fishing pressure for Northeast Arctic cod. This will provide higher quotas on average, but we must allow a little more variability in quotas. It will also mean increased quotas of other stocks, such as capelin, shrimp, haddock and redfish. It is also important to work to improve the stock assessments that management rules are based on. It is maybe at this point there is most to improve at the moment. Norway and Russia should still cooperate to ensure that environmental issues and business interests continue to be balanced in a responsible and sustainable way in managing the fish stocks in the Barents Sea. We hope that the Harvest control rules will be followed by the Commission, unless it is obvious that they should be abandoned and changed. We are pleased that the parties this time include the fishing industry in the discussions about the Harvest control rules in the Barents Sea. Thank you for your attention! 140


")
141 Session 3 contribution 3: The usefulness of Stable quotas on the international market By S. Johansen (Norwegian Seafood Federation) Presentation Invited talk 141


142 142
143 Session 3 contribution 4: About science and industry cooperation in evaluation of biological stocks, improvement of fishing control and management measures By N. Androsov (Robinzon Ltd.) Paper Invited talk About science and industry cooperation in evaluation of biological stocks, improvement of fishing control and management measures By Nikolay Androsov Robinzon Ltd., Murmansk, Russia For coastal states like Russia and Norway, from olden times Norwegian and Barents seas are traditional fishing areas for bottom and pelagic fishing. For centuries fishermen from our countries have actively mastered, developed and improved fishing. Here in the North major part of cod and haddock is being caught and which is considerable part of export of Russian and Norwegian fishermen. In recent years Kamchatka crab which has been successfully naturalized in the North and its effective breeding population has reached commercial size, is being caught actively. Scientists and fishermen have accumulated vast experience and knowledge about fish stock condition, place and time of spawning, feeding, optimal fishing periods and areas. Thus the mutual opinion of all members of the Union of Fishermen of the North is that tight cooperation of scientists and the fishermen will make a solid foundation for development of fishing industry of Russia and Norway. It is most necessary since the global climate changes are getting visible and the certain traces on instability of marine ecosystems in North East Atlantic and Barents Sea are coming up. These traces are changes of stocks of main industrial species used by our fishermen, sometimes these changes are sharp. Nowadays much is said about complex influence of warming to the fishing stocks (yield of a generation) and feeding potential (plankton) for its reproduction. Let me illustrate few statements: First. Changes of cod fishing areas is distant years. 143

144 Second. Dependence of cod distribution in high latitude parts of sea depending on ice conditions in specific years. First. Changes of cod fishing areas is distant years. 144
 of biological parameters (weight, size, feeding, maturity) of bottom and pelagic species being caught by fishing boats of Russia and Norway as per agreed")
145 Second. Dependence of cod distribution in high latitude parts of sea depending on ice conditions in specific years. In our opinion main elements of cooperation of science and industry may be: 1. Development of gathering (monitoring) of biological parameters (weight, size, feeding, maturity) of bottom and pelagic species being caught by fishing boats of Russia and Norway as per agreed procedure and exchange of this information between fishermen and scientists 145
146 of our countries. This will help to use in mathematic model more complete and correct information than the one we have now. We have checked and came to conclusion that input of some additional information in daily reports will make no difficulties for the crew. 2. The use of new mathematic models for stock assessment besides traditional ones as well as additional methods on the basis of detailed fishing data and exact fleet positioning. These methods are already used in Russia (by VNIRO scientists, Marine Informatics). It helps to receive comparative biomass assessments and to control its dynamics in different fishing conditions. 3. Participation of fishermen in joint work: Regular joint discussion of stock assessment, especially international on national and two way basis; Motivated joint discussion of biomass assessment using new and additional methods and its further use and development; Regular discussion of stock assessments of jointly used fish stocks before sending of materials to ICES with a purpose of timely estimation of fishing perspectives for the next year for Russian and Norwegian fishermen. We believe that the absence of such cooperation has brought us to situation that our recommendation for to define cod TAC at 1,2 1,3 mln.tons were not accepted though these recommendations were motivated by fishermen information: masters of fishing boats have noticed that fishing capacity is constantly growing and is limited by quotas volume only; In cod guts there are a lot of juvenile cod fishes; capelin fishing in was hold because of number of grown cod in pelagic trawls; before in pelagic zone there was younger fish mostly looking for food thus its pelagic fishing was forbidden, and now big fish has to come to same layers for feeding; every year we see more mature «dry» cod, which is going for spawning. Fishermen think that it might be some sort of stock self regulating mechanism because of deficiency of food for cod; as per fishermen report the fishing size of cod of 2 3 kg and higher has grown and this is a sign of big cod prevalence in the school. 146
147 According to VNIRO data the feeding of cod consists of average 8 mln. tons of fish, including approximately 3.7 mln. tons of capelin. Quite possible that this might be one of the reasons for reduction the stock of capelin and ban of capelin fishing in Implementation of Fishing Regulating Rules in 2003 by Russian Norwegian Joint Fisheries Commission (Fisheries Commission) had the main purpose to restore the stock of cod and has played its positive role. However current rules in force could not provide accurate defining of TAC under stock growing conditions. Fishermen believe that TAC reduction for tons happened because of current limitations of Fisheries Commission and because of not taking into account cod stocks fluctuations. At the same time fishermen think that it is necessary to keep current Rules for regulation haddock fishing, but its TAC should not be defined independently of cod TAC. For most of fishing areas in Barents Sea these two species are being caught together. Thus one of TAC criteria should become expected haddock volume inside cod catches. We also think it is necessary to pinpoint your attention to the fishing of other jointly used species which are normally being caught as a by catch, first of all such as cat fish and saithe. Despite the increasing of Russian cod quotas starting from 2013, quotas for cat fish and saithe were not increased and remained unchanged since 2013: saithe 12000t, cat fish 4500t. It was the reason why Russian fishermen after ending of saithe and cat fish quotas in NEZ had to leave efficient fishing grounds. We suggest scientists from our countries considering reasonable proportions of cod and haddock fishing with other species as bycatches, otherwise fishermen will have to catch in areas where impact and damage for small fish and stocks shall be higher. Live and important is the question of fishery certification for compliance with requirements of MSC (Marine Stewardship Council). To my mind we should coordinate the work of all companies certified at MSC otherwise we shall face absurd situation when according to one information there is by catch of protected species, according to other info by catch is minimum but the area should be closed. It is necessary to work out solid opinion about use of bottom trawls, as per fishermen bottom trawl influence for bottom species is not as harmful as WWF (World Wildlife Fund) specialists claim. In Northern seas there are no corals and other objects; bottom species are very stable in recent years as never before. 147


148 We believe it is time to work out common transfer coefficients for all fishing species and for processing and to approve them at next Fisheries Commission meeting. Onboard of our boats we have studied the outcome of ready products and according to our crew specialists the difference is within acceptable tolerance and can/should not influence the volume of quotas. Thus for correct catch calculation this job is vitally important. I want to underline the importance of cooperation of fishermen and scientists in defining TAC for pelagic species in Barents and Norwegian seas. Fishermen are worried with ICES recommendation about reduction of Norwegian spawning herring, blue whiting, mackerel. Capelin fishing is banned. May be stocks are underestimated? For example, it to compare the positioning of Russian boats during mackerel fishing in July September it is possible to say that with high probability that mackerel stocks are underestimated, especially in open part of Norwegian sea because of late fish coming to those areas in 2015 and more eastern fish orientation of distribution in summer spring 2015, comparing with (Positions 3,4). Three. International mackerel stock assessment and positioning of Russian fishing boats in July September


149 Four. Positioning of Russian fishing boats in June September Three. International mackerel stock assessment and positioning of Russian fishing boats in July September

150 Four. Positioning of Russian fishing boats in June September Analysis of biomass assessments and ICES recommendations for blue whiting in recent years show controversial character of process with fast changing tendencies from drop to growth of stocks which was once again shown during spring 2015 survey. In comments to survey results it is said that stock underestimation might happen because of late fish coming to main spawning areas of Porcupine bank. Fishermen believe that there no reasons for reduction of blue whiting TAC, especially since in catches of Russian boats in 150
151 Norwegian sea it is notices considerate part of smaller fish in the fishing school. Survey of Norwegian scientists for herring stocks in February 2016 showed the drop of its biomass for 30% (from 6,2 mln. tons in 2015 down to 4,3 mln. tons in 2016). Main biomass consists of the fish of 2004year class. Every next generation has only indirect influence to the volume of stock. At the same time the catch of herring in coastal areas for 60 70% consists of immature herring. I want to underline that fishermen have never opposed them to scientists. For us, for our countries it is vitally important to have stable catches and to keep stable stocks of all species in our seas. My suggestions have the only goal to improve cooperation and to have more accurate assessment of actual situation in industry and at sea. Thank you for your attention. 151


152 Session 3 contribution 5: Integrated ecosystem assessment of the Barents Sea: Recent findings and relevance to management By E. Johannesen and other WGIBAR members (see first slide) Presentation 152

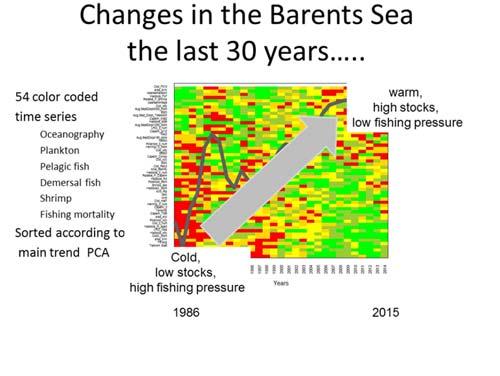
153 153


154 154


155 155


156 156
 Presentation with abstract Abstract Arctic and Antarctic marine systems have in common high latitudes, large seasonal changes in light levels, cold air and sea temperatures, and sea ice.")

157 Session 3 contribution 6: Krill, Climate, and Contrasting Future Scenarios for Arctic and Antarctic Fisheries By M. McBride (IMR) Presentation with abstract Abstract Arctic and Antarctic marine systems have in common high latitudes, large seasonal changes in light levels, cold air and sea temperatures, and sea ice. In other ways, however, they are strikingly different, including their: age, extent, geological structure, ice stability, and food web structure. Both regions contain rapidly warming areas and climate impacts have already been reported, as have dramatic future projections. However, the combined effects of a changing climate on oceanographic processes and food web dynamics are likely to influence their future fisheries in very different ways. Differences in life-history strategies of key zooplankton species (Antarctic krill in the Southern Ocean and Calanus copepods in the Arctic) will likely affect future productivity of fishery species and fisheries. To explore future scenarios for each region we: 1) considers differing characteristics (including geographic, physical, and biological) that define polar marine ecosystems, and reviews known and projected impacts of climate change on key zooplankton species that may impact fished species; 2) summarizes existing fishery resources; 3) synthesizes this information to generate future scenarios for fisheries; and 4) considers the implications for future fisheries management. Published studies suggest that if an increase in open water during summer in Arctic and Sub-arctic Seas results in increased primary and secondary production, biomass may increase for some important commercial fish stocks and new mixes of species may become targeted. In contrast, published studies suggest that in the Southern Ocean the potential for existing species to adapt is mixed, and that the potential for invasion of large and highly productive pelagic finfish species appears to be low. Thus, future Southern Ocean fisheries may largely be dependent on existing species. It is clear from this review that new management approaches will be needed that account for the changing dynamics in these regions under climate change. 157


158 158


159 159


160 160


161 161
 Presentation with abstract Abstract Bottom-trawl fisheries are expanding into deeper habitats and high latitude ecosystems, but our understanding of their effects in these areas")
 and slope (400-2000 m) in the southern Barents Sea.")
162 Session 3 contribution 7: Trawling impact on megabenthos and sediment in the Barents Sea: use of satellite tracking and video By L. Buhl Mortensen (IMR) Presentation with abstract Abstract Bottom-trawl fisheries are expanding into deeper habitats and high latitude ecosystems, but our understanding of their effects in these areas is limited. The ecological importance of habitat forming megabenthos and their vulnerability to trawling is acknowledged, but studies on effects are few. The objective of the study was to investigate chronic effects of otter-trawl fishery on substratum and megabenthos on the shelf ( m) and slope ( m) in the southern Barents Sea. The km2 large study area represents a wide range in history of fishing intensity (FI). Physical impact of trawling, density of trawl marks (TMs), was quantified on 250 video transects from shelf and slope and megabenthos (> 2 cm) composition was studied on 149 video transects from the shelf. Number of satellite-recorded vessels within grid cells 5 x 5 km was used as proxy for FI in the TM analysis and for the megabenthos records within a 2 km radious around the video stations, the effects of using different search area size was tested. Patterns in density of TMs and megabenthos composition were compared with FI using linear regression and correspondence analysis. Occurrence of TMs was not directly related to FI but to bottom type while, megabenthos density and diversity showed a negative relation to FI. For 79 of the 97 most common taxa density was negatively correlation to FI. The sponges Craniella zetlandica, and Phakellia/Axinella were particularly vulnerable, but also Flabellum macandrewi (Scleractinia), Ditrupa arietina (Polychaeta), Funiculina quadrangularis (Pennatulacea), and Spatangus purpureus (Echinoidea) were negatively correlated with FI, while Asteroids, lamp shells and small sponges showed a positive trend. Our results are an important step towards the understanding of chronic effects of bottom trawling, and are discussed in relation to the descriptors Biological diversity and Seafloor integrity in the EU Marine strategic framework directive. 162

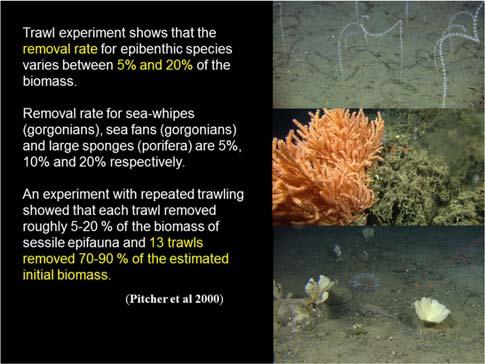


163 163


164 164


165 165


166 166


167 167
Ecosystem dynamics and fisheries management in the Barents sea
 Ecosystem dynamics and fisheries management in the Barents sea A.Filin 1, S. Tjelmeland 2, J.E. Stiansen 2 1 Polar Research Institute of Marine Fisheries and Oceanography (PINRO), Murmansk, Russia 2 Institute
OVERVIEW OF NEW MANAGEMENT APPROACH FOR CRAB FISHERIES IN THE RUSSIAN WATERS
 OVERVIEW OF NEW MANAGEMENT APPROACH FOR CRAB FISHERIES IN THE RUSSIAN WATERS Sergey Bakanev The Polar Research Institute of Marine Fisheries and Oceanography (PINRO), Murmansk, Russia The 17th Russian-Norwegian
NOTE. Scenario C : A program documentation. Norwegian Computing Center SAMBA/04/05. Gro Hagen Tore Schweder. 31st January 2005
 Scenario C : A program documentation NR Norwegian Computing Center APPLIED RESEARCH AND DEVELOPMENT NOTE SAMBA/04/05 Latitude 60 65 70 75 80 8 1 4 2 6 3 7 5 Gro Hagen Tore Schweder 10 20 30 40 50 60 Longitude
Draft interim management plan for boarfish. Maurice Clarke, Marine Institute
 Draft interim management plan for boarfish Maurice Clarke, Marine Institute Summary Recap on ICES advice 2011 Latest update on assessment of boarfish Need for a management plan Need for caution, and the
A Management Strategy Evaluation. for orange roughy. ISL Client Report for Deepwater Group Ltd
 A Management Strategy Evaluation for orange roughy ISL Client Report for Deepwater Group Ltd P.L. Cordue August 2014 Executive summary A management strategy evaluation was performed with a generic orange
Developing Sustainable Seafood Recommendations Updated April 23, 2008
 Developing Sustainable Seafood Recommendations Updated April 23, 2008 Monterey Bay Aquarium is committed to inspiring conservation of the oceans. To this end, we make every attempt to purchase seafood
Ecosystem drivers of stock production are rarely implemented in tactical fisheries management
 ICES CM 2015/B:05 Ecosystem drivers of stock production are rarely implemented in tactical fisheries management Mette Skern-Mauritzen, Geir Ottersen, Nils Olav Handegard, Geir Huse, Gjert E. Dingsør, Nils
APPROACHES FOR EVALUATING THE PROPOSED 3PS COD CONSERVATION PLAN AND REBUILDING STRATEGY (CPRS)
") Canadian Science Advisory Secretariat Science Response 2012/008 APPROACHES FOR EVALUATING THE PROPOSED 3PS COD CONSERVATION PLAN AND REBUILDING STRATEGY (CPRS) Context International agreements such as
Canadian Science Advisory Secretariat Science Response 2012/008 APPROACHES FOR EVALUATING THE PROPOSED 3PS COD CONSERVATION PLAN AND REBUILDING STRATEGY (CPRS) Context International agreements such as
John Boreman, Chair, Mid-Atlantic Fisheries Management Council SSC
 Memo To: From: John Boreman, Chair, Mid-Atlantic Fisheries Management Council SSC Thomas Miller, Vice-Chair, Mid-Atlantic Fisheries Management Council SSC Date: September 12, 2015 Re: Review of McNamee
Rendement maximal durable (RMD) définition, estimation. Maximum sustainable yield (MSY) definition, estimation. Alain Biseau, Ifremer, France
 définition, estimation. Maximum sustainable yield (MSY) definition, estimation. Alain Biseau, Ifremer, France") Rendement maximal durable (RMD) définition, estimation Maximum sustainable yield (MSY) definition, estimation Alain Biseau, Ifremer, France 1 0. MSY introduction Not only a scientific issue but a political
Rendement maximal durable (RMD) définition, estimation Maximum sustainable yield (MSY) definition, estimation Alain Biseau, Ifremer, France 1 0. MSY introduction Not only a scientific issue but a political
STOCK ASSESSMENT OF WITCH FLOUNDER (GLYPTOCEPHALUS CYNOGLOSSUS) IN NAFO SUBDIVISION 3PS
 IN NAFO SUBDIVISION 3PS") Canadian Science Advisory Secretariat Newfoundland and Labrador Region Science Advisory Report 2018/011 STOCK ASSESSMENT OF WITCH FLOUNDER (GLYPTOCEPHALUS CYNOGLOSSUS) IN NAFO SUBDIVISION 3PS Image: Witch
Canadian Science Advisory Secretariat Newfoundland and Labrador Region Science Advisory Report 2018/011 STOCK ASSESSMENT OF WITCH FLOUNDER (GLYPTOCEPHALUS CYNOGLOSSUS) IN NAFO SUBDIVISION 3PS Image: Witch
Trophic interactions affecting a key ecosystem component: a multi-stage analysis of the recruitment of the Barents Sea capelin
 ICES CM 9/ C: Not to be cited without prior reference to the author Trophic interactions affecting a key ecosystem component: a multi-stage analysis of the recruitment of the Barents Sea capelin Dag Ø.
Ecosystem Approach to Fisheries Management in the Barents Sea. by Å. Bjordal and A. Boltnev 10th Norwegian-Russian Symposium
 Ecosystem Approach to Fisheries Management in the Barents Sea by Å. Bjordal and A. Boltnev 10th Norwegian-Russian Symposium Ecosystem Approach to Fisheries Management (EAFM) - Nothing new! - We don t
The Barents Sea ecosystem in the 1980s: ocean climate, plankton, and capelin growth
 ICES mar. Sei. Symp., 195: 278-290. 1992 The Barents Sea ecosystem in the 1980s: ocean climate, plankton, and capelin growth Hein Rune Skjoldal, Harald Gjøsæter, and Harald Loeng Skjoldal, H. R., Gjøsæter,
Implementation of the Ecosystem Approach to Fisheries in the North-East Atlantic
 Norwegian College of Fisheries Science Implementation of the Ecosystem Approach to Fisheries in the North-East Atlantic A case study of how the Joint Norwegian-Russian Fishery Commission has worked with
EU GOVERNANCE. 1) For the North Sea and adjacent areas. North Sea Plan Ulrike Rodust, German, S&D (Socialists and Democrats- Jeremy Corbyn)
 For the North Sea and adjacent areas. North Sea Plan Ulrike Rodust, German, S&D (Socialists and Democrats- Jeremy Corbyn)") EU GOVERNANCE 1) For the North Sea and adjacent areas North Sea Plan Ulrike Rodust, German, S&D (Socialists and Democrats- Jeremy Corbyn) 2) For all Union waters Technical Conservation Measures Gabriel
EU GOVERNANCE 1) For the North Sea and adjacent areas North Sea Plan Ulrike Rodust, German, S&D (Socialists and Democrats- Jeremy Corbyn) 2) For all Union waters Technical Conservation Measures Gabriel
Operation and supply chain management Prof. G. Srinivasan Department of Management Studies Indian Institute of Technology Madras
 Operation and supply chain management Prof. G. Srinivasan Department of Management Studies Indian Institute of Technology Madras Lecture - 37 Transportation and Distribution Models In this lecture, we
IMPLEMENTATION OF A HARVEST CONTROL RULE FOR NORTHERN ATLANTIC ALBACORE
 SCRS/2013/150 Collect. Vol. Sci. Pap. ICCAT, 70(3): 1355-1364 (2014) IMPLEMENTATION OF A HARVEST CONTROL RULE FOR NORTHERN ATLANTIC ALBACORE Laurence T. Kell 1, Paul De Bruyn 1, Gorka Merino 2 and Josetxu
A Framework for Multispecies Assessment and Management. An ICES/NCM Background Document
 A Framework for Multispecies Assessment and Management An ICES/NCM Background Document A Framework for Multispecies Assessment and Management An ICES/NCM Background Document Anna Rindorf, Jörn Schmidt,
Approaches for dealing with three sources of bias when studying the fishing down marine food web phenomenon
 Approaches for dealing with three sources of bias when studying the fishing down marine food web phenomenon Daniel Pauly 1 and Maria Lourdes Palomares 2 1 Fisheries Center, University of British Columbia,
Overview of Risk Policy and Managing for Uncertainty Across the Regional Fishery Management Councils
 Overview of Risk Policy and Managing for Uncertainty Across the Regional Fishery Management Councils Overview of Risk Policies Councils, in general, have adopted a risk policies based mainly on the level
Marine Policy 39 (2013) Contents lists available at SciVerse ScienceDirect. Marine Policy. journal homepage:
 Contents lists available at SciVerse ScienceDirect. Marine Policy. journal homepage:") Marine Policy 39 (2013) 172 181 Contents lists available at SciVerse ScienceDirect Marine Policy journal homepage: www.elsevier.com/locate/marpol A bio-economic analysis of harvest control rules for the
Marine Policy 39 (2013) 172 181 Contents lists available at SciVerse ScienceDirect Marine Policy journal homepage: www.elsevier.com/locate/marpol A bio-economic analysis of harvest control rules for the
REFERENCE POINTS, DECISION RULES, AND MANAGEMENT STRATEGY EVALUATION FOR TUNAS AND ASSOCIATED SPECIES IN THE EASTERN PACIFIC OCEAN
 REFERENCE POINTS, DECISION RULES, AND MANAGEMENT STRATEGY EVALUATION FOR TUNAS AND ASSOCIATED SPECIES IN THE EASTERN PACIFIC OCEAN 1. INTRODUCTION Mark N. Maunder The Antigua Convention commits the IATTC
21 st Century Climate Change Impacts on Marine Fisheries
 21 st Century Climate Change Impacts on Marine Fisheries Anne B. Hollowed, NOAA, NMFS, Alaska Fisheries Science Center, Seattle, WA USA International Workshop on Climate and Oceanic Fisheries, Rarotonga,
Study Group on Multispecies Assessments in the North Sea
 Resource Management Committee ICES CM /D: Ref. ACFM, ACE, G REPORT OF THE Study Group on Multispecies Assessments in the North Sea Bergen, Norway August This report is not to be quoted without prior consultation
Methodology for the case studies
 Methodology for the case studies AUTHORS Marie-José Smits, Researcher, Wageningen University and Research Geert Woltjer, Researcher, Wageningen University and Research With contributions from: With thanks
STRATEGIC PLAN OF THE WORKING PARTY ON RENEWABLE ENERGY TECHNOLOGIES FOR THE PERIOD OF 1 JULY 2016 TO 30 JUNE 2019
 STRATEGIC PLAN OF THE WORKING PARTY ON RENEWABLE ENERGY TECHNOLOGIES FOR THE PERIOD OF 1 JULY 2016 TO 30 JUNE 2019 1. Background a) Renewable Energy in the World Energy Context 1. The world energy system
LCA in decision making
 LCA in decision making 1 (13) LCA in decision making An idea document CHAINET LCA in decision making 2 (13) Content 1 INTRODUCTION 2 EXAMPLE OF AN INDUSTRIAL DEVELOPMENT PROCESS 2.1 General about the industrial
Joint Norwegian-Russian environmental status 2008 Report on the Barents Sea Ecosystem Part I - Short version
 I M R / PI NRO T R S IE R 2009 E IN JO 2 S EP O R T Joint Norwegian-Russian environmental status 2008 Report on the Barents Sea Ecosystem Part I - Short version This report should be cited as: Arneberg,
Now, I wish you lots of pleasure while reading this report. In case of questions or remarks please contact me at:
 Preface Somewhere towards the end of the second millennium the director of Vision Consort bv, Hans Brands, came up with the idea to do research in the field of embedded software architectures. He was particularly
How Many Fish Need to Be Measured to Effectively Evaluate Trawl Selectivity?
 RESEARCH ARTICLE How Many Fish Need to Be Measured to Effectively Evaluate Trawl Selectivity? Bent Herrmann 1,5, Manu Sistiaga 2 *, Juan Santos 3, Antonello Sala 4 1 SINTEF Fisheries and Aquaculture, Fishing
Supplement to the AI Pollock EA/RIR: Analysis of the Council s April Allocation Size Alternatives
 Supplement to the AI Pollock EA/RIR: Analysis of the Council s April Allocation Size Alternatives The following discussion will be added to Section 4.2 as a new sub-section 4.2.3. Appropriate text will
Are data-poor fisheries certifiable? Generic Management Procedures and precautionary management
 Are data-poor fisheries certifiable? Generic Management Procedures and precautionary management Helena Geromont MARAM (Marine Resource Assessment and Management Group) Department of Mathematics and Applied
ALL APPS ARE NOT CREATED EQUAL BUILDING THE BUSINESS CASE FOR BUSINESS CONTINUITY & DISASTER RECOVERY IN SMALL & MID-SIZED ORGANIZATIONS
 ALL APPS ARE NOT CREATED EQUAL BUILDING THE BUSINESS CASE FOR BUSINESS CONTINUITY & DISASTER RECOVERY IN SMALL & MID-SIZED ORGANIZATIONS a white paper by INTRODUCTION Whether we are supporting our customers
Welcome address, NCHR 25 th anniversary
 Welcome address, NCHR 25 th anniversary 29.08.2012. (Venue: Teatersalen, Hotel Continental, Oslo) Nils A Butenschøn, Director Excellences, friends and colleagues, On behalf of the Norwegian Centre for
Research Plan for New Scientific Whale Research Program in the western North Pacific (NEWREP-NP) Government of Japan
 Government of Japan") Research Plan for New Scientific Whale Research Program in the western North Pacific (NEWREP-NP) Government of Japan 1 EXECUTIVE SUMMARY a. Primary, Secondary (and, if appropriate Ancillary) objectives
Research Plan for New Scientific Whale Research Program in the western North Pacific (NEWREP-NP) Government of Japan 1 EXECUTIVE SUMMARY a. Primary, Secondary (and, if appropriate Ancillary) objectives
Red, Green and Yellow: Thoughts on Stock Status and the ICCAT Convention Objectives. Victor R. Restrepo 1,2. Summary
 SCRS/8/7 Red, Green and Yellow: Thoughts on Stock Status and the ICCAT Convention Objectives Victor R. Restrepo, Summary The ICCAT Convention has the stated objective of maintaining populations at levels
By Papa Gora NDIAYE 1, Fisheries Economist Geneva, March 22 nd 2017
 Contribution to the Session on Trade Subsidies in Fisheries Sector at the Ocean Forum jointly organized by UNCTAD, UNEP, FAO and COMMONWEALTH By Papa Gora NDIAYE 1, Fisheries Economist Geneva, March 22
PROTOCOL FOR THE SCIENTIFIC EVALUATION OF PROPOSALS TO CULL MARINE MAMMALS
 Report of the Scientific Advisory Committee of the Marine Mammals Action Plan October 1999. PROTOCOL FOR THE SCIENTIFIC EVALUATION OF PROPOSALS TO CULL MARINE MAMMALS Supported by Greenpeace, World Wide
Application of Surplus-Production Models to Splendid Alfonsin Stock in the Southern Emperor and Northern Hawaiian Ridge (SE-NHR)
") Appendix C Application of Surplus-Production Models to Splendid Alfonsin Stock in the Southern Emperor and Northern Hawaiian Ridge (SE-NHR) Akira NISHIMURA 1 and Akihiko YATSU 2 1 Hokkaido National Fisheries
Appendix C Application of Surplus-Production Models to Splendid Alfonsin Stock in the Southern Emperor and Northern Hawaiian Ridge (SE-NHR) Akira NISHIMURA 1 and Akihiko YATSU 2 1 Hokkaido National Fisheries
Report of the Board for 2005
 Report of the Board for 2005 Financial results For the fisheries and aquaculture trades, 2005 was a good year with profitability in most sectors. Trade political difficulties in existing markets have been
TURBOT AQUACULTURE: PRODUCTION AND MARKETS by Trond Bjørndal and José Fernández-Polanco
 TURBOT AQUACULTURE: PRODUCTION AND MARKETS by Trond Bjørndal and José Fernández-Polanco Background Turbot is a high valued species, much favoured in fine restaurants. Aquaculture of turbot started first
Exam Duration: 2 hours and 30 minutes
 The PRINCE2 Practitioner Examination Sample paper TR Question Booklet Multiple Choice Exam Duration: 2 hours and 30 minutes Instructions 1. You should attempt all 75 questions. Each question is worth one
ASSESSMENT OF THE PACIFIC SARDINE RESOURCE IN 2015 FOR U.S.A. MANAGEMENT IN
 Agenda Item G.1.a Assessment Report Executive Summary April 2015 ASSESSMENT OF THE PACIFIC SARDINE RESOURCE IN 2015 FOR U.S.A. MANAGEMENT IN 2015-16 Kevin T. Hill 1, Paul R. Crone 1, Emmanis Dorval 2,
All NEMOs proposal for the price coupling algorithm and for the continuous trading matching algorithm, also incorporating TSO and NEMO proposals for
 All NEMOs proposal for the price coupling algorithm and for the continuous trading matching algorithm, also incorporating TSO and NEMO proposals for a common set of requirements, in accordance with Article
Impacts of global warming on bio-products of marine and coastal system Ling TONG Qisheng TANG
 Impacts of global warming on bio-products of marine and coastal system Ling TONG Qisheng TANG Yellow Sea Fisheries Research Institute, CAFS Both environmental and human factors affect the bioproducts in
WORKING PAPER ON NATURAL RESOURCES AND CONCESSIONS IN THE CONTEXT OF THE MAI
 Unclassified DAFFE/MAI/ST/RD(97)2/FINAL Organisation for Economic Co-operation and Development 12 January 2000 Organisation de Coopération et de Développement Economiques Negotiating Group on the Multilateral
Understanding IEC 62304
 Understanding IEC 62304 Co-authored by MethodSense, Inc. and Medical Equipment Compliance Associates, LLC www.methodsense.com 919.313.3960 Understanding IEC 62304 By: Rita King, Chief Executive Officer,
EXECUTIVE SUMMARY. What is carbon leakage?
 EXECUTIVE SUMMARY When climate change mitigation policy introduces a cost for some but not others within the same sector, competition among companies is distorted. The implementation of the Kyoto Protocol
Value Creation through Information Management. A Benefits Realisation Initiative
 Value Creation through Information Management A Table of Contents Executive Summary... 2 Introduction... 3 1.1 Study Purpose & Background... 3 1.2 Study Objectives... 3 1.3 Methodology... 3 1.4 Respondent
Tipping Points and Decision-Making: Why they matter, why they are hard, and practical things to do. Jake Rice Chief Scientist - DFO
 Tipping Points and Decision-Making: Why they matter, why they are hard, and practical things to do Jake Rice Chief Scientist - DFO Why they matter What do they do? They differentiate the area where there
Long term bilateral Russian-Norwegian scientific co-operation as a basis for sustainable management of living marine resources in the Barents Sea
 J O I N I M R / P I N R O 5 27 T R E P O R T S E I E R S Long term bilateral Russian-Norwegian scientific co-operation as a basis for sustainable management of living marine resources in the Barents Sea
Why use Ecodesign in the industry 2013? A Survey regarding Barriers and Opportunities related to Ecodesign.
 Why use Ecodesign in the industry 13? A Survey regarding Barriers and Opportunities related to Ecodesign. Anna Karin Jönbrink 1, Anna Rúna Kristinsdottir 1, Sandra Roos 1, Mats Sundgren 1, Eva Johansson
Operations and Supply Chain Management Prof. G. Srinivasan Department of Management Studies Indian Institute of Technology, Madras
 Operations and Supply Chain Management Prof. G. Srinivasan Department of Management Studies Indian Institute of Technology, Madras Lecture - 24 Sequencing and Scheduling - Assumptions, Objectives and Shop
The European Consensus Conference: The View of a Participating Practitioner
 Part E _ Special Section on the European Consensus Conference on Homelessness 191 The European Consensus Conference: The View of a Participating Practitioner René Kneip Director, Caritas Accueil et Solidarité
GfK Verein & St. Gallen Symposium
 GfK Verein & St. Gallen Symposium Imprint and Copyright GfK Verein & St. Gallen Symposium /// Global Perspectives Barometer - Voices of the Leaders of Tomorrow /// Participants Package Contacts for the
Ecological Data Requirements to Support Ecosystem-based Fisheries Management. Examples from Pelagic Longline Tuna Fisheries
 Ecological Data Requirements to Support Ecosystem-based Fisheries Management Examples from Pelagic Longline Tuna Fisheries 2 nd Symposium on Fishery Dependent Information 3-6 March 2014 Eric Gilman, EricLGilman@gmail.com
Assessing the effects of climate change on U.S. West Coast sablefish productivity and on the performance of alternative management strategies
 Assessing the effects of climate change on U.S. West Coast sablefish productivity and on the performance of alternative management strategies Melissa A. Haltuch 1, Z. Teresa A mar 2, Nicholas A. Bond 3,
People Are the Key Strategic Resource
 People Are the Key Strategic Resource In today s intensely competitive and globalize marketplace, maintaining a competitive advantage by becoming a low cost leader or a differentiator puts a heavy premium
For informasjon om rapporten, se vedlegg 11 til protokollen fra den 35. sesjon i Den blandete norsk-russiske fiskerikommisjon;
 1 Vedlegg 11 For informasjon om rapporten, se vedlegg 11 til protokollen fra den 35. sesjon i Den blandete norsk-russiske fiskerikommisjon; Protocol of the second meeting of the WORKING GROUP ON ELABORATION
Elements of abnormally low tenders: A comparative analysis of EU procurement directive and case law
 Elements of abnormally low tenders: A comparative analysis of EU procurement directive and case law Abstract Orjana Ibrahimi Albanian Ministry of Finance Nowadays remains a challenge for the Contracting
The place of the oceans in Norway s foreign and development policy
 Norwegian Ministry of Foreign Affairs Summary Meld. St. 22 (2016 2017) Report to the Storting (white paper) The place of the oceans in Norway s foreign and development policy Norwegian foreign policy
THE LEAD PROFILE AND OTHER NON-PARAMETRIC TOOLS TO EVALUATE SURVEY SERIES AS LEADING INDICATORS
 THE LEAD PROFILE AND OTHER NON-PARAMETRIC TOOLS TO EVALUATE SURVEY SERIES AS LEADING INDICATORS Anirvan Banerji New York 24th CIRET Conference Wellington, New Zealand March 17-20, 1999 Geoffrey H. Moore,
ICES Special Request Advice Baltic Sea Ecoregion Published 11 February 2016 Version 2; 13 May 2016
 ICES Special Request Advice Baltic Sea Ecoregion Published 11 February 2016 Version 2; 13 May 2016 9.4.1 * EU request to ICES on evaluation of the Trans-border management plan for European eel in the Polish
Over the past decades, global markets for fish and fish products have changed
 Globalisation in Fisheries and Aquaculture Opportunities and Challenges OECD 2010 Executive Summary Over the past decades, global markets for fish and fish products have changed considerably and continue
Workshop on development of a draft Action Plan on Climate Change for the Barents Region
 Workshop on development of a draft Action Plan on Climate Change for the Barents Region Prepared for the Norwegian Ministry of the Environment as input to work under the Barents Euro-Arctic Council March
Linda Carrington, Wessex Commercial Solutions
 Linda Carrington, Wessex Commercial Solutions Linda Carrington has worked with ISO 9001 accredited systems throughout her career, in businesses as diverse as oil and gas, construction, defence and shipping.
Generic Metrics System
 Generic Metrics System (v.1, 2010) 1. An Overview of the Generic Metrics Systems The Sustainable Fisheries Partnership (SFP) has developed a Metrics Systems to provide retailers and seafood buyers with
1986 Panda symbol WWF-World Wide Fund For Nature (also known as World Wildlife Fund) WWF and living planet are WWF Registered Trademarks
 WWF and living planet are WWF Registered Trademarks") 1986 Panda symbol WWF-World Wide Fund For Nature (also known as World Wildlife Fund) WWF and living planet are WWF Registered Trademarks World Wildlife Fund - Canada Brief Standing Committee on Environment
1986 Panda symbol WWF-World Wide Fund For Nature (also known as World Wildlife Fund) WWF and living planet are WWF Registered Trademarks World Wildlife Fund - Canada Brief Standing Committee on Environment
FEATURES OF A PROJECT
 FEATURES OF A PROJECT by Professor Dr. Knut Samset, Norwegian University of Science and Technology, and Director of the Concept research program. 1 THE PROJECT AS A MEANS TO ACHIEVE AN AIM The project
World Meteorological Day 2003 Our Future Climate. Geneva, 24 March 2003
 World Meteorological Day 2003 Our Future Climate Geneva, 24 March 2003 Address by Joke Waller-Hunter Executive Secretary, United Nations Framework Convention on Climate Change not an official document,
Re: Comments on proposed revisions for the ASC salmon standard under the operational review.
 18 December 2015 Aquaculture Stewardship Council Nieuwekade 9 3511 RV Utrecht The Netherlands Re: Comments on proposed revisions for the ASC salmon standard under the operational review. To Whom It May
By Gjert H. Rosenlund, SKM Market Predictor
 By Gjert H. Rosenlund, SKM Market Predictor Abstract The variability and low predictability of wind speed makes handling of balances a difficult task for wind power producers. With increased investments
ISO INTERNATIONAL STANDARD. Risk management Principles and guidelines. Management du risque Principes et lignes directrices
 INTERNATIONAL STANDARD ISO 31000 First edition 2009-11-15 Risk management Principles and guidelines Management du risque Principes et lignes directrices http://mahdi.hashemitabar.com Reference number ISO
COORDINATING DEMAND FORECASTING AND OPERATIONAL DECISION-MAKING WITH ASYMMETRIC COSTS: THE TREND CASE
 COORDINATING DEMAND FORECASTING AND OPERATIONAL DECISION-MAKING WITH ASYMMETRIC COSTS: THE TREND CASE ABSTRACT Robert M. Saltzman, San Francisco State University This article presents two methods for coordinating
Online Student Guide Types of Control Charts
 Online Student Guide Types of Control Charts OpusWorks 2016, All Rights Reserved 1 Table of Contents LEARNING OBJECTIVES... 4 INTRODUCTION... 4 DETECTION VS. PREVENTION... 5 CONTROL CHART UTILIZATION...
POLICY REPORT. Regulatory Impact Assessment (2)
") March 2010 POLICY REPORT Benefits of RIA Overview on Macedonia s developments regarding RIA introduction and implementation RIA process in Macedonia, a long way to go Regulatory Impact Assessment (2) Analytica
March 2010 POLICY REPORT Benefits of RIA Overview on Macedonia s developments regarding RIA introduction and implementation RIA process in Macedonia, a long way to go Regulatory Impact Assessment (2) Analytica
Climate and Fisheries in the North. Klima og fiskerier i Nord
 Climate and Fisheries in the North Klima og fiskerier i Nord Professor Michaela Aschan Vice Dean / Prodekan Faculty of Biosciences, Fisheries and Economics UiT The Arctic University of Norway Klima Marin
The Future of Canada s Commercial Fisheries. - Discussion Document -
 The Future of Canada s Commercial Fisheries - Discussion Document - Table of Contents Introduction... 2 Planning for the long term... 7 Economic prosperity in the 21 st century... 13 Supporting Sustainable
Chapter Three British Parliamentary Debate as a Model of Educational and Social Debate
 Chapter Three British Parliamentary Debate as a Model of Educational and Social Debate Educational debate usually is modeled on some legislative system such as a congress or a parliament. In some cases,
HRM and Dairy. Research Questions. Purpose of the Study. Dependent Variable. Explanatory Variables
 HRM and Dairy Managing for Commitment: How Human Resource Management Practices Affect Dairy Employee Attitudes Richard Stup, Ph.D. AgChoice Farm Credit Popular press is filled with articles, information,
BP Energy Outlook 2018: Energy demand grows as fuel mix continues to diversify
 20 February 2018 BP Energy Outlook 2018: Energy demand grows as fuel mix continues to diversify The 2018 edition of BP s Energy Outlook is published today and considers the forces shaping the global energy
G. B. SREEKANTH 1, P. U. ZACHARIA 2, T. V. SATHIANANDAN 2, SAIBY THOMAS 2 N. MANJU LEKSHMI 1 AND N. P. SINGH 1 1 ABSTRACT.
 Indian J. Fish., 62 (1): 41-45, 215 41 Combining surplus production and spectral models to define fishery management advisory - a case study using the threadfinbream fishery along Kerala coast G. B. SREEKANTH
Some insights about Insights
 Can I get some insights, please? Over the years, I have come to somewhat dislike the term insights almost to the same level as, say, a Data Lake. And that s saying something. Not because these concepts
SCIENTIFIC COUNCIL MEETING OCTOBER/NOVEMBER 2007
 NOT TO BE CITED WITHOUT PRIOR REFERENCE TO THE AUTHOR (S) Northwest Atlantic Fisheries Organization SERIAL NO. N5459 NAFO SCR DOC. 07/73 SCIENTIFIC COUNCIL MEETING OCTOBER/NOVEMBER 2007 A preliminary estimate
How HR Creates Value. Exercise. Exploring the HR impact along the HR Transformation Continuum TM (v3)
") Exercise How HR Creates Value Exploring the HR impact along the HR Transformation Continuum TM (v3) CourageousHR works with HR leaders and Communities to identify their distinctive contribution and then
Exercise How HR Creates Value Exploring the HR impact along the HR Transformation Continuum TM (v3) CourageousHR works with HR leaders and Communities to identify their distinctive contribution and then
Essential elements of sustainable UK fisheries management
 Essential elements of sustainable UK fisheries management Briefing for parliamentarians and policy makers December 2017 Summary The development of new domestic fisheries legislation is an opportunity to
TEAM EMOTIONAL INTELLIGENCE SURVEY REPORT
 TEAM EMOTIONAL INTELLIGENCE SURVEY REPORT April 15, 2013 For further information about Team Emotional Intelligence: www.geipartners.com GEI Partners 2013 This report is the property of GEI Partners (Professor
REPORT FROM THE COMMISSION TO THE EUROPEAN PARLIAMENT, THE COUNCIL AND THE COMMITTEE OF THE REGIONS
 EN EN EN EUROPEAN COMMISSION Brussels, 17.12.2010 COM(2010) 762 final REPORT FROM THE COMMISSION TO THE EUROPEAN PARLIAMENT, THE COUNCIL AND THE COMMITTEE OF THE REGIONS Ex Post evaluation of the 2009
USING A LARGE RESERVOIR MODEL IN THE PROBABILISTIC ASSESSMENT OF FIELD MANAGEMENT STRATEGIES
 PROCEEDINGS, Twenty-Seventh Workshop on Geothermal Reservoir Engineering Stanford University, Stanford, California, January 28-30, 2002 SGP-TR-171 USING A LARGE RESERVOIR MODEL IN THE PROBABILISTIC ASSESSMENT
Communicating employee benefits. Driving the value of reward
 Communicating employee benefits Driving the value of reward Introduction When people are financially invested, they want a return. When people are emotionally invested, they want to contribute. - Simon
PICK ONLY ONE BEST ANSWER FOR EACH BINARY CHOICE OR MULTIPLE CHOICE QUESTION.
 Econ 101 Summer 2015 Answers to Second Mid-term Date: June 15, 2015 Student Name Version 1 READ THESE INSTRUCTIONS CAREFULLY. DO NOT BEGIN WORKING UNTIL THE PROCTOR TELLS YOU TO DO SO You have 75 minutes
Corporate Reporting - Future Directions John Collier, Secretary General, Institute of Chartered Accountants in England and Wales
 Corporate Reporting - Future Directions John Collier, Secretary General, Institute of Chartered Accountants in England and Wales Introduction Corporate reporting is currently going through a period of
Case study. Redundancy training: Acas trains Vodafone employees to aid effective consultation over redundancies, in a recessionary climate.
 Case study Redundancy training: Acas trains Vodafone employees to aid effective consultation over redundancies, in a recessionary climate. This case study explores how Acas training helped an international
EVALUATING THE ROBUSTNESS OF MANAGEMENT PROCEDURES FOR THE SABLEFISH (ANOPLOPOMA FIMBRIA) FISHERY IN BRITISH COLUMBIA, CANADA FOR
 FISHERY IN BRITISH COLUMBIA, CANADA FOR") Canadian Science Advisory Secretariat Pacific Region Science Advisory Report 2017/017 EVALUATING THE ROBUSTNESS OF MANAGEMENT PROCEDURES FOR THE SABLEFISH (ANOPLOPOMA FIMBRIA) FISHERY IN BRITISH COLUMBIA,
Canadian Science Advisory Secretariat Pacific Region Science Advisory Report 2017/017 EVALUATING THE ROBUSTNESS OF MANAGEMENT PROCEDURES FOR THE SABLEFISH (ANOPLOPOMA FIMBRIA) FISHERY IN BRITISH COLUMBIA,
SUSTAINABLE OCEAN-BASED ECONOMIES
 United Nations The Nippon Foundation of Japan Fellowship Programme Human Resources Development and Advancement of the Legal Order of the World s Oceans SUSTAINABLE OCEAN-BASED ECONOMIES Prof. Dr. Alain
Theme: 2015 Multi-stressors in the Arctic Marine Ecosystem
 Project information Project title 1st FRAM Science Days Year 2015 Project leader Melissa Chierici Participants organizing committee: Lis L Jørgensen (IMR, Cost&Fjord flagship) Arild Sundfjord (NPI, Polhavet)
CAP Post Key issues from the Environmental Pillar
 CAP Post-2013 Key issues from the Environmental Pillar The Environmental Pillar is a coalition of 26 national environmental NGOS. The Pillar and its constituent organisations work on a range of policy
ENVIRONMENTAL PERFORMANCE REVIEW OF ICELAND
 ENVIRONMENTAL PERFORMANCE REVIEW OF ICELAND EXECUTIVE SUMMARY Implementing environmental policies. Towards sustainable development. After sluggish growth in the early 1990s, Iceland s economic growth since
Quality Management System Guidance. ISO 9001:2015 Clause-by-clause Interpretation
 Quality Management System Guidance ISO 9001:2015 Clause-by-clause Interpretation Table of Contents 1 INTRODUCTION... 4 1.1 IMPLEMENTATION & DEVELOPMENT... 5 1.2 MANAGING THE CHANGE... 5 1.3 TOP MANAGEMENT