Computational Simulation of Coal Gasification in Fluidized Bed Reactors
|
|
|
- Susan Simon
- 6 years ago
- Views:
Transcription
1 Computational Simulation of Coal Gasification in Fluidized Bed Reactors Ryan Michael Soncini Dissertation submitted to the faculty of Virginia Polytechnic Institute and State University in partial fulfillment of the requirements for the degree of Doctor of Philosophy In Mechanical Engineering Francine Battaglia, Chair Foster A. Agblevor Michael T. Klein Brian Lattimer Mark R. Paul July 19, 2017 Blacksburg, Virginia Keywords: Coal Gasification, Computational Fluid Dynamics, Fluidized Bed, Multiphase Flow Copyright by Ryan Michael Soncini 2017
2 Computational Simulation of Coal Gasification in Fluidized Bed Reactors Ryan Michael Soncini ABSTRACT The gasification of carbonaceous fuel materials offers significant potential for the production of both energy and chemical products. Advancement of gasification technologies may be expedited through the use of computational fluid dynamics, as virtual reactor design offers a low cost method for system prototyping. To that end, a series of numerical studies were conducted to identify a computational modeling strategy for the simulation of coal gasification in fluidized bed reactors. The efforts set forth by this work first involved the development of a validatable hydrodynamic modeling strategy for the simulation of sand and coal fluidization. Those fluidization models were then applied to systems at elevated temperatures and polydisperse systems that featured a complex material injection geometry, for which no experimental data exists. A method for establishing similitude between 2-D and 3-D multiphase systems that feature non-symmetric material injection were then delineated and numerically tested. Following the development of the hydrodynamic modeling strategy, simulations of coal gasification were conducted using three different chemistry models. Simulated results were compared to experimental outcomes in an effort to assess the validity of each gasification chemistry model. The chemistry model that exhibited the highest degree of agreement with the experimental findings was then further analyzed identify areas of potential improvement.
3 Computational Simulation of Coal Gasification in Fluidized Bed Reactors Ryan Michael Soncini GENERAL AUDIENCE ABSTRACT Efficient utilization of coal is critical to ensuring stable domestic energy supplies while mitigating human impact on climate change. This idea may be realized through the use of gasification systems technologies. The design and planning of next-generation coal gasification reactors can benefit from the use of computational simulations to reduce both development time and cost. This treatise presents several studies where computational fluid dynamics was applied to the problem of coal gasification in a bubbling fluidized bed reactor with focuses on accurate tracking of solid material locations and modeling of chemical reactions.
4 Dedications To my wife Samantha, for following me three hundred miles from home to allow our love to flouris To my parents Margaret and Raymond, for their support and guidance throughout my life iii
5 Acknowledgements Reflecting on my time spent at Virginia Tech, I can state with confidence that I am a wiser and more rounded scientist and researcher. That said, I would like to take this opportunity and proclaim my gratitude to those who carried me from where I was as a student to where I am now as a professional. First, I would like to thank my advisor, mentor, and now friend Dr. Francine Battaglia. Her philosophy as an educator seeks to build the whole professional and helped me identify gaps in my competency as a researcher I did not know existed. For that, I will be forever grateful. I would also like to thank my committee members and my classroom instructors at Virginia Tech and elsewhere in the country. The field of gasification is multidisciplinary by nature and frequently took my studies outside of my comfortable skillset. Fortunately, I was afforded the knowledge of these experts to assist in my understanding. Finally, none of this work presented here would have been possible without the assistance of the skilled computational scientists who manage the high-performance computers at Virginia Tech. Therefore, I would also like to thank the entire workforce of Virginia Tech Advanced Research Computing for their stellar management and maintenance of the super-computers. iv
6 Table of Contents Dedications... iii Acknowledgements... iv Chapter 1. Introduction Motivation A Market for Gasification Technologies Utilizing CFD for Chemical Reactor Design Review of Gasification Technologies Thermochemical Conversion of Carbonaceous Fuels Pyrolysis Gasification Multiphase Flow and Fluidization Fluidized Bed Gasifiers Investigation Objectives Structure of this Dissertation Chapter 2. Literature Review Mathematical Modeling of Fluidized Beds Fluidization Theory Modeling Approaches and Methods Formulation and Phase Coupling v
7 Modeling of Aerodynamic Drag Adjustment for Non-Uniform Inlet Conditions Numerical Studies of Fluidized Bed Gasification Eulerian-Eulerian Bubbling Fluidized Bed Studies Eulerian-Eulerian Circulating Fluidized Bed Studies Eulerian-Lagrangian Studies Summary Chapter 3. Multiphysics Modeling of Fluidized Bed Chemical Reactors Governing Equations Constitutive Relations Equation of State Formulation of Phasic Stress Tensors Interphase Momentum Transfer Interphase Enthalpy Transport and Conductive Fluxes Granular Energy Transport and Dissipation Numerical Methods Discretization and Deferred Correction Solution Technique Chapter 4. Simulation of Sand and Coal Fluidization Under Various Conditions Cold-Flow Fluidization Behavior of Sand and Coal Experimental Setup, Procedure, and Results Computational Modeling Strategy and Parameter Adjustment Grid Resolution and Independence vi
8 4.1.4 Validation and Comparison of Numerical Simulations Principal Outcomes Fluidization Characteristics of Sand at Elevated Temperatures Fluid Properties and Minimum Fluidization Velocity Comparison of Fluidization Behaviors Principal Outcomes Modeling Coal Injection into a Fluidized Bed of Sand Experimental Setup and Procedure Point-Source Injection Modeling Modeling Considerations for Polydisperse Systems D Simulations of the Point-Source Injected System Similitude between 3-D and 2-D Fluidized Bed Simulations The 2-D Methodology in Theory and Practice A Method for Establishing Similitude in Material Injected Fluidized Beds Comparison of 3-D and 2-D Point-Source Injection Simulations Principal Outcomes Chapter 5. Modeling Coal Gasification in a Bubbling Fluidized Bed Reactor Analysis of Experiments Chemical Composition of Subbituminous Coal Product Distributions Total Product Distributions Gas Phase Composition vii
9 5.1.3 Thermodynamic Considerations Equilibrium Analysis Chemistry Modeling METC Gasifier Advanced Simulation Model HPTR Pyrolysis Model University of Delaware Model Numerical Simulations of Coal Gasification Assessment of Chemistry Models Analysis of the HPTR Model Results Principal Outcomes Chapter 6. Conclusions, Recommendations, and Remarks Summary of Findings Future Work and Recommendations Closing Remarks Appendix A References viii
10 List of Tables Table 1: Physical Properties of Sand and Coal Table 2: Comparison of Experimental and Simulated Solids Properties Table 3: Results of GCI Study Table 4: Fluid Properties of Nitrogen, Carbon Dioxide and Steam Table 5: Comparison of Predicted and Ergun Equation U mf Values for the Sand-Gas Systems.. 61 Table 6: Comparison of Carrier Stream Injection Velocities Table 7: Comparison of Volumetric and Mass Inputs for 3-D and 2-D Simple Fluidizaiton Table 8: 3-D, 2-D, and Adjusted 2-D Point-Source Injection Properties Table 9: Proximate Analysis of North Antelope Subbituminous Coal Table 10: Ultimate Analysis of North Antelope Subbituminous Coal Table 11: Total Product Yields (wt.%) for N 2 and CO 2 Gasification Table 12: Gas Phase Product Distributions (mole %) for N 2 and CO 2 Gasification Table 13: Combined Gas Phase Product Distributions (mole %) for N 2 and CO 2 Gasification Table 14: Comparison of Experiential and WGS Equilibrated Gas Compositions Table 15: Stoichiometric Coefficients for MGAS Pyrolysis and Tar Cracking Reactions Table 16: Stoichiometric Coefficients for HPTR Pyrolysis Model Table 17: Stoichiometric Coefficients for University of Delaware Model Table 18: Kinetic Parameters for University of Delaware Kinetics Model ix
11 Table 19: Experimental and Simulated Gas Mole Fractions for MGAS under N Table 20: Experimental and Simulated Gas Mole Fraction for MGAS under CO Table 21: Experimental and Simulated Gas Mole Fractions for HPTR under N Table 22: Experimental and Simulated Gas Mole Fractions for HPTR under CO Table 23: Experimental and Simulated Gas Mole Fractions for UD under N Table 24: Experimental and Simulated Gas Mole Fractions for UD under CO Table 25: Mean Relative Errors for each Chemistry Model at each Operating Condition x
12 List of Figures Figure 1: Roadmap of Thermochemical Conversion... 4 Figure 2: Fluid Bed System... 7 Figure 3: Fluidization Pressure Drop... 8 Figure 4: Control Volume with 1-D Compass Point Notation Figure 5: Downwind Weighting Factor Notation Figure 6: Schematic of Cold Flow Fluidization Vessel Figure 7: Sand Fluidization Results for (a) Pressure Drop and (b) Bed Expansion Figure 8: Coal Fluidization Results for (a) Pressure Drop and (b) Bed Expansion Figure 9: Schematic of Simulated Reactor Figure 10: Cold Flow Sand 2D Simulation Comparison for (a) Pressure Drop and (b) Bed Expansion Figure 11: Cold Flow Coal 2D Simulation Comparison for (a) Pressure Drop and (b) Bed Expansion Figure 12: Cold Flow Sand Grid Comparison for (a) Pressure Drop and (b) Bed Expansion Figure 13: Cold Flow Coal Grid Comparison for (a) Pressure Drop and (b) Bed Expansion Figure 14: Axial Profiles of Gas Volume Fraction for Cold Flow Sand GCI Analysis Figure 15: Axial Profiles of Gas Volume Fraction for Cold Flow Coal GCI Analysis xi
13 Figure 16: Validation of 2-D and 3-D Cold Flow Sand Simulations for (a) Pressure Drop and (b) Bed Expansion Figure 17: Validation of 2-D and 3-D Cold Flow Coal Simulations for (a) Pressure Drop and (b) Bed Expansion Figure 18: Axial Profiles of Gas Volume Fraction for 2-D and 3-D Cold Flow Sand Simulations Figure 19: Axial Profiles of Gas Volume Fraction for 2-D and 3-D Cold Flow Coal Simulations Figure 20: Contours of Gas Volume Fraction for 2-D Cold Flow Sand Simulations Figure 21: Contours of Gas Volume Fraction for 3-D Cold Flow Sand Simulations Figure 22: Contours of Gas Volume Fraction for 2-D Cold Flow Coal Simulations Figure 23: Contours of Gas Volume Fraction for 3-D Cold Flow Coal Simulations Figure 24: Comparison of Gas Volume Fraction for 2-D Cold Flow Sand and Coal Simulations Figure 25: Comparison of Gas Volume Fraction for 3-D Cold Flow Sand and Coal Simulations Figure 26: Pressure Drop for the Sand-Gas Systems at 700, 800, and 900 C Figure 27: Axial Profiles of Void Fraction Comparing Gas Species for 2U mf Simulations Figure 28: Axial Profiles of Void Fraction Comparing Gas Species for 8 cm/s Simulations Figure 29: Axial Profiles of Void Fraction Comparing Temperature for 2U mf Simulations Figure 30: Axial Profiles of Void Fraction Comparing Temperature for 8 cm/s Figure 31: Instantaneous Contours of Void Fraction for Nitrogen Fluidization at 2U mf Figure 32: Instantaneous Contours of Void Fraction for Carbon Dioxide Fluidization at 2U mf.. 65 xii
14 Figure 33: Instantaneous Contours of Void Fraction for Steam Fluidization at 2U mf Figure 34: Instantaneous Contours of Void Fraction for Nitrogen Fluidization at 8 cm/s Figure 35: Instantaneous Contours of Void Fraction for Carbon Dioxide Fluidization at 8 cm/s 67 Figure 36: Instantaneous Contours of Void Fraction for Steam Fluidization at 8 cm/s Figure 37: Schematic of Gasification Unit Figure 38: Radial-Azimuthal Plane Depicting Actual and Simulated Injection Sites Figure 39: Radial-Axial Plane Depicting Actual and Simulated Injection Sites Figure 40: Axial Profiles of Gas Volume Fraction for SSC Parametric Study Figure 41: Axial Profiles of Sand Volume Fraction for SSC Parametric Study Figure 42: Axial Profiles of Coal Volume Fraction for SSC Parametric Study Figure 43: Radial Profiles of Gas Volume Fraction for SSC Parametric Study Figure 44: Radial Profiles of Sand Volume Fraction for SSC Parametric Study Figure 45: Radial Profiles of Coal Volume Fraction for SSC Parametric Study Figure 46: Time-Averaged Contours of Gas Volume Fraction for Point-Source System Figure 47: Time-Averaged Contours of Sand Volume Fraction for Point-Source System Figure 48: Time-Averaged Contours of Coal Volume Fraction for Point-Source System Figure 49: Instantaneous Contours of Gas Volume Fraction at 700 C Figure 50: Instantaneous Contours of Gas Volume Fraction at 800 C Figure 51: Instantaneous Contours of Gas Volume Fraction at 900 C Figure 52: Schematics of 3-D cylindrical (left) and 2-D Cartesian (right) domains Figure 53: Axial Profiles of Gas Volume Fraction for 3-D and 2-D Point-Source Simulations.. 87 Figure 54: Axial Profiles of Sand Volume Fraction for 3-D and 2-D Point-Source Simulations 87 Figure 55: Axial Profiles of Coal Volume Fraction for 3-D and -2-D Point-Source Simulations 88 xiii
15 Figure 56: Axial Profiles of Coal Volume Fraction for 3-D and 2-D Simulations for Entire Reactor Figure 57: Axial Profiles of Gas Volume Fraction for 3-D and 2-D Coal Only Injection Figure 58: Axial Profiles of Sand Volume Fraction for 3-D and 2-D Coal Only Injection Figure 59: Axial Profiles of Coal Volume Fraction for 3-D and 2-D Coal Only Injection Figure 60: Total Product Distribution for (left) N 2 and (right) CO 2 Gasification Figure 61: Gas Phase Product Distributions for (left) N 2 and (right) CO 2 Gasification Figure 62: Combined Gas Phase Product Distributions for (left) N 2 and (right) CO 2 Gasification Figure 63: Gibbs Free Energy of Reaction for CO 2 and H 2 O Gasification Figure 64: Equilibrium Constant for (top) WGS and (bottom) SRM Figure 65: Plots of Effluent Species Mole Fraction with Time for the MGAS Model under N Figure 66: Plots of Effluent Species Mole Fraction with Time for the MGAS Model under CO Figure 67: Plots of Effluent Species Mole Fraction with Time for the HPTR Model under N Figure 68: Plots of Effluent Species Mole Fraction with Time for the HPTR Model under CO Figure 69: Plots of Effluent Species Mole Fraction with Time for the UD Model under N Figure 70: Plots of Effluent Species Mole Fraction with Time for the UD Model under CO Figure 71: Axial Profiles of Gas Mole Fractions for HPTR Simulations under N Figure 72: Axial Profiles of Gas Mole Fractions for HPTR Simulations under CO Figure 73: Contours of Gas Volume Fraction for HPTR Model Simulations under N Figure 74: Contours of Gas Volume Fraction for HPTR Model Simulations under CO xiv
16 Figure 75: Contours of Sand Volume Fraction for HPTR Model Simulations under N Figure 76: Contours of Sand Volume Fraction for HPTR Model Simulations under CO Figure 77: Contours of Coal Volume Fraction for HPTR Model Simulations under N Figure 78: Contours of Coal Volume Fraction for HPTR Model Simulations under CO Figure 79: Contours of Drying Reaction Rate for HPTR Model Simulations under N Figure 80: Contours of Drying Reaction Rate for HPTR Model Simulations under CO Figure 81: Contours of Pyrolysis Reaction Rate for HPTR Model Simulations under N Figure 82: Contours of Pyrolysis Reaction Rate for HPTR Model Simulations under CO Figure 83: Contours of Steam Gasification Rate for HPTR Model Simulations under N Figure 84: Contours of Steam Gasification Rate for HPTR Model Simulations under CO Figure 85: Contours of Carbon Dioxide Gasification Rate for HPTR Model Simulations under N Figure 86: Contours of Carbon Dioxide Gasification Rate for HPTR Model Simulations under CO Figure 87: Contours of Water-Gas Shift Reaction Rate for HPTR Model Simulations under N Figure 88: Contours of Water-Gas Shift Reaction Rate for HPTR Model Simulations under CO xv
17 Chapter 1. Introduction Education is what remains after one has forgotten everything he learned in school. Albert Einstein Advancement of gasification systems technologies offers significant potential for improved efficiency and sustainability in the utilization of solid carbonaceous fuel materials such as coal, petroleum coke, and renewable biomass feedstocks. The application of simulation-based, virtual reactor design strategies may expedite the achievement of realizable enhancements to gasification processes. The efforts presented in this treatise seek to progress the area of computational reactor design as it pertains to the advancement of gasification systems. 1.1 Motivation It is obligatory to begin any extensive work of this variety by addressing the exigent demand for the efforts presented. In making a case for the study of gasification systems modeling, it is necessary to provide arguments in favor of gasification as a general technology, and to establish the need for accurate computational simulation strategies. To that end, this section addresses the role carbonaceous fuel gasification can play in the continuously evolving markets of energy and chemical production, while also demonstrating that computational fluid dynamics modeling is invaluable to the design of successful gasification systems. 1
18 1.1.1 A Market for Gasification Technologies Gasification is an attractive option for carbonaceous fuel utilization due to its many advantages over traditional combustion systems; including improved emissions control, affinity toward carbon capture, flexibility of compatible feedstocks, and enhanced process efficiency [1, 2]. The U.S. Department of Energy (DOE) has acknowledged that gasification technologies show promise in addressing the energy and chemical production needs of the future and have set fourth research efforts toward the advancement of gasification systems [3]. The production of gas from coal has been studied since the early 1600s, leading to many chemical and energy production technologies [4]. Presently, the world-wide production of syngas by gasification is approximately 100 MW, with an additional 100 MW of production capacity currently under construction [5]. Global production capacity is projected to exceed 250 MW by The majority of the production capacity, as well as the planned operations, reside in Asia and Australia. Greater than half of the current global syngas production capacity is derived from coal, with the majority of planned facilities intending to utilize coal as well. Coal gasification shows potential to supplement chemical and energy production demands; however, similar to all fossil fuels, coal utilization results in carbon dioxide pollution. Co-feeding coal and biomass may off-set the carbon footprint of a gasification process. Furthermore, the addition of biomass may help enhance the H 2 content of the produced syngas. The concept of synthesis gas tailoring has led to a current, DOE funded, investigation of coal/biomass co-feeding in a catalytic fluidized bed for the production of optimal syngas, undertaken collaboratively by Dr. Francine Battaglia at Virginia Tech, Dr. Michael T. Klein at the University of Delaware, and Dr. Foster A. Agblevor at Utah State University. The present work shown here is a contribution to that ongoing investigation. 2
19 1.1.2 Utilizing CFD for Chemical Reactor Design Computational fluid dynamics (CFD) is a multidisciplinary field of study encompassing fluid mechanics, numerical mathematics, and computer science. CFD involves the use of high performance computing hardware to numerically approximate solutions to the equations believed to govern fluid motion. The CFD design strategy has allowed scientists and engineers alike to improve experimental planning and reduce development cost in the areas of aviation and aeronautics. The fundamental utility of numerical simulation is to provide high fidelity, quantitative results concerning the dynamics of a system whose complexity is such that the postulated governing theories do not lend themselves to closed-form analytic solutions. This in mind, it is the goal of CFD to reduce both development time and expense by replacing costly iterative prototyping design strategies with equivalent numerical experiments that accurately convey the dynamics of the physical system of interest. Inherent to the CFD design strategy is the development of the mathematical models believed to govern the physics of the system of interest. The postulates of mass, momentum, and energy conservation provide the foundation on which an effective mathematical formulation can be built. In the case of employing CFD for the design of chemical reactors, the model requires the addition of species balance equations and kinetic rate expressions to convey the chemical composition of the matter within the reactor and the rate at which the chemical reactions occur. The use of accurate rate expressions is critical in the design of chemical processes as the chemistry of the system can have significant impact on the performance and safety of the reactor. Chemical production operations must be able to accurately predict a proposed facility s yield of the desired marketable product in order to assess the economic viability of the venture, and the potential dangers of a process must be well understood to prevent accidental losses. 3
20 1.2 Review of Gasification Technologies The study of gasification is multidisciplinary by nature, requiring a diverse background in chemistry, heat transport, and fluid dynamics. The following section provides a basic overview of gasification technologies Thermochemical Conversion of Carbonaceous Fuels Thermochemical conversion of carbonaceous fuel utilizes heat energy to decompose and reform the virgin feed material into useful products of varying phases. The overall process may be separated into several steps. Figure 1 shows a schematic describing the basic process of thermochemical conversion. Liquids Upgrading Carbonaceous Fuel Pyrolysis Solids Gasification Useful Products Gases Reforming Figure 1: Roadmap of Thermochemical Conversion The depiction given in Figure 1 is undoubtedly an oversimplification of the thermochemical process as some steps may occur simultaneously depending on temperature, heating rate, and atmospheric composition; however, the figure does provide an adequate roadmap of the process which must be understood to investigate the process of gasification. 4
21 Pyrolysis During the initial thermal treatment of a carbonaceous material, the virgin feed will undergo a devolatilization, or destructive distillation, process yielding solid, liquid, and gaseous products. The term pyrolysis may be used to describe the initial devolatilization process in an oxidizing atmosphere or the entirety of a thermal treatment regimen if conducted in an inert atmosphere [6-8]. The composition and distribution of macroscopic pyrolysis products vary with the severity and duration of the thermal treatment. The solid product, referred to from here onward as char, is comprised primarily of carbon with varying small amounts of other elemental, e.g. oxygen, and inorganic, e.g. alkali metal, inclusions [9, 10]. Liquid and gaseous product compositions depend heavily on the temperature and vapor residence times of the pyrolysis process, as potentially condensable compounds may decompose to form permanent gases under prolonged thermal exposure. This results in a liquid and gaseous composition spectrum of various aliphatic, cyclic, and aromatic hydrocarbons, alongside phenols and alcohols [11-13]. The phasic product distribution is dependent upon temperature and heating rate with slow, low temperature treatment favoring the production of char, rapid treatment at moderate temperatures favoring liquids, and high temperature systems favoring the production of gases [9, 13]. As with the phasic product distributions and compositions, the structural characteristics of the resulting char are dependent upon the pyrolysis conditions. Char porosity, internal surface area, and pore size generally increase with increasing pyrolysis pressure [14, 15]. Similar trends have been observed with increasing particle heating rate [16, 17]. Such characteristics and trends are important as the morphology of the char material is known have an impact on its gasification kinetics [18, 19]. 5
22 Gasification Gasification is the process of converting the organic fraction of a solid fuel material to gases. Gasification conceptually differs from combustion in that the intent of gasification is for the produced gas to maintain, to the highest extent possible, the enthalpy of combustion of the solid fuel material [20]. Gasification may refer to the entire gas-producing process, including pyrolysis, or simply the conversion of the pyrolytic solid, depending on the designation of the fuel material. Because this work focuses on the utilization of a fuel material that has not undergone prior thermal treatment, i.e. raw coal, gasification will refer to the reaction of char with oxidizing agents other than diatomic oxygen. Reactions where diatomic oxygen is the oxidant are referred to as combustion reactions. Equations (1.1) through (1.3) convey the gasification reactions along with their corresponding enthalpies of reaction, H r. Equation (1.4) shows the complete char combustion reaction. C + H 2 O CO + H 2 C + CO 2 2CO H r = +131 kj mol (1.1) H r = +173 kj mol (1.2) C + 2H 2 CH 4 H r = 75 kj mol (1.3) C + O 2 CO 2 H r = 394 kj mol (1.4) Equations (1.1), (1.2), and (1.3) are the steam, carbon dioxide, and methanation gasification reactions respectively. Note that the steam and carbon dioxide gasification reactions are fairly endothermic, with methanation being mildly exothermic. This highlights the necessity of continuous thermal input to the system for gasification to occur. Diatomic oxygen may be fed in addition to the gasifying agent to provide heat, or heat may be introduced by another source. 6
23 1.2.2 Multiphase Flow and Fluidization The process of thermochemical conversion of solids fuels inherently involves the interaction of solid particles and a gaseous fluid. Rudimentary distinction of gasifier design lies in the different ways the solid fuel and gaseous oxidant may mechanically interact. To introduce the mechanics of gas-particle flows, a thought experiment is borrowed from Dimitri Gidaspow s book Multiphase Flow and Fluidization [21]. Consider a tube whose axial coordinate is coincident to the direction of gravity. The tube is partially filled with a granular solid, collectively referred to as the bed. The bed is supported from beneath by a porous distributor plate, through which a gaseous fluid flows. The described system is depicted in Figure 2. Freeboard Particle Bed Gas Flow Figure 2: Fluid Bed System 7
24 The impinging fluid imposes a force on the particles within the bed that is proportional to the gas velocity, resulting in a pressure drop across the bed. There are effectively three distinct states of such a system, each of which is characterized by the gas velocity. The first of these states arises when the gas velocity is too low to generate a pressure drop capable of supporting the weight of the bed. In this instance, the granular material will remain stationary, and the fluid will flow through the bed as though it were a porous solid, referred to as a fixed bed. If the gas velocity is increased to the point where the pressure drop is capable of supporting the weight of the granular solid, the bed will begin to expand in height as the particles exhibit motion induced by the force of the fluid. The bed will then have achieved what is referred to as the fluidized state, where the particles are visibly under the influence of the gravity and aerodynamic drag. The fluidized state is characterized by vigorous mixing of the solid material and the particle bed, exhibiting behavior similar to that of a fluid. The gas velocity that initiates the onset of fluidization is called the minimum fluidization velocity. Once the bed has achieved bubbling fluidization, the pressure drop remains constant. This behavior is shown in Figure 3. Pressure Drop Minimum Fluidization Velocity Gas Velocity Figure 3: Fluidization Pressure Drop 8
25 The last possible state of the system occurs when the gas velocity is large enough to generate aerodynamic drag much greater than the force of gravity. This results in the particles being pneumatically transported with the fluid and is referred to as entrained flow. These three states of the gas-particle system typify the three basic categories of gasification reactors: fixed bed, fluidized bed, and entrained flow [22]. While many of the modeling techniques presented in this work are applicable to all of the reactor configurations, they are only computationally applied to fluidized bed systems. Therefore, this treatise will only include a detailed discussion of fluidized bed gasifiers. For a comprehensive dialogue of fixed bed and entrained flow gasifiers, the reader is referred elsewhere [20, 22] Fluidized Bed Gasifiers Fluidized bed reactors are renowned for their ability to thoroughly mix solids, achieve high rates of heat transfer, and maintain a stable bed temperature [21]. These qualities are desirable in a gasification system as the thermal condition of the reactor affects the composition of the gaseous products. Fluidized bed gasifiers can accommodate a variety of pressures to cater to downstream processes or gaseous compositions and are typically operated at moderate temperatures ( C) [10, 22, 23]. This temperature range is utilized to provide adequate carbon conversion rates while remaining below the ash softening point [20]. Softened or molten ash is referred to as slag. While some slagging fluidized bed configurations have shown success, ash softening is typically avoided as it may lead to particle agglomeration followed by defluidization. 9
26 1.3 Investigation Objectives The goal of this effort is to provide a comprehensive review and characterization of coal gasification modeling strategies to enable informed reactor design decisions. This study seeks to quantitatively assess the suitability of several hydrodynamic and chemistry modeling strategies at various operating conditions with an eye toward development of an experimentally validatable computational model. Specific contributions to the field of gasification systems include methods for establishing similitude between 2-D and 3-D simulations for both system hydrodynamics and chemical kinetics. Furthermore, recommendations for improved accuracy of reduced-order kinetic modeling strategies are presented. 1.4 Structure of this Dissertation The previous sections have provided justification for advanced study in gasification technologies, as well as the necessary material to understand thermochemical conversion processes. Chapter 2 presents a review of fluidized bed gasification computational studies with specific focus on their choice of solids phase handling and chemistry modeling techniques. The simulations presented in this work are conducted using an Eulerian-Eulerian approach, the theory and numerical formulation for which is shown in Chapter 3. Hydrodynamic validation of the computational model with experimental results, followed by extension of the model to realistic gasification operating conditions is discussed in Chapter 4. Chapter 5 contains an assessment and comparison of chemical kinetic models with experimental results. Lastly, Chapter 6 presents a brief summation of Chapters 4 and 5 along with recommendations for future research. 10
27 Chapter 2. Literature Review If I have seen further than others, it is by standing upon the shoulders of giants Isaac Newton Inspection of the literature with regard to computational simulation of fluidized bed gasification reveals a lack of diverse operating conditions due, in part, to the limited number of CFD studies available. While a significant number of studies concerning the simulation of fluidization hydrodynamics have been published, not much has been accomplished in the area of fluidized bed gasification simulation. This chapter presents a review of contemporary academic literature concerning the use of CFD for the simulation of fluidized bed gasification systems. 2.1 Mathematical Modeling of Fluidized Beds Fluidization Theory As delineated in the previous chapter, the fluidized state is characterized by the ability of the impinging fluid to support the weight of the bed such that the solid granular material behaves like a fluid. The pressure drop generated across the particle bed is an important feature of fluidization, as profiles of pressure drop against inlet velocity serve as the primary indicator of the transition from a fixed bed to a fluid bed. In the fixed bed regime, the pressure drop will 11
28 increase as the velocity is increased. Once the system has achieved bubbling fluidization, the pressure drop will remain constant. This constant pressure drop is proportional to the mass of the bed material as indicated by Equation (1.5), where P is the post-fluidization pressure drop, m is the mass of the bed, A is the cross-sectional area of the fluidization vessel normal to the direction of flow, and g is the gravitational acceleration. P = mg A (1.5) Theoretical prediction of the minimum fluidization velocity is frequently accomplished using the Ergun equation [24], shown by Equation (1.6). Here, U mf denotes the minimum fluidization velocity, ψ is the particle sphericity, d p is the mean particle diameter, ρ s is the particle density, ρ g is the gas density, ε is the packed bed void fraction, and μ g is the gas viscosity. U mf = (ψd p) 2 (ρ s ρ g )g(ε ) 3 150μ g (1 ε ) (1.6) Particle characteristics can significantly impact fluidization behavior. This observation is best described by Geldart s classification of granular solids [25], which delineates the effect particle size and density have on the fluidization characteristics of gas-solids systems and proceeds to group particles by behavior. Group A particles are referred to as aeratable, as they exhibit significant bed expansion prior to the formation of bubbles. They are typified by low particle densities (< 1.4 g/ml) and small particles diameters. Group B particles are characterized as having moderate particle densities ( g/ml) and diameters (40-500μm) and exhibit bubble formation immediately upon fluidization. Group C particles are referred to as cohesive, as they tend to display plug-flow behavior rather than fluidization. Finally, Group D particles are typified by large particle diameters and manifest spouting and channeling fluidization behavior. 12
29 2.1.2 Modeling Approaches and Methods Formulation and Phase Coupling The two prevailing approaches toward the mathematical modeling of multiphase flow systems are the Eulerian-Eulerian, or multi-fluid, model [26, 27] and the Eulerian-Lagrangian, or discrete element, model [28]. Fundamental distinction between these two approaches involves the handling of phase coupling. The multi-fluid model treats the fluid and solids phases as interpenetrating continua, whereas the discrete element method utilizes a continuum formulation for the gas phase while applying a Lagrangain framework toward the tracking of discrete solids particles Modeling of Aerodynamic Drag The prediction of aerodynamic drag is critical to the accuracy of any gas-solids modeling strategy. Several studies providing comparative assessments of existing drag models were identified by this review [29-31]. Estejab and Battaglia [29] performed 2-dimensional, multifluid simulations of coal-biomass mixtures with Geldart A particles and validated their results for pressure drop and bed expansion with experimental findings. Estejab and Battaglia found the Huilin-Gidaspow drag model provided the best validation among the tested models. Du et al. [30] performed multi-fluid simulations of Geldart D particles in a spouted fluid bed. They reported that the Gidaspow drag model provided the best validation when compared to experimental voidage profiles and particle velocity profiles. Taghipour et al. [31] applied the Syamlal-O Brian, Gidaspow, and Wen-Yu drag models to simulations of bubbling Geldart B particles and compared the results to experimental findings. They demonstrated that all three models were capable of accurately predicting pressure drop and bed expansion. 13
30 Adjustment for Non-Uniform Inlet Conditions Fluidization vessels contain a device called a distributor plate which is designed to distribute the gas across the vessel inlet [32]. These devices are typically plates perforated with holes that allow the flowing gas to enter the fluidization region. In some systems, granular material may rest between the perforated holes, causing small amounts of the granular media to not fluidize. These regions of non-fluidized material are referred to as dead-zones. Reconciliation of the discrete nature of real-world distributor plates with the uniform inlet boundary conditions typically applied to fluidization simulations is crucial to achieving accurate results for bed expansion and pressure drop. Kanholy et al. [33] demonstrated the need for a parameter adjustment strategy to account for the non-uniform inlet condition of experimental fluidization apparatuses and derived a procedure that reconciles experiments and simulations. In Kanholy et al., the authors delineate a procedure where the bed mass is adjusted using the experimental post-fluidization pressure drop and Equation (1.5), and the packed bed void fraction is adjusted using the experimental minimum fluidization velocity and solving Equation (1.6) for ε. 2.2 Numerical Studies of Fluidized Bed Gasification The literature concerning CFD simulation fluidized bed gasification may be sub-divided according to the hydrodynamic modeling technique, i.e. Eulerian-Eulerian or Eulerian- Lagrangian, the fluidization regime, and the nature of the fuel. In this review, studies utilizing biomass and coal as feed material are considered. Both bubbling fluidized bed and circulating fluidized bed investigations are included. 14
31 2.2.1 Eulerian-Eulerian Bubbling Fluidized Bed Studies The contemporary Eulerian-Eulerian CFD studies of bubbling fluidized bed coal gasification located for this review [34-39] all share the same basic operating conditions and validation data [40]. Ocampo et al. [40] conducted gasification experiments of a Colombian coal at C under a steam and air atmosphere of varying composition. The reactor was initially filled with a small bed of limestone. During the experiment, coal and limestone were fed into the reactor through a side injection inlet. The study reports gaseous effluent compositions for several differing atmospheres and feed rates. The study by Armstrong et al. [34] attempted to capture the effect of limestone calcination on the coal gasification process. Simulations were conducted at 812 and 855 C in an air and steam atmosphere. A kinetic-diffusion type model was used for the reaction of char with oxygen, while first-order Arrhenius rate equations were employed for the gasification reactions. The inclusion of calcination did little to improve the agreement in effluent gas mole fractions between the simulations and experiments. Relative errors in gas mole fraction range from 4-97%, with the highest errors being attributed to small CH 4 concentrations in the experimental effluent. If methane is excluded from consideration, then the relative errors range from 4-52%. The simulations consistently under-predict CO 2 and H 2 production while over-predicting CO production, leading to 38-40% relative error in the prediction of the H 2 /CO ratio, an important metric in the consideration of downstream processes. The author attributes discrepancies in gas mole fraction to the use of char and limestone as an initial bed material and the occurrence of water-gas shift (WGS) in the freeboard. 15
32 These same authors then conducted a parametric study [35] that included WGS in the homogeneous gas reaction model while utilizing the same heterogeneous reaction model from their previous investigation [34]. In this study four simulations were conducted under various operating conditions consistent with the Ocampo experiments. The resulting gas effluent values showed consistent under-prediction in CO, CO 2, H 2, and CH 4 concentrations. Relative errors ranged from 20-99%, with the highest again being attributed to small amounts of CH 4 in the effluent gas. If methane is excluded from consideration, the relative errors range from 20-56%. Cornejo and Farias [36] developed a mathematical model to describe coal gasification. They utilized the Kinetic Diffusion Surface Reaction Model [41, 42] for the rates of combustion, CO 2 gasification, and H 2 O gasification. The methanation reaction was not included in their model. The reported gas compositions show prediction accuracy varying with reactor operating condition. Effluent compositions are reported as figures. Esmaili et al. [37] conducted six simulations at temperatures ranging from C under varying air/steam feed rates. They employed n th order Arrhenius kinetics for all gasification reactions. The CO 2 gasification rate equation was 0.31 order, and the steam gasification reaction was 0.73 order. Average relative errors for relevant gas mole fractions ranging from 9-14% were reported. The study by Wang et al. [38] conducted 3-D computational simulations of the Ocampo reactor. This study used kinetic-diffusion type models with Arrhenius intrinsic kinetic rates for all oxidizing agents. The rate expressions were first order in oxidant partial pressure. The study consistently under-predicted CO and CH 4 production while over-predicting CO 2 and H 2. This type of prediction error drastically affects the H 2 /CO ratio as the predictions show a ratio greater than one while the experiments show a ratio less than one. 16
33 The last Eulerian-Eulerian coal study reviewed is that of Yu et al. [39]. Six simulations were conducted at various operating conditions consistent to those used in the Ocampo experiments. This study employed a kinetic-diffusion type rate equation for all of the char-gas reactions and utilized Arrhenius-type expressions for intrinsic chemical kinetics rates. While it is difficult to see from the figures reported, it appears that the simulations consistently over-predict H 2 production while under-predicting CO. Three Eulerian-Eulerian CFD studies of biomass gasification in bubbling fluidized beds were identified for this review [43-45]. Gerber et al. [43] performed 2-D simulations of a laboratory scale, air-fed wood gasifier using char as a bed material. The combustion reaction was modeled using a kinetic-diffusion type expression, while the gasification reactions were modeled by 1 st order Arrhenius power law rate equations. Validation data came from in-house experiments. Relative errors in effluent gas composition varied from 7-80% with the high associated with methane. If methane were excluded, the range reduces to 7-30%. The study by Silva et al. [44] investigated gasification of three Portuguese biomasses in an air fed bubbling fluidized bed reactor at 790 and 815 C. Experimental and simulated gas effluent values were reported for one of these fuels at three operating conditions. The resulting figures showed little consistency in the quality of gas effluent prediction across operating conditions. The low temperature simulations under-predicted H 2 production by approximately 3 mole percent while the high temperature simulation over-predicted H 2 production by about 3 mole percent, as well. CO production was consistently under-predicted by about 3 mole percent. The study by Xue and Fox [45] presented a biomass gasification modeling strategy utilizing a variable fuel density. This study employed a modified Arrhenius for all heterogeneous reaction rates. The investigation presented no validation. 17
34 2.2.2 Eulerian-Eulerian Circulating Fluidized Bed Studies Two Eulerian-Eulerian circulating fluidized bed (CFB) studies were identified for this review [46, 47]. The study by Liu et al. [46] simulated the gasification of biomass in an air atmosphere. This study employed a kinetic-diffusion type model in all heterogeneous char reactions. The peak reactor temperature is approximately 1000 C. The results were validated against the experimental findings of Garcia-Ibanez et al. [48]. Comparisons of the gaseous effluent were reported as a figure, making it difficult to assess the quality of the simulation result. Furthermore, the choice to use only air as the oxidant makes combustion the primary mode of char conversion, thus limiting the applicability of such a model to actual gasification systems. The study by Zhang et al. [47] simulated coal gasification in a CFB reactor at 1100 to 1200 K under an air/steam atmosphere. This investigation utilized the MGAS model [49] in all reactions. Gas compositions were validated against in-house experimental data. The reported comparison figure showed over-prediction of CO and CO 2 and CH 4. The concentration of H 2 is under-predicted Eulerian-Lagrangian Studies Five Eulerian-Lagrangian CFD studies are considered in this review [50-54]. The study by Gräbner et al. [50] computationally investigated the gasification of coal in a High-Temperature Winkler gasifier under a steam and oxygen atmosphere at 33 bar. The study employed a kineticdiffusion type model with an Arrhenius chemical term for char consumption, though the considered oxidizing species were not reported. This study provided no validation of its results. 18
35 The computational investigation of Ku et al. [51] studied the gasification behavior of biomass in a steam atmosphere at 820, 870 and 920 C. This effort used a kinetic-diffusion type model with a modified Arrhenius chemical term. Effluent gas compositions were validated against the experimental findings of Song et al. [55] The validation was reported as a set of figures. Absolute deviations in relevant gas mole percent appear to not exceed 10%. Loha et al. [52] simulated the air/steam gasification of rice husk in a bubbling fluidized bed at 800 C. This study employed first-order Arrhenius kinetics in combustion and Langmuir- Hinshelwood type expressions for steam and CO 2 gasification. Gaseous effluent compositions were validated against an experimental study by the same research group [56]. Graphical comparisons were presented for all tested operating conditions. The figures showed good agreement between the simulations and experiments. Numerical comparison was reported for one of the tested operating conditions. The numerical results showed relative errors of 12, 0, 13, and 34% in H 2, CO, CO 2, and CH 4 production, respectively. The study by Oevermann [53] investigated bubbling fluidized bed gasification of wood in air at approximately 700 C. This study used Arrhenius rate equations in combustion and CO 2 gasification while employing a Langmuir-Hinshelwood expression for steam gasification. The resulting gas compositions were validated against in-house experimental data. Agreement is difficult to assess, as the simulated fuel feed rates were one twentieth to one-tenth of that used in the experimental measurement. Effluent results from the feed rate that matched the fuel to air ratio exhibited 9-46% relative error in relevant gas concentrations. Lastly, Xie et al. [54] simulated bubbling fluidized bed gasification of coal in air and steam at 822, 841, and 866 C. First-order modified Arrhenius expressions were used for all heterogeneous char reaction rate equations. Gaseous effluent was validated against the 19
36 experimental data of Ocampo [40]. Comparisons are presented as figures. The figures showed consistent under-prediction of CO 2 and H 2 with over-prediction of CO and CH Summary A review of fluidized bed modeling strategies revealed important considerations regarding aerodynamic drag models and modeling considerations for non-uniform inlet conditions. The Huilin-Gidaspow drag model was shown effective for both systems of Geldart A and B particles. Also, a procedure to reconcile uniform inlet simulation boundaries and non-uniform experimental distributor plates was identified for use in this work. Review of the scientific literature concerning CFD simulation of fluidized bed gasification has revealed a multitude of chemistry rate equation permutations. The bulk of these investigations were conducted at temperatures of 700 to 900 C using air as the sole oxidant or a mixture of air and steam. All of the reviewed studies attempted to model gasification of a virgin feed material. Some authors utilized kinetic-diffusion type models for all of the char-gas reactions, while others only applied diffusional models to char combustion. Intrinsic chemical rates are typically modeled using Arrhenius-type expressions with a small minority choosing to employ Langmuir-Hinshelwood relations. Studies that do not apply diffusion theories to the gasification reactions typically assume a power law rate equation of first-order with only one investigation utilizing effective fractional orders. This level of variability in the chemical kinetic models, considering the narrow range of operating conditions used, warrants investigation of the efficacy of various chemical modeling techniques. 20
37 Chapter 3. Multiphysics Modeling of Fluidized Bed Chemical Reactors Young man in mathematics you don t understand things, you just get used to them John von Neumann The simulations presented in this work were performed using the Multiphase Flow with Interphase exchanges (MFiX) software package, which is developed and maintained by the U.S. Department of Energy at the National Energy Technology Laboratory (NETL). This chapter introduces the theoretical formulation of the multiphase governing equations, as well as the numerical methods invoked by MFiX for their approximate solution [57, 58]. 3.1 Governing Equations The Eulerian-Eulerian framework, on which the MFiX multi-fluid model is based, treats individual phases as interpenetrating continua. Point variables are volume-averaged over a region that is sufficiently large compared to the spacing of the disperse phases, yet small when contrasted to the totality of the flow domain. The development of the multiphase governing equations requires the definition of phasic volume fractions to represent the proportion of the averaging volume occupied by each phase. Because this work is concerned solely with gas-solids flows, ε g is used to denote the fraction of the volume occupied by the gas phase and ε s,m is used to represent the fraction of the volume occupied by the m th solids phase. 21
38 Definition of the phasic volume fractions facilitates the development of mathematical formulations pertaining to the various conservation postulates with regard to chemically reacting, multiphase systems, i.e. mass, momentum, energy, granular energy, and species conservation. General formulae of these postulates are presented in this section. Constitutive relations necessary for closure of the resulting system are presented in the following section. Equations (3.1) and (3.2) convey the postulate of mass conservation with regard to the gas and solids phases, respectively. Here, ρ denotes the microscopic material density, u is the velocity vector, N is the number of chemical species comprising the phase of interest, and R n represents the rate of creation or destruction of chemical species n within the phase of interest. N g t (ε gρ g ) + (ε g ρ g u g) = R g,n n=1 N s,m t (ε s,mρ s,m ) + (ε s,m ρ s,m u s,m ) = R s,m,n n=1 (3.1) (3.2) Equations (3.3) and (3.4) communicate linear momentum conservation with regard to the gas and solids phases respectively. Here, σ denotes the stress tensor of the phase of interest, g is the gravitational force, and I denotes the interphase interaction forces. Gas-particle interactions, denoted by I g,m, account for aerodynamic drag, buoyancy, and momentum transfer by means of mass transfer. t (ε gρ g u g) + (ε g ρ g u gu g) = σ g + ε g ρ g g I g,m t (ε s,mρ s,m u s,m ) + (ε s,m ρ s,m u s,m u s,m ) M m=1 = σ s,m + ε s,m ρ s,m g + I g,m I m,l M m=1,m l (3.3) (3.4) 22
39 Equations (3.5) and (3.6) present the postulate of energy conservation in terms of enthalpy. Here, T denotes the thermodynamic temperature, c is the constant-pressure heat capacity of the phase of interest, q denotes the flux vector, H g,m represents gas-solids interphase enthalpy transfer, and H denotes the enthalpy of reaction. These formulations of energy conservation assume that changes in internal energy resulting from viscous dissipation or compression are negligible, and that solid-solids interphase enthalpy transport is also negligible. ε g ρ g c g ( T g t + u g T g ) = q g H g,m H g (3.5) ε s,m ρ s,m c s,m ( T s,m t M m=1 + u s,m T s,m ) = q s,m + H g,m H s,m (3.6) Equation (3.7) conveys the postulate of granular energy conservation in terms of the granular temperature where Θ denotes the granular temperature, γ Θ represents the dissipation of granular energy by particle collisions, q Θ is the granular energy flux, and φ represents interphase granular energy transfer. M m=1 3 2 [ t (ε s,mρ s,m Θ s,m ) + (ε s,m ρ s,m Θ s,m u s,m )] = [σ s,m : u s,m q Θ,m γ Θ,m + φ g,m + φ m,l ] M m=1,m l (3.7) Finally, Equations (3.8) and (3.9) express the postulate of chemical species conservation in terms of the phasic species mass fractions, denoted by Y. t (ε gρ g Y g,n ) + (ε g ρ g Y g,n u g) = R g,n (3.8) t (ε s,mρ s,m Y s,m,n ) + (ε s,m ρ s,m Y s,m,n u g) = R s,m,n (3.9) 23
40 3.2 Constitutive Relations Equation of State The gas phase is assumed to behave as a Maxwell-Boltzmann gas, justifying the use of the ideal gas equation of state toward the determination of the gas microscopic material density. This relation is shown in Equation (3.10) where P g denotes the gas pressure, MW g is the average molecular weight of the gas, and R u is the universal gas constant. ρ g = P gmw g R u T g (3.10) Formulation of Phasic Stress Tensors It is assumed that the fluid phase obeys Newton s law of viscosity, allowing the fluid stress tensor to be written as Equation (3.11). In this equation, P g denotes the gas pressure, I is the identity tensor, and τ gdenotes the gas phase viscous stress tensor. σ g = P g I + τ g (3.11) The viscous stress tensor is defined in terms of the strain rate tensor, D g, the fluid viscosity, μ g, and the second coefficient of viscosity, λ g. Equations (3.12) and (3.13) describe the viscous stress tensor and the strain rate tensor, respectively. τ g = 2ε g μ g D g + ε g λ g tr(d g)i (3.12) D g = 1 2 [ u g + ( u g) T ] (3.13) 24
41 Definition of the solids stress tensor requires understanding of the nature of granular flows, which demonstrate differing physics depending on the particle dispersion. If the particles are densely packed, they will exhibit slow shearing and the dominant mode of momentum transfer will be contact friction. This type of slow shearing flow regime is referred to as plastic granular flow. On the contrary, if the particles are more dispersedly distributed, they will manifest rapid shearing, and the dominant mode of momentum transfer will be particle-particle collisions. Collision dominated particle flows are referred to as viscous granular flows. MFiX employs a technique attempting to capture both behaviors by utilizing applicable plastic flow theory when the gas volume fraction is below a specified threshold, i.e. the bed is densely packed, and applying viscous flow theory when the gas volume fraction is above that same threshold. Equation (3.14) demonstrates the method. Here, P s,m is the solids pressure, τ s,m is the solids viscous stress tensor, and ε g is the gas volume fraction at minimum fluidization. σ s,m = { P p s,m P v s,m p I + τ s,m if ε g ε g v I + τ s,m if ε g > ε g (3.14) Inspection of Equation (3.14) reveals its susceptibility to solids stress discontinuity for systems that undergo transitions in granular flow regime, such as bubbling fluidized beds. This discontinuous behavior in frictional stress modeling may hinder numerical convergence and reduce model accuracy. MFiX seeks to rectify the solids stress discontinuity issue through use of a dispersion weighted blending function that melds plastic and viscous theories for regions where the void fraction is near critical packing. The blending domain is defined as [0.99ε g, 1.01ε g ] and the blending function is given by Equation (3.15). φ blend (ε g ) = 1 2 [tanh (2π(ε g ε g ) 0.02ε g ) + 1] (3.15) 25
42 Equation (3.15) is applied to calculations of solids shear viscosity and solids pressure in accordance with Equation (3.16), where α denotes the quantity of interest. α = α v φ blend + α p (1 φ blend ) for ε g < 1.01ε g (3.16) The viscous theory utilized by MFiX is an extension of that proposed by Lun et al [59]. Definitions for the viscous solids pressure and viscous stress tensor are given in Equations (3.17) v v and (3.18). Here, μ s,m is the shear viscosity, λ s,m is the second coefficient of viscosity, and D s,m is the strain rate tensor. Equations (3.19) through (3.21) show formulae for these quantities. v τ s,m v P s,m = K 1,m ε 2 s,m Θ m (3.17) = 2μ v v s,m D s,m + λ s,m tr(d s,m )I (3.18) v λ s,m = K 2,m ε s,m Θ m (3.19) v μ s,m = K 3,m ε s,m Θ m (3.20) D s,m = 1 2 [ u s,m + ( u s,m ) T ] (3.21) The constants K 1,m through K 3,m are defined in Equations (3.22) through (3.24). These are functions of the coefficient of restitution for particle-particle collisions, e m,m, the particle density, ρ s,m, the radial distribution function, g 0,m,m, and the particle diameter, d p,m. The form of the radial distribution function is described later in this section. K 1,m = 2(1 + e m,m )ρ s,m g 0,m,m (3.22) K 2,m = 4d p,mρ s,m (1 + e m,m )ε s,m g 0,m,m 3 π 2 3 K 3,m (3.23) K 3,m = d p,mρ s,m 2 π { 3(3 e m,m ) [ (1 + e m,m)(3e m,m 1)ε s,m g 0,m,m ] + 8ε s,mg 0,m,m (1 + e m,m ) } 5 π (3.24) 26
43 In the case of plastic granular flow, MFiX employs a solids pressure function that allows limited solids compressibility, which is typical for plastic granular flows [60]. The definition of plastic solids pressure is given by Equation (3.25), with the form of P shown in Equation (3.26). P p s,m = ε s,m P (3.25) P = (ε g ε g ) 10 (3.26) The definition of the viscous stress tensor for the plastic regime is that of Schaeffer [61], which is shown in Equation (3.27). Equation (3.28) defines the plastic shear viscosity, where φ denotes the angle of internal friction and I 2D is the second invariant of the deviator of the strain rate tensor. p τ s,m p μ s,m = 2μ p s,m D s,m (3.27) = P sin(φ) 2 I 2D (3.28) Interphase Momentum Transfer Gas-solids interaction forces, I g,m, are calculated using the model shown by Equation (3.29), which accounts for aerodynamic drag, buoyancy, and momentum transfer by means of interphase mass transfer. Here, F g,m is the coefficient of drag and R g,m is the rate of gas-solids interphase mass transfer. Sign conventions are enforced by ξ g,m and ξ g,m, which are defined by Equation (3.30). I g,m = ε s,m P g F g,m (u s,m u g) + R g,m (ξ g,m u s,m + ξ g,m u g) (3.29) ξ g,m = { 1 for R g,m < 0 0 for R g,m 0 ; ξ g,m = 1 ξ g,m (3.30) 27
44 While MFiX allows for the use of a wide variety of gas-solids drag models, the relation employed by this work is the Gidaspow-Huilin model [62]. This model is an extension of the Gidaspow model [63], a potentially discontinuous piecewise combination of the Ergun model, Equation (3.31), and the Wen-Yu model [64], Equations (3.32) and (3.33). Here, Re is the Reynolds number. The Gidaspow-Huilin model seeks to make the Gidaspow model continuous through the introduction of a blending function, shown in Equation (3.34). Equation (3.35) shows the final formulation of the Gidaspow-Huilin drag model. F (Ergun) g,m = 150 ε s,m 2 μ g ε g d ρ gε s,m u s,m u g (3.31) p d p,m F (Wen Yu) g,m = 3 4 C ρ g ε g ε s,m 2.65 D u s,m u g ε d g (3.32) p,m C D = { 24 [ (ε gre) ] (εg Re) for Re < for Re 1000 (3.33) φ G H g,m = arctan[ (0.2 ε s,m)] + 1 π 2 F g,m = (1 φ G H g,m )F (Ergun) g,m + φ G H (Wen Yu) g,m F g,m (3.34) (3.35) Solids-solids interaction forces, I m,l, are determined in accordance with Equation (3.36), which considers contributions from particle-particle drag and momentum transfer by solidssolids mass transfer. Here, F m,l is the coefficient of drag and R m,l is the rate of solids-solids mass transfer. Sign conventions are enforced by ξ g,m and ξ g,m, which are defined by Equation (3.37). I m,l = F m,l (u s,l u s,m ) + R ml (ξ m,l u s,l + ξ m,l u g) (3.36) ξ m,l = { 1 for R m,l < 0 0 for R m,l 0 ; ξ m,l = 1 ξ m,l (3.37) 28
45 The coefficient of drag is found using the Syamlal model [65] shown in Equation (3.38). Here, C f,m,l denotes the coefficient of friction between the solids phases. The form of the radial distribution function implemented in MFiX is that of Lebowitz [66], shown in Equation (3.39). 3(1 + e m,l ) ( π 2 + C π 2 f,m,l 8 ) ε s,lρ s,l ε s,m ρ s,m (d p,l d p,m ) 2 g 0,m,l u s,l u s,m F m,l = 2π(ρ s,l d 3 3 p,l + ρ s,m d p,m ) g 0,m,l = 1 ε g + M 3d p,ld p,m ε g 2 (d p,l + d p,m ) ε s,k d p,k k=1 (3.38) (3.39) Interphase Enthalpy Transport and Conductive Fluxes Fourier s law of conduction is applied to all phases for the definition of conductive heat fluxes. Equations (3.40) and (3.41) show Fourier s model for the gas and solids phases, respectively. q g = ε g k g T g (3.40) q s,m = ε s,m k s,m T s,m (3.41) Interphase convective enthalpy transfer between the gas and solids phases is modeled using Equation (3.42), which is an extension of Newton s law of cooling. Here, γ g,m denotes the gas-solids enthalpy transfer coefficient. The gas-solids enthalpy transfer coefficient is described in terms of the gas heat capacity, the rate of interphase mass transfer, and the heat transfer coefficient in the absence of mass transfer, γ 0 g,m. Equation (3.43) provides the definition of γ g,m. H g,m = γ g,m (T s,m T g ) (3.42) γ g,m = c g R g,m exp ( c gr g,m 0 ) γ g,m (3.43) 29
46 0 The quantity γ g,m is determined by Equation (3.44), where Nu m is the particle Nusselt number, given by Equation (3.45). The Nusselt number is a function of the particle Reynolds number, Re m, and the Prandtl number, Pr, defined in Equations(3.46) and (3.47), respectively. 0 = 6k gε s,m Nu m 2 (3.44) γ g,m d p,m Nu m = (7 10ε g + 5ε g 2 )( Re m 0.2 Pr 1/3 ) + ( ε g + ε g 2 )Re m 0.7 Pr 1/3 (3.45) Re m = d p,m u s,m u g ρ g μ g (3.46) Pr = c gμ g k g (3.47) Granular Energy Transport and Dissipation Conduction of granular energy is modeled using Fourier s law, allowing for the diffusive flux vector to be written as shown in Equation (3.48). The coefficient of granular energy diffusion is given by Equation (3.49). The dissipation of granular energy and the interphase granular energy transfer are described by Equations (3.50) and (3.51), respectively. q Θ,m = k Θ,m Θ m (3.48) k Θ,m = 15d p,mρ s,m ε s,m πθ m 4(41 33η) [ η2 (41 33η)ε s,m g 0,m,m π (41 33η)ηε s,mg 0,m,m ] ; η = 1 2 (1 + e m,m) γ Θ,m = 12(1 e 2 m,m)ρ s,m g 0,m,m ε 2 3/2 s,m Θ m d p,m π (3.49) (3.50) φ Θ,m = 3F g,m Θ m (3.51) 30
47 3.3 Numerical Methods The aforementioned governing and constitutive equations were numerically solved using the MFiX suite of multiphase flow algorithms. This section presents the relevant numerical methods invoked within MFiX to generate the simulations presented in this work Discretization and Deferred Correction The hydrodynamics of fluidized bed systems are dominated by convective transport. This observation is most simply demonstrated in the work by Madhava Syamlal [67], where several spatial discretization schemes were applied to the solids continuity equation for a moving plug problem. It was shown by Syamlal that while the first-order upwind discretization scheme produces a stable set of finite-volume differencing equations, the strategy suffers from significant numerical diffusion. The concept of numerical diffusion and discretization sensitivity in gas-solids flows was further delineated in a later work by Guenther and Syamlal [68], where the authors demonstrated the effect of spatial discretization schemes on simulations of isolated gas bubbles in a granular media. The discussion of discretization presented here borrows largely from their work, as Guenther and Syamlal [68] present the topic in adequate yet concise detail. MFiX employs a finite volume approach toward the derivation of differencing equations to ensure property conservation. A staggered grid arrangement is used such that scalar field variables such as pressure and volume fraction are defined at grid cell centers, while vector quantities like velocity are designated at cell edges. This choice of a staggered assignment scheme assists in numerical convergence and mitigates unphysical oscillations in the determination of the pressure field arising from the momentum equations [69]. 31
48 Equation (3.52) shows the general 1-D property balance equation for a multiphase system. Here, m denotes the phasic index where m = 0 implies the gas phase and m > 0 implies a solids phase. The scalar of interest is denoted by φ, the diffusion coefficient is given by Γ φ, and R φ is a source term. Equation (3.52) contains most of the relevant features of the governing equations and serves as an excellent template equation for discussion of discretization methods. t (ε mρ m φ) + x (ε mρ m u m,i φ) = x (Γ φ φ x ) + R φ (3.52) Derivation of the finite volume differencing equations begins with integration of Equation (3.52) over an arbitrary control volume, depicted using standard compass point notation in Figure 4. Equation (3.53) shows the integral form of Equation (3.52) over the control volume. CV t (ε mρ m φ)dv + x (ε mρ m u m φ)dv CV = x (Γ φ CV φ x ) DV + R φ dv cv (3.53) The discussion presented here will be limited to discretization of the convective term in Equation (3.53) as this term is most sensitive to scheme selection. For detailed information regarding discretization of the transient and diffusion terms, the reader is referred elsewhere [58]. Equation (3.54) shows the differencing equation for the convection term. CV x (ε mρ m u m,i φ) dv (ε m ρ m φ) e (u m ) e A e (ε m ρ m φ) w (u m ) w A w (3.54) W w P e E CV Figure 4: Control Volume with 1-D Compass Point Notation 32
49 As discussed earlier in this section, first-order upwind discretization of Equation (3.54) results in a highly diffuse numerical formulation. However, higher-order schemes tend to produce oscillations in their solutions resulting in diminished convergence performance. Total variation diminishing (TVD) schemes seek to overcome this oscillatory short fall by employing a flux limiter that bounds the solution value when the local distribution of the quantity of interest is monotonic [70]. Leonard and Mokhtari [71] constructed a universal limiter that is implemented through what they refer to as a Downwind Weighting Factor (DWF). Detailed formulation of the Downwind Weighting Factor may be found elsewhere [68].The value of φ at the downwind cell face, denoted as φ f, may be expressed by Equation (3.55), where the nodal and edge locations are described in Figure 5. φ f = DWFφ D + (1 DWF)φ C (3.55) Equation (3.55) may be applied to the right-hand side of Equation (3.54) to produce a linear system of equations. Convergence may be assisted through use of the Deferred Correction method (DC) attributed to Rubin and Khosla [72] which modifies the linear system produced by the DWF method via a source term that melds the lower and higher-order approximations. The simulations presented here were performed using the Superbee discretization scheme [68]with deferred correction. Flow Direction U C f D Figure 5: Downwind Weighting Factor Notation 33
50 3.3.2 Solution Technique MFiX employs a modified formulation of Spalding and Patankar s Semi-Implicit Method for Pressure-Linked Equations (SIMPLE) [69] in the numerical solution of the governing equations. The SIMPLE algorithm utilizes a pressure-correction relation for the solution of flow field variables in fluid phase systems. In the case of multiphase flow, there is no way to derive a unique pressure correction factor that exactly satisfies all continuity relations [58]. To navigate this issue, a solids volume fraction correction [58] is used in place of a pressure-correction. 34
51 Chapter 4. Simulation of Sand and Coal Fluidization Under Various Conditions A couple of months in the laboratory can frequently save a couple of hours in the library Frank Westheimer Computational simulations of gasification reactors must provide not only detailed data regarding the chemistry of the system, but accurate information concerning the hydrodynamic behavior of the solids and fluid phases as well. Prior to the inclusion of chemical reactions into the numerical simulations, various hydrodynamic studies were performed to validate the CFD modeling strategy with experimental results and to provide specific information of fluidization behavior at gasification operating conditions. This chapter presents the results of those hydrodynamic studies. 4.1 Cold-Flow Fluidization Behavior of Sand and Coal Project collaborators at Utah State University have provided cold flow fluidization data in the form of pressure drop and bed height measurements, presented as a function of the superficial inlet velocity, U g, [73]. These data constitute the sole source of hydrodynamic validation for the CFD simulations. This section details development of a hydrodynamic modeling strategy that provides strong agreement with the provided experimental data. 35
52 4.1.1 Experimental Setup, Procedure, and Results Cold flow fluidization experiments were performed in a cylindrical, borosilicate glass vessel with a diameter of 5.08 cm and a height of cm. Figure 6 shows a schematic of the fluidization vessel, where h 0 denotes the initial height of the granular bed. Experiments were conducted at room temperature and atmospheric pressure using nitrogen as the fluidizing agent. Pressure measurements were recorded using a distilled water U-tube manometer. Full detail of the experimental setup and procedure may be found elsewhere [73] cm cm h 0 Fluidizing Gas Figure 6: Schematic of Cold Flow Fluidization Vessel 36
53 Fluidization experiments were conducted on both silica sand and subbituminous, Powder River Basin coal. Table 1 shows physical properties for both of these granular materials. Fluidization trials were performed using either 100 grams of silica sand or 30 grams of the subbituminous coal. In the case of sand, the volumetric flow rate of fluidizing nitrogen was varied from 2 to 26 LPM in increments of 2 LPM. The smaller and less dense coal particles fall under Group A in Geldart s classification of granular materials [25], which are known to exhibit hysteretic fluidization [74] and homogeneous bed expansion [75]. For the coal experiments, the volumetric flow rate was varied from 2 to 14 to 2 LPM in increments/decrements of 2 LPM. Each fluidization experiment was performed three times to assess repeatability. Figures 7 and 8 show plots of pressure drop and bed expansion against superficial gas velocity for the sand and coal experiments respectively. The markers shown in Figures 7 and 8 represent the mean value of the quantity of interest across the three trials, while the error bars convey the 95% confidence interval. In Figure 7 (a), the diagonal line depicts the least-squares determination of the slope of pressure drop assent to fluidization, while the horizontal line represents the mean, post-fluidization pressure drop of 4578 Ba. The minimum fluidization velocity (U mf ) for the sand was determined from the intersection of these lines and was found to be 6.6 cm/s. The lines in Figure 8 (a) depict cubic spline fits of the fluidization and defluidization pressure drop data to demonstrate the aeration prior to bubbling fluidization exhibited by Group A particles. Table 1: Physical Properties of Sand and Coal Material Particle Diameter [μm] Particle Density [g/ml] Bulk Density [g/ml] Min Void Fraction Sphericity Geldart Group Sand B Coal A 37
54 Figure 7: Sand Fluidization Results for (a) Pressure Drop and (b) Bed Expansion 38
55 Figure 8: Coal Fluidization Results for (a) Pressure Drop and (b) Bed Expansion 39
56 4.1.2 Computational Modeling Strategy and Parameter Adjustment Simulations of cold flow fluidization of sand and coal were performed using the MFiX software package. Figure 9 shows a schematic of the simulated reactor where the numbers 1, 2 and, 3 correspond to the gas inlet, outlet, and wall boundary conditions. The gas inlet boundary is modeled as a mass inlet with prescribed velocity. The outlet is modeled as a pressure outlet at 1 atm. The wall of the reactor is modeled using the Johnson and Jackson partial slip boundary condition for the solids phases, and the no-slip condition for the gas phase. The default specularity coefficient of 0.6 was used for the Johnson and Jackson model. Details concerning the Johnson and Jackson condition may be found in their paper introducing the condition [76]. The bed velocity was initialized using the ratio of the inlet velocity and the void fraction cm cm 3 h 0 1 Figure 9: Schematic of Simulated Reactor 40
57 Preliminary 2-D sand simulations were first performed using the as received physical properties. Then, the bed mass and packed bed void fraction were adjusted using the procedure detailed in Kanholy et al. [33] to reconcile pressure drop and bed height over-prediction due to the non-uniform inlet conditions of the experiments. Simulation results for pressure drop and bed height for the sand simulations are shown in Figure 10. It can be seen in Figure 10 that the Kanholy et al. procedure produced results that closely match with the experimental values. In the case of coal, preliminary simulations were performed using as received properties and the Kanholy et al. adjusted minimum void fraction and bed mass. Due to lack of confidence in the experimental U mf, arising from the limited amount of data prior to fluidization and the high spread of that data, a third series of simulations was also conducted using the as received packed bed void fraction with the adjusted bed mass. Results for these simulations are shown in Figure 11. It can be seen from Figure 11 that adjusting both the bed mass and minimum void fraction result in over-prediction of the pressure drop for coal, while only adjusting the bed mass yields results that validate well for both pressure drop and bed expansion. These preliminary simulations were used to determine the set of parameters for both solids phases for further computational analysis. For the sand, the procedure adjusting the bed mass and minimum void fraction produced results that exhibited strong agreement with the experimental finding, while for coal, only the bed mass needs adjusted to provide validatable results. Table 2 shows a comparison of the experimental parameters and the adjusted parameters used in the simulations. Table 2: Comparison of Experimental and Simulated Solids Properties Material Bulk Density [g/ml] Min Void Fraction Bed Mass [g] Experiment Simulated Experiment Simulated Experiment Simulated Sand Coal
58 Figure 10: Cold Flow Sand 2D Simulation Comparison for (a) Pressure Drop and (b) Bed Expansion 42
59 Figure 11: Cold Flow Coal 2D Simulation Comparison for (a) Pressure Drop and (b) Bed Expansion 43
60 4.1.3 Grid Resolution and Independence The abovementioned simulations were performed using a Cartesian discretization of the domain. A grid resolution study was conducted to quantify uncertainty in the simulated results attributed to grid selection. Here, the grid convergence index (GCI) procedure [77] is used in the estimation of discretization uncertainty. Details of the GCI method may be found in Appendix A. The grids used in this study were 10 60, , and These meshes were selected such that the medium grid agrees with a literature recommendation that the cell edge length be specified at approximately 10 particle diameters [78]. This recommendation was applied using the larger sand particles. Table 3 shows the results of the GCI analysis for both the sand and coal phases using pressure drop and bed expansion as the relevant parameters. Figures 12 and 13 show comparisons of pressure drop and bed expansion across the tested grids for sand and coal, respectively. Figures 14 and 15 show axial profiles of gas volume fraction at several inlet velocities for each of the tested meshes for sand and coal, respectively. The aggregate of these analyses shows that while the medium grid provides satisfactory results for the sand simulations, the coal system is insufficiently resolved by the mesh. Because the eventual goal of this effort is to provide accurate simulations of polydisperse sand-coal systems, the mesh was identified as the best choice for modeling both solids phases. Table 3: Results of GCI Study Variable Sand P Sand Bed Ex. Coal P Coal Bed Ex. Num. of Cells 9600, 2400, 600 Refinement Fac. 2, 2 Avg. Order Rel. Error % 1.79% 0.50% 11.64% Rel. Error % 1.92% 19.04% 35.06% GCI % 0.06% 0.01% 4.87% GCI % 0.07% 0.55% 14.67% 44
61 Figure 12: Cold Flow Sand Grid Comparison for (a) Pressure Drop and (b) Bed Expansion 45
62 Figure 13: Cold Flow Coal Grid Comparison for (a) Pressure Drop and (b) Bed Expansion 46
63 Figure 14: Axial Profiles of Gas Volume Fraction for Cold Flow Sand GCI Analysis 47
64 Figure 15: Axial Profiles of Gas Volume Fraction for Cold Flow Coal GCI Analysis 48
65 4.1.4 Validation and Comparison of Numerical Simulations Following the selection of an adequate grid resolution and adjusted solids phase properties, both 2-D and 3-D simulations were performed and their results were compared with those of the experiments. 2-D simulations were performed using a structured Cartesian discretization of the domain, while 3-D simulations employed a cylindrical orthogonal mesh. Figures 16 and 17 show the final comparisons of simulated pressure drop and bed expansion results with those of the experiments for sand and coal, respectively. Figures 17 and 18 show comparative axial profiles of gas volume fraction at several inlet velocities for 2-D and 3-D simulations for sand and coal, respectively. In Figure 16, it can be seen that the results for both 2-D and 3-D sand simulations show strong agreement with the experimental findings in both pressure drop and bed height. It may be see in both Figure 16 and Figure 18 that bed expansion results for 2-D and 3-D sand simulations begin to slightly diverge from one another at inlet velocities greater than 2U mf. This finding is consistent with the results of other researchers, e.g. Xie et al. [78], and may be attributed to increased azimuthal momentum loss at higher velocities [79]. While Figure 17 demonstrates that both 2-D and 3-D coal simulations are capable of accurately predicting bed expansion, the same cannot be said for the pressure drop results. The coal particles investigated here are classified as Geldart A [25]. Type A particles are referred to as aeratable as they exhibit an interval of homogeneous, i.e. non-bubbling, fluidization between the minimum fluidization velocity and the minimum bubbling velocity [75]. This interval is demonstrated in Figure 17 (a) by the overshoot of post-fluidization pressure drop at the lower velocities. The inability to accurately predict pressure drop in the homogeneous fluidization region is a known shortfall of the multi-fluid approach [80]. 49
66 Figure 16: Validation of 2-D and 3-D Cold Flow Sand Simulations for (a) Pressure Drop and (b) Bed Expansion 50
67 Figure 17: Validation of 2-D and 3-D Cold Flow Coal Simulations for (a) Pressure Drop and (b) Bed Expansion 51
68 Figure 18: Axial Profiles of Gas Volume Fraction for 2-D and 3-D Cold Flow Sand Simulations 52
69 Figure 19: Axial Profiles of Gas Volume Fraction for 2-D and 3-D Cold Flow Coal Simulations 53
70 Inspection of Figure 17 demonstrates that both pressure drop and bed expansion are accurately predicted for the cold flow coal system at velocities greater than 1.0U mf,sand. Because later research efforts utilizing the modeling strategy presented in this section are only concerned with systems capable of fluidizing both the sand and coal materials, the aforementioned short fall of the multi-fluid approach regarding Geldart A materials is deemed irrelevant to the overall study. Inspection of Figures 17 and 19 reveals that the 2-D and 3-D cold flow coal simulations produce nearly identical results in pressure drop and bed expansion. Figures 20 and 21 show instantaneous contours of void fraction at several inlet velocities for the 2-D and 3-D sand simulations, respectively. Comparison of Figures 20 and 21 reveals that the 2-D and 3-D simulations result in similar bubble shape and size. It can also be seen from Figures 20 and 21 that the expansion of the bed increases as the inlet velocity is increased. Figures 22 and 23 show instantaneous contours of gas volume fraction at several inlet velocities for the 2-D and 3-D coal simulations, respectively. Comparison of Figures 22 and 23 shows that the 2-D and 3-D simulations produce very similar results with the 3-D simulations exhibiting only slightly higher particulate dispersion than 2-D. Figures 24 and 25 show comparisons of instantaneous gas volume fraction between the sand and coal for the 2-D and 3-D simulations respectively at 1.75U mf,sand. Inspection of Figures 24 and 25 reveal that the coal system experiences significantly greater particulate dispersion than the sand at the same operating conditions. This observation is likely the result of significant differences in particle diameter and material density, as well as the amount of granular material initially in the system. The aggregate information contained within Figures 20 through 25 demonstrates both the similarity exhibited between the 2-D and 3-D simulations, and the significantly differing behavior displayed by the two granular materials investigated. 54


71 Figure 20: Contours of Gas Volume Fraction for 2-D Cold Flow Sand Simulations Figure 21: Contours of Gas Volume Fraction for 3-D Cold Flow Sand Simulations 55


72 Figure 22: Contours of Gas Volume Fraction for 2-D Cold Flow Coal Simulations Figure 23: Contours of Gas Volume Fraction for 3-D Cold Flow Coal Simulations 56

73 Figure 24: Comparison of Gas Volume Fraction for 2-D Cold Flow Sand and Coal Simulations Figure 25: Comparison of Gas Volume Fraction for 3-D Cold Flow Sand and Coal Simulations 57
74 4.1.5 Principal Outcomes In this section, a modeling strategy for the computational simulation of sand and coal fluidization was identified and validated against experimental findings. The parameter adjustment method by Kanholy et al. [33] was employed for the determination of adjusted solids properties to reconcile the non-uniform inlet conditions of the experiments with the uniform inlet conditions used in the simulations. A domain discretization was selected using the GCI procedure by Celik et al. [77] and was shown to produce accurate results for both the sand and coal fluidization systems. Finally, both 2-D and 3-D simulations for sand and coal were performed and validated against the experimental findings. Both the 2-D and 3-D simulations exhibited strong agreement with the experimental results, as well as with themselves. 4.2 Fluidization Characteristics of Sand at Elevated Temperatures The process of gasification requires thermal input to the system in order for the endothermic chemical reactions to occur. Reactor temperatures in excess of 700 C are necessary to achieve appreciable rates of the steam and carbon dioxide chemical reactions; however, it is difficult to obtain in situ measurements of relevant hydrodynamic properties at such high temperatures. The study presented in this section extends the validated hydrodynamic model from the cold flow fluidization work to systems of sand at elevated temperatures and under several types of gasification atmospheres, in an effort to assess the effect of temperature and working fluid on fluidization characteristics. Here, the fluidization behavior of sand is investigated at temperatures of 700, 800, and 900 C, under atmospheres of nitrogen, carbon dioxide, and steam. 58
75 4.2.1 Fluid Properties and Minimum Fluidization Velocity Each of the working fluids investigated in this study experience a significant change in fluid properties from 25 C, the assumed room temperature, to the temperatures investigated here. Table 4 provides values of density and viscosity for each of the fluidization gases [81-85]. Table 4: Fluid Properties of Nitrogen, Carbon Dioxide and Steam Nitrogen Carbon Dioxide Steam Density [g/ml] Viscosity [P] Density [g/ml] Viscosity [P] Density [g/ml] Viscosity [P] 25 C N/A* N/A* 700 C C C *Steam cannot exist at 25 C and 1 atm It may be seen from Table 4 that the viscosity of the gases nearly triples from 25 to 900 C, while the density is reduced by approximately one quarter. Such changes in viscosity and density will result in significant reduction in minimum fluidization velocity as evidenced by the Ergun equation. In this study, 2-D fluidization simulations of sand were performed at inlet velocities ranging from 0.5 to 6.5 cm/s at 700, 800, and 900 C under atmospheres of nitrogen, carbon dioxide, and steam. Figure 26 shows pressure drop plots of nitrogen, carbon dioxide, and steam, respectively. The minimum fluidization velocity for each system was determined using graphical intersection of the data presented in Figure 26. Table 5 shows the predicted minimum fluidization velocities for the investigated systems in comparison to the theoretical Ergun equation. Inspection of Table 5 reveals that the relative error between the Ergun equation and predicted minimum fluidization values do not exceed 2% for any of the tested systems. Table 5 also shows Ergun values for nitrogen and carbon dioxide at 25 C for reference. 59
76 Figure 26: Pressure Drop for the Sand-Gas Systems at 700, 800, and 900 C 60
77 Table 5: Comparison of Predicted and Ergun Equation U mf Values for the Sand-Gas Systems Nitrogen Carbon Dioxide Steam Predicted [cm/s] Ergun [cm/s] Predicted [cm/s] Ergun [cm/s] Predicted [cm/s] Ergun [cm/s] 25 C N/A 700 C C C Tables 4 and 5 demonstrate the non-trivial impact both temperature and the selected working fluid have on the fluid properties, and thus the fluidization behavior of gas-solids flows Comparison of Fluidization Behaviors Following the determination of the minimum fluidization velocities, simulations were conducted to study and compare bed expansion and bubble attributes for each of the investigated temperatures and gases. Simulations were conducted at 2U mf and 8 cm/s for each of the gassolids systems at 700, 800, and 900 C and at 25 C for nitrogen and carbon dioxide. Figures 27 and 28 show axial profiles of gas volume fraction, comparing the effect of gas species at each temperature for the 2U mf and 8 cm/s simulations, respectively. Figures 29 and 30 show axial profiles of gas volume fraction, comparing the effect of temperature for each gas species at 2U mf and 8 cm/s simulations, respectively. It can be seen in Figure 27 that each fluid produces nearly identical profiles at each temperature, indicating the bed undergoes approximately the same level of expansion at 2U mf, regardless of the fluid composition. Figure 28 demonstrates that these three fluids experience similar bed expansion at the same inlet velocity, with steam exhibiting slightly less expansion than nitrogen and carbon dioxide. Inspection of Figure 29 reveals that while the elevated temperatures demonstrate very similar expansion under the influence of a 2U mf stream, the room temperature bed is noticeably more expanded at 2U mf. 61
78 Figure 27: Axial Profiles of Void Fraction Comparing Gas Species for 2U mf Simulations Figure 28: Axial Profiles of Void Fraction Comparing Gas Species for 8 cm/s Simulations 62
79 Figure 29: Axial Profiles of Void Fraction Comparing Temperature for 2U mf Simulations Figure 30: Axial Profiles of Void Fraction Comparing Temperature for 8 cm/s 63
80 Figure 30 conveys the sensitivity of each fluidizing gas to changes in temperature. It can be seen in Figure 30 that nitrogen is least sensitive in bed expansion to temperature fluctuation as the elevated temperature profiles are nearly coincident. Steam appears to be the most sensitive to changes in temperature as there is clear distinction between each of the three elevated temperature levels. Finally, it can be seen in Figure 30 that the tested 8 cm/s inlet velocity is just capable of fluidizing the nitrogen and carbon dioxide systems at 25 C. Figures 31, 32, and 33 show instantaneous contours of gas volume fraction at each temperature level and 2U mf for nitrogen, carbon dioxide, and steam respectively. Inspection and comparison of Figures 31 through 33 reveal that each system exhibits similar bubble dynamics at 2U mf, regardless of temperature or working fluid. Figures 34, 35, and 36 show instantaneous contours of gas volume fraction at each temperature level and 8 cm/s for nitrogen, carbon dioxide, and steam, respectively. It can be seen from Figures 34 through 36 that the bubble characteristics are very similar across the elevated temperatures for all of the working fluids. Furthermore, the 8 cm/s simulations produce very similar bubble attributes across the three tested fluids as well. In Figures 34 and 35, it can be seen that the room temperature simulations are barely capable of fluidizing the bed and exhibit very small bubble diameters Principal Outcomes Simulations of sand fluidization at elevated temperatures under various gasification atmospheres were performed and compared to one another. It was observed that nitrogen, carbon dioxide, and steam exhibit very similar fluidization behaviors at elevated temperature when the systems are subjected to similar gas velocities; however, as seen in Figure 29, the bed expansion at the same U mf factor is not preserved between low and high temperatures. 64
81 Figure 31: Instantaneous Contours of Void Fraction for Nitrogen Fluidization at 2U mf Figure 32: Instantaneous Contours of Void Fraction for Carbon Dioxide Fluidization at 2U mf 65


82 Figure 33: Instantaneous Contours of Void Fraction for Steam Fluidization at 2U mf Figure 34: Instantaneous Contours of Void Fraction for Nitrogen Fluidization at 8 cm/s 66


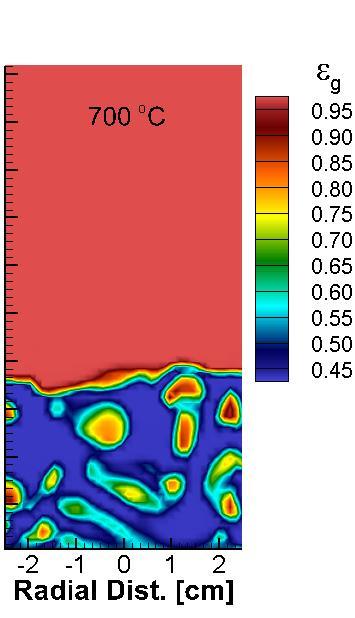
83 Figure 35: Instantaneous Contours of Void Fraction for Carbon Dioxide Fluidization at 8 cm/s Figure 36: Instantaneous Contours of Void Fraction for Steam Fluidization at 8 cm/s 67
84 4.3 Modeling Coal Injection into a Fluidized Bed of Sand The gasification reactor used by the study collaborators at Utah State University introduces coal into the unit through a discharge tube, which protrudes from the wall of the reactor into a bed of silica sand [73]. Coal is delivered through the discharge tube under the influence of a gas carrier stream. Figure 37 shows a schematic of the gasification unit with relevant dimensions. The inner diameter of the discharge tube is 0.72 cm and enters the side of the reactor at an angle of 60 with respect to the horizontal cm cm Coal Carrier Stream 60 Fluidization Stream 1.27 cm Figure 37: Schematic of Gasification Unit 68
85 The non-symmetric characteristic of this coal injection setup complicates the process of computational modeling as it is prohibitive to define formal boundaries for the discharge tube on a structured grid. Furthermore, the presence of the tube itself results in unphysical trapping of material on the left side of the reactor for 2-D simulations. To facilitate reasonable approximation of the coal injection system, a point-source strategy was applied toward the introduction of coal and carrier gas into the reactor. This section details the point-source strategy, as well as other modeling considerations pertaining to the computational simulation of polydisperse gas-solids flows. Those modeling strategies were applied to non-reacting, 3-D cylindrical and 2-D Cartesian discretizations of the Figure 37 domain to demonstrate the impact the carrier stream has on the system hydrodynamics. Discussion of establishing similitude between 2-D and 3-D domain discretizations is also presented Experimental Setup and Procedure Gasification experiments were conducted at 700, 800, and 900 C under atmospheres of nitrogen and carbon dioxide. Both the fluidization gas stream and the carrier gas stream enter the reactor with volumetric flow rates of 2 SLPM, implying that their velocities increase with increasing temperature. This standard flow rate produces superficial fluidization inlet velocities approximately two times the U mf for each system [73]. The gasification unit is initially filled with 100 g of silica sand, and the coal is introduced into the reactor with a mass flow rate of 200 g/h. The reactor unit is fitted with a cm preheating zone packed with Berl saddles to condition the fluidization stream flow prior to making contact with the distributor plate. Due to the similarities observed between the hydrodynamic behavior of nitrogen and carbon dioxide systems in the previous section, only nitrogen systems will be investigated here. 69
86 4.3.2 Point-Source Injection Modeling MFiX allows for the placement of mass inlet zones within the computational domain for systems where the specification of a formal boundary condition is prohibitive [86]. These mass inlets are referred to as point-sources and facilitate the introduction of mass into the computational domain. The task of point-source modeling is accomplished through the specification of a volume of cells that approximate the injection site. A 3-D cylindrical discretization of was applied to the Figure 37 domain. This discretization produces the same cell sizes shown in the previously mentioned cold-flow fluidization study. The volume of cells used to model the coal injection site was selected by minimizing the difference between the actual and simulated outer face of the injection site, while also attempting to preserve the location of the actual inlet. Figures 38 and 39 show the actual and simulated injection locations on the computational mesh. Figure 38 depicts the radial-azimuthal plane through the center of the point source. Here, the actual inlet surface is shown in blue and the simulated point-source volume is shown in red. Figure 39 shows the radial-axial plane through the center of the point source. Again, the actual inlet surface is shown in blue and the simulated point-source volume is shown in red. Note that the point-source is located slightly outward from the center of the reactor to avoid instabilities that can arise at the center of a cylindrical discretization. The outer area of the point-source volume, through which the entering material would travel, is less than 0.5% larger than the actual inlet area, implying that gas and solids velocities through the point-source will be very similar to those experienced at the actual inlet. Table 6 shows a comparison of the actual and simulated inlet velocities. The actual and simulated carrier stream velocities were determined by assuming an isobaric expansion of the carrier gas from 25 C to each of the operating temperatures using the 2 SLPM volumetric flow rate. 70


87 Figure 38: Radial-Azimuthal Plane Depicting Actual and Simulated Injection Sites Figure 39: Radial-Axial Plane Depicting Actual and Simulated Injection Sites 71
88 Table 6: Comparison of Carrier Stream Injection Velocities Temperature Actual Velocity [cm/s] Simulated Velocity [cm/s] 700 C C C Modeling Considerations for Polydisperse Systems In monodisperse gas-solids flows, the minimum void fraction of the granular material is constant; however, this is not true for polydisperse systems containing particles of differing sizes, which is the case for the sand-coal system presented here. As the smaller coal particles are introduced into the reactor, the minimum void fraction of the binary sand-coal bed will begin to increase in a manner proportional to the instantaneous volume fraction of the coal. This occurrence must be accurately predicted, as the minimum void fraction is used in the determination of solids stress formulation, as shown in Chapter 3. Here, the Fedors and Landel [87] correlation is used to calculate the minimum void fraction. Details of the specific formulation of the model employed by MFiX may be found in the code documentation [88]. The second consideration made in this study concerns segregation of particles of differing sizes. In the computational study by Gera et al. [89], the authors present evidence that the definition of the solids-solids drag coefficient by Syamlal [65], shown in Chapter 3, provides an insufficient representation of the interaction between particles of differing sizes. They conclude that a hindrance effect term must be added to the model given by Equation (3.38) to accurately simulate a fluid bed of different sized particles. Their model, which may be found in their paper, includes a term referred to as the segregation slope coefficient. Gera et al. suggest a value of 0.3 for the segregation slope coefficient, which is based on experimental validation of their work. 72
89 D Simulations of the Point-Source Injected System A parametric study was conducted using 3-D cylindrical simulations to determine the effect the segregation slope coefficient (SSC) has on the hydrodynamic behavior of the coal particles within the reactor. Simulations were performed for 10 seconds at each of the three operating temperatures using SSC values of 0.0, 0.3, and 0.6. The resulting data was time-averaged from 8 to 10 seconds, an averaging duration approximately four times the bed space-time. Profiles were then taken from the planes passing through the center of the point source to assess sensitivity of the system hydrodynamics to changes in SSC. Figures 40, 41, and 42 show axial profiles of the gas, sand, and coal volume fractions, respectively, at each of the operating temperatures for each SSC value. Figures 43, 44, and 45 show radial profiles of the gas, sand, and coal volume fractions, respectively, at each of the operating temperatures for each SSC value. Figures 40, 41, 43, and 44 demonstrate that there is little observable difference in the gas and sand volume fractions brought about by changes in SSC. This observation is likely because such little coal is fed to the reactor. However, inspection of Figures 42 and 45 reveals that SSC does impact the distribution of coal particles within the reactor. It can be seen in Figure 42 that the volume fraction of coal particles in the vicinity of the injection site increases with increasing SSC. This observation is most pronounced at the 700 C temperature level. It can also be seen in Figure 42 that the degree to which coal particles are held within the bed diminishes with increasing temperature, regardless of SSC value. This observation may be attributed to changes in the system U mf factor as temperature increases. The 2 SLPM standard flow rate used in the coal gasification experiments produces fluidization velocities of 1.9U mf, 2.2U mf, and 2.5U mf for the 700, 800, and 900 C temperature levels, respectively, which likely explains the aforementioned diminishing coal volume fractions. 73
90 Figure 40: Axial Profiles of Gas Volume Fraction for SSC Parametric Study Figure 41: Axial Profiles of Sand Volume Fraction for SSC Parametric Study 74
91 Figure 42: Axial Profiles of Coal Volume Fraction for SSC Parametric Study Similar behavior can be witnessed in Figure 45, as distinct differences in coal volume fraction are observable, particularly at the 700 C temperature. The distinction between SSC values becomes less noticeable with increasing temperature, which again, is likely attributable to changes in U mf factor with changing temperature. It has been shown that changes in the value of the segregation slope coefficient resulted in marked differences in the hydrodynamic behavior of the coal particles within the gasification unit. While these observations are noteworthy for designing simulations for solids fuel injected fluidized beds, without the validation of experimental findings, it is difficult to ascertain the best SSC value for the system of interest. That said, the literature recommendation for SSC of 0.3 from Gera et al. [89] is obeyed throughout the remainder of this work. 75
92 Figure 43: Radial Profiles of Gas Volume Fraction for SSC Parametric Study 76
93 Figure 44: Radial Profiles of Sand Volume Fraction for SSC Parametric Study 77
94 Figure 45: Radial Profiles of Coal Volume Fraction for SSC Parametric Study 78


95 Following the conclusion of the parametric study, further analysis was conducted on the 3-D cylindrical, point-source injection simulations. Figures 46, 47, and 48 show time-averaged contour plots of gas, sand, and coal volume fractions, respectively, on the radial-axial plane that passes through the center of the point-source for each of the operating temperatures. It can be seen from Figures 46 and 47 that, on average, the injection of the gas carrier stream produces an apparent void within the sand bed that spans from the injection site to the top of the bed. Inspection of Figure 48 reveals that while some of the coal is distributed within the bed, the bulk of the fuel material resides at the bed-freeboard interface. The volume of coal particles deep within the bed appears to diminish with increasing temperature, an occurrence likely caused by the increasing of the U mf factor with increasing temperature. Figure 46: Time-Averaged Contours of Gas Volume Fraction for Point-Source System 79


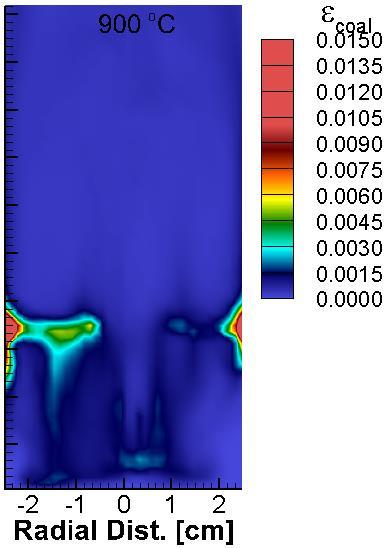
96 Figure 47: Time-Averaged Contours of Sand Volume Fraction for Point-Source System Figure 48: Time-Averaged Contours of Coal Volume Fraction for Point-Source System 80


97 To further understand the gas void observed in Figure 46, animations of the point-source simulations were generated and reviewed. Inspection of the animations revealed periodic formation and breakup of a large bubble within the bed resulting from the gas carrier stream. Figures 49, 50, and 51 show instantaneous contours of gas volume fraction for the 700, 800, and 900 C simulations, respectively. It may be seen from Figures 49 through 51 that normal bubbling behavior is experienced within the bed near the walls of the reactor, while the periodic formation of a large bubble is observed in the vicinity of the point-source volume. Inspection of Figures 49 through 51 coupled with review of the simulation animations reveals that the period of point-source bubble formation and breakup is approximately 0.04 to 0.06 seconds for all operating temperatures. Figures 49 through 51 also reveal a lack of carrier stream penetration in the radial direction, considering the relatively high velocities of the injection gas given in Table 6. It can be seen here that the carrier stream only slightly perturbs the bed material in the radial direction, with the most apparent effect of gas injection being observed in the axial direction. Figure 49: Instantaneous Contours of Gas Volume Fraction at 700 C 81


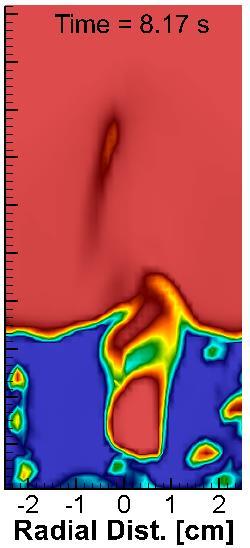
98 Figure 50: Instantaneous Contours of Gas Volume Fraction at 800 C Figure 51: Instantaneous Contours of Gas Volume Fraction at 900 C 82
99 4.3.5 Similitude between 3-D and 2-D Fluidized Bed Simulations Addressing similitude between 3-D and 2-D computational simulations of fluidized bed systems is a potentially advantageous endeavor, as reducing the dimensionality of the modeling strategy would most likely significantly lessen the computational cost. However, it is paramount to the totality of the effort that adequate similitude of relevant field properties be established across the models. To that end, a novel method for establishing similitude between 3-D cylindrical and 2-D Cartesian computational simulations is derived, then applied to the abovementioned sand-coal, point-source injection system The 2-D Methodology in Theory and Practice The 2-D approximation of a transport system assumes a lack of realizable variation in relevant field quantities in the un-modeled direction. Classic examples of the 2-D assumption include Couette flow [90], boundary layer theory [91], and thin plate conduction [92]. When a finite volume approach is taken toward the development of a computational model, the 2-D approximation is applied by disallowing variation of field variables in the un-modeled direction and taking the cell length in the un-modeled direction to be unity. Figure 52 provides schematics of a 3-D cylindrical fluidization unit (left) and the 2-D Cartesian domain used for computational simulation (right). It has been demonstrated by the efforts presented earlier in this chapter, and by the work of other authors [78], that both 3-D cylindrical and 2-D Cartesian simulations produce similar results for velocities below 3U mf for simulations of simple fluidization. For those cases, the initial bed height, the fluidization velocity, and the minimum void fraction of the materials are preserved; however, there are notable differences between the two representations. Table 7 provides comparisons of the volumetric and mass properties between the 3-D and 2-D 83
100 modeled systems for simple fluidization. It can be seen from Figure 52 and Table 7 that while the 3-D and 2-D representations of the simple fluidization system produce similar simulation results, their computational implementations and extensive properties are very different. Table 7: Comparison of Volumetric and Mass Inputs for 3-D and 2-D Simple Fluidizaiton Property 3-D Cylindrical Representation 2-D Cartesian Representation Reactor Volume Gas Volume Flow Rate Bed Material Mass V r = π 4 D2 H V r = DH π V g = u g 4 D2 V g = u g D π m s = ρ b,s 4 D2 h 0 m s = ρ b,s Dh 0 3-D 2-D H H h 0 1unit h 0 D D Figure 52: Schematics of 3-D cylindrical (left) and 2-D Cartesian (right) domains 84
101 A Method for Establishing Similitude in Material Injected Fluidized Beds Similitude between 3-D cylindrical and 2-D Cartesian representations of simple fluidization systems appears natural, with the details of property preservation seeming superfluous, as geometric and kinematic similarity are easily observed. However, the addition of non-symmetric mass inputs to the system significantly complicates the problem. Inspection of the theory and governing equations for the multi-fluid approach to multiphase flows demonstrates universal dependence on the phasic volume fractions. It follows that preservation of the phasic volume fractions, both locally and globally within the domain of interest, constitutes a necessary condition for trans-dimensional similitude. That basic concept provides the foundation for the method set forth by this work. Comparison of the relations shown in Table 7 reveal that the volume and mass inputs between 3-D and 2-D systems differ by a factor of π D. 4 The significance of this factor is dualistic, as it constitutes both the ratio of the 3-D and 2-D reactor cross-sectional area and the quotient of the 3-D and 2-D reactor volumes. Simple calculation reveals that the preservation of mass flux from the 3-D to 2-D domains does not ensure global similitude in the phasic volume fractions for radially injected systems. However, by scaling 2-D volumetric inputs by the quotient of the reactor volumes, π D, global similitude of 4 phasic volume fractions with the 3-D domain is guaranteed. This assertion may be proven by application of the definition of phasic volume fraction to the relations shown in Table 7. While the approach presented here does guarantee global preservation of phasic volume fractions from 3-D to 2-D, local similitude of the phasic volume fractions cannot be demonstrated a priori due the kinematic differences between 3-D and 2-D simulations. In an effort to assess the viability of the method delineated by this work, several series of 3-D and 2-D simulations were executed and compared. 85
102 Comparison of 3-D and 2-D Point-Source Injection Simulations Two sets of 2-D simulations were originally performed to assess the viability of the aforementioned similarity strategy. The first set utilized the exact same parameters as the 3-D simulations to demonstrate the necessity of an injection adjustment strategy. The second set applied the strategy delineated earlier in this work to the mass flow rates of the gas carrier stream and the coal. Then, the gas and coal injection velocities were scaled using the face area of the point-source volume to ensure continuity balance. Table 8 shows the properties used in the two sets of 2-D simulations. Similitude assessments were made in a manner similar to that of the segregation slope coefficient parametric analysis, in that the resulting 2-D data was timeaveraged from 8 to 10 seconds and axial profiles were then taken from the planes passing through the center of the point-source. Figures 53, 54, and 55 show axial profiles of gas, sand, and coal volume fractions, respectively, for the 3-D, 2-D, and 2-D adjusted simulations at each of the operating temperatures. It can be seen from Figures 53 and 54 that the volumetric input adjustment strategy produces marked improvements in the prediction of the gas and sand volume fractions compared to using the 3-D injection properties for each of the operating temperatures. Inspection of Figures 53 through 55 reveals that while the adjustment strategy employed here does improve agreement between the 3-D and 2-D simulations compared to the non-adjusted cases, improvements are less significant in the case of coal volume fraction. Table 8: 3-D, 2-D, and Adjusted 2-D Point-Source Injection Properties 3-D and 2-D Injection Properties 2-D Adjusted Injection Properties m gas m coal Velocity m gas m coal Velocity [g/s] [g/s] [cm/s] [g/s] [g/s] [cm/s] 700 C C C
103 Figure 53: Axial Profiles of Gas Volume Fraction for 3-D and 2-D Point-Source Simulations Figure 54: Axial Profiles of Sand Volume Fraction for 3-D and 2-D Point-Source Simulations 87
104 Figure 55: Axial Profiles of Coal Volume Fraction for 3-D and -2-D Point-Source Simulations It can be observed in Figure 55 that while the adjusted 2-D cases produce results more similar to the 3-D simulations in the prediction of coal volume fraction, there are still noteworthy differences between the results. Both the adjusted and non-adjusted 2-D simulations over-predict the entrainment of coal in the lower freeboard; however, the adjusted cases exhibit strong agreement with the 3-D results at heights greater than 10 cm for all of the operating temperatures. Figure 56 shows axial profiles of coal volume fraction for the 3-D, 2-D, and 2-D adjusted simulations at each of the operating temperatures throughout the entire height of the reactor. It can be seen in Figure 56 that the differences between the 2-D adjusted and the 3-D simulations in coal volume fraction are localized to the lower third of the unit, while the nonadjusted 2-D simulations over-predict coal volume fraction throughout the whole reaction vessel. 88
105 Figure 56: Axial Profiles of Coal Volume Fraction for 3-D and 2-D Simulations for Entire Reactor Further simulations were conducted to ascertain the cause of the aforementioned differences between the 3-D and 2-D adjusted simulations. These included executing cases for all domains and parameter values where only coal was introduced into the unit. Figures 57, 58, and 59 show axial profiles of gas, sand, and coal volume fractions, respectively, for the 3-D, 2-D, and 2-D adjusted simulations, at each of the operating temperatures, for cases where only coal is injected into the domain through the point-source. It can be seen from Figures 57 through 59 that the 2-D adjusted simulations almost exactly replicate the 3-D simulations in all of the phasic volume fractions, while the non-adjusted 2-D results drastically over-predict coal volume fraction at the bed-freeboard interface. It should be noted for further discussion that in all of the cases where only coal is injected through the point-source, the bulk of the coal material resides on top of the sand bed. 89
106 Figure 57: Axial Profiles of Gas Volume Fraction for 3-D and 2-D Coal Only Injection Figure 58: Axial Profiles of Sand Volume Fraction for 3-D and 2-D Coal Only Injection 90
107 Figure 59: Axial Profiles of Coal Volume Fraction for 3-D and 2-D Coal Only Injection The aggregate information conveyed through Figures 55, 56, and 59 suggests that volumetric magnitude of the gas carrier stream is the cause of imperfect similitude between the 2-D adjusted and 3-D simulations. The most noteworthy difference between the 2-D adjusted and 3-D simulations observed in Figures 55 and 56 is the quantity of coal particles entrained within the lower region of the freeboard. This occurrence is likely caused by a lack of kinematic similitude between the 2-D adjusted and 3-D simulations, arising from the increased significance of azimuthal momentum losses. The 2 SLPM volumetric flowrate through the fluidization inlet results in velocities between 1.9 and 2.5 U mf, which may be directly correlated to the minimum fluidization volumetric flow rate, Q mf. By doubling the total gas phase volumetric inputs of the reactor to 4 SLPM, total flow through the vessel increases to Q mf, resulting in some 2-D modeling inaccuracies produced by out-of-plane momentum losses [79]. 91
108 4.3.6 Principal Outcomes A point-source injection modeling strategy was developed and implemented for use in modeling the Utah State University bench-scale gasification unit [73]. This strategy was applied to both 3-D cylindrical and 2-D Cartesian computational simulations. A parametric study was conducted to assess the sensitivity of the coal injection simulations to changes in the segregation slope coefficient. It was observed that SSC does impact the distribution of coal particles within the reactor; however, without experimental findings to validate the simulated results, the literature suggested value of 0.3 was used for the remainder of the simulations. Inspection of point-source simulation animations revealed periodic bubble formation and breakup in the vicinity of the injection site, caused by the gas carrier stream. The periodicity of the point-source bubble was observed to be approximately 0.04 to 0.06 seconds and exhibited similar characteristics for each of the operating temperatures. Lastly, a novel method for establishing similitude between 3-D cylindrical and 2-D Cartesian simulations of material injected fluidized beds was delineated and then applied to computational simulations of the point-source injection system. It was shown that the strategy presented here produced marked improvements in the prediction of phasic volume fractions compared to directly applying the 3-D conditions to the 2-D domain. Imperfections in the method were only observable in the lower third of the vessel and may be attributed to increased significance of azimuthal momentum transfer at volumetric inputs greater than 2Q mf. This assertion was substantiated by comparative inspection of simulations where only coal was introduced into the reactor through the point-source. 92
109 Chapter 5. Modeling Coal Gasification in a Bubbling Fluidized Bed Reactor The good thing about science is that it s true whether or not you believe in it Neil degrasse Tyson Up to this point, the efforts presented here have focused solely on hydrodynamic modeling of coal and sand fluidization systems under a variety of operating conditions. As explained in Chapter 1, effective computational modeling of coal gasification requires the inclusion of accurate chemistry models to resolve the occurrence of relevant chemical reactions. This chapter provides a detailed analysis of the gasification experiments performed by the study collaborators at Utah State University, including thermodynamic and chemical equilibrium considerations. Furthermore, chemically reacting gasification simulations were performed using several different chemistry models. Simulated results were compared to the experimental findings to assess the applicability of each model. 5.1 Analysis of Experiments This section provides an in-depth analysis of the experimental findings for coal gasification under atmospheres of nitrogen and carbon dioxide collected by collaborators at Utah State University. Equilibrium analyses were performed on the experimental findings to better understand the thermodynamic state of the gas phase products. 93
110 A discussion of the gasification unit pertaining to reactor setup and experimental procedure was presented in Chapter 4 and is therefore not provided in this chapter. The reader is directed to Section 4.3 of this dissertation for a discussion regarding experimental setup and procedure Chemical Composition of Subbituminous Coal The coal used by the investigation collaborators at Utah State University is a subbituminous coal from the North Antelope Rochelle Mine located in the Powder River Basin of Wyoming, USA. The results of ASTM proximate analysis testing performed on the coal are shown in Table 9, while the data from the ultimate analysis is shown in Table 10. It may be seen in Table 10 that the investigated subbituminous coal has a relatively low sulfur content compared to that of other coals. This attribute makes Powder River Basin coals an attractive option for synthesis gas production, as sulfur-containing compounds present many challenges for downstream processes. Table 9: Proximate Analysis of North Antelope Subbituminous Coal Proximate Composition (wt.%) Moisture Volatile Matter Fixed Carbon Ash 4.94 Table 10: Ultimate Analysis of North Antelope Subbituminous Coal Species Composition (wt.%) C H 6.22 N 0.78 O S
111 5.1.2 Product Distributions Following gasification, the reactor effluent first passes through a high-temperature filter to separate entrained solids from the gas phase products [73]. The mass of the solids elutriated from the reactor is recorded as produced char. The gaseous effluent then passes through two ethyleneglycol-cooled condensers to remove condensable vapors from the gas stream. Non-condensable gases are then introduced to an electrostatic precipitator to sequester any remaining aerosols from the gas stream. Finally, the permanent gas product composition is analyzed using gas chromatography. Solids and condensable yields were determined by massing the hot gas filter and the condensing units, respectively, while total gas yield was determined by chromatographic analysis and by mass difference Total Product Distributions Table 11 contains the product distributions reported by Utah State University for coal gasification under nitrogen and carbon dioxide. Figure 60 shows a graphical representation of the Table 11 data, normalized such that the weight fractions sum to one. Table 11: Total Product Yields (wt.%) for N 2 and CO 2 Gasification Product Char Water Tar Gas Atmosphere Temperature 700 C 800 C 900 C N CO N CO N CO N CO
112 Figure 60: Total Product Distribution for (left) N 2 and (right) CO 2 Gasification Inspection of Table 11 and Figure 60 reveals that both the nitrogen and carbon dioxide atmospheres result in very similar trends in macroscopic product formation. It can be seen from Figure 60 that char, water, and tar exhibit near linear decreases in product formation with increasing temperature for both of the investigated atmospheres while gas is observed to increase linearly with increasing temperature. Furthermore, tar production is nearly identical at all temperatures for both the nitrogen and carbon dioxide systems. 96
113 Gas Phase Composition Gas phase product yields were provided in the form of gas chromatography data. The species reported were CO, CO 2, H 2, CH 4, and N 2. C 2 to C 4 hydrocarbons were reported as a lumped group due to their relatively small individual contribution to the overall permanent gas composition. Table 12 shows the average gas compositions in mole percent across several gasification trials under both nitrogen and carbon dioxide atmospheres. Figure 61 shows graphical representations of the Table 12 data. It can be seen in Figure 61 that overall trends in gas composition between nitrogen and carbon dioxide gasification are very similar, with the obvious exceptions being the fed gas species. Comparative analysis of the data shown in Table 12 and Figure 61 between the nitrogen and carbon dioxide atmospheres reveals significantly elevated production of carbon monoxide, likely brought about through the carbon dioxide gasification reaction. Another noteworthy feature of the systems conveyed in the gas chromatography data is a decreased output of dihydrogen from the nitrogen atmosphere to the carbon dioxide atmosphere. Table 12: Gas Phase Product Distributions (mole %) for N 2 and CO 2 Gasification Species Atmosphere Temperature 700 C 800 C 900 C CO N 2 CO CO 2 CO N H 2 CO N CH 4 N CO N C 2 -C CO N N CO
114 Figure 61: Gas Phase Product Distributions for (left) N 2 and (right) CO 2 Gasification To better understand the overall chemistry of the system, the data given in Table 11 were combined with that in Table 12 to facilitate the incorporation of steam production into the gas composition data. Those results are quantitatively given in Table 13 and graphically depicted in Figure 62. Aggregate information contained within Table 13 and Figure 62 demonstrates that under carbon dioxide the production of steam is significantly higher than that experienced under nitrogen. Possible causes of this finding are increased moisture content in the coal sample used for the carbon dioxide, trials or increased activity of the reverse water-gas shift reaction, introduced later in this chapter, due to the high concentration of carbon dioxide. The latter explanation is substantiated by the reduction in dihydrogen present in the effluent gas. 98
115 Table 13: Combined Gas Phase Product Distributions (mole %) for N 2 and CO 2 Gasification Species Atmosphere Temperature 700 C 800 C 900 C CO N 2 CO CO 2 CO N H 2 CO N CH 4 N CO N C 2 -C CO N N CO H 2 O N CO Figure 62: Combined Gas Phase Product Distributions for (left) N 2 and (right) CO 2 Gasification 99
116 5.1.3 Thermodynamic Considerations Understanding the limits that thermodynamics places on chemically reacting systems is paramount to the interpretation of experimental data and the development of chemistry models. This section presents a brief thermodynamic assessment of four reactive processes of potential importance to gasification systems. The thermodynamic analysis presented here begins with an examination of the Gibbs free energies for the steam and carbon dioxide gasification reactions. The Gibbs free energy of a reaction provides information with regard to the thermodynamic favorability of a reactive process. A reactive process may only occur at temperatures and pressures where the Gibbs free energy of reaction, G rxn, is strictly less than zero. Figure 63 shows plots of the Gibbs free energy of reaction for both steam and carbon dioxide gasification around the temperature region of interest at 1 atm of pressure. The data shown in Figure 63 were adapted from equilibrium constant data provided in the work by Walker, Rusinko, and Austin [93]. Figure 63: Gibbs Free Energy of Reaction for CO 2 and H 2 O Gasification 100
117 It can be seen from Figure 63 that thermodynamics limits the occurrence of the gasification reactions to systems where the temperature exceeds 700 C in the case of carbon dioxide gasification and 675 C for steam gasification. Application of this observation to the experimental system reveals that oxidation of char by carbon dioxide gasification within the reactor will not occur to an appreciable degree at the 700 C operating temperature. The remaining two reactive processes of potential importance to gasification systems are the water-gas shift reaction (WGS) and the steam reformation of methane reaction (SRM). Equations (5.1) and (5.2) show the water-gas shift and steam reformation of methane reactions, respectively. CO + H 2 O CO 2 + H 2 (5.1) CH 4 + H 2 O CO + 3H 2 (5.2) Here, an assessment of chemical equilibrium with regard to these reactions is presented. This analysis is facilitated by inspection of the equilibrium constant, K p, whose definition is given by Equation (5.3). The equilibrium constant provides information concerning the directional favorability of a reversible chemical process. If K p > 1, the forward reaction is favored, while K p < 1 indicates that the reverse reaction is thermodynamically favorable. K P (T) = exp ( G rxn RT ) (5.3) Figure 64 shows plots of equilibrium constant for the water-gas shift and steam reformation of methane reactions. It can be seen from Figure 64 that thermodynamics heavily favors the forward reaction for the SRM reaction for all of the experimental operating temperatures, indicating that the reaction of steam and methane would likely be kinetically, not thermodynamically, limited. 101
118 Figure 64: Equilibrium Constant for (top) WGS and (bottom) SRM 102
119 In the case of the WGS reaction, Figure 64 shows that the equilibrium constant shifts from favoring the forward to the reverse reaction within the range of operating temperatures Equilibrium Analysis Due to the potential for the water-gas shift reaction to be limited by thermodynamics, an equilibrium analysis was conducted to determine if the gas effluent produced in the experiments had achieved chemical equilibrium in water-gas shift and, if not, how far from equilibrium were the combined gas compositions. This analysis begins with the formulation of species mole balance equations given by Equations (5.4) through (5.7). Here, n i is the molar flow rate of species i leaving the reactor at equilibrium, n i is the actual molar flow rate of species i leaving the reactor, and ξ is the extent of reaction. n CO = n n co 2 = n n H 2 = n n H 2 O = n CO ξ (5.4) co 2 + ξ (5.5) H 2 + ξ (5.6) H 2 O ξ (5.7) Because the water-gas shift reaction is equimolar, there is no need to account for molar expansion toward defining the total number of moles, thus allowing the mole fractions of each species to be written as shown in Equation (5.8). Here, χ i denotes the mole fraction of species i at equilibrium, χ i denotes the actual mole fraction of species i, η is the normalized extent of reaction, and ν i is the stoichiometric coefficient of species i. χ i = χ i + ην i (5.8) 103
120 The WGS equilibrium composition of the effluent constituents must satisfy the relation shown in Equation (5.9), which may be derived from the definition of Gibbs free energy. Equation (5.9) was solved for η using the combined gas product distribution data for each atmosphere at each operating temperature. Solutions were generated using a MATLAB computer program developed by the author using thermodynamic data from the NIST webbook [94]. K p (T) = (χ co 2 + η)(χ H2 + η) (χ H2 O η)(χ CO η) (5.9) Table 13 shows a comparison of the equilibrium and experimental gas compositions for the water-gas shift reaction-participating species, along with the normalized reaction extents. Inspection of the data shown in Table 14 reveals that at the 700 C operating temperature, the effluent gas composition is very near the equilibrium composition for water-gas shift, while at 800 C and 900 C, the system exhibits limited ability for further forward WGS. Table 14: Comparison of Experiential and WGS Equilibrated Gas Compositions Species Atmosphere Temperature C 900 C Exp. Equ. Exp. Equ. Exp. Equ. CO N 2 CO CO 2 CO N H 2 CO N H 2 O CO v N η N CO
121 5.2 Chemistry Modeling Three chemistry models of coal gasification were investigated in this study. These included the METC Gasifier Advanced Simulation (MGAS) model [49], a variant of the MGAS model that employs experimental data from in-house NETL experiments, and a model developed by project collaborators at the University of Delaware. This section introduces each of these models METC Gasifier Advanced Simulation Model The MGAS chemistry model separates chemical reactions into three categories: initial stage, gasification, and water-gas shift. Initial stage reactions include drying of the coal resulting in the release of interstitially bound moisture, pyrolysis of the coal volatile matter for the production of tar and gases, and tar-cracking. Equations (5.10), (5.11), and (5.12) show the reaction equations for the drying, pyrolysis, and tar-cracking reactions, respectively, where VM denotes volatile matter, MST denotes moisture, and FC denotes fixed carbon. Stoichiometric coefficients for the pyrolysis and tar cracking reactions used in this study, shown in Table 15, were taken from the Carbonaceous Chemistry for Computational Modeling (C3M) software package, which is developed and maintained by NETL. C3M contains a database of MGAS coefficients for several coal types. For this study, the Powder River Basin subbituminous coal (PRB) type was selected due to its similarity in proximate analysis to the investigated coal. MST H 2 O (5.10) VM ν 1 CO + ν 2 CO 2 + ν 3 H 2 + ν 4 H 2 O + ν 5 CH 4 + ν 6 Tar (5.11) Tar ν 7 FC + ν 9 CO + ν 9 CH 4 (5.12) 105
122 Table 15: Stoichiometric Coefficients for MGAS Pyrolysis and Tar Cracking Reactions Coefficient Value ν ν ν ν ν ν ν ν ν Rate equations for the drying, pyrolysis, and tar cracking reactions are given by Equations (5.13), (5.14), and (5.15). Here, Y i denotes the mass fraction of species i within the phase of interest. Definition of the parameter Y in Equation (5.14) can be found in the MGAS documentation [49]. rate dry = exp ( 18.7 Y MST ) ε RT coal ρ coal coal MW MST (5.13) rate pyrolysis = exp ( 18.7 RT coal ) ε coal ρ coal (Y VM Y ) MW VM (5.14) rate tar cracking = exp ( RT g ) ε g ρ g Y Tar MW Tar (5.15) Gasification reactions used in the MGAS model are given by Equations (5.16), (5.17), and (5.18) and include the steam, carbon dioxide, and hydrogen gasification reaction, respectively. Note that Equations (5.16) through (5.18) are written as reversible. FC + H 2 O CO + H 2 (5.16) FC + CO 2 2 CO (5.17) FC + 2 H 2 CH 4 (5.18) 106
123 This reversibility is used by the MGAS model to apply adsorption considerations toward the formulation of the kinetic rate expressions instead of implementing formal Langmuir- Hinshelwood relations [95]. Rate expressions for the steam, carbon dioxide, and hydrogen gasification reactions are given in Equations (5.19), (5.20), and (5.21), respectively. rate forward H2 O Gas = 70 exp ( 30.0 Y FC ) ε RT coal ρ coal P film MW H2 O FC rate reverse H2 O Gas = 70 exp ( Y FC 17.29) ε RT coal ρ coal P film MW H2 P CO FC (5.19) rate forward CO2 Gas = 70 exp ( 30.0 Y FC ) ε RT coal ρ coal P film MW CO2 FC rate reverse CO2 Gas = 70 exp ( Y FC ) ε RT coal ρ coal P film MW CO FC (5.20) rate forward H2 Gas = exp ( 8078 Y FC 7.087) ε T coal ρ coal P film MW H2 FC rate reverse H2 Gas = exp ( Y FC ) ε T coal ρ coal P film MW CH4 FC (5.21) The final reaction considered in the MGAS chemistry model is the water-gas shift reaction. The MGAS model assumes that water-gas shift only happens when catalyzed by coal ash, implying that coal particles must be present for WGS to occur. Equation (5.22) shows the rate expression for the WGS reaction. Formulae for the WGS equilibrium constant, K WGS, and the catalytic activity parameter, f, may be found in the MGAS documentation [49]. rate WGS = exp ( (0.5 P) ) P 250 (Y RT CO Y H2 O Y H 2 Y CO2 ) f g K WGS (5.22) 107
124 5.2.2 HPTR Pyrolysis Model In addition to the MGAS model, the C3M software also includes an empirical pyrolysis model developed using in-house NETL experiments from their High-Pressure Tubular Reactor (HPTR) using a Powder River Basin subbituminous coal [11]. The HPTR pyrolysis model features variable stoichiometric coefficients that change with reactor operating temperature to more accurately capture the devolatilization process. Equations (5.23) and (5.24) show the reaction equation and kinetic rate equation for the HPTR pyrolysis model, respectively. Note that the sole difference between Equation (5.11) and (5.23) is that the production of ethylene by pyrolysis is considered. The coefficients for Equation (5.23) at each operating temperature are given in Table 16. In this work, the HPTR pyrolysis model was substituted into the MGAS model in place of the MGAS pyrolysis and tar-cracking reactions to form a full gasification chemistry model. VM ν 1 CO + ν 2 CO 2 + ν 3 H 2 + ν 4 H 2 O + ν 5 CH 4 + ν 6 C 2 H 4 + ν 7 Tar (5.23) rate pyrolysis = 5.607exp ( 4.69 Y VM ) ε RT coal ρ coal coal MW VM (5.24) Table 16: Stoichiometric Coefficients for HPTR Pyrolysis Model Coefficient Temperature 700 C 800 C 900 C ν ν ν ν ν ν ν
125 5.2.3 University of Delaware Model Project collaborators at the University of Delaware employed an ideal reactor approach toward the development of a chemistry model specific to the system of interest. Their kinetic modeling strategy utilized the plug-flow reactor model [96] in tandem with the experimental findings to formulate a lumped kinetics model of the gasification system. Their reaction network is delineated by Equations (5.25) through (5.32) where Equations (5.25), (5.26), and (5.27) are parallel pyrolysis processes, Equation (5.28) represents tar-cracking, Equations (5.29) through (5.31) are the char gasification reactions, and Equation (5.32) is the water-gas shift reaction. Here, FCH is a pseudo-species represented an intermediate char-hydrogen complex. Kinetic rate equations corresponding to the reaction network are given by Equations (5.33) through (5.40). Here, K p (T) denotes the equilibrium constant of the water-gas shift reaction. Notice that all rate constants for Equations (5.33) to (5.40) are of Arrhenius form [97]. The provided stoichiometric coefficients for the reaction network are shown in Table 17, while Arrhenius kinetic parameters are given in Table 18. Coal ν 1 FCH + ν 2 CH 4 + ν 3 CO + ν 4 CO 2 + ν 5 H 2 + ν 6 H 2 O (5.25) Coal ν 7 Tar + ν 8 CO 2 + ν 9 H 2 O (5.26) FCH 2 FC + 0.5H 2 (5.27) Tar ν 10 FC + ν 11 CH 4 + ν 12 H 2 + ν 13 H 2 O (5.28) FC + H 2 O CO + H 2 (5.29) FC + CO 2 2 CO (5.30) FC + 2H 2 CH 4 (5.31) CO + H 2 O CO 2 + H 2 (5.32) 109
126 rate 5.25 = A 1 exp ( E 1 Y Coal ) ε RT coal ρ coal coal MW Coal (5.33) rate 5.26 = A 2 exp ( E 2 Y Coal ) ε RT coal ρ coal coal MW Coal (5.34) rate 5.27 = A 3 exp ( E 3 Y FCH ) ε RT coal ρ coal coal MW FCH (5.35) rate 5.28 = A 4 exp ( E 4 Y Tar ) ε RT g ρ g g MW Tar (5.36) rate 5.29 = A 5 exp ( E 5 RT coal ) ε coal ρ coal Y FC MW FC ε g ρ g Y H2 O MW H2 O (5.37) rate 5.30 = A 6 exp ( E 6 RT coal ) ε coal ρ coal Y FC MW FC ε g ρ g Y CO2 MW CO2 (5.38) rate 5.31 = A 7 exp ( E 7 RT coal ) ε coal ρ coal Y FC MW FC (ε g ρ g 2 Y H2 ) MW H2 (5.39) rate 5.32 = A 8 exp ( E 8 RT g ) (ε g ρ g ) 2 ( Y CO MW CO Y H2 O MW H2 O Y CO 2 Y H2 1 MW CO2 MW H2 K p (T) ) (5.40) Table 17: Stoichiometric Coefficients for University of Delaware Model Stoichiometric Coefficients ν 1 = 25.9 ν 4 = 1.9 ν 7 = 4.7 ν 10 = 11.5 ν 13 = 1.1 ν 2 = 1.0 ν 5 = 10.8 ν 8 = 1.3 ν 11 = 1.5 ν 3 = 8.2 ν 6 = 0.11 ν 9 = 4.4 ν 12 =
127 Table 18: Kinetic Parameters for University of Delaware Kinetics Model Rate Equation Pre-exponential Factor (A) [log 10 (A)] Activation Energy (E) [kcal/mol] (5.33) (5.34) (5.35) (5.36) (5.37) (5.38) (5.39) (5.40) Numerical Simulations of Coal Gasification Each of the three aforementioned chemistry models was implemented into 2-D Cartesian simulations of the point-source coal injection system presented in Chapter 4, using the similitude adjustment procedure described therein. Simulations were performed using each chemistry model at each operating temperature for a duration of ten seconds. Coal injection into the computational domain was initiated after two seconds to allow a realistic hydrodynamic condition to develop in the bed. Thermochemical properties of gas phase species were taken from the database of Burcat and Ruscic [98], which is built into the MFiX source code. Thermochemical properties of requisite pseudo-species, such as coal, ash, volatile matter, and char, were taken from the C3M database. 111
128 5.3.1 Assessment of Chemistry Models The gas chromatography data collected by the experimental collaborators constitutes the most robust source of validation data. Therefore, assessment of the applicability of each chemistry model to the system of interest was established by comparing the experimental and simulated effluent gas compositions. To make the results comparable across both experimentally investigated atmospheres and all three computational models, only reactive, permanent gas species were used for validation. The effluent composition of the simulations was determined by space-averaging gas mole fractions near the exit of the reactor and time averaging those data for two seconds after a steady effluent composition had been achieved by the system. Figures 65 and 66 show plots of the effluent gas composition versus time from the MGAS model simulations under nitrogen and carbon dioxide, respectively. It may be observed from Figures 65 and 66 that the 800 and 900 C systems achieve a steady gas composition after approximately eight seconds of simulation time, while the gas compositions at 700 C are still developing. Likely causes for this difference in steady effluent composition time are changes in reactor space-time with temperature and reduced kinetic rates at lower temperatures. The 700 C simulations were extended for an additional two seconds to allow a steady effluent gas composition to develop prior to time averaging. Tables 19 and 20 show comparisons of MGAS simulated gas mole fractions on a N 2 /H 2 O/Tar-free basis with those observed in the experiments, along with the relative errors of the simulated results. It may be observed from Figure 65 and Table 19 that the MGAS-simulated nitrogen gasification cases all produce the same steady-state effluent composition, regardless of temperature. This result is likely caused by a combination of the static pyrolysis stoichiometry and prevalent occurrence of the pyrolysis and tar-cracking reactions due to high gas phase dilution by nitrogen. 112
129 Figure 65: Plots of Effluent Species Mole Fraction with Time for the MGAS Model under N 2 113
130 Figure 66: Plots of Effluent Species Mole Fraction with Time for the MGAS Model under CO 2 114
131 Table 19: Experimental and Simulated Gas Mole Fractions for MGAS under N C 800 C 900 C Spec. Exp. Sim. Rel. Err. Exp. Sim. Rel. Err. Exp. Sim. Rel. Err. H % % % CO % % % CH % % % CO % % % Table 20: Experimental and Simulated Gas Mole Fraction for MGAS under CO C 800 C 900 C Spec. Exp. Sim. Rel. Err. Exp. Sim. Rel. Err. Exp. Sim. Rel. Err. H % % % CO % % % CH % % % CO % % % Inspection of Tables 19 and 20 shows that use of the MGAS chemistry model produces significant over-prediction of methane when compared to the experiments. Examination of the model equations reveals that the tar-cracking reaction stoichiometry heavily favors production of methane. This information, coupled with that given by the tar mole fraction plots shown in Figures 65 and 66, which show tar to be almost entirely consumed by the cracking reaction, indicate that methane over-prediction is prospectively the result of over-activity of the tarcracking reaction. However, it is unlikely that MGAS-simulated results would become more physical by removing the tar-cracking reaction from the model, as static effluent compositions with changing temperature would likely persist. Figures 67 and 68 show plots of the effluent gas composition versus time from the HPTR model simulations under nitrogen and carbon dioxide, respectively. As was the case for the MGAS model, 800 and 900 C systems achieve a steady gas composition after approximately eight seconds of simulation time, while the gas compositions at 700 C are still developing. Again, the 700 C simulations were extended for an additional two seconds. 115
132 Figure 67: Plots of Effluent Species Mole Fraction with Time for the HPTR Model under N 2 116
133 Figure 68: Plots of Effluent Species Mole Fraction with Time for the HPTR Model under CO 2 117
134 Tables 21 and 22 show comparisons of the experimental and HPTR-simulated gas mole fraction on a N 2 /H 2 O/Tar free basis. It can be seen from Tables 21 and 22 that use of the HPTR pyrolysis model in place of the MGAS pyrolysis and tar-cracking models produces marked improvement in quantitative agreement between the simulations and the experiments. Inspection of Table 21 reveals that the HPTR model nearly exactly recovers the experimental gas composition for nitrogen gasification at 900 C; however, agreement diminishes with decreasing temperature, as the carbon monoxide and carbon dioxide production trends diverge at the lower temperatures. The information contained in Table 22 shows that, under carbon dioxide, the HPTR model exhibits progressively worsening agreement in carbon dioxide and carbon monoxide prediction as temperature increases. This observation may be attributed to insufficient activity of the CO 2 -char gasification reaction predicted by the model, an assertion that is substantiated by consistent, monatomic over-prediction of carbon dioxide production and underprediction of carbon monoxide production. Table 21: Experimental and Simulated Gas Mole Fractions for HPTR under N C 800 C 900 C Spec. Exp. Sim. Rel. Err. Exp. Sim. Rel. Err. Exp. Sim. Rel. Err. H % % % CO % % % CH % % % CO % % % Table 22: Experimental and Simulated Gas Mole Fractions for HPTR under CO C 800 C 900 C Spec. Exp. Sim. Rel. Err. Exp. Sim. Rel. Err. Exp. Sim. Rel. Err. H % % % CO % % % CH % % % CO % % % 118
135 Figures 69 and 70 show plots of the effluent gas composition versus time from the simulations under nitrogen and carbon dioxide, respectively, where the model provided by collaborators at the University of Delaware (UD) was used. As was the case with the MGAS and HPTR chemistry models, the UD model simulations of the 800 and 900 C systems achieve a steady gas composition after approximately eight seconds of simulation time, while the gas compositions at 700 C are still developing. The 700 C simulations were extended for an additional two seconds to allow for sufficient time averaging of the effluent composition data. Tables 23 and 24 show comparisons of the experimental and UD model simulated gas mole fraction on a N 2 /H 2 O/Tar free basis. Inspection of Table 23 reveals good agreement between the experiments and simulations in the case of hydrogen production; however, methane formation is consistently over-predicted. Table 24 shows that carbon monoxide production is consistently under-predicted for UD model simulations of the carbon dioxide gasification systems. Again, this observation may be attributed to insufficient activity of the CO 2 -char gasification reaction predicted by the model. Table 23: Experimental and Simulated Gas Mole Fractions for UD under N C 800 C 900 C Spec. Exp. Sim. Rel. Err. Exp. Sim. Rel. Err. Exp. Sim. Rel. Err. H % % % CO % % % CH % % % CO % % % Table 24: Experimental and Simulated Gas Mole Fractions for UD under CO C 800 C 900 C Spec. Exp. Sim. Rel. Err. Exp. Sim. Rel. Err. Exp. Sim. Rel. Err. H % % % CO % % % CH % % % CO % % % 119
136 Figure 69: Plots of Effluent Species Mole Fraction with Time for the UD Model under N 2 120
137 Figure 70: Plots of Effluent Species Mole Fraction with Time for the UD Model under CO 2 121
138 Quantitative comparison of the validity of the investigated chemistry models was addressed by comparing the average relative error of each model for each system. Table 25 shows the mean relative error for each model at each of the operating conditions. It can be seen from Table 25 that the HPTR model provides the most accurate results of all of the investigated models for each operating condition. This occurrence can most likely be attributed to the specialized method used in the determination of the pyrolysis reaction stoichiometric coefficients. Detailed inspection of Tables 22 and 24 reveals that the UD model does provide more accurate results in the determination of carbon monoxide production for systems under carbon dioxide. This observation indicates that the kinetic rate expression and parameters employed by the UD model for the determination of CO 2 -char gasification rate are more accurate than those used by the HPTR, i.e. MGAS, models. The aggregate of these results suggest that while the HPTR model does outperform the UD model for each investigated case, this finding is likely the result of the HPTR pyrolysis model accuracy propagating through the simulated solution. It follows that the UD model may experience improved accuracy through tuning the pyrolysis stoichiometry, using the HPTR pyrolysis coefficients as a starting point. Table 25: Mean Relative Errors for each Chemistry Model at each Operating Condition Model MGAS HPTR UD Atmosphere Temperature 700 C 800 C 900 C N % % % CO % % % N % % % CO % % % N % % % CO % % % 122
139 5.3.2 Analysis of the HPTR Model Results Following the identification of the HPTR chemistry model as the most suitable for computational simulation of the system of interest, the results of HPTR cases were further analyzed to better understand the modeling strategy. Figures 71 and 72 show time-averaged axial profiles of gas species mole fractions for the HPTR model simulations under nitrogen and carbon dioxide, respectively. Inspection of Figures 71 and 72 reveals that both the nitrogen and carbon dioxide atmospheres produce very similar results at all temperatures, with the obvious exception of the fluidizing gas species. It can be seen in these figures that each system experiences surge in gas evolution in the immediate vicinity of the coal injection site, followed by slight dilution by the gas carrier stream. This behavior becomes increasingly pronounced as temperature increases, which is likely caused by the increased permanent gas production of the HPTR pyrolysis stoichiometry with increasing temperature. Figures 73 and 74 show time-averaged contour plots of gas volume fraction for the HPTR simulations under nitrogen and carbon dioxide, respectively. Figures 75 and 76 depict timeaveraged contour plots of sand volume fraction for the HPTR simulations under nitrogen and carbon dioxide, respectively. Figures 77 and 78 show time-averaged contour plots of coal volume fraction for the HPTR simulations under nitrogen and carbon dioxide, respectively. The aggregate information conveyed by these figures is that both the nitrogen and carbon dioxide systems exhibit nearly identical hydrodynamic behavior at each operating temperature. Inspection of Figures 73 and 74 reveals the presence of a gas void in the vicinity of the injection site. This behavior is similar to that observed in the 3-D cylindrical point-source cases shown in Chapter 4; however, the 2-D cases appear slightly more diffuse near the bed-freeboard interface. 123
140 Figure 71: Axial Profiles of Gas Mole Fractions for HPTR Simulations under N 2 124
141 Figure 72: Axial Profiles of Gas Mole Fractions for HPTR Simulations under CO 2 125
142 Figure 73: Contours of Gas Volume Fraction for HPTR Model Simulations under N 2 Figure 74: Contours of Gas Volume Fraction for HPTR Model Simulations under CO 2 126
143 Figure 75: Contours of Sand Volume Fraction for HPTR Model Simulations under N 2 Figure 76: Contours of Sand Volume Fraction for HPTR Model Simulations under CO 2 127
144 Figure 77: Contours of Coal Volume Fraction for HPTR Model Simulations under N 2 Figure 78: Contours of Coal Volume Fraction for HPTR Model Simulations under CO 2 128
145 Inspection of Figures 77 and 78 reveals diminishing in the quantity of coal particles present within the bed region with increasing temperature; however, this observation is likely exacerbated at the 700 C operating temperature by the time-averaging region being seconds, to allow for a steady effluent composition to develop, instead of the 8-10 seconds used for the 800 and 900 C operating temperatures. Comparison of the 800 and 900 C operating temperatures for each atmosphere reveals slightly less coal material in the bed region at the higher temperature, which is likely caused by increased entrainment brought about by the higher U mf factor experimented by the 900 C systems. Figures 79 and 80 depict time-averaged contour plots of drying reaction rate for the HPTR simulations under nitrogen and carbon dioxide, respectively. Inspection of Figures 79 and 80 reveals that similar drying behavior is experienced under both investigated atmospheres. It can be observed from these figures that moisture release is most prevalent in the immediate vicinity of the injection site and that the maximal rate of the drying process increases with increasing temperature. Figures 79 and 80 also show increased activity of the drying reaction at the top of the bed for the lower two operating temperatures. A likely cause for this behavior is that the moisture content of the coal material is more quickly depleted at the 900 C temperature. Figures 81 and 82 show time-averaged contour plots of pyrolysis reaction rate for the HPTR simulations under nitrogen and carbon dioxide, respectively. Inspection of these figures shows that the bulk of the pyrolysis process is confined to the bed with diminishing activity along the axial length of the vessel. Furthermore, the pyrolysis reaction of the HPTR model appears to be largely temperature independent, which is likely the result of the low activation energy of 4.69 kcal/mol used in the kinetic rate expression. Comparison of Figures 81 and 82 reveals very similar pyrolysis behavior is experienced under both atmospheres. 129
146 Figure 79: Contours of Drying Reaction Rate for HPTR Model Simulations under N 2 Figure 80: Contours of Drying Reaction Rate for HPTR Model Simulations under CO 2 130

147 Figure 81: Contours of Pyrolysis Reaction Rate for HPTR Model Simulations under N 2 Figure 82: Contours of Pyrolysis Reaction Rate for HPTR Model Simulations under CO 2 131
148 Figures 83 and 84 depict time-averaged contour plots of the steam gasification reaction rate for the HPTR simulations under nitrogen and carbon dioxide, respectively. Inspection of Figures 81 and 82 reveals similar activity in steam gasification is experienced under both of the investigated atmospheres. It can be seen in these figures that very little steam gasification activity is apparent at the 700 and 800 C temperatures. While the 900 C operating temperature does exhibit some activity in steam gasification comparison, of the reaction rates in shown in Figures 83 and 84 to those of the drying and pyrolysis reactions shows that initial stage reactions are dominant. Figures 85 and 86 show time-averaged contour plots of the carbon dioxide gasification reaction rate for the HPTR simulations under nitrogen and carbon dioxide, respectively. The behavior exhibited by the carbon dioxide gasification reaction is similar to that of the steam gasification reaction in that very little reaction activity is apparent at the 700 and 800 C temperatures. At the 900 C operating temperature, some activity of the carbon dioxide gasification reaction is apparent under nitrogen; however, the highest rates are observed under carbon dioxide. Again, while the 900 C operating temperature under carbon dioxide does exhibit activity in carbon dioxide gasification, comparison of the reaction rates shown in Figures 85 and 86 to those of the drying and pyrolysis reactions shows that initial stage reactions are dominant over carbon dioxide gasification as well. Figures 87 and 88 depict time-averaged contour plots of the water-gas shift reaction rate for the HPTR simulations under nitrogen and carbon dioxide, respectively. It can be seen from Figures 87 and 88 that some forward water-gas shift is experienced by the nitrogen systems; while the direction of water-gas shift swings from forward to reverse as temperature increases for the carbon dioxide systems. 132

149 Figure 83: Contours of Steam Gasification Rate for HPTR Model Simulations under N 2 Figure 84: Contours of Steam Gasification Rate for HPTR Model Simulations under CO 2 133
Heat transfer optimization in a fluidized bed biomass gasification reactor
 Advanced Computational Methods and Experiments in Heat Transfer XIII 169 Heat transfer optimization in a fluidized bed biomass gasification reactor R. K. Thapa & B. M. Halvorsen Department of Process,
Modeling and Simulation of Downdraft Biomass Gasifier
 Modeling and Simulation of Downdraft Biomass Gasifier Pratik N Sheth a and B V Babu b1 Birla Institute of Technology and Science (BITS), PILANI-333 031 Rajasthan, India a Lecturer, Chemical Engineering
Design and Simulation of a Hybrid Entrained-Flow and Fluidized Bed Mild Gasifier Part 2 Case Study and Analysis
 Proceedings of the ASME 2011 International Mechanical Engineering Congress & Exposition IMECE2011 November 11-17, 2011, Denver, Colorado, USA IMECE2011-64485 Design and Simulation of a Hybrid Entrained-Flow
Author: Andrea Milioni Chemical Engineer On Contract Cooperator University UCBM Rome (Italy)
") Gasification Process Author: Andrea Milioni Chemical Engineer On Contract Cooperator University UCBM Rome (Italy) 1. Theme description The gasification process is the thermochemical conversion of a carbonaceous
Gasification Process Author: Andrea Milioni Chemical Engineer On Contract Cooperator University UCBM Rome (Italy) 1. Theme description The gasification process is the thermochemical conversion of a carbonaceous
ISSN: ISO 9001:2008 Certified International Journal of Engineering Science and Innovative Technology (IJESIT) Volume 3, Issue 2, March 2014
 Volume 3, Issue 2, March 2014") A Comparative Study on Fluidization Characteristics of Coarse and Fine Particles in a Gas - Solid Fluidized Bed: CFD Analysis Pranati Sahoo, Abanti Sahoo Abstract Hydrodynamics of a two - dimensional gas
A Comparative Study on Fluidization Characteristics of Coarse and Fine Particles in a Gas - Solid Fluidized Bed: CFD Analysis Pranati Sahoo, Abanti Sahoo Abstract Hydrodynamics of a two - dimensional gas
Numerical CFD Simulations for Understanding and Optimizing a Biomass Gasifier Reactor Set-Up
 Numerical CFD Simulations for Understanding and Optimizing a Biomass Gasifier Reactor Set-Up E. George 1, J. Nguyen 1,Y. Kara, B 1. Marchand 1, A. Galnares 1 & 1 O. Guerrini 1 1. GDF SUEZ, R&D Division
A Computational Study of the Hydrodynamics of Gas-Solid Fluidized Beds. Lindsey Teaters
 A Computational Study of the Hydrodynamics of Gas-Solid Fluidized Beds Lindsey Teaters Thesis submitted to the faculty of the Virginia Polytechnic Institute and State University in partial fulfillment
OPERATING PARAMETER EFFECTS ON THE SOLID CIRCULATION RATE IN A DUAL FLUIDIZED-BED GASIFICATION SYSTEM
 Eleventh International Conference on Computational Fluid Dynamics in the Minerals and Process Industries MCEC, Melbourne, Australia 7-9 December 2015 CFD2015 OPERATING PARAMETER EFFECTS ON THE SOLID CIRCULATION
Validation of the CFD model for prediction of flow behaviour in fluidized bed reactors
 Advances in Fluid Mechanics IX 231 Validation of the CFD model for prediction of flow behaviour in fluidized bed reactors R. K. Thapa & B. M. Halvorsen Department of Process, Energy and Environmental Technology,
Modelling & experimental validation of biomass-steam gasification in bubbling fluidized bed reactor
 Modelling & experimental validation of biomass-steam gasification in bubbling fluidized bed reactor Prasanth Gopalakrishnan Supervisor: Professor Shusheng Pang Co-supervisor: Dr Chris Williamson Department
Towards a Muti-scale Modeling Framework for Fluidized Bed Reactor Simulation
 Towards a Muti-scale Modeling Framework for Fluidized Bed Reactor Simulation Addison Killean Stark 1,3, Christos Altantzis 2,3, Ahmed F Ghoniem 3 November 16, 2016 November 16, 2016 1 ARPA-E, 2 NETL, 3
CFD and Process Simulations of air gasification of plastic wastes in a conical spouted bed gasifier
 CFD and Process Simulations of air gasification of plastic wastes in a conical spouted bed gasifier Dr. Abdallah S. Berrouk Dr. Chaohe Yang Mr. Yupeng Du Outline Background Process description CFD model
Hydrodynamics and CFD Modeling of Food Materials using Circulating Fluidized Bed
 International Journal of ChemTech Research CODEN (USA): IJCRGG, ISSN: 0974-4290, ISSN(Online):2455-9555 Vol.10 No.3, pp 276-288, 2017 Hydrodynamics and CFD Modeling of Food Materials using Circulating
Simulation of Simplified Model for Kinetics of Biomass Gasification
 Simulation of Simplified Model for Kinetics of Biomass Gasification Cornelius E. Agu 1 Rajan K. Thapa 2 Britt M. Halvorsen 3 Department of Process, Energy and Environmental Technology, Telemark University
Chapter 13. Thermal Conversion Technologies. Fundamentals of Thermal Processing
 Chapter 13 Thermal Conversion Technologies Fundamentals of Thermal Processing Thermal processing is the conversion of solid wastes into gaseous, liquid and solid conversion products with the concurrent
Development of an integrated procedure for comprehensive gasification modelling
 Development of an integrated procedure for comprehensive gasification modelling E. Biagini 1, L. Masoni 1, L. Tognotti 2 1. D. Energy and Environment - C. Pisa Ricerche, Pisa - ITALY 2. Chemical Engineering
Modelling of Biomass Pyrolysis
 Modelling of Biomass Pyrolysis Samreen Hameed, Adhirath Wagh, Abhishek Sharma, Milin Shah, Ranjeet Utikar and Vishnu Pareek 13/09/2017 A global university Perth Kalgoorlie Dubai Malaysia Singapore Biomass
A CFD MODELLING STUDY OF MULTI-PHASE FLOW BEHAVIOUR OF BIOMASS AND BIOCHAR PARTICLES IN A BUBBLING FLUIDIZED BED
 Ninth International Conference on CFD in the Minerals and Process Industries CSIRO, Melbourne, Australia 1-1 December 1 A CFD MODELLING STUDY OF MULTI-PHASE FLOW BEHAVIOUR OF BIOMASS AND BIOCHAR PARTICLES
AN INTRODUCTION TO FLUIDIZATION BY MILAN CARSKY UNIVERSITY OF KWAZULU-NATAL
 AN INTRODUCTION TO FLUIDIZATION BY MILAN CARSKY UNIVERSITY OF KWAZULU-NATAL AN INTRODUCTION TO FLUIDIZATION SUMMARY Principle of fluidization (gas-solid fluidization, liquid-solid fluidization, properties
CFD investigation of coal gasification: Effect of particle size
 CFD investigation of coal gasification: Effect of particle size Sonal Bhadauria #%, Sreepriya Vedantam *, Shriram Prasad $1, Anish P. Jacob $2 # PG scholar, Madhav Institute of Science and Technology,
Investigators: R. E. Mitchell, Associate Professor, Mechanical Engineering Department; P. A. Campbell and L. Ma, Graduate Researchers
 Coal and Biomass Char Reactivity Investigators: R. E. Mitchell, Associate Professor, Mechanical Engineering Department; P. A. Campbell and L. Ma, Graduate Researchers Project Overview: There is considerable
Numerical study on the thermodynamic characteristics. in a Twin Swirl pulverized coal Combustor
 ICCM2015, 14-17 th July, Auckland, NZ Abstract Numerical study on the thermodynamic characteristics in a Twin Swirl pulverized coal Combustor Yinli LIU, * Hao TANG, Yongfen WANG College of Energy and Power
High-Resolution Simulations of Gas-Solids Jet Penetration Into a High- Density Riser Flow
 Engineering Conferences International ECI Digital Archives 10th International Conference on Circulating Fluidized Beds and Fluidization Technology - CFB-10 Refereed Proceedings Spring 5-2-2011 High-Resolution
D DAVID PUBLISHING. Numerical Simulation of Char Particle Gasification. 1. Introduction
 Journal of Energy and Power Engineering 9 (2015) 679-686 doi: 10.17265/1934-8975/2015.08.001 D DAVID PUBLISHING Syed Shabbar Raza 1, Isam Janajreh 1, Rizwan Ahmed 2 and Ashjan AlKatheeri 2 1. Waste to
Biomass gasification plant and syngas clean-up system
 Available online at www.sciencedirect.com ScienceDirect Energy Procedia 75 (2015 ) 240 245 The 7 th International Conference on Applied Energy ICAE2015 Biomass gasification plant and syngas clean-up system
Improved solutions for solid waste to energy conversion
 Improved solutions for solid waste to energy conversion C. Marculescu * Polytechnic University Bucharest, Romania * Corresponding author. Tel: +40745133713, Fax: +40214029675, E-mail: cosminmarcul@yahoo.co.uk
Computational Study on Coal Direct Chemical Looping Combustion
 Computational Study on Coal Direct Chemical Looping Combustion Rahul Wadhwani Department of Chemical Engineering Indian Institute of Technology Roorkee, Roorkee, Uttarakhand, India Bikash Mohanty Department
EEC 503 Term Project No 2
 Overall Objective EEC 503 Term Project No 2 Spring 2012 In preparing this term paper you are expected to demonstrate: a) resourcefulness in (i) outlining of and focusing on the problem, (ii) using effectively
A Modeling of Biomass Fast Pyrolysis using CFD in a fluidized bed reactor
 Ref: C0273 A Modeling of Biomass Fast Pyrolysis using CFD in a fluidized bed reactor Young Min Ju, Department of Biosystems Engineering, Kangwon National University, Hyoja 2 Dong, 192-1 Chuncheon, Republic
Design of a Small Scale CFB Boiler Combustion Chamber for Laboratory Purposes
 International Journal of Emerging Engineering Research and Technology Volume 3, Issue 9, September, 2015, PP 1-7 ISSN 2349-4395 (Print) & ISSN 2349-4409 (Online) Design of a Small Scale CFB Boiler Combustion
Zhongchao Tan. Air Pollution and Greenhouse Gases. From Basic Concepts to Engineering. Applications for Air Emission Control.
 Zhongchao Tan Air Pollution and Greenhouse Gases From Basic Concepts to Engineering Applications for Air Emission Control ^ Springer Contents 1 Air Emissions I 1.1 Air 1 1.2 Air Pollution and Greenhouse
CFD Burner Study for Entrained Flow Gasifiers
 CFD Burner Study for Entrained Flow Gasifiers Numerical Study of Different Burner Configurations in an Entrained Flow gasifiers 1 H/C molar ratio 0.9 0.8 0.7 CRC-252 LBC-3 RBC-2 LBC-2 CRC-272 RBC-1 LBC-1
Combustion Modeling for Industrial Systems. Niveditha Krishnamoorthy CD-adapco
 Combustion Modeling for Industrial Systems Niveditha Krishnamoorthy CD-adapco niveditha.krishnamoorthy@cd-adapco.com Outline Combustion capabilities of STAR-CCM+ Modeling of process heaters, crackers,
ADVANCES in NATURAL and APPLIED SCIENCES
 ADVANCES in NATURAL and APPLIED SCIENCES ISSN: 1995-772 Published BY AENSI Publication EISSN: 1998-19 http://www.aensiweb.com/anas 216 April 1(4): pages 472-477 Open Access Journal Kinetic Modeling of
EXPERIMENTAL AND COMPUTATIONAL INVESTIGATION OF MIXING BEHAVIOUR OF BIOMASS WITH INERT SAND IN FLUIDIZED BED
 International Journal of Mechanical Engineering and Technology (IJMET) Volume 8, Issue 9, September 2017, pp. 257 263, Article ID: IJMET_08_09_027 Available online at http://www.iaeme.com/ijmet/issues.asp?jtype=ijmet&vtype=8&itype=9
MODELING OF BIOMASS GASIFICATION Venko Petkov, Emil Mihailov, Nadezhda Kazakova
 Journal Journal of Chemical of Technology and and Metallurgy, 9, 9, 1, 01, 1, 01 9-98 MDELING F BIMASS GASIFICATIN enko etkov, Emil Mihailov, Nadezhda azakova Department of hysical Metallurgy and Thermal
Modeling Biomass Gasification in a Fluidized Bed Reactor
 Proceedings of the 2014 International Conference on Industrial Engineering and Operations Management Bali, Indonesia, January 7 9, 2014 Modeling Biomass Gasification in a Fluidized Bed Reactor R. Fatoni
CFD-assisted Process Intensification for Biomass Fast Pyrolysis in Gas-solid Vortex Reactor Technology
 CFD-assisted Process Intensification for Biomass Fast Pyrolysis in Gas-solid Vortex Reactor Technology Shekhar R. Kulkarni, Arturo Gonzalez Quiroga, Patrice Perreault, Geraldine Heynderickx, Kevin M. Van
Gasification of Municipal Solid Waste
 Gasification of Municipal Solid Waste Salman Zafar Renewable Energy Advisor INTRODUCTION The enormous increase in the quantum and diversity of waste materials and their potentially harmful effects on the
Project Title: Development of a novel gasification technology for distributed power generation from solid wastes
 Project Title: Development of a novel gasification technology for distributed power generation from solid wastes Contract Number: RD4-1 Milestone Number: 3 Report Date: April 3, 218 Principal Roger Ruan
Solid Circulation and Gas Bypassing in an Internally Circulating Fluidized Bed with an Orifice-Type Draft Tube
 Korean J. Chem. Eng., 16(5), 618-623 (1999) Solid Circulation and Gas Bypassing in an Internally Circulating Fluidized Bed with an Orifice-Type Draft Tube Hong-Sik Ahn, Woon-Jae Lee, Sang-Done Kim and
COMSOL Multiphysics Simulation of Flow in a Radial Flow Fixed Bed Reactor (RFBR)
") COMSOL Multiphysics Simulation of Flow in a Radial Flow Fixed Bed Reactor (RFBR) Anthony G. Dixon *,1, Dominic Polcari 1, Anthony Stolo 1 and Mai Tomida 1 1 Department of Chemical Engineering, Worcester
COMSOL Multiphysics Simulation of Flow in a Radial Flow Fixed Bed Reactor (RFBR) Anthony G. Dixon *,1, Dominic Polcari 1, Anthony Stolo 1 and Mai Tomida 1 1 Department of Chemical Engineering, Worcester
Detailed modelling of FBC fluid dynamics and combustion
 Detailed modelling of FBC fluid dynamics and combustion Norberto Fueyo, Ana Cubero, Alberto Sánchez-Insa, Ramón Chordá Numerical Fluid dynamics Group University of Zaragoza gfn.unizar.es IEA - Fluidized
EVALUATION OF AN INTEGRATED BIOMASS GASIFICATION/FUEL CELL POWER PLANT
 EVALUATION OF AN INTEGRATED BIOMASS GASIFICATION/FUEL CELL POWER PLANT JEROD SMEENK 1, GEORGE STEINFELD 2, ROBERT C. BROWN 1, ERIC SIMPKINS 2, AND M. ROBERT DAWSON 1 1 Center for Coal and the Environment
MODELLING OF WOODEN BIOMASS PYROLYSIS IN SCREW REACTOR
 Proceedings of the Asian Conference on Thermal Sciences 2017, 1st ACTS March 26-30, 2017, Jeju Island, Korea ACTS-P00794 MODELLING OF WOODEN BIOMASS PYROLYSIS IN SCREW REACTOR Levin A. A. *, Kozlov A.N.
PROCESS SIMULATION OF A ENTRAINED FLUIDIZED BED BIOMASS GASIFICATION USING ASPEN PLUS
 PROCESS SIMULATION OF A ENTRAINED FLUIDIZED BED BIOMASS GASIFICATION USING ASPEN PLUS S.Ilaiah 1, D.Veerabhadra Sasikanth 2, B.Satyavathi 3 1 University College of Technology, Osmania University, Hyderabad,(India)
The Effects of Increased Pressure on the Reaction Kinetics of Biomass Pyrolysis and Combustion
 The Effects of Increased Pressure on the Reaction Kinetics of Biomass Pyrolysis and Combustion Charles Churchman, P.E. Stephanie England, E.I.T. International Applied Engineering, Inc. Marietta, Georgia
Direct Conversion Process from Syngas to Light Olefins A Process Design Study
 CHEMICAL ENGINEERING TRANSACTIONS Volume 21, 2010 Editor J. J. Klemeš, H. L. Lam, P. S. Varbanov Copyright 2010, AIDIC Servizi S.r.l., ISBN 978-88-95608-05-1 ISSN 1974-9791 DOI: 10.3303/CET102100156 331
STUDIES ON NUCLEAR COAL GASIFICATION IN ARGENTINA
 STUDIES ON NUCLEAR COAL GASIFICATION IN ARGENTINA D. Nassini (1), G.G. Fouga (1,2), G. De Micco (1,2) H.E. Nassini (2) and A.E. Bohé (1,2) (1) Consejo Nacional de Investigaciones Científicas y Técnicas
Biomass Combustion Technology
 Lecture-6 Biomass Combustion Technology Combustion Biomass combustion is a complex process that consists of consecutive heterogeneous and homogeneous reactions. The main process steps are drying, devolatilization,
Abstract Process Economics Program Report 270 THERMOCHEMICAL CELLULOSIC ETHANOL (December 2009)
") Abstract Process Economics Program Report 270 THERMOCHEMICAL CELLULOSIC ETHANOL (December 2009) World ethanol production has experienced spectacular growth. This growth has been based on starch and sugar
Abstract Process Economics Program Report 270 THERMOCHEMICAL CELLULOSIC ETHANOL (December 2009) World ethanol production has experienced spectacular growth. This growth has been based on starch and sugar
A numerical simulation of the combustion processes of wood pellets
 Advanced Computational Methods and Experiments in Heat Transfer XIII 149 A numerical simulation of the combustion processes of wood pellets J. Ahn 1 & H. J. Kim 2 1 School of Mechanical Systems Engineering,
Prediction of Pollutant Emissions from Industrial Furnaces Using Large Eddy Simulation
 Paper # B03 Topic: Turbulent Flames 5 th US Combustion Meeting Organized by the Western States Section of the Combustion Institute and Hosted by the University of California at San Diego March 25-28, 2007.
Numerical simulation of biomass fast pyrolysis in fluidized bed and auger reactors
 Graduate Theses and Dissertations Iowa State University Capstones, Theses and Dissertations 2014 Numerical simulation of biomass fast pyrolysis in fluidized bed and auger reactors Soroush Aramideh Iowa
Characterization of Coal and Biomass. Conversion Behaviors in Advanced Energy Systems
 Characterization of Coal and Biomass Conversion Behaviors in Advanced Energy Systems Reginald Mitchell, Paul Campbell and Liqiang Ma High Temperature Gasdynamics Laboratory Group Mechanical Engineering
Modelling and Simulation of Thermodynamic Processes of Vertical Shaft Kiln in Magnesia Plant Using CFD Code Fluent
 Proceedings of the 5th IASME/WSEAS Int. Conference on Heat Transfer, Thermal Engineering and Environment, Athens, Greece, August 25-27, 2007 85 Modelling and Simulation of Thermodynamic Processes of Vertical
Analysis of the Effect of Steam-to-Biomass Ratio in Fluidized Bed Gasification with Multiphase Particle-in-cell CFD Simulation
 Analysis of the Effect of Steam-to-Biomass Ratio in Fluidized Bed Gasification with Multiphase Particle-in-cell CFD Simulation Janitha C. Bandara 1 Marianne S. Eikeland 1 Britt M. E. Moldestad 1 1 Faculty
Pyrolysis and Gasification
 Pyrolysis and Gasification of Biomass Tony Bridgwater Bioenergy Research Group Aston University, Birmingham B4 7ET, UK Biomass, conversion and products Starch & sugars Residues Biological conversion Ethanol;
MODELING OF CHAR COMBUSTION IN CO 2 /O 2 AND N 2 /O 2 ATMOSPHERES
 MODELING OF CHAR COMBUSTION IN CO 2 /O 2 AND N 2 /O 2 ATMOSPHERES C. Kuhr *, M. Ehmann *, S. Rehfeldt *, C. Bergins *, J. Maier, G. Scheffknecht, S. Wu *Hitachi Power Europe GmbH, Schifferstraße 80, 47059
Hydrodynamic Modelling of Coal-Biomass Mixture in a Bubbling Fluidized Bed Reactor
 Journal of Applied Fluid Mechanics, Vol. 10, No. 5, pp. 1355-1362, 2017. Available online at www.jafmonline.net, ISSN 1735-3572, EISSN 1735-3645. DOI: 10.18869/acadpub.jafm.73.242.27698 Hydrodynamic Modelling
Thermochemical Gasification of Agricultural Residues for Energetic Use
 Thermochemical Gasification of Agricultural Residues for Energetic Use Uzuneanu Krisztina, Ion V.Ion Thermochemical Gasification of Agricultural Residues for Energetic Use: In this paper we present the
Two-stage Gasification of Untreated and Torrefied Wood
 133 A publication of CHEMICAL ENGINEERING TRANSACTIONS VOL. 50, 2016 Guest Editors: Katharina Kohse-Höinghaus, Eliseo Ranzi Copyright 2016, AIDIC Servizi S.r.l., ISBN 978-88-95608-41-9; ISSN 2283-9216
Effect of Temperature Field on the Coal Devolatilization in a Millisecond Downer Reactor
 Engineering Conferences International ECI Digital Archives 1th International Conference on Circulating Fluidized Beds and Fluidization Technology - CFB-1 Refereed Proceedings Spring 5-3-211 Effect of Temperature
Evaluating a Downdraft Wood Fired Hydronic Furnace: Computational Fluid Dynamics Modeling and Analysis
 Evaluating a Downdraft Wood Fired Hydronic Furnace: Computational Fluid Dynamics Modeling and Analysis Megan Karalus karalm2@u.washington.edu Master s of Science in Mechanical Engineering 9 June 2009 Outline
Computational Fluid Dynamics Modeling and Simulations of Fluidized Bed Reactors for Chemical Looping Combustion
 Washington University in St. Louis Washington University Open Scholarship Engineering and Applied Science Theses & Dissertations Engineering and Applied Science Summer 8-15-2016 Computational Fluid Dynamics
PRODUCTION OF SYNGAS BY METHANE AND COAL CO-CONVERSION IN FLUIDIZED BED REACTOR
 PRODUCTION OF SYNGAS BY METHANE AND COAL CO-CONVERSION IN FLUIDIZED BED REACTOR Jinhu Wu, Yitain Fang, Yang Wang Institute of Coal Chemistry, Chinese Academy of Sciences P. O. Box 165, Taiyuan, 030001,
Energy-Crop Gasification
 Energy-Crop Gasification R. Mark Bricka Mississippi State University Mississippi State, MS Biomass may be obtained from many sources. Already mentioned at this conference are switchgrass, corn stover,
Non-intrusive Uncertainty Quantification for Reacting Multiphase Flows in Coal Gasifiers
 2014 ASME V&V Symposium Performance Measures x.x, x.x, and x.x Track 2: Uncertainty Quantification, Sensitivity Analysis, and Prediction Part 3, Las Vegas, Nevada, USA May 9 th, 2014 Non-intrusive Uncertainty
A Textbook of Metallurgical Kinetics
 A Textbook of Metallurgical Kinetics A Textbook of Metallurgical Kinetics AHINDRA GHOSH Formerly Professor Materials and Metallurgical Engineering Indian Institute of Technology Kanpur SUDIPTO GHOSH Associate
Chapter 2.6: FBC Boilers
 Part-I: Objective type questions and answers Chapter 2.6: FBC Boilers 1. In FBC boilers fluidization depends largely on --------- a) Particle size b) Air velocity c) Both (a) and (b) d) Neither (a) nor
Pilot Scale Production of Mixed Alcohols from Wood. Supplementary Information
 Pilot Scale Production of Mixed Alcohols from Wood Supplementary Information Richard L. Bain, Kimberly A. Magrini-Bair, Jesse E. Hensley *, Whitney S. Jablonski, Kristin M. Smith, Katherine R. Gaston,
FORMING THE COMPOSITION OF UNDERGROUND COAL GASIFICATION PRODUCTS IN THE SIMULATION OF VARIOUS HEAT AND MASS TRANSFER CONDITIONS IN THE COAL SEAM
 FORMING THE COMPOSITION OF UNDERGROUND COAL GASIFICATION PRODUCTS IN THE SIMULATION OF VARIOUS HEAT AND MASS TRANSFER CONDITIONS IN THE COAL SEAM A.S. Masanik 1, A.N. Subbotin 1,*, and A.S. Tarasanov 1
Effect of Fuel Particle Size on Emissions and Performance of Fluidized Bed Combustor
 2011 International Conference on Biology, Environment and Chemistry IPCBEE vol.24 (2011) (2011)IACSIT Press, Singapoore Effect of Fuel Particle Size on Emissions and Performance of Fluidized Bed Combustor
Principles of Pyrolysis
 Lecture- 10 Principles of Pyrolysis Pyrolysis Pyrolysis is the one of the most common methods in thermal conversion technology of biomass. In pyrolysis, biomass is heated to moderate temperatures, 400-600
MODELLING COMBUSTION AND THERMAL NO X FORMATION IN ELECTRIC ARC FURNACES FOR THE PRODUCTION OF FERRO-SILICON AND SILICON-METAL
 MODELLING COMBUSTION AND THERMAL NO X FORMATION IN ELECTRIC ARC FURNACES FOR THE PRODUCTION OF FERRO-SILICON AND SILICON-METAL B. Ravary, C. Colomb 1 and S. T. Johansen 2 ERAMET Norway AS, c/o SINTEF Materials,
DETERMINATION OF AIR/FUEL AND STEAM/FUEL RATIO FOR COAL GASIFICATION PROCESS TO PRODUCE SYNTHESIS GAS
 DETERMINATION OF AIR/FUEL AND STEAM/FUEL RATIO FOR COAL GASIFICATION PROCESS TO PRODUCE SYNTHESIS GAS Afşin Güngör, Murat Özbayoğlu, Coşku Kasnakoğlu 3, Atilla Bıyıkoğlu 4, B. Zühtü Uysal 5 Dept. of Mechanical
Effect of catalyst to oil weight ratio on gaseous product distribution during heavy oil catalytic pyrolysis
 Chemical Engineering and Processing 3 () 965 97 Effect of catalyst to oil weight ratio on gaseous product distribution during heavy oil catalytic pyrolysis Xianghai Meng, Chunming Xu, Jinsen Gao, Qian
Supercritical Water Coal Conversion with Aquifer-Based Sequestration of CO 2
 Supercritical Water Coal Conversion with Aquifer-Based Sequestration of CO 2 Profs. Reginald Mitchell, 1 Christopher Edwards 1 and Scott Fendorf 2 1 Mechanical Engineering Department 2 Department of Geological
Computational fluid dynamics simulations of biomass fast pyrolysis in a gas-solid vortex reactor
 Computational fluid dynamics simulations of biomass fast pyrolysis in a gas-solid vortex reactor Shekhar R. Kulkarni, Laurien A. Vandewalle, Arturo González Quiroga, Patrice Perreault, Pieter A. Reyniers,
CFD modeling of Plasmatron Methane Reformer
 PSFC/JA-05-14 CFD modeling of Plasmatron Methane Reformer L. Bromberg August 25, 2005 Massachusetts Institute of Technology Plasma Science and Fusion Center Supported by Chevron Texaco, ArvinMeritor and
The Role of Engineering Simulation in Clean Coal Technologies
 W H I T E P A P E R - 1 0 6 The Role of Engineering Simulation in Clean Coal Technologies David Schowalter, PhD, ANSYS, Inc. IINTRODUCTION In some circles in the United States, coal has become a dirty
Simulation of the Flow in a Packed-Bed with and without a Static Mixer by Using CFD Technique
 Simulation of the Flow in a Packed-Bed with and without a Static Mixer by Using CFD Technique Phavanee Narataruksa, Karn Pana-Suppamassadu, Sabaithip Tungkamani Rungrote Kokoo, and Prayut Jiamrittiwong
3D Modelling of Oxygen Fired CFB Combustors in Different Scales
 3rd Oxyfuel Combustion Conference Ponferrada, Spain, 9th - 13th September 2013 3D Modelling of Oxygen Fired CFB Combustors in Different Scales Presented by: Jarno Parkkinen a Co-authors: Pasi Antikainen
Copyright is owned by the Author of the thesis. Permission is given for a copy to be downloaded by an individual for the purpose of research and
 Copyright is owned by the Author of the thesis. Permission is given for a copy to be downloaded by an individual for the purpose of research and private study only. The thesis may not be reproduced elsewhere
COMPARISON OF INSTANTANEOUS, EQUILIBRIUM, AND FINITE-RATE GASIFICATION MODELS IN AN ENTRAINED-FLOW COAL GASIFIER. Armin Silaen Ting Wang *
 Proceedings of the 26th International Pittsburgh Coal Conference, Pittsburgh, USA, September 20-23, 2009 COMPARISON OF INSTANTANEOUS, EQUILIBRIUM, AND FINITE-RATE GASIFICATION MODELS IN AN ENTRAINED-FLOW
Fluidised bed gasification of high-ash South African coals: An experimental and modelling study
 Fluidised bed gasification of high-ash South African coals: An experimental and modelling study A.D. Engelbrecht, B.C. North, B.O. Oboirien, R.C. Everson and H.W.P.J. Neomagus MAY 2012 www.csir.co.za CSIR
Theory Comparison between Propane and Methane Combustion inside the Furnace
 International Journal of Current Engineering and Technology E-ISSN 2277 4106, P-ISSN 2347 5161 2015 INPRESSCO, All Rights Reserved Available at http://inpressco.com/category/ijcet Research Article Theory
Development of coal gasifier operation supporting technique
 Development of coal gasifier operation supporting technique - Evaluation of gasification performance and slag discharge characteristics using CFD technique - Hiroaki WATANABE Energy Engineering Research
THE CHALMERS GASIFIER
 ASSESSMENT OF THE MASS AND ENERGY FLOWS IN THE CHALMERS GASIFIER Anton Larsson 1,2*, Martin Seemann 1,3, Henrik Thunman 1,4 1 Division of Energy Technology, Chalmers University of Technology, SE-412 96
Effect of Pressure and Heating Rates on Biomass Pyrolysis and Gasification
 Effect of Pressure and Heating Rates on Biomass Pyrolysis and Gasification Pradeep K. Agrawal School of Chemical and Biomolecular Engineering Georgia Institute of Technology June 15, 2012 Auburn University
ASPEN PLUS SIMULATION AND EXPERIMENTAL STUDIES ON BIOMASS GASIFICATION
 ASPEN PLUS SIMULATION AND EXPERIMENTAL STUDIES ON BIOMASS GASIFICATION THIS THESIS IS SUBMITTED IN THE PARTIAL FULFILLMENT OF THE REQUIREMENT FOR THE DEGREE OF BACHELOR OF TECHNOLOGY IN CHEMICAL ENGINEERING
Development of a Kinetic Fluidized Bed Gasifier Model for Application in Flowsheet Simulation
 Die Ressourcenuniversität. Seit 1765. Department of Energy Process Engineering and Chemical Engineering Development of a Kinetic Fluidized Bed Gasifier Model for Application in Flowsheet Simulation Matthias
Introduction: Thermal treatment
 Thermal Treatment 2 Introduction: Thermal treatment Technologies using high temperatures to treat waste (or RDF) Commonly involves thermal combustion (oxidation) Reduces waste to ash (MSW c. 30% of input)
PLASMA ARC THE LEADING LIGHT?
 http://www.waste-management-world.com/articles/print/volume-11/issue-6/features/plasma-arc-the-leading-light.html PLASMA ARC THE LEADING LIGHT? 11/01/2010 Various thermal processes are now available for
Research Article Effect of Heating Method on Hydrogen Production by Biomass Gasification in Supercritical Water
 Advances in Condensed Matter hysics, Article ID 519389, 5 pages http://dx.doi.org/.1155/2014/519389 Research Article Effect of Heating Method on Hydrogen roduction by Biomass Gasification in Supercritical
Advanced Gas Cleaning using Chemical-Looping Reforming (CLR)
") 1 st International Conference on Renewable Energy Gas Technology Malmö, Sweden 2014 Advanced Gas Cleaning using Chemical-Looping Reforming (CLR) Henrik Thunman 1, Nicolas Berguerand, Martin Seemann 1 Division
1 st International Conference on Renewable Energy Gas Technology Malmö, Sweden 2014 Advanced Gas Cleaning using Chemical-Looping Reforming (CLR) Henrik Thunman 1, Nicolas Berguerand, Martin Seemann 1 Division
Development and optimization of a two-stage gasifier for heat and power production
 Journal of Physics: Conference Series PAPER OPEN ACCESS Development and optimization of a two-stage gasifier for heat and power production Related content - Design and implementation of a laserbased absorption
1-D Coupled Chemical Reaction and Heat Transfer Models for Biomass Fast Pyrolysis
 1-D Coupled Chemical Reaction and Heat Transfer Models for Biomass Fast Pyrolysis Presenter: Jianqiu Huang (Tim) Mentor: Shankar Subramaniam Department of Mechanical Engineering Motivation To understand
ABE 482 Environmental Engineering in Biosystems. September 29 Lecture 11
 ABE 482 Environmental Engineering in Biosystems September 29 Lecture 11 Today Gasification & Pyrolysis Waste disposal balance Solid Waste Systems Solid Waste Air Limited air No air Combustion Gasification
DETAILED DEM SIMULATION OF PARTICLE- WALL INTERACTIONS UNDER COAL GASIFIER CONDITIONS
 DETAILED DEM SIMULATION OF PARTICLE- WALL INTERACTIONS UNDER COAL GASIFIER CONDITIONS D.M. Balice*, F. S. Marra**, F. Montagnaro*, P. Salatino*** marra@irc.cnr.it *Dipartimento di Scienze Chimiche, Università