An Educator s Guide to Stream Health Assessment
|
|
|
- Geraldine Cameron
- 5 years ago
- Views:
Transcription

1 An Educator s Guide to Stream Health Assessment
2 Purpose of this guide This guide has been designed to support teachers of students in years 5-8 to explain the principles of stream health and the field-based skills required to assess stream health. Greater Wellington Regional Council (GWRC) supports schools to teach their students about native freshwater ecosystems and engage them in learning about stream biodiversity and how their actions can affect stream health. Assessing stream health involves investigating the water quality, the physical features of the stream and the plants and animals living in and alongside the stream. This guide offers suggestions about how to plan and undertake assessment during a field trip. Stream health assessment can support several school curriculum topics, including science, maths, technology, social studies and environmental education. In particular, stream health assessment can support studies about native animals or freshwater ecology, the impact of people on the environment and how land use can affect streams. There are many online school resources to supplement the study of stream health. This guide has been adapted from the GWRC Take Action for Water school resource, which is available at This guide is intended to be used with stream assessment kits that include the equipment necessary to undertake stream assessment. These kits are available for loan within the Wellington region from GWRC. For information about the stream assessment kits go to 2 Cover image: Students using a water clarity tube
3 Contents Introduction 3 Planning a field trip 4 Planning process 4 Preparing equipment 5 Preparing your itinerary 5 Background information 6 Introducing students to stream assessment 6 The scientific method 6 The stream health assessment 6 An Educator s Guide to Stream Health Assessment Setting up and equipment 7 Stream health assessment activities 8 Stream habitat Stream habitat observations (Activity 1) 8 Water quality Measuring water temperature (Activity 2) 9 Measuring water clarity (Activity 3) 9 Aquatic invertebrates Observing aquatic invertebrates (Activity 4) 10 Conclusions 11 Resources for stream health assessment 12 Online education resources 12 Glossary 12 Stream Health Assessment Worksheet 13 Critter Identification Card 15 Algae Identification Card 16 3

4 Introduction Why assess stream health? Protecting our precious water resource is important for many reasons. Everyone needs safe drinking water, and New Zealanders also place importance on water for several other reasons. They want safe water for recreational activities such as swimming, sustainable supplies for economic activities such as farming livestock or growing crops and healthy water for biodiversity the plants and animals that live in the stream. Indicators of stream health can also be monitored to track changes in conditions over time to see whether the health of a stream is improving or declining. Monitoring can also be used to see if activities such as planting along stream banks are helping to improve the health of the stream. This information improves our knowledge of local streams and is a great way for kids to be involved, to share stories and to start conversations about stream biodiversity, and what we can do to protect streams. What s in this guide? This guide provides information to support teachers in leading a field trip to assess stream health. There are four main sections: Planning a field trip Background information Stream health assessment activities Resources for stream health assessment Akatarawa Stream, a healthy natural stream 4
5 Planning a field trip When planning a field trip there are a number of factors to consider. Prior to embarking on your field trip it is recommended that you familiarise yourself with the Background information section. It may also pay to introduce students and helpers to the concepts contained in this guide, as well as outlining the process you expect to follow. Assessing stream health will support students to learn field skills and to develop a better understanding of the elements of stream health. Assessing one stream allows students to focus on a particular stream in detail, while visiting both a healthy and a degraded stream provides the opportunity for students to compare results. Stream assessment activities, once at a site, will take hours. The timing of the different activities will depend on the size of your group, how in-depth your discussions are and whether you set up before or on arrival. The assessment at a second stream is usually quicker as participants are more familiar with the equipment and methods. Areas that are covered in native forest usually have healthier waterways. Streams running through land dominated by urbanisation or intensive farming are more likely to be degraded due to inputs like stormwater pollution, sediment, animal waste, pesticides and fertilisers. Assessing the land cover of a catchment can be done before a field trip and used as an indicator to predict the health of a stream. An Educator s Guide to Stream Health Assessment The following steps are recommended for planning a field trip to a stream site. It is best to sort students into groups and to assemble equipment prior to departing. An example itinerary and a list of recommended equipment are also provided. Planning process 1. Identify a suitable stream monitoring site (you can find stream maps on the LAWA link in the Online education resources section) 2. Get permission from the landowner to access the stream 3. Visit the site to assess: a. space available for your group size and for activities b. safe access to the water c. hazards and how they might be managed d. views along the stream to carry out monitoring activities (ideally about 50m) e. parking and toilet facilities f. cell phone coverage 4. Organise stream assessment equipment. If you do not have one of your own, stream assessment kits can be borrowed from GWRC. Information on booking a kit can be found at 5. Coordinate appropriate health and safety management and documentation 6. Arrange field trip date, postponement date and itinerary (see below) 7. Coordinate communication and documentation with students and their families about the nature of the trip, what forms need completing (eg permission slips) and what gear they ll need to bring 8. Coordinate transport and adult help for the trip 9. Prepare stream health assessment resources for the day: a. print Stream Health Assessment Worksheets (pages 13 & 14) b. collect equipment (see equipment list below) 5
6 Preparing equipment Some items needed for the field trip are provided in the GWRC stream health assessment kits, available for schools in the Wellington region. The equipment recommended to be taken is listed here. Stream assessment kits Assembled by the teacher Assembled by students 1 Clarity tube (tube in protective cover, cap and 2 magnets) 5 White trays 1 Thermometer 1 Kick net 5 Magnifying glasses 15 Critter ID cards / Algae ID cards First aid kit Stream Health Assessment Worksheets (page 13 & 14) Clipboards Sunscreen Camera Gumboots Weather-appropriate clothing Drink bottle Water-proof jacket Personal medication Pencils Sturdy walking shoes Warm hat and sun hat 1 Brush for cleaning Cones (or similar) to mark 5 Plastic spoons stream monitoring area Gumboots if working in water 1 Care and courtesy / Equipment list 1 Copy of An Educator s Guide to Stream Health Assessment (this guide) 1 Large container Map of the area eg, from Google maps GWRC website Walking Access (www. wams.org.nz) Preparing your itinerary The itinerary below is a suggestion only. You might choose to explain all the stream assessment observations and measurements and how to record results before students start to work through the four activities, or you could do this at the start of each activity. You may also like to combine some activities rather than rotate groups through them separately. Example itinerary for when you arrive at the site. Total estimated time is hours duration. Action Time Description (minutes) Site briefing 5 Health and safety, toilets, schedule for the day Suggested break 15 Introduction and overview of stream health assessment 5 Basic description of activities and procedure for groups; sort into pre-determined groups Hypothesis/prediction of stream health 10 Hand out clipboards, worksheets, ID cards and pencils; explain and complete the initial information and the hypothesis (prediction) section on the Stream Health Assessment worksheet Break into groups Rotate each group through the activities below Activity 1 Stream habitat observation See page 8 Activity 2 Water temperature See page 9 Activity 3 Water clarity See page 10 Activity 4 Aquatic invertebrates See page 11 Group conclusions Each group should assess their results and any conclusions about stream health and compare these with their original hypothesis Re-group 10 Share and discuss results as a larger group Suggested break 30 Return to school or travel to second stream site Second stream health monitoring Repeat activities as above 6
7 Background information This section provides background information on key aspects of stream health to support informed discussion and to provide guidance on completing a stream health assessment using the scientific method. It explains how the assessment results and observations relate to stream health. Introducing students to stream assessment To prepare students for the field trip, it may be useful to introduce them to the purpose of stream health assessment, the tests and observations that are used for this, and how the wider environment influences stream heath. These are outlined below. The purpose of stream health assessment may be to identify a potential water quality problem, to determine whether it is safe to swim or to help make decisions about looking after a stream. Tests and observations are made to investigate how healthy a stream is. These are the same tests that aquatic scientists use. Stream assessment results can vary at different sites along a stream and between different streams. On a field trip the stream water is tested to determine the water quality at this site, in this stream and at this time. Some factors that have an impact on streams include: An Educator s Guide to Stream Health Assessment seasonal variation - in summer there is usually less rainfall (lower water levels and less flow) and water temperatures can be higher storms - lots of rain can affect the amount of sediment carried in the water and therefore affect the water clarity readings human activities digging work or logging adjacent to the stream can increase the amount of sediment in the water The health of a stream is dependent on its location within a catchment (ie. whether it is close to the ocean or close to the start of the stream) and on the surrounding environment (ie. whether there is housing, industry, native forest or agriculture). Some key concepts about the catchment include: native forest cover supports healthy waterways by providing habitat, shade and capturing sediment urban areas can negatively impact the health of a stream or waterway due to storm water pollution intensive farming can also have a negative impact on the health of a waterway, particularly when there is a lack of protective vegetation or fencing to keep stock out. Contaminants can include animal waste, fertiliser, pesticides and sediment. The scientific method Stream health assessment involves a set of simple scientific experiments, which students can be guided through. The process is: make a prediction or hypothesis set up equipment perform tests and observations analyse results make a conclusion The stream health assessment Students will need a clipboard, pen and a Stream Health Assessment Worksheet (page 13). They can work in pairs, groups or individually to complete the worksheet. They should circle one answer for each test or observation and write in reasons for their hypothesis and conclusion. 7
8 Hypothesis Ask students to make a prediction about how healthy they think the stream is. This should be based on their observations of where the stream is in the catchment and the effects of land use in the areas it flows through. Tests and observations Students should investigate the health of the stream by carrying out tests and observations on: 1. stream habitat observations of the stream bed, algae, pool/riffle/run, shading, bank stability and any human impact features 2. water quality tests for water temperature and water clarity 3. aquatic invertebrates observations of the types of invertebrates present Use a map to show students the catchment area and to refer to the environment around the stream you will be assessing. Discuss the impacts of the surrounding catchment on the health of the stream. Prompt a discussion towards forming a hypothesis/prediction of the health of the stream. Setting up and equipment Each activity will require specific equipment and a small amount of set up time. You may do this before the students arrive, or with the students. Mark out the section of the stream you will assess using cones or other identifiable objects and let participants know the boundaries. A 50 metre section of stream is fine. 8
9 Stream health assessment activities Stream habitat Activity 1: Stream habitat observations Setting up and equipment use These observations do not require any set-up except of outlining the section of stream to be assessed. Equipment needed: Stream Health Assessment Worksheet and Algae Identification Card Students will need to walk along a 50m reach of the stream to make a visual assessment of the stream habitat. They should observe the aspects of the environment listed below and record their observations on the Stream Health Assessment Worksheet. a. Stream bed Many aquatic animals rely on stony stream beds, where they live on and in-between the stones. Sediment from soil erosion (eg, as a result of deforestation, earthworks or storms) in the catchment can cover the stones and degrade the habitat for fish and aquatic invertebrates. An Educator s Guide to Stream Health Assessment b. Algae Algae grow on the stones in the stream bed. Some invertebrates feed on algae as their main food source and are adapted to eat short algae. When nutrient levels are high (from agricultural runoff) or when there is too much sunlight (lack of stream shading), algae grows longer and thicker and invertebrates can no longer eat it. See the Algae Identification Card (page 16) in the Resources section (also included in the stream assessment kits). c. Pool/riffle/run A healthy stream will have pools, riffles and runs as these provide a variety of habitat for aquatic animals. A pool is an area of slow flowing, deep water, often on the outside bend of a stream A riffle is an area of fast flowing, shallow water where the surface of the water is broken from flowing over stones A run is a smooth, unbroken flow of water that connects pools and riffles d. Stream shading Trees provide shading that has several benefits: reduces temperature extremes limits light and keeps water cooler to help limit algal growth keeps water cooler to hold more dissolved oxygen (invertebrates and fish need oxygen to survive) provides falling leaves and insects as a year round supply of food for aquatic animals e. Bank stability Bank stability is provided naturally by trees and plants. Root systems hold the banks together and are particularly effective when they grow right down to the water s edge. Bare banks, erosion and bank slumping show instability. Tree roots help stream ecosystems by: preventing sediment (soil) from coating the stream bed and covering the gaps between the rocks where invertebrates live keeping sediment out of the water and maintaining water clarity. (This is important for stream dwelling creatures who need good visibility to hunt prey and need their gills clear for taking in oxygen) creating habitat for fish and kōura (freshwater crayfish) in amongst their roots f. Human impacts Some human actions have a direct effect on the stream and the animals within it. Examples include: stormwater pipes that may discharge polluted water grazing animals (eg, cows) that pollute the water culverts and weirs that stop the migration of native fish straightening of streams that reduce pool or riffle habitat concreted stream beds with no stony habitat available for aquatic animals 9

10 Water quality Activity 2: Measuring water temperature Setting up and equipment use Water temperature is measured using a thermometer. Collect stream water in a white tray and place the thermometer so it is lying flat and submerged in the bottom of the tray. Take measurements once the thermometer reading has reached the water temperature. Read the thermometer while it is still in the water. If it is taken out of the water it will begin to measure the air temperature. The water temperature will slowly increase on warm days. If possible, keep this tray in the shade to prevent the water from warming up. If testing with a number of groups over a longer period of time and the water temperature rises, collect fresh water. Equipment needed: 1 white tray, thermometer The temperature of the water affects the amount of oxygen dissolved in the water. Cool water contains more oxygen than warm water. Water at 0 C has twice the oxygen than water at 30 C. Most invertebrates prefer temperatures of 10 to 15 C. Aquatic animals become stressed as temperatures increase and will eventually die if they are unable to move to a cooler stretch of stream. Student using a water clarity tube 10
11 Activity 3: Measuring water clarity Setting up and equipment use Water clarity is measured using a metre-long clarity tube which is filled with stream water. One end is clear for viewing and the open end is fitted with a cap. Magnets are used on the inside and outside of the tube to hold a black disc inside which is moved along the length of the tube. By moving the disc you can mark the depth of visibility through the water. Care of tube It is important to keep the tube free from scratches, especially at the viewing end, to ensure accurate measurement readings Clarity tubes are fragile and can break easily please ensure their use is closely supervised. Filling the water clarity tube 1. Gently insert the magnets while the tube is still empty and lying horizontal, to prevent the inside magnet dropping down the length of the tube and breaking the bottom of the tube. Insert the magnet with the black disc inside the mouth of the tube, with the disc closest to the open end. Hold this in place with the other magnet on the outside of the tube. They will now attract each other and grip onto the tube. Tube Other magnet outside tube Tube Other magnet outside tube An Educator s Guide to Stream Health Assessment Magnet with black disc inside tube Cap Magnet with black disc inside tube View of magnets looking down tube View of magnets looking along tube 2. Fill the tube by dipping it into the stream, magnet side up. Keep the mouth of the tube upstream of where you are standing so that the sediment you disturb with your feet doesn t go in the tube. Don t rest the tube mouth against the stream bottom while you are filling it as this will scoop sediment into the tube. 3. When the tube is full, place the rubber cap on the end whilst still holding it under the water. When you lift the tube out of the water, water will probably squirt or leak out of the pressure valve in the cap. The tube is now ready to use. Using the water clarity tube Students should use the clarity tube in pairs or groups of three Make sure the tube is held horizontally while reading Ensure there is enough light - avoid patchy light with shadows To read the water clarity 1. Look through the clear viewing end of the tube along the length of the tube (toward the black cap). 2. One person should slowly slide the magnets along the tube, away from the viewing end while a second person, the observer, keeps an eye on the black disc. 3. Keep moving the magnets slowly along the tube toward the other end until the observer can no longer see the black disc. 4. Slowly move the magnets back until the disc reappears. 5. Read the number on the outside of the tube, from the viewing end of the tube to where the disc was stopped. This is the clarity reading in centimetres (0-100cm). Note: This test will get a range of results as eyesight varies between people. If students are working in pairs or groups, enter their average score on the Stream Health Assessment Worksheet. Equipment needed: 1 Clarity tube (tube in protective cover, cap and 2 magnets) Water clarity is affected by the amount of sediment in the water. Too much sediment reduces the ability of light to penetrate the water to allow aquatic plants to grow. This limits the food supply available to the animals that eat it and in turn affects the rest of the food chain. Sediment overload can also damage the gills of animals and prevent hunters, such as whio/blue ducks or kōura/freshwater crayfish, from seeing their prey. Too much sediment may cover the stream bed making it unsuitable habitat for much aquatic life. 11
12 Aquatic invertebrates Activity 4: Observing aquatic invertebrates Setting up and equipment use To observe the aquatic animals, first you need to catch a sample and place them in a container so they can be easily seen. You will collect the aquatic invertebrates using a kick net. Samples of invertebrates should be taken in riffle habitat (where this is present). Invertebrate communities will differ among riffle, run and pool habitats so if you are testing two streams try to sample from the same habitat types in each stream. 1. Fill four white trays with stream water and place them on the bank. 2. Stand in the stream and hold the kick net so that water is flowing downstream past your feet and into the net. Use your feet (or hands) to move around rocks and clumps of leaves to disturb the invertebrates; they should then flow into the net. Do this a number of times until the net is full. You will have collected sediment, leaves and other vegetation and hopefully a lot of invertebrates. 3. Empty out the net into one of the trays. Put everything in the tray, including rocks, soil and leaves. Carefully transfer any small invertebrates stuck in the net with a spoon or your fingers. 4. Gather another net load from the stream and empty it into the next tray. 5. While the contents of the first tray settle, remove large leaves and rocks from the trays. Check the trays for invertebrates and gently use a plastic spoon to scoop them up and transfer them into a clean tray so they can be seen more easily. This can take some time as they are well camouflaged. If you allow the water to settle, you can see the invertebrates swimming around. 6. You can put leaves and other vegetation in the trays to show how well camouflaged the invertebrates are. Students can use plastic spoons and magnifying glasses to have a closer look at invertebrates. 7. Keep the water temperature in the trays cool. If the water warms up too much, the invertebrates will begin to suffer. Keep the trays cool by placing them in the shade and adding fresh stream water if needed. Equipment needed: Gumboots, 1 kick net, 4 white trays, 5 magnifying glasses, critter identification cards, plastic spoons. Invertebrates are good indicators of stream health. Some aquatic invertebrates (eg, mayflies and cased caddisflies) cannot tolerate pollution whereas others (eg, worms and snails) can survive in quite polluted waters. Because of these differences, the types of invertebrates that are observed at a site tells us about water quality at that site. The presence of invertebrates that are sensitive to pollution indicate good water quality. The Critter Identification Card on page 15 (also included in the stream assessment kit) identifies many of the invertebrates you are likely to find. Each invertebrate has a number from 1 to 4 that indicates how sensitive they are to pollution, with 1 being less sensitive and 4 being most sensitive. For additional information see the Online education resources listed on page 12. Conclusions On completion of their testing and observing, students analyse their results to make a conclusion about the health of the stream. They need to relate their results to provide two main reasons for their conclusion. Prompt students to share their conclusions with their group and discuss whether their hypothesis was correct or not. If stream testing is undertaken at two sites, the differences between the two steams can be compared and discussed. Which results were different? What could have caused those differences? What could be done to improve the less healthy stream? 12
13 Resources for stream health assessment This section contains resources for stream assessment activities and links to online resources. Online education resources Online resources are available that provide supporting information about stream health and monitoring. These are described and linked below. Glossary Take Action for Water is an innovative and exciting environmental education resource for teachers to help primary and intermediate school students (years 5-8) investigate and explore their local environment. You can find this on the Greater Wellington Regional Council website: The Whitebait Connection (WBC) is a non-profit community conservation education programme offering ways in which all New Zealanders can come to understand and be involved in the future health of our local streams, rivers, lakes and wetlands. To find out more: NIWA Freshwater plant, algae, fish and invertebrate identification guides Department of Conservation Landcare Research Freshwater invertebrate identification guide: Te Ara the Encyclopaedia of New Zealand: LAWA Land Air Water Aotearoa LAWA connects you with New Zealand s environment through sharing scientific data: Catchment maps are available from LAWA at An Educator s Guide to Stream Health Assessment Agricultural run-off Biodiversity Catchment Clarity Invertebrate Monitor Nutrient pollution Stream habitat types Pool-riffle-run Scientific method Stormwater pollution Water leaving farmland and going into streams or lakes as a result of rain or irrigation. Run-off may carry sediment, nutrients, pathogens or chemicals from animals, fertilisers and pesticides. The variety of plants and animals (and their genetics) and the ecosystem in which they live. An area of land, bounded by hills or mountains where water flows into streams and rivers and eventually into the sea. The clearness or transparency of water. Clarity is measured by the distance at which an object becomes invisible to the naked eye. An animal, such as an insect or a mollusc, that doesn t have a backbone. To observe and check the progress or quality of something over time. Where too many nutrients, mainly nitrogen and phosphorous, wash into bodies of water. High nutrient levels can reduce the ability of aquatic life to survive. Three main types of stream habitat for aquatic animals. A pool is deeper with slow flowing, or stagnant, water; a riffle has fast moving, churning water; a run is a stretch of smoothly moving water, connecting pools and riffles. A way of solving an identified problem by making a hypothesis and then gathering data and making observations to test that hypothesis. Stormwater pollution includes chemicals and materials from buildings and debris from driveways and roads that gets washed into streams through roadside gutters. 13
14 Stream Health Assessment Worksheet Name of stream: Date:. Location (site name): Student names: Hypothesis (prediction): We think the mauri (life force/health) of the stream, and the life within will be: Excellent / OK / Poor (circle one) because: Walk along the selected stretch of stream and assess which picture below best represents the stream Stream habitat Excellent OK Poor Stream bed Algae Stones Gravel Mud/Sand Pool/riffle/run Thin layers Medium layers Long layers Stream shading Pool, riffles and runs present 2 of the 3 (run/riffle/pool present) Only runs or only pools Bank stability Mostly shaded Some shade No shade Stable banks Some erosion Very unstable 14
15 Human impacts Stormwater drains or pipes Water Quality Water temperature Water clarity Animals in stream Culverts Straightened streams Weirs or barriers Excellent OK Poor Less than 10ºc 10ºc to 20ºc More than 20ºc An Educator s Guide to Stream Health Assessment 70 to 100cm 30 to 70cm 0 to 30cm Aquatic animals Excellent OK Poor Invertebrates Number 4 and 3 animals like caddisflies,mayflies and stoneflies Number 2 animals like beetles and damselflies Mainly worms, snails and flies Conclusion: We think the water quality and habitat for animal in this stream is: Excellent / OK / Poor (circle one) because of the following reasons:


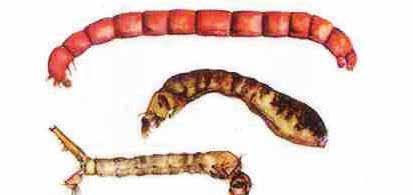
16 Critter Identification Card Mayflies Large Stoneflies Small Stoneflies Uncased Caddis Cased Caddis Purse Caddis Dobsonfly Beetles Damselflies Dragonflies Amphipods Snails Water Boatmen Worms Flies Illustrations: Karen Mason Numbers 1-4 indicate the sensitivity of each invertebrate to pollution with 1 being the least sensitve and 4 the most sensitive. 16
17 Algae Identification Card An Educator s Guide to Stream Health Assessment Thin mat or film (less than 0.5mm thick). Excellent stream health. Medium film or mat (0.5 to 3mm thick). Not so good stream health. Long filaments (more than 2cm long) or thick mat. Poor stream health. Photos: NIWA 17
18 The Greater Wellington Regional Council s purpose is to enrich life in the Wellington Region by building resilient, connected and prosperous communities, protecting and enhancing our natural assets, and inspiring pride in what makes us unique For more information contact the Greater Wellington Regional Council: Wellington office PO Box Manners Street Wellington Upper Hutt office PO Box Upper Hutt Masterton office PO Box 41 Masterton Follow the Wellington Regional Council info@gw.govt.nz January 2016 GW/BD-G-15/116
BACKGROUND: The following is adapted from the Watershed Cruzin Guide:
 GOALS: To introduce students to the Watsonville Wetlands water system To help students identify sources of water pollution and learn how they can avoid polluting the environment To discuss the importance
Aquatic Species Diversity and Water Quality
 Aquatic Species Diversity and Water Quality Reference: Wagner & Sanford. Environmental Science. Wiley & Sons, 2005 Introduction: Freshwater is only a small part of the Earth s supply of water, yet it is
Microhabitats #1: Quantitative Study of Microhabitats
 Microhabitats #1: Quantitative Study of Microhabitats Adapted from: Microhabitats in Environmental Science Activities Kit by Michael Roa. The Center for Applied Research in Education, 1993. Microhabitats
Mangere Catchment Group Mangere River stream health investigation Field Trip
 Mangere Catchment Group Mangere River stream health investigation Field Trip Collated and narrated by Kim Jones Whitebait Connection. Photos by Susan Karels from NRC - Enviroschools We gathered around
Water Quality Testing
 Field Experience Water Quality Testing How s the Water? Overview Students will use chemical tests to determine the water quality of a local pond. Teacher Background: Water Quality In 1972 the Clean Water
itself is a stream disturbance and too heavy a monitoring cycle can negatively impact macroinvertebrate populations.
 Virginia Save Our Streams Eastern Biomonitoring Method for Muddy Bottom Streams Stream Quality Survey Instructions Standard Operating Procedures for Macroinvertebrate Population Surveys Background The
Macroinvertebrates What Wetland Bugs Can Teach Us
 Photo Credit: Sue Mortson Macroinvertebrates What Wetland Bugs Can Teach Us Learning Environment: Outdoor Classroom: wetland near school Prep Time: 15 min Length of Lesson: 1.5 hours Key Vocabulary: macroinvertebrates,
Macro Invertebrates STUDENT LEARNING OBJECTIVES
 First Green is an innovative environmental and STEM education outreach program using golf courses as environmental learning labs. Macro Invertebrates Water is essential to all life. Water is a place to
How Sensitive Are They?
 Pollution Tolerance Levels How Sensitive Are They? Adapted from: An original Creek Connections activity. Creek Connections, Box 10, Allegheny College, Meadville, Pennsylvania 16335. Grade Level: intermediate
Macro Invertebrates. Student Learning Objectives
 Macro Invertebrates Water is essential to all life. Water is a place to explore and understand the aquatic habitats that water supports. The aquatic environment may be in lakes, ponds, streams and wetlands.
My Stream s Temperatures
 My Stream s Temperatures Temperature Adapted from: An original Creek Connections activity. Creek Connections, Box 10, Allegheny College, Meadville, Pennsylvania 16335. Grade Level: basic, all Duration:
Missing Macroinvertebrates. Missing Macroinvertebrates
 Purpose: To make inferences about the quality and/or quantity of freshwater using macroinvertebrate data collected from local water systems. To explain the factors that contribute to the extinction of
Water Wonders. Purpose. Materials. Overview. Student Outcomes. Time. Level. Part 1: Part 2: Part 3 (optional):
:") Purpose To introduce students to hydrology and the study of macroinvertebrates. To understand how macroinvertebrates help scientists understand water quality. Overview Students will be introduced to different
Purpose To introduce students to hydrology and the study of macroinvertebrates. To understand how macroinvertebrates help scientists understand water quality. Overview Students will be introduced to different
Benthic Macroinvertebrates (BMI) Identification
 Identification") Benthic Macroinvertebrates (BMI) Identification In this activity students will identify benthic macroinvertebrates collected from a stream. Benthic macroinvertebrates are stream-dwelling invertebrates
Benthic Macroinvertebrates (BMI) Identification In this activity students will identify benthic macroinvertebrates collected from a stream. Benthic macroinvertebrates are stream-dwelling invertebrates
BIOASSESSMENT OF STREAMS
 OBJECTIVES The student will do the following: 1. Work as a team to gather organisms from a stream to evaluate if the water quality is excellent, good, or fair to poor. BACKGROUND INFORMATION The quality
DATA COLLECTION AND MANAGEMENT
 ADOPT-A-RIVER INITIATIVE, Training of Trainers Workshop, National Museums of Kenya, 7 th July 2015. DATA COLLECTION AND MANAGEMENT Bonface Nduma, Vice President, WSCSD - Kenya o This is a simplified version
Science Enhanced Scope and Sequence Grade 6. Water Quality
 Water Quality Strand Topic Living Systems Investigating water quality Primary SOL 6.7 The student will investigate and understand the natural processes and human interactions that affect watershed systems.
Mock Stream Habitat Assessment: Bringing the outside in!
 Mock Stream Habitat Assessment: Bringing the outside in! Objectives: At the end of this activity, youth should be able to: Assess the overall health of a stream habitat Apply the terms abiotic and biotic
Macroinvertebrate Investigation
 Macroinvertebrate Investigation PURPOSE: To introduce students to living aquatic macroinvertebrates in a field setting. SUMMARY: Students will collect live macroinvertebrates from a river or stream. They
Benthic Macroinvertebrates (BMI): Identification. The Activity
: Identification. The Activity") Benthic Macroinvertebrates (BMI): Identification In this activity students will identify benthic macroinvertebrates collected from a stream. Benthic macroinvertebrates are stream-dwelling invertebrates
Benthic Macroinvertebrates (BMI): Identification In this activity students will identify benthic macroinvertebrates collected from a stream. Benthic macroinvertebrates are stream-dwelling invertebrates
Name. Your Handbook and Journal of. Lake name. Lake Water Quality
 Your Handbook and Journal of Name Lake name Lake Water Quality Table of Contents Page # Section 1 Why do we care about clean water?... 4 How do lakes work?... 5 Section 2 How do we measure the health of
Wetland versus Stream Macroinvertebrates
 Wetland versus Stream Macroinvertebrates Purpose: Summary: To investigate various biomes through observation and comparison of the diversity of life, in particular, the specific number of species, biomass,
Reading the River Water A Unit for 3 rd Grade. Lisa Handlon Taylor Mill Elementary Kenton County
 Reading the River 2004 Water A Unit for 3 rd Grade Lisa Handlon Taylor Mill Elementary Kenton County Grade Level: 3 rd Objectives In this lesson, students will: 1) identify aquatic organisms 2) assess
Wetland versus Stream Macroinvertebrates
 Wetland versus Stream Macroinvertebrates Purpose: Summary: Background: To investigate various biomes through observation and comparison of the diversity of life, in particular, the specific number of species,
Stream Observation Data Sheet School: Charleroi Middle School Date 9/24/15 Stream Study Site: Maple Creek. Macroinvertebrate Survey
 Stream Observation Data Sheet School: Charleroi Middle School Date 9/2/15 Stream Study Site: Maple Creek Teacher: Mr. Johnson Latitude_210 7 degrees NORTH Yesterday Group Members: Period 7 th Longitude_79
Stream Observation Data Sheet School CMS Date 12/16/2015 Stream Study Site Mingo Creek. Macroinvertebrate Survey
 Stream Observation Data Sheet School CMS Date 2/6/205 Stream Study Site Mingo Creek Teacher Johnson Group Members: Latitude degrees NORTH Yesterday Longitude degrees WEST Weather Today Air Temperature
AquaScience. Using aquatic organisms for pollution monitoring TEACHER S MANUAL
 AquaScience Using aquatic organisms for pollution monitoring TEACHER S MANUAL 1 Introduction Of the world s water 97.75% is seawater and 2.24% in glaciers; therefore the freshwater that we rely on for
Life on the James Judging Water Quality Based on Macroinvertebrates
 Life on the James Judging Water Quality Based on Macroinvertebrates About this Lesson This lesson is an excellent introduction to the concept of pollution and how it affects macroinvertebrates and therefore
Watershed Investigations: How to Assess the Health of a Stream
 Watershed Investigations: How to Assess the Health of a Stream By Joan Chadde, Western UP Center for Science, Mathematics & Environmental Education. All photos by author, unless otherwise noted. Why Monitor
Lesson 2-2: Riparian Zones
 2-14 Lesson 2-2: Riparian Zones Time of Lesson: 1 hour Rationale: The purpose of this lesson is to define what a riparian zone is and link its importance for fish and other animals, and humans, and the
Benthic Macroinvertebrate Monitoring
 Benthic Macroinvertebrate Monitoring "In the end, we will conserve only what we love, we will love only what we understand, we will understand only what we are taught." - Bada Dioum, Senegalese conservationist
Reading the River 2006 Water Study Sixth Grade Science Mindy Fry Kenton County
 Reading the River 2006 Water Study Sixth Grade Science Mindy Fry Kenton County Curriculum Plan Lesson Context: To kick off this unit of study, I will have Jamie Egglemeyer from Sanitation District No.
Water Quality and Macroinvertebrates By Teresa Matteson and Heath Keirstead Benton Soil & Water Conservation District
 Water Quality and Macroinvertebrates By Teresa Matteson and Heath Keirstead Benton Soil & Water Conservation District Learning Objectives: Identify aquatic macroinvertebrate pictures Relate insect species/group
AquaScience. Using aquatic organisms for pollution monitoring TEACHER S MANUAL
 AquaScience Using aquatic organisms for pollution monitoring TEACHER S MANUAL 1 Introduction Of the worlds water 97.75% is seawater and 2.24% in glaciers, therefore the freshwater that we rely on for drinking
Multi-plate Sampling
 Multi-plate Sampling Sampling method multi-plate sampler Adapted from: Field Manual for Water Quality Monitoring, Aquatic Entomology, and State of Ohio Environmental Protection Agency: Biological Criteria
Surveying Invertebrates to Determine Water Quality in Rivers and Canals. Duke of Edinburgh s Award Expedition Aim
 Surveying Invertebrates to Determine Water Quality in Rivers and Canals Duke of Edinburgh s Award Expedition Aim Copyright The Green Blue 2016 Duke of Edinburgh s Award Expedition Aim Surveying Invertebrates
Surveying Invertebrates to Determine Water Quality in Rivers and Canals. Duke of Edinburgh s Award Expedition Aim for Inland Waters
 Surveying Invertebrates to Determine Water Quality in Rivers and Canals Duke of Edinburgh s Award Expedition Aim for Inland Waters Duke of Edinburgh s Award Expedition Aim for Inland Waters Surveying Invertebrates
Turbidity and Sediment. The Activity
 Turbidity and Sediment Turbidity- an indication the presence of dirt and other particulate matter in water- is an important variable in the health of a stream. The biggest contributor to turbidity is erosion.
Executive summary. Introduction. Summary of top findings
 Executive summary Introduction Fresh water supports almost every aspect of life. We use fresh water to drink, enjoy it for recreation, and use it to produce goods and services. Māori tribal identity is
A Claytor Nature Center Stream Monitoring Experience
 A Claytor Nature Center Stream Monitoring Experience Conduct field investigations in which distinctions are made among observations, hypotheses, results and conclusions Perform a visual habitat assessment
River of Ashe County, NC
 Running Head: Annual Variations in Mayfly Populations and Relations to Water Quality Annual Variations in Mayfly Populations and Relations to Water Quality in the New River of Ashe County, NC Benjamin
FIELD RECORD LIVE-STREAM YOUR RIVER. Education and Water Monitoring Action Group ( G3E), 2012
, 2012") FIELD RECORD LIVE-STREAM YOUR RIVER Name Observation Date PRODUCTION Education and Water Monitoring Action Group (G3E) Coordination Éric Gagnon and Nathalie Piedboeuf Research and texts Éric Gagnon and
FIELD RECORD LIVE-STREAM YOUR RIVER Name Observation Date PRODUCTION Education and Water Monitoring Action Group (G3E) Coordination Éric Gagnon and Nathalie Piedboeuf Research and texts Éric Gagnon and
Geography Stage 4. Lesson plan Murky Waters
 Lesson plan Murky Waters Objective To understand water turbidity, what causes water to become turbid, impacts on ecosystems and water filtration, and ways to protect waterways Lesson schedule - Introductory
WATERSHED. Maitland Valley. Report Card 201
 Maitland Valley WATERSHED Report Card 201 The Maitland Valley Conservation Authority has prepared this report card as a summary on the state of our forests, wetlands, surface water, and ground water resources.
Riparian Ecology Station OBJECTIVES
 Riparian Ecology Station OBJECTIVES Students learn The basic definition of a riparian area. The condition of any riparian area greatly affects the water quality and aquatic habitat of the water body it
Land Use Activities Potential Pollution Problems. Land Disposal septic system bacteria, nitrate, phosphate
 If Bugs Could Talk PURPOSE: To describe and identify the link between land use activities within a watershed and water quality. Students will also understand the link between aquatic macroinvertebrates
Lesson Title: Habitat for Stream Insects: What Kind of Substrate is the Best Habitat for Aquatic Insects?
 Lesson Title: Habitat for Stream Insects: What Kind of Substrate is the Best Habitat for Aquatic Insects? NSF GK-12 Fellow: Tommy Detmer (Boulder, CO) Grade Level: Middle School Type of Lesson: Life Science
Pollution Tolerance Index Bag of Bugs
 Pollution Tolerance Index Bag of Bugs Adapted from: An original Creek Connections activity. Creek Connections, Box 10, Allegheny College, Meadville, Pennsylvania 16335. Aquatic Macroinvertebrates - Pollution
Water Quality indicators and How Human Activities Affect Water Quality
 Water Quality indicators and How Human Activities Affect Water Quality Name: Online Assignment: Period: Date: Purpose: to learn how to evaluate water quality and how pollution can make water unavailable
Lesson Title: Habitat for Stream Insects: What Kind of Substrate is the Best Habitat for Aquatic Insects?
 Lesson Title: Habitat for Stream Insects: What Kind of Substrate is the Best Habitat for Aquatic Insects? NSF GK-12 Fellow: Tommy Detmer (Boulder, CO) Grade Level: 5th Type of Lesson: STEM Objectives:
What is it? Why is it important? What impacts it?
 Supplement C: Water Quality Information Sheet Water Quality Information SheetMeasure Water Temperature What is it? Why is it important? What impacts it? The level of heat in the degrees Fahrenheit ( F).
Study of a Freshwater Stream Ecosystem
 Practical Related Task - Ecology Field Work Instructional Approach Study of a Fresh Ecosystem Name: Group: Date: Aims: After the course, students should be able to: 1. Classify and identify organisms commonly
Appendix D: Visual aids and handouts for graphing lessons
 Appendix D: Visual aids and handouts for graphing lessons Macroinvertebrate Graphing Activity Amount Stonefly Caddisfly Beetle Cranefly Midge Leech 41 Water Pollution Graphing Activity Amount Sediment
City of Texarkana, Arkansas. Storm Water Pollution
 City of Texarkana, Arkansas Storm Water Pollution STORM WATER GUIDE What is Storm Water Pollution? Stormwater can provide a toxic discharge which can enter into a lake, river or coastal water system. As
POND MUCKING Environmental Education Lesson Plan Edwards Camp and Conference Center
 POND MUCKING Environmental Education Lesson Plan Edwards Camp and Conference Center Summary Using the boat bay as an example of a pond, the students will compare it to Lake Beulah to learn the differences
Lesson 4: Biodiversity in a Leaf Pack
 SMILE Program Winter Teachers Workshop 2015 Lesson 4: Biodiversity in a Leaf Pack Lesson Summary: Students will make artificial leaf packs to create a model habitat for freshwater macroinvertebrates. Students
Water Quality: The Basics
 Water Quality: The Basics Environmental Science Why is Water Quality Important? Effects all humans Safe drinking water Allows for food productions and SAFE food products Effects Wildlife Health domestic
Otonabee Region WATERSHED
 Otonabee Region WATERSHED Report Card 2018 Otonabee Conservation has prepared this report card as a summary of the state of your forests, wetlands, and water resources using data from 2012 to 2016. WHERE
Community Water Quality Monitoring Biomonitoring Approach Using Macroinvertebrates. Training Guide
 Community Water Quality Monitoring Biomonitoring Approach Using Macroinvertebrates Training Guide Please see The Asia Foundation s website (https://asiafoundation.org/where-we-work/laos/) for copies of
Photo tour of the monitoring activities found in the Stream Side Science manual
 Photo tour of the monitoring activities found in the Stream Side Science manual This slide show will walk you through the following tests: ph Dissolved Oxygen Temperature Turbidity Nitrates Macroinvertebrates
THE WATERSHED The watershed is an area of land that drains into a stream. This includes both the surface runoff and groundwater. Because a stream is m
 Understanding Streams A stream is the product of its watershed. Good land use in the watershed will be reflected in the stream. MOST PEOPLE enjoy the captivating qualities of flowing water. But streams
Transparency A Water Clarity Measure
 Volunteer Monitoring Factsheet Series 2010 Transparency A Water Clarity Measure Why are we concerned? Water clarity is one of the most obvious measures of water quality. Water clarity can be a useful indicator
Application for resource consent Form B Damming and diversion of water
 Application for resource consent Form B Damming and diversion of water Notes Resource use activities must meet all the conditions of any relevant Permitted Activity Rules in the Waikato Regional Plan or
VIDEO: Riparian Forest Buffers: The Link Between Land & Water
 VIDEO: Riparian Forest Buffers: The Link Between Land & Water Introduction to Riparian Buffers Adapted from: Riparian Forest Buffers: The Link Between Land & Water. Maryland Cooperative Extension. Wye
FORM B: DAMMING AND DIVERSION OF WATER
 APPLICATION FOR RESOURCE CONSENT FORM B: DAMMING AND DIVERSION OF WATER NOTES Resource use activities must meet all the conditions of any relevant Permitted Activity Rules in the Waikato Regional Plan
Captured Critters. Lesson Abstract
 Captured Critters Lesson Abstract Summary: GLE: Subject Areas: Students learn some of the common benthic aquatic macroinvertebrates used as water quality indicators and determine how long-term monitoring
Applicable TEKS. Procedure. Duration. Objectives. Prerequisites. Materials. Temperature Station. ph Station
 L E S S O N LESSON 7 Survey: Physical Properties Applicable TEKS Grade 4 4.1 A 4.2 A, B, D, E, F 4.3 A 4.4 A, B Grade 4 4.1 A, C 4.8 C Duration Two 40-minute lessons Grade 5 5.1 A 5.2 A, C, D, E, F 5.3
INVESTIGATING YOUR STREAM S DRAINAGE BASIN
 IT S OUR WATER INVESTIGATING YOUR STREAM S STREAM ACTIVITY SUMMARY Using maps, students will determine land uses in the drainage basin of their stream and calculate the approximate percentage of impervious
STREAM EROSION. The Activity
 1 STREAM EROSION Erosion is an ongoing process on all bodies of water, especially moving water. Both natural and humancaused factors affect the amount of erosion a stream may experience. Natural factors
FIELD RECORD LIVE-STREAM YOUR RIVER. Name. Observation Date
 FIELD RECORD LIVE-STREAM YOUR RIVER Name Observation Date PRODUCTION Education and Water Monitoring Action Group (G3E) Coordination Éric Gagnon and Nathalie Piedboeuf Research and texts Éric Gagnon and
Maitland Valley WATERSHED
 Maitland Valley WATERSHED Report Card 2018 Maitland Conservation has prepared this report card as a summary of the state of your forests, wetlands, and water resources. WHERE ARE WE? We are one of 36 Conservation
Properties of Water. Their shapes change when they are in different containers. Their volumes stay the same in any container.
 Name: Date: 1. Which statement correctly describes both gases and liquids? Their shapes stay the same in any container. Their shapes change when they are in different containers. Their volumes stay the
When it Rains it Pours
 Lesson Summary: Students will understand how water is absorbed into the ground. They will also be able to explain the difference between pervious and impervious surfaces. Students will also learn about
ACTIVITY ONE: WATER QUALITY IN OUR RIVERS
 ACTIVITY ONE: WATER QUALITY IN OUR RIVERS This LIFE SCIENCES lesson looks at visible animal life to determine the health of our rivers and streams. minisass is a simplified form of the South African Scoring
Aquatic Macro invertebrates Lesson Plan
 Aquatic Macro invertebrates Lesson Plan NGSS Standards: MSESS3-3. Apply scientific principles to design a method for monitoring and minimizing human impact on the environment. 3-LS4-3. Construct an argument
Shower Curtain Watershed
 Topic Watersheds Shower Curtain Watershed Grades 3-5 Sites Outdoors, Indoors Duration 30 minutes Materials Watershed pictures Labels or index cards Clear plastic shower curtain Spray bottles with water
Biodiversity Debate. To evaluate the biological, aesthetic, ethical, social and economic arguments with regard to maintaining biodiversity.
 Purpose: Summary: To evaluate the biological, aesthetic, ethical, social and economic arguments with regard to maintaining biodiversity. In this exercise, students will hold a debate about the construction
Starting Your Own Water Monitoring Program
 Starting Your Own Water Monitoring Program By initiating your own citizen-based watershed group, you can serve your community by leading and taking part in activities to protect and restore your local
Environmental Literacy Question: How have humans affected the Chesapeake Bay and its watershed?
 Lesson: Land s Wonders and Worries: Pollution Solution Environmental Literacy Question: How have humans affected the Chesapeake Bay and its watershed? Topic/ Essential Question: What characteristics of
MANAGING STORMWATER. What you and your business need to know. Anything but rainwater down our stormwater drains pollutes our rivers and streams
 MANAGING STORMWATER What you and your business need to know Anything but rainwater down our stormwater drains pollutes our rivers and streams MANAGING STORMWATER Did you know that Nelson City Council s
Missouri Streams. Fact Sheet. What factors affect stream habitat? Stream Habitat Affects Aquatic Communities
 Missouri Streams Fact Sheet Written by Del Lobb & Suzanne Femmer Edited by Sarah Wolken When most people think of habitat, they usually picture places where fish or wildlife live, like a hollow log or
Shower Curtain Watershed
 Shower Curtain Watershed Overview: What is a watershed and how do humans affect its health? What is a watershed? How do our actions affect the health of a watershed? Students explore these questions by
Is There AMD In This Stream?
 Is There AMD In This Stream? Adapted from: Is There Mine Drainage Impacting This Stream? in AMD Biology Module. St. Vincent College Environmental Education Center, 2002. Abandoned Mine Drainage Grade Level:
Contractors, Illicit Discharges, & Best Management Practices. Chris Allen Stormwater Inspector
 Contractors, Illicit Discharges, & Best Management Practices Chris Allen Stormwater Inspector What is an Illicit Discharge? Georgetown County Stormwater Ordinance defines an Illicit Discharge as: Any activity
Macroinvertebrate Mayhem
 Aquatic Macroinvertebrates Pollution Effects On Macroinvertebrate Mayhem Adapted from: Macroinvertebrate Mayhem in Project WET: Curriculum & Activity Guide. Bozeman: The Watercourse and the Council for
2017 Agricultural Water Quality Workshop
 2017 Agricultural Water Quality Workshop Focus Area Lower Lewis and Clark Clatsop SWCD has identified this area as one that needs much improvement This does not mean we can t do projects in other areas
Freshwater Ecosystems
 Freshwater Ecosystems The types of organisms in an aquatic ecosystem are mainly determined by the water s salinity. As a result, aquatic ecosystems are divided into freshwater and marine ecosystems. Freshwater
Is There AMD In This Stream?
 Is There AMD In This Stream? Adapted from: Is There Mine Drainage Impacting This Stream? in AMD Biology Module. St. Vincent College Environmental Education Center, 2002. Abandoned Mine Drainage Grade Level:
INTERMEDIATE BMI ASSESSMENT TIER 2 FIELD SHEET
 INTERMEDIATE BMI ASSESSMENT TIER 2 FIELD SHEET PHYSICAL PARAMETERS ASSESSMENT FIELD SHEET ALL TIERS NAME: DATE: TIME: STREAM OR RIVER NAME: WATERSHED NAME: TOWN: WEATHER PRESENT PAST 48 HOURS SITE DESCRIPTION
CHAPTER 15 WATER POLLUTION. INTO THE GULF Researchers try to pin down what s choking the Gulf of Mexico
 CHAPTER 15 WATER POLLUTION INTO THE GULF Researchers try to pin down what s choking the Gulf of Mexico SAVING THE BAY Teams of researchers try to pin down what s choking the Chesapeake Water pollution
The Importance of Riparian Forests
 The Importance of Riparian Forests By Jean Llewellyn Monroe County is the second fastest growing county in Pennsylvania. This rapid growth can be problematic because uncontrolled and unregulated growth
Using the Seine Net. Step 1. Two students carefully unroll the seine net so the weighted side is in contact with the river bottom.
 Supplement A: Using the Seine Net Step 1. Two students carefully unroll the seine net so the weighted side is in contact with the river bottom. Step 2. Students walk out to hip-deep water, bumping poles
Riffle Beetles to Riparian Buffers
 We care about WateR. it S What We do. Riffle Beetles to Riparian Buffers Exploring Methods of Assessing Surface Water Quality Grade level: 7-12 objective: Students will evaluate the quality of two water
Advanced Water Quality Monitoring and Analysis Life Science: Grades 7-12
 Advanced Water Quality Monitoring and Analysis Life : Grades 7-12 Enduring Understandings 1. Understand and be able to list and describe important water quality factors (temperature, transparency, ph,
Students and a parent from Rimu School identifying freshwater invertebrates caught in the Waihopai River.
 EnviroTEACH An environmental education resource for teachers Term 4 2017 Inside this issue Page 2: Southland s water quality is a mixed bag Page 3: Otatara School students step up as water experts Page
Key Vocabulary: Aquatic life, pollution, wildlife, waterway, biotic assessment, ph, conservation
 Adopt a Water Friend Subjects: Science, Social Studies, Language Arts, Health Process Skills: Identifying plants and animals, classifying, collecting and analyzing data, recording observations, taking
Youth make a solution of food coloring with a concentration of one part per million and discuss clean water standards.
 One in a Million Overview: Youth make a solution of food coloring with a concentration of one part per million and discuss clean water standards. Substances dissolved in water can be present in very tiny
Water Chemistry Monitoring
 Chicago River Fieldtrip Activity Summary Students use basic to advanced water quality monitoring kits and probes to assess the water quality of the Chicago River. Water chemistry kits available for loan
Croudace Bay Wetlands Education Kit
 Croudace Bay Wetlands Education Kit Developed by The Wetlands Environmental Education Centre for Lake Macquarie City Council Contents PART A Background Information Page 3 A1 - Introduction Page 4 A2 -