2017 World LNG Report
|
|
|
- Arnold Davidson
- 5 years ago
- Views:
Transcription
1 2017 World LNG Report Sponsored by

2
3 Table of Contents Message from the President of the International Gas Union 3 2. State of the LNG Industry 4 3. LNG Trade Overview LNG Exports by Country LNG Imports by Country LNG Interregional Trade Spot, Medium and Long-Term Trade LNG Pricing Overview Liquefaction Plants Overview Global Liquefaction Capacity and Utilisation Liquefaction Capacity by Country Liquefaction Processes Floating Liquefaction Project Capital Expenditures (CAPEX) Risks to Project Development Update on New Liquefaction Plays LNG Carriers Overview Vessel Characteristics Charter Market Fleet Voyages and Vessel Utilisation Fleet and Newbuild Orders Vessel Costs and Delivery Schedule Near-Term Shipping Developments 44 1
4 6. LNG Receiving Terminals Overview Receiving Terminal Capacity and Utilisation Globally Receiving Terminal Capacity and Utilisation by Country Receiving Terminal LNG Storage Capacity Receiving Terminal Berthing Capacity Receiving Terminals with Reloading and Transshipment Capabilities Comparison of Floating and Onshore Regasification Project CAPEX Risks to Project Development The LNG Industry in Years Ahead References Used in the 2017 Edition Data Collection Definitions Regions and Basins Acronyms Units Conversion Factors 64 Appendix 1: Table of Global Liquefaction Plants 65 Appendix 2: Table of Liquefaction Plants Under Construction 68 Appendix 3: Proposed Liquefaction Plants by Region 69 Appendix 4: Table of Regasification Terminals 73 Appendix 5: Table of Regasification Terminals Under Construction 77 Appendix 6: Table of Active LNG Fleet 78 Appendix 7: Table of LNG Vessel Orderbook 89 Appendix 8: Table of FSRU, Laid-Up, Converted FSU & FLNG 93 2

5 Message from the President of the International Gas Union Dear colleagues: Liquefied natural gas (LNG) experienced a dynamic 2016, with global trade reaching a record 258 million tonnes (MT), an increase of 13 MT over Supply ramped up at projects spanning the globe, from the United States to Australia, and LNG found new markets in a diverse array of countries. At the same time, delays and plant outages kept supply growth subdued. LNG prices remained below the cost of new supply as demand grows to reach balance. As the advantages of natural gas in the global energy mix become increasingly apparent to governments, businesses and consumers around the world, 2016 saw some encouraging trends in LNG. The much awaited tranche of US LNG production began with Sabine Pass Trains 1&2 entering commercial operation. Ramp-up in Australia continued as well, with Gorgon LNG Trains 1&2 and Australia Pacific LNG starting commercial operation, coupled with new train additions at Gladstone LNG and Queensland Curtis LNG. Keen interest in LNG was also evidenced by more than 879 MTPA of proposed project development, concentrated in North America, East Africa and Asia Pacific. On the demand side, LNG continued to find new markets as a fuel of choice for existing grids that have limited indigenous production, such as Egypt and Pakistan, with combined growth of 6 MT. New niche markets have also developed that prefer clean, flexible fuel for power generation, such as Jamaica and Malta. China s LNG consumption increased dramatically, by nearly 35%, to around 27 MTPA. At the same time, however, the two largest markets Japan and South Korea are showing signs of satiation, as nuclear, coal and renewables find their balance in the power mix. With a rebound in hydro-power reservoir levels, Brazilian demand for LNG was down 80% (4 MT), demonstrating the flexible value of LNG. As LNG prices continue in a competitive range, opportunities for demand growth in 2017 abound globally. Supply ramped up at projects spanning the globe, from the United States to Australia, and LNG found new markets in a diverse array of countries. Trends in floating storage regasification units (FRSUs) and LNG bunkering are shaping the LNG industry. FRSU new-builds and conversions are expanding access for emerging LNG markets and will continue to help absorb supply. LNG is increasingly seen as a vital bunkering fuel for maritime transport as well. Last year, for example, the Port of Rotterdam installed its third LNG fueling berth, as the benefits of switching to natural gas become increasingly apparent. Switching to LNG in the port can reduce NOx emissions by up to 90% and SOx and particulate emissions by up to 100%. These trends must all be seen in a wider context. It is not an exaggeration to say that the increased uptake of natural gas has direct and positive impacts on the environment and on human health around the world. In a post-cop 21 world, gas must become an increasingly vital part of the future energy mix. IGU continues to advocate vigorously for the benefits of natural gas, and the LNG industry plays a key role in expanding access to gas across the globe. The World LNG Report, a flagship publication of IGU first published in 2010 and now published annually, provides key insights into the LNG industry. It remains a standard desk reference on the LNG industry around the world. Yours sincerely, David Carroll President of the International Gas Union 3
 from 2015, when a previous record of 244.8 MT was set over the 2014 trade volume of 241.1 MT. The growth rate in 2016 was a noticeable increase from the average growth of 0.")
6 Tokyo 2. State of the LNG Industry MT Global trade in 2016 Global Trade:For the third consecutive year, global LNG trade set a new record, reaching 258 million tonnes (MT). This marks an increase of 13.1 MT (+5%) from 2015, when a previous record of MT was set over the 2014 trade volume of MT. The growth rate in 2016 was a noticeable increase from the average growth of 0.5% over the last four years, when there were not very many new supply additions. The continued addition of supply in the Pacific Basin, primarily in Australia, as well as the start of exports from the United States Gulf of Mexico (US GOM) enabled this increase. Demand growth was most pronounced in Asia; China, India, and Pakistan added a combined 13.0 MT in incremental LNG demand. Inter-basin LNG trade flows have declined, particularly as Pacific Basin supplies continued to catch up with high demand in that region. 72 MT Non long-term trade, 2016 Short and Medium-term LNG Market: Short and medium-term LNG trade reached 72.3 MT in 2016 (+0.4 MT YOY) and accounted for 28% of total trade. Historically, short and medium-term trade grew in 2011, owing to shocks that include the Fukushima crisis, which called on emergency cargos to help fill the power generation gap; and the growth of shale gas in the United States, which facilitated excess cargos no longer needed in a flush market. Both events added a need for commercial innovation and flexibility. However, the share of LNG traded without a longterm contract as a percentage of the global market has tapered off since Short and medium-term trade, as a share of total traded LNG, fell by 4%. Several emerging markets like Pakistan and Malaysia, seeking firm supply, began importing LNG under new long-term contracts in Other markets that typically rely heavily on spot and short-term volumes experienced a significant decline in demand. In the case of Brazil it was due to improved hydro-power availability. Further, the majority of new liquefaction projects that started operations in 2015 and 2016 in the Asia-Pacific region are supported by long-term contracts that are coming into force. $5.52/MMBtu Average Northeast Asian spot price, 2016 Global Prices: Asian and spot LNG prices fell steadily in the first half of 2016 as supply overwhelmed demand, settling at $4.05 per million British thermal units (MMBtu) in May. A reversal occurred in the second half of the year, with supply disruptions and cold winter temperatures driving spot prices to $9.95/MMBtu by February With cold weather and storage constraints at Rough, the United Kingdom National Balancing Point (NBP) also ended the year on an upswing at $5.44/MMBtu. The oil price continued to decline in the first half of the year resulting in low oil-indexed contract prices. As prices fell around the world, the market moved closer to price convergence; the differential between NBP and Northeast Asian spot prices narrowed to an average $0.91/MMBtu in Notably, the differential was negative for several months for the first time in six years. In May and June 2016, the Asian spot price was ~$0.40/MMBtu lower than NBP. 1 The scope of this report is limited only to international LNG trade, excluding small-scale projects, unless explicitly stated. Small-scale projects are defined as anything less than 0.5 MTPA for liquefaction, 1.0 MTPA for regasification, and 60,000 cm for LNG vessels. Domestic movements of LNG are also not included. 4
7 340 MTPA Global nominal liquefaction capacity, January 2017 Liquefaction plants: Global liquefaction capacity grew at a similar rate in 2016 as in 2015, adding 35 MTPA of capacity between end-2015 and January 2017 to reach MTPA. This includes new projects such as Gorgon LNG, Australia Pacific LNG and Sabine Pass LNG, as well as additional trains at Gladstone LNG (GLNG), Queensland Curtis LNG (QCLNG), and Malaysia LNG (MLNG). Liquefaction capacity additions are poised to increase over the next few years as MTPA of capacity was underconstruction as of January Two projects entered the construction phase of development in 2016: a brownfield expansion of Tangguh LNG (3.8 MTPA) as well as an additional US project, Elba Island LNG (2.5 MTPA). 879 MTPA Proposed liquefaction capacity, January 2017 New Liquefaction Proposals: Given abundant gas discoveries globally and the shale revolution in the US, proposed liquefaction capacity reached 890 million tonnes per annum (MTPA) by January This figure fell slightly to 879 MTPA at end-january 2017 in an attempt at rationalization with market demand. More of these projects will not go forward as demand remains far below this ambitious target; particularly as ample pipeline supply - by Russia and Norway to Europe, and the US to Mexico - reduce the need for LNG in those markets. Additionally, Egypt will experience a drastic reduction in LNG demand as the Zohr field comes on-line and preferentially supplies the domestic market. In fact, there is potential for Egypt to again be a significant LNG exporter. The areas with the largest proposed volumes include the US GOM, Canada, East Africa, and Asia-Pacific brownfield expansions. 795 MTPA Global nominal regasification capacity, January 2017 Regasification Terminals: Global regasification capacity increased to MTPA by the end of 2016 and MTPA by the end of January 2017, primarily supported by additional capacity coming online in established markets such as China, Japan, France, India, Turkey, and South Korea. This stands in contrast with 2015, when capacity was driven by floating regasification projects in emerging markets: Egypt, Jordan, and Pakistan. The expansion of new markets slowed in 2016, as capacity was only added in Jamaica - both Colombia and Malta received their initial LNG cargoes in An additional 90.4 MTPA of capacity were under construction as of January A combined eleven projects are under construction in China and India, countries that displayed the strongest LNG demand growth in New entrants are also set to complete regasification projects in the coming years, including the Philippines, Bahrain, and Russia (Kaliningrad). 83 MTPA 2 FSRU capacity, January 2017 Floating Regasification: Two floating storage and regasification units (FSRUs) located in the United Arab Emirates (Abu Dhabi 3.8 MTPA) and Turkey (5.3 MTPA) reached commercial operations by January 2017, boosting global FSRU capacity to 83.0 MTPA. Floating regasification infrastructure was also added in Colombia (FSRU) and Malta (a floating storage unit) but neither had begun commercial operations by January This builds on the fast growth in 2015, when 17.5 MTPA of capacity was added across Egypt, Jordan, and Pakistan. Although an FSRU arrived in Ghana during 2016, land-based infrastructure has been the critical path to start-up. Looking forward, several FSRU projects are in advanced stages for Uruguay, Chile, Puerto Rico, and Russia. Turkey s first offshore regasification terminal was able to come online in under one year of construction, demonstrating the speed with which new projects utilizing FSRU technology can be brought online. Although there are eight FSRUs on the order book as of January 2017, very few existing FSRUs were available for charter, leading shipping companies to order new FSRUs or convert existing conventional vessels on a speculative basis. 439 Vessels LNG fleet, January 2017 Shipping Fleet: The global LNG shipping fleet consisted of 439 vessels as of January 2017, including conventional vessels and ships acting as FSRUs and floating storage units. In 2016, a total of 31 newbuilds (including two FSRUs) were delivered from shipyards, a 7% increase when compared to Relative to the previous year, this was a much more balanced addition relative to liquefaction capacity (which grew by 35 MTPA). Nevertheless, the accumulation of the tonnage buildout from the previous years is still being worked through, keeping short-term charter rates at historical lows. In 2016, two vessels were retired and sold for scrap. 10% of Supply Share of LNG in global gas supply in LNG in the global gas market: Natural gas accounts for roughly a quarter of global energy demand, of which 9.8% is supplied as LNG. Although LNG supply previously grew faster than any other natural gas supply source averaging 6.2% per annum from 2000 to 2015 its market share growth has stalled since 2010 as indigenous production and pipeline supply have competed well for growing global gas markets. Despite the lack of market share growth in recent years, the large additions of LNG supply through 2020 mean LNG is poised to resume its expansion. 2 This 81 MTPA is included in the global regasification capacity total of 793 MTPA quoted above. 3 Data for pipeline trade and indigenous gas production comes from the BP Statistical Review. Data for 2016 is not yet available. 5

8 Chevron LNG Journey to Japan Courtesy of Chevron
9 3. LNG Trade In 2016, global LNG trade reached a new record of MT, the third consecutive year of incremental growth. The majority of supply growth was supported by commercial production at multiple new liquefaction plants in East and West Australia, and commissioning production at a new train in Malaysia. The successful and timely completion of the first two trains of the Sabine Pass LNG facility marked the start of US Gulf of Mexico (GOM) exports. Also in the Atlantic Basin, Angola resumed LNG exports, as its sole exporting facility returned to operation. However, global LNG supply growth did not meet expectations. As delay and supply disruptions were coupled with demand uptake in Asia, the expected trade volume of LNG did not result; excess volumes that might have reached Europe did not materialize. LNG trade was bolstered by large markets such as China, India, and Egypt, as combined demand in Japan and South Korea declined slightly. New importers from 2015 continued to increase volumes, ramping-up at a rate faster than had been standard in the past. Moderate growth was present in a number of other markets globally, however a sharp contraction of LNG demand occurred in Brazil as the country was able to meet its lower power needs via hydro power as well as steady indigenous gas production. Looking forward, supply is poised to increase again in 2017 as new plants and additional trains come online, largely in the Pacific Basin. Major economies such as China and India, as well as new LNG importers such as Pakistan, Egypt, and Jordan, will continue to support fundamentaldriven demand. The looser LNG supply/demand balance will manifest additional deliveries into European markets with ample infrastructure, such as the UK, France, and Spain. Another developing trend will be the continued push by developers to locate small pockets of demand, which although individually small could amount to substantial volumes in aggregate Overview In 2016, total globally-traded LNG volumes reached MT, a 13.1 MT increase over 2015 and new record for global LNG trade (see Figure 3.1). However, this record is poised to be broken repeatedly over the next few years as additional liquefaction plants come online. The annual growth of 13.1 MT marks the highest level since MT Global LNG trade reached a historic high in 2016 The number of countries exporting LNG in 2016 returned to 18 from 17 in 2015 as Angola and Egypt resumed exports midway through the year. Political instability in Yemen meant LNG imports were unable to restart after shutting down in mid The start of operations at Sabine Pass LNG marked the start of US GOM LNG exports for the US, although the Kenai LNG plant in Alaska did not send out any cargoes during the year. Total re-export activity stayed relatively stable globally, with 4.4 MT re-exported by 10 countries during the year (10 countries also re-exported LNG in 2015).¹ Driven by growth in Qatari production, the Middle East was the world s largest LNG exporting region from 2010 to However, the Asia-Pacific regained this mantle in 2016 due to new production at several new liquefaction plants, coupled with Yemen LNG remaining offline due to continued unrest in the country. Asia-Pacific countries represented 38.6% of total exports, compared to 35.3% for the Middle East in Qatar continues to remain the world s largest LNG exporting country, accounting for around 30% of global trade by exporting 77.2 MT. Growth in Asia-Pacific supply was 15.4 MT, primarily from Australian project start-ups, including Gorgon LNG T1-2, GLNG T1-2 and Australia Pacific LNG T1. QCLNG T2 and Donggi-Senoro LNG, both of which started up in Q4 2015, also added to the growth in annual volumes from this region. The US shifted from its pattern of exporting only minor volumes from Kenai LNG and a handful of re-exported cargoes, to exporting 2.9 MT from the new Sabine Pass project in the US GOM during Elsewhere in the Atlantic Basin, Trinidad continued to struggle with feedstock limits, as production at Atlantic LNG (ALNG) was down substantially for the second consecutive year, falling 2.0 MT year-on-year Figure 3.1 LNG Trade Volumes, MTPA Global Regasification Capacity 700 Total Volume of LNG Trade 600 No. of LNG Exporting Countries (right axis) 500 No. of LNG Importing Countries (right axis) No. of Countries Source: IHS Markit, IEA, IGU 1 The United States is included in both totals, since it exports domestically-produced LNG and re-exports LNG from regasification terminals in the Gulf of Mexico. 7
10 (YOY). Nigeria LNG (NLNG) produced 1.8 MT less in 2016, due to domestic unrest in the Niger Delta region, as well as a period of extended maintenance during the first half of the year. Contrasting with difficulties in those countries, the return of Angola and Egypt to exporting status provided a combined boost of 1.3 MT in 2016 to Atlantic Basin production. Asia-Pacific and Asia markets (the distinction between these regions is illustrated in Section 8.3) continued to represent the most activity in LNG imports, recording a small increase in combined market share from 71.7% in 2015 to 72.4% in Given a decline in Japanese demand and near-flat South Korean demand, this slight growth was due to strong demand growth from both China and India (+6.9 MT and +4.5 MT YOY, respectively). Continued moderate growth in smaller markets such as Thailand, Pakistan, and Singapore helped these regions retain their important role in global trade. The addition of Jamaica and Colombia brought the number of importing countries to 35, although the pair registered just 0.1 MT of additional trade.² The four new markets from 2015, Egypt, Pakistan, Jordan, and Poland, added 7.7 MT in 2016, including 4.3 MT by Egypt alone. This builds on the 6.0 MT of imports those markets contributed to global trade during Looking forward, Malta received its first commissioning cargo in January 2017, and will likely be the only new importer of LNG in European LNG imports increased YOY for the second consecutive year, although strong Pacific Basin prices during the second half of 2016, and particularly during the last quarter of 2016, kept gains from exceeding 0.6 MT. The Northwest European markets of the UK, Belgium, and the Netherlands declined by a combined 3.4 MT YOY as ample pipeline supplies from both Russia and Norway were readily available. In contrast, the newest markets of Poland and Lithuania contributed a combined 1.4 MT of growth in Re-export activity from Europe decreased slightly in 2016 (-6.6% YOY), with the largest decrease in re-exports by Spain (-1.2 MT). Imports in many North American and Latin American markets fell, with the combined regions imports decreasing by 5.8 MT. Increased pipeline supply availability in Mexico and improved hydroelectric power generation in Brazil were the leading factors behind this drop. The only countries with expansions in LNG imports in the Western Hemisphere were Chile (+0.3 MT), Colombia, and Jamaica (both new, totalling 0.1 MT). The increase in Chilean imports was partially supported by gas sales across the Andes to Argentina to help meet winter demand; this is likely to be repeated again in Looking forward, an important factor in 2017 will include the trend of structural demand loss for LNG in foundational importing countries of Japan and South Korea. This is despite continued uncertainty regarding nuclear power generation in both countries. The rapidly-increasing demand for energy in both China and India will also support LNG imports into those markets, as additional Pacific Basin production becomes available. European LNG imports will be shaped by inter-basin differentials, as we have seen demand is comfortably filled by pipeline imports and domestic production. Ample gas supply via pipeline from both Russia and Norway will continue to compete with LNG in well-integrated European gas networks. Gas-fired power generation in Spain, Greece, and Italy will help gas and LNG demand. Carbon pricing policy in the UK has greatly aided gas s competiveness vis-à-vis coal in that LNG Trade in Review Global LNG Trade MTPA Growth of global LNG trade LNG Exporters & Importers +2 Number of new LNG importers in 2016 LNG Re-Exports FLAT YOY Re-exported volumes remained flat in 2016 LNG Price Change -$2.32 Drop in average Northeast Asian spot price from 2015 to 2016, in MMBtu Global LNG trade reached a record of MT in 2016, rising above the previous MT set last year. China, India, and Egypt provided 15.7 MT in new import demand. Contractions were largest in Brazil, the UK, and Japan (combined -8.8 MT). Two new countries began importing LNG in 2016, Colombia and Jamaica, although volumes were less than 0.2 MT. Exports resumed from Angola and Egypt. Yemen recorded no exports for the year, after production was shut in during the first half of Brazil, a country which had reload capabilities during 2015, but did not do so internationally, reloaded 0.4 MT in India re-exported LNG internationally during 2015, but did not during One notable shift in re-export behaviour was a large drop in reloads from Spain (-1.2 MT) and increase in French re-exports (+0.9 MT). Spot prices in general continue to face weakness due to supply additions outpacing demand growth. Spot price rebounded in the second half of 2016 in response to unanticipated supply outages and cold winter weather in Asia and Europe. 8 ² All counts and totals within this section only include countries that imported LNG on conventionally-sized LNG carriers and above, and exclude countries which buy cargoes exclusively from domestic liquefaction plants, such as Indonesia. Refer to Chapter 8 for a description of the categorization of small-scale versus large-scale LNG.
11 market, however in other European markets gas will face strong competition from both coal and renewables. Thus, additional flows to Europe will depend on LNG price shifts influenced by global LNG balances. From a supply perspective, trends in 2017 will be nearly parallel to those of 2016, with new production coming primarily from the Pacific Basin. Gorgon LNG T1 & T2, Australia Pacific LNG T2, MLNG T9 and PFLNG Satu are in position to reach nameplate annual production. Gorgon LNG T3 and Ichthys LNG are set to start-up in In the Atlantic Basin, two additional trains at Sabine Pass will boost US GOM output and Angola LNG is set for a full year of production LNG Exports by Country The number of exporting countries returned to 18 in 2016 as Angola and Egypt (Egyptian LNG) both returned to producing LNG. The Pacific Basin provided the majority of new supply, as 15.0 MT of additional LNG was exported from Australia alone (see Figure 3.3). Yemen, which exported LNG during the first half of 2015, did not export a single cargo in 2016 due to ongoing instability in the country. The US, although nominally an LNG-exporting country in 2015 via the Kenai LNG plant in Alaska and minor re-exported volumes, began LNG exports from the US GOM Sabine Pass LNG. With exports of 77.2 MT, Qatar continued to be the largest LNG exporter, a position it has now held for over a decade. Qatar s global market share has dropped to just under 30% as its production remains stable while other countries have grown (see Figure 3.2). The order of the top five exporters by share (Qatar, Australia, Malaysia, Nigeria, Indonesia; respectively) remained the same between 2015 and Although Australia remains a distant second to Qatar, it gained significant ground in 2016 and is poised to do so again in With a full year of production at its first two trains, as well as additional expansion trains, the US will be able to move up the ranks of producers again in Angola is poised to benefit from a full year of production in Figure 3.2: LNG Exports and Market Share by Country (in MTPA) Qatar, 77.2, 29.9% Australia, 44.3, 17.2% Malaysia, 25, 9.7% Nigeria, 18.6, 7.2% Indonesia, 16.6, 6.4% Algeria, 11.5, 4.5% Russia, 10.8, 4.2% Trinidad, 10.6, 4.1% Oman, 8.1, 3.2% PNG, 7.4, 2.9% Brunei, 6.3, 2.4% UAE, 5.6, 2.2% Norway, 4.3, 1.7% Peru, 4, 1.6% Eq. Guinea, 3.4, 1.3% US, 2.9, 1.1% Angola, 0.8, 0.3% Egypt, 0.5, 0.2% Note: Numbers in the legend represent total 2016 exports in MT, followed by market share. Source: IHS Markit, IGU Production from Trinidad decreased for the third consecutive year as feedstock shortages at Atlantic LNG persist. Declines were also evident in Yemen, although this is merely a continuation of the force majeure from last year. Although it had a strong year in 2015, NLNG production dropped by 1.8 MT in 2016, as sabotage in the Niger Delta regions affected midstream operations and the facility underwent extended maintenance during the first half of the year. In North Africa, Egypt s ELNG facility was able to begin exporting LNG again after Shell reached an agreement for limited feedstock from Egyptian Natural Gas Holding Company (EGAS). Algerian LNG production decreased for the second consecutive year, although this was due to a sharp rise in pipeline gas exports to Italy as Algerian domestic production rose. Europe s only LNG-producing country, Norway, produced just slightly more LNG than in 2015, a record 4.3 MT for the country via Snøhvit LNG. Figure Incremental LNG Exports by Country Relative to 2015 (in MTPA) MTPA Australia, US, Angola, 0.8 Egypt, Indonesia, 16.6 PNG, Oman, 8.1 Peru, 4 Norway, 4.3 UAE, Malaysia, 25 Russia, 10.8 Brunei, Eq. Guinea, 3.4 Qatar, 77.2 Algeria, Yemen, Nigeria, Trinidad, 10.6 North America Europe FSU Latin America Africa Asia-Pacific Middle East Source: IHS Markit, IGU 9
12 Figure 3.4 Share of Global LNG Exports by Country, % Share 100% 80% 60% 40% 20% 0% Qatar Australia Malaysia Nigeria Indonesia Algeria Russia Trinidad Oman PNG Brunei UAE Norway Peru Eq. Guinea US Angola Egypt Yemen Libya Source: IHS Markit, IGU 4.4 MT Re-exported LNG volumes in 2016 Re-exported volumes remained relatively stable YOY, at 4.4 MT. The number of countries once again remained at 10, however this included no re-exports by India and a restart of re-export activity by Brazil. Brazilian re-exported cargoes were generally sent to points in South America, however a lone re-export was sent to India in December. The US remained the only country to both re-export LNG in addition to exporting domestically-sourced gas. As in the past four years, Mexico again did not utilize its re-export capabilities in Europe registered a decrease of 0.2 MT in re-exports (see Figure 3.5). However this obscures the major shift in re-exports from Spain (-1.2 MT) to France (+0.9 MT). Given high resurgent spot prices in the Pacific Basin as well as tenders offered by short-term buyers, 20 cargoes were re-exported from French terminals in UK and Belgian re-exports inched up (+0.2 MT and +0.1 MT, respectively), while Dutch re-exports dropped (-0.2 MT). Re-export trade will continue to face pressure as additional LNG supply enters the market globally, reducing the number of cross-basin arbitrage opportunities as buyers are able to source from their respective regions. Additionally, the gap between European and East Asian spot prices is set to diminish as the market shifts into a period of oversupply. How players with large supply portfolios choose to manage those volumes, including portfolio optimization to take advantage of seasonal arbitrage opportunities, will also determine any change in re-export trade moving forward. Figure 3.5: Re-exports by Country, MTPA Note: Re-exports figures exclude volumes that were reloaded and discharged within the same country. Sources: IHS Markit Regional trade had been dominated by the Middle East, owing to Qatar s industry-leading 77 MT of nameplate capacity. However, additions in Australia during 2016 (as well as commercial volumes from Indonesia s Donggi-Senoro LNG) helped Asia Pacific take the lead role in LNG production at 99.5 MT (+15.4 MT YOY; see Figure 3.6). Only Asia Pacific and North America saw gains in market share in 2016, with all other regions market shares decreasing. African exports were down due to decreases in Algeria, Nigeria, and Equatorial Guinea, despite the return of Angola and Egypt (ELNG) as exporting countries. Latin American production (Trinidad and Peru) was down due to feedstock issues at Atlantic LNG, while European and FSU exports held constant in absolute value, resulting in a drop in market share for those regions. North American production began the first of what is likely to be a number of years of increasing output, exporting 1.1% of global LNG in Figure 3.6: LNG Exports by Region, MTPA United Kingdom, 3 Singapore, 3 India, 4 South Korea, 4 Netherlands, 15 Portugal, 5 Mexico, 0 France, 6 Brazil, 0 US, US4 Belgium, 12 Spain, North America Europe FSU Latin America Africa Asia Pacific Middle East Note: FSU = Former Soviet Union. Sources: IHS Markit, IGU 10
13 3.3. LNG Imports by Country Although last year s record LNG import levels were aided by an additional 6.0 MT of imports into the four new markets, 2016 marked a year where larger growth was supported by existing buyers. China and India added 11.5 MT compared to 7.7 MT added by the four new entrants from 2015: Egypt, Jordan, Pakistan and Poland. First-year importers Jamaica and Colombia imported just 0.1 MT, all during the second half of Asia Pacific remained the largest market by a comfortable margin in 2016, taking in 53.6% of global supply. This marks a decrease from the 57.1% of total imports the region received in 2015 as total imports into the region declined by 1.6 MT. Demand in Asia-Pacific continues to be led by Japan (83.3 MT), with South Korea (33.7 MT) a distant second. Buyers in the region received an increased amount of LNG from sellers within the region, with intra-regional trade rising to 76.5 MT from 68.5 MT in After alternating with Europe for second-largest importing region between 2013 and 2015, Asia took a decisive lead in 2016, importing 48.6 MT, compared with 38.1 MT for Europe. Asia was home to the two markets which grew by the largest margins, China (+6.9 MT) and India (+4.5 MT), while Pakistan also showed strong growth (+1.6 MT). Although Europe showed the most expansion in LNG imports in 2015, Asia, driven by China and India, displayed the strongest regional growth in 2016, rising by 13.0 MT. Buyers in the region continued to source primarily from a mix of Middle East and Asia Pacific suppliers. European imports appeared poised for a year of solid growth, but a resurgence in Asian prices during the second half of the year directed supply into the Pacific Basin. Growth in Europe was most evident in France (+1.0 MT) and Spain (+1.0 MT), as nuclear outages in the former supported regional gas demand during the second half of the year in addition to cooler weather during that time. The newest importers on the continent, Lithuania and Poland, provided a boost of 0.7 MT each YOY. Europe received a higher proportion of its LNG from Africa in 2016 than in 2015, as Middle East exports were redirected to Asia and Asia Pacific. Table 3.1: LNG Trade between Basins, 2016, MT Exporting Region Importing Region Africa Asia-Pacific Europe Sources: IHS Markit, EIA, IGU Former Soviet Union Africa Asia Asia-Pacific Europe Latin America Middle East North America Total Latin America Middle East North America Reexports Received Reexports Loaded Total North American and Latin American LNG imports both fell again in 2016 (-1.4 MT and -4.4 MT, respectively). Latin America was particularly hard-hit, as the return of normal rainfall levels and economic contraction in Brazil during 2016 were responsible for the decrease in imports in that country (-4.1 MT). LNG imports into Argentina also fell (-0.6 MT) given steadily increasing domestic gas production. Chile was able to increase LNG imports by 0.3 MT YOY, but some of this was actually destined for the Argentine market, piped over the Andes to meet seasonal demand. Latin America added two new importers, Colombia and Jamaica; however they only provided a combined 0.1 MT of import growth. Strong pipeline flow from the US to Mexico caused global LNG imports into the latter to continue to decline (-1.0 MT). This continues the trend from 2015, when the country experienced a decrease of 1.7 MT in imports. An additional result of continued strong US domestic gas production was Canadian LNG imports decreasing to their lowest annual total since imports began in As in 2015, emerging regions experienced steady demand growth. In the Middle East, Kuwait, the UAE, Israel, and Jordan all posted gains, collectively adding 2.6 MT to global LNG imports. The persistence of low LNG prices throughout the year enabled these countries to import extra LNG to meet growing demand, as did new contracts and a second FSRU commissioned in the UAE. In Africa, Egypt continued to be the lone LNG importer, adding 4.3 MT of additional trade, more than doubling imports to 7.3 MT during its second year of importing LNG. This resulted in a total of 10.3 MT imported in the market s first two years of imports, compared to the previous record of 3.9 MT imported by China in 2006 and Jordan and Pakistan had 2-year cumulative demand of 5 MT and 4.4 MT, respectively. Some Jordanian imports were actually destined for Egypt via the Arab Gas Pipeline. The largest single country increase was experienced in China, particularly as cold weather spurred demand fundamentals Figure 3.7. LNG Imports and Market Share by Country (in MTPA) Japan, 83.3, 32.3% S. Korea, 33.7, 13.1% China, 26.8, 10.4% India, 19.2, 7.4% Taiwan, 15, 5.8% Spain, 9.9, 3.8% Egypt, 7.3, 2.8% UK, 7.4, 2.9% France, 5.6, 2.2% Turkey, 5.6, 2.2% Italy, 4.5, 1.8% Mexico, 4.1, 1.6% Kuwait, 3.3, 1.3% Argentina, 3.6, 1.4% UAE, 2.9, 1.1% Pakistan, 2.7, 1% Chile, 3.3, 1.3% Jordan, 3, 1.2% Thailand, 2.9, 1.1% Other, 13.9, 5.4% Note: Number legend represents total imports in MT, followed by market share %. Other includes countries with imports less than 2.5 MT (by order of size): Singapore, US, Portugal, Puerto Rico Belgium, Malaysia, Brazil, Lithuania, Poland, Dominican Republic, Greece, Netherlands, Israel, Canada, Jamaica, and Colombia. Sources: IHS Markit, IGU 11
14 Figure 3.8: Incremental 2016 LNG Imports by Country & Incremental Change Relative to 2015 (in MTPA) MTPA Africa Asia Asia-Pacific Europe Latin America Middle East North America Other China, 26.8 India, 19.2 Egypt, 7.3 Pakistan, 2.7 Jordan, 3 France, 5.6 Spain, 9.9 UAE, 2.9 Poland, 0.8 Lithuania, 1 Taiwan, 15 S. Korea, 33.7 Kuwait, 3.3 Italy, 4.5 Thailand, 2.9 Other, 13.6 Chile, 3.3 Canada, 0.2 Netherlands, 0.4 Malaysia, 1.1 Argentina, 3.6 Belgium, 1.2 Mexico, 4.1 Japan, 83.3 UK, 7.4 Brazil, 1.1 Note: Other includes countries with incremental imports of less than ±0.2 MT: Israel, Portugal, Greece, Colombia, Jamaica, Singapore, Puerto Rico, Turkey, the US, and Dominican Republic. Sources: IHS Markit, IGU during the winter, including a doubling YOY of imports in December 2016 (see Figure 3.8). Growing Pacific Basin drove this increase, as Australian projects (+15.0 MT YOY) supplied a series of Chinese contracts which began during the year. The continued ramp-up in supply in Australia throughout will further enable Chinese and other Asian demand to expand. Also in Asia, Indian LNG imports grew by the second highest amount globally in 2016 (+4.5 MT), spurred by low spot prices meeting price-elastic demand outlets. Asia-Pacific imports declined by 1.6 MT YOY; however, this translates to only a 1.1% drop in annual imports. Five of the six importers of this region all changed by less than 1 MT YOY, with three increasing imports and two decreasing. The largest absolute change was in Japan (-2.2 MT), where nuclear restarts have continued, albeit at a slow pace, and a rapid renewables build is squeezing thermal generation amidst weak demand. After two years of falling LNG demand, South Korean imports grew slightly in 2016 (+0.4 MT), with the cold winter and hot summer a significant driver. Across the region, even in a year with falling LNG and rising coal prices, coal remained strongly competitive in the power sector % p.a. Average yearly growth rate of LNG demand since 2000 Although LNG has posted a higher annual rate of growth over the past 15 years than either global production for indigenous consumption or international pipeline exports, much of the impressive growth was focused in the first decade, with pipeline trade displaying a similar growth rate to LNG over the past few years (see Figure 3.9). Between 2010 and 2015, the average growth rate of LNG trade has slowed to just 2.1%, roughly on par with indigenous production (1.9%) and pipeline trade (0.8%). In 2015, LNG s share of global trade dipped slightly, remaining around 9.8%, while pipeline s share of gas trade increased to 20.3%, aided by historically-high levels of pipeline exports by both Russia and Norway. Despite a slowing rate of growth in recent years, LNG trade has continued to develop for various reasons by country. In the markets of the Asia Pacific, LNG imports are driven by geographic isolation and gas resource scarcity. Additionally, questions regarding nuclear as a power source continue to support LNG imports. Unlike some other importing regions, these countries either find themselves without prospects for increased domestic gas production, or otherwise insufficient production to meet demand. Cross-border pipeline connections have yet to make a major impact on regional gas dynamics. In other markets, LNG is used to supplement domestic production, which is either maturing or insufficient to keep pace with domestic demand. Despite the UK being able to record an increase in gas production in 2016, production is in a long-term trend of decline. Additional restraints at the Groningen field in the Netherlands have likewise decreased output from that country. A more common occurrence globally has been the inability of gas production to keep pace with demand growth, including in Kuwait, Thailand, and Argentina. Figure 3.9: Global Gas Trade, ,000 3,500 3,000 2,500 2,000 1,500 1, LNG Pipeline Consumed where produced Note: CAGR = Compound Annual Growth Rate Sources: IHS Markit, BP Statistical Review of World Energy CAGR ( ) % 3.0% 1.8% 12

15 LNG continues to be used as a means to increase gas supply security even in markets with ample pipeline connections. European importers such as France, Italy, and Turkey use LNG to diversify their import mix and to maintain access to gas in the case of inadequate pipeline flows. Concerns over the pricing and security of pipeline imports prompted both Lithuania and Poland to become LNG importers during the past few years. During the past decade, the fortunes of domestic gas production in a number of countries have, and will continue to affect their outlooks as importers. The most pronounced shift was the shale revolution in the US, which allowed the country to begin exporting LNG from the Lower 48 states, instead of becoming a net importer as had previously been projected. US production in turn influenced the LNG import needs of neighbouring Canada and Mexico as well. In other importers, such as China and Argentina, the possibility of expanding shale production could reduce the need for LNG imports in the long term. Egypt is likely to experience a pronounced reduction in LNG imports in the coming years as recent discoveries come on stream LNG Interregional Trade The largest global trade flow route continues to be Intra- Pacific trade, a trend which is poised to continue as that basin posted the largest gains in both supply and demand by region (see Figure 3.10). Continuing growth in Chinese and Indian demand, as well as Australian production, will cement this trade route s prominence. Trade between the Middle East and Pacific was the second-highest by volume, due to Qatar s role in supplying Japan and South Korea. Given elevated prices in Asian markets during the second half of 2016, much of Qatar s supply went to the Pacific, meaning Middle-East to Atlantic trade declined to just 7% of global trade in That route was the fastest-declining in 2016, dropping by 4.7 MT YOY. Very few volumes from the Pacific left the basin, with Pacific Basin exports to the Middle East or Atlantic totalling just 2.7 MT in Fewer cargoes from the Atlantic likewise made the journey to the Pacific in 2016, instead stopping in the Middle East. Combined Atlantic trade to the Pacific and Middle East totalled 23.3 MT in 2015 and 24.2 MT in Figure 3.10: Inter-Basin Trade Flows % % Share 80% 60% 40% 20% 0% Intra-Pacific Intra-Atlantic Intra-Middle East Middle East-Pacific Middle East-Atlantic Atlantic-Pacific Atlantic-Middle East Pacific-Middle East Pacific-Atlantic Sources: IHS Markit, IGU Figure 3.11: Inter-Basin Trade, 2000 v Intra-Pacific Middle East-Pacific Intra-Atlantic Middle East-Atlantic Atlantic-Pacific Intra-Middle East Atlantic-Middle East Pacific-Middle East Pacific-Atlantic MT Sources: IHS Markit, IGU Sabine Pass LNG Courtesy of Cheniere Energy 13
16 Table 3.2: LNG Trade Volumes between Countries, 2016 (in MTPA) Algeria Angola Australia Brunei Egypt Equatorial Guinea Indonesia Malaysia Nigeria Norway Oman Papua New Guinea Peru Qatar Russia Trinidad United Arab Emirates United States Yemen Re-exports Received Re-exports Loaded 2015 Net Imports 2015 Net Imports 2014 Net Imports 2013 Net Imports 2012 Net Imports Egypt Africa China India Pakistan Asia Japan Malaysia Singapore (0.34) South Korea (0.28) Taiwan Thailand Asia-Pacific (0.62) Belgium (0.85) France (1.24) Greece Italy Lithuania Netherlands (0.59) Poland Portugal (0.20) Spain (0.08) Turkey United Kingdom (0.38) Europe (3.35) Argentina Brazil (0.39) Chile Colombia Dominican Republic Jamaica Puerto Rico Latin America (0.39) Israel Jordan Kuwait United Arab Emirates Middle East Canada Mexico United States (0.09) North America (0.09) Exports (4.46) Exports (4.57) Exports (6.23) Exports (4.59) Exports (3.45) Note: Indonesia, Malaysia, India, and the UAE conducted domestic LNG trade in These volumes are not included above as they do not reflect international trade between countries. Sources: IHS Markit, IGU 14
17 3.5. Spot, Medium and Long-term Trade³ Historically, a large portion of LNG volumes have been traded under long-term, fixed destination contracts. Over the past decade, a growing number of cargoes have been sold under shorter contracts or on the spot market. This non long-term LNG trade⁴ has been made possible by the proliferation of flexible-destination contracts and an emergence of portfolio players and traders. The growth of non long-term trade accelerated in 2011 owing to shocks like those that resulted from the Fukushima crisis and the growth of shale gas in the United States. However, the share of LNG traded without a long-term contract as a percentage of the global market has tapered off since Short-term trade defined here as all volumes traded under agreements of less than two years accounts for the vast majority of all volumes traded without a long-term contract. In 2016, short-term trade reached 67.6 MT, or 25.8% of total gross traded LNG (including re-exports). Although this volume equates to a total growth of 1.65 MT relative to 2015, its share of total traded LNG declined by 0.6%. Several emerging markets like Pakistan and Malaysia began importing LNG under new long-term contracts in 2016; while other markets that typically rely very heavily on spot and short-term volumes, like Brazil, measured large drops in LNG imports. Further, the majority of new liquefaction projects that started operations in 2015 and 2016 in the Asia-Pacific region are supported by long-term contracts. Volumes traded under medium-term contracts (between 2 and <5 years) remain a comparatively small portion of all non longterm trade. Medium-term deliveries declined for the second year in a row in 2016, falling to 4.7 MT from 6.0 MT in 2015, as several contracts were filled increasingly with short-term volumes. Medium term contracts offer countries with uncertain future LNG needs more security of supply for their minimum requirements than would be provided by short-term imports; and have been favoured by buyers hesitant to sign long-term contracts because of the availability of uncontracted and flexible supply. In total, all non long-term LNG trade reached 72.3 MT in 2016 (+0.4 MT YOY) and accounted for 28% of total gross LNG trade a 4% decline in share from This volume was Figure 3.12: Short, Medium and Long-Term Trade, MTPA Sources: IHS Markit, IGU Short-term Medium-term Long-term % Spot and Short-term (right) 30% 25% 20% 15% 10% 5% 0% 1.0 MT lower than the peak that non long-term trading reached in 2013, when Japan was turning heavily to the spot market to satisfy its post-fukushima needs. Since then, the start-up of new projects underpinned by long-term contracts has led the non long-term market to decline consistently as a share of total traded LNG. Still, the volume of LNG traded without a longterm contract in 2016 is more than double the amount traded a decade ago. This growth is the result of several key factors: y The growth in LNG contracts with destination flexibility, which has facilitated diversions to higher priced markets. y The increase in the number of exporters and importers, which has amplified the complexity of the industry and introduced new permutations and linkages between buyers and sellers. In 2016, 29 countries (including re-exporters) exported spot volumes to 35 end-markets. This compares to 6 spot exporters and 8 spot importers in y The lack of domestic production or pipeline imports in Japan, South Korea and Taiwan, which has pushed these countries and others to rely on the spot market to cope with any sudden changes in demand like the Fukushima crisis. y The decline in competitiveness of LNG relative to coal (chiefly in Europe) and shale gas (North America) that has freed up volumes to be re-directed elsewhere. y The large disparity between prices in different basins from 2010 to 2014, which made arbitrage an important and lucrative monetisation strategy. y The faster development timeline and lower initial capital costs of FSRUs compared to onshore regasification, which allow new countries to enter the LNG market. y The large growth in the LNG fleet, especially vessels ordered without a long-term charter, which has allowed low-cost inter-basin deliveries. In 2016, trends among suppliers in the non long-term market closely followed those of the global LNG market as a whole. The largest growth in non long-term supply came from Australia. Although the majority of new Australian liquefaction projects are supported by long-term contracts, several of these are destination-flexible, and commissioning cargoes from six new trains also contributed to the country s 5.9 MT of YOY growth. The first two trains of the United States first US GOM plant Sabine Pass are underpinned by destinationflexible contracts with LNG aggregators, and as a result Figure 3.13: Non Long-Term Volumes, MTPA Sources: IHS Markit, IGU Non Long-Term Trade % of Total LNG Trade (right axis) 40% 35% 30% 25% 20% 15% 10% 5% 0% % Share ³ As defined in Section 8. ⁴ Non long-term trade refers to all volumes traded under contracts of less than 5 years duration (spot/short-term + medium-term trade). To truly capture the size of the market, volumes are considered non long-term if at any point they were traded under anything other than a long-term contract (e.g., volumes procured from the spot market but delivered under a long-term portfolio contract would be considered spot). 15
18 Figure 3.14: Non Long-Term Cargo Market Development, No. of Cargoes 1,400 1,200 1, No. of Non Long-Term Cargoes Traded No. of Countries Importing Non Long-Term LNG (right axis) No. of Countries Exporting Non Long-Term LNG (right axis) Sources: IHS Markit, IGU 68% of volumes delivered in 2016 (1.9 MT) were on the non long-term market. The expiration of older contracts also contributed to the increase in short-term trade, particularly in Malaysia, where deliveries grew by 1.2 MT YOY. Most of the biggest declines in short- and medium-term trade were primarily the result of supply-side factors at individual exporters. Algeria, Nigeria, and Trinidad all saw non long-term deliveries fall by over 1.5 MT owing to production outages and feedstock shortfalls. Qatar s short-term deliveries fell by 2.2 MT, but this was the result of several new contract start-ups in Pakistan, Japan, and India. Continuing the trend from 2015, Egypt had the largest growth in non long-term imports. The market relies almost exclusively on one- or two-year tenders for its LNG supply, resulting in a 4.3 MT increase in short-term imports. Although the vast majority of China s total 6.9 MT of YOY import growth was satisfied by new long-term contracts, it still had over 1 MT of new non long-term imports as it turned to the spot market to cover high year-end demand. New medium-term contracts fuelled moderate gains in several countries in the Middle East Kuwait and Jordan grew by 0.3 and 0.5 MT, respectively. Because Brazil s LNG imports are sourced entirely from the spot and short-term market, its 4.1 MT demand decline was the largest drop in non long-term imports globally. This was followed by Japan, where the start-up of new long-term contracts, combined with lower total demand, brought a decline of 2.7 MT of non long-term imports. New long-term contracts were also responsible for a decrease in non longterm imports in Taiwan (-1.0 MT), and kept Pakistan s spot and short-term imports flat despite its 1.6 MT demand gain LNG Pricing Overview LNG-related prices in 2016 had different drivers in each half of the year. With increasing supply and weak demand in the first six months of 2016, Asian and European spot prices and oil-indexed contract prices continued to weaken. By midyear, supply disruptions and a recovery in oil prices began to influence prices upward. Colder winter weather in Asia and Europe, encouraged a run on spot volumes at the end of the year and hastened the run-up. By February 2017, landed No. of Countries Figure 3.15: Monthly Average Regional Gas Prices, January 2017 $/mmbtu Jan-10 Jan-11 Jan-12 Jan-13 Jan-14 Jan-15 Jan-16 Jan-17 US (Henry Hub) German Border Price NE Asia Spot Price Sources: IHS Markit, Cedigaz, US DOE UK (NBP) Japan (based on LNG) Asian LNG spot prices reached an average $9.55/MMBtu their highest point since early While this resurgence is notable, spot prices are likely to once again face downward pressure in the coming years as new liquefaction capacity is added. In November 2016, the Organisation of Petroleum Exporting Countries (OPEC) and Russia reached a deal to limit oil production. If producers adhere to their new quota levels, oil prices could strengthen in 2017, which would consequently lend strength to oil-indexed LNG. The supply outages and cold weather at end 2016 revealed that some tightness in the global LNG market is still possible, particularly in the winter. Asian spot prices rose, disconnecting from European prices and even rising above oil parity. During this time, price signals were so pronounced that US LNG began flowing to Asia. The delivered costs of US LNG provides an increasingly important reference point for global markets, given the flexibility of its destination-free supply as well as the liquidity and pricing transparency of the US market. Gas prices in North America are largely set at liquid trading hubs, the largest and most important of which is Henry Hub in Louisiana. In Europe, wholesale gas is sold mainly via longterm contracts. These contracts variously take into account gas hub-based or oil-linked pricing, and often both. In Asia and many emerging markets without established and liquid gas trading markets, the price of LNG is for the most part set via oil-linkages, supplemented by a smaller share of spot imports. Oil prices are particularly important for the LNG market. As oil prices fell in late 2014 through late 2016, traditionally oil-linked prices in Europe and Asia also declined. From an average of over $100/bbl in the first eight months of 2014, crude prices fell rapidly to an average of $52/bbl in 2015 and $43/bbl in Given that most oil-indexed contracts have a three to six month time lag against the oil price, Asian term import prices remained relatively steady through the end of 2014, with Japanese imports holding at the $15/MMBtu level. However, by 2015 the impact of oil price became apparent and continued through The Japanese import price averaged $9.77/MMBtu in 2015 and $6.59/MMBtu in

19 Figure 3.16: European Import Price Formation, 2005 to 2015 % Share of price formation mechanism 100% 80% 60% 40% 20% 0% Oil Price Escalation Gas-on-Gas Competition Note: Oil Price Escalation = prices linked, usually through a base price and an escalation clause, to competing fuels, typically crude oil, gas oil and/or fuel oil. Gas-on-Gas Competition = prices determined by the interplay of supply and demand gas-on-gas competition that are traded at physical or notional hubs. Sources: IGU Wholesale Gas Price Survey 2016 Edition Over the past six years, Asian buyers have increasingly sought to diversify the pricing structures of their LNG portfolios, shifting away from the traditional fixed-destination, long-term, oil-linked LNG contract. The sustained growth of shale gas production in North America has seen Henry Hub trade at a discount to other major gas benchmarks in the Pacific Basin and Europe; prompting Japanese, South Korean, Indian, and Indonesian companies, among others, to sign a number of offtake agreements based on Henry Hub linkage. However, as oil price has declined, buyer contracting activity from the US has also waned. While Henry Hub linked LNG contracts will continue to offer buyer s portfolio diversification, the perception that these contracts will result in lower priced LNG relative to oil-linked contracts is less assured. Northeast Asian spot LNG prices fell steadily in the first half of 2016 as supply overwhelmed demand, but the opposite occurred in the second half when supply shortages and cold winter temperatures drove spot prices back up. Landed Asian spot LNG prices averaged $5.52/MMBtu during the year, although there was considerable volatility during the year. Prices fell to $4.05/MMBtu in May 2016 as supply overwhelmed demand, but climbed to $9.95/MMBtu by February 2017 owing to supply shortages and cold winter temperatures. From mid-2014 to early-2016, low oil prices pulled prices at European gas hubs down; decreasing global spot prices for LNG also removed upward pressure on the UK NBP benchmark. Weak demand fundamentals in both power generation and the residential and commercial sectors (owing to warm weather) in the UK failed to provide a typical seasonal price rally. Following a slight lag in oil price recovery, the benchmark price at NBP rose in May and June 2016, but decreased in line with lower summer demand and ample supply; by September 2016, NBP hit a low of $3.67/MMBtu. Moving into winter, NBP prices began to recover, jumping 48% in three months to reach $5.44/MMBtu by December. The Rough storage outage in the UK was a contributor to price appreciation during this period. If LNG imports into the European continent increase substantially in the short run, it will put downward pressure on the UK NBP in the coming years. As prices fell around the world, the market moved closer to price convergence; the differential between NBP and Northeast Asian spot prices narrowed to an average $0.91/MMBtu in Notably, the Northeast Asian spot price was at a discount to NBP for several months for the first time in six years. In May and June 2016, average Asian spot prices were ~$0.40/MMBtu lower than NBP. In North America, overall market fundamentals drive gas price movements much more than changes in the oil price. Although lower activity in oil and wet gas plays resulting from weaker oil prices reduced the growth of gas production in 2016, the volumetric impact is minimal relative to the size of US gas production. Further, reduced liquids activity has reduced the costs of rigs, crews, and equipment, which benefited operators. Downward price pressure will come from removing infrastructure constraints in Marcellus and Utica shale. In addition, end-market fuel competition with coal and renewables in the power sector will provide an upside limit. Renewables in particular have been promoted by the Clean Power Plan. On an annual basis, Henry Hub averaged ~$2.50/MMBtu in 2016 the lowest level since Lower oil prices may have decreased the spread between oil-linked and US LNG contracts in the near-term, but the lower starting point of US prices and abundant downside market fundamentals risks mean that US LNG contracts may offer buyers reduced price volatility over the next few years. Since 2009, European gas contracts have increasingly been signed or renegotiated to include hub gas price indexation (particularly in the Northwest), dropping the historically dominant links to crude and fuel oil. Due to European Union energy policies and market dynamics, major gas suppliers have since increased the share of hub pricing in the formulation of pipeline export prices for certain contracts. Similar to contracted Japanese LNG prices, the German border gas price a proxy for contracted European gas import prices began to reflect the fall in oil prices in 2015, averaging $6.80/MMBtu for the year and falling to $4.89/ MMBtu during the first eleven months of Moreover, increased indexation to hub prices also contributed to lower border prices. Courtesy of Chevron. 17

20 Looking Ahead What does the global LNG supply/demand balance hold? Incremental LNG supply growth in 2017 is likely to be similar to 2016, with additional supply from the US GOM, Australia, and South East Asia coming online. Given steady output from new trains and stabilized production at facilities that experienced production issues during 2016, supply growth is likely to outpace demand in Much of the new LNG supply will be located in the Pacific Basin during 2017, with the balance of new supply shifting to the Atlantic Basin in The result of most additional capacity coming online in the Pacific Basin means that the region will be less subject to supply-related price shocks, and further reduce arbitrage opportunities between basins. To what degree will domestic market factors impact LNG imports? Questions surrounding nuclear power in established markets such as Japan and South Korea could aid LNG imports. The pace of gas industry-related reforms in nearby China will also be critical. Underserved gas markets such as India and Pakistan could benefit from lower prices, but midstream infrastructure may act as a limit to gas market growth. In Europe, the EU Commission s Strategy for LNG and Gas Storage could lead to higher LNG imports in the interest of supply security. How will new project startups influence short-term trade in 2017? Of the 31.7 MTPA of new liquefaction startups in 2016, 72% were located in the Pacific Basin that held long-term contracts with primarily Asian buyers. In 2017, over 45 MTPA of new liquefaction capacity expects to begin commercial operations, 37% of which is either uncontracted, or contracted to Atlantic Basin aggregators. This increase in flexible-destination and Atlantic supply could support faster growth of spot and short-term trade in This trend will only accelerate in 2018, when roughly half of new liquefaction capacity expected online will be located in the US. Courtesy of Chevron. 18
21 4. Liquefaction Plants Global nominal 1 liquefaction capacity has grown to MTPA as of January 2017, an increase of approximately 35 MTPA relative to end Project delays and outages during 2016 limited the effect of the anticipated imbalance in the LNG market. However, the pace of liquefaction investment continued to wane as a result of these expectations and capital spending constraints. Only two projects, totalling 6.3 MTPA, reached a final investment decision (FID) in Under-construction capacity totalled MTPA as of January Projects are focused primarily in Australia, the continental United States (which began to export LNG in 2016), and on several floating LNG (FLNG) developments, the first of which is expected online in early With more than 55 MTPA of capacity online and more than 30 MTPA expected online in the next two years, Australia is expected to become the largest liquefaction capacity holder in North America accounts for the majority of new liquefaction proposals, where 664 MTPA of capacity has been announced in the US and Canada, excluding 68.1 MTPA of existing and under-construction capacity in the continental United States. The anticipated LNG oversupply and structural shifts in some buyers demand requirements have continued to slow the long-term contracting activity that is generally required to finance new projects. With numerous projects competing for offtakers, only the most cost-effective proposals are likely to advance during this period. The increasing proliferation of new, generally smaller LNG importing markets offers an array of contracting opportunities for liquefaction project sponsors. In some cases, these end-markets face infrastructure, regulatory, and credit-related hurdles that may limit the underpinning of new liquefaction projects in the near term Overview MTPA Global nominal liquefaction capacity, January 2017 Global nominal liquefaction capacity was MTPA as of January 2017, an increase from MTPA at end Four new projects totalling 31.7 MTPA of capacity began commercial operations in 2016: Gorgon LNG T1-2 (10.4 MTPA), GLNG T1-2 (7.8 MTPA), and Australia Pacific LNG T1 (4.5 MTPA) in Australia as well as the first two trains (9 MTPA) at Sabine Pass LNG in the United States. MLNG T9 in Malaysia (3.6 MTPA) began commercial operations in January In 2017, project sponsors plan to bring 47.6 MTPA of nominal capacity online 50% more than in 2016 in the US, Australia, Cameroon, Malaysia, Indonesia, and Russia. Underconstruction capacity was MTPA as of January 2017, with two projects totalling 6.3 MTPA reaching FID in : Tangguh LNG T3 (3.8 MTPA) in Indonesia and Elba Island LNG (2.5 MTPA) in the United States. Australia Pacific LNG T2 also sent out commissioning cargoes in 2016; commercial operations are scheduled to begin in proposed capacity in the US and Canada is at or beyond the pre-front end engineering and design (pre-feed) stage. Australia, East Africa, and Russia also have major proposed liquefaction capacity. Across regions, the anticipated market oversupply, weaker demand growth in key import markets, decreased capital budgets, and project-specific hurdles, have slowed the pace of development. Feedstock availability and security concerns continued to impact operations at several projects in In Egypt, Damietta LNG, remained offline due to limited feedgas production. After being offline since end-2014, Egyptian LNG (ELNG) exported several cargoes during In Yemen, LNG production was halted in early 2015 and remained offline as of January 2017 owing to the ongoing civil war in the country. Figure 4.1: Nominal Liquefaction Capacity by Status and Region, as of January Existing FID Pre-FID Together, the US and Australia will be the main contributors to new liquefaction capacity. Australia will have the largest liquefaction capacity in the world by 2018, with capacity expected to grow to 85 MTPA, up from 43.7 MTPA in In the US, 57.6 MTPA is under construction. MTPA MTPA Global liquefaction capacity under construction, January 2017 More than three quarters of the 879 MTPA of proposed capacity at end-january 2017 is located in the US and Canada (see Figure 4.1), though relatively few have made substantial commercial progress. Only 42% of Africa Asia Pacific Europe Note: FID does not include capacity stated to be under construction in Iran, nor is the project included in totals elsewhere in the report. Sources: IHS Markit, Company Announcements FSU Latin America Middle East North America 1 Nominal liquefaction capacity refers to projects nameplate capacities and is not prorated based on project start dates. 2 Excludes Woodfibre LNG (2.1 MTPA) in Canada since the project was not under construction as of January Includes Elba Island LNG as it began onsite construction in 2016, although a formal FID has not been announced. 19
22 Figure 4.2: Global Liquefaction Capacity Build-Out, % % % % % % % % % 50 10% 0 0% Global Liquefaction Capacity % of Capacity Utilised (right axis) Sources: IHS Markit, Company Announcements MTPA 4.2. Global Liquefaction Capacity and Utilisation While LNG exports have grown, liquefaction capacity utilisation has declined slightly in recent years. Existing projects without declining feedstock availability or other challenges affecting output generally were highly utilised, while idled capacity at some projects removed potential volumes from the market. Utilisation in 2016 was 82%, below the average of 84% since 2010 (see Figure 4.2). Several projects remained offline in 2016, and others faced production outages or feedstock shortages. As of January 2017, Yemen LNG was offline. Due to increased political violence, the project partners declared force majeure in mid- 2015, which resulted in the stoppage of exports. Following extended repairs that caused the project to halt operations in 2014, Angola LNG resumed exports in 2016 but experienced multiple production outages during the year. In Australia, Gorgon LNG T1 also faced outages in A reduction in utilisation at Nigeria LNG was due in part to force majeure being declared on a feed gas pipeline in mid Declining domestic production contributed to falling exports from Algeria, Brunei, and Trinidad. These losses were mostly balanced by strong utilisation at a number of existing projects. Qatar, Malaysia, Norway, Papua New Guinea, Russia, and the UAE all operated at or near full capacity in The United States saw an uptick in utilisation as Sabine Pass LNG exported its first cargoes in Utilisation remained flat in Australia despite start-ups at Gorgon LNG, GLNG, and Australia Pacific LNG during the year. Egypt resumed exports from ELNG in 2016, though overall utilization remained low. During the year, one of the ELNG partners concluded an agreement with the Egyptian government to send a small amount of feedstock, initially 125 million cubic feet per day (mmcfd) and reportedly increased to 250 mmcfd, to the plant for export. Forecast Figure 4.3: Number of Trains Commissioned vs. Average Train Capacity, MTPA Sources: IHS Markit, Company Announcements 4.3. Liquefaction Capacity by Country Existing Five countries: Qatar, Australia, Malaysia, Algeria, and Nigeria, account for more than sixty percent of the world s nominal liquefaction capacity. Qatar alone holds nearly one quarter of the total. No new countries have built liquefaction plants since Papua New Guinea in 2014, which brought the total number of countries with liquefaction capacity to nineteen % by 2022 Expected growth in global liquefaction capacity Under Construction The majority of the MTPA of under-construction capacity is located in the US (57.6 MTPA) and Australia (31.1 MTPA). Additional projects are under construction in Russia (16.5 MTPA), Malaysia (2.7 MTPA), Indonesia (4.3 MTPA), and Cameroon (2.4 MTPA) 4. A second train at Australia Pacific LNG as well as PFLNG Satu are in the commissioning phase and expected to begin commercial operations in early In 2016, Australia maintained its position as the second-largest LNG capacity holder, behind only Qatar. Over the next several years, it will be a major source of incremental supply growth. Five projects are under construction in the country and all are expected online by 2018, which will make Australia the world s largest liquefaction capacity holder. The US will be the primary source of incremental liquefaction capacity over the next five years 5. Six projects (57.6 MTPA) are under construction on the US GOM and East Coast (see Figure 4.4). The US currently only exports from two trains at Sabine Pass LNG located on the US Gulf Coast. The country previously exported small volumes from the Kenai LNG project in Alaska but did not do so in Three of the under-construction projects, both expansions and newbuilds, were sanctioned in 2015, and all are expected online by Elba Island LNG (2.5 MTPA) began onsite construction in 2016, though construction on the modular liquefaction units was reported to have begun offsite several years earlier. Apart from Corpus Christi LNG, Forecast Average Gross Capacity of Trains Commissioned, MTPA No. of New Trains Commissioned (right axis) No. of Trains 3 Includes Yemen, which did not export cargoes in Although the US has exported from Kenai LNG in Alaska, the continental US began exporting in 2016 (not including re-exports). Projects in the continental US are utilising a different resource base. 4 See Appendix II for a detailed list of under-construction liquefaction projects. 5 Excludes proposed liquefaction capacity with announced start dates prior to 2022 that has not been sanctioned as of January

23 Figure 4.4: Nominal Liquefaction Capacity by Country in 2016 and % 100% 80 80% MTPA Africa Asia Pacific Europe and FSU Americas Middle East 60% 40% 20 20% 0 0% Algeria Angola Cameroon Egypt Equatorial Guinea Nigeria Australia Brunei Indonesia Malaysia Papua New Guinea Utilisation, 2016 (right axis) Norway Russia Peru Trinidad United States Oman Qatar United Arab Emirates Yemen Note: Liquefaction capacity only takes into account existing and under construction projects expected online by Sources: IHS Markit, IGU, Company Announcements the under-construction projects are brownfield developments associated with existing regasification terminals. In Russia, construction at Yamal LNG began in 2013 and continued throughout The first train is announced to come online in 2017, and all trains are scheduled to be operational by Once completed, it will bring Russia s total liquefaction capacity to 27.3 MTPA. 6 The project completed financing in 2016, which was previously a considerable obstacle. Proposed While the number of liquefaction proposals has increased significantly in recent years, totalling 879 MTPA in January 2017, proposal activity slowed in 2016 mainly due to the anticipated market imbalance, low oil prices, and uncertain long-term demand requirements. Projects will face significant competition given the relative size of the market. The vast majority of this proposed capacity is in North America, where 59 liquefaction projects or expansion trains have been announced totalling approximately 671 MTPA 7. Few have made significant commercial progress, however, and the actual capacity buildout is likely to be less than announced. Most of the approximately 335 MTPA of proposed capacity in the US is located on the Gulf Coast. British Columbia on Canada s West coast accounts for most of the country s proposed 329 MTPA of capacity. While major LNG buyers are equity partners in several projects, their near-term interest in committing to long-term contracts may diminish in a market with many supply options. In contrast to most US projects, a number of these proposals require large upstream and pipeline investments. In addition to the market risks noted above, the several projects proposed in Eastern Canada and Mexico face Chevron LNG Journey to Japan Courtesy of Chevron 6 Excludes proposed liquefaction capacity with announced start dates prior to 2022 that has not been sanctioned as of January Excludes stalled and cancelled projects. See Tables 4.3 through 4.7 for a breakdown of proposed projects in North America, including the US Lower 48 (4.3), Alaska (4.4), Western Canada (4.5), Eastern Canada (4.6), and Mexico (4.7). 21
24 feedstock availability challenges. Projects in Eastern Canada will likely require pipeline reversal and capacity expansion. Increased gas demand in Mexico has resulted in additional US pipeline (and, to a lesser extent, LNG) imports as domestic production declines. Mexico s two proposed liquefaction projects totalling 7 MTPA of capacity are therefore longer-term export opportunities. The discovery of large gas reserves offshore East Africa has resulted in multiple liquefaction proposals in Mozambique (53.4 MTPA) and Tanzania (20 MTPA). Some East African projects made significant commercial progress during 2016, and an FID at Coral FLNG in Mozambique may be imminent. Based on announced start dates, several projects are planned to begin operations in the first half of the 2020s. In addition to broader LNG market conditions, projects in the region must contend with a lack of infrastructure and the completion of commercial and regulatory frameworks, though recent progress has been made. Several smaller FLNG proposals have quickly emerged in West Africa in addition to the underconstruction Cameroon FLNG project. These include Fortuna FLNG in Equatorial Guinea, and most recently, a proposed cross-border development between Mauritania and Senegal. A challenging operating environment, higher cost estimates, and, in some cases, lengthy estimated construction timelines have impacted some proposed projects in the Arctic and sub-arctic. In Russia, Novatek is considering a gravitybased development as a means of potential cost reduction for its proposed Arctic LNG-2 (12-18 MTPA) project. The approximately 20 MTPA Alaska LNG project is estimated to cost approximately $45 billion and requires the construction of an 800-mile pipeline. The state of Alaska is evaluating several options to restructure the proposal and improve project economics after other partners withdrew from the project in A brownfield expansion train at Sakhalin-2 in Russia is announced to come online in the early 2020s, but has not yet reached FID. Due to a high-cost environment, particularly in Australia, as well as competition with other proposed supply sources, Asia Pacific projects are planned as longer-term opportunities. Proposals in the region are based primarily on offshore reserves and totalled 63.5 MTPA as of January Project sponsors have not announced start dates for nearly 60% of proposed capacity (36 MTPA). Thirty-four percent (22 MTPA) of proposed capacity is composed of brownfield expansions of existing or under-construction capacity, while more than 35% (23 MTPA) plans to utilise FLNG technology. As feedstock at existing legacy projects in the region declines, projects like North West Shelf and Darwin have discussed backfilling existing trains in lieu of developing additional expansion trains or greenfield projects. Decommissioned Few projects are expected to be decommissioned over the next several years, and none were officially decommissioned in In Indonesia, Arun LNG transitioned to an import terminal in early 2015 after the final two trains were decommissioned in late Two trains at the Skikda complex in Algeria were decommissioned in early The country may decommission several other aging trains in the next few years as two new trains (totalling 9.2 MTPA) were brought online in 2013 and However, in 2016 it announced plans to upgrade two trains at Arzew LNG. While Kenai LNG in Alaska received a two-year extension of its export authorization in early 2016 it did not export cargoes during the year. Its export program for 2017 remains uncertain as ConocoPhillips has announced plans to sell the project. Due to declining feedstock, the project was shut down in 2012 but resumed operations in 2014, exporting cargoes during the summer months of 2014 and Declining domestic gas production and rising demand in Egypt has caused the country s two export projects, Damietta and ELNG, to be significantly underutilized. The country began importing LNG in Damietta LNG has been idled since 2012, and ELNG resumed modest exports in 2016 after not exporting in With the approximately 24 trillion cubic feet (Tcf) 9 Zohr discovery and developments in the West Nile Delta, Egypt plans to resume its status as a net exporter by This would be facilitated if further exploration success occurs and/or the Leviathan discovery in Israel or the Aphrodite Figure 4.5: Nominal Liquefaction Capacity and Utilisation by Country, Sources: IHS Markit, IGU Qatar, 77, 100% Australia, 56.5, 101% Malaysia, 25.7, 97% Algeria, 25.3, 46% Nigeria, 21.9, 85% Indonesia, 25.4, 78% Trinidad, 15.3, 69% Egypt, 12.2, 4% Oman, 10.8, 75% Russia, 10.8, 100% US, 10.5, 48% Yemen, 7.2, 0% Brunei, 7.2, 87% PNG, 6.9, 107% UAE, 5.8, 96% Angola, 5.2, 15% Peru, 4.5, 91% Norway, 4.2, 103% Eq. Guinea, 3.7, 93% Figure 4.6: Liquefaction Capacity by Type of Process, MTPA % 14% 15% 47% 40% AP-C3MR AP-C3MR/SplitMR Linde MFC Other Source: IHS Markit 23% 22% 11% AP-X COP Opt. Cascade Shell Proprietary 8 Utilisation is calculated based on prorated capacity. 9 Estimated recoverable reserves. Gas in place reserves are estimated at approximately 30 Tcf. 22
25 discovery in Cyprus is partly monetized via Egypt s LNG infrastructure through a shared arrangement. Oman has announced it intends to decommission its export projects by 2025 to fulfil domestic demand. Discussions occurred throughout 2016 regarding a potential 1 billion cubic feet per day (Bcfd) gas agreement with Iran, which may backfill a portion of Oman LNG. The pipeline, with an estimated cost of $1-1.5 billion, needs to be rerouted to bypass the UAE s Exclusive Economic Zone, and negotiations over gas pricing remain a hurdle. The UAE is also considering various options to meet growing demand, including potentially decommissioning some of the ADGAS trains, when the project s long-term contracts expire in Liquefaction Processes The choice of liquefaction processes has become increasingly diverse in recent years. A number of designs have focused on new concepts, such as smaller and floating liquefaction trains. Air Products liquefaction processes accounted for nearly 80% of existing plants in 2016 (see Figure 4.6): the AP-C3MR process held the greatest share at 47%, followed by the AP-X (15%) and AP-C3MR/SplitMR (14%) processes. Air Products processes account for 68.2 MTPA (59%) of the MTPA of capacity under construction as of January Cameron LNG and Yamal LNG have selected the AP-C3MR process, while Cove Point, Freeport LNG, Gorgon LNG, Ichthys LNG, and Tangguh LNG T3 use the AP-C3MR/SplitMR design. PFLNG Satu uses the AP-N process. The large-scale AP-X process has thus far been used exclusively in Qatari projects. Air Products is therefore expected to retain its leading position. However, the ConocoPhillips Optimized Cascade process will see strong growth with eight trains (35.9 MTPA of capacity) under construction as of January Sixty percent of the 35.3 MTPA of new capacity that came online since January 2016 utilises the Optimized Cascade process. As a result of its suitability to dry gas, the process has been the top choice for coal-bed methane (CBM) projects in Australia as well as some projects in the US, given their pipeline-quality dry gas feedstock. Other and increasingly smaller-scale processes make up a limited portion of existing and under-construction capacity but may see an increase in market share going forward. The use of these processes may allow developers to begin constructing liquefaction trains offsite, which in turn may help to reduce costs. In North America, multiple projects have been proposed based on small-scale modular liquefaction processes, such as IPSMR (Chart Industries), OSMR (LNG Limited), and PRICO (Black & Veatch). The 2.5 MTPA Elba Island LNG project in the US, which began onsite construction in 2016, will utilise Shell s Movable Modular Liquefaction System (MMLS) process Floating Liquefaction MTPA Proposed FLNG capacity as of January Numerous FLNG projects, particularly small-scale, are under development as the pace of onshore liquefaction proposals has slowed. Four FLNG projects in Australia, Malaysia, and Cameroon totalling 8.7 MTPA were under construction as of January 2017 (see Figure 4.7). The first two projects, PFLNG Satu and Cameroon FLNG, are expected to begin operations in 2017, and all four are scheduled to be online by An additional twenty-four FLNG proposals totalling MTPA have been announced as of January 2017, principally in the US, Canada, and Australia. Others are proposed to be located in the Republic of the Congo, Djibouti, Equatorial Guinea, Indonesia, Iran, Mauritania and Senegal, Mozambique, Papua New Guinea, and Russia. FLNG projects can be based on several development concepts purpose-built, near-shore barge, and conversions. They generally aim to commercialize otherwise stranded gas resources, avoid much of the lengthy permitting and regulatory approvals associated with onshore proposals, and reduce costs with offsite construction. In many cases, they are smaller in capacity compared with onshore proposals. In some instances, FLNG projects reportedly have lower cost Figure 4.7: Under Construction and Total Proposed FLNG Capacity by Country in MTPA and Share of Total, as of January 2017 Under construction Total proposed US, 69, 42% Canada, 44.4, 27% Australia, 24.5, 15% Mozambique, 8.4, 5% Eq. Guinea, 4.4, 3% Djibouti, 3, 2% Australia, 3.6, 41% Malaysia, 2.7, 31% Cameroon, 2.4, 28% Malaysia, 2.7, 2% Mauritania, 2.5, 2% Cameroon, 2.4, 1% Russia, 1.3, 1% Congo (Rep.), 1.2, 1% PNG, 1, 1% Indonesia, 0.8, 0% Notes: Total proposed capacity is inclusive of under-construction capacity. Source: IHS Markit Iran, 0.5, 0% 10 This number is included in the 879 MTPA of total proposed global liquefaction capacity quoted in Section 4.1. Excludes the 8.7 MTPA of FLNG capacity currently under construction. 23
 Sabine Pass LNG (28) Peru LNG (20) Snøhvit LNG (16) Marsa El Brega LNG (2) Arzew/Skikda (5) Atlantic LNG (10) ELNG/Damietta LNG (13)")
26 Figure 4.8: Global Liquefaction Plants, as of January 2017 Kenai LNG (1) Sabine Pass LNG (28) Peru LNG (20) Snøhvit LNG (16) Marsa El Brega LNG (2) Arzew/Skikda (5) Atlantic LNG (10) ELNG/Damietta LNG (13) Nigeria LNG (11) Equatorial Guinea LNG (15) Angola LNG (22) Qatargas/RasGas (9) Oman LNG (12) Yemen LNG (19) ADGAS (4) Bontang LNG (6) Sakhalin 2 LNG (17) Malaysia LNG (7) Brunei LNG (3) Tangguh LNG (18) Donggi-Senoro LNG (25) Pluto LNG (21) Gorgon LNG (29) North West Shelf LNG (8) Darwin LNG (14) Australia Pacific LNG (27) PNG LNG (23) GLNG (26) QCLNG (24) Figure 4.8: Global Liquefaction Plants, as of January Source: IHS Markit
27 Liquefaction in Review Capacity Additions MTPA Year-over-year growth of global liquefaction capacity in 2016 New LNG Exporters 1 Number of new LNG exporters since 2014 US Build-out Begins 9 MTPA Continental US capacity online in 2016 Floating Liquefaction 8.7 MTPA FLNG capacity under construction as of January 2017 Global liquefaction capacity increased from MTPA in 2015 to MTPA in MTPA was under construction as of January MTPA of new liquefaction projects have been proposed as of January 2017, primarily in North America PNG joined the list of countries with LNG export capacity in 2014 A number of project proposals in emerging regions such as Canada and Sub-Saharan Africa could lead to the emergence of several new exporters in coming years Previously expected to be one of the largest LNG importers, 57.6 MTPA of export capacity was under construction in the US as of January MTPA of capacity is proposed in the US, excluding under-construction projects, though a number of projects face commercial obstacles MTPA of floating liquefaction capacity has been proposed. Four projects have been sanctioned, totalling 8.7 MTPA Many proposals announced in the past few years aim to commercialize gas from smaller, stranded offshore fields relatively quickly estimates, though only once projects begin operations will greater cost certainty be established. Three of the four under-construction FLNG projects Prelude (3.6 MTPA), PFLNG Satu (1.2 MTPA), and PFLNG 2 (1.5 MTPA) are utilising purpose-built vessels. As of January 2017, PFLNG Satu was in commissioning, with its first cargo expected shortly. In early 2016, construction of PFLNG 2 was put on hold. The proposed 3.4 MTPA Coral FLNG project offshore Mozambique would use a similar approach and achieved several milestones in 2016 and early 2017 as an offtake agreement was finalised and several of the partners have sanctioned the project. Eni is seeking FID in 2017 and start-up by Cameroon FLNG, a 2.4 MTPA FLNG conversion, was the latest FLNG project to take FID, in Fortuna FLNG in Equatorial Guinea (2.2 MTPA) is seeking FID in In 2016, the cross-border Greater Tortue FLNG project was proposed to commercialize the approximately 15 Tcf field that straddles Mauritania and Senegal. The 2-3 MTPA proposal is also considering a vessel conversion and currently expects to begin exports in The project would be a cross-border development and require alignment between Mauritania and Senegal. There is precedent for cross-border developments with Darwin LNG in Australia, which sources feedstock from the Joint Petroleum Development Area shared between Australia and Timor-Leste. Near-shore, barge-based FLNG developments generally seek to commercialize onshore reserves while minimizing onshore infrastructure. Being permanently moored without navigation ability reduces project complexity. Costs may be relatively lower accordingly, but as with any liquefaction project particularly those seeking to implement a development scheme for the first time there is the potential for design changes. The 0.5 MTPA Caribbean FLNG project offshore Colombia was originally slated to be the first operational floating project. In early 2015 Pacific Rubiales announced delays due to commercial conditions, and the project was cancelled altogether in Exmar is seeking opportunities to place the vessel elsewhere for liquefaction work. In Canada, the Douglas Channel FLNG partners Altagas, Idemitsu, EDF Trading, and Exmar halted development of the project in early Only two under-construction FLNG projects, Prelude and Cameroon FLNG, have announced binding offtake agreements. One proposed project, Coral FLNG, has contracted its full capacity. Given the expected weakness in near-term market fundamentals, uncontracted FLNG projects may face marketing challenges similar to onshore projects. That said, with a smaller parcel size than large land-based projects, some FLNG projects may find it easier to secure offtakers and reach FID in the near term. FLNG project sponsors are increasingly assessing the potential of smaller capacities, which may facilitate the optimization of project costs and attract buyers with smaller volume requirements. For example, the Browse FLNG partners in Australia put the 11 MTPA project on hold in 2016 and are examining smaller-scale options Project Capital Expenditures (CAPEX) 11 Project costs will be an important determinant of which projects are sanctioned as the market oversupply likely deepens in Plant costs vary widely and depend on location, capacity, liquefaction process (including choice of compressor driver), the number of storage tanks, access to skilled labour, and regulatory and permitting costs. Large amounts of steel, cement, and other bulk materials are required. Investment in gas processing varies depending on the composition of the upstream resource. Gas treatment includes acid gas, natural gas liquids (NGL), and mercury 11 CAPEX figures reflect the complete cost of building the liquefaction facilities, including site preparation, gas processing, liquefaction, LNG storage, and other related infrastructure costs. Upstream and financial costs are excluded. 25

28 Sabine Pass LNG Courtesy of Cheniere removal as well as dehydration. Figures 4.9 and 4.12 include additional information on average liquefaction project costs by construction component and expense category. Cost escalation has been considerable, with several projects reporting cost overruns in the range of approximately 30% to 50% relative to estimates at FID. Unit costs 12 for liquefaction plants increased from an average of $413/tonne in the period to $987/tonne from Over the same periods, greenfield projects increased from $507/tonne to $1,389/tonne, while brownfield projects only increased to $532/tonne, up from $329/tonne (see Figure 4.10). The commencement of operations at the first FLNG projects beginning in 2017 will likely provide additional clarity on FLNG costs. With numerous projects starting construction in close succession, higher input and labour costs became common due to global competition for engineering, procurement and construction (EPC) services. Cost escalation has been pervasive in both the Atlantic and Pacific Basins, though Australia has been particularly affected due in part to exchange rate fluctuations and skilled labour shortages. The challenges associated with complex upstream resources and/or difficult operating environments, such as CBM in Eastern Australia, deepwater fields in Asia Pacific, and Arctic environments in Norway and Russia, have contributed to delays at numerous projects, driving up costs. $1,541/tonne Weighted average expected cost for greenfield projects announced to come online between 2017 and 2022 Middle Eastern projects generally remained low-cost in the period, averaging $452/tonne, largely due to the lower cost of brownfield expansions in Qatar. Conversely, projects in both the Pacific and Atlantic Basins experienced significantly higher costs during relative to (see Figure 4.11). The Pacific Basin had the highest increases, with per unit liquefaction costs nearly quadrupling from $347/tonne to $1,373/tonne between the same periods due in part to cost escalation at some projects. The average unit liquefaction cost for Atlantic Basin LNG projects rose to $1,221/tonne from , compared to $461/tonne from Although ultimate FLNG costs are not yet clear, several FLNG projects based on vessel conversion schemes have had lower announced cost estimates relative to onshore greenfield and FLNG newbuild proposals. Figure 4.9: Average Cost Breakdown of Liquefaction Project by Construction Component 13 32% 10% 8% Owner's Costs Engineering However, costs may begin to stabilize going forward due to significant technological advancements that have reduced upstream costs by improving well productivity. Steel costs have fallen dramatically over the last several years and, if sustained, may reduce overall capital expenditure requirements. There has also been greater pressure from project sponsors to optimize EPC costs over the past year in order to increase projects competitiveness in an oversupplied market. 20% 30% Equipment Bulk Materials Construction Source: Oxford Institute for Energy Studies 12 All unit costs are in real 2014 dollars. 13 According to the Oxford Institute for Energy Studies paper, LNG Plant Cost Escalation, equipment costs include the cryogenic heat exchangers, compressors and drivers, power plant, and storage tanks. Bulk materials are assumed to refer to steel and other raw materials. Owner s costs include all technical and commercial components of project management prior to the commencement of operations, including costs associated with contractors/consultants for pre-feed and FEED, environmental impact studies, and contract preparation prior to FID, as well as working with financiers and government and regulatory authorities. 26
29 Figure 4.10: Average Liquefaction Unit Costs in $/tonne (real 2014) by Project Type, $/tonne 1,800 1,600 1,400 1,200 1, Greenfield Brownfield Floating Sources: IHS Markit, Company Announcements Based on cost announcements and the advantages associated with existing infrastructure, brownfield projects will generally be competitive with greenfield developments in terms of unit costs of liquefaction capacity. Five of the six liquefaction projects under construction in the US are brownfield projects associated with existing regasification terminals. Unit costs for these continental US brownfield projects average $807/tonne, well below the $1,508/tonne associated with under-construction greenfield projects globally. Dry gas to be sourced by most US projects will reduce costs by limiting the need for gas treatment infrastructure. In addition, US projects may be less exposed to cost escalation because most EPC contracts associated with the projects were signed on a lump-sum turnkey basis as opposed to the cost-plus contracts used for some global projects. Contractors therefore run the full risk of project cost over-runs. For most projects globally to move forward, developers will need to secure long-term contracts to underpin project financing. Lower oil prices and demand growth in major import markets would in many cases weaken project economics and make this task a more difficult undertaking. In some cases, high costs are expected to be a major source of delay for some greenfield projects. Relatively low upstream development costs reported by some project developers could potentially improve economics. Apart from high liquefaction costs, greenfield projects proposed in Western Canada and Alaska require lengthy (300 miles or more) pipeline infrastructure. Integrated Western Canadian projects have announced cost estimates of up to $40 billion, while in Alaska the estimate was revised downward in 2016 to approximately $45 billion from $45-65 billion previously. Figure 4.11: Average Liquefaction Unit Costs in $/tonne (real 2014) by Basin and Project Type, $/tonne 3,000 2,500 2,000 1,500 1, Brownfield Greenfield Floating Brownfield Sources: IHS Markit, Company Announcements Greenfield Floating Brownfield Greenfield Pacific Atlantic-Mediterranean Middle East 4.7. Risks to Project Development As with other major infrastructure projects, liquefaction plants face a variety of commercial, political, regulatory, and macroeconomic risks that may affect the pace of project development. In the case of liquefaction projects, these include project economics, politics and geopolitics, environmental regulation, partner priorities and partners ability to execute, business cycles, domestic gas needs and fuel competition, feedstock availability, and marketing and contracting challenges. Low oil prices and the expectation of challenging market conditions for project sponsors over the next several years have in particular highlighted risks associated with project economics, partner priorities, and marketing. Timelines for a number of projects, particularly those with high cost estimates and either no buyers or those with uncertain demand requirements, have been pushed back by several years. In 2016, several projects facing such risks were delayed or cancelled, and additional delays or cancellations are possible going forward. Project Economics With high cost estimates a leading obstacle to project development particularly as the LNG market becomes increasingly oversupplied and if oil prices remain low some Figure 4.12: Average Cost Breakdown of Liquefaction Project by Expense Category 27% 1% 7% 3% Gas Treatment Fractionation Liquefaction 28% Refrigeration 20% 14% Utilities Offsites (storage, etc) Site Preparation Source: Oxford Institute for Energy Studies 27
30 project sponsors have sought to optimize costs and, in some cases, development concepts. Especially in emerging liquefaction regions, challenging or uncertain fiscal and regulatory regimes, are an additional risk. Politics, Geopolitics, and Environmental Regulation Political and regulatory risk exists in both developed and developing liquefaction regions, though significant geopolitical risks and instability have tended to be more associated with developing markets. Several developed supply regions have stringent regulatory and environmental approval processes for liquefaction projects, which can be time consuming and costly. For instance, environmental permitting for US brownfield developments has taken nearly two years or more. Other countries, such as Tanzania, are still developing regulatory and legislative frameworks for LNG in order to provide greater certainty to project sponsors. This process will govern the pace of project development. Political instability and sanctions can affect projects both prior to FID and while they are operational. It has delayed the development of additional liquefaction capacity in Nigeria and several other countries. Ongoing civil war has halted operations at Yemen LNG since early The easing of sanctions against Iran in 2016 has removed some obstacles to foreign investment and participation in Iran s gas sector, and there has been a revived interest in Iranian LNG exports as a result. However, the country s LNG ambitions remain challenged. Sanctions that remain in place prevent Iran from obtaining US-sourced liquefaction technology, which maintains a majority of market share. US companies are still unable to invest in the country s energy sector, and secondary sanctions against non-us entities, such as financial institutions, may complicate financing efforts. Partner Priorities, Ability to Execute, and Business Cycles There must be stakeholder alignment before a project can proceed. Projects with multiple partners must, in some cases, contend with divergent priorities. Smaller companies may be unable or unwilling to commit to investments, particularly for large-scale proposals, while larger players are frequently in the position of choosing between several large opportunities in their respective portfolios. Even for projects with one shareholder, they must consider the project in relation to other options in their portfolio, if applicable. These factors can impact project sanctioning. Moreover, many of the large number of projects proposed in recent years are being developed by new LNG players with no direct experience in liquefaction, particularly in North America. Developers must have the technical, operational, and logistical capabilities to execute a project. Concerns over a company s ability to execute on any component of an LNG project will also make it more difficult for that company to secure sufficient financing and offtakers. Macroeconomic, market conditions and commodity cycles are also considerations in project sanctioning. Low oil prices have caused many companies to reduce capital spending over the past few years, resulting in numerous project deferments, likely pending a price recovery. The number of new project proposals similarly slowed in 2015 and Table 4.1: Liquefaction Project Development Risks Risk Factors Project Economics Politics & Geopolitics Environmental Regulation Partner Priorities Ability to Execute Business Cycle Feedstock Availability Fuel Competition Domestic Gas Needs Marketing/Contracting Impact on LNG Project Development Long-term sales contracts that allow for a sufficient return typically underpin the financing of LNG projects. High project costs or changing market prices can have a large impact on when or if a project is sanctioned, and cost overruns post-fid can impact project returns. Permitting may be time consuming. Federal or local governments may not be supportive of exports and could levy additional taxes on LNG projects or establish stringent local content requirements. Political instability or sanctions could inhibit project development or operations. Regulatory approval may be costly and extends to the approval of upstream development and pipeline construction. Local environmental opposition, including from indigenous groups, may also arise. Not all partners are equally committed to a project and face different constraints depending on their respective portfolios. Ensuring alignment in advance of FID may be difficult. Partners must have the technical, operational, financial, and logistical capabilities to fully execute a project. Certain complex projects may present additional technical hurdles that could impact project feasibility. Larger economic trends (e.g., declining oil prices, economic downturns) could limit project developers' ability or willingness to move forward on a project. The overall availability of gas to supply an LNG project may be limited by technical characteristics of the associated fields or the requirement of long-distance pipelines. Interest in a project may wane if project developers or end-markets instead seek to develop or consume pipeline gas or competing fuels, including coal, oil, or renewables. Countries with high or rising gas demand may choose to use gas domestically rather than for exports. This often results in new or existing liquefaction projects being required to dedicate a share of production to meet domestic demand. In some cases, it may also limit the life of existing projects. Project developers generally need to secure long-term LNG buyers for a large portion of project capacity before sanctioning a project. Evolving or uncertain market dynamics may make this task more difficult. Source: IHS Markit 28

31 Chevron LNG Journey to Gorgon. Courtesy of Chevron Shifts in country-specific demand fundamentals (e.g., economic downturn in China or deregulation in the Japanese power and gas sectors) have increased the uncertainty of several countries LNG import requirements. With strong supply additions and unpredictable demand in key markets, buyers remain hesitant of new long-term obligations. Feedstock Availability, Domestic Gas Needs, and Fuel Competition Countries with declining production and growing demand have tended to prioritize gas for domestic consumption over LNG exports. Feedstock originally allocated to Egypt s export plants has been mostly diverted to the domestic market, resulting in the closure of Damietta LNG in late 2012 and the cessation of exports at ELNG in 2014 though ELNG did resume small exports in While production from fields associated with these projects is set to continue to decline over time, the West Nile Delta and Zohr developments could potentially revive domestic production growth in the longer term. Both are expected to commence production in Additional successful exploration efforts in surrounding areas and/or the Leviathan and Aphrodite discoveries could alleviate feedstock constraints if monetized partially via Egypt. Growing domestic demand and declining domestic production has also impacted Indonesia, UAE, Malaysia, Oman, and Trinidad, which may eventually result in lower LNG exports or, in some cases, exports being halted. New or brownfield export proposals, including those in Malaysia, Mexico, and Algeria may also be impacted. Additionally, feedstock challenges in Eastern Australia may impact utilisation of the three CBM-to- LNG projects in Gladstone and have led to LNG imports being proposed. Certain drilling restrictions and capital spending reductions have hindered domestic production growth while significant volumes have been contracted for export as LNG. Additionally, the competitiveness of LNG relative to pipeline gas (if applicable) and alternate fuels both in terms of project returns and downstream economics remains a major factor that can affect liquefaction project investment decisions. Marketing and Contracting With liquefaction capacity set to expand to more than 450 MTPA by 2020, mainly due to growth from under-construction projects in Australia and the US, there will be greater competition amongst proposed projects to secure long-term buyers. Some under-construction projects have also not yet signed offtake contracts for their full capacities. Shorter-term contracts have become increasingly common over the last several years as a number of new buyers have entered the market. In some cases, the anticipated LNG surplus has reduced buyers interest in long-term contracting, at least for the time being. In many cases, however, longer-term agreements will be necessary for projects to secure financing. Some buyers desire greater diversity in pricing structures, and a growing number of contracts, which have traditionally been linked to oil, show multiple oil, gas, and other benchmarks. Companies that have traditionally served as foundational buyers, such as aggregators, may have portfolios that may require or benefit from full destination flexibility in their contracts. The amount of flexible-destination LNG on the market is expected to increase significantly, in part driven by US offtake agreements that are free of destination restrictions. Additionally, Japan in 2016 began an investigation of destination restrictions in its contracts and may seek to remove them; it is also likely to pursue only destination-flexible contracts moving forward. Fixed-destination contracts actually became prominent again in 2016 as a number of new contracts and tenders were awarded by buyers seeking volumes for their own markets. In a number of cases, these were buyers in emerging markets. As the pace of FIDs increases again, the split between fixed- and flexible-destination contracts may evolve further. The emergence of the US as a major LNG supply source will increase the prominence of the tolling model, in which the market risk is shifted to the tolling customer. Most US projects are being developed as pure or hybrid tolling facilities. In reserving capacity, the tolling customer agrees to pay a flat 29

32 liquefaction fee to the terminal owner for the life of the contract, regardless of whether it elects to actually offtake volumes. In a hybrid model, the project owner additionally procures feedstock on behalf of the offtaker and charges a marketing and transportation margin above a benchmark price, such as Henry Hub. While the take-or-pay model offers developers and lenders greater revenue certainty, tolling customers face financial exposure if price fluctuations or changing demand fundamentals incentivize them to turn away cargoes Update on New Liquefaction Plays Despite market headwinds, there was significant commercial and regulatory progress made in several emerging liquefaction regions during However, the potential for sustained low oil prices and continued expectations of an LNG oversupply are testing projects competitiveness globally, and the number of new project proposals similarly slowed in 2015 and Although regulatory certainty generally improved in 2016, remaining political risks also have the potential to lengthen development timelines in several regions. United States In 2016, the continental US began exporting LNG for the first time. 14 Two trains totalling 9.5 MTPA at Sabine Pass LNG were operational as of January 2017, and six projects totalling 57.6 MTPA of capacity were under construction as of January The US has been widely perceived as among the lowest-cost sources of LNG on a long-term basis due to the brownfield nature of many developments 15 and relatively inexpensive feedstock. In the near term, however, the competitiveness of Henry Hub-linked LNG is a major development risk for US projects that have not reached FID. Over the past two years, the price differential between oil-linked and Henry Hub-linked contracts has narrowed, though price differentials will widen should oil prices continue to recover. Low oil prices have also caused many companies to reduce capital spending, resulting in numerous project deferments. Figure 4.13: Post-FID Liquefaction Capacity Build-Out, MTPA Other Qatar Australia United States Note: This build-out only takes into account existing and under construction projects. Sources: IHS Markit, Company Announcements Only 10 MTPA of binding and non-binding offtake agreements were signed in 2016 through January 2017, out of approximately 102 MTPA 16 in total from US projects so far. Given market conditions, it may be difficult for projects to proceed in the near term. Lake Charles LNG delayed FID in 2016, though its capacity is fully subscribed by one aggregator. No new FID date has been specified. Several other uncontracted or partially contracted projects were delayed or cancelled during 2016 due in part to marketing challenges. In light of these challenges, some US project sponsors have demonstrated considerable commercial flexibility. Some have considered low tolling fees and alternative pricing structures; others have made or are considering making downstream investments in order to provide a market for their LNG. Tellurian, sponsor of the 26 MTPA Driftwood LNG project, secured multiple equity investments in 2016, including from TOTAL. Regulatory certainty has increased but remains timeconsuming and costly, though some expansion trains at Chevron LNG Hook-up Courtesy of Chevron 14 Excluding previous re-exports of imported LNG. 15 Five of the six projects under construction are brownfield projects associated with existing regasification terminals, while the sixth is a former regasification proposal. 16 Excludes contracts deemed to have been cancelled or lapsed, those with unknown counterparties, as well as Cheniere Marketing s options to take volumes not required by other customers at Sabine Pass and Corpus Christi LNG. 30
33 projects already under construction may be able to complete the regulatory process more quickly. US LNG export projects need to receive two major sets of regulatory approvals to move forward: environmental/construction approval, primarily from the Federal Energy Regulatory Commission (FERC), and export approval from the Department of Energy (DOE). 17 Eleven 18 projects have now moved through the FERC environmental review process, including four in 2016: Cameron LNG T4-5, Elba Island, Golden Pass, and Magnolia LNG. While there is greater clarity regarding expected timelines and costs, FERC also denied approval of an LNG export project for the first time in FERC did not approve the 6 MTPA Jordan Cove LNG project and its associated pipeline, citing concerns that the pipeline had not demonstrated sufficient commercial need to outweigh landowner concerns. After an unsuccessful appeal, the sponsor plans to submit a new application. Most other projects in the continental US do not require significant new pipeline infrastructure and so may be less likely to face the same obstacles. Canada In contrast to most US projects, nearly all projects proposed in Canada, with the exception of Canaport LNG, are greenfield developments. A number of them require lengthy pipeline infrastructure and plan to utilise an integrated structure, in which partners upstream resources are dedicated as feedstock for the project. In some cases, these factors have contributed to higher cost estimates at Canadian projects relative to proposals elsewhere. The inability to secure buyers has been a major impediment to the development of many LNG projects in Western Canada. To date, few binding offtake contracts elsewhere have been signed, though several projects have offtakers as equity partners. Decisions to reduce capital spending, combined with the availability of potentially more cost-effective sources of supply and weakened demand growth in some buyers home markets, has reduced momentum and contributed to delays and cancellations at several projects. In 2016, LNG Canada postponed FID to an undetermined date, citing capital spending considerations. After receiving a long-delayed environmental approval in 2016, Pacific Northwest LNG is currently undertaking a full review of the project before determining whether to proceed. It previously reached a conditional FID in Partners at both projects plan to offtake volumes in proportion to their equity stakes. Douglas Channel FLNG halted development in early 2016, and the nascent Triton FLNG proposal was stalled several months later. An internationally-focused expansion to 3 MTPA of the Tilbury LNG facility, an existing micro-scale plant serving local and regional markets, was scrapped after its contract to supply Hawaii Electric lapsed. In Q4 2016, Woodfibre LNG (2.1 MTPA) announced that its parent company had authorized funding. This is unusual in that the project is still in the FEED phase and has not fully completed the regulatory process or concluded binding offtake agreements. Canada s environmental approval process is fairly well established but is nonetheless rigorous. Approval must be obtained from each First Nations groups impacted by the projects, including those along associated pipeline routes. In some instances, First Nations and other local opposition has emerged as a significant hurdle. In Canada, projects must receive environmental and export approval from the Canadian Environmental Assessment Agency (CEAA) and the National Energy Board (NEB), respectively. In some cases, a provincial environmental assessment can be a substitute for a federal environmental assessment. Reviews generally take nearly two years to complete, though the review of Pacific Northwest LNG, had faced significant delays prior to receiving environmental approval in September Kitimat LNG also has all environmental approvals and is working toward further development, with no announced FID date. Only a few projects have been approved, with most proposals yet to begin the process. In 2016, the Canadian federal government announced its intention to incorporate direct and upstream greenhouse gas emissions into its environmental review process. In some cases, a provincial environmental assessment can substitute the federal environmental assessment process. Table 4.2: Nominal Liquefaction Capacity by Region in 2010, 2016, and 2022 Region (Anticipated) % Growth (Actual) % Growth (Anticipated) Africa % 4% Asia Pacific % 34% Europe % 0% FSU % 153% Latin America % 0% North America % 534% Middle East % 0% Total Capacity % 35% Note: Liquefaction capacity only refers to existing and under construction projects. Sources: IHS Markit, Company Announcements 17 DOE approval has two phases. Approval to export to countries with which the US holds a free trade agreement (FTA) is issued essentially automatically. For non-fta approved countries, a permit will be issued only after the project receives full FERC approval. 18 Sabine Pass LNG T5-6 and Cameron T4-5 are counted separately from their initial phases. 31
34 Figure 4.14: Liquefaction Capacity by Region in 2010, 2016, and 2022 MTPA Note: Liquefaction capacity only refers to existing and under-construction projects. Sources: IHS Markit, Company Announcements The British Columbia government provided clarity on taxation in 2014 and 2015 via a new LNG export-specific tax and royalty regime. Previously a major uncertainty, these steps are unlikely to have a major impact on the overall pace of project development, as evidenced by the reduced commercial momentum in Projects totalling 47.5 MTPA of capacity 19 have also been proposed in Eastern Canada. Given long shipping distances to Asia, most projects appear to be targeting European importers. However, only Goldboro LNG has secured a binding offtake agreement with Uniper. Most of the East Coast projects also depend on pipeline reversal and capacity expansion, subject to regulatory approval from both Canada and the US. East Africa Since 2010, large offshore dry gas discoveries have underpinned several floating and onshore proposals in Mozambique and Tanzania totalling more than 73 MTPA of capacity. The region has significant potential to become a major LNG supplier. However, higher midstream costs and dry gas reserves may translate to higher breakeven costs, which could slow the pace of development during a period of LNG surplus. That said, projects in Mozambique gained momentum in Area 4 s Coral FLNG project owned by Eni, KOGAS, CNPC, Galp Energia, and Empresa Nacional de Hidrocarbonetos (ENH) has its entire capacity contracted to BP and FID may be imminent as several of the partners have already sanctioned the project. Toward the end of 2016, Area 1 partners Anadarko, Mitsui, ONGC Videsh, Oil India, Bharat Petroleum, PTT, and ENH formally submitted their Development Plan to the Government of Mozambique for a two-train 12 MTPA onshore liquefaction project. While both governments support the development of liquefaction projects and have actively worked to establish gasspecific legislation, projects in Mozambique and Tanzania face some political risks. The Mozambique government in 2014 set out constructive taxation terms and required companies developing LNG proposals to submit plans for unitisation, which occurred in late Contractual amendments in Q and an approved resettlement plan build on the progress made in previous years and may facilitate the financing of 19 See Appendix 3 on page 69 Africa Asia Pacific Europe FSU Latin America North America Middle East (Anticipated) two projects based on standalone reserves. The government also recently agreed to allow the marketing and sale of LNG volumes collectively by the Area 1 project consortium, which will facilitate offtake agreements. The country s ongoing debt crisis is a potential obstacle, though in Q an agreement was reached to fund the equity share of ENH, the Mozambique national oil company (NOC), for the two most advanced projects. Repayments will be made with profits from future LNG sales. Regulatory challenges, in conjunction with potentially divergent partner priorities, may slow progress in Tanzania. In 2015, the government enacted the first of a series of oil and gas policy and regulatory reforms, which must be implemented before projects can reach FID. The Petroleum Bill, passed in 2015, provides more regulatory independence and establishes royalty and profit-sharing rates; additional bills are still under consideration. A new gas policy has also been approved, but a formal law regarding the country s Gas Master Plan must still be passed. West Africa Over the last few years, West Africa has emerged as an important region for the deployment of small-scale floating liquefaction. While small in terms of capacity, commercial momentum achieved during the last two years indicates the ability of some projects to potentially move forward in an oversupplied market. The last project to reach FID in sub-saharan Africa was Cameroon FLNG (2.4 MTPA) in In Equatorial Guinea, the 2.2 MTPA Fortuna FLNG project, also based on a vessel conversion, announced significant cost reductions and advanced offtake discussions during Proposed in 2016, the 2-3 MTPA Greater Tortue FLNG project on the maritime border between Mauritania and Senegal has made notable progress in a short time. The project aims to rapidly commercialize a portion of 15 Tcf of gas resources. The developer has indicated additional FLNG vessels or potentially a larger, onshore component could be utilised to monetize potential future discoveries. Government and project stakeholders currently appear to be aligned, with unitisation negotiations having occurred. The sponsor has also been negotiating the use of a vessel conversion and has attracted a 32
35 major equity investment from BP. Greater Tortue FLNG would be the first cross-border liquefaction project ever developed, and so it is possible the project could face additional complexities. In Nigeria, a revised development concept was announced in 2016 for a proposed two-train expansion at NLNG. The project is now evaluating smaller 4.3 MMtpa trains instead of the 8.4 MMtpa megatrains previously planned. The 10 MTPA Brass LNG project is undergoing a planning review by partners Nigerian National Petroleum Corporation (NNPC), TOTAL, and Eni. Russia Located in a challenging geographical region, the Yamal LNG (16.5 MTPA) project remains under construction in Russia. Due to the imposition of US and EU sanctions on Russia, the project had previously faced financing challenges but resolved these and completed financing in In December 2015, Silk Road Fund (China) acquired a 9.9% equity stake. Several other proposals in the country remain longer-term opportunities and may face similar challenges if sanctions remain in place. A third train at Sakhalin-2 LNG in Russia s Far East, for instance, has been delayed in part by sanctions imposed against the development of the Yuzhno-Kirinskoye field, a key source of feedstock for the expansion. Yamal LNG operator Novatek is in the early stages of evaluating an Arctic LNG-2 project, and so the specific impact of sanctions, if any, remains to be seen. Australia Beyond the ongoing capacity buildout, additional greenfield projects and brownfield expansion trains have been proposed on Australia s East and West coasts, based on CBM and conventional off-shore resources, respectively. With costs likely to remain high, the challenges associated with CBM-to- LNG production, and an anticipated market oversupply, many proposals face challenges and are unlikely to advance in the near term; several have been delayed or cancelled. There is also growing concern that exports from the CBM-to-LNG projects are causing gas shortages in the Australian market that have at times led to domestic price surges. There have been proposals to backfill existing trains that have declining feedstock supply. Doing so may offer more attractive economics relative to using those resources to develop additional trains or greenfield projects. Apart from the under-construction Prelude FLNG, most floating proposals in Australia are considered longer-term options. In Q1 2016, the Browse FLNG partners decided not to pursue an 11 MMtpa concept and are evaluating a smaller-scale development concept. Eastern Mediterranean Depending on the monetization method, the Leviathan and Aphrodite developments, as well as any major future discoveries in the Eastern Mediterranean, may facilitate the region regaining its potential as a major new source of LNG supply. The Zohr and West Nile Delta developments in Egypt are likely to be used to meet domestic consumption and may help alleviate the constraints that domestic demand has placed on LNG exports from Egypt. Momentum in the region had slowed owing to a greater focus on pipeline exports, significant regulatory uncertainty over upstream licenses, and the prioritization of gas for domestic uses. Political hurdles also remain, especially regarding development schemes that may require significant crossborder cooperation and infrastructure. The Leviathan development in Israel advanced in 2016, signing several gas sales agreements; an FID is planned for Various commercialization options have been proposed for additional Leviathan production, including LNG exports via Egypt. Developments elsewhere in the Eastern Mediterranean, such as Aphrodite in Cyprus, or future discoveries could also transform the region into a major liquefaction play or potentially provide feedstock for LNG exports from Egypt; however, progress is still at an early stage, and there are numerous political and commercial challenges. Looking Ahead To what extent will the expected liquefaction capacity surplus be realized in 2017? Delays and production outages at several projects dampened the effect of the anticipated oversupply in With approximately 48 MTPA of capacity expected online in 2017 across a diverse range of suppliers, it is likely that only major construction delays or a significant production outage could cause a market imbalance. Will project sponsors commit to new liquefaction investment in the near term? Project developers postponed or cancelled a number of projects in 2016 due to spending constraints and marketing difficulties. While project sanctioning activity is expected to continue to remain low in 2017, it is likely that some projects will reach FID in what is anticipated to be a low- LNG price environment. FIDs may occur for a variety of reasons based on the considerations of individual companies portfolios. The recent agreement between OPEC and Russia to cut production provided oil price support, and by extension, to energy markets. As a result, more LNG investment is likely after two years of tight fiscal restraint. Some larger players may have long time horizons and be able to position counter-cyclically. Although many traditional buyers general hesitancy to commit to long-term offtake is likely to continue in 2017, some smaller-scale or lower-cost projects may find it easier to contract their capacities and potentially move forward. Will floating LNG gain additional traction in an anticipated low-price environment? The proposed benefits of FLNG, including lower cost structures and the potential ability to be diverted to other markets, will begin to be tested in With the first FLNG unit, PFLNG Satu, expected to export its first cargo in 2017, the performance and ultimate cost of the first FLNG projects, mostly largerscale and purpose-built, will in part determine the scale at which FLNG is adopted. The market will similarly look to the performance of the first FLNG projects based on vessel conversions and barges once they begin operations. It is not yet clear the extent to which delays at several FLNG projects may impact costs. 33

36 Chevron LNG Gorgon Pilot Boat Trip Courtesy of Chevron

37 5. LNG Carriers LNG shipping has evolved in response to significant changes in the LNG market over the past decade. Spot charter rates hit historic highs in 2012 following the Fukushima disaster, but have since fallen drastically to where the market currently stands facing historic lows. The LNG shipping sector, like most shipping markets, is cyclical in nature and 2016 continued the trend from the previous year, marking historic lows in spot charter rates as new tonnage enters an already over supplied market. Average estimated spot charter rates for steam vessels fell below $20,000/day for a period of time during the year, with rates ultimately averaging ~$20,500/day. Average dualfuel diesel electric (DFDE)/ tri-fuel diesel electric (TFDE) day rates dipped to ~$33,500/day as demand for Atlantic volumes in the Pacific Basin continued to decrease, resulting in a more regionalized LNG trade. The continuous wave of newbuilds hitting the market in 2017 will further push the LNG shipping market deeper into a period of oversupply, maintaining the current trend for spot charter rates in the near term. However, we will see a more substantial increase in new liquefaction capacity come online during 2017, which could potentially absorb some of the excess capacity Overview At the end of 2016, there were a total of 439 LNG tankers in the global LNG fleet, either actively trading or sitting idle available for work. 1 Of these vessels, 23 are currently chartered as FSRUs and three are chartered as floating storage units. Throughout the year, a total of 31 newbuilds (including two FSRUs) were delivered from shipyards, a 7% increase when compared to 2015 (see Figure 5.1). The newbuilds entering the market during 2016 were much more aligned with liquefaction growth than the previous year, when 29 newbuilds were delivered to a meagre 4.7 MTPA of new liquefaction capacity. Throughout 2016 a total of 26.5 MTPA of new liquefaction capacity was brought online, however, the accumulation of the tonnage buildout from previous years continued to overwhelm the market, keeping rates at historic lows. The growth in shipping tonnage entering the market, which began back in early 2013, has continued through This buildout of new tonnage has consistently outpaced the incremental growth in globally traded LNG during this period, which has been reflected in the strong decline in charter rates. Unlike newbuild construction cycles of the past, this current cycle includes a significant number of tankers that were ordered on a speculative basis, not tied to any specific project. 439 vessels Number of active LNG vessels (including chartered FSRUs) at end-2016 Tanker storage capacity continues to grow as charterers prefer larger tankers that reduce the unit cost of transported LNG. The average LNG storage capacity for a newbuild delivered during 2016 was around 168,000 cubic meter (cm), compared to 153,000 cm for the global LNG fleet in 2015 (144,000 cm if we exclude Q-Flex & Q-Max tankers). Dynagas Clean Vision - Courtesy of Dynagas 1 For the purposes of this report, only LNG vessels with a capacity greater than 60,000 cm are considered part of the global fleet and included in this analysis. All vessels below 60,000 cm are considered small-scale. 35

38 Figure 5.1: Global LNG Fleet by Year of Delivery versus Average Vessel Size # of vessels Ice Breakers Q-Flex Q-Max Conventional Average delivered vessel size As of end-2016, the order book included 121 tankers expected to be delivered through 2022, of which 6 were ordered during 2016; a significant decrease from the 28 tankers ordered in the prior year. 2 The slowdown in newbuild orders coincides with the slowdown in liquefaction project FIDs being reached. Only 66% of the tankers currently on the order book are tied to a specific charterer, leaving many options for potential project offtakers (see Figure 5.2). In 2017, an additional 55 tankers (including 4 FSRUs, 1 FLNG unit, and 1 converted FLNG unit) will be delivered from shipyards, while an additional 36.8 MTPA of new liquefaction capacity is expected to come online. Despite the increase in liquefaction capacity start-ups, the concurrent rise in vessel deliveries will maintain the ongoing mismatch in tonnage availability to liquefaction capacity, keeping charter rates at their historic lows. With the Panama Canal expansion finally completed, 91% of the global LNG fleet can now pass through the canal. However, the long awaited expansion has not become the gateway to Asia as many thought it would. Following the expansion of the Panama Canal in mid-2016, most volumes passing through have been delivered into the Latin American markets; Chile s Quintero and Mejillones LNG terminal as well as Mexico s west coast terminal of Manzanillo. However, there was an uptick in Forecast Source: IHS Markit mcm Figure 5.2: Estimated Future Conventional Vessel Deliveries, # of vessels Available Note: Available = currently open for charter. Source: IHS Markit 9 Term chartered volumes transiting the canal towards Asia in December. This was a result of the arbitrage between the Atlantic Basin and the Far East opening up, prompting traders to move volumes west through the canal. When the winter demand season comes to an end and the arbitrage closes, we could see cargo flows return to previous regionalized trading patterns, which will ultimately exacerbate the saturated tanker market. The one bright spot in the LNG shipping sector are FSRUs, which are in high demand at the moment. Project developers are starting to look towards emerging markets as the answer to the LNG supply glut. FSRUs are ideal for markets that have stagnant or dwindling domestic gas production, or are looking to switch from expensive liquid fuels to gas in a relatively short period of time with limited capital expenditures. Some shipowners have even started the process of ordering long-lead items for the potential conversion of an existing tanker. Once these long-lead items are delivered, a shipyard can complete a conversion in 6 to 8 months. In the two months of 2017, there have already been three confirmed FSRU orders placed. Two of the FSRUs were ordered by Hoegh LNG in January one earmarked for Ghana s Tema LNG project and the other ordered on spec while the other was placed for a firm unit (plus an option for a second) by Kolin Construction, a company new to the FSRU business. Cardiff TMS Kita LNG LNG Carrier Courtesy of Cardiff TMS 2 As with existing vessels, only LNG vessels with a capacity greater than 60,000 cm are included in the analysis of the order book. All vessels below 60,000 cm are considered small-scale. 36
39 Figure 5.3: Existing Fleet by Containment Type, end-2016 Figure 5.4: Existing and On Order LNG Fleet by Propulsion Type, end % 27% 75% 73% Membrane-type Moss-type 50% 25% Source: IHS Markit Older tonnage is also being earmarked for projects where vessels will be used as floating storage units. In 2016, the Golar Arctic was positioned off the coast of Jamaica, where it is being utilised for breakbulk operations; the much smaller Coral Anthelia loads volumes off the Golar Arctic via a shipto-ship transfer and then sails to Montego Bay to discharge at the regasification plant. Malta s first regasification project is also using a floating storage unit; the Armada LNG Mediterrana (formerly the Wakaba Maru) is moored in the Marsaxlokk port, where it sends volumes onshore to the regasification plant Vessel Characteristics Containment Systems. Two different designs were initially developed for LNG containment on vessels: the Moss Rosenberg design and the membrane-tank system using thin, flexible membranes supported only by the insulated hull structure. The Moss Rosenberg design started in 1971 and is well known by its independent spherical tanks that often have the top half exposed on LNG carriers. The Membranetype has multiple designs from different companies, though the most common have been designed by Gaztransport and Technigaz (GTT) 3. The GTT Mark V membrane system, their newest design with a very low boil-off rate of around 0.08%, saw its first order in Q by Gaslog. The 180,000 cm tanker will be built at the Samsung Heavy Industry ship yard and delivered in A new version of the membrane containment design, KC-1, has been developed by Kogas; it will be installed on two vessels ordered by SK Shipping. At the end of 2016, 74% of the active fleet had a Membrane-type containment system (see Figure 5.3), which also continues to lead the orderbook as the preferred containment option for 93% of vessels on order. Both tank systems rely on expensive insulation to keep the LNG cold during the voyage and minimize evaporation. Nevertheless, an amount equivalent up to roughly 0.15% of the cargo evaporates per day. However, the rate of the boil off gas (BOG) is ultimately determined by the insulation of the LNG carrier, which in turn varies according to the containment system. Newer vessels are designed with lower BOG rates, with the best-in-class purporting rates as low as 0.08%. 0% Active Fleet Order Book Undecided Steam Reheat XDF ME-GI SSD TFDE DFDE Steam Source: IHS Markit Propulsion Systems.To keep the tank pressure close to atmospheric conditions per design conditions, this boil-off gas has to be released from the tanks, and has generally been used for fuelling the ships steam-turbine propulsion systems which are reliable, but not optimal. Since the turn of the millennium, however, these systems specific to LNG carriers have undergone major innovations and enhancements, particularly to reduce fuel cost during an LNG voyage. With a rise in bunker costs during the 2000s, the issue of fuel cost became ever more critical. Attempting to reconcile the objective of low fuel consumption with the necessity of consuming the BOG, innovative systems have taken a variety of approaches, depending on the specific transport concept, such as the carrying capacity, vessel speed, the duration of its potential voyages, and other voyage-specific factors. Any comparison of alternative concepts of LNG carrier propulsion and auxiliary energy generation must consider the overall complexity of LNG transport. Today, LNG carrier operators can choose between the following systems: Steam Turbines. Steam turbines are the traditional propulsion system of LNG carriers. Usually two boilers generate sufficient steam for the main propulsion turbines and auxiliary engines. The boilers can also be partially or fully fuelled with heavy fuel oil. One important advantage of the steam turbine system is the fact that no gas combustion unit is necessary; all BOG is used in the boilers. The maintenance and other operating costs are considerably lower with steam propulsion systems when compared to other systems due to the simple design with BOG from the LNG. On the other hand, low thermal efficiency and resulting higher cargo transport costs are clear disadvantages. Large LNG carriers require more power than existing steam turbine designs can deliver. Moreover, manning the vessels with engineers that are qualified to operate steam-turbine systems 3 GTT was formed in 1994 out of the merger between Gaztransport and Technigaz. Both companies had previous experience in designing and developing LNG carrier technologies. 37
40 is getting more difficult as this technology loses market share and fewer seamen pursue this qualification. Dual-Fuel Diesel Electric (DFDE). After almost forty years of the LNG fleet consisting entirely of steam turbine propulsion systems, GDF SUEZ (now ENGIE) ordered the first LNG carriers to be powered by DFDE propulsion systems in DFDE systems are able to burn both diesel oil and BOG improving vessel efficiency by around 25-30% over the traditional steam-turbines. DFDE propulsion systems are equipped with an electric propulsion system powered by dual-fuel, medium-speed diesel engines. In gas mode, these dual-fuel engines run on low-pressure natural gas with a small amount of diesel used as a liquid spark. The engine operators can switch to traditional marine diesel at any time. These propulsion systems must be equipped to handle excess BOG. In contrast to steam propulsions, a Gas Combustion Unit (GCU) is necessary as it offers an appropriate means to burn the BOG when necessary. In addition, a GCU is needed to dispose of residual gas from the cargo tanks prior to inspection. The additional equipment needed for the BOG increases the amount of maintenance needed for the engines. Tri-Fuel Diesel Electric (TFDE). Shortly after the adoption of DFDE systems, TFDE vessels those able to burn heavy fuel oil, diesel oil, and gas offered a further improvement to operating flexibility with the ability to optimize efficiency at various speeds. While the existing fleet is still dominated by the legacy steam propulsion system, almost 25% of active vessels are equipped with TFDE propulsion systems. Additionally, the orderbook consists of over 28% of vessels planned with TFDE systems (see Figure 5.4). Slow-Speed Diesel (SSD) with a BOG Re-liquefaction Plant. Another propulsion system was introduced to the LNG shipping industry in the mid-2000s, primarily developed in tandem with the Qatari megatrain projects. Instead of using BOG to generate propulsion and/or electric energy, vessels are propelled by conventional low-speed diesel engines consuming heavy fuel oil (HFO) or marine diesel oil (MDO) generator sets. The boil-off gas is instead entirely re-liquefied and fed back into the cargo tanks. An additional GCU allows BOG to be burned when necessary. This system permits LNG to be transported without any loss of cargo which can be advantageous especially if HFO or MDO is comparatively cheaper than burning BOG for propulsion fuel. During ballast voyages, the cargo tank temperature is maintained by spraying re-liquefied LNG back into the cargo tanks. This helps reduce the initial increase of BOG on laden voyages. The entirety of the Q-Class is equipped with this propulsion type. M-type, Electronically Controlled, Gas Injection (ME-GI). Around 37% of vessels in the orderbook are designated to adopt the newest innovation in LNG carrier engine design: the ME-GI engine, which utilise high pressure slow-speed gasinjection engines. Unlike the Q-Class which cannot accept BOG in the engine, ME-GI engines optimize the capability of slow speed engines by running directly off BOG or fuel oil if necessary instead of only reliquefying the gas. This flexibility allows for better economic optimization at any point in time. Figure 5.5: Active Global LNG Fleet by Capacity and Age, end-2015 # of vessels Source: IHS Markit A 170,000 cm, ME-GI LNG carrier operating at design speed and fully laden in gas mode will consume around 15-20% less fuel than the same vessel with a TFDE propulsion system. The ME-GI propulsion system now accounts for almost as many vessels in the order book as TFDE/DFDE tankers. The more fuel efficient propulsion system seems to be gaining traction amongst ship owners as the bulk of the most recent newbuild orders have been placed for vessels with the ME-GI propulsion system. Currently in the global LNG fleet there are nine tankers utilizing this propulsion system, with another 20 expected to be delivered in Wärtsilä Low-Pressure Two-Stroke Engine. Wärtsilä introduced its low-speed two-stroke dual-fuel engine in This alternative to DFDE propulsion systems is estimated to offer capital expenditure reductions of 15-20% via a simpler and lower cost LNG and gas handling system. Significant gains are reportedly achieved by eliminating the high pressure gas compression system. In addition, the nitrogen oxides (NOX) abatement systems may not be required. Others. In order to improve the performance of a traditional steam-turbine propulsion system, the Steam Reheat engine design was developed. The design is based on a reheat cycle, where the steam used in the turbine is reheated to improve its efficiency. This improvement in the steam adaptation maintained the benefits of the simple steam-turbine while improving overall engine efficiency. Table 5.1: Propulsion Type and Associated Characteristics Propulsion Type Fuel Consumption (tonnes/day) Average vessel capacity Typical Age Steam 175 <150,000 >10 DFDE/TFDE ,000- <10 180,000 ME-GI , ,000 <1 Steam Re-heat 235 Source: IHS Markit < >39 vessel age (years) > 180,000 cm , , , ,000 cm 125, ,999 cm 30, ,999 cm 6 Not Active 38

41 LNG Trade in Review Global LNG Fleet +29 Conventional carriers added to the global fleet in 2016 Propulsion systems ~30% Active vessels with DFDE/TFDE propulsion systems Charter Market $20,500 TFDE /DFDE $33,500 Spot charter rate per day in 2016 Orderbook Growth +6 Conventional carriers ordered in The active fleet expanded to 439 carriers in 2016 The average ship capacity of newbuilds in 2016 increased by 4.5% to 170,660 cm compared to the average in 2015 Two vessels both over 35 years of age were scrapped in 2016 In 2015, over 72% of the fleet was steam-based; by 2016, DFDE/TFDE ships accounted for over 30% of the fleet The orderbook has a variety of vessels with new propulsion systems including ME-GI, and Steam Reheat designs The increase in cross-basin trade following the years after the 2011 Fukushima crisis prompted spot charter rates to skyrocket in 2013 to over $100,000/day Between , +90 vessels entered the market during a period of minimal incremental growth in LNG supply, pushing charter rates almost to operating costs 26 newbuild orders were placed during 2015 as buyers continued to secure shipping tonnage for the upcoming growth in LNG supply, primarily from the US; down from the 68 orders in There were only 6 vessels ordered throughout 2016 as liquefaction project FIDs have been pushed back Vessel Size. Conventional LNG vessels typically vary significantly in size, though more recent additions to the fleet demonstrate a bias toward vessels with larger capacities. Prior to the introduction of the Q-Class in , the standard capacity of the fleet was between 125,000 cm and 150,000 cm. As of end-2016, 49% of active LNG carriers had a capacity within this range, making it the most common vessel size in the existing fleet (see Figure 5.5), but this share is steadily decreasing. Tanker newbuilds delivered during 2016 had an average size of 173,600 cm. Conversely, the Q-Flex (210, ,000 cm) and Q-Max (261, ,000 cm) LNG carriers that make up the Qatari Q-Class offer the largest available capacities. The Q-Class (45 vessels in total) accounted for 11% of the active fleet and 18% of total LNG transportation capacity at the end of The growing size of LNG vessels is partly related to the upcoming expansion of the Panama Canal, which will accommodate vessels of up to 180,000 cm and redefine the Panamax vessel class known as the New Panamax 4. By the end of 2016, 36% of the active global fleet was in the 150,000 to 180,000 cm range. This share will grow rapidly in the years ahead with the average capacity in the orderbook standing at approximately 172,000 cm at the end of Vessel Age. At the end of 2016, 56% of the fleet was under 10 years of age, a reflection of the newbuild order boom that accompanied liquefaction capacity growth in the mid-2000s, and again in the early 2010s. Generally, shipowners primarily consider safety and operating economics when considering whether to retire a vessel after it reaches the age of 35, although some vessels have operated for approximately 40 years. Around 6% of active LNG carriers were over 30 years of age in 2016; these carriers will continue to be pushed out of the market as the younger, larger, and more efficient vessels continue to be added to the existing fleet. Typically, as a shipowner considers options for older vessels either conversion or scrappage the LNG carrier is laid-up. However, the vessel can re-enter the market. At the end of 2016, 18 vessels (primarily Moss-type steam tankers with a ENGIE/NYK/MC Engie Zeebrugge Courtesy of ENGIE, Mitsubishi Corporation and NYK. 4 The New Panamax is defined by length, breadth, and draught. The maximum capacity which still fits these dimensions has thus far come to about 180,000m 3, but there is no specific limitation on capacity. 39
42 capacity of under 150,000 cm) were laid-up. Over 77% of these vessels were over 30 years old, and all were older than 10. As the newbuilds are delivered from the shipyards, shipowners can consider conversion opportunities to lengthen the operational ability of a vessel if it is no longer able to compete in the charter market. In 2016, we saw 2 vessels retired from the fleet by selling the tanker for scrap. Unlike 2015, where four vessels were flagged for conversion to either become an FLNG or floating storage unit, 2016 did not see any tankers nominated for any conversions. Ship owner Gaslog had started to order long-lead items necessary for conversion in late 2016; however, no specific tanker had been selected for the conversion job Charter Market Charter rates throughout 2016 remained quite low as new tonnage continued to enter the market and trading patterns became more regionalized. Even with the number of spot fixtures at an all-time high, the saturated shipping market has kept a lid on any substantial increase in rates. The delta between charter rates for older steam turbine tankers and newer DFDE/TFDE tankers has increased as charterers overwhelmingly prefer the larger and more fuel efficient tankers. A total of 31 tankers were delivered from shipyards during 2016, of which two were FSRUs, and one was a floating storage unit conversion. Of the 31 tankers, only three were delivered without a charterer lined up, which coincides with the start-up of multiple liquefaction projects globally and replacement tankers for existing projects. Six liquefaction project trains were brought online during 2016 with a total liquefaction capacity of 26.5 MTPA. This lines up with the industry rule of thumb that one tanker is needed for each 1 MTPA of liquefaction capacity; however, many of the project tankers were delivered well ahead of time during 2015 alongside speculatively ordered tankers, adding length to the market. y The 2015 addition of 29 newbuilds into the global fleet plus another 31 during 2016 was far more than the market required for the 24.4 MTPA of incremental liquefaction capacity growth in the same timeframe. y The production shut-ins and outages at Yemen, Angola, and Egypt all added shipping length to the market. Also Figure 5.6: Average LNG Spot Charter Rates versus Vessel Deliveries, 2012 December 2016 $'000/day Jan-12 Jan-13 Jan-14 Jan-15 Jan-16 Source: IHS Markit # of vessels Vessels delivered (right) Steam DFDE/TFDE contributing to the growth in excess shipping tonnage has been the decrease in LNG exports out of Trinidad. y With spot LNG prices in the Pacific and Atlantic Basin almost at parity throughout 2016, arbitrage opportunities were limited, resulting in a more regionalized trade and fewer nautical miles travelled per voyage. Atlantic Basin volumes sailing to the Far East fell by 50% on a YOY basis. Spot charter rates for much of 2016 remained low and relatively flat throughout the year (see Figure 5.6). Rates for a TFDE/DFDE tanker averaged ~$34,000/day during 2016, compared to ~$36,000/day during 2015 a 6% YOY decrease. In regards to conventional steam tankers, there was a more dramatic YOY decrease of 25%; rates averaged ~$20,000/ day during 2016, compared to the 2015 average of ~$27,000/ day. This is further evidence of the market s preference for the newer, larger, and more fuel efficient TFDE/DFDE tankers. TFDE/DFDE tankers were nominated for most of the spot trade, leaving older steam tankers to sit idle with longer periods of time between cargoes, resulting in storage tanks and the associated cryogenic equipment becoming warm; this requires the vessel to take in cool-down volumes to return to service, resulting in additional time and expenses. Pure LNG traders have played a critical role in helping soaking up excess tonnage. With the relatively recent trend of securing volumes via short-term tenders as has occurred in markets like Argentina, Egypt, and Pakistan traders are participating in global LNG trade without having to commit to long-term supply purchase agreements or long-term charters. With an over supplied product and shipping market, traders are taking on short positions in the market and covering them with spot LNG volumes transported on tankers fixed on a short-term basis. As the market becomes more liquid, short-term fixtures will be more prevalent. Total spot fixtures (a charter of six months or less) during 2016 reached an estimated 280 fixtures compared to 175 fixtures in 2015, with traders making up a third of all spot fixtures. For the most part, spot charter rates for the 2016 remained flat, however, we did witness an increase in Atlantic Basin spot charter rates at the end of Q A jump in Northeast Asian spot LNG prices in December resulted in an increase in cross-basin trade; the increase in voyage days associated with the cross-basin trade left the Atlantic Basin short on shipping capacity. With the bulk of the liquefaction capacity located in the Pacific Basin, as well as all newbuilds being delivered from Japanese, Korean, or Chinese shipyards, there are a disproportional number of available tankers in the Pacific Basin. Ship owners are hesitant to reposition their tankers from the Pacific to the Atlantic and incur repositioning fuel costs, on hopes that the vessels might later be fixed at a higher rate. Looking forward to 2017, if all 53 LNG tankers are delivered on schedule, charter rates are likely to continue to face downward pressure. Global LNG trade is set to continue its regionalization, as new liquefaction capacity comes online in both the Atlantic and Pacific Basin. These new volumes will keep prices in both basins at parity, reducing the need for cross-basin trade. Ship owners may potentially start looking with more interest at converting some of their existing tankers into FSRUs. The retirement or conversion of older tonnage could provide some relief to this oversupplied market; however, 40

43 Figure 5.7: Major LNG Shipping Routes, 2016 Source: IHS Markit. it will take multiple years to work through excess tonnage in a meaningful way Fleet Voyages and Vessel Utilisation The total number of voyages completed in 2016 increased as new liquefaction capacity came online, and the Africa and Middle East regions emerged as significant LNG importers. A total of 4,246 voyages were completed during 2016, a 5% increase when compared to 2015 (see Figure 5.8). Trade was traditionally conducted on a regional basis along fixed routes serving long-term point-to-point contracts, though the rapid expansion in LNG trade over the past decade has been accompanied by an increasing diversification of trade routes. However, the growing trend of inter-basin trade was quite muted throughout 2016 due to the increase in new liquefaction capacity in both the Atlantic and Pacific Basins. With limited arbitrage opportunities available for traders, inter-basin trade shrank by 47% when compared to ,246 Voyages Number of voyages of LNG trade voyages in 2016 Given the increased regionalisation of trade throughout 2016, the average nautical miles travelled per voyage has decreased. Also, with the Panama Canal expansion finally completed, the voyage distance from the US Gulf Coast to Japan has now been reduced to 9,500 nautical miles (nm), compared to the 14,400 nm when the Suez Canal is used. However, the Panama Canal expansion has not been utilised to the extent as anticipated. Price parity between the Atlantic and Pacific has limited Atlantic basin volumes from flowing through the canal to access the Asian markets, except for during the recent cold winter in Asia which coincided with unexpected production outages. In 2016, the longest voyage from Trinidad to China around the Cape of Good Hope was taken by only one vessel. Figure 5.8: Atlantic-Pacific Trade versus Total Number of Voyages per year, MT Atlantic-Pacific Source: IHS Markit Total Voyages (right) 4,300 4,250 4,200 4,150 4,100 4,050 4,000 3,950 3,900 Total # of voyayes 41
44 Figure 5.9: Estimated Long-term and Spot Charter Rates versus Newbuild Orders, $'000/day Jan-11 Jul-11 Jan-12 Jul-12 Jan-13 Jul-13 Jan-14 Jul-14 Jan-15 Jul-15 Jan-16 Jul # of vessels Source: IHS Markit Spot Charter Rate Long-term Charter Rate Conventional Newbuild Orders (right) However, two other Atlantic LNG cargoes were sent to the Far East using a similar route via the Cape of Good Hope. Conversely, the shortest voyage a more traditional route from Algeria to the Cartagena terminal in Spain occurred only once. However, voyages from Algeria to Spain s four southern terminals occurred 59 times in The most common voyage in 2016 was from Australia to Japan, with 386 voyages completed during the year, a 29% YOY increase. In 2016, the amount of LNG delivered on a per tanker basis, including idle tankers, reached 0.62 MT compared to the 0.73 MT in 2011, before the tanker buildout cycle began. The buildout in tonnage continues to outpace new liquefaction capacity, resulting in an increase in tanker availability. In contrast, vessel utilisation was at its highest in 2011 following Japan s Fukushima disaster, which required significant incremental LNG volumes sourced from the Atlantic Basin. Strong Atlantic to Pacific trade continued in the following three years as traders capitalised on the arbitrage opportunity between basins. The extended voyage distance between the Atlantic and Pacific put a strain on the global LNG fleet, which caused charter rates to skyrocket and led ship owners to go to shipyards to put in orders on a speculative basis. Tanker availability has remained high since 2014, as the build-up in LNG liquefaction capacity lags behind the influx of newbuilds to the market. However, a portion of the available tankers had higher utilisation rates than the rest, because their owners offered the tankers at below market price early on to maintain cold tanks, and build up an operational history for the tanker at multiple ports. As a result, many of the same tankers were used for single voyages or backhauls while the rest sat idle. Also helping keep tanker utilization from falling any further has been the emergence of traders such as Trafigura and Vitol. These traders do not have any long-term dedicated tankers; instead they use the spot charter market to cover their shipping needs Fleet and Newbuild Orders At the end of 2016, 121 vessels were on order. Around 67% of vessels in the orderbook were associated with charters that extend beyond a year, while 44 vessels were ordered on a speculative basis. In 2016, newbuild vessel orders decreased by 77% YOY to just six (see Figure 5.10), one of which was for an FSRU. With a looming supply glut, many liquefaction projects have postponed taking FID, delaying any decision on potential newbuilds. Also, with an order book heavy with speculatively ordered tonnage, many potential project offtakers could easily cover their shipping requirements with these tankers. Orders in 2015 were also tied to the upcoming US LNG build-out, Figure 5.10: Firm Conventional Newbuild Orders by Quarter, # of vessels 40 Speculative Term-chartered Q Q Q Q Q Q Q Q Q Q Q Q Sources: IHS Markit, Shipyard Reports 5 Long-term charter rates refer to anything chartered under a contract of five years or above. Sport charter rates refer to anything chartered under a contract of six months or less. 42

45 Figure 5.11: LNG Fleet by Respective Company Interests, end # of vessels On Order Delivered in 2016 Teekay Maran Gas Maritime Nakilat MISC GasLog BW NYK BP Golar LNG MOL J4 Consortium Sovcomflot Knutsen OAS Dynagas Golar LNG Partners Hoegh Hyundai LNG Shipping SK Shipping Mitsui & Co National Gas Shipping NYK, K Line, MOL Shell BGT Ltd. Nakilat, Teekay North West Shelf Chevron K Line Korea Line Maran G.M, Nakilat Nigeria LNG Ltd Brunei Gas Carriers Cardiff Marine China LNG Ship Mgmt. China Shipping Group Excelerate Energy PETRONAS Teekay, Marubeni BG Group Commerz Real Hanjin Shipping Co. HYPROC ICBC Mitsui, NYK, Teekay MOL, China LNG Nakilat, OSC OSC, MOL TEPCO, NYK, Mitsubishi Active Source: IHS Markit particularly with Asian buyers. The majority of orders in 2016 are slated for delivery by late All vessels ordered in 2016 will have a capacity greater than or equal to 170,000 cm. As these larger, more efficient newbuilds are added to the active fleet, older smaller vessels will be increasingly retired. Many independent shipping companies made moves to dramatically grow their fleet sizes in the aftermath of the Fukushima nuclear crisis. While Golar ordered newbuilds primarily on a speculative basis, competitors such as Maran Gas Maritime and GasLog LNG chiefly placed orders based on term charter agreements with international oil companies. Out of the 77 vessels on charter in the order book, 20% are tied to companies that are considered an LNG producer (e.g., Sonatrach, Yamal LNG, etc.; see Figure 5.11). LNG buyers make up 38% of the new-build orders as the companies gear up for their Australian and US offtake. The remaining charters comprise companies with multiple market strategies. Figure 5.12: Average Delivery and Cost per Cubic Meter in Ordered Year by LNG Carrier Type, ,800 1,700 1,600 1,500 1,400 1,300 1,200 1,100 1, Avg. Delivery (right) Steam SSD TFDE DFDE MEGI Source: IHS Markit $/cm Months 5.6. Vessel Costs and Delivery Schedule Throughout the 2000s, average LNG carrier costs per cubic meter remained within a narrow range. The rapid growth in demand for innovative vessels starting in 2014, particularly vessels with TFDE propulsion, pushed average vessel costs to rise from $1,300/cm in 2005 to $1,770/cm in 2014 (see Figure 5.12). This was mainly driven by the Yamal LNG icebreaker vessels, which are more expensive than a typical carrier. However, in 2016, the costs for TFDE vessels dropped back to $1,092/cm. Korean shipyards, which have been suffering from the overall downturn in shipping, have been quite aggressive with their pricing, in turn forcing Japanese and Chinese shipyards to also offer competitive bids for newbuilds. With few exceptions, vessels have historically been delivered between 30 and 50 months after the order is placed. However, the delivery timeline has varied depending on the type of propulsion system. For instance, when DFDE vessels were first ordered in the early 2000s, the time to delivery was expanded as shipyards had to adapt to the new ship specifications. DFDE tankers delivered in 2006 saw an average time of 60 months between order and delivery. YAMAL LNG Carrier Christophe de Margerie Courtesy of SCF-GROUP 43
46 Yamal s three liquefaction trains are under construction, and upon completion, the project will require up to 17 ice-breaker LNG carriers; 15 have already been ordered. Eventually, these ships will have the capacity to transport LNG in summer via the North Sea Route (NSR) and in winter by the western route to European terminals, including Zeebrugge and Dunkirk. The 15 under-construction ice-class tankers each cost approximately $320 million. As of February 2017, the first of these vessels was sailing to the Arctic to begin ice trials Near-Term Shipping Developments Newbuilds and Conversions With the looming LNG supply glut, many emerging markets have shown interest in LNG as a replacement fuel for expensive oil-based fuels. Currently, the quickest and cheapest option is an FSRU. Many of the current LNG ship owners are working with independent power producers (IPPs) and NOCs in these markets, trying to secure long-term contracts to supply them with an FSRU. Currently all but one of the existing FRSUs have been chartered to specific projects or are earmarked to begin a project in the near future. Petrobras is redelivering one of the Golar FSRUs in mid-2017, after terminating its contract a year early. As of end-2016, there are eight FSRUs on the order book, five of which are dedicated to projects. The list of potential FSRU projects continues to grow, while the order book remains relatively subdued. The construction time for a newbuild FSRU ranges between 30 and 40 months, depending on space availability at the shipyard and whether it is a repeat order, which would require less engineering work. Regarding conversions, if the long-lead items are ordered ahead of their planned conversion, they can cut the conversion process timeline from months to 6-8 months. There are quite a few potential conversion candidates currently in the market. Ship owners such as Golar, Dynagas, and TMS Cardiff Gas, which have taken delivery of speculatively ordered tonnage, are well positioned for an FSRU conversion. Emerging markets utilizing vessels for creative import solutions Jamaica imported its first LNG cargoes in 2016 through new LNG regasification infrastructure delivering to the converted Bogue power plant. The process involves a series of ship-to-ship transfers from conventional LNG carriers to a floating storage unit stationed offshore, then to a lightering vessel set to deliver smaller volumes to an onshore regasification receiving centre. This process is similar to the one first established at Chile s Mejillones terminal, which used a floating storage unit in combination with onshore regasification capacity to allow imports to begin before terminal s onshore storage tank was completed. Jamaica s path to LNG imports highlights a potential trend in the LNG industry that of smaller, immature markets joining the global LNG space by utilising idle existing infrastructure to develop small-scale projects relatively quickly. Similarly, Malta became an LNG importer in January 2017 by also utilising an older tanker as a floating storage unit and then sending volumes onshore to a small-scale regasification terminal. With the LNG product market expected to remain over supplied, low prices could motivate more small-scale LNGto-power projects. Power producers will get access to a potentially cheaper and cleaner fuel, while LNG suppliers will have new downstream markets to supply. Looking Ahead Will there be more trade route optimization in 2017? With new liquefaction capacity coming online, charter rates could start to recover as spot and term fixtures increase. Throughout most of 2016, cross-basin trading decreased as prices in the Atlantic and Pacific were almost at parity. With limited arbitrage opportunities for traders to act on, the number of long-distance voyages from west to east was limited, resulting in an increase in shipping availability. While the start-up of several new liquefaction trains including Gorgon LNG T1-2, GLNG T1-2, Australia Pacific LNG T1, and Sabine Pass T1-2 has increased shipping demand to help absorb some of this excess tonnage, much of the trade from these projects will stay in-basin, limiting ship ton-miles. Going into 2017, the global trade will continue to become more regionalized as prices between regions converge. However, there may be moments where there could be a brief uptick in cross-basin trading activity, similar to what occurred at the end of Production issues at Gorgon LNG and cold weather in Asia sent spot LNG prices upwards, signalling to Atlantic Basin producers to divert cargoes towards the Far East. This is a good example of how the market can react to price signals and that it is flexible enough to divert at a moment s notice. However, to facilitate this flexibility, the market needs access to spot tonnage. Can older steam tankers compete in an over supplied tanker market? Another theme that will carry into 2017 will be the market s overwhelming preference for DFDE/ TFDE tankers over the conventional steam tanker. With slim trading margins due to low commodity prices, traders are looking to save on whatever components of the trade they can control, and shipping is a prime prospect for rationalization. The gap between charter rates for the more fuel efficient DFDE/TFDE tankers and steam tankers will continue to grow in The preference for the newer DFDE/TFDE tankers has left many older steam tankers sitting idle for quite some time, resulting in expired Ship Inspection Report Programme (SIRE) documents and warm tanks; this makes them less marketable for spot trades and widens the gap between the two tanker types. The resulting increase in steam tonnage availability has many ship owners looking for alternative uses for their tankers, such as floating storage unit, FSRU, and FLNG conversions. 44
47 6. LNG Receiving Terminals Tracking the growth of LNG demand, global LNG regasification capacity also increased, reaching 777 MTPA by end-2016 and 795 MTPA as of January In contrast to 2015, growth in receiving terminal capacity was primarily centred in established LNG markets, including: China, Japan, France, India, and South Korea. Poland and Colombia joined the global LNG market as new importers. The Emirate of Abu Dhabi also began imports via an FSRU; although as a country, UAE was already an importer. Furthermore, Jamaica completed its first LNG terminal in late 2016 and began importing LNG via floating storage and a break-bulk delivery vessel. 1 Over the last few years, given relatively low LNG price, new markets have been able to complete regasification projects fairly quickly using FSRUs. However, the majority of new regasification capacity came from expansions to existing terminals and the inauguration of new, larger onshore terminals. The Dunkirk terminal in France (9.5 MTPA) is the largest terminal to come online in five years. The incentives for developing new receiving terminal projects and expansions is increasing given that a significant amount of new liquefaction capacity will continue to be added to the market through Lower prices could unlock previously unattainable pockets of demand, both within existing LNG markets and countries new to the LNG space. Regasification capacity growth in the next two years is concentrated in existing Asian markets, particularly China and India. Japan, Pakistan, Thailand, Singapore, and Malaysia are among the other Asian importers set to expand capacity by end However, new LNG markets are still expected to materialize around the world. Beyond Colombia, which is expected to reach commercial operations at its first terminal in 2017, the Philippines, Russia (through an FSRU in Kaliningrad), and Bahrain are expected to complete their first regasification projects in the near-term. Further out, Ghana, Bangladesh, Uruguay, Croatia, Myanmar, Ivory Coast, Morocco, South Africa, and Sudan all have project proposals announced to come online by end LNG demand in emerging markets is still expanding. These new markets provide additional outlets for LNG producers, particularly important in a market with growing supply Overview The majority of new regasification capacity in 2016 came from established LNG countries, including Japan, China, India, and France. First-time importer Poland began commercial operations in mid-2016, the Emirate of Abu Dhabi in the UAE developed its first regasification terminal via FSRU; and Colombia, another new entrant to the LNG market, received its first commissioning cargo in November Overall, total global regasification capacity grew by 22.4 MTPA in 2016, bringing total capacity worldwide to MTPA in 34 countries (see Figure 6.1). A further 17.8 MTPA was added by the end of January 2017, with terminals reaching commercial operations in France, South Korea, and Turkey. 795 MTPA Global LNG receiving capacity, January 2017 The highest concentration of regasification capacity continues to be in the Asia and Asia Pacific region, with growth expected to continue both in established and growth LNG markets. Beyond small-scale developments in the Caribbean, North America is the only region where regasification capacity has not grown recently. The introduction of FSRUs granted a number of new countries access to the global LNG market over the last several years, especially in the Middle East, Asia, and Latin America. FSRUs are expected to continue playing an important role in bringing new importing countries to the LNG market quickly, provided there is sufficient pipeline and offloading infrastructure in place. However, onshore regasification terminals offer the stability of a permanent solution when desired and time is available Receiving Terminal Capacity and Utilisation Globally Over the last 15 years, the number of countries with LNG regasification capacity has tripled. LNG trade has expanded due to growing flexibility of supply and quicker access to new and existing markets via FSRUs. Lower LNG prices have been a driver for demand growth in India, while China approaches contract levels. Although countries in some traditional importing regions like Europe continue to join the global LNG market, countries in emerging, higher credit risk markets comprise the majority of the next round of new LNG importers. Four new regasification terminals reached commercial operations in 2016 (see Figure 6.3), two of which were onshore terminals located in existing markets in the Asia Pacific region: China (Guangxi Beihai) and Japan (Hitachi). Poland joined Figure 6.1: LNG Receiving Capacity by Status and Region, as of January MTPA Asia Pacific North America Asia Africa Existing FID Pre-FID Sources: IHS Markit, Company Announcements Europe Latin America Middle East Former Soviet Union 1 All counts and totals within this section only include countries with large-scale LNG regasification capacity (1 MTPA and above). This includes countries that only regasify domestically-produced LNG, which may cause totals to differ from those reported in Chapter 3. Refer to Chapter 8 for a description of the categorization of small-scale versus large-scale LNG. 45
48 Figure 6.2: Global Receiving Terminal Capacity, MTPA 1, Under Construction in 2017 Existing Utilization (right axis) Note: The above forecast only includes projects sanctioned as of January Owing to short construction timelines for regasification terminals, additional projects that have not yet been sanctioned may still come online in the forecast period, as indicated by the outlined bars. Although several FSRU contracts will expire over this time period, this forecast assumes that the capacity will remain in the global market. Sources: IHS Markit, IGU, Company Announcements 90% 80% 70% 60% 50% 40% 30% 20% 10% the global LNG market with an onshore terminal, which began commercial operations in mid Abu Dhabi completed its first terminal with the installation of an FSRU. In addition, a number of terminals were expected online in early France s Dunkirk terminal commenced with commercial operations in January 2017, and Turkey s Etki FSRU received its first LNG cargo in December South Korea added an additional terminal in early 2017, further expanding the number of new regasification terminals to 7 by the end of January In total, 22 MTPA was added in 2016 and a further 18 MTPA in the first month of % 7 terminals Number of new receiving terminals brought online in 2016 and January 2017 Terminal capacity expansions were also prevalent throughout 2016 as three existing terminals completed expansion projects. The Jiangsu Rudong and Liaoning Dalian terminals in China each added 3 MTPA of capacity, and the Dahej LNG terminal in India completed a 5 MTPA expansion. As of January 2017, 90.4 MTPA of new regasification capacity was considered to be under construction, including thirteen new onshore terminals, six FSRUs, and four expansion projects to existing receiving terminals. Although 85% of this total capacity was located in existing import markets, four under-construction projects are anticipated to add capacity for the first LNG imports in Colombia, Bahrain, Russia, and the Philippines. China has eight under-construction projects, followed by India s three. Additional projects are underway in Thailand, Greece, Pakistan, Singapore, Japan, Malaysia, Brazil, and Kuwait. Beyond under-construction projects, seven FSRU projects were considered to be in advanced stages. 2 The projects are located in India, Ghana, Uruguay, Puerto Rico, Pakistan, and Chile, with a total combined capacity of 28.7 MTPA. Only 60% of this figure stems from countries with established regasification capacity MTPA New receiving capacity under-construction, Q Global LNG regasification utilisation rates averaged 34% in 2016, roughly equal to 2015 levels. If mothballed terminals 3 are excluded, this number would reach 37% in Due to the requirement to meet peak seasonal demand and ensure security of supply, regasification terminal capacity far exceeds liquefaction capacity. Global utilisation levels have stayed flat, despite adding 22.4 MTPA of new Figure 6.3: Start-Ups of LNG Receiving Terminals, Forecast New Terminals or Expansion Phases Online Floating Onshore No. of Countries with LNG Receiving Terminals (right axis) Forecast No. of Countries Sources: IHS Markit, Company Announcements 2 Although these projects technically have binding agreements in place with FSRU providers, they are still considered as Pre-FID until on-site construction is confirmed. 3 Including El Musel, Cameron, Golden Pass, Gulf LNG, and Lake Charles. 46

49 Figure 6.4: Annual Send-out Capacity of LNG Terminals in 2016 and Number of Terminals bcm/yr 5-10 bcm/yr bcm/yr Sources: IHS Markit, Company Announcements bcm/yr 30+ bcm/yr receiving capacity in However, if the US is removed, global utilisation reached 41% in The US imported just 1% of the country s 129 MTPA capacity, as gas production from shale has expanded. Average peak send-out capacity has followed a trajectory of decline over the last few years, largely as a result of small to medium-sized terminals coming online in smaller markets, as well as the growing use of floating terminals, whose capacity is generally below 6 MTPA. Average regasification capacity for existing onshore terminals stood at 7.6 MTPA as of January 2017, compared to 4.0 MTPA for floating terminals. Global average peak send-out capacity has fallen from 12.2 billion cubic meters per year (bcm/yr; equivalent to 8.9 MTPA) in 2011 to 11.0 bcm/yr (8.0 MTPA) in 2016 (see Figure 6.4) Receiving Terminal Capacity and Utilisation by Country Japan remains the world s largest LNG importer and contains the most regasification capacity (see Figure 6.5). Japan added the 1 MTPA Hitachi terminal in March 2016, bringing total regasification capacity in Japan to 197 MTPA by end- 2016, or 25% of the world s total regasification capacity. As of January 2017, one terminal in Japan was under construction, Soma LNG, which is expected to come online in Figure 6.5: LNG Regasification Capacity by Country (MTPA) and Utilisation, January Japan, 197, 43% US, 129, 1% South Korea, 101, 35% Spain, 49, 21% China, 49, 56% UK, 35, 21% India, 27, 75% France, 25, 36% Mexico, 17, 25% Turkey, 16, 54% Taiwan, 13, 118% Brazil, 12, 11% Italy, 11, 40% Egypt, 10, 75% UAE, 10, 37% Netherlands, 9, 4% Indonesia, 9, 36% Argentina, 8, 47% Canada, 8, 3% Belgium, 7, 15% Singapore, 6, 36% Portugal, 6, 23% Kuwait, 6, 66% Chile, 6, 59% Thailand, 5, 50% Small Mkts*, 30, 46% Note: Smaller Markets includes Malaysia, Jordan, Pakistan, Poland, Greece, Lithuania, Israel, Dominican Republic, and Puerto Rico. Each of these markets had 4 MTPA or less of nominal capacity as of January Utilisation figures are based on 2016 trade data. Sources: IHS Markit, IGU Capacity utilisation stood at 43% in 2016, a minor decrease from 44% in South Korea, the world s second largest LNG importer in 2016, has 101 MTPA of regasification capacity, behind only Japan and the US. The country added 3 MTPA of capacity after completing the Boryeong terminal in January 2017, but did not have any additional capacity under construction as of early Although South Korea experienced a utilisation rate of 35% in 2016 (+1% YOY), LNG demand has fallen from a peak in 2013 at the expense of nuclear and coal-fired power. Taiwan remains one of the largest LNG importers, generally importing above its 13 MTPA of nameplate regasification capacity. Although no new terminals have been completed since 2009, Taiwan has announced a number of proposals to expand regasification capacity, including a 2 MTPA expansion Huelva LNG Terminal Courtesy of Enagas 47
50 Figure 6.6: Receiving Terminal Import Capacity and Utilisation Rate by Country in 2016 and Africa Asia Asia - Pacific Utilisation 2016 (right axis) Europe Latin America Middle East North America 120% 90% MTPA % 50 30% 0 Egypt China India Pakistan Japan Korea Taiwan Indonesia Malaysia Singapore Thailand Philippines Belgium France Greece Italy Portugal Spain Turkey UK Lithuania Netherlands Poland Russia Dom. Rep. Puerto Rico Argentina Brazil Colombia Chile Bahrain Israel Jordan Kuwait UAE Mexico US Canada 0% Sources: IHS Markit, IGU, Company Announcements project at the existing Taichung LNG terminal. Taiwan s LNG demand has increased incrementally over the last few years as gas utilisation in the power sector rose. Over the past five years, the fastest growing LNG market in terms of regasification capacity was China, increasing to 6.3% of the market as of end-2016, compared to 3.5% in China completed one terminal and two expansion projects in 2016, adding 9 MTPA of new capacity. China also has 18.4 MTPA of under-construction regasification capacity announced to come online in 2017 (and 6 MTPA under construction for 2018). China is the world s fifth largest regasification market by capacity as of January 2017, at 49 MTPA. Notably, this is up from only 6 MTPA in Although it remains the third largest importer by volume, LNG demand growth in 2016 remained below contract expectations. China s average terminal utilisation increased to 56% in 2016, rising from 50% in 2015 (see Figure 6.6) MTPA of new regasification capacity is announced to come online in India, forecasted to be a significant growth market for LNG imports, had 27 MTPA of regasification capacity as of January 2017, after completing a 5 MTPA expansion of Dahej LNG terminal in September The country has 15 MTPA of projects under construction that are targeted to be completed by Indeed, India s total regasification capacity could reach as high as 103 MTPA by 2020 based on the number of announced project proposals. Eastern India requires additional supply since domestic upstream projects have either under-performed or been delayed. Other parts of India that have not used much gas are more actively developing terminal plans such as northeastern and southwestern India. Despite Receiving Terminals in Review Receiving Capacity +22 MTPA Growth of global LNG receiving capacity New LNG import terminals +4 Number of new regasification terminals Number of regasification markets +1 Markets that added regasification capacity Offshore Terminals +1 Number of new offshore LNG terminals Regasification capacity grew by 22.4 MTPA (+3%), from 754 MTPA in 2015 to 777 MTPA in An additional 18 MTPA reached commercial operations by end-january 2017, including France s 9.5 MTPA Dunkirk terminal. Growth capacity was led by the Asia and Asia Pacific regions in New terminals in China, the UAE, and Japan (existing markets), and Poland (new importer) brought the total number of active regasification terminals from 110 to 114 by end By end-january 2017, that number grew to 117 with new terminals in France, Turkey and South Korea (all existing markets). The number of countries with regasification capacity increased from 33 to 34 as Poland began commercial operations at its new terminal. Colombia began received a commissioning cargo at its first terminal in late Russia (Kaliningrad), the Philippines, and Bahrain all have their first regasification projects under construction in 2017, set to come online over the next two years. One FSRU began commercial operations in 2016, in the UAE, as Abu Dhabi received its first LNG terminal. Turkey s Etki FSRU reached commercial operations in early 2017 and Colombia s Cartagena LNG FSRU received a commissioning cargo in late Teesside GasPort (UK) was decommissioned in 2015 after the facility came to the end of its commercially viable life. 48
51 this strong activity for new regasification developments, new pipeline connections will be needed to maximize gas penetration throughout the country. The lack of connectivity near the Kochi terminal in particular has limited throughput thus far and current expectations by the operator are that the pipeline will be completed by 2019 at the earliest. Utilisation rates have been low across Europe, reaching an average of 25% in 2016 (steady with 2015), ranging between 4% and 54% by country. Despite holding 20% of global LNG import capacity, imports have been down in recent years due to competition from pipeline gas and weak continental demand, particularly in the power sector. Record Norwegian pipeline imports in 2015 as well as record Russian pipeline imports in 2016 further squeezed LNG in many markets. The expected growth of LNG into Europe did not materialize in Given low utilisation rates at existing regasification terminals, Western Europe may not require significant amounts of new regasification capacity despite the expected increase in LNG imports. France, Poland, and Turkey are the only European markets to complete new regasification terminals in Europe since Lithuania did so in Poland s 3.6 MTPA Swinoujscie terminal is the country s first LNG infrastructure, designed to diversify the country s gas supply away from Russia. France s 9.5 MTPA Dunkirk LNG terminal, which reached commercial operations in January 2017, is one of the largest import terminals in the world to come online in recent years, located in France s northeast in proximity to the GATE, Zeebrugge, and Isle of Grain terminals. In addition, Turkey s Etki LNG FSRU began commercial operations in early 2017, with two more Turkish FSRU proposals navigating the regulatory stages of development. In the medium term, Croatia could potentially become an LNG importer if progress is made on its Krk LNG terminal. Also on the Mediterranean Sea, Greece and Bulgaria are pushing to install an FSRU at Alexandroupolis, which has been aided by the progress on both the Trans-Adriatic Pipeline (TAP) and Interconnector Greece Bulgaria (IGB). Figure 6.7: LNG Storage Tank Capacity by Country (mmcm) and % of Total, as of Q Japan, 17.1, 29% Korea, 11.6, 20% China, 6, 10% United States, 4.8, 8% Spain, 3.8, 6% India, 2.1, 4% United Kingdom, 2.1, 3% France, 1.4, 2% Taiwan, 1.2, 2% Indonesia, 1, 2% Mexico, 0.9, 2% Turkey, 0.7, 1% Singapore, 0.6, 1% Netherlands, 0.5, 1% Chile, 0.5, 1% Italy, 0.5, 1% Canada, 0.5, 1% Brazil, 0.5, 1% Portugal, 0.4, 1% Belgium, 0.4, 1% Smaller Markets*, 2.7, 5% Note: Smaller Markets includes Egypt, Thailand, United Arab Emirates, Argentina, Malaysia, Kuwait, Lithuania, Jordan, Dominican Republic, Puerto Rico, Pakistan, Israel, and Greece. Each of these markets had less than 0.4 mmcm of capacity as of January Sources: IHS Markit, Company Announcements Behind Japan, the US still holds the second most regasification capacity in the world. However, the country s terminals remain minimally utilized, if at all; the country averaged 1% utilisation in In fact, only three regasification terminals in the US received cargoes in The prospect of ample, price-competitive domestic gas production means that this is unlikely to change going forward. Many terminal operators have focused on adding export liquefaction capacity to take advantage of the shale gas boom. Canada also had one of the lowest utilisation levels in 2016 (3%), also due to the availability of domestic production. Taiwan (118%) and Puerto Rico (103%) registered the highest regasification terminal utilisation in Taiwan has typically received higher volumes than its announced regasification capacity, often leading to utilisation levels over 100% Receiving Terminal LNG Storage Capacity The seven new terminals added through January 2017 increased announced global LNG storage capacity to 59 million cubic meters (mmcm), averaging at 524 mcm for existing terminals in the global market (see Figure 6.7). As oversupply looms in the LNG market, the strategic importance of gas storage will increase, particularly in Europe and Asia as US volumes come online. Of the world s total existing storage capacity, 42% is located in the 20 largest LNG storage terminals, which range from 0.5 to 3.3 mmcm in size. 13 of these 20 terminals are located in Asia, as terminal operators in the region placed a premium on large storage capacity in order to secure supply and enhance flexibility, particularly given Asia s seasonal demand cycles. Importers like China, Japan, India and South Korea also often have little gas storage available outside of LNG terminals. While South Korea s Pyeong-Taek terminal maintains the largest storage capacity at 3.36 mmcm, the Samcheok LNG terminal added 1.0 mmcm of storage capacity in mid-2016, bringing its total to 1.8 mmcm. An additional 0.81 mmcm is expected online by mid-2017, set to be completed through three tanks of 270,000 cm each the world s largest capacity for a single storage tank. Outside of Asia, France s Dunkirk, completed in January 2017, contains 0.57 mmcm of storage. Figure 6.8: Maximum Berthing Capacity of LNG Receiving Terminals by Region, 2016.⁴ Number of Terminals Africa Asia Asia Pacific Europe Sources: IHS Markit, Company Announcements Conventional Q-Flex Q-Max Latin Middle North America East America 4 Terminals that can receive deliveries from more than one size of vessel are only included under the largest size that they can accept. 49
52 Storage capacity is following two trends: growth in average storage capacity per terminal in existing markets, particularly onshore terminals in Asia, and decline in average storage capacity in new markets deploying FSRUs, which typically contain far less storage capacity than onshore systems. Onshore terminals generally contain between 200 and 600 mcm of storage capacity, whereas floating terminals typically utilize storage tanks between 125 and 170 mcm in size. However, with a storage capacity of 263 mcm, Uruguay s GNL del Plata FRSU reported to come online in 2018 will become the world s largest FSRU to enter operations Receiving Terminal Berthing Capacity LNG receiving facilities vary widely in their ship berthing capabilities. In similar fashion to recent observations in storage capacity, the maximum size of ships able to berth at onshore facilities in existing markets has generally been increasing. In comparison, newer markets often utilise FSRUs or smallscale facilities, which encompass much smaller ship berthing capacities. These smaller terminals generally can only receive conventional ships (under 200,000 cm capacity). Q-Class carrier (over 217,000 cm) utilization has generally increased as higher-demand and established markets moved to expand their ship berthing capacities in recent years. Q-Max vessels, the largest of LNG carriers, have capacities of 261, ,000 cm. Sixteen different import markets (41 out of 114 existing regasification terminals) were known to be capable of receiving Q-Max ships as of January 2017 (see Figure 6.8). Twenty-two of these terminals were located in Asia and Asia Pacific, and none in Latin America or Africa. An additional twenty-eight existing regasification terminals are capable of receiving Q-Flex vessels (217, ,700 cm), as well as conventional carriers. In total, twenty-one out of thirty-four import markets were confirmed to have at least one terminal capable of receiving Q-Class vessels. Notably, Taiwan, the world s fifth largest LNG importer in 2016, is only able to receive conventional vessels. Of the 45 terminals that are reported to be limited to receive conventional vessels, 20 are FSRUs. Some terminals are capable of receiving even smaller LNG ships as small-scale LNG facilities continue to develop worldwide; one example is the new Montego Bay terminal in Jamaica, which utilizes a small lightering vessel to make ship-to-ship transfers from an FSU and then shuttle to an onshore regasification system. Many European terminals have also made adjustments to accommodate small-scale vessels and add LNG bunkering capabilities to comply with emissions targets and capture new commercial opportunities Receiving Terminals with Reloading and Transshipment Capabilities The growth of LNG re-exports largely stemmed from markets with ample pipeline access that utilize LNG to capture arbitrage opportunities between basins. Re-exports have also been a result of logistical motives within the market. France generated the most re-export cargoes in 2016, reaching Table 6.1: Regasification Terminals with Reloading Capabilities as of January Country Terminal Reloading Capability Storage (mcm) No. of Jetties Start of Re-Exports Belgium Zeebrugge 4-5 mcm/h Brazil Rio de Janeiro 10.0 mcm/h Brazil Bahia Blanca 5 mcm/h N/A Brazil Pecém 10 mcm/h N/A France FosMax LNG 4.0 mcm/h France Montoir 5.0 mcm/h France Dunkirk 4.0 mcm/h N/A India Kochi N/A Mexico Costa Azul N/A Netherlands GATE LNG 10 mcm/h Portugal Sines 3.0 mcm/h Singapore Singapore LNG 8.0 mcm/h S. Korea Gwangyang N/A Spain Cartagena 7.2 mcm/h Spain Huelva 3.7 mcm/h Spain Mugardos 2.0 mcm/h Spain Barcelona 3.5 mcm/h Spain Bilbao 3.0 mcm/h Spain Sagunto 6.0 mcm/h Spain El Musel 6.0 mcm/h N/A UK Isle of Grain Ship-dependent USA Freeport 2.5 mcm/h* USA Sabine Pass 1.5 mcm/h* USA Cameron 0.9 mcm/h* *Reloading capacity permitted by the US DOE. Sources: IHS Markit, IGU 50
53 1.2 MTPA, coming from both Montoir and FosMax LNG. Although Spain has traditionally been the world s largest re-exporter, the country only re-exported two cargoes in Of 25 regasification terminals in Europe, 14 have re-export capabilities. The only new re-exporting terminal in 2016 was in Lithuania, although this is considered to be small-scale. However, in 2015 three terminals re-exported cargoes for the first time, all from countries new to re-exports: Grain (UK), Kochi (India), and Singapore LNG. Additionally, China reloaded a cargo from its Zhuhai terminal, for delivery within the domestic market. This brought the total number of terminals able to reload cargoes to 23 in 13 different countries. Furthermore, the Andres terminal in the Dominican Republic and the Sodeshi terminal in Japan are expected to be re-export-ready in early Other facilities, such as Cove Point in the US, have been authorized to re-export, but decided not to pursue this option as they have instead focused on adding liquefaction capacity. France s Dunkirk regasification terminal, which began commercial operations in January 2017, also has reloading capabilities, although it had not generated a re-export cargo as of January Although non-european reloads grew in 2016, reaching 21 compared to only a few cargoes in previous years, European countries continued to provide the majority of re-exports, with France, Belgium, and the Netherlands leading the way. Outside of Europe, Singapore and Brazil reloaded 6 and 8 cargoes, respectively, generating a large portion of non- European reloading growth in South Korea, the US, and India also re-exported cargoes throughout the year. Receiving terminals with two jetties are capable of providing bunkering services and completing transshipments, such as the Montoir-de-Bretagne (France) terminal. GATE LNG in the Netherlands has also been offering this functionality since the second half of 2015 (for ships as small as 5,000 cm). Figure 6.9: Rise of FSRUs among Import Markets, Number of Countries Onshore-only importers Both onshore & FSRU FSRU-only importers Forecast Note: The above graph only includes importing countries that had existing or under construction LNG import capacity as of end Owing to short construction timelines for regasification terminals, additional projects that have not yet been sanctioned may still come online in the forecast period, as indicated by the outlined bars. The decline in number of countries at the end of the forecast period is the result of short FSRU contract expirations. Sources: IHS Markit, Company Announcements A number of regasification terminals, including the Isle of Grain terminal in the UK, have established truck loading capabilities. The transportation sector continues to be a growing consumer for LNG. In addition small-scale consumption has increased, reaching isolated demand pockets outside of the primary pipeline infrastructure. For more information on this topic, see the 2015 edition of the IGU World LNG Report Comparison of Floating and Onshore Regasification As of January 2017, 82% of existing receiving terminals were located onshore. Three out of the four terminals completed in 2016 were onshore developments, as well as two of the three terminals that began operations in January In 2015, however, of the seven new terminals, four were FSRUs, and six of the 19 currently under-construction projects are floating concepts, indicating that the ratio of onshore to offshore terminals will continue to shift. FSRUs have been the most common pathway for new markets to enter the LNG market over the past several years (see Figure 6.9). Colombia is set to join the ranks of countries with LNG import capacity in 2017 via the commissioning of an FSRU, following Egypt, Jordan, and Pakistan in Abu Dhabi in the UAE also began imports with an FSRU in 2016 under an accelerated development schedule. Thirteen out of thirty-four current import markets had floating capacity by end Four of these thirteen had onshore capacity as well. Five FSRU projects were under construction or had already selected an FSRU contractor and have announced plans to come online by end-2017, totaling 19.3 MTPA (in Colombia, Russia, and Ghana all new LNG markets and India and Pakistan). Furthermore, multiple FSRUs have been announced for 2018, particularly in Uruguay, the Philippines, Bangladesh, and Ivory Coast, all of which would be new import markets. Nevertheless, there are still several new importers, such as Morocco and Sudan, which announced plans to enter the LNG market using onshore proposals to establish a more permanent solution for gas imports. A new FSRU began operations in Abu Dhabi (UAE) in September Turkey s Etki FSRU began commercial operations in early 2017 after receiving its first cargo in late Figure 6.10: Floating Regasification Capacity by Status and Number of Terminals, MTPA FID Existing Total chartered Floating Terminals (right) Forecast Note: The above forecast only includes floating capacity sanctioned as of end Owing to short construction timelines for FSRUs, additional projects that have not yet been sanctioned may still come online in the forecast period, as indicated by the outlined bars. The decline in number of chartered floating terminals at the end of the forecast period is the result of short FSRU contract expirations. Sources: IHS Markit, Company Announcements
 Option for future")
54 Table 6.2: Benefits of Onshore Regasification Terminals and FSRUs. Onshore Terminals Provides a more permanent solution Offers longer-term supply security Greater gas storage capacity Generally requires lower operating expenditures (OPEX) Option for future expansions FSRUs Allows for quicker fuel switching Greater flexibility if there are space constraints or no useable ports Capable of operating further offshore Generally requires less CAPEX Less land regulations At the end of January 2017, total active floating import capacity stood at 83 MTPA at 21 terminals (see Figure 6.10). Both onshore terminals and FSRUs have their own merits and challenges for implementation and their utilization depends greatly on the specific needs and requirements of the target market. Recent trends have indicated that new markets have favoured utilising floating terminals, as evidenced by Egypt, Jordan, Pakistan, and Abu Dhabi, all joining the LNG market via FSRU in recent years. Overall, FSRUs allow for more rapid fuel switching, as projects can often be brought online faster than an onshore option, which can prove advantageous for new markets targeting near-term demand requirements. FSRUs can include faster permitting processes, and they are generally less expensive than onshore projects, particularly given that vessels are typically chartered from a third party (see Section 6.8. for further information). Without the need to construct significant onshore facilities, floating solutions in many cases offer greater flexibility when there are either space constraints onshore or no suitable ports. Additionally, floating receiving terminals are often linked to an offshore buoy that connects into a subsea gas pipeline system and can therefore operate further offshore than conventional terminals. Onshore terminals provide a number of benefits in comparison to FSRUs, which become evident depending on target market requirements. While the majority of recent newcomers to the LNG market utilised FSRUs for their first LNG imports, Poland joined the LNG market through an onshore scheme in In general, onshore terminals can contain larger storage and send-out capacities, which could be strategically important given the current market environment. This can also alleviate concerns around impediments and limitations for onloading capacities, sometimes experienced with FSRUs. FSRUs face potential risks related to the terminal s operability, including vessel performance, heavy seas or meteorological conditions, and a longer LNG deliverability downtime. Furthermore, onshore terminals allow for the possibility of future expansions, both in terms of storage and regasification capacity. Engine capabilities within floating terminals create two separate classifications of FSRUs. The first FSRUs came in the form of converted old vessels with limited propulsion that are permanently moored and act as long-term regasification terminals. Other floating terminals are mobile vessels that can be contracted for short periods. These FSRUs can function as Hitachi LNG Terminal Courtesy of Tokyo Gas 52
55 standard LNG carriers when not under contract, and also have the possibility to come to a port loaded and stay only for the time required to regasify their cargo. Eight FSRUs (with capacities over 60,000 cubic meters) were announced to be on the order book as of January However, there are limited FSRUs available in the near term, with the Golar Spirit as one of the only un-chartered vessels. The Excelsior will come off hire in October, but it is earmarked for a project in Bangladesh. In the very near-term, there are limited opportunities to develop regasification capacity via floating terminals beyond what is already delivered and on order, given the lack of idle FSRUs. Therefore, shipping companies have been open to ordering newbuild FSRUs and converting existing conventional vessels on a speculative basis, underlining the perceived importance of FSRUs in supporting new LNG markets Project CAPEX CAPEX costs for new receiving terminals have risen significantly over the last few years, specifically onshore terminals, after experiencing a period of relative steadiness between 2006 and FSRU CAPEX has remained fairly steady with a slight decline in recent years. FSRUs had experienced a large jump in 2009 and 2010 as the active number of floating terminals increased from four to ten; some of which were capital intensive projects. Regasification CAPEX figures are typically composed of costs associated with vessel berthing, storage tanks, regasification equipment, send-out pipelines, and metering of new facilities. $334/tonne Average costs of new onshore LNG import capacity in 2016 Figure 6.11: Regasification Costs based on Project Start Dates, $/tonne Onshore In 2016, the weighted average unit cost of onshore regasification capacity that came online during the year was $334/tonne (based on a three-year moving average), which is significantly higher than the 2015 average ($242/tonne), as the Hitachi (Japan) and Swinoujscie (Poland) projects both began operations in 2016 (see Figure 6.11). The Floating *Indicates the size of onshore storage relative to onshore terminal capacity. Sources: IHS Markit, Company Announcements rise in onshore regasification costs is closely associated with the trend of increased LNG storage capacity. As countries mainly in high-demand regions like Asia and Asia Pacific add larger storage tanks to allow for higher imports and greater supply stability, the storage capacity size per unit of regasification capacity has increased. However, several new onshore terminals with smaller storage units are expected online in 2017 and 2018, bringing down overall costs. CAPEX for onshore capacity under construction are set to fall to $212/tonne in 2017 and $285/tonne in 2018, if all developing projects come online on time. However, a number of proposed projects that may soon reach construction milestones have higher CAPEX, which could ultimately bring these averages higher. Nonetheless, these figures vary significantly on a caseby-case basis, often depending on country-specific factors, including associated infrastructure development requirements. Given that floating terminals require relatively limited infrastructure development in order to reach operations, CAPEX for FSRUs has been generally lower than onshore proposals. However, typically OPEX is higher for floating receiving terminals given that vessel charters are considered an OPEX cost. New floating terminals CAPEX have remained roughly steady over the past three years, declining from a high of $158/tonne in In 2016, the weighted average unit cost of floating regasification based on a three-year moving average was $78/tonne. A rise in FSRU conversions, which can be brought into operations at a lower cost than new-build vessels, will be a factor in reducing average floating terminal CAPEX. However, this figure is slightly skewed due to limited reporting of CAPEX figures for recently completed floating terminals. As of January 2017, there were six FSRUs considered to be under construction and seven forthcoming FSRU projects that have selected an FSRU provider. Four of these projects have notably high CAPEX, particularly the Uruguay, Bahrain, Brazil, and Chile proposals, indicating that average FSRU costs could be rising moving forward. As with onshore terminals, larger vessels and thus greater storage and send-out capacity have accompanied higher CAPEX. Still, there is generally less variation in overall CAPEX for floating terminals than for onshore facilities, which is partly a reflection of fewer differences in capacity and storage size for vessel-based terminal solutions Risks to Project Development While they are perhaps not as cumbersome as the risks facing liquefaction plants, regasification project developers still face a number of challenges when trying to bring proposed terminals online. Given the physical disparities between FSRUs and onshore terminals, project developers could utilize different approaches in order to mitigate the risks to develop each type of projects. Nonetheless, receiving terminals, both onshore and floating, must navigate similar risks to achieve commercial operations. These include: y Project and equity financing, which are required for terminal plans to advance. Bangladesh s Moheshkhali LNG (Petrobangla) FSRU project has faced multiple delays, largely due to financing challenges. The latest announcement indicated a 2018 target start date for commercial operations. 5 Figures in this section have been revised from the 2016 edition of the IGU World LNG Report 53

56 y Permitting, approval, and fiscal regime. New regasification terminals can face significant delays in countries with complicated government approval processes or lengthy permit authorization periods. The Aguirre GasPort FSRU project in Puerto Rico has faced an extended timeline due to regulation and permitting processes since beginning the initial filing process in The terminal is now announced to come online in y Challenging conditions in the surrounding environment could lead to delays or cancellations of regasification projects. A floating terminal was cancelled in South Africa in 2014 following FEED studies that indicated that intricate oceanographic conditions in Mossel Bay would prevent the project from moving forward. y Reliability and liquidity of contractors and engineering firms during the construction process. Financial and regulatory issues with contractors or construction companies can lead to project delays or even equity partners pulling out of the project all together. y Securing long-term regasification and offtake contracts with terminal capacity holders and downstream consumers, particularly as the market shifts toward shorter-term contracting. As of January 2017, Uruguay s FSRU project, the first for the country, is facing growing uncertainty given that a supply deal between Uruguay and Argentina had not been reached. For the development of new terminals, political support could be needed if longterm commitments are not secured. y Associated terminal and downstream infrastructure including pipelines or power plant construction required to connect a terminal with end-users, which are often separate infrastructure projects that are not planned and executed by the terminal owners themselves. Ghana s West African Gas Limited (WAGL) Tema LNG project requires significant downstream infrastructure development in order to move forward. The Golar Tundra was delivered in May 2016, but remains idle offshore until the issues are sorted out The Kochi terminal in India continues to limit receiving capabilities due to the lack of completed pipeline connections to downstream users. Barcelona LNG Terminal Courtesy of Enagas 54

57 Dunkirk LNG Terminal First Delivery Courtesy TOTAL Looking Ahead Will regasification capacity growth continue to be driven by existing LNG markets in the near term? Although Poland s first terminal began commercial operations in mid-2016, 84% of newly constructed regasification capacity in 2016 was completed in existing LNG markets, compared to only 30% in Supporting the trend are expansion projects at existing onshore terminals and France s new Dunkirk terminal. Colombia, Russia (Kaliningrad) and the Philippines are planning to add capacity by end-2017 as new importers. However, the majority of regasification capacity likely to be completed over the year will come from existing importers, particularly in China and India. Can emerging markets readily respond to lower prices by completing regasification terminal projects in a timely manner? With Colombia s floating regasification terminal set to reach commercial operations in 2017, it will become the first emerging market to become an LNG buyer since mid Lower prices help unlock new pockets of demand and provide incentive for emerging markets to fasttrack their first receiving terminals, as was observed in 2015 in Egypt, Jordan, and Pakistan. However, emerging markets still face a number of hurdles before projects can prove viable, including regulatory, infrastructure, and financing challenges, particularly in higher credit risk markets. Will floating regasification capacity regain momentum in 2017? Although seven FSRUs were initially planned for completion in 2016, Abu Dhabi s FSRU was the only floating project to reach commercial operations during the year. In comparison, four FSRUs were completed in However, the utilization of FSRUs is expected to rebound throughout 2017 and into 2018, particularly in nascent LNG markets. Turkey s FSRU began commercial operations in early 2017 after taking a first cargo in late Colombia, India, Pakistan, and Russia (Kaliningrad) all have underconstruction FSRUs anticipated online by the end of the year. Furthermore, a wide range of announced floating proposals for starts by end-2018 are in various stages of planning, indicating that the use of FSRUs is set to expand significantly in the near term. 55

58 Figure 6.12: Global LNG Receiving Terminal Locations Note: Terminal numbers correspond to Appendix III: Table of LNG Receiving Terminals. Source: IHS Markit 56
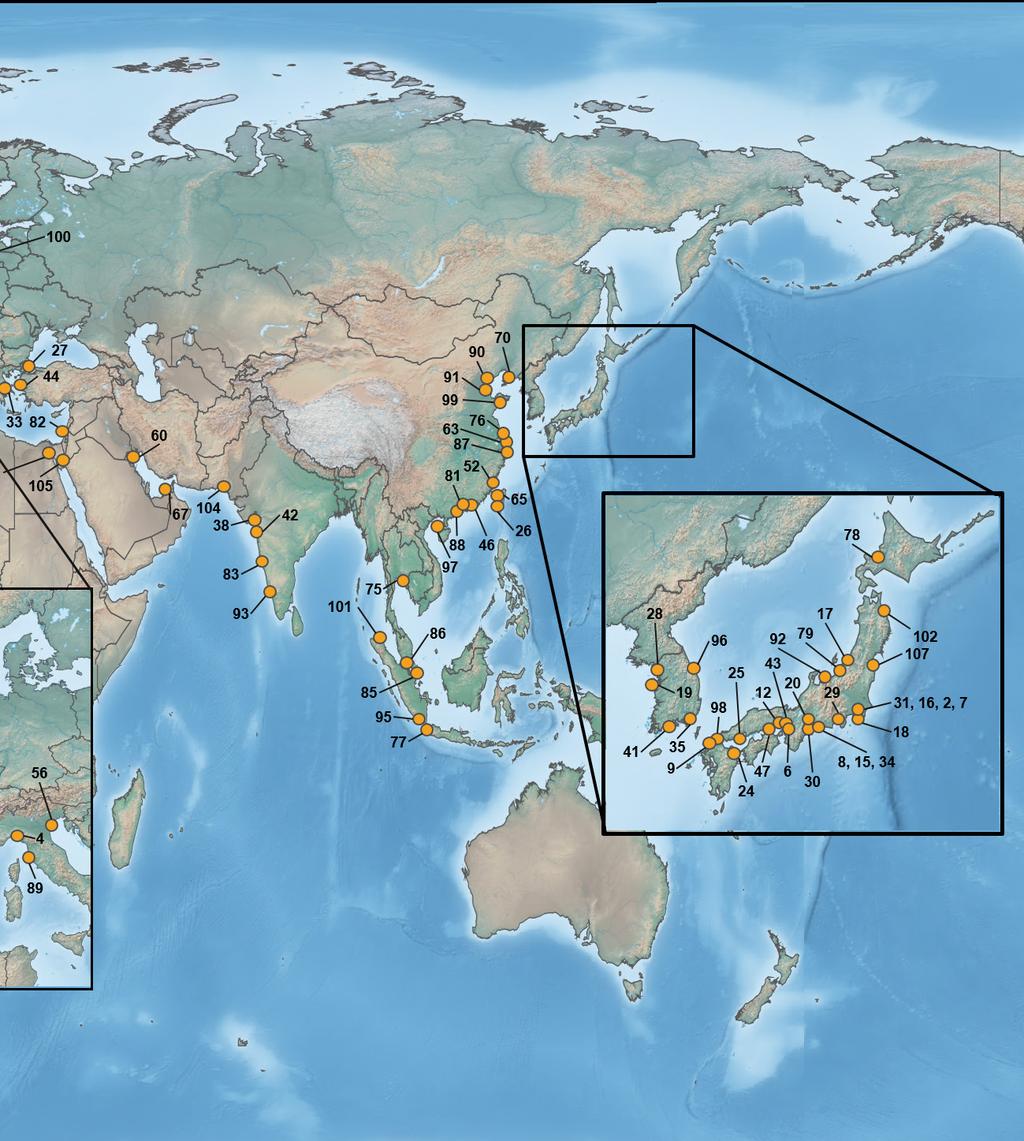
59 57

60 Cartagena LNG Terminal Courtesy of Enagas
61 7. The LNG Industry in Years Ahead Will the high Asian spot prices of winter be sustained? A range of factors have enabled a strong run-up in Asian spot prices in the second half of In the final two months of the year, a significant premium opened up between Asian and European assessed LNG spot prices typically a sign of a tighter market. Much of the impetus for higher prices has been unexpected supply shortfalls from existing projects and new projects that have struggled to start producing consistently. Moreover, very cold temperatures in Northeast Asia and Europe created additional demand needs. Nevertheless, the current relatively high spot price levels will be met with additional supply in For 2017, we expect several new trains and ramp-ups, particularly in Australia and the United States. Supply should outpace demand growth and further cushion the Asian market, and thereby put considerable pressure on the supply/demand balance once the winter season ends in Asia and Europe. Many Asian importers are gearing up for higher contracted supply from new Australian projects that will dampen their spot and short-term purchasing needs. During the year, global supply additions should also be sufficient to cover emerging demand in new markets like Egypt and Pakistan. These countries have been actively tendering for short-term cargoes, with Pakistan recently awarding a new five-year contract. While the balance is expected to be comfortable, volatility cannot be under-estimated. European prices are in a period of transition. NBP rose in second half 2016, driven by the rapid climb in global steam coal prices, which are linked by power generation in Europe. However, Pacific Basin LNG supply is ramping up faster than demand in 2017 and could lead to a significant increase in LNG arriving in Europe. With more LNG flowing into Europe in 2017 especially from the US GOM, the European market would be well-supplied allowing for the potential of cross-basin LNG trade to return. The Asian LNG premium is expected to again re-align with an inter-connected global LNG market, with European gas fundamentals returning to the forefront. However, delays in starting up new projects are a key risk to this rebalancing timeframe. In addition, coal prices remain highly volatile. Much of this uptick in coal prices was driven by policy changes in China designed to curb oversupply an indication of how quickly markets can cycle, with far-reaching impacts. Chinese government intervention in the domestic coal market is likely to continue, creating uncertainty for global coal prices. In the current environment, where European gas markets are highly influenced by coal, volatility in LNG markets can be expected until further supply comes on-stream. Will there be more liquefaction FIDs despite loose market conditions? With relatively low LNG prices, developers will naturally be cautious about new investment. Nevertheless, companies make independent decisions as they seek to monetize gas resource according to their own outlooks. Given demand uncertainty and changing buyer preferences, smallerscale projects have been gaining the most momentum and commercial interest. Many of these also happen to be floating projects. These projects can help minimize risk and capital exposure in this price environment. Coral FLNG in Mozambique may take FID imminently as multiple project partners have achieved internal board approvals. Fortuna FLNG could also reach FID soon as partner alignment has progressed and upstream costs are reported to have been reduced. Woodfibre LNG benefits from strong sponsor commitment and preliminary contracts. These three projects are strong contenders to reach FID in In addition, Exmar s Caribbean FLNG (0.5 MTPA), which had been slated for Colombia, has become a speculative asset that could quickly add capacity. Photo courtesy of Chevron. 59
62 What trends could emerge for new LNG contracts? With few new projects expected to reach FID in the coming year, contracting activity will continue to be dominated by secondary and tertiary deals i.e., aggregators (particularly with US LNG volumes) re-contracting flexible-destination supply. In addition, the trend of shorter duration contracts will provide buyers with fewer long-term commitments, enhancing optionality, but adding long-term market exposure. In addition to seeking out shorter lengths, buyers are also pursuing smaller contracts. Small contracts (less than 1.0 MMtpa) made up only 15% of all contracts signed in 2013, but rose to account for 46% of all contracts signed in Although traditional buyers in Japan, South Korea, and Taiwan drove small-volume activity in the early 2010s, continued growth has been supported primarily by new buyers. This includes buyers in emerging markets in the Middle East, Africa, Asia and Asia Pacific, as well as new companies in more established markets like China. These buyers often have smaller or more unpredictable demand profiles that make them unable to accommodate a large contract in the first few years of imports. During the height of contracting activity at US projects, contracts with full destination flexibility made up the vast majority of new contracts signed 81% of total contracts in 2013 but since then, fixed destination contracts have accounted for a higher portion. This trend toward fixed destination contracts is primarily the result of two factors: the slowdown in global liquefaction FIDs and the emergence of new markets. Many emerging markets like Egypt and Pakistan have contracted volumes fixed to their own terminals. However, more established buyers in markets like Japan are increasingly pursuing more destination flexibility in their future contracts. In order to avoid a supply shortage, long-term agreements will be necessary for underpinning new, large-scale LNG projects. While buyers are navigating the current market, and at times demanding terms to enhance their supply optionality, longterm contracts will be of particular importance to buyers who face a portfolio of expiring contracted supply. How will existing LNG contracts come under pressure in 2017? Customers of existing long-term contracts that are reacting to oversupply conditions largely fall into two groups: those that are seeking to re-negotiate pricing and those that do not have enough demand to meet their contractual commitments. Petronet LNG s price renegotiation with RasGas at the end of 2015 was an important catalyst for other bilateral relationships in 2016.The government of Peru pushed to review terms of its arrangement with Shell. India s GAIL sought to revise terms with Gazprom and Cheniere. Thailand s PTT reportedly looked to reduce the price agreed to in heads of agreement (HOAs) with Shell and BP. Gas demand has slowed quicker than anticipated in some importing markets particularly in Asia Pacific. As a result, buyers in those countries have to be creative to manage over-commitments. China has been over-contracted since 2015 and this may continue in 2017 given the large additions of Australian capacity and associated contracts with the Chinese NOCs. Beyond the NOC s, smaller LNG players in China e.g., ENN Energy, Beijing Gas, Jovo Group are becoming more active players. In the same way, other Asian LNG buyers in Japan and South Korea are potentially overcommitted in the near term and many have formed trading businesses to manage their portfolios. Will there be more LNG-related asset ownership changes? Since the second half of 2016, a series of asset acquisitions associated with major gas and LNG projects have been announced e.g., ExxonMobil s acquisition of InterOil, BP s entry into Mauritania and Senegal, and TOTAL s investment in Tellurian Investments developer of Driftwood LNG, located in U.S. Notably, the acquiring companies in these deals have primarily been large international oil companies (IOCs), and gas and LNG-related assets have disproportionately been the focus of their investment appetites. As the oil market begins to potentially turn around, several long-term strategic drivers could re-surface and motivate IOCs and other companies to further invest in the gas space. The scope and financial exposure of the deals vary, as do the drivers behind them. The IOCs that have made investments thus far have a long-term time horizon, which allows them to make commitments despite the shorter-term prospect of weak market conditions. The notable focus by some companies in gas assets could be a result of their worldview that gas will play a critical role in a carbon-constrained future. Can LNG in shipping bunkers be transformative for LNG demand? The use of LNG has generated much interest in the shipping community, with two main drivers. First, LNG emits virtually no sulfur oxides (SOX), much less NOX and particulate matter, and significantly less carbon dioxide (CO2) per unit of energy released than oil-derived liquid fuels. This can reduce the compliance cost imposed by the use of traditional liquid fuels. Second, interest in LNG is also driven by lower prices and by the need of gas marketers to create new markets for now abundant gas supplies. The lower retail price of natural gas everywhere in the world is a strong driver for LNG penetration in commercial transport. While natural gas retains a commodity price advantage even at low oil prices, the higher fixed costs of producing and delivering LNG erode and can even reverse that advantage. Thus environmental specifications will ultimately influence the potential use of LNG in bunkering. The International Maritime Organization (IMO) provided clarity in October 2016 when it confirmed the originallyproposed timetable of 2020 for reducing the permitted sulfur content of marine fuel from 3.5% currently, to 0.5%. LNG can meet the technical specifications of the IMO standards, but the amount of switching that occurs will depend upon the economics compared with the alternative of using marine diesel and installation of scrubbers. The pace of infrastructure development to support this new market is also a major question. 60
63 How will individual country (regional) dynamics impact the LNG balance? As always, individual country (or regional) dynamics will have important consequences on the LNG market. In particular, the following countries and regions will be influential for the LNG market balance. Japan: How will the market deal with continued uncertainty from nuclear restarts and market deregulation? The opening of Japan s entire retail power sector to competition in April 2016 led to relatively fast customer switching, with a direct impact on incumbents fuel procurement needs. This builds upon the further uncertainty the incumbent electricity utilities face regarding the timing of nuclear restarts. The Osaka High Court is expected to rule in early 2017 on whether Units 3 and 4 of Kansai Electric s Takahama reactors can restart following the provisional injunction issued by Otsu local District Court. The court injunction brought on by residents has halted the operations of once-restarted reactors despite the regulator s approvals. Many other reactors face similar ongoing judicial risks regarding when they can come back online any further delays will lead to a greater need for short-term LNG imports. By contrast, the April 2017 opening of the gas market to full competition could have uncertain impacts on the industry, given the challenges facing new entrants in accessing infrastructure. Some areas will have intense retail gas competition between the city gas and electric power companies. To prepare for such uncertain future, traditional regional utilities have been setting-up trading businesses to hedge their relative broadening contract portfolios which increasingly include US LNG. China: How will LNG imports respond to commercial and political changes? China s ability to absorb growing amounts of contracted LNG continues to be an important signpost for the global market. The country has been over-contracted since However, there was a dramatic increase in LNG deliveries in the last two months of 2016; November and December 2016 imports were the highest levels ever in those months, with December imports reaching 4.1 MMt. Some of this huge increase could be attributed to CNPC s Qatari contract being weighted towards winter delivery. Nevertheless, there are other factors that could position China to catch up with contracts. The policy push to improve air quality standards in China s coastal provinces is a major driver of using more gas in the power and heating sectors. While there are means to import coal and renewable power from inland provinces to the coast, gas could be pushed more heavily in the country s energy mix. Indeed, China could be the second largest regasification capacity holder in Asia by While the NOCs are dealing with over-contracted conditions, many private generators and other non-nocs have achieved some success in securing regasification terminal rights and offtake contracts with international suppliers. South Korea: Will South Korea continue to see LNG import declines? Despite the short-term boost to demand driven by the temporary shutdown of nuclear power plants and cold winter weather in 2016, the structural drivers leading to lower LNG demand persist. Significant coal and nuclear capacity additions and expected weak power growth may continue to squeeze South Korea s LNG consumption. If any of these new plants take longer than anticipated to start-up, additional LNG might be needed. Another area to watch is an apparent shift in the government s stance toward coal. In 2016, new policies were proposed that could potentially reign in the growth of coal consumption. These include the increased import tax for coal used in power generation and the proposals to close older coal plants and change the dispatch order in power generation based on factors linked to pollution and not just short-run costs. On the political front, increased U.S. LNG imports have been discussed as a way to help balance the U.S. - South Korea trade deficit. In addition, the upcoming Presidential election in 2017 may result in energy policy changes. India: Will price relationship shifts slow India s spot import momentum? For the last two years, India has provided an important destination for spot cargoes and we expect this to continue into The country will benefit from additional regasification capacity during the year. A key factor in India s 2017 procurement will be the oil price and arbitrage potential between oil-indexed LNG contracts and spot volumes. If spot prices increase relative to oil, this could yield a much milder appetite for spot LNG. Another important signpost for demand will be the impact of the reduction in the customs duty on LNG imports from 5% to 2.5% for the upcoming fiscal year. Egypt: Could LNG growth backtrack as new production starts? New indigenous production starting during 2017 could put pressure on imports in 2017 despite strong levels in previous years. Consequently, Egypt has substantially reduced its LNG tender for 2017 below original expectations and has canceled its tender for a third FSRU in the country. The BP-operated West Nile Delta and Eni-operated Zohr field are expected to start during the year. The exact start of these fields will be closely watched to determine if more LNG will be needed to meet demand in the power sector. Other Middle East and Asia: Will demand grow in gas-short countries? Many Middle Eastern (i.e., Kuwait, UAE, Jordan, and Bahrain) and Asian (i.e., Pakistan and Bangladesh) markets are witnessing a rapid expansion in gas demand for power and industrial projects. At the same time, domestic production in many of these countries is limited, increasing the potential call on LNG imports. Given political hurdles for international pipelines in these regions, LNG will continue to have an important role. Europe: What factors will impact the continent s ability to balance the LNG market? LNG imports are expected to increase to Europe over the next two years as U.S. supply increases. This influx will be a consequence of global demand not growing as fast as incremental supply additions, not necessarily due to market-specific needs of the European market. The continent can serve as a backstop market for any excess cargoes that cannot find a dedicated international buyer. The additional LNG volumes combined with sufficient pipeline imports, should keep Europe well-supplied. As a result, the gas-fired power sector may see increased utilization, particularly if coal prices stay at current levels or continue to trend upwards, including via the broader adoption of a carbon price. 61
64

65 8. References Used in the 2017 Edition 8.1. Data Collection Data in the 2017 World LNG Report is sourced from a variety of public and private domains, including the BP Statistical Review of World Energy, Cedigaz, the International Energy Agency (IEA), the Oxford Institute for Energy Studies (OIES), the US Energy Information Agency (EIA), the US Department of Energy (DOE), GIIGNL, IHS Markit, company reports and announcements. This report should be read in conjunction with the 2015 and 2016 World LNG Reports, available on the IGU website at The data and associated comments have been reviewed and verified by IGU. The IGU wishes to thank the following organisations and Task Force members entrusted to oversee the preparation and publication of this report: y Chevron, USA: Elias Cortina, Uday Jayanti y American Gas Association (AGA), USA: Ted Williams y Enagas, Spain: Alvaro Sedano Pulido, Angel Rojo Blanco y TOTAL, France: Guy Broggi y Osaka Gas, Japan: Masaya Watanabe, Ichiro Baba, Shuzo Maeda y Anadarko, USA: Jupiter Ramirez y Bureau Veritas, France: Carlos Guerrero y GIIGNL, France: Vincent Demoury y IHS Markit: Gautam Sudhakar, Kelli Krasity 8.2. Definitions Brownfield Liquefaction Project: A land-based LNG project at a site with existing LNG infrastructure, such as: jetties, storage tanks, liquefaction facilities or regasification facilities. Forecasted Data: Forecasted liquefaction and regasification capacity data only takes into account existing and under construction capacity (criteria being FID taken), and is based on company announced start dates. Greenfield Liquefaction Project: A land-based LNG project at a site where no previous LNG infrastructure has been developed. Large-Scale vs. Small-Scale LNG: IGU defines the largescale LNG industry as every LNG business above 1 MTPA of LNG production and/or consumption. Conversely, small-scale LNG is any business under 1 MTPA. Liquefaction and Regasification Capacity: Unless otherwise noted, liquefaction and regasification capacity throughout the document refers to nominal capacity. It must be noted that re-loading and storage activity can significantly reduce the effective capacity available for regasification. LNG Carriers: For the purposes of this report, only Q-Class and conventional LNG vessels with a capacity greater than 60,000 cm are considered part of the global fleet discussed in the LNG Carriers chapter (Chapter 5). Vessels with a capacity of under 60,000 cm are considered small-scale LNG carriers. Long-term and Spot Charter Rates: Long-term charter rates refer to anything chartered under a contract of five years or above. Sport charter rates refer to anything chartered under a contract of six months or less. Northeast Asian Spot Prices: Northeast Asian spot prices are calculated based on the observed average price for spot cargoes imported into Japan and South Korea in a given month. Project CAPEX: Liquefaction plant CAPEX figures reflect the complete cost of building the facilities, including site preparation, gas processing, liquefaction, LNG storage and other related infrastructure costs. Regasification terminal CAPEX figures are based on company announcements and may therefore only include selected infrastructure components. Short-term, Medium-term and Long-term Trade: y Short-term trade = volumes traded on a spot basis or under contracts of less than 2 years y Medium-term trade = volumes traded under a 2 to <5 year contract y Long-term trade = volumes traded under a 5+ year contract Traded LNG Volumes: Trade figures are measured according to the volume of LNG imported at the regasification level. Only international trade is taken into account. Domestic LNG trade in Indonesia is thus excluded from the global figures Regions and Basins The IGU regions referred to throughout the report are defined as per the colour coded areas in the map above. The report also refers to three basins: Atlantic, Pacific and Middle East. The Atlantic Basin encompasses all countries that border the Atlantic Ocean or Mediterranean Sea, while the Pacific Basin refers to all countries bordering the Pacific and Indian Oceans. However, these two categories do not include the following countries, which have been differentiated to compose the Middle East Basin: Bahrain, Iran, Iraq, Israel, Jordan, Kuwait, Oman, Qatar, UAE and Yemen. IGU has also taken into account countries with liquefaction or regasification activities in multiple basins and has adjusted the data accordingly. El Musel LNG Terminal. 63
66 Former Soviet Union North America Europe Middle East Asia Africa Asia Pacific Latin America 8.4. Acronyms BOG = Boil-Off Gas CAPEX = Capital Expenditures CBM = Coalbed methane DFDE = Dual-Fuel Diesel Electric LNG vessel EPC = Engineering, Procurement and Construction FEED = Front-End Engineering and Design FERC = Federal Energy Regulatory Commission FID = Final Investment Decision FOB = Free On Board FLNG = Floating Liquefaction FSRU = Floating Storage and Regasification Unit FSU = Former Soviet Union HFO = Heavy Fuel Oil HOA = Heads of Agreement IOC = International Oil Company IPP = Independent Power Producers ME-GI = M-type, Electronically Controlled, Gas Injection 8.5. Units Bcfd = billion cubic feet per day bcm = billion cubic meters cm = cubic meters KTPA = thousand tonnes per annum mcm = thousand cubic meters mmcfd = million cubic feet per day MDO = Marine Diesel Oil NBP = National Balancing Point NOC = National Oil Company NOX = Nitrogen Oxides NSR = North Sea Route OPEC = Organisation of Petroleum Exporting Countries OPEX = Operating Expenditures SOX = Sulphur Oxides SPA = Sales and Purchase Agreement SSD = Slow Speed Diese TFDE = Tri-Fuel Diesel Electric LNG vessel UAE = United Arab Emirates UK = United Kingdom US = United States US DOE = US Department of Energy US GOM = US Gulf of Mexico US Lower 48 = US excluding Alaska and Hawaii YOY = Year-on-Year mmcm = million cubic meters MMBtu = million British thermal units MT = million tonnes MTPA = million tonnes per annum nm = nautical miles Tcf = trillion cubic feet 8.6. Conversion Factors Multiply by Tonnes LNG cm LNG cm gas cf gas MMBtu boe Tonnes LNG ,300 45, cm LNG , cm gas x cf gas x x x 10-4 MMBtu boe ,
67 Appendix 1: Table 1: Table of Global of Global Liquefaction Liquefaction Plants (continued) Plants Reference Number Country Project Name Start Year Nameplate Capacity (MTPA) Owners* Liquefaction Technology 1 United States Kenai LNG** ConocoPhillips ConocoPhillips Optimized Cascade 2 Libya Marsa El Brega*** LNOC APC C 3 MR 3 Brunei Brunei LNG T Government of Brunei, Shell, Mitsubishi APC C 3 MR 3 Brunei Brunei LNG T Government of Brunei, Shell, Mitsubishi APC C 3 MR 4 United Arab Emirates ADGAS LNG T ADNOC, Mitsui, BP, TOTAL APC C 3 MR 5 Algeria Arzew - GL1Z (T1-6) Sonatrach APC C 3 MR 5 Algeria Arzew - GL2Z (T1-6) Sonatrach APC C 3 MR 6 Indonesia Bontang LNG T Pertamina APC C 3 MR 7 Malaysia MLNG Satu (T1-3) PETRONAS, Mitsubishi, Sarawak State Government APC C 3 MR 8 Australia North West Shelf T BHP Billiton, BP, Chevron, Shell, Woodside, Mitsubishi, Mitsui APC C 3 MR 8 Australia North West Shelf T BHP Billiton, BP, Chevron, Shell, Woodside, Mitsubishi, Mitsui APC C 3 MR 6 Indonesia Bontang LNG T Pertamina APC C 3 MR 8 Australia North West Shelf T BHP Billiton, BP, Chevron, Shell, Woodside, Mitsubishi, Mitsui APC C 3 MR 4 United Arab Emirates ADGAS LNG T ADNOC, Mitsui, BP, TOTAL APC C 3 MR 6 Indonesia Bontang LNG T Pertamina APC C 3 MR 7 Malaysia MLNG Dua (T1-3) PETRONAS, Shell, Mitsubishi, Sarawak State Government APC C 3 MR 9 Qatar Qatargas I (T1) Qatar Petroleum, ExxonMobil, TOTAL, Marubeni, Mitsui APC C 3 MR 9 Qatar Qatargas I (T2) Qatar Petroleum, ExxonMobil, TOTAL, Marubeni, Mitsui APC C 3 MR 6 Indonesia Bontang LNG T Pertamina APC C 3 MR 9 Qatar Qatargas I (T3) Qatar Petroleum, ExxonMobil, TOTAL, Marubeni, Mitsui APC C 3 MR 9 Qatar RasGas I (T1) Qatar Petroleum, ExxonMobil, KOGAS, Itochu, LNG Japan APC C 3 MR 10 Trinidad ALNG T Shell, BP, CIC, NGC Trinidad ConocoPhillips Optimized Cascade 11 Nigeria NLNG T NNPC, Shell, TOTAL, Eni APC C 3 MR Government of Oman, Shell, TOTAL, 12 Oman Oman LNG T Korea LNG, Mitsubishi, Mitsui, Partex, Itochu APC C 3 MR 6 Indonesia Bontang LNG T Pertamina APC C 3 MR Government of Oman, Shell, TOTAL, 12 Oman Oman LNG T Korea LNG, Mitsubishi, Mitsui, Partex, Itochu APC C 3 MR 9 Qatar RasGas I (T2) Qatar Petroleum, ExxonMobil, KOGAS, Itochu, LNG Japan APC C 3 MR 11 Nigeria NLNG T NNPC, Shell, TOTAL, Eni APC C 3 MR 10 Trinidad ALNG T Shell, BP ConocoPhillips Optimized Cascade 11 Nigeria NLNG T NNPC, Shell, TOTAL, Eni APC C 3 MR 10 Trinidad ALNG T Shell, BP ConocoPhillips Optimized Cascade 7 Malaysia MLNG Tiga (T1-2) PETRONAS, Shell, JX Nippon Oil & Energy, Sarawak State Government, Mitsubishi, JAPEX APC C 3 MR 65
68 Appendix 1: Table of Global Liquefaction Plants (continued) Reference Number Country Project Name Start Year Nameplate Capacity (MTPA) Owners* 9 Qatar RasGas II (T1) Qatar Petroleum, ExxonMobil 8 Australia North West Shelf T Egypt Damietta LNG T1*** Egypt ELNG T1*** BHP Billiton, BP, Chevron, Shell, Woodside, Mitsubishi, Mitsui Gas Natural Fenosa, Eni, EGPC, EGAS Shell, PETRONAS, EGAS, EGPC, ENGIE 9 Qatar RasGas II (T2) Qatar Petroleum, ExxonMobil 13 Egypt ELNG T2*** Oman Qalhat LNG Shell, PETRONAS, EGAS, EGPC Government of Oman, Oman LNG, Gas Natural Fenosa, Eni, Itochu, Mitsubishi, Osaka Gas Liquefaction Technology APC C 3 MR/ Split MR APC C 3 MR APC C 3 MR/ Split MR ConocoPhillips Optimized Cascade APC C 3 MR/ Split MR ConocoPhillips Optimized Cascade APC C 3 MR 10 Trinidad ALNG T Shell, BP, NGC Trinidad ConocoPhillips Optimized Cascade 11 Nigeria NLNG T NNPC, Shell, TOTAL, Eni APC C 3 MR 11 Nigeria NLNG T NNPC, Shell, TOTAL, Eni APC C 3 MR 14 Australia Darwin LNG T ConocoPhillips, Santos, INPEX, Eni, JERA, Tokyo Gas 9 Qatar RasGas II (T3) Qatar Petroleum, ExxonMobil 15 Equatorial Guinea EG LNG T Norway Snøhvit LNG T Marathon, Sonagas, Mitsui, Marubeni Statoil, Petoro, TOTAL, ENGIE, LetterOne ConocoPhillips Optimized Cascade APC C 3 MR/ Split MR ConocoPhillips Optimized Cascade Linde MFC 11 Nigeria NLNG T NNPC, Shell, TOTAL, Eni APC C 3 MR BHP Billiton, BP, 8 Australia North West Shelf T Chevron, Shell, Woodside, Mitsubishi, Mitsui APC C 3 MR 9 Qatar Qatargas II (T1) Qatar Petroleum, ExxonMobil APC AP-X 17 Russia Sakhalin 2 (T1) Gazprom, Shell, Mitsui, Mitsubishi Shell DMR 17 Russia Sakhalin 2 (T2) Gazprom, Shell, Mitsui, Mitsubishi Shell DMR 9 Qatar RasGas III (T1) Qatar Petroleum, ExxonMobil APC AP-X 9 Qatar Qatargas II (T2) Qatar Petroleum, ExxonMobil, TOTAL APC AP-X 18 Indonesia Tangguh LNG T Yemen Yemen LNG T Indonesia Tangguh LNG T BP, CNOOC, JX Nippon Oil & Energy, Mitsubishi, INPEX, KG Berau, Sojitz, Sumitomo, Mitsui TOTAL, Hunt Oil, Yemen Gas Co., SK Group, KOGAS, Hyundai, GASSP BP, CNOOC, JX Nippon Oil & Energy, Mitsubishi, INPEX, KG Berau, Sojitz, Sumitomo, Mitsui APC C 3 MR/ Split MR APC C 3 MR/ Split MR APC C 3 MR/ Split MR 9 Qatar RasGas III (T2) Qatar Petroleum, ExxonMobil APC AP-X 19 Yemen Yemen LNG T Peru Peru LNG T Qatar Qatargas III TOTAL, Hunt Oil, Yemen Gas Co., SK Group, KOGAS, Hyundai, GASSP Hunt Oil, Shell, SK Group, Marubeni Qatar Petroleum, ConocoPhillips, Mitsui APC C3MR/ Split MR APC C3MR/ Split MR APC AP-X 66
69 Appendix 1: Table of Global Liquefaction Plants (continued) Reference Number Country Project Name Start Year Nameplate Capacity (MTPA) Owners* Liquefaction Technology 9 Qatar Qatargas IV Qatar Petroleum, Shell APC AP-X 21 Australia Pluto LNG T Algeria Skikda - GL1K Rebuild 22 Angola Angola LNG T Papua New Guinea Papua New Guinea 5 Algeria PNG LNG T PNG LNG T Arzew - GL3Z (Gassi Touil) Woodside, Kansai Electric, Tokyo Gas Shell propane pre-cooled mixed refrigerant design Sonatrach APC C 3 MR Chevron, Sonangol, BP, Eni, TOTAL ExxonMobil, Oil Search, PNG Government, Santos, JX Nippon Oil & Energy, MRDC, Marubeni, Petromin PNG ExxonMobil, Oil Search, PNG Government, Santos, JX Nippon Oil & Energy, MRDC, Marubeni, Petromin PNG Sonatrach 24 Australia QCLNG T Shell, CNOOC 24 Australia QCLNG T Shell, Tokyo Gas 25 Indonesia Donggi-Senoro LNG Australia GLNG T Australia Australia Pacific LNG T Mitsubishi, Pertamina, KOGAS, Medco Santos, PETRONAS, TOTAL, KOGAS ConocoPhillips, Origin Energy, Sinopec 28 United States Sabine Pass T Cheniere Energy, Blackstone 26 Australia GLNG T Santos, PETRONAS, TOTAL, KOGAS 28 United States Sabine Pass T Cheniere Energy, Blackstone 29 Australia Gorgon LNG T Australia Gorgon LNG T Malaysia MLNG T Chevron, ExxonMobil, Shell, Osaka Gas, Tokyo Gas, JERA Chevron, ExxonMobil, Shell, Osaka Gas, Tokyo Gas, JERA PETRONAS, JX Nippon Oil & Energy, Sabah State ConocoPhillips Optimized Cascade APC C 3 MR APC C 3 MR APC C 3 MR/ Split MR ConocoPhillips Optimized Cascade ConocoPhillips Optimized Cascade APC C 3 MR ConocoPhillips Optimized Cascade ConocoPhillips Optimized Cascade ConocoPhillips Optimized Cascade ConocoPhillips Optimized Cascade ConocoPhillips Optimized Cascade APC C 3 MR/ Split MR APC C 3 MR/ Split MR APC C 3 MR/ Split MR Sources: IHS Markit, Company Announcements * Companies are listed by size of ownership stake, starting with the largest stake ** Kenai LNG s export license is valid until February 2018, though the plant s future exports are uncertain. It did not export cargoes in *** Damietta LNG in Egypt has not operated since the end of 2012; operations at ELNG in Egypt returned in 2016 after the plant did not export cargoes in The Marsa El Brega plant in Libya is included for reference although it has not been operational since
70 Appendix 2: Table of Liquefaction Plants Under Construction Country Project Name Start Year Nameplate Capacity (MTPA) Owners* Australia Australia Pacific LNG T ConocoPhillips, Origin Energy, Sinopec Malaysia PFLNG Satu PETRONAS Indonesia Senkang LNG T EWC United States Sabine Pass LNG T Cheniere Energy, Blackstone Australia Ichthys LNG T INPEX, TOTAL, CPC, Tokyo Gas, Kansai Electric, Osaka Gas, JERA, Toho Gas Cameroon Cameroon FLNG Golar, Keppel Australia Gorgon LNG T Chevron, ExxonMobil, Shell, Osaka Gas, Tokyo Gas, JERA Australia Wheatstone LNG T Chevron, KUFPEC, Woodside, JOGMEC, Mitsubishi, Kyushu Electric, NYK, JERA Russia Yamal LNG T Novatek, TOTAL, CNPC, Silk Road Fund United States Cove Point LNG Dominion Australia Ichthys LNG T Australia Wheatstone LNG T INPEX, TOTAL, CPC, Tokyo Gas, Kansai Electric, Osaka Gas, JERA, Toho Gas Chevron, KUFPEC, Woodside, JOGMEC, Mitsubishi, Kyushu Electric, NYK, JERA United States Elba Island LNG T Kinder Morgan Australia Prelude FLNG Shell, INPEX, KOGAS, CPC United States Cameron LNG T Sempra, Mitsubishi/NYK JV, Mitsui, ENGIE Russia Yamal LNG T Novatek, TOTAL, CNPC, Silk Road Fund United States Cameron LNG T Sempra, Mitsubishi/NYK JV, Mitsui, ENGIE United States Freeport LNG T Freeport LNG, JERA, Osaka Gas United States Corpus Christi LNG T Cheniere Energy United States Elba Island LNG T Kinder Morgan United States Freeport LNG T Freeport LNG, IFM Investors United States Corpus Christi LNG T Cheniere Energy United States Cameron LNG T Sempra, Mitsubishi/NYK JV, Mitsui, ENGIE United States Sabine Pass LNG T Cheniere Energy, Blackstone Russia Yamal LNG T Novatek, TOTAL, CNPC, Silk Road Fund United States Freeport LNG T Freeport LNG Indonesia Tangguh LNG T BP, CNOOC, JX Nippon Oil & Energy, Mitsubishi, INPEX, KG Berau, Sojitz, Sumitomo, Mitsui Malaysia PFLNG PETRONAS Malaysia PFLNG PETRONAS Sources: IHS Markit, Company Announcements * Companies are listed by size of ownership stake, starting with the largest stake. 68
71 Appendix 3: Proposed 3: Proposed Liquefaction Liquefaction Plants by Region Plants (continued) by Region Project Capacity Status Sabine Pass LNG Latest Company Announced Start Date United States Lower 48 DOE/FERC Approval FTA/non-FTA Approval T3-4 9 UC** 2017 DOE/FERC FTA/ non-fta T5 4.5 UC** 2019 DOE/FERC FTA/ non-fta T6 4.5 Pre-FID N/A DOE/FERC FTA/ non-fta Operator Cheniere Energy Cove Point LNG 5.25 UC** 2017 DOE/FERC FTA/ non-fta Dominion Resources Elba Island LNG 2.5 UC** 2018 DOE/FERC FTA/ non-fta Kinder Morgan Cameron LNG Freeport LNG Corpus Christi LNG T UC** 2018 DOE/FERC FTA/ non-fta T4-5 8 Pre-FID 2021 DOE/FERC FTA/ non-fta T UC** DOE/FERC FTA/ non-fta T3 5.1 UC** 2019 DOE/FERC FTA/ non-fta T4 5.1 Pre-FID 2021 N/A N/A T1-2 9 UC** 2019 DOE/FERC FTA/ non-fta T3 4.5 Pre-FID N/A DOE/FERC FTA/ non-fta T4-5 9 Pre-FID N/A DOE FTA American LNG - Titusville 0.6 Pre-FID 2017 DOE FTA Sempra Energy Freeport LNG Liquefaction Cheniere Energy Fortress Investment Group Eagle LNG 0.99 Pre-FID DOE FTA Ferus Natural Gas Fuels Calcasieu Pass LNG 10 Pre-FID 2020 DOE FTA Venture Global Partners CE FLNG 7.5 Pre-FID 2020 DOE FTA Cambridge Energy Holdings Delfin FLNG 12 Pre-FID 2020 DOE FTA Fairwood LNG Main Pass Energy Hub FLNG 24 Pre-FID 2020 DOE FTA Freeport-McMoran Energy Plaquemines LNG 20 Pre-FID 2020 DOE FTA Venture Global LNG Rio Grande LNG 27 Pre-FID DOE FTA NextDecade Barca FLNG 12 Pre-FID 2021 DOE FTA Barca LNG Eos FLNG 12 Pre-FID 2021 DOE FTA Eos LNG Gulf Coast LNG 21 Pre-FID 2021 DOE FTA Gulf Coast LNG Texas LNG 4 Pre-FID 2021 DOE FTA Texas LNG Annova LNG 6 Pre-FID DOE FTA Exelon Golden Pass LNG 15.6 Pre-FID DOE/FERC FTA Golden Pass Products Gulf LNG 10 Pre-FID DOE FTA Kinder Morgan G2 LNG 13.4 Pre-FID 2022 DOE FTA G2 LNG General American LNG 4 Pre-FID 2022 N/A N/A General American LNG Magnolia LNG 8 Pre-FID 2022 DOE/FERC FTA/ non-fta LNG Limited Point Comfort FLNG 9 Pre-FID 2022 N/A N/A Lloyds Energy Group Driftwood LNG 26 Pre-FID N/A N/A Tellurian Investments Port Arthur LNG 10 Pre-FID 2023 DOE FTA Sempra Energy Monkey Island LNG 12 Pre-FID DOE FTA SCT&E Jordan Cove LNG 6 Pre-FID 2024 DOE FTA/ non-fta Veresen Lake Charles LNG 15 Pre-FID N/A DOE/FERC FTA/ non-fta Shell Alturas LNG 1.5 Pre-FID N/A N/A N/A WesPac Commonwealth LNG 1.25 Pre-FID N/A DOE FTA Commonwealth Projects Avocet FLNG N/A Pre-FID N/A N/A N/A Fairwood LNG Energy World Gulf Coast LNG 2 Pre-FID N/A N/A N/A EWC Penn America Energy LNG N/A Pre-FID N/A N/A N/A Penn America Energy Holdings Shoal Point LNG N/A Pre-FID N/A N/A N/A NextDecade 69
72 Appendix 3 (continued) Project Capacity Status Latest Company Announced Start Date Alaska DOE/FERC Approval FTA/non-FTA Approval Operator Alaska-Japan LNG 1 Pre-FID 2021 N/A N/A Resources Energy Inc. Alaska LNG T Pre-FID DOE FTA/ non-fta State of Alaska ** UC denotes Under Construction Project Capacity Status Latest Company Announced Start Date Western Canada NEB Application Status Operator Kitsault FLNG 8 Pre-FID Approved Kitsault Energy Stewart Energy LNG Orca FLNG FLNG 1 5 Pre-FID Approved T Pre-FID Approved 1 4 Pre-FID 2019 Approved Pre-FID N/A Approved Stewart Energy Group Orca LNG NewTimes Energy LNG 12 Pre-FID Approved NewTimes Energy LNG Cedar FLNG 6.4 Pre-FID 2020 Approved Haisla First Nation Woodfibre LNG 2.1 Pre-FID 2020 Approved Pacific Oil and Gas Pacific Northwest T Pre-FID Approved LNG T3 6 Pre-FID N/A Approved PETRONAS Grassy Point LNG 20 Pre-FID 2021 Approved Woodside Discovery LNG 20 Pre-FID Approved Quicksilver Resources WCC LNG T Pre-FID 2025 Approved T Pre-FID N/A Approved ExxonMobil Aurora LNG T Pre-FID 2026 Approved T Pre-FID 2028 Approved Nexen (CNOOC) Kitimat LNG T1 5 Pre-FID N/A T2 5 Pre-FID N/A Approved Chevron LNG Canada T Pre-FID N/A Approved T Pre-FID N/A Approved Shell Malahat FLNG 6 Pre-FID N/A Approved Steelhead Group Prince Rupert LNG T Pre-FID N/A Approved T3 7 Pre-FID N/A Approved Shell Sarita LNG 24 Pre-FID N/A Approved Steelhead Group SK Group Canada LNG N/A Pre-FID N/A Not Filed SK E&S Watson Island LNG N/A Pre-FID N/A Not Filed Watson Island LNG Corp. 70
73 Appendix 3 (continued) Project Capacity Status Eastern Canada Latest Company Announced Start Date NEB Application Status Operator North Shore LNG 1 Pre-FID 2018 Approved SLNGaz AC LNG 15.5 Pre-FID 2020 Approved H-Energy Saguenay LNG 11 Pre-FID 2020 Approved GNL Quebec Goldboro LNG 10 Pre-FID 2021 Approved Pierdae Energy Bear Head LNG 12 Pre-FID 2023 Approved LNG Limited Canaport LNG 5 Pre-FID Stalled Approved Repsol Sources: IHS Markit, Company Announcements Project Capacity Status Mexico Latest Company Announced Start Date Operator PEMEX LNG 5 Pre-FID 2021 PEMEX Costa Azul LNG 2 Pre-FID Sempra Energy Sources: IHS Markit, Company Announcements Project Capacity Status Eastern Australia (CBM) Latest Company Announced Start Date Operator Australia Pacific LNG T2 9 UC** 2017 ConocoPhillips Abbot Point LNG T1-2 1 Pre-FID 2020 T3-4 1 Pre-FID N/A Fisherman s Landing LNG T Pre-FID N/A LNG Limited Gorgon LNG Wheatstone LNG Offshore Australia T UC** 2017 T4 5.2 Pre-FID N/A T UC** T Pre-FID N/A EWC Chevron Chevron Ichthys LNG 8.9 UC** INPEX Prelude FLNG 3.6 UC** 2018 Shell Scarborough FLNG 6.5 Pre-FID 2021 ExxonMobil Bonaparte FLNG 2 Pre-FID N/A ENGIE Browse FLNG Pre-FID N/A Woodside Cash Maple FLNG 2 Pre-FID N/A PTTEP Crux FLNG 2 Pre-FID N/A Shell Darwin LNG T2 3.6 Pre-FID N/A ConocoPhillips Poseidon FLNG 3.9 Pre-FID N/A ConocoPhillips Sunrise FLNG 4 Pre-FID N/A Shell/Woodside Timor Sea LNG 3 Pre-FID N/A MEO ** UC denotes Under Construction 71
74 Appendix 3 (continued) Country Project Capacity Latest Company Announced Start Date Operator Iran Iran FLNG Unknown Russia Gorskaya FLNG Unknown Russia Pechora LNG Altech Group Russia Portovaya LNG Gazprom Djibouti Djibouti FLNG Poly-GCL Equatorial Guinea Fortuna FLNG Golar Mozambique Mamba LNG Eni Congo (Republic) Congo-Brazzaville FLNG NewAge Mauritania Greater Tortue FLNG Kosmos Energy Russia Baltic LNG T Gazprom Russia Sakhalin-2 T Sakhalin Energy Investment Company Mozambique Coral FLNG (Area 4) Eni Papua New Guinea Mozambique Papua New Guinea PNG LNG T ExxonMobil Mozambique LNG (Area 1) T Anadarko Papua LNG T TOTAL Indonesia Abadi LNG T INPEX Russia Tanzania Arctic LNG-2 Tanzania LNG T T N/A Novatek T Statoil T4 5 N/A Shell Indonesia East Dara FLNG 0.83 N/A Black Platinum Energy Nigeria NLNG T N/A Nigeria LNG Papua New Guinea Pandora FLNG 1 N/A Cott Oil & Gas Russia Sakhalin 1 LNG (Far East LNG) 5 N/A ExxonMobil Indonesia Sengkang LNG T N/A EWC Papua New Guinea Western LNG T1 1.5 N/A Repsol Russia Yamal LNG T4 5.5 N/A Novatek 72
75 Appendix 4: Table 4: Table of Regasification of Regasification Terminals (continued) Terminals Reference Number Country Terminal Name Start Year Nameplate Capacity (MTPA) Owners* Concept 1 Spain Barcelona ENAGAS 100% Onshore 2 Japan Negishi TEPCO 50%; Tokyo Gas 50% Onshore 3 US Everett ENGIE 100% Onshore 4 Italy Panigaglia (La Spezia) GNL Italia 100% Onshore 5 France Fos Tonkin ENGIE 100% Onshore 6 Japan Senboku Osaka Gas 100% Onshore 7 Japan Sodegaura TEPCO 50%; Tokyo Gas 50% Onshore 8 Japan Chita LNG Joint/ Chita Kyodo Chubu Electric 50%; Toho Gas 50% Onshore 9 Japan Tobata Kitakyushu LNG 100% Onshore 10 US Cove Point Dominion 100% Onshore 11 US Elba Island KM LNG Operating Partnership 100% Onshore 12 Japan Himeji Osaka Gas 100% Onshore 13 France Montoir-de- Bretagne ENGIE 100% Onshore 14 US Lake Charles Energy Transfer Equity 100% Onshore 15 Japan Chita Chubu Electric 50%; Toho Gas 50% Onshore 16 Japan Higashi- Ohgishima TEPCO 100% Onshore 17 Japan Nihonkai (Niigata) Nihonkai LNG 58.1%; Tohoku Electric 41.9% Onshore 18 Japan Futtsu TEPCO 100% Onshore 19 Korea Pyeong-Taek KOGAS 100% Onshore 20 Japan Yokkaichi LNG Works Chubu Electric 100% Onshore 21 Belgium Zeebrugge Publigas 89.97%; Fluxys 10.03% Onshore 22 Spain Huelva ENAGAS 100% Onshore 23 Spain Cartagena ENAGAS 100% Onshore 24 Japan Oita Kyushu Electric 100% Onshore 25 Japan Yanai Chugoku Electric 100% Onshore 26 Taiwan Yong an (Kaohsiung) CPC 100% Onshore 27 Turkey Marmara Ereglisi Botas 100% Onshore 28 Korea Incheon KOGAS 100% Onshore 29 Japan Sodeshi Shizuoka Gas 65%; TonenGeneral 35% Onshore 30 Japan Kawagoe Chubu Electric 100% Onshore 31 Japan Ohgishima Tokyo Gas 100% Onshore 32 Puerto Rico Peñuelas (EcoElectrica) Gas Natural Fenosa 47.5%; ENGIE 35%; Mitsui 15%; GE Capital 2.5% Onshore 33 Greece Revithoussa DEPA 100% Onshore 34 Japan Chita Midorihama Works Toho Gas 100% Onshore 35 Korea Tong-Yeong KOGAS 100% Onshore 73
76 Appendix 4: Table of Regasification Terminals (continued) Reference Number Country Terminal Name Start Year Nameplate Capacity (MTPA) Owners* Concept 36 Dominican Republic AES Andrés AES 92%; Estrella-Linda 8% Onshore 37 Spain Bilbao (BBG) ENAGAS 70%; EVE 30% Onshore 38 India Dahej LNG Petronet LNG 100% Onshore 39 Portugal Sines LNG REN 100% Onshore 40 UK Grain LNG National Grid Transco 100% Onshore 41 Korea Gwangyang Posco 100% Onshore 42 India Hazira LNG Shell 74%; TOTAL 26% Onshore 43 Japan Sakai Kansai Electric 70%; Cosmo Oil 12.5%; Iwatani Onshore 12.5%; Ube Industries 5% 44 Turkey Aliaga LNG Egegaz 100% Onshore 45 Mexico Altamira LNG Vopak 60%; ENAGAS 40% Onshore 46 China Guangdong Dapeng LNG I Japan Mizushima LNG Spain Saggas (Sagunto) Spain Mugardos LNG (El Ferrol) Local companies 37%; CNOOC 33%; BP 30% Chugoku Electric 50%; JX Nippon Oil & Energy 50% ENAGAS 72.5%; Osaka Gas 20%; Oman Oil 7.5% Grupo Tojeiro 50.36%; Gobierno de Galicia 24.64%; First State Regasificadora 15%; Sonatrach 10% Onshore Onshore Onshore Onshore 50 Mexico Costa Azul Sempra 100% Onshore 51 US Freeport LNG Michael S Smith Cos 57.5%; Global Infrastructure Partners 25%; Osaka Gas 10%; Dow Onshore Chemical 7.5% 52 China Fujian Putian CNOOC 60%; Fujian Investment and Onshore Development Co 40% 53 US Northeast Gateway Excelerate Energy 100% Floating 54 US Sabine Pass Cheniere Energy 100% Onshore 55 Argentina Bahia Blanca GasPort YPF 50%; Stream JV 50% Floating 56 Italy Adriatic LNG/ Rovigo US Cameron LNG ExxonMobil 46.35%; Qatar Petroleum 46.35%; Edison 7.3% Sempra 50.2%; ENGIE 16.6%; Mitsubishi 16.6%; Mitsui 16.6% Offshore Onshore 58 Canada Canaport Repsol 75%; Irving Oil 25% Onshore 59 UK Dragon LNG Shell 50%; PETRONAS 30%; 4Gas 20% Onshore 60 Kuwait Mina Al-Ahmadi Kuwait Petroleum Corporation 100% Floating 61 Brazil Pecém Petrobras 100% Floating 62 Chile Quintero LNG ENAGAS 60.4%; ENAP 20%; Oman Oil 19.6% Onshore 63 China Shanghai Yangshan Shenergy Group 55%; CNOOC 45% Onshore 74
77 Appendix 4: Table of Regasification Terminals (continued) Reference Number Country Terminal Name Start Year Nameplate Capacity (MTPA) Owners* Concept 64 UK South Hook Qatar Petroleum 67.5%; ExxonMobil 24.15%; Onshore TOTAL 8.35% 65 Taiwan Taichung LNG CPC 100% Onshore 66 Brazil Guanabara LNG Petrobras 100% Floating 67 UAE Dubai Dubai Supply Authority (Dusup) 100% Floating 68 France FosMax LNG (Fos Cavaou) ENGIE 71.5%; TOTAL 28.5% Onshore 69 Chile Mejillones LNG ENGIE 63%; Codelco 37% Onshore 70 China Liaoning Dalian CNPC 75%; Dalian Port 20%; Dalian Construction Onshore Investment Corp 5% 71 Netherlands GATE LNG Gasunie 40%; Vopak 40%; Dong 5%; EconGas OMV 5%; Onshore EON 5%; RWE 5% 72 US Golden Pass Qatar Petroleum 70%; ExxonMobil 17.6%; Onshore ConocoPhillips 12.4% 73 US Gulf LNG KM LNG Operating Partnership 50%; General Onshore Electric 40%; AES 10% 74 Argentina Puerto Escobar Enarsa 50%; YPF 50% Floating 75 Thailand Map Ta Phut LNG PTT 100% Onshore 76 China Jiangsu Rudong LNG PetroChina 55%; Pacific Oil and Gas 35%; Jiangsu Guoxin 10% Onshore 77 Indonesia Nusantara Pertamina 60%; PGN 40% Floating 78 Japan Ishikari LNG Hokkaido Gas 100% Onshore 79 Japan Joetsu Chubu Electric 100% Onshore 80 Mexico Manzanillo Mitsui 37.5%; Samsung 37.5%; KOGAS 25% Onshore 81 China Guangzhou Dongguan LNG Jovo Group 100% Onshore 82 Israel Hadera Gateway Israel Natural Gas Lines 100% Floating 83 India Dabhol GAIL 31.52%; NTPC 31.52%; Indian financial institutions 20.28%; MSEB Holding Co. Onshore 16.68% 84 Spain El Musel ENAGAS 100% Onshore 85 Singapore Singapore LNG Singapore Energy Market Authority 100% Onshore 86 Malaysia Lekas LNG (Malacca) PETRONAS 100% Onshore 87 China Zhejiang Ningbo CNOOC 51%; Zhejiang Energy Group Co Ltd 29%; Ningbo Power Development Co Ltd 20% Onshore 88 China Guangdong Zhuhai LNG (CNOOC) CNOOC 30%; Guangdong Gas 25%; Guangdong Yuedian 25%; Local companies 20% Onshore 75
78 Appendix 4: Table of Regasification Terminals (continued) Reference Number 89 Italy 90 China Country Terminal Name Start Year Livorno/LNG Toscana Hebei Tangshan Caofeidian LNG Nameplate Capacity (MTPA) Owners* EON 46.79%; IREN 46.79%; OLT Energy 3.73%; Golar 2.69% CNPC 51%; Beijing Enterprises Group 29%; Hebei Natural Gas 20% Concept Floating Onshore 91 China Tianjin CNOOC 100% Floating 92 Japan Naoetsu (Joetsu) INPEX 100% Onshore 93 India Kochi LNG Petronet LNG 100% Onshore 94 Brazil Bahia/TRBA Petrobras 100% Floating 95 Indonesia Lampung LNG PGN 100% Floating 96 Korea Samcheok KOGAS 100% Onshore 97 China Hainan Yangpu LNG Japan Hibiki LNG China Shandong Qingdao LNG CNOOC 65%; Hainan Development Holding Co 35% Saibu Gas 90%; Kyushu Electric 10% Sinopec 99%; Qingdao Port Group 1% Onshore Onshore Onshore 100 Lithuania Klaipeda LNG Klaipedos Nafta 100% Floating 101 Indonesia Arun LNG Pertamina 70%; Aceh Regional Government 30% Onshore 102 Japan Hachinohe LNG JX Nippon Oil & Energy 100% Onshore 103 Egypt Ain Sokhna Hoegh EGAS 100% Floating 104 Pakistan Engro LNG Engro Corp. 100% Floating 105 Jordan Aqaba LNG Jordan Ministry of Energy and Mineral Resources (MEMR) Floating 100% 106 Egypt Ain Sokhna BW EGAS 100% Floating 107 Japan Shin-Sendai Tohoku Electric 100% Onshore 108 Japan Hitachi Tokyo Gas 100% Onshore 109 China Guangxi Beihai LNG Sinopec 100% Onshore 110 Poland Swinoujscie GAZ-SYSTEM SA 100% Onshore 111 UAE Abu Dhabi LNG ADNOC 100% Floating 112 France Dunkirk LNG EDF 65%; Fluxys 25%; TOTAL 10% Onshore 113 Korea Boryeong GS Group 50%; SK Group 50% Onshore 114 Turkey Etki LNG Etki Liman Isletmeleri Dolgalgaz Ithalat ve Ticaret 100% Floating 76
79 Appendix 5: Table of Regasification Terminals Under Construction Reference Number 115 China 116 China 117 China Country Terminal Name Start Year Guangdong Shenzhen (Diefu) (CNOOC) Tianjin (Onshore) Phase 1 Tianjin (Sinopec) Phase 1 Nameplate Capacity (MTPA) Owners* CNOOC 70%; Shenzhen Energy Group 30% Concept Onshore CNOOC 100% Onshore Sinopec 100% Onshore 118 India Mundra GSPC 50%; Adani Group 50% Onshore 119 China Guangdong Yuedong LNG Shenergy 55%; CNOOC 45% Onshore 120 Colombia Cartagena LNG Grupo Tojeiro 100% Floating 121 Philippines 122 China 123 Pakistan Pagbilao LNG Hub Guangdong Shenzhen (CNPC) PGPC Port Qasim Energy World Corporation 100% CNPC 51%; CLP 24.5%; Shenzhen Gas 24.5% Pakistan LNG Terminals Limited 100% Onshore Onshore Floating 124 Russia Kaliningrad LNG Gazprom 100% Floating 125 China Fujian Zhangzhou CNOOC 60%; Fujian Investment and Onshore Development Co 40% 126 Japan Soma LNG Japex 100% Onshore 127 Malaysia 128 China RGT-2 (Pengerang LNG) Zhejiang Zhoushan (ENN) India Ennore LNG Bahrain Bahrain LNG India Jafrabad LNG Port PETRONAS 65%; Dialog Group 25%; Johor Government 10% Onshore ENN Energy 100% Onshore Indian Oil Corporation 95%; Tamil Nadu Industrial Development Corporation 5% NOGA 30%; Teekay Corp 30%; Samsung 20%; Gulf Investment Corporation 20% Exmar 50%; Swan Energy 26%; Gujarat Government 26%; Tata Group 10% Onshore Floating Floating 132 Brazil Sergipe (CELSE) Golar 50%; GenPower 50% Floating 133 Kuwait Al Zour Kuwait Petroleum Corporation 100% Onshore Note: Under construction expansion projects at existing terminals are not included in these totals. 77
80 Appendix 6: Table 6: Table of Active of LNG Active Fleet LNG (continued) Fleet Ship Name Shipowner Shipbuilder Type Delivery Year Capacity (cm) Propulsion Type AAMIRA Nakilat Samsung Q-Max ,912 SSD ABADI Brunei Gas Carriers Mitsubishi Conventional ,269 Steam ADAM LNG AL AAMRIYA Oman Shipping Co (OSC) NYK, K Line, MOL, Iino, Mitsui, Nakilat IMO # Hyundai Conventional ,000 TFDE Daewoo Q-Flex ,958 SSD AL AREESH Nakilat, Teekay Daewoo Conventional ,786 Steam AL BAHIYA Nakilat Daewoo Q-Flex ,981 SSD AL BIDDA J4 Consortium Kawaski Conventional ,466 Steam AL DAAYEN Nakilat, Teekay Daewoo Conventional ,853 Steam AL DAFNA Nakilat Samsung Q-Max ,988 SSD AL DEEBEL MOL, NYK, K Line Samsung Conventional ,795 Steam AL GATTARA Nakilat, OSC Hyundai Q-Flex ,200 SSD AL GHARIYA Commerz Real, Nakilat, PRONAV Daewoo Q-Flex ,941 SSD AL GHARRAFA Nakilat, OSC Hyundai Q-Flex ,200 SSD AL GHASHAMIYA Nakilat Samsung Q-Flex ,885 SSD AL GHUWAIRIYA Nakilat Daewoo Q-Max ,984 SSD AL HAMLA Nakilat, OSC Samsung Q-Flex ,862 SSD AL HAMRA National Gas Shipping Co Kvaerner Masa Conventional ,000 Steam AL HUWAILA Nakilat, Teekay Samsung Q-Flex ,176 SSD AL JASRA J4 Consortium Mitsubishi Conventional ,855 Steam AL JASSASIYA Maran G.M, Nakilat Daewoo Conventional ,988 Steam AL KARAANA Nakilat Daewoo Q-Flex ,988 SSD AL KHARAITIYAT Nakilat Hyundai Q-Flex ,986 SSD AL KHARSAAH Nakilat, Teekay Samsung Q-Flex ,885 SSD AL KHATTIYA Nakilat Daewoo Q-Flex ,993 SSD AL KHAZNAH National Gas Shipping Co Mitsui Conventional ,540 Steam AL KHOR J4 Consortium Mitsubishi Conventional ,295 Steam AL KHUWAIR Nakilat, Teekay Samsung Q-Flex ,885 SSD AL MAFYAR Nakilat Samsung Q-Max ,043 SSD AL MARROUNA Nakilat, Teekay Daewoo Conventional ,539 Steam AL MAYEDA Nakilat Samsung Q-Max ,157 SSD AL NUAMAN Nakilat Daewoo Q-Flex ,981 SSD AL ORAIQ NYK, K Line, MOL, Iino, Mitsui, Nakilat Daewoo Q-Flex ,994 SSD AL RAYYAN J4 Consortium Kawaski Conventional ,671 Steam AL REKAYYAT Nakilat Hyundai Q-Flex ,986 SSD AL RUWAIS Commerz Real, Nakilat, PRONAV Daewoo Q-Flex ,941 SSD AL SADD Nakilat Daewoo Q-Flex ,963 SSD AL SAFLIYA AL SAHLA Commerz Real, Nakilat, PRONAV NYK, K Line, MOL, Iino, Mitsui, Nakilat Daewoo Q-Flex ,100 SSD Hyundai Q-Flex ,842 SSD AL SAMRIYA Nakilat Daewoo Q-Max ,054 SSD AL SHAMAL Nakilat, Teekay Samsung Q-Flex ,536 SSD AL SHEEHANIYA Nakilat Daewoo Q-Flex ,963 SSD
81 Appendix 6: Table of Active LNG Fleet (continued) Ship Name Shipowner Shipbuilder Type Delivery Year Capacity (cm) Propulsion Type AL THAKHIRA K Line, Qatar Shpg. Samsung Conventional ,517 Steam AL THUMAMA AL UTOURIYA NYK, K Line, MOL, Iino, Mitsui, Nakilat NYK, K Line, MOL, Iino, Mitsui, Nakilat IMO # Hyundai Q-Flex ,235 SSD Hyundai Q-Flex ,879 SSD AL WAJBAH J4 Consortium Mitsubishi Conventional ,562 Steam AL WAKRAH J4 Consortium Kawaski Conventional ,624 Steam AL ZUBARAH J4 Consortium Mitsui Conventional ,510 Steam ALTO ACRUX TEPCO, NYK, Mitsubishi Mitsubishi Conventional ,798 Steam AMADI Brunei Gas Carriers Hyundai Conventional ,000 Steam Reheat AMALI Brunei Gas Carriers Daewoo Conventional ,228 TFDE AMANI Brunei Gas Carriers Hyundai Conventional ,000 TFDE AMUR RIVER Dynagas Hyundai Conventional ,748 Steam ARCTIC AURORA Dynagas Hyundai Conventional ,880 TFDE ARCTIC DISCOVERER K Line, Statoil, Mitsui, Iino Mitsui Conventional ,759 Steam ARCTIC LADY Hoegh Mitsubishi Conventional ,835 Steam ARCTIC PRINCESS Hoegh, MOL, Statoil Mitsubishi Conventional ,835 Steam ARCTIC SPIRIT Teekay I.H.I. Conventional ,305 Steam ARCTIC VOYAGER K Line, Statoil, Mitsui, Iino Kawaski Conventional ,071 Steam ARKAT Brunei Gas Carriers Daewoo Conventional ,228 TFDE ARWA SPIRIT Teekay, Marubeni Samsung Conventional ,285 DFDE ASEEM MOL, NYK, K Line, SCI, Nakilat, Petronet Samsung Conventional ,948 TFDE ASIA ENDEAVOUR Chevron Samsung Conventional ,948 TFDE ASIA ENERGY Chevron Samsung Conventional ,948 TFDE ASIA EXCELLENCE Chevron Samsung Conventional ,948 TFDE ASIA VISION Chevron Samsung Conventional ,948 TFDE ATLANTIC ENERGY Sinokor Merchant Marine Kockums Conventional ,588 Steam BACHIR CHIHANI Sonatrach CNIM Conventional ,767 Steam BARCELONA KNUTSEN Knutsen OAS Daewoo Conventional ,400 TFDE BEBATIK Shell Chantiers de l'atlantique Conventional ,056 Steam BEIDOU STAR MOL, China LNG Hudong- Zhonghua Conventional ,000 MEGI BELANAK Shell Ch.De La Ciotat Conventional ,000 Steam BERGE ARZEW BW Daewoo Conventional ,089 Steam BILBAO KNUTSEN Knutsen OAS IZAR Conventional ,049 Steam BRITISH DIAMOND BP Hyundai Conventional ,883 DFDE BRITISH EMERALD BP Hyundai Conventional ,983 DFDE BRITISH INNOVATOR BP Samsung Conventional ,135 Steam BRITISH MERCHANT BP Samsung Conventional ,517 Steam BRITISH RUBY BP Hyundai Conventional ,000 DFDE BRITISH SAPPHIRE BP Hyundai Conventional ,000 DFDE BRITISH TRADER BP Samsung Conventional ,248 Steam BROOG J4 Consortium Mitsui Conventional ,359 Steam BU SAMRA Nakilat Samsung Q-Max ,928 SSD
82 Appendix 6: Table of Active LNG Fleet (continued) Ship Name Shipowner Shipbuilder Type Delivery Year Capacity (cm) Propulsion Type BW GDF SUEZ BOSTON BW, ENGIE Daewoo Conventional ,059 Steam BW GDF SUEZ BRUSSELS BW Daewoo Conventional ,514 DFDE BW GDF SUEZ EVERETT BW Daewoo Conventional ,028 Steam BW GDF SUEZ PARIS BW Daewoo Conventional ,524 TFDE BW PAVILION LEEARA BW Hyundai Conventional ,880 TFDE BW PAVILION VANDA BW Pavilion LNG Hyundai Conventional ,880 TFDE CADIZ KNUTSEN Knutsen OAS IZAR Conventional ,240 Steam CASTILLO DE SANTISTEBAN Anthony Veder STX Conventional ,673 TFDE CASTILLO DE VILLALBA Anthony Veder IZAR Conventional ,420 Steam CATALUNYA SPIRIT Teekay IZAR Conventional ,423 Steam CELESTINE RIVER K Line Kawaski Conventional ,394 Steam CESI GLADSTONE CESI QINGDAO CHEIKH BOUAMAMA CHEIKH EL MOKRANI Chuo Kaiun/Shinwa Chem. China Shipping Group HYPROC, Sonatrach, Itochu, MOL HYPROC, Sonatrach, Itochu, MOL Hudong- Zhonghua Hudong- Zhonghua IMO # Conventional ,000 TFDE Conventional ,000 TFDE Universal Conventional ,245 Steam Universal Conventional ,990 Steam CLEAN ENERGY Dynagas Hyundai Conventional ,794 Steam CLEAN HORIZON Avoca Maritime Corp Ltd Hyundai Conventional ,000 TFDE CLEAN OCEAN Dynagas Hyundai Conventional ,000 TFDE CLEAN PLANET Dynagas Hyundai Conventional ,000 TFDE CLEAN VISION Dynagas Hyundai Conventional ,000 TFDE COOL EXPLORER Thenamaris Samsung Conventional ,000 TFDE COOL RUNNER Thenamaris Samsung Conventional ,000 TFDE COOL VOYAGER Thenamaris Samsung Conventional ,000 TFDE CORCOVADO LNG Cardiff Marine Daewoo Conventional ,800 TFDE CREOLE SPIRIT Teekay Daewoo Conventional ,400 MEGI CUBAL Mitsui, NYK, Teekay Samsung Conventional ,948 TFDE CYGNUS PASSAGE TEPCO, NYK, Mitsubishi Mitsubishi Conventional ,400 Steam DAPENG MOON China LNG Ship Mgmt. Hudong- Zhonghua Conventional ,200 Steam DAPENG STAR China LNG Ship Mgmt. Hudong- Zhonghua Conventional ,200 Steam DAPENG SUN China LNG Ship Mgmt. Hudong- Zhonghua Conventional ,200 Steam DISHA MOL, NYK, K Line, SCI, Nakilat Daewoo Conventional ,026 Steam DOHA J4 Consortium Mitsubishi Conventional ,203 Steam DUHAIL Commerz Real, Nakilat, PRONAV Daewoo Q-Flex ,100 SSD DUKHAN J4 Consortium Mitsui Conventional ,672 Steam DWIPUTRA P.T. Humpuss Trans Mitsubishi Conventional ,386 Steam EAST ENERGY Sinokor Merchant Marine Chantiers de l'atlantique Conventional ,255 Steam
83 Appendix 6: Table of Active LNG Fleet (continued) Ship Name Shipowner Shipbuilder Type EJNAN K Line, MOL, NYK, Mitsui, Nakilat Delivery Year Capacity (cm) Propulsion Type IMO # Samsung Conventional ,815 Steam EKAPUTRA 1 P.T. Humpuss Trans Mitsubishi Conventional ,400 Steam ENERGY ADVANCE Tokyo Gas Kawaski Conventional ,590 Steam ENERGY ATLANTIC Alpha Tankers STX Conventional ,521 TFDE ENERGY CONFIDENCE Tokyo Gas, NYK Kawaski Conventional ,880 Steam ENERGY FRONTIER Tokyo Gas Kawaski Conventional ,596 Steam ENERGY HORIZON NYK, TLTC Kawaski Conventional ,441 Steam ENERGY NAVIGATOR Tokyo Gas, MOL Kawaski Conventional ,558 Steam ENERGY PROGRESS MOL Kawaski Conventional ,596 Steam ESSHU MARU Mitsubishi, MOL, Chubu Electric Mitsubishi Conventional ,300 Steam EXCALIBUR Excelerate, Teekay Daewoo Conventional ,000 Steam EXCEL Exmar, MOL Daewoo Conventional ,344 Steam EXCELSIOR Exmar Daewoo FSRU ,000 Steam EXPRESS Exmar, Excelerate Daewoo FSRU ,900 Steam FRAIHA NYK, K Line, MOL, Iino, Mitsui, Nakilat Daewoo Q-Flex ,950 SSD FUJI LNG Cardiff Marine Kawaski Conventional ,596 Steam FUWAIRIT K Line, MOL, NYK, Nakilat Samsung Conventional ,262 Steam GALEA Shell Mitsubishi Conventional ,269 Steam GALICIA SPIRIT Teekay Daewoo Conventional ,814 Steam GALLINA Shell Mitsubishi Conventional ,269 Steam GANDRIA Golar LNG HDW Conventional ,512 Steam GASELYS GDF SUEZ, NYK Chantiers de l'atlantique Conventional ,383 DFDE GASLOG CHELSEA GasLog Hanjin H.I. Conventional ,600 DFDE GASLOG GENEVA Anthony Veder Samsung Conventional ,000 TFDE GASLOG GIBRALTAR GasLog Samsung Conventional ,000 TFDE GASLOG GLASGOW GasLog Samsung Conventional ,000 TFDE GASLOG GREECE GasLog Samsung Conventional ,520 TFDE GASLOG SALEM GasLog Samsung Conventional ,000 TFDE GASLOG SANTIAGO GasLog Samsung Conventional ,948 TFDE GASLOG SARATOGA GasLog Samsung Conventional ,000 TFDE GASLOG SAVANNAH GasLog Samsung Conventional ,948 TFDE GASLOG SEATTLE GasLog Samsung Conventional ,948 TFDE GASLOG SHANGHAI GasLog Samsung Conventional ,948 TFDE GASLOG SINGAPORE GasLog Samsung Conventional ,948 TFDE GASLOG SKAGEN GasLog Samsung Conventional ,948 TFDE GASLOG SYDNEY GasLog Samsung Conventional ,948 TFDE GDF SUEZ GLOBAL ENERGY GDF SUEZ POINT FORTIN GDF SUEZ MOL, Sumitomo, LNG JAPAN Chantiers de l'atlantique Conventional ,130 Steam Imabari Conventional ,982 Steam GEMMATA Shell Mitsubishi Conventional ,269 Steam GHASHA National Gas Shipping Co Mitsui Conventional ,100 Steam
84 Appendix 6: Table of Active LNG Fleet (continued) Ship Name Shipowner Shipbuilder Type Delivery Year Capacity (cm) Propulsion Type GIGIRA LAITEBO MOL, Itochu Hyundai Conventional ,870 TFDE GIMI Golar LNG Rosenberg Verft Conventional ,388 Steam GOLAR ARCTIC Golar LNG Daewoo Conventional ,814 Steam GOLAR BEAR Golar LNG Samsung Conventional ,000 TFDE GOLAR CELSIUS Golar LNG Samsung Conventional ,000 TFDE GOLAR CRYSTAL Golar LNG Samsung Conventional ,000 TFDE GOLAR FROST Golar LNG Samsung Conventional ,000 TFDE GOLAR GLACIER ICBC Hyundai Conventional ,500 TFDE GOLAR GRAND Golar LNG Partners Daewoo Conventional ,700 Steam GOLAR ICE ICBC Samsung Conventional ,000 TFDE GOLAR KELVIN ICBC Hyundai Conventional ,000 TFDE GOLAR MARIA Golar LNG Partners Daewoo Conventional ,700 Steam GOLAR MAZO Golar LNG Partners Mitsubishi Conventional ,000 Steam GOLAR PENGUIN Golar LNG Samsung Conventional ,000 TFDE GOLAR SEAL Golar LNG Samsung Conventional ,000 TFDE GOLAR SNOW ICBC Samsung Conventional ,000 TFDE GRACE ACACIA NYK Hyundai Conventional ,791 Steam GRACE BARLERIA NYK Hyundai Conventional ,770 Steam GRACE COSMOS MOL, NYK Hyundai Conventional ,794 Steam GRACE DAHLIA NYK Kawaski Conventional ,425 Steam GRAND ANIVA NYK, Sovcomflot Mitsubishi Conventional ,000 Steam GRAND ELENA NYK, Sovcomflot Mitsubishi Conventional ,968 Steam GRAND MEREYA MOL, K Line, Primorsk Mitsui Conventional ,964 Steam HANJIN MUSCAT Hanjin Shipping Co. Hanjin H.I. Conventional ,366 Steam HANJIN PYEONG TAEK Hanjin Shipping Co. Hanjin H.I. Conventional ,366 Steam HANJIN RAS LAFFAN Hanjin Shipping Co. Hanjin H.I. Conventional ,214 Steam HANJIN SUR Hanjin Shipping Co. Hanjin H.I. Conventional ,333 Steam HISPANIA SPIRIT Teekay Daewoo Conventional ,814 Steam HYUNDAI AQUAPIA Hyundai LNG Shipping Hyundai Conventional ,400 Steam HYUNDAI COSMOPIA Hyundai LNG Shipping Hyundai Conventional ,308 Steam HYUNDAI ECOPIA Hyundai LNG Shipping Hyundai Conventional ,790 Steam HYUNDAI GREENPIA Hyundai LNG Shipping Hyundai Conventional ,000 Steam HYUNDAI OCEANPIA Hyundai LNG Shipping Hyundai Conventional ,300 Steam HYUNDAI TECHNOPIA Hyundai LNG Shipping Hyundai Conventional ,524 Steam HYUNDAI UTOPIA Hyundai LNG Shipping Hyundai Conventional ,182 Steam IBERICA KNUTSEN Knutsen OAS Daewoo Conventional ,230 Steam IBRA LNG OSC, MOL Samsung Conventional ,951 Steam IBRI LNG OSC, MOL, Mitsubishi Mitsubishi Conventional ,173 Steam ISH National Gas Shipping Co Mitsubishi Conventional ,512 Steam K. ACACIA Korea Line Daewoo Conventional ,017 Steam K. FREESIA Korea Line Daewoo Conventional ,015 Steam K. JASMINE Korea Line Daewoo Conventional ,961 Steam K. MUGUNGWHA Korea Line Daewoo Conventional ,776 Steam IMO # 82
85 Appendix 6: Table of Active LNG Fleet (continued) Ship Name Shipowner Shipbuilder Type Delivery Year Capacity (cm) Propulsion Type KITA LNG Cardiff Marine Daewoo Conventional ,800 TFDE KUMUL MOL, China LNG Hudong- Zhonghua IMO # Conventional ,147 SSD LA MANCHA KNUTSEN Knutsen OAS Hyundai Conventional ,300 MEGI LALLA FATMA N'SOUMER HYPROC Kawaski Conventional ,888 Steam LARBI BEN M'HIDI HYPROC CNIM Conventional ,500 Steam LENA RIVER Dynagas Hyundai Conventional ,880 TFDE LIJMILIYA Nakilat Daewoo Q-Max ,019 SSD LNG ABALAMABIE Nigeria LNG Ltd Samsung Conventional ,000 MEGI LNG ABUJA II Nigeria LNG Ltd Samsung Conventional ,180 DFDE LNG ADAMAWA BGT Ltd. Hyundai Conventional ,656 Steam LNG AKWA IBOM BGT Ltd. Hyundai Conventional ,656 Steam LNG AQUARIUS Hanochem General Dynamics Conventional ,750 Steam LNG BARKA OSC, OG, NYK, K Line Kawaski Conventional ,880 Steam LNG BAYELSA BGT Ltd. Hyundai Conventional ,500 Steam LNG BENUE BW Daewoo Conventional ,988 Steam LNG BONNY II Nigeria LNG Ltd Hyundai Conventional ,000 DFDE LNG BORNO NYK Samsung Conventional ,600 Steam LNG CROSS RIVER BGT Ltd. Hyundai Conventional ,656 Steam LNG DREAM NYK Kawaski Conventional ,326 Steam LNG EBISU MOL, KEPCO Kawaski Conventional ,546 Steam LNG ENUGU BW Daewoo Conventional ,988 Steam LNG FINIMA II Nigeria LNG Ltd Samsung Conventional ,000 DFDE LNG FLORA NYK, Osaka Gas Kawaski Conventional ,637 Steam LNG FUKUROKUJU MOL, KEPCO Kawasaki Sakaide Conventional ,700 Steam Reheat LNG IMO BW Daewoo Conventional ,452 Steam LNG JAMAL NYK, Osaka Gas Mitsubishi Conventional ,977 Steam LNG JUPITER Osaka Gas, NYK Kawaski Conventional ,880 Steam LNG JUROJIN MOL, KEPCO Mitsubishi Conventional ,300 Steam Reheat LNG KANO BW Daewoo Conventional ,565 Steam LNG KOLT STX Pan Ocean Hanjin H.I. Conventional ,595 Steam LNG LAGOS II Nigeria LNG Ltd Hyundai Conventional ,000 DFDE LNG LERICI ENI Sestri Conventional ,993 Steam LNG LIBRA Hoegh General Dynamics Conventional ,000 Steam LNG LOKOJA BW Daewoo Conventional ,471 Steam LNG MALEO MOL, NYK, K Line Mitsui Conventional ,544 Steam LNG MARS Osaka Gas, MOL Mitsubishi Conventional ,000 Steam Reheat LNG OGUN NYK Samsung Conventional ,600 Steam LNG ONDO BW Daewoo Conventional ,478 Steam LNG OYO BW Daewoo Conventional ,988 Steam LNG PIONEER MOL Daewoo Conventional ,000 Steam LNG PORT- HARCOURT II Nigeria LNG Ltd Samsung Conventional ,000 MEGI LNG PORTOVENERE ENI Sestri Conventional ,262 Steam
86 Appendix 6: Table of Active LNG Fleet (continued) Ship Name Shipowner Shipbuilder Type Delivery Year Capacity (cm) Propulsion Type LNG RIVER NIGER BGT Ltd. Hyundai Conventional ,656 Steam LNG RIVER ORASHI BW Daewoo Conventional ,988 Steam LNG RIVERS BGT Ltd. Hyundai Conventional ,500 Steam LNG SATURN MOL Mitsubishi Conventional ,000 Steam Reheat LNG SOKOTO BGT Ltd. Hyundai Conventional ,500 Steam LNG VENUS Osaka Gas, MOL Mitsubishi Conventional ,300 Steam LOBITO Mitsui, NYK, Teekay Samsung Conventional ,948 TFDE LUSAIL K Line, MOL, NYK, Nakilat IMO # Samsung Conventional ,808 Steam MADRID SPIRIT Teekay IZAR Conventional ,423 Steam MAGELLAN SPIRIT Teekay, Marubeni Samsung Conventional ,194 DFDE MALANJE Mitsui, NYK, Teekay Samsung Conventional ,948 TFDE MARAN GAS ACHILLES Maran Gas Maritime Hyundai Conventional ,000 MEGI MARAN GAS AGAMEMNON Maran Gas Maritime Hyundai Conventional ,000 MEGI MARAN GAS ALEXANDRIA Maran Gas Maritime Hyundai Conventional ,000 TFDE MARAN GAS AMPHIPOLIS Maran Gas Maritime Daewoo Conventional ,400 DFDE MARAN GAS APOLLONIA Maran Gas Maritime Hyundai Conventional ,000 TFDE MARAN GAS ASCLEPIUS Maran G.M, Nakilat Daewoo Conventional ,906 Steam MARAN GAS CORONIS Maran G.M, Nakilat Daewoo Conventional ,889 Steam MARAN GAS DELPHI Maran Gas Maritime Daewoo Conventional ,800 TFDE MARAN GAS EFESSOS Maran Gas Maritime Daewoo Conventional ,800 TFDE MARAN GAS HECTOR Maran Gas Maritime Hyundai Conventional ,000 TFDE MARAN GAS LINDOS Maran Gas Maritime Daewoo Conventional ,800 TFDE MARAN GAS MYSTRAS Maran Gas Maritime Daewoo Conventional ,800 TFDE MARAN GAS OLYMPIAS Maran Gas Maritime Daewoo Conventional ,400 TFDE MARAN GAS PERICLES Maran Gas Maritime Hyundai Conventional ,000 DFDE MARAN GAS POSIDONIA Maran Gas Maritime Hyundai Conventional ,000 TFDE MARAN GAS SPARTA Maran Gas Maritime Hyundai Conventional ,000 TFDE MARAN GAS TROY Maran Gas Maritime Daewoo Conventional ,800 TFDE MARIA ENERGY Tsakos Hyundai Conventional ,000 TFDE MARIB SPIRIT Teekay Samsung Conventional ,280 DFDE MEKAINES Nakilat Samsung Q-Max ,137 SSD MERIDIAN SPIRIT Teekay, Marubeni Samsung Conventional ,285 TFDE MESAIMEER Nakilat Hyundai Q-Flex ,986 SSD METHANE ALISON VICTORIA BG Group Samsung Conventional ,000 Steam METHANE BECKI ANNE GasLog Samsung Conventional ,416 TFDE METHANE HEATHER SALLY BG Group Samsung Conventional ,000 Steam
87 Appendix 6: Table of Active LNG Fleet (continued) Ship Name Shipowner Shipbuilder Type Delivery Year Capacity (cm) Propulsion Type METHANE JANE ELIZABETH GasLog Samsung Conventional ,000 Steam METHANE JULIA LOUISE Mitsui & Co Samsung Conventional ,416 TFDE METHANE LYDON VOLNEY Shell Samsung Conventional ,000 Steam METHANE MICKIE HARPER BG Group Samsung Conventional ,400 TFDE METHANE NILE EAGLE BG, GasLog Samsung Conventional ,000 Steam METHANE PATRICIA CAMILA BG Group Samsung Conventional ,416 TFDE METHANE PRINCESS Golar LNG Partners Daewoo Conventional ,086 Steam METHANE RITA ANDREA GasLog Samsung Conventional ,000 Steam METHANE SHIRLEY ELISABETH GasLog Samsung Conventional ,800 Steam METHANE SPIRIT Teekay, Marubeni Samsung Conventional ,195 TFDE METHANIA Distrigas Boelwerf Conventional ,235 Steam MILAHA QATAR Nakilat, Qatar Shpg., SocGen Samsung Conventional ,140 Steam MILAHA RAS LAFFAN Nakilat, Qatar Shpg., SocGen IMO # Samsung Conventional ,199 Steam MIN LU China LNG Ship Mgmt. Hudong- Zhonghua Conventional ,000 Steam MIN RONG China LNG Ship Mgmt. Hudong- Zhonghua Conventional ,000 Steam MOURAD DIDOUCHE Sonatrach Chantiers de l'atlantique Conventional ,190 Steam MOZAH Nakilat Samsung Q-Max ,988 SSD MRAWEH National Gas Shipping Co Kvaerner Masa Conventional ,000 Steam MUBARAZ National Gas Shipping Co Kvaerner Masa Conventional ,000 Steam MURWAB NYK, K Line, MOL, Iino, Mitsui, Nakilat Daewoo Q-Flex ,971 SSD NEO ENERGY Tsakos Hyundai Conventional ,838 Steam NIZWA LNG OSC, MOL Kawaski Conventional ,469 Steam NKOSSA II AP Moller Mitsubishi Conventional ,488 Steam NORTHWEST SANDERLING NORTHWEST SANDPIPER NORTHWEST SEAEAGLE NORTHWEST SHEARWATER NORTHWEST SNIPE NORTHWEST STORMPETREL NORTHWEST SWAN North West Shelf Venture North West Shelf Venture North West Shelf Venture North West Shelf Venture North West Shelf Venture North West Shelf Venture North West Shelf Venture Mitsubishi Conventional ,452 Steam Mitsui Conventional ,042 Steam Mitsubishi Conventional ,541 Steam Kawaski Conventional ,660 Steam Mitsui Conventional ,747 Steam Mitsubishi Conventional ,525 Steam Daewoo Conventional ,500 Steam OAK SPIRIT Teekay Daewoo Conventional ,400 MEGI OB RIVER Dynagas Hyundai Conventional ,791 Steam
88 Appendix 6: Table of Active LNG Fleet (continued) Ship Name Shipowner Shipbuilder Type Delivery Year Capacity (cm) Propulsion Type OCEAN QUEST GDF SUEZ Newport News Conventional ,540 Steam ONAIZA Nakilat Daewoo Q-Flex ,963 SSD PACIFIC ARCADIA NYK Mitsubishi Conventional ,400 Steam PACIFIC ENLIGHTEN Kyushu Electric, TEPCO, Mitsubishi, Mitsubishi Conventional ,800 Steam Mitsui, NYK, MOL PACIFIC EURUS TEPCO, NYK, Mitsubishi Mitsubishi Conventional ,000 Steam PACIFIC NOTUS TEPCO, NYK, Mitsubishi Mitsubishi Conventional ,006 Steam PALU LNG Cardiff Marine Daewoo Conventional ,800 TFDE PAPUA MOL, China LNG Hudong- Zhonghua Conventional ,000 TFDE POLAR SPIRIT Teekay I.H.I. Conventional ,100 Steam PRACHI NYK Hyundai Conventional ,000 TFDE PROVALYS GDF SUEZ Chantiers de l'atlantique Conventional ,383 DFDE PSKOV Sovcomflot STX Conventional ,200 TFDE PUTERI DELIMA MISC Chantiers de l'atlantique Conventional ,797 Steam PUTERI DELIMA SATU MISC Mitsui Conventional ,849 Steam PUTERI FIRUS MISC Chantiers de l'atlantique Conventional ,689 Steam PUTERI FIRUS SATU MISC Mitsubishi Conventional ,865 Steam PUTERI INTAN MISC Chantiers de l'atlantique Conventional ,694 Steam PUTERI INTAN SATU MISC Mitsubishi Conventional ,770 Steam PUTERI MUTIARA SATU MISC Mitsui Conventional ,861 Steam PUTERI NILAM MISC Chantiers de l'atlantique Conventional ,756 Steam PUTERI NILAM SATU MISC Mitsubishi Conventional ,833 Steam PUTERI ZAMRUD MISC Chantiers de l'atlantique Conventional ,751 Steam PUTERI ZAMRUD SATU MISC Mitsui Conventional ,870 Steam RAAHI MOL, NYK, K Line, SCI, Nakilat Daewoo Conventional ,077 Steam RAMDANE ABANE Sonatrach Chantiers de l'atlantique Conventional ,190 Steam RASHEEDA Nakilat Samsung Q-Max ,912 MEGI RIBERA DEL DUERO KNUTSEN Knutsen OAS Daewoo Conventional ,400 TFDE RIOJA KNUTSEN Knutsen OAS Hyundai Conventional ,300 MEGI SALALAH LNG OSC, MOL Samsung Conventional ,174 Steam SCF MELAMPUS Sovcomflot STX Conventional ,200 TFDE SCF MITRE Sovcomflot STX Conventional ,200 TFDE SEISHU MARU Mitsubishi, NYK, Chubu Electric Mitsubishi Conventional ,300 Steam SENSHU MARU MOL, NYK, K Line Mitsui Conventional ,835 Steam SERI ALAM MISC Samsung Conventional ,572 Steam SERI AMANAH MISC Samsung Conventional ,795 Steam SERI ANGGUN MISC Samsung Conventional ,100 Steam IMO # 86
89 Appendix 6: Table of Active LNG Fleet (continued) Ship Name Shipowner Shipbuilder Type Delivery Year Capacity (cm) Propulsion Type SERI ANGKASA MISC Samsung Conventional ,786 Steam SERI AYU MISC Samsung Conventional ,474 Steam SERI BAKTI MISC Mitsubishi Conventional ,886 Steam SERI BALHAF MISC Mitsubishi Conventional ,567 TFDE SERI BALQIS MISC Mitsubishi Conventional ,747 TFDE SERI BEGAWAN MISC Mitsubishi Conventional ,964 Steam SERI BIJAKSANA MISC Mitsubishi Conventional ,822 Steam SERI CAMELLIA PETRONAS Hyundai Conventional ,200 Steam Reheat SESTAO KNUTSEN Knutsen OAS IZAR Conventional ,357 Steam SEVILLA KNUTSEN Knutsen OAS Daewoo Conventional ,400 TFDE SHAGRA Nakilat Samsung Q-Max ,988 SSD SHAHAMAH SHEN HAI National Gas Shipping Co China LNG, CNOOC, Shanghai LNG IMO # Kawaski Conventional ,756 Steam Hudong- Zhonghua Conventional ,741 Steam SIMAISMA Maran G.M, Nakilat Daewoo Conventional ,971 Steam SK SPLENDOR SK Shipping Samsung Conventional ,540 Steam SK STELLAR SK Shipping Samsung Conventional ,540 Steam SK SUMMIT SK Shipping Daewoo Conventional ,933 Steam SK SUNRISE Iino Kaiun Kaisha Samsung Conventional ,505 Steam SK SUPREME SK Shipping Samsung Conventional ,320 Steam SOHAR LNG OSC, MOL Mitsubishi Conventional ,850 Steam SOLARIS GasLog Samsung Conventional ,000 TFDE SONANGOL BENGUELA SONANGOL ETOSHA SONANGOL SAMBIZANGA Mitsui, Sonangol, Sojitz Mitsui, Sonangol, Sojitz Mitsui, Sonangol, Sojitz Daewoo Conventional ,500 Steam Daewoo Conventional ,500 Steam Daewoo Conventional ,500 Steam SOUTHERN CROSS MOL, China LNG Hudong- Zhonghua Conventional ,295 Steam Reheat SOYO Mitsui, NYK, Teekay Samsung Conventional ,948 TFDE SPIRIT OF HELA MOL, Itochu Hyundai Conventional ,800 TFDE STENA BLUE SKY Stena Bulk Daewoo Conventional ,988 Steam STENA CLEAR SKY Stena Bulk Daewoo Conventional ,593 TFDE STENA CRYSTAL SKY Stena Bulk Daewoo Conventional ,611 TFDE SUNRISE Shell Dunkerque Ateliers Conventional ,813 Steam TAITAR NO. 1 CPC, Mitsui, NYK Mitsubishi Conventional ,627 Steam TAITAR NO. 2 MOL, NYK Kawaski Conventional ,627 Steam TAITAR NO. 3 MOL, NYK Mitsubishi Conventional ,627 Steam TAITAR NO. 4 CPC, Mitsui, NYK Kawaski Conventional ,596 Steam TANGGUH BATUR Sovcomflot, NYK Daewoo Conventional ,988 Steam TANGGUH FOJA K Line, PT Meratus Samsung Conventional ,948 TFDE TANGGUH HIRI Teekay Hyundai Conventional ,885 TFDE TANGGUH JAYA K Line, PT Meratus Samsung Conventional ,948 TFDE TANGGUH PALUNG K Line, PT Meratus Samsung Conventional ,948 TFDE TANGGUH SAGO Teekay Hyundai Conventional ,872 TFDE
90 Appendix 6: Table of Active LNG Fleet (continued) Ship Name Shipowner Shipbuilder Type TANGGUH TOWUTI NYK, PT Samudera, Sovcomflot Delivery Year Capacity (cm) Propulsion Type IMO # Daewoo Conventional ,988 Steam TEMBEK Nakilat, OSC Samsung Q-Flex ,885 SSD TENAGA LIMA MISC CNIM Conventional ,409 Steam TESSALA HYPROC Hyundai Conventional ,800 TFDE TRINITY ARROW K Line Imabari Conventional ,655 Steam TRINITY GLORY K Line Imabari Conventional ,675 Steam UMM AL AMAD UMM AL ASHTAN NYK, K Line, MOL, Iino, Mitsui, Nakilat National Gas Shipping Co Daewoo Q-Flex ,958 SSD Kvaerner Masa Conventional ,000 Steam UMM BAB Maran G.M, Nakilat Daewoo Conventional ,708 Steam UMM SLAL Nakilat Samsung Q-Max ,928 SSD VALENCIA KNUTSEN Knutsen OAS Daewoo Conventional ,400 TFDE VELIKIY NOVGOROD Sovcomflot STX Conventional ,471 TFDE WEST ENERGY Sinokor Merchant Marine Chantiers de l'atlantique Conventional ,255 Steam WILFORCE Teekay Daewoo Conventional ,900 TFDE WILPRIDE Teekay Daewoo Conventional ,007 TFDE WOODSIDE CHANEY Maran Gas Maritime Hyundai Conventional ,000 SSD WOODSIDE DONALDSON Teekay, Marubeni Samsung Conventional ,620 TFDE WOODSIDE GOODE Maran Gas Maritime Daewoo Conventional ,800 TFDE WOODSIDE REES WITHERS Maran Gas Maritime Daewoo Conventional ,400 DFDE WOODSIDE ROGERS Maran Gas Maritime Daewoo Conventional ,800 TFDE YARI LNG Cardiff Marine Daewoo Conventional ,800 TFDE YENISEI RIVER Dynagas Hyundai Conventional ,880 TFDE YK SOVEREIGN SK Shipping Hyundai Conventional ,582 Steam ZARGA Nakilat Samsung Q-Max ,104 SSD ZEKREET J4 Consortium Mitsui Conventional ,733 Steam
91 Appendix 7: Table 7: Table of LNG of Vessel LNG Orderbook Vessel Orderbook (continued) Ship Name Shipowner Shipbuilder Type Delivery Year Capacity (cm) Propulsion Type ASIA INTEGRITY Chevron Samsung Conventional ,948 TFDE ASIA VENTURE Chevron Samsung Conventional ,948 TFDE BISHU MARU CASTILLO DE CALDELAS CASTILLO DE MERIDA CESI BEIHAI Trans Pacific Shipping Kawasaki Sakaide Conventional ,700 Steam Reheat IMO # Elcano Imabari Conventional ,000 MEGI Elcano Imabari Conventional ,000 MEGI China Shipping Group Hudong- Zhonghua Conventional ,000 TFDE CHRISTOPHE DE MARGERIE Sovcomflot Daewoo Conventional ,000 TFDE DAEWOO 2416 Teekay Daewoo Conventional ,400 MEGI DAEWOO 2417 Teekay Daewoo Conventional ,400 MEGI DAEWOO 2421 Sovcomflot Daewoo Conventional ,000 TFDE DAEWOO 2422 Sovcomflot Daewoo Conventional ,000 TFDE DAEWOO 2423 Teekay Daewoo Conventional ,000 TFDE DAEWOO 2424 Dynagas Daewoo Conventional ,000 TFDE DAEWOO 2425 Dynagas Daewoo Conventional ,000 TFDE DAEWOO 2426 MOL Daewoo Conventional ,000 TFDE DAEWOO 2427 Sovcomflot Daewoo Conventional ,000 TFDE DAEWOO 2428 Sovcomflot Daewoo Conventional ,000 TFDE DAEWOO 2429 Sovcomflot Daewoo Conventional ,000 TFDE DAEWOO 2430 Dynagas Daewoo Conventional ,000 TFDE DAEWOO 2431 Dynagas Daewoo Conventional ,000 TFDE DAEWOO 2432 Dynagas Daewoo Conventional ,000 TFDE DAEWOO 2433 Teekay Daewoo Conventional ,000 TFDE DAEWOO 2434 MOL Daewoo Conventional ,000 TFDE DAEWOO 2435 BW Daewoo Conventional ,300 MEGI DAEWOO 2436 BW Daewoo Conventional ,300 MEGI DAEWOO 2438 Daewoo Conventional ,000 MEGI DAEWOO 2441 BP Daewoo Conventional ,000 MEGI DAEWOO 2442 BP Daewoo Conventional ,000 MEGI DAEWOO 2443 BP Daewoo Conventional ,000 MEGI DAEWOO 2444 BP Daewoo Conventional ,000 MEGI DAEWOO 2445 BP Daewoo Conventional ,000 MEGI DAEWOO 2446 BP Daewoo Conventional ,000 MEGI DAEWOO 2447 Frontline Management Daewoo Conventional ,400 MEGI DAEWOO 2448 Frontline Management Daewoo Conventional ,000 MEGI DAEWOO 2449 Korea Line Daewoo Conventional ,000 MEGI DAEWOO 2450 Korea Line Daewoo Conventional ,000 MEGI DAEWOO 2451 Hyundai LNG Shipping Daewoo Conventional ,000 MEGI DAEWOO 2453 Teekay Daewoo Conventional ,400 MEGI DAEWOO 2454 Teekay Daewoo Conventional ,400 MEGI DAEWOO 2455 Teekay Daewoo Conventional ,400 MEGI
92 Appendix 7: Table of LNG Vessel Orderbook (continued) Ship Name Shipowner Shipbuilder Type DAEWOO 2456 DAEWOO 2457 DAEWOO 2458 DAEWOO 2459 Maran Gas Maritime Maran Gas Maritime Maran G.M, Nakilat Maran Gas Maritime Delivery Year Capacity (cm) Propulsion Type IMO # Daewoo Conventional ,400 MEGI Daewoo Conventional ,000 DFDE Daewoo Conventional ,400 MEGI Daewoo Conventional ,400 MEGI DAEWOO 2460 Chandris Group Daewoo Conventional ,000 MEGI DAEWOO 2461 Teekay Daewoo Conventional ,400 MEGI DAEWOO 2462 Mitsui & Co Daewoo Conventional , DAEWOO 2464 Chandris Group Daewoo Conventional ,400 MEGI DAEWOO 2466 Maritima Del Norte Daewoo Conventional , DAEWOO 2467 DAEWOO 2468 Maran Gas Maritime Maran Gas Maritime Daewoo Conventional , Daewoo FSRU ,400 XDF DAEWOO 2488 BW Daewoo Conventional ,400 MEGI DAEWOO 2489 BW Daewoo Conventional ,400 MEGI DAEWOO 3 Daewoo Conventional ,000 MEGI FSRU ESPERANZA Hoegh Hyundai FSRU , GNL DEL PLATA MOL Daewoo FSRU ,000 TFDE HOEGH GIANT Hoegh Hyundai FSRU ,000 TFDE HUDONG- ZHONGHUA H1664A HUDONG- ZHONGHUA H1665A HUDONG- ZHONGHUA H1666A HUDONG- ZHONGHUA H1718A HUDONG- ZHONGHUA H1719A HUDONG- ZHONGHUA H1720A HYUNDAI PEACEPIA HYUNDAI SAMHO S856 HYUNDAI SAMHO S857 HYUNDAI ULSAN 2800 HYUNDAI ULSAN 2801 HYUNDAI ULSAN 2909 Teekay Teekay Teekay China Shipping Group China Shipping Group China Shipping Group Hyundai LNG Shipping Hudong- Zhonghua Hudong- Zhonghua Hudong- Zhonghua Hudong- Zhonghua Hudong- Zhonghua Hudong- Zhonghua Conventional ,000 DFDE Conventional ,000 DFDE Conventional ,000 DFDE Conventional ,000 TFDE Conventional ,000 TFDE Conventional ,000 MEGI Daewoo Conventional ,000 MEGI Teekay Hyundai Conventional ,000 MEGI Teekay Hyundai Conventional ,000 MEGI GasLog Hyundai Conventional ,000 TFDE GasLog Hyundai Conventional ,000 MEGI Hoegh Hyundai FSRU ,630 DFDE
93 Appendix 7: Table of LNG Vessel Orderbook (continued) Ship Name Shipowner Shipbuilder Type Delivery Year Capacity (cm) Propulsion Type HYUNDAI ULSAN 2937 SK Shipping Hyundai Conventional ,000 DFDE HYUNDAI ULSAN 2938 SK Shipping Hyundai Conventional ,000 DFDE IMABARI SAIJO 8200 K Line Imabari Conventional ,000 MEGI IMABARI SAIJO 8215 Imabari Conventional ,000 MEGI IMABARI SAIJO 8216 Imabari Conventional ,000 XDF IMABARI SAIJO 8217 Imabari Conventional ,000 XDF JMU TSU 5070 MOL Japan Marine Conventional ,000 TFDE JMU TSU 5071 NYK Japan Marine Conventional ,000 Steam JMU TSU 5072 MOL Japan Marine Conventional ,000 Steam JMU TSU 5073 MOL Japan Marine Conventional ,000 Steam KALININGRAD Gazprom JSC Hyundai FSRU ,000 Steam KAWASAKI SAKAIDE 1718 K Line Kawaski Conventional ,000 Steam KAWASAKI SAKAIDE 1720 KAWASAKI SAKAIDE 1728 KAWASAKI SAKAIDE 1729 KAWASAKI SAKAIDE 1731 KAWASAKI SAKAIDE 1734 KAWASAKI SAKAIDE 1735 MARAN GAS ROXANA MARAN GAS ULYSSES MITSUBISHI NAGASAKI 2310 MITSUBISHI NAGASAKI 2316 MITSUBISHI NAGASAKI 2321 MITSUBISHI NAGASAKI 2322 MITSUBISHI NAGASAKI 2323 MITSUBISHI NAGASAKI 2324 MITSUBISHI NAGASAKI 2325 MITSUBISHI NAGASAKI 2326 MITSUBISHI NAGASAKI 2327 K Line Kawaski Conventional ,700 Mitsui & Co Mitsui & Co Maran Gas Maritime Maran Gas Maritime Kawasaki Sakaide Kawasaki Sakaide Kawasaki Sakaide Kawasaki Sakaide Kawasaki Sakaide Steam Reheat IMO # Conventional ,000 TFDE Conventional ,000 Steam Conventional ,000 Steam Conventional , Conventional , Daewoo Conventional ,400 TFDE Hyundai Conventional ,000 SSD K-Line, Inpex Mitsubishi Conventional ,000 NYK Mitsubishi Conventional ,300 Steam Reheat Steam Reheat NYK Mitsubishi Conventional ,000 DFDE Mitsui & Co Mitsubishi Conventional ,000 DFDE MOL Mitsubishi Conventional ,000 TFDE NYK Mitsubishi Conventional ,000 TFDE NYK Mitsubishi Conventional ,000 TFDE MOL Mitsubishi Conventional ,000 TFDE NYK Mitsubishi Conventional ,000 TFDE
94 Appendix 7: Table of LNG Vessel Orderbook (continued) Ship Name Shipowner Shipbuilder Type Delivery Year Capacity (cm) Propulsion Type MITSUBISHI NAGASAKI 2332 Mitsubishi Conventional , OUGARTA HYPROC Hyundai Conventional ,800 TFDE PAN ASIA Teekay Hudong- Zhonghua Conventional ,000 DFDE SAMSUNG 2081 SK Shipping, Marubeni Samsung Conventional ,000 TFDE SAMSUNG 2107 Flex LNG Samsung Conventional ,000 MEGI SAMSUNG 2108 Flex LNG Samsung Conventional ,000 MEGI SAMSUNG 2130 GasLog Samsung Conventional ,000 MEGI SAMSUNG 2131 GasLog Samsung Conventional ,000 MEGI SAMSUNG 2148 Mitsui & Co Samsung Conventional ,000 MEGI SAMSUNG 2149 Mitsui & Co Samsung Conventional ,000 MEGI SAMSUNG 2150 Mitsui & Co Samsung Conventional ,000 MEGI SAMSUNG 2189 Golar LNG Samsung FSRU ,000 DFDE SAMSUNG 2212 GasLog Samsung Conventional , CHRISTOPHE DE MARGERIE Sovcomflot Daewoo Conventional ,000 TFDE SERI CAMAR PETRONAS Hyundai Conventional ,200 Steam Reheat MITSUBISHI NAGASAKI 2326 MOL Mitsubishi Conventional ,000 TFDE SERI CEMARA PETRONAS Hyundai Conventional ,200 Steam Reheat SERI CEMPAKA PETRONAS Hyundai Conventional ,200 MEGI SERI CENDERAWASIH PETRONAS Hyundai Conventional ,200 Steam Reheat IMO # SK AUDACE SK Shipping, Marubeni Samsung Conventional ,000 DFDE SK SERENITY SK Shipping Samsung Conventional ,000 DFDE SK SPICA SK Shipping Samsung Conventional ,000 MEGI TORBEN SPIRIT Teekay Daewoo Conventional ,400 XDF
95 Appendix 8: Table 8: Table of FSRU, of FSRU, Laid-Up, Laid-Up, Converted FSU Converted & FSU FLNG & (continued) FLNG Ship Name Shipowner Shipbuilder Type FSRU TOSCANA GOLAR FREEZE GOLAR SPIRIT GOLAR WINTER NUSANTARA REGAS SATU OLT Offshore LNG Toscana Golar LNG Partners Golar LNG Partners Golar LNG Partners Golar LNG Partners Hyundai HDW Kawasaki Sakaide Daewoo Rosenberg Verft Converted FSRU Converted FSRU Converted FSRU Converted FSRU Converted FSRU Delivery Year Capacity (cm) Propulsion Type IMO # ,500 Steam ,000 Steam ,000 Steam ,000 Steam ,003 Steam BW INTEGRITY BW Samsung FSRU ,000 TFDE BW SINGAPORE BW Samsung FSRU ,000 TFDE EXCELERATE EXCELLENCE EXEMPLAR EXPEDIENT EXPERIENCE EXPLORER EXQUISITE GDF SUEZ CAPE ANN Exmar, Excelerate Excelerate Energy Excelerate Energy Excelerate Energy Excelerate Energy Exmar, Excelerate Excelerate Energy Hoegh, MOL, TLTC Daewoo FSRU ,313 Steam Daewoo FSRU ,124 Steam Daewoo FSRU ,072 Steam Daewoo FSRU ,994 Steam Daewoo FSRU ,660 TFDE Daewoo FSRU ,900 Steam Daewoo FSRU ,035 Steam Samsung FSRU ,130 DFDE GOLAR ESKIMO Golar LNG Samsung FSRU ,000 TFDE GOLAR IGLOO Golar LNG Partners Samsung FSRU ,000 TFDE GOLAR TUNDRA Golar LNG Samsung FSRU ,000 TFDE HOEGH GALLANT Hoegh Hyundai FSRU ,000 TFDE HOEGH GRACE Hoegh Hyundai FSRU ,000 DFDE INDEPENDENCE Hoegh Hyundai FSRU ,132 TFDE NEPTUNE PGN FSRU LAMPUNG Hoegh, MOL, TLTC Samsung FSRU ,130 Steam Hoegh Hyundai FSRU ,000 TFDE Status at end-2015 Chartered as FSRU Chartered as FSRU Chartered as FSRU Chartered as FSRU Chartered as FSRU Chartered as FSRU Chartered as FSRU Chartered as FSRU Chartered as FSRU Chartered as FSRU Chartered as FSRU Chartered as FSRU Chartered as FSRU Chartered as FSRU Chartered as FSRU Chartered as FSRU Chartered as FSRU Chartered as FSRU Chartered as FSRU Chartered as FSRU Chartered as FSRU Chartered as FSRU Chartered as FSRU BALTIC ENERGY Sinokor Merchant Kawaski Conventional ,929 Steam Laid-up Marine ECHIGO MARU NYK Mitsubishi Conventional ,568 Steam Laid-up 93
96 Appendix 8: Table of FSRU, Laid-Up, Converted FSU & Converted FLNG (continued) Ship Name Shipowner Shipbuilder Type FORTUNE FSU GAEA Dalian Inteh Golar LNG Dunkerque Normandie General Dynamics Delivery Year Capacity (cm) Propulsion Type IMO # Status at end-2015 Conventional ,000 Steam Laid-up Conventional ,530 Steam Laid-up GOLAR VIKING Golar LNG Hyundai Conventional ,000 Steam Laid-up GRACE ENERGY LNG CAPRICORN LNG GEMINI LNG LEO LNG TAURUS LNG VESTA LNG VIRGO LUCKY FSU METHANE KARI ELIN PACIFIC ENERGY SOUTH ENERGY Sinokor Merchant Marine Nova Shipping & Logistics General Dynamics General Dynamics Nova Shipping & Logistics Tokyo Gas, MOL, Iino General Dynamics Dalian Inteh Mitsubishi Conventional ,580 Steam Laid-up General Dynamics General Dynamics General Dynamics General Dynamics Conventional ,750 Steam Laid-up Conventional ,750 Steam Laid-up Conventional ,750 Steam Laid-up Conventional ,750 Steam Laid-up Mitsubishi Conventional ,547 Steam Laid-up General Dynamics Dunkerque Normandie Conventional ,750 Steam Laid-up Conventional ,400 Steam Laid-up BG Group Samsung Conventional ,167 Steam Laid-up Sinokor Merchant Marine Sinokor Merchant Marine Kockums Conventional ,588 Steam Laid-up General Dynamics Conventional ,750 Steam Laid-up WILENERGY Awilco Mitsubishi Conventional ,788 Steam Laid-up WILGAS Awilco Mitsubishi Conventional ,975 Steam Laid-up TENAGA EMPAT MISC CNIM FSU ,000 Steam FSU TENAGA SATU MISC Dunkerque Chantiers FSU ,000 Steam FSU ARMADA LNG MEDITERRANA HILLI Bumi Armada Berhad Golar LNG Mitsui FSU ,209 Steam FSU Rosenberg Verft Converted FLNG ,890 Steam PRELUDE Shell Samsung FLNG , Under conversion Under construction 94
97 Notes
98 Notes

99 Enagás supports the diversity of supply in Europe Enagás large experience as independent Transmission System Operator, TSO accredited by the EU, and leader in liquefied natural gas infrastuctures at the service of diversity of supply in Europe. International leader in LNG infrastructures

100 IGU The International Gas Union (IGU), founded in 1931, is a worldwide non-profit organisation promoting the political, technical and economic progress of the gas industry with the mission to advocate gas as an integral part of a sustainable global energy system. The members are national associations and corporations of the gas industry. The working organisation of IGU covers the complete value chain of the gas industry upstream to downstream. For more information please visit International Gas Union (IGU) Att: Gas Natural Fenosa Plaça del Gas, 1 Building B 3rd floor Barcelona Spain Telephone: Fax: secretariat@igu-gasnatural.com Published by the International Gas Union (IGU) Copyright 2017 The entire content of this publication is protected by copyright, full details of which are available from the publisher. All rights reserved. No part of this part of this publication may be reproduced, stored in retrieval systems or transmitted in any form or by any means electronic, mechanical, photocopying, recording or otherwise without the prior permission of the copyright owner.
World LNG Report industry trends-
 World LNG Report-218 -industry trends- Satoshi Yoshida General Manager, International Section, Policy and Planning Department Japan Gas Association International Gas Union (IGU) Who we are Founded in 1931,
7. Liquefied Natural Gas (LNG)
") 7. Liquefied Natural Gas (LNG) Figure 7-1: LNG supply chain Source; Total Liquid natural gas (LNG) is a good alternative to natural gas in remote locations or when the distance between the producer and
7. Liquefied Natural Gas (LNG) Figure 7-1: LNG supply chain Source; Total Liquid natural gas (LNG) is a good alternative to natural gas in remote locations or when the distance between the producer and
Lecture 12. LNG Markets
 Lecture 12 LNG Markets Data from BP Statistical Review of World Energy 1991 to 2016 Slide 1 LNG Demand LNG demand is expected to grow from China, India and Europe in particular. Currently biggest importer
World LNG Report Edition
 IGU World LNG Report 2015 Edition І Page 1 International Gas Union News, views and knowledge on gas worldwide World LNG Report - 2015 Edition World Gas Conference Edition Sponsored by: IGU World LNG Report
World LNG Trade 2014 & Outlook 2015
 World LNG Trade 2014 & Outlook 2015 By: Global LNG Info (GLNGI) May 2015 www.globallnginfo.com LNG Trades 2014 (1) 239.2 MMT of LNG traded in 2014, effectively flat for the third year running as reduced
RIM LNG Trade Annual 2010 Edition
 RIM LNG Trade Annual 2010 Edition -Contents Volume 1 = Liquefacation Terminals in the world 1. Liquefacation Terminals in Asian Pacific Region 1 United states of America(Alaska) 2 Brunei 3 Indonesia 4
LNG Markets GDF SUEZ and its LNG activities
 LNG Markets GDF SUEZ and its LNG activities Paris 22 April 2013 Denis Bonhomme Executive VP Strategy GDF SUEZ LNG This presentation is not intended to provide the basis for any evaluation of GDF SUEZ or
SONATRACH PERSPECTIVES ON ASIAN LNG MARKETS
 SONATRACH PERSPECTIVES ON ASIAN LNG MARKETS 65% of global gas demand growth by 2030 is expected to come from Asia, with traditional demand centers remaining stagnant Global gas demand by region to 2030
[LNG MARKET ANALYSIS ] 1. LNG Market Analysis
![[LNG MARKET ANALYSIS ] 1. LNG Market Analysis](/thumbs/83/87599992.jpg "[LNG MARKET ANALYSIS ] 1. LNG Market Analysis") [LNG MARKET ANALYSIS ] 1 LNG Market Analysis LNG Market Analysis Volume: 8 th June 2018 LNG and Natural Gas Price Assessment 28 th May 8 th June 2018 [LNG MARKET ANALYSIS ] 2 LNG Analysis Stable to bullish
[LNG MARKET ANALYSIS ] 1 LNG Market Analysis LNG Market Analysis Volume: 8 th June 2018 LNG and Natural Gas Price Assessment 28 th May 8 th June 2018 [LNG MARKET ANALYSIS ] 2 LNG Analysis Stable to bullish
LNG in 2015 and MT perspectives
 CEDIGAZ, the International Association for Natural Gas LNG in 2015 and MT perspectives Geoffroy Hureau Secretary General - CEDIGAZ THE LNG MARKET IN 2015 (Preliminary estimates) LNG Demand grew 2% in 2015
Natural Gas Facts & Figures. Section 3: LNG
 Natural Gas Facts & Figures Section 3: LNG September 214 3. LNG Trade movements Terminals for import, terminals for exports Liquefaction, regazeification LNG Fleet Sources : Total LNG group, PGCD special
NARUC. Global Liquefied Natural Gas Supply: An Introduction for Public Utility Commissioners
 2009 Global Liquefied Natural Gas Supply: An Introduction for Public Utility Commissioners NARUC October 2009 The National Association of Regulatory Utility Commissioners Funded by the U.S. Department
ASIAN OFFSHORE ENERGY CONFERENCE DISPUTES IN LNG CONTRACTS
 ASIAN OFFSHORE ENERGY CONFERENCE 28 SEPTEMBER 2017 DISPUTES IN LNG CONTRACTS Bob Broxson BDO USA, LLP, a Delaware limited liability partnership, is the U.S. member of BDO International Limited, a UK company
The Role of GCC s Natural Gas in the World s Gas Markets
 World Review of Business Research Vol. 1. No. 2. May 2011 Pp. 168-178 The Role of GCC s Natural Gas in the World s Gas Markets Abdulkarim Ali Dahan* The objective of this research is to analyze the growth
European Gas & LNG Markets, Energy Policy, and Geopolitics October 2016
 European Gas & LNG Markets, Energy Policy, and Geopolitics October 2016 www.rapidangroup.com Leslie.palti-guzman@rapidangroup.com t. +1 301.656.4480 No Quotation or Distribution 1 EU LNG Demand Key Themes:
LNG Projects & Markets Past, Present & Challenges Ahead
 LNG Projects & Markets Past, Present & Challenges Ahead Presented by: Don Andress Mostefa Ouki Nexant [Part 2: Markets, Past, Present & Challenges Ahead] United States Association for Energy Economics
Global LNG Market Overview
 Global LNG Market Overview 27 September, 2018 Toronto stock exchange listed, global intelligence solutions Request a demonstration of Evaluate Energy at this link 1 Who we serve 2 Global natural gas supply
The Impact of the Recession on Gas Markets
 The Impact of the Recession on Gas Markets What has changed in our Brave New World Gas demand dropped by 2% Bigger drops in OECD region, FSU, Latin America But some notable exceptions: China, India Some
Fabio Ballini World Maritime University
 Pricing on gas: focus on LNG sectors Fabio Ballini World Maritime University What are the benefits of LNG? Environmental Benefits Table 3: Compering alterative technologies and fuels Source: SSPA, TC/1208-05-2100
LNG TRADE FLOWS. Hans Stinis Shell Upstream International
 LNG TRADE FLOWS Hans Stinis Shell Upstream International ABSTRACT The LNG industry has witnessed a great deal of change recently, and indications are that this will only continue. Global gas demand is
The IEA s Gas 2017 Report - LNG moves to the front
 The IEA s Gas 2017 Report - LNG moves to the front Peter Fraser, Head of the Gas, Coal and Power Division EMART Energy, Amsterdam, 5 October 2017 IEA Gas in today s world The contribution of gas Versatile
Gas Markets Globalization: Perspectives and Limits
 Gas Markets Globalization: Perspectives and Limits By: Sid Ahmed Hamdani, Senior Business Analyst, Sonatrach, Algeria Date:04 June 2012 Venue: Kuala Lumpur Towards Gas Market Globalization? Increasing
IPTC MS The Outlook for LNG Supply to Asia. Stuart Traver, Lalitha Seelam and Nick Fulford Baker Hughes Inc. and Gaffney, Cline & Associates
 IPTC 17774 - MS The Outlook for LNG Supply to Asia Stuart Traver, Lalitha Seelam and Nick Fulford Baker Hughes Inc. and Gaffney, Cline & Associates Slide 2 2013 GLOBAL NATURAL GAS TRADE Units: billion
[LNG MARKET ANALYSIS ] 1. LNG Market Analysis
![[LNG MARKET ANALYSIS ] 1. LNG Market Analysis](/thumbs/83/87599942.jpg "[LNG MARKET ANALYSIS ] 1. LNG Market Analysis") [LNG MARKET ANALYSIS ] 1 LNG Market Analysis LNG Market Analysis Volume: 20 th April 2018 LNG and Natural Gas Price Assessment 14 th 20 th April 2018 [LNG MARKET ANALYSIS ] 2 LNG Analysis Global LNG prices
[LNG MARKET ANALYSIS ] 1 LNG Market Analysis LNG Market Analysis Volume: 20 th April 2018 LNG and Natural Gas Price Assessment 14 th 20 th April 2018 [LNG MARKET ANALYSIS ] 2 LNG Analysis Global LNG prices
World LNG Report 2011
 International Gas Union (IGU) News, views and knowledge on gas worldwide World LNG Report 2011 Sponsored by: C M Y CM MY CY CMY K IGU World LNG Report - 2011 Page 1 1. MESSAGE FROM THE PRESIDENT OF INTERNATIONAL
gas 2O18 Analysis and Forecasts to 2O23
 Market Report Series gas 2O18 Analysis and Forecasts to 2O23 executive summary INTERNATIONAL ENERGY AGENCY The IEA examines the full spectrum of energy issues including oil, gas and coal supply and demand,
Arbitrage in Natural Gas Markets?
 Arbitrage in Natural Gas Markets? Yuri Yegorov University of Vienna Seminar on Energy Economics Paris, School of Mines April 13 th, 2016, 16:30-18:30 Based on article with J.Dehnavi and F.Wirl in Intern.
[LNG MARKET ANALYSIS ] 1. LNG Market Analysis
![[LNG MARKET ANALYSIS ] 1. LNG Market Analysis](/thumbs/82/85327769.jpg "[LNG MARKET ANALYSIS ] 1. LNG Market Analysis") [LNG MARKET ANALYSIS ] 1 LNG Market Analysis LNG Market Analysis Volume: 13 th April 2018 LNG and Natural Gas Price Assessment 3 rd 13 th April 2018 [LNG MARKET ANALYSIS ] 2 LNG Analysis Global LNG prices
[LNG MARKET ANALYSIS ] 1 LNG Market Analysis LNG Market Analysis Volume: 13 th April 2018 LNG and Natural Gas Price Assessment 3 rd 13 th April 2018 [LNG MARKET ANALYSIS ] 2 LNG Analysis Global LNG prices
Session 3: Enhancing gas supply and diversification New sources & markets
 Session 3: Enhancing gas supply and diversification New sources & markets IEF-IGU Gas Ministerial 22 nd November 218 Key messages: Enhancing gas supply and diversification new sources and markets Key messages
LNG market update. Surge in LNG supply creates opportunities to open new markets
 LNG market update Surge in LNG supply creates opportunities to open new markets Royal Vopak Analyst Day 2017 Ton Floors, Global LNG Director 12 December 2017 Forward-looking statement This presentation
Rice World Gas Trade Model: Russian Natural Gas and Northeast Asia
 Rice World Gas Trade Model: Russian Natural Gas and Northeast Asia Peter Hartley Kenneth B Medlock III James A. Baker III Institute of Public Policy RICE 1 Overview and motivation Worldwide, the demand
LNG MARKET TRENDS AND OPPORTUNITIES IN LNG SUPPLY CHAIN
 LNG MARKET TRENDS AND OPPORTUNITIES IN LNG SUPPLY CHAIN LNG SEMINAR PETROLEUM INSTITUTE OF PAKISTAN MAY 23, 2016 ISLAMABAD No part of this presentation may be circulated, quoted, or reproduced for distribution
Argus Benzene Annual 2017
 Argus Benzene Annual 2017 Petrochemicals illuminating the markets Market Reporting Consulting Events Argus Benzene Annual 2017 Summary The Argus (formerly DeWitt) Benzene Annual has provided an accurate
An Exporter s Perspective
 An Exporter s Perspective Kathleen Eisbrenner CEO, Pangea LNG B.V. May 2013 Mayer Brown is a global legal services provider comprising legal practices that are separate entities (the "Mayer Brown Practices").
Argus Ethylene Annual 2017
 Argus Ethylene Annual 2017 Market Reporting Petrochemicals illuminating the markets Consulting Events Argus Ethylene Annual 2017 Summary Progress to the next peak of the economic cycle, now expected by
Wholesale Gas Price Survey Edition
 IGU - WHOLESAFE GAS PRICE FORMATION 2013 International Gas Union International Gas Union News, views and knowledge on gas worldwide Wholesale Gas Price Survey - 2013 Edition - A global review of price
2009 Changing the scene
 2009 Changing the scene Gas demand in Europe and in other major economies is weakening Industrial demand strongly affected by the economic crisis Demand in the power generation sector suffers from relatively
The Price of Oil: Why it Rose, Why it Fell, and What it Will Mean for Australian LNG
 Perth, 26 August 2016 Curtin Corner, JCIPP The Price of Oil: Why it Rose, Why it Fell, and What it Will Mean for Australian LNG Roberto F. Aguilera r.aguilera@curtin.edu.au Background Shale oil industry
216 IEEJ216 Key points of this report Oversupply in the international LNG market will expand further in the coming years. Upstream industry is cutting
 216 IEEJ216 423 rd Forum on Research Works on July 26, 216 Outlook for Gas Market The Institute of Energy Economics, Japan Yoshikazu Kobayashi Senior Economist, Manager, Gas Group, Fossil Fuels & Electric
LNG EDGE Q TRADE FLOW REPORT
 LNG EDGE Q2 18 TRADE FLOW REPORT By Alex Froley LNG EDGE: Q2 18 TRADE FLOW REPORT CHINA S DEMAND REMAINS STRONG IN Q2 18 BY ALEX FROLEY JULY 18 SUMMARY: Global LNG supplies in the second quarter of 18
LNG Shipping: How Long Will The Good Times Last?
 LNG Shipping: How Long Will The Good Times Last? Poten & Partners November 1 HOUSTON NEW YORK LONDON ATHENS SINGAPORE GUANGZHOU PERTH A GLOBAL BROKER AND COMMERCIAL ADVISOR FOR THE ENERGY AND OCEAN TRANSPORTATION
2011 Institute of Energy Economics, Japan - IEEJ
 A Changing World of LNG Pacific Energy Summit: Unlocking the Potential of Natural Gas in the Asia-Pacific Session 2: Market Evolution and Adaptation: Contracts, pricing mechanisms, and supply security
Table 1 Trade movements 2004 LNG (Bcm)
") LNG Prospects for the Future The prospect that LNG could become a major global energy source is one of the most keenly debated issues in the sector. This was reflected in this quarter's survey, conducted
LNG Prospects for the Future The prospect that LNG could become a major global energy source is one of the most keenly debated issues in the sector. This was reflected in this quarter's survey, conducted
Global Gas Deregulation Ed
 Global Gas Deregulation Ed 1 2012 What s in this report and analysis? Overview of the state of the gas sector World Survey of Gas Privatisation and Deregulation Coverage of Gas privatisation and deregulation
Changes in Dynamics and Pricing of LNG in the Atlantic Basin
 Changes in Dynamics and Pricing of LNG in the Atlantic Basin Andrew Williamson Head of LNG Supply, Commercial Operations & Trading Vienna, 29 January 2018 OMV Gas & Power Agenda Changes in Dynamics and
Energy Market in Asia-Pacific and Canada s Potential for Natural Gas Export. Shahidul Islam
 Energy Market in Asia-Pacific and Canada s Potential for Natural Gas Export Shahidul Islam Objective Examine energy demand in Asia-Pacific Especially natural gas Canada s natural gas situation Potential
Overview of LNG in the United States
 Overview of LNG in the United States Dan McGinnis, Vice President of Gas Infrastructure Tractebel Project Development Inc. Natural Gas Conference Louisiana State University October 27, 2003 What Is Liquefied
Current and expected LNG supply-demand balance LNG, a tool to mitigate potential risks linked to pipe gas transport
 Current and expected LNG supply-demand balance LNG, a tool to mitigate potential risks linked to pipe gas transport Armand Khayat Madrid, 17 March 215 Agenda LNG has already demonstrated it is an effective
Immediate & Future LNG Opportunities in the Midstream; Reviewing Innovative
 17 th INTERNATIONAL CONFERENCE & EXHIBITION ON LIQUEFIED NATURAL GAS (LNG 17) 17 th INTERNATIONAL CONFERENCE & EXHIBITION ON LIQUEFIED NATURAL GAS (LNG 17) Immediate & Future LNG Opportunities in the Midstream;
[LNG MARKET ANALYSIS ] 1. LNG Market Analysis
![[LNG MARKET ANALYSIS ] 1. LNG Market Analysis](/thumbs/82/85327793.jpg "[LNG MARKET ANALYSIS ] 1. LNG Market Analysis") [LNG MARKET ANALYSIS ] 1 LNG Market Analysis LNG Market Analysis Volume: 6 th April 2018 [LNG MARKET ANALYSIS ] 2 LNG and Natural Gas Price Assessment 26 th March 6 th April 2018 LNG Analysis Global LNG
[LNG MARKET ANALYSIS ] 1 LNG Market Analysis LNG Market Analysis Volume: 6 th April 2018 [LNG MARKET ANALYSIS ] 2 LNG and Natural Gas Price Assessment 26 th March 6 th April 2018 LNG Analysis Global LNG
Oxford Institute for Energy Studies Natural Gas Programme Howard V Rogers
 Oxford Institute for Energy Studies Natural Gas Programme Howard V Rogers LNG Costs, Russian Exports and Global Interactions December 9 th & 1 th 215 WE ARE: A gas research programme at a Recognised Independent
EVA S QUARTERLY LNG OUTLOOK
 EVA S QUARTERLY LNG OUTLOOK LNG Webinar Dustin Meyer Lead LNG Analyst! Arlington, VA ENERGY VENTURES ANALYSIS 1901 N. Moore St., Suite 1200 (703) 276 8900 Arlington, VA 22209 www.evainc.com OUTLINE 1.
RYSTAD ENERGY GAS PERSPECTIVES. Jakarta, November 20 th 2017
 RYSTAD ENERGY GAS PERSPECTIVES Jakarta, November 2 th 217 Agenda 1. Global LNG market outlook Oversupply and new Asian demand 2. Japan LNG Market outlook LNG demand in a nuclear restart 2 Longer distances
LNG Market Trends & Price Transparency
 LNG Market Trends & Price Transparency Tokyo Fiona Poynter April 2015 London Houston Washington New York Portland Calgary Santiago Bogota Rio de Janeiro Singapore Beijing Tokyo Sydney Dubai Moscow Astana
CHENIERE ENERGY, INC.
 CHENIERE ENERGY, INC. Factors Affecting Global Coal-Gas Competition NGI Workshop - Global Competition Between Coal and Natural Gas October 15th 218 Najla Jamoussi Director, Market Fundamentals & Corporate
European Gas Market in 2017: State and Perspectives
 European Gas Market in 2017: State and Perspectives Sergei Komlev Head of Contract Structuring and Price Formation Directorate Gazprom Export Oil & Gas Forum, Thompson Reuters Moscow, December 14, 2017
[LNG MARKET ANALYSIS ] 1. LNG Market Analysis
![[LNG MARKET ANALYSIS ] 1. LNG Market Analysis](/thumbs/89/100997948.jpg "[LNG MARKET ANALYSIS ] 1. LNG Market Analysis") [LNG MARKET ANALYSIS ] 1 LNG Market Analysis LNG Market Analysis Volume: 23 rd March 2018 [LNG MARKET ANALYSIS ] 2 LNG Price Assessment and Natural Gas 12 th 23 rd March 2018 LNG Analysis Global LNG prices
[LNG MARKET ANALYSIS ] 1 LNG Market Analysis LNG Market Analysis Volume: 23 rd March 2018 [LNG MARKET ANALYSIS ] 2 LNG Price Assessment and Natural Gas 12 th 23 rd March 2018 LNG Analysis Global LNG prices
HAVE WE CROSSED THE BRIDGE?
 GAS AS A BRIDGE FUEL: HAVE WE CROSSED THE BRIDGE? 9th South East Europe Energy Dialogue (SEEED) International Conference The MET Hotel, Thessaloniki, June 29-30, 2016 Nikos Tsafos, President nikos.tsafos@.com
Edgardo Curcio President AIEE
 Edgardo Curcio President AIEE The First National Conference on Liquefied Natural Gas for Transports - Italy and the Mediterranean Sea April 11, 2013 What is LNG? The LNG (Liquefied Natural Gas) is a fluid
CHENIERE ENERGY, INC. How is the Rest of the World s LNG Interfacing With Europe?
 CHENIERE ENERGY, INC. How is the Rest of the World s LNG Interfacing With Europe? European Gas Conference - Vienna Andrew Walker VP LNG Strategy January 23, 18 2 Safe Harbor Statements Forward-Looking
MEMBER BRIEFING REPORT RELEASE DATE APRIL 2, 2019 IGU PUBLIC AFFAIRS
 MEMBER BRIEFING REPORT RELEASE DATE APRIL 2, 2019 IGU PUBLIC AFFAIRS Contents Key Findings and Messages 3 2018 by the Numbers 4 Press Release.. 5 LNG Microsite. 7 Embargoed Copy of the Report.8 Amplification
U.S. Rice Market Faces Larger Supplies and Lower Prices in 2018/19; Global Trade Projected Another Record High
 U.S. Rice Market Faces Larger Supplies and Lower Prices in 218/19; Global Trade Projected Another Record High 218 Rice Outlook Conference December 5-7, 218 Nathan Childs Economic Research Service USDA
Global LNG Market dynamics, key trends and market outlook
 REUTERS / Anne Kat Brevik Global LNG Market dynamics, key trends and market outlook December 14, 217 What to address Market dynamics, key trends and market outlook The role and outlook for U.S. LNG China
MIDDLE EAST GAS 2002 DOHA - APRIL 10-11, The Market for LNG Vessels - Current and Future
 MIDDLE EAST GAS 22 DOHA - APRIL 1-11, 22 The Market for LNG Vessels - Current and Future By Ian Walker, Gas Business Development, Golar LNG Ltd. Agenda 1. Golar LNG 2. The LNG market. Supply Demand Balance.
New Delhi 24 November th IEF-IGU Ministerial Gas Forum IEF Background Materials
 New Delhi 24 November 2016 5 th IEF-IGU Ministerial Gas Forum IEF Background Materials Overview 1. 3+3 Challenges 2. 7 Observations on gas markets 3. What the JODI Gas Data Base Shows 4. 3 Proposals 7
The 55 th Meeting of APEC Energy Working Group (EWG) Hong Kong, China, May, Diego RIVERA RIVOTA APERC Researcher
 Hong Kong, China, May, Diego RIVERA RIVOTA APERC Researcher") The 55 th Meeting of APEC Energy Working Group (EWG) Hong Kong, China, 16-17 May, 2018 Diego RIVERA RIVOTA APERC Researcher Total gas consumption in the APEC region, 2006-2016 Demand growth driven by the
The 55 th Meeting of APEC Energy Working Group (EWG) Hong Kong, China, 16-17 May, 2018 Diego RIVERA RIVOTA APERC Researcher Total gas consumption in the APEC region, 2006-2016 Demand growth driven by the
3-2. LNG in the Asia-Pacific
 APERC Workshop at EWG52 Moscow, Russia, 18 October, 2016 3-2. LNG in the Asia-Pacific Favoring trade and rational market development Kirsten Smith Researcher, APERC Report Highlights Report Highlights
Panama Canal and LNG: Congestion Ahead?
 April 218 Panama Canal and LNG: Congestion Ahead? Background and Introduction With the ongoing expansion of US LNG exports from projects under construction and a long list of new US projects (yet to receive
The New Global Gas Market Dynamic. Emmanuel Grand, FTI-CL Energy
 The New Global Gas Market Dynamic Emmanuel Grand, FTI-CL Energy May 2017 Contents I. Key uncertainties on gas demand II. Drivers of global LNG prices III. Conclusion 2 I. Key uncertainties on gas demand
LNG Markets in Transition
 J.P. Morgan Center for Commodities at the University of Colorado Denver Business School LNG Markets in Transition Anne-Sophie Corbeau Research Fellow, KAPSARC (Saudi Arabia) In its 52-year history, the
Global gas markets: the aftermath of the global recession
 Global gas markets: the aftermath of the global recession www.woodmac.com Jen Snyder Wood Mackenzie CSIS 28 October 2009 Delivering commercial insight to the global energy industry The deep global recession
LNG in the Asia Pacific
 2016/EWG52/WKSP1/004 LNG in the Asia Pacific Submitted by: APERC Asia Pacific Energy Research Centre Workshop Moscow, Russia 18 October 2016 APERC Workshop at EWG52 Moscow, Russia, 18 October, 2016 3-2.
International Index of Energy Security Risk
 International Index of Energy Security Risk Assessing Risk in a Global Energy Market 2013 Edition Highlights Institute for 21st Century Energy U.S. Chamber of Commerce www.energyxxi.org Highlights This
Orientation for a fast-changing energy world. Dr Fatih Birol IEA Chief Economist Tokyo, 21 April 2014
 Orientation for a fast-changing energy world Dr Fatih Birol IEA Chief Economist Tokyo, 21 April 2014 The world energy scene today Some long-held tenets of the energy sector are being rewritten Countries
Promoting regional cooperation in the Asia-Pacific gas industry, for sustainable development in the region
 Natural Gas Trade as a Catalyst for Regional Market Integration Promoting regional cooperation in the Asia-Pacific gas industry, for sustainable development in the region Norio Ichino Chairman, The Japan
The increasing role of LNG in Europe. 7th US-EU Energy Regulators Roundtable Nov , New Orleans
 The increasing role of LNG in Europe Agenda World outlook European demand and supply Growing role for LNG in Europe Conclusion Gas supply/demand in the world : Geographic dissociation of reserves and demand
INTERNATIONAL CONVENTION ON LIABILITY AND COMPENSATION FOR DAMAGE IN CONNECTION WITH THE CARRIAGE OF HAZARDOUS AND NOXIOUS SUBSTANCES BY SEA
 INTERNATIONAL OIL POLLUTION COMPENSATION FUND 1992 ASSEMBLY 92FUND/A/ES.12/9/1/Rev.1* 12th extraordinary session 15 May 2007 Agenda item 9 Original: ENGLISH INTERNATIONAL CONVENTION ON LIABILITY AND COMPENSATION
APEC Energy Outlook and Security Issues Asia Pacific Energy Research Centre (APERC)
") APEC Energy Outlook and Security Issues (APERC) Summary of APERC Presentation Energy demand in the APEC region is projected to rise by almost 60 percent between 1999 and 2020, at 2.1 percent per annum.
APEC Energy Outlook and Security Issues (APERC) Summary of APERC Presentation Energy demand in the APEC region is projected to rise by almost 60 percent between 1999 and 2020, at 2.1 percent per annum.
TABLE OF CONTENTS GAS MARKET REPORT
 TABLE OF CONTENTS Foreword... 3 Acknowledgements... 4 Executive summary... 11 1. Demand... 15 Global overview... 15 Assumptions... 18 OECD Demand... 19 Americas... 19 Europe... 26 Asia Oceania... 31 Non-OECD
Introduction to medium term reports Based on the most recent data available 5 years outlook is important for policy making Natural gas and renewables
 IEA Medium-Term Market Reports IEEJ Seminar Tokyo, 20 September 2012 Didier Houssin Director, Energy Markets and Security International Energy Agency OECD/IEA 2011 Introduction to medium term reports Based
The Future Role of Gas
 The Future Role of Gas GECF Global Gas Outlook 24 Insights Presentation for the 3rd IEA-IEF-OPEC Symposium on Gas and Coal Market Outlooks Dmitry Sokolov Head of Energy Economics and Forecasting Department
LNG Market Outlook and Development Pierre Cotin. 3 rd Annual LNG Shipping Forum 2013, Lillestrøm, 6 June 2013
 LNG Market Outlook and Development Pierre Cotin 3 rd Annual LNG Shipping Forum 2013, Lillestrøm, 6 June 2013 Who we are GLE is one of the three columns of GIE (Gas Infrastructure Europe), the European
Gas Markets in 2015: Outlook and Challenges
 The 418th Forum on Research Work Gas Markets in 2015: Outlook and Challenges December 19, 2014 Tetsuo Morikawa The Institute of Energy Economics, Japan Natural Gas Demand in Major Regions Natural Gas Demand
Global gas report. The natural gas market is at an inflection point: what will it take for growth forecasts to be achieved going forwards?
 Global gas report 2017 Prepared in collaboration with BCG Center for Energy Impact The natural gas market is at an inflection point: what will it take for growth forecasts to be achieved going forwards?
Impact of American Unconventional Oil and Gas Revolution
 National University of Singapore Energy Studies Institute 18 May 215 Impact of American Unconventional Oil and Gas Revolution Edward C. Chow Senior Fellow Revenge of the Oil Price Cycle American Innovation:
Höegh LNG The floating LNG services provider. Company and Market Update May 2012
 Höegh LNG The floating LNG services provider Company and Market Update May 2012 Forward looking statements This presentation contains forward-looking statements which reflects management s current expectations,
Meeting Asia LNG Demand in Challenging Cost and Price Enviroment
 Meeting Asia LNG Demand in Challenging Cost and Price Enviroment 9 th China-U.S. Oil and Gas Industry Forum G. M. (Chip) Schuppert, Jr Manager, Global LNG Marketing & Sales ConocoPhillips September 2009
PGC B Strategy - Triennium November 18 20, 2014 Bratislava. By: Ashkan Esmaeilifar
 1 PGC B Strategy - Triennium 2012 2015 November 18 20, 2014 Bratislava By: Ashkan Esmaeilifar 2 COUNTRY PROFILE Area (km 2 ): 49,035 Population: 5,379,000 Capital: Bratislava Member of OECD, WTO, NATO,
LNG Market in Asia. - A Japanese Perspective on the LNG Industry - October 14 th, Industry Research Department
 LNG Market in Asia - A on the LNG Industry - October 14 th, 216 Industry Research Department Copyright (c) Mizuho Bank, Ltd. All Rights Reserved. Contents 1 Energy Policies in Japan P. 2 2 P. 9 3 P. 15
Meat and Meat products: price and trade update Issue 3 November Meat and Meat products. Price and Trade Update: November
 Issue 3 November 2014 Weekly Newsletter Meat and Meat products Price and Trade Update Export prices remain at historic highs Meat and Meat products Price and Trade Update: November 2014 1 The FAO Meat
As discussed in Chapters 2 and 5, energy fuel
 C H A P T E R 8 Energy and Fuels As discussed in Chapters 2 and 5, energy fuel mix and energy intensity (shaped by economic structure and energy efficiencies) play important roles as drivers of CO 2 emissions.
LNG Import Facility Infrastructure Options
 LNG Import Facility Infrastructure Options Mangesh Patankar (Head of Business Development Galway Group) 28 th April 2016 www.galwaygroup.com Agenda Introduction to Galway Group Types of Regas terminals
The 3 rd International LNG Summit
 OAPEC Organization of Arab Petroleum Exporting Countries 3 rd Annual Future Prospects for LNG in the Arab Countries and Implications on the Global LNG Market Gas Industries Expert OAPEC Agenda Setting
The Global Natural Gas Industry
 The Global Natural Gas Industry Orlando CABRALES SEGOVIA Presidente de Naturgas, Colombia Regional Coordinator International Gas Union August 28 218 IGU Members serve 97% of the Worlds Gas Market 91 Charter
LNG Markets in Transition : Will East meet West?
 LNG Markets in Transition : Will East meet West? Jean-Marc Hosanski World Conference Tokyo, June 2nd, 2003 WOC 10 Thank you Mister Chairman, Ladies and Gentlemen, Distinguished Guests, My objective today
OECD/IEA The IEA gas outlook Ambassador Richard H. Jones Deputy Executive Director
 The IEA gas outlook Ambassador Richard H. Jones Deputy Executive Director Key highlights Gas demand has recovered strongly in 2010 It continues to increase in 2011, except in Europe Medium-term outlook
CHENIERE ENERGY, INC. Louisiana Energy Conference. June 2016
 CHENIERE ENERGY, INC. Louisiana Energy Conference June 2016 Forward Looking Statements This presentation contains certain statements that are, or may be deemed to be, forward-looking statements within
Global Guide to Natural Gas Utilities Report Edition 1, 2012
 Global Guide to Natural Gas Utilities Report Edition 1, 2012 Market Intelligence Carbon reduction commitments and low gas prices relative to other fossil fuels have made natural gas more attractive for
Global Energy & CO2 Status Report 2017
 Global Energy & CO2 Status Report 2017 March 2018 Key findings Energy: Global energy demand increased by 2.1% in 2017, compared with 0.9% the previous year and 0.9% on average over the previous five years.
LNG Import Terminals: Challenges and Opportunities
 LNG Import Terminals: Challenges and Opportunities 13 th October 2016 Mangesh Patankar Head of Business Development (Asia Pacific), Galway Group www.galwaygroup.com 1 Galway Group has been actively involved