Leary s Brook at Prince Philip Drive
|
|
|
- Nelson Osborne
- 5 years ago
- Views:
Transcription


1 Real-Time Water Quality Report Leary s Brook at Prince Philip Drive Deployment Period January 18, 216 to February 22, 216 Government of Newfoundland & Labrador Department of Environment and Conservation Water Resources Management Division
2 Leary s Brook, Newfoundland and Labrador Prepared by: Paul Rideout Environmental Scientist Water Resources Management Division Department of Environment & Conservation 4th Floor, Confederation Building, West Block PO Box 87, St. John's NL A1B 4J6 Ph. No.: (79) Fax No.: (79) paulrideout@gov.nl.ca 3

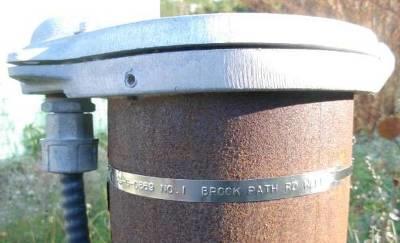
3 Leary s Brook, Newfoundland and Labrador General The Water Resources Management Division (WRMD), in partnership with Environment Canada, maintains a real-time water quality and water quantity monitoring station at Leary s Brook adjacent to Prince Phillip Parkway. The real-time station allows for assessment and management of the water body. This deployment report discusses water quality related events occurring at the Leary s Brook station. The purpose of this real-time station is to monitor, process and publish hydrometric (water quantity) and real-time water quality data at the real-time station. Leary s Brook is an urban stream that flows through industrial and commercial areas and adjacent to a major roadway. This report covers the period between the deployment on January 18, 216 and removal on February 22, 216. Figure 1: Leary s Brook Real-Time Water Quality and Quantity Station. 4
4 Leary s Brook, Newfoundland and Labrador Quality Assurance and Quality Control As part of the Quality Assurance and Quality Control protocol (QA/QC), an assessment of the reliability of data recorded by an instrument is made at the beginning and end of the deployment period. The procedure is based on the approach used by the United States Geological Survey. At deployment and removal, a QA/QC Sonde is temporarily deployed alongside the Field Sonde. Values for temperature, ph, conductivity, dissolved oxygen and turbidity are compared between the two instruments. Based on the degree of difference between the parameters on the Field Sonde and QA/QC Sonde at deployment and at removal, a qualitative statement is made on the data quality (Table 1). Table 1: Instrument Performance Ranking classifications for deployment and removal Rank Parameter Excellent Good Fair Marginal Poor Temperature ( C) <=+/-.2 >+/-.2 to.5 >+/-.5 to.8 >+/-.8 to 1 <+/-1 ph (unit) <=+/-.2 >+/-.2 to.5 >+/-.5 to.8 >+/-.8 to 1 >+/-1 Sp. Conductance (μs/cm) <=+/-3 >+/-3 to 1 >+/-1 to 15 >+/-15 to 2 >+/-2 Sp. Conductance > 35 μs/cm (%) <=+/-3 >+/-3 to 1 >+/-1 to 15 >+/-15 to 2 >+/-2 Dissolved Oxygen (mg/l) (% Sat) <=+/-.3 >+/-.3 to.5 >+/-.5 to.8 >+/-.8 to 1 >+/-1 Turbidity <4 NTU (NTU) <=+/-2 >+/-2 to 5 >+/-5 to 8 >+/-8 to 1 >+/-1 Turbidity > 4 NTU (%) <=+/-5 >+/-5 to 1 >+/-1 to 15 >+/-15 to 2 >+/-2 The temperature sensor on any sonde is the most important. All other parameters can be divided into subgroups of: temperature dependant, temperature compensated and temperature independent. Due to the temperature sensor s location on the sonde, the entire sonde must be at a constant temperature before the temperature sensor will stabilize. The values may take some time to climb to the appropriate reading; if a reading is taken too soon it may not accurately portray the water body. Deployment and removal instrument performance rankings for Leary s Brook for the period of January 18, 216 to February 22, 216 are summarized in Table 2. Table 2: Instrument performance rankings for Leary s Brook Station Leary s Brook Date January 18, 216 February 22, 216 Action Comparison Ranking Temperature ph Conductivity Dissolved Oxygen Turbidity Deployment Excellent Fair Excellent Good Poor Removal Good Excellent Excellent Excellent Poor 5
5 Leary s Brook, Newfoundland and Labrador At the Leary s Brook station at the time of deployment, the temperature and conductivity readings ranked as Excellent. The dissolved oxygen ranked as Good. The ph ranked as Fair and the turbidity readings ranked as Poor. Leary s Brook water was very cloudy at the time of deployment on January 18. The QA/QC sonde recorded a turbidity value of 4.1 NTU while the field (deployed) sonde recorded a value of 67.2 NTU. As both sondes had performed well during recent calibration for turbidity against a known laboratory standard, this difference, resulting in a Poor ranking as noted above, may have been caused by variations occurring naturally in the brook. At the time of removal, ph, conductivity and dissolved oxygen ranked as Excellent, temperature ranked as Good and turbidity ranked as Poor. The Poor ranking for turbidity at the time of removal was likely caused by an extreme siltation event that occurred during the early morning on February 18. Over a period of 7 hours, from approximately 9: PM on February 17 to 4: AM on February 18, flow increased 33% in Leary s Brook. Turbidity data collected subsequent to this event is considered to be unreliable and has been removed from the data set. Data Interpretation The following graphs and discussion illustrate water quality-related events from January 18, 216 to February 22, 216 at the Leary s Brook station. With the exception of water quantity data (stage), all data used in the preparation of the graphs and subsequent discussion below adhere to this stringent QA/QC protocol. Water Survey of Canada is responsible for QA/QC of water quantity data. Corrected and finalized data may be retrieved from the Water Survey of Canada website ( Precipitation data from the deployment period was retrieved from the Environment Canada weather station at St. John s International Airport. 6
6 216 Jan Jan Jan Jan Jan Jan Jan Jan Jan Jan Jan Jan Jan Jan Feb Feb Feb Feb Feb Feb Feb Feb Feb Feb Feb Feb Feb Feb Feb Feb Feb Feb Feb Feb Feb 22 Temperature ( C) Stage (m) Leary s Brook, Newfoundland and Labrador Leary s Brook Water Temperature Water temperature ranged from -.8 o C to 4.58 o C during this deployment period (Figure 2). Water temperature at Leary s Brook displays a typical variation over the deployment period. Water temperature is influenced by air temperature. The water temperature data displayed on Figure 2 is typical of shallow streams and ponds. Shallow water bodies are highly influenced by variations in ambient air temperatures. Water temperature also falls overnight and rises during daylight hours. 3 Water Temperature and Stage Level at Leary's Brook Water Temperature Stage.4.2 Date Figure 2: Water Temperature and Stage Level at Leary s Brook 7
7 216 Jan Jan Jan Jan Jan Jan Jan Jan Jan Jan Jan Jan Jan Jan Feb Feb Feb Feb Feb Feb Feb Feb Feb Feb Feb Feb Feb Feb Feb Feb Feb Feb Feb Feb Feb 22 ph Stage (m) Leary s Brook, Newfoundland and Labrador ph Throughout this deployment period ph values ranged between 5.56 ph units and 7.6 ph units (Figure 3). For most of the deployment, ph values were near or above the minimum CCME Guidelines for the Protection of Aquatic Life (6.5 ph units). The CCME guideline provides a basis by which to judge the overall health of the brook. Naturally, all streams and brooks are different. Leary s Brook ph median was 6.69 (ph units) for this deployment period. As illustrated below, ph typically falls in Leary s Brook (the water becomes more acidic), at the same time as stage and flow are increasing. In general, precipitation entering Leary s Brook has a lower ph than local surface water and this causes a reduction in the ph of the brook ph and Stage Level at Leary's Brook Max ph (CCME Protection of Aquatic Life Guideline) Min ph (CCME Protection of Aquatic Life Guideline) ph (ph Units) Stage (m).2 Date Figure 3: ph (ph units) values at Leary s Brook Station 8
8 216 Jan Jan Jan Jan Jan Jan Jan Jan Jan Jan Jan Jan Jan Jan Feb Feb Feb Feb Feb Feb Feb Feb Feb Feb Feb Feb Feb Feb Feb Feb Feb Feb Feb Feb Feb 22 Specific Conductivity (µs/cm) Stage (m) & TDS (g/l) Leary s Brook, Newfoundland and Labrador Specific Conductivity The conductivity levels ranged between 26. µs/cm and µs/cm during this deployment period. The median was µs/cm. TDS ranged from.132 g/ml to 6.95 g/ml. The peaks in conductivity seen during the early part of this deployment period are believed to be associated with road and parking lot salting adjacent and upstream of Leary s Brook due to low temperatures encountered nightly. The highest conductivity and TDS occurred during the January 26 to January 27 period when rain fell in significant amounts after a period of cold weather and snow. This rain flushed large amounts of road salt and other debris into the brook. Peaks in conductivity recorded during the February 1 to February 18 period are again associated with road salting and runoff during colder weather with no rain. Maximum stage occurred after a significant rainfall event (with snow on the ground) overnight on February 18. The lowest conductivity was also recorded at this time as rainwater and snowmelt entered the brook, diluting salts and other solids that were present. 12 Specific Conductance, TDS and Stage Level at Leary's Brook 8 1 Specific Conductivity (us/cm) Stage (m) TDS (g/l) Deployment Period Figure 4: Specific conductivity (μs/cm), TDS (g/l) and stage (m) values at Leary s Brook Station 9
9 216 Jan Jan Jan Jan Jan Jan Jan Jan Jan Jan Jan Jan Jan Jan Feb Feb Feb Feb Feb Feb Feb Feb Feb Feb Feb Feb Feb Feb Feb Feb Feb Feb Feb Feb Feb 22 DO (mg/l) DO (%-Sat) & Temperature ( C) Leary s Brook, Newfoundland and Labrador Dissolved Oxygen The instrument measures dissolved oxygen (mg/l) directly then calculates percent saturation (% Sat.). The Dissolved Oxygen % Sat levels within this deployment period were between 91.9% Sat and 11.1% Sat. Dissolved Oxygen (mg/l) measured between mg/l and mg/l. The DO mg/l values are consistently above the minimum DO CCME guideline for early life stages for this deployment period (Figure 5). Small dips in mg/l values are associated with increases in water temperature. Cool water can hold more dissolved oxygen than warmer water Dissolved Oxygen (mg/l & % Sat) and Water Temperature at Leary's Brook CCME Guideline for the Protection of Early Life Stages CCME Guideline for the Protection of Other Life Stages DO (mg/l) DO (%Sat) Water Temperature (oc) 1 Figure 5: Dissolved oxygen (mg/l & % sat) and water temperature ( C) values at Leary s Brook Station 1
10 216 Jan Jan Jan Jan Jan Jan Jan Jan Jan Jan Jan Jan Jan Jan Feb Feb Feb Feb Feb Feb Feb Feb Feb Feb Feb Feb Feb Feb Feb Feb Feb Feb Feb Feb Feb 22 Turbidity (NTU) Stage (m) Leary s Brook, Newfoundland and Labrador Turbidity The turbidity sensor records values between NTU and 3 NTU. A turbidity reading of 3NTU is identified as an error and is not a true value. Readings of 3 NTU should not be included in any statistical analysis. The turbidity readings during this deployment ranged between. NTU to 965. NTU (Figure 6). Higher turbidity values closely correspond with precipitation events and elevated river stage and runoff (Figure 7). Rainfall and subsequent runoff along with increased flow carries road and bank sediment and other material into the brook which is captured by the turbidity sensor. A significant rainfall and associated peak in stage and flow on the night of February 18 caused the turbidity sensor to be covered in sediment. Turbidity readings collected subsequent to this event are considered to be unreliable and have been removed from the data set. 12 Turbidity (NTU) Turbidity and Stage Level at Leary's Brook Stage (m) Turbidity data removed due to sensor malfunction Deployment Period Figure 6: Turbidity (NTU) values at Leary s Brook Station 11
11 18-Jan 19-Jan 2-Jan 21-Jan 22-Jan 23-Jan 24-Jan 25-Jan 26-Jan 27-Jan 28-Jan 29-Jan 3-Jan 31-Jan 1-Feb 2-Feb 3-Feb 4-Feb 5-Feb 6-Feb 7-Feb 8-Feb 9-Feb 1-Feb 11-Feb 12-Feb 13-Feb 14-Feb 15-Feb 16-Feb 17-Feb 18-Feb 19-Feb 2-Feb 21-Feb 22-Feb Stage (m) Total Precipitation (mm) Leary s Brook, Newfoundland and Labrador Stage and Total Precipitation The below graph includes daily total precipitation data from St. John s International Airport weather station and the daily average stage. Please note that the stage data in this report is raw data. It has not been corrected for backwater effect. WSC is responsible for QA/QC of water quantity data. Corrected data can be obtained upon request to WSC. Stage (and streamflow) usually varies significantly throughout the deployment period in Leary s Brook. Stage is directly influenced by rainfall and subsequent runoff from the surrounding environment. Precipitation runoff impacts urban streams relatively quickly as rainfall flows across impervious surfaces such as roads and parking lots and then into storm drains. Precipitation occurring as snow or mostly snow does not cause an immediate significant increase in stage or flow. This can be seen on January 18 when a 31 cm snowfall was recorded and on January 29 when a 1.4 cm snowfall was recorded. Stage peaked on February 18 after significant rainfall occurred with 2 cm of snow on the ground. 1.6 Daily Average Stage Levels & Precipitation Amounts at Leary's Brook Total Precipitation Daily Average Stage Date Figure 7: Daily average stage values (m) from Leary s Brook Station and daily total precipitation values (mm) from St. John s International Airport. 12
12 Leary s Brook, Newfoundland and Labrador Conclusions Generally in natural environments, climate and weather conditions contribute in large part to the variation in water quality. During this deployment it was evident that many of the changes displayed on the graphs are related to intermittent precipitation events and small climatic changes of the seasons. The impact of road salting and heavy rain on snow was also seen during this deployment period. Rainfall events during the deployment period led to related fluctuations in stage, which thus influenced the values of turbidity, ph, specific conductance, and TDS. When ambient air temperatures decreased, there were correspondingly cooler water temperatures, which in turn slightly increased the amount of dissolved oxygen in the water. During this deployment period the median water temperature at the Leary s Brook station was 1.2 C. The median ph value for Leary s Brook Station was 6.69 (ph units). The ph level for the most part is steady at this station. Dissolved Oxygen at Leary s Brook had a median of 97.6%Sat during the deployment period. Small reductions in DO (mg/l and % Sat) correspond with increases in water temperatures. The turbidity median value at Leary s Brook during deployment was 3.3 NTU. Increases in stage level can explain most of the peaks in the turbidity values during the deployment period. As organic matter and sediments are washed into the brook, the suspended matter in the water column will increase and the turbidity sensor will detect an increase in water cloudiness. 13
Waterford River at Kilbride
 Real Time Water Quality Report Waterford River at Kilbride Deployment Period June 2, 2015 to August 20, 2015 Government of Newfoundland & Labrador Department of Environment and Conservation Water Resources
Outer Cove Brook Network
 Real Time Water Quality Report Outer Cove Brook Network Deployment Period August 6 to September 4, 2013 Government of Newfoundland & Labrador Department of Environment and Conservation Water Resources
Outer Cove Brook Network
 Real Time Water Quality Report Outer Cove Brook Network Deployment Period May 3 to June 4, 2013 Government of Newfoundland & Labrador Department of Environment and Conservation Water Resources Management
Real-Time Water Quality Deployment Report
 Real-Time Water Quality Deployment Report Iron Ore Company of Canada Lab West Network July to August 31, 1 Government of Newfoundland & Labrador Department of Environment and Climate Change Water Resources
Waterford River Kilbride NF02ZM0009 December 2013 to January 2014
 Waterford River @ Kilbride NF02ZM0009 December 2013 to January 2014 Government of Newfoundland & Labrador Department of Environment and Conservation Real Time Water Quality Monthly Report Waterford River
Table 1: QA/QC Data Comparison Rankings for deployment between June 24 and July 21, 2009.
 General The Water Resources Management Division staff monitors the real-time web page on a daily basis. This monthly deployment report interprets the data from a water quality monitoring station on Minipi
Real-Time Water Quality Deployment Report
 Real-Time Water Quality Deployment Report Rattling Brook Network February 19, 2016 to March 23, 206 Government of Newfoundland & Labrador Department of Environment and Conservation Water Resources Management
Real-Time Water Quality Deployment Report
 Real-Time Water Quality Deployment Report Duck Pond Network July 6, 2016 to August 30, 2016 Government of Newfoundland & Labrador Department of Environment and Climate Change Water Resources Management
Long Harbour Real-Time Water Quality Monitoring Network. Annual Report
 Long Harbour Real-Time Water Quality Monitoring Network Annual Report 2008 Prepared by: Date: Ryan Pugh Ph: 709.729.16.81 Fx: 709.729.0320 ryanpugh@gov.nl.ca March 2, 2009 Table of Contents Table of Contents...
Labrador Iron Mines Schefferville Network
 Real Time Water Quality Report Labrador Iron Mines Schefferville Network 2015 06 02 to 2015 10 05 Government of Newfoundland & Labrador Department of Environment and Conservation Water Resources Management
Labrador Iron Mines Schefferville Network
 Real Time Water Quality Report Labrador Iron Mines Schefferville Network 2011 06 04 to 2011 10 16 Government of Newfoundland & Labrador Department of Environment and Conservation Water Resources Management
Newfoundland and Labrador Hydro Churchill River Real Time Water Monitoring Network Annual Report 2008
 Newfoundland and Labrador Hydro Churchill River Real Time Water Monitoring Network Annual Report 2008 Prepared by: Grace Gillis Environmental Scientist PH: (709) 896-5473 FX: (709) 896-4043 Email: gracegillis@govnlca
Real-Time Water Quality Monitoring Network in Newfoundland and Labrador
 Real-Time Water Quality Monitoring Network in Newfoundland and Labrador Overview Objectives of Real-Time Water Quality Monitoring Program in NL Real-Time Water Quality Monitoring Network in NL - - - Provincial
Blue Green Algae Monitoring Summary Report
 Blue Green Algae Monitoring Summary Report 2007 2015 March 2016 Government of Newfoundland & Labrador Department of Environment and Conservation Water Resources Management Division Prepared by: Paul Rideout
Kinley Creek Monitoring Sites Monitoring Data Summary for March 30 th, 2017 May 3 rd, 2017
 Kinley Creek Monitoring Sites Monitoring Data Summary for March 3 th, 17 May 3 rd, 17 Data Gaps The KINA and KINB stations did not experience any gaps in the data record during this monitoring period.
Morro Bay Watershed Creek Health For Water Year 2017
 Morro Bay Watershed Creek Health For Water Year 201 Date Range: October 1, 201 to September 30, 201 Analytes: Dissolved oxygen, water temperature, nitrates as N, orthophosphates as P Background The Morro
Kinley Creek Monitoring Sites Monitoring Data Summary for August 19 th, 2017 September 18 th, 2017
 Kinley Creek Monitoring Sites Monitoring Data Summary for August 19 th, 217 September 18 th, 217 Data Gaps The KINA station experienced submergence issues that affected specific conductivity from the date
Ionic Concentration Estimation of Urban and Non Urban Water Bodies of Newfoundland and Labrador using Real Time Water Quality Data
 Ionic Concentration Estimation of Urban and Non Urban Water Bodies of Newfoundland and Labrador using Real Time Water Quality Data Date: July 8 th, 2013 Government of Newfoundland and Labrador Department
SOURCE WATER MONITORING
 Monitoring and Protecting Our Water Sources SOURCE WATER MONITORING The Upper Cache la Poudre (UCLP) Watershed Collaborative Monitoring Program was established in 28 between the City of Fort Collins, the
Regional District of Nanaimo Community Watershed Monitoring Network 2011 Data Summary
 With participation from: Mid Vancouver Island Habitat Enhancement Society, Qualicum Beach Streamkeepers, Parksville Fish & Game, Nile Creek Enhancement Society, Friends of French Creek and Nanaimo Area
TSS The TSS analyser was operational during the reporting period. The composite sampler is in place to cover any shortfalls in the TSS analyser.
 Interim Environmental Report Period Ending: 3 th April 28 Compiled By: Siobhan Quinn, Aoife Reynolds & Thomas McGlynn Approved By: Tony Doyle 1 Monitoring Data 1.1 Monitoring Equipment Axonics Axonics
Resource. ph must be measured in the field. The ph will change if the water is collected and stored, and will not reflect the true value at the site.
 Resource ph What is ph? ph is a measurement of how acidic or alkaline (basic) the water is. ph is measured on a scale of 0 to 14, with 0 being the most acidic, and 14 being the most basic. Distilled water,
Reporting Period: 01/01/2010 to 12/31/2010. Understanding the Level 2 Stream Monitoring Data Report
 Squaw Creek, 10030147 Squaw Creek Latitude: 45.32639, Longitude: -88.945564 Jim Waters, Wolf River Trout Unlimited Andy Killoren, Wolf River Trout Unlimited Reporting Period: 01/01/2010 to 12/31/2010 Understanding
Reporting Period: 01/01/2008 to 12/31/2008. Understanding the Level 2 Stream Monitoring Data Report
 Panther Creek, 10010222 Panther Creek Latitude: 44.6216, Longitude: -90.568054 Carol Vedra, Beaver Creek Science Center Steven Hemersbach, Beaver Creek Citizen Science Center Reporting Period: 01/01/2008
Reporting Period: 01/01/2008 to 12/31/2008. Understanding the Level 2 Stream Monitoring Data Report
 St Croix River at Old HWY 53 At Gordon, 163118 Saint Croix River Latitude: 46.252617, Longitude: -91.79963 Susan Peterson, Friends of the Saint Croix Headwaters James Heim, Friends of the Saint Croix Headwaters
Acidity and Alkalinity:
 Evaluation of Pollution Sources to Lake Glenville Quarterly Report December 2018 Kimberlee K Hall, PhD Environmental Health Program, Western Carolina University Summary Chemical and microbial analysis
When Things Heat Up. To relate the physical and chemical properties of water to a water pollution issue.
 Purpose: Summary: To relate the physical and chemical properties of water to a water pollution issue. In this exercise, students will measure the temperature and dissolved oxygen of a stream (or use their
2015 Range Ponds Water Quality Report
 2015 Range Ponds Water Quality Report Prepared by Scott Williams, Aquatic Biologist Lake & Watershed Resource Management Associates PO Box 65; Turner, ME 04282 207-576-7839 The Range Ponds Environmental
Santa Rosa Creek Water Quality Results 2004
 Santa Rosa Creek Water Quality Results 24 Community Clean Water Institute Site Description: SRC4: Off 3rd Street in downtown Santa Rosa. Behind the Vineyard Hotel just West of Highway 11 along the Prince
Real-time Water Quality Monitoring
 Real-time Water Quality Monitoring Amanjot Singh, Ph.D., P. Eng. Water Quality Engineer Credit Valley Conservation Authority November 14, 212 Focus Current sampling methods their objectives and limitations
fcgov.com/water-quality Water Quality Update Summer 2017 Monitoring and Protecting Our Water Sources
 Water Quality Update Summer 217 Monitoring and Protecting Our Water Sources SOURCE WATER MONITORING The Upper Cache la Poudre (UCLP) Watershed Collaborative Monitoring Program was established in 28 between
INTERMEDIATE BMI ASSESSMENT TIER 2 FIELD SHEET
 INTERMEDIATE BMI ASSESSMENT TIER 2 FIELD SHEET PHYSICAL PARAMETERS ASSESSMENT FIELD SHEET ALL TIERS NAME: DATE: TIME: STREAM OR RIVER NAME: WATERSHED NAME: TOWN: WEATHER PRESENT PAST 48 HOURS SITE DESCRIPTION
Keeyask Infrastructure Project
 Keeyask Infrastructure Project Terrestrial and Aquatic Monitoring Plan Annual Report 2014-2015 December 2015 KEEYASK INFRASTRUCTURE PROJECT TERRESTRIAL AND AQUATIC MONITORING PLAN Water Quality: Annual
What s in the Water?
 Purpose: Summary: Background: To observe and list abiotic factors in specific ecosystems. In this exercise, students will observe and list abiotic factors in an aquatic system and measure four of them
Performance Evaluation of Rainwater Harvesting Systems Toronto, Ontario
 Performance Evaluation of Rainwater Harvesting Systems Toronto, Ontario Prepared by: Toronto and Region Conservation 2010 Toronto, Ontario A final report prepared by: Toronto and Region Conservation Authority
Pebble Lake - Water Quality Report
 Emerald Lakes Village, Oakland County January 8 th, 218 Pebble Lake - Water Quality Report The goal of this testing protocol was to monitor various water quality parameters of the lake, compare results
Results of Water Quality Measurements in Messer Pond Bob Crane, Messer Pond Protective Association (MPPA) Board
 Board") Results of Water Quality Measurements in Messer Pond Bob Crane, Messer Pond Protective Association (MPPA) Board The collection of water samples for the assessment of water quality in Messer Pond, New London,
Results of Water Quality Measurements in Messer Pond Bob Crane, Messer Pond Protective Association (MPPA) Board The collection of water samples for the assessment of water quality in Messer Pond, New London,
Little Bay Water Quality Report Card Spring 2014
 Little Bay Water Quality Report Card Spring 2014 Little Bay is a small, semi-enclosed estuary located in the heart of Rockport, Texas. Estuaries, where freshwater from rivers and streams mixes with salt
TSS The TSS analyser was operational during the reporting period. The composite sampler is in place to cover any shortfalls in the TSS analyser.
 Interim Environmental Report Period Ending: 28th May 28 Compiled By: Siobhan Quinn & Thomas McGlynn Approved By: Tony Doyle 1 Monitoring Data 1.1 Monitoring Equipment Axonics Axonics plant operated as
Gills Creek Monitoring Sites
 Gills Creek Monitoring Sites Data Gaps The GILA sonde was not submerged for part of this monitoring period, from March th March 14th, due most likely to the operation patterns of the control structure
fcgov.com/water-quality Water Quality Update Fall 2017 Monitoring and Protecting Our Water Sources
 Water Quality Update Fall 217 Monitoring and Protecting Our Water Sources SOURCE WATER MONITORING The Upper Cache la Poudre (UCLP) Watershed Collaborative Monitoring Program was established in 28 between
Stormwater Runoff Water Quality Characteristics From Highways in Lake Tahoe, California
 California State University, Sacramento (CSUS) University of California, Davis (UCD) California Department of Transportation (Caltrans) Stormwater Runoff Water Quality Characteristics From Highways in
WATER QUALITY MONITORING TFL 49 ECOLOGICAL STEWARDSHIP PROJECT Annual Report
 WATER QUALITY MONITORING For the TFL 49 ECOLOGICAL STEWARDSHIP PROJECT 2003 Annual Report Prepared for RIVERSIDE FOREST PRODUCTS LIMITED by DOBSON ENGINEERING LTD. #4, 1960 Springfield Road Kelowna, BC
El Dorado Hydroelectric Project FERC Project No Water Quality Monitoring Report
 El Dorado Hydroelectric Project FERC Project No. 184 21 Water Quality Monitoring Report EL DORADO IRRIGATION DISTRICT 289 Mosquito Road Placerville, CA 95667 March 211 1. Introduction The El Dorado Irrigation
The data used for this reporting period was taken from the on-site meteorological station.
 Environmental Report - Final Week Ending: Thur 15 th Mar 27 Generated By: Siobhan Quinn/Sandra Barber Checked By: Tony Doyle 1 Monitoring Data. 1.1 Monitoring Equipment Axonics Axonics plant ran for the
Baseline Water Quality Monitoring in the Eightmile River Watershed Summer 2014, 2015 and 2016
 Baseline Water Quality Monitoring in the Eightmile River Watershed Summer 2014, 2015 and 2016 1 Acknowledgements A Special thanks to our summer interns. Douglas Morey and David Lloyd 2 Executive Summary
Water Chemistry. Water 101
 Water Chemistry Water 101 I. Introduction A. Water is not pure Many different kinds of chemicals dissolved in it Ions, organic chemicals, organic matter, particulate matter, and gases can all be in water
LOXAHATCHEE RIVER WATER QUALITY EVENT SAMPLING TASK 2: FINAL REPORT ASSESSMENT OF LOXAHATCHEE RIVER WATER QUALITY
 LOXAHATCHEE RIVER WATER QUALITY EVENT SAMPLING TASK 2: FINAL REPORT ASSESSMENT OF 2007-2008 LOXAHATCHEE RIVER WATER QUALITY In Partial Fulfillment of Agreement No. 4600001281 For the Period October 2007
BC Approved Water Quality Guidelines (updated to 2014) Compendium of Working Water Quality Guidelines (updated to 2006)
 Compendium of Working Water Quality Guidelines (updated to 2006)") 13477-116 Ave Surrey, BC Canada V3R 6W4 April 15, 2014 Web Kassa Environment Canada 401 Burrard Street Vancouver, British Columbia V6C 3S5 Re: Addendum to April 9, 2014 submission: Summary of in situ and
13477-116 Ave Surrey, BC Canada V3R 6W4 April 15, 2014 Web Kassa Environment Canada 401 Burrard Street Vancouver, British Columbia V6C 3S5 Re: Addendum to April 9, 2014 submission: Summary of in situ and
Reporting Period: 01/01/2010 to 12/31/2010. Understanding the Level 2 Stream Monitoring Data Report
 Eau Claire River at Outlet Bay Rd, 10029003 Upper Eau Claire Lake Latitude: 46.302803, Longitude: -91.50336 Susan Peterson, Friends of the Saint Croix Headwaters John Kudlas, Friends of the St.Croix Headwaters
Methylmercury Monitoring Plan. For Surface Water Quality. Muskrat Falls Reservoir, Churchill River and Lake Melville
 DOC-2016-298 Methylmercury Monitoring Plan For Surface Water Quality Muskrat Falls Reservoir, Churchill River and Lake Melville Initial Plan Prepared: October 17, 2016 Revised: December 19, 2016 Introduction:
Grants Pass Water Quality Monitoring
 Grants Pass Water Quality Monitoring 2003-2005 Rogue Valley Council of Governments April 2005 Rogue Valley Council of Governments Natural Resources Department 155 North First Street Central Point, Oregon
WASA Quiz Review. Chapter 2
 WASA Quiz Review Chapter 2 Question#1 What is surface runoff? part of the water cycle that flows over land as surface water instead of being absorbed into groundwater or evaporating Question #2 What are
WATER QUALITY MONITORING TFL 49 FOREST ECOLOGICAL STEWARDSHIP PROJECT Annual Report
 WATER QUALITY MONITORING For the TFL 49 FOREST ECOLOGICAL STEWARDSHIP PROJECT 2002 Annual Report (FIA Activity # 2040021) Prepared for RIVERSIDE FOREST PRODUCTS LIMITED by DOBSON ENGINEERING LTD. #4, 1960
Environmental Report - Status Week Ending: Thur 12 h May2006 Generated By: Siobhan Quinn/Mairtin Naughton/Sandra Barber Checked By: Leslie Finnegan
 Environmental Report - Status Week Ending: Thur 12 h May2006 Generated By: Siobhan Quinn/Mairtin Naughton/Sandra Barber Checked By: Leslie Finnegan 1 Monitoring Data 1.1 Monitoring Equipment Axonics System
Evaluation copy. Total Dissolved Solids. Computer INTRODUCTION
 Total Dissolved Solids Computer 12 INTRODUCTION Solids are found in streams in two forms, suspended and dissolved. Suspended solids include silt, stirred-up bottom sediment, decaying plant matter, or sewage-treatment
MEMORANDUM Project Specific:
 Information Only MEMORANDUM Project Specific: 5-829-007 Policy Memo - File With TO: Robert Flaherty, Bullitt County Deputy Judge Executive FROM: Adam Connelly DATE: RE: 2006 Wet Weather Water Quality Monitoring
Water Quality in the Lower Tuolumne River Watershed,
 Water Quality in the Lower Tuolumne River Watershed, 2011-2014 Dominic Walker California State University Stanislaus January 18 th 2014 - December 15 th 2014 Advisor: Dr. Matthew Cover California State
fcgov.com/water-quality Water Quality Update Fall 2018 Monitoring and Protecting Our Water Sources
 Water Quality Update Fall 218 Monitoring and Protecting Our Water Sources SOURCE WATER MONITORING The Upper Cache la Poudre (UCLP) Watershed Collaborative Monitoring Program was established in 28 between
City of Daphne, Alabama Water Quality Monitoring Plan For Phase II MS4
 City of Daphne, Alabama Water Quality Monitoring Plan For Phase II MS4 2016-2021 Permit # ALR 040039, Expiration Date: September 30, 2021 I. Introduction This document presents the City of Daphne s Stormwater
Water Resources on PEI: an overview and brief discussion of challenges
 Water Resources on PEI: an overview and brief discussion of challenges Components: Components and links Atmospheric water Surface water (including glacial water) Groundwater Links: Precipitation (atm(
Total Dissolved Solids
 Total Dissolved Solids LabQuest 12 INTRODUCTION Solids are found in streams in two forms, suspended and dissolved. Suspended solids include silt, stirred-up bottom sediment, decaying plant matter, or sewage-treatment
Estero Americano Watershed Sediment Reduction Project, Phase II, Sonoma and Marin Counties, CA. Draft Quarterly Monitoring Report Item B.4.
 Estero Americano Watershed Sediment Reduction Project, Phase II, Sonoma and Marin Counties, CA Draft Quarterly Monitoring Report Item B.4.2 This quarterly report summarizes data collected from December
Environmental Services
 Environmental Services 14 River Water Quality Summary for the Twin Cities Metropolitan Area This document is a summary of the 14 water quality of major rivers in the Twin Cities metropolitan area (metro
JOE RICH CREEK WATERSHED
 Water Quality Monitoring For the South Slopes of the JOE RICH CREEK WATERSHED (Year 4-2003 Data) Prepared for GORMAN BROS. LUMBER LTD. Westbank, BC by DOBSON ENGINEERING LTD. #4, 1960 Springfield Road
Stream Observation Data Sheet School: Charleroi Middle School Date 9/24/15 Stream Study Site: Maple Creek. Macroinvertebrate Survey
 Stream Observation Data Sheet School: Charleroi Middle School Date 9/2/15 Stream Study Site: Maple Creek Teacher: Mr. Johnson Latitude_210 7 degrees NORTH Yesterday Group Members: Period 7 th Longitude_79
Prepared in Cooperation with: the Houston Galveston Area Council and the Texas Commission on Environmental Quality. By Lee Bodkin and Jeannette Oden
 Surrogate Relationship Development of Suspended Sediment and Total Suspended Solids Utilizing Turbidity and Streamflow Data in the West Fork San Jacinto River, near Conroe, Texas, July 2008 August 2009
Great Swamp Watershed Association
 Great Swamp Watershed Association FINAL REPORT WATER QUALITY IN GREAT BROOK Quarterly Monitoring Results January 2008 - December 2010 Prepared by: Roger Edwards, Volunteer and Kelley Curran, Director of
Applicable TEKS. Procedure. Duration. Objectives. Prerequisites. Materials. Temperature Station. ph Station
 L E S S O N LESSON 7 Survey: Physical Properties Applicable TEKS Grade 4 4.1 A 4.2 A, B, D, E, F 4.3 A 4.4 A, B Grade 4 4.1 A, C 4.8 C Duration Two 40-minute lessons Grade 5 5.1 A 5.2 A, C, D, E, F 5.3
Factsheet: Town of Hamden Water Quality and Stormwater Summary
 79 Elm Street Hartford, CT 06106-5127 www.ct.gov/deep Affirmative Action/Equal Opportunity Employer Factsheet: Town of Hamden Water Quality and Stormwater Summary This document was created for each town
Stream Observation Data Sheet School CMS Date 12/16/2015 Stream Study Site Mingo Creek. Macroinvertebrate Survey
 Stream Observation Data Sheet School CMS Date 2/6/205 Stream Study Site Mingo Creek Teacher Johnson Group Members: Latitude degrees NORTH Yesterday Longitude degrees WEST Weather Today Air Temperature
Comparison of Three Turbidity Instruments DTS-12, YSI, and Hydrolab
 Comparison of Three Turbidity Instruments DTS-12, YSI, and Hydrolab Prepared: 211-12-21 Government of Newfoundland & Labrador Department of Environment and Conservation Water Resources Management Division
SECTION 2 WATER 2.1 ROUTINE WATER COLUMN MONITORING Collection Summary
 SECTION 2 WATER 2.1 ROUTINE WATER COLUMN MONITORING 2.1.1 Collection Summary Routine water column sampling was performed biweekly between May and October for a total of 13 sampling rounds. Water column
Evaluation of Water Quality Effects of Stormwater Pond Construction in Horry County, South Carolina
 Evaluation of Quality Effects of Stormwater Construction in Horry County, South Carolina Environmental Quality Lab Burroughs & Chapin Center for Marine and Wetland Studies Coastal Carolina University February
Transparency A Water Clarity Measure
 Volunteer Monitoring Factsheet Series 2010 Transparency A Water Clarity Measure Why are we concerned? Water clarity is one of the most obvious measures of water quality. Water clarity can be a useful indicator
Ecology Unit 1 Practice Test
 Ecology Unit 1 Practice Test Grade:«8» Subject:Science ate:«10/2012 1 n ecologist would refer to all of the tropical rainforests worldwide as a biosphere a biome a community a population LT 1 I can define
WHIPPANY RIVER WATER QUALITY TREND ANALYSIS STUDY
 WHIPPANY RIVER WATER QUALITY TREND ANALYSIS STUDY FINAL REPORT AUGUST 28, 2012 PREPARED FOR THE WHIPPANY RIVER WATERSHED ACTION COMMITTEE PROJECT OFFICER: GEORGE VAN ORDEN, PH.D. TOWNSHIP OF HANOVER HEALTH
City of River Falls North Kinnickinnic River Monitoring Project Summary. Report prepared by SEH Inc., for the
 City of River Falls North Kinnickinnic River Monitoring Project 2012 Summary Report prepared by SEH Inc., for the City of River Falls Engineering Department December 2012 Project Introduction: City of
Long-Term Volunteer Lake Monitoring in the Upper Woonasquatucket Watershed
 Long-Term Volunteer Lake Monitoring in the Upper Woonasquatucket Watershed Linda Green URI Watershed Watch 1-87-95, lgreen@uri.edu WATER QUALITY IS A REFLECTION OF THE ACTIVITIES IN THE LANDS AND WATERS
CONTINUED MONITORING OF DO, ph, AND TURBIDITY IN THE WELLS FOREBAY AND LOWER OKANOGAN RIVER (DO, ph and Turbidity Study) WELLS HYDROELECTRIC PROJECT
 WELLS HYDROELECTRIC PROJECT") CONTINUED MONITORING OF DO, ph, AND TURBIDITY IN THE WELLS FOREBAY AND LOWER OKANOGAN RIVER () WELLS HYDROELECTRIC PROJECT FERC NO. 2149 FINAL REPORT NOT REQUIRED BY FERC March 2009 Prepared by: Parametrix,
CONTINUED MONITORING OF DO, ph, AND TURBIDITY IN THE WELLS FOREBAY AND LOWER OKANOGAN RIVER () WELLS HYDROELECTRIC PROJECT FERC NO. 2149 FINAL REPORT NOT REQUIRED BY FERC March 2009 Prepared by: Parametrix,
Factsheet: Town of East Lyme Water Quality and Stormwater Summary
 79 Elm Street Hartford, CT 06106-5127 www.ct.gov/deep Affirmative Action/Equal Opportunity Employer Factsheet: Town of East Lyme Water Quality and Stormwater Summary This document was created for each
2016, 2017 Estuarine Water Quality and Modeling in the Royal and Cousins Rivers
 2016, 2017 Estuarine Water Quality and Modeling in the Royal and Cousins Rivers Angela Brewer and Robert Mohlar Division of Environmental Assessment Bureau of Water Quality Protecting Maine s Air, Land
Factsheet: City of West Haven Water Quality and Stormwater Summary
 79 Elm Street Hartford, CT 06106-5127 www.ct.gov/deep Affirmative Action/Equal Opportunity Employer Factsheet: City of West Haven Water Quality and Stormwater Summary This document was created for each
Middle Santa Ana River Bacterial Indicator TMDL 2009 Dry Season Report
 Middle Santa Ana River Bacterial Indicator TMDL 2009 Dry Season Report December 31, 2009 on behalf of Santa Ana Watershed Project Authority San Bernardino County Stormwater Program County of Riverside
My Stream s Temperatures
 My Stream s Temperatures Temperature Adapted from: An original Creek Connections activity. Creek Connections, Box 10, Allegheny College, Meadville, Pennsylvania 16335. Grade Level: basic, all Duration:
Upper Sugar River Upstream Of Valley Spring Rd, Sugar River
 Upper Sugar River Upstream Of Valley Spring Rd, 10009472 Sugar River WBIC: 875300 Latitude: 43.03571, Longitude: -89.645996 Wade Moder, Upper Sugar River Watershed Association Wade Moder, Upper Sugar River
Municipal Stadium Wetland
 W A T E R S H E D F A C T S Total watershed area 140 mi 2 Average annual rainfall 38 in Average annual temperature 58 F Elevation Max 1321 ft Min 899 ft C. J. Brown Reservoir controls flow from 83 mi 2
MRSWMP Dry Run/ First Flush Summary
 Monterey Bay Sanctuary Citizen Watershed Monitoring Network 299 Foam Street Monterey, CA 93940 Bus. (831) 647-4227 Fax (831) 647-4250 2009-2010 MRSWMP Dry Run/ First Flush Summary Prepared by: Lisa Emanuelson,
Monitoring Stormwater Best Management Practices: Why Is It Important and What To Monitor
 Monitoring Stormwater Best Management Practices: Why Is It Important and What To Monitor Scott D. Struck, Ph.D. US EPA, Urban Watershed Management Branch New Jersey Water Monitoring Workshop 4/20/2006
October 29, Monitoring Data Analysis for September 20 October 21, Gills Creek Monitoring Sites
 October 9, Monitoring Data Analysis for September October, Gills Creek Monitoring Sites Over the course of the monitoring period (September through October, ), an overall decrease in water temperature
Fords Creek Report WATER MONITORING REPORT
 Fords Creek Report WATER MONITORING REPORT 1995-2010 Front Page: Sign on Fords Creek near Mansfield TABLE OF CONTENTS INTRODUCTION... 4 FIGURE 1. GOULBURN BROKEN CATCHMENT... 5 FIGURE 2. GOULBURN RIVER
Flow-Based Surrogate TMDLs, A Case Study in Ohio
 Lower Grand River TMDL January 2012 This fact sheet describes the characteristics of a good surrogate total maximum daily load (TMDL) and the factors that should be considered when selecting a surrogate
Thompson Valley Creek 12 m upstream at Barka Rd bridge, Thompson Valley Creek
 Thompson Valley Creek 12 m upstream at Barka Rd bridge, 10031841 Thompson Valley Creek WBIC: 2131100 Latitude: 44.647297, Longitude: -91.179436 Anna Mares, Beaver Creek Citizen Science Center Reporting
Pigeon River at Mill Rd, Pigeon River. Latitude: , Longitude: Tom Henning Kris Stepenuck, UWEX
 Pigeon River at Mill Rd, 603339 Pigeon River WBIC: 62300 Latitude: 43.7843264, Longitude: -87.7367284 Tom Henning Kris Stepenuck, UWEX Reporting Period: 01/01/1996 to 06/17/2016 Understanding the Level
Fox River -- Parkway North Canoe Launch, Fox River
 Fox River -- Parkway North Canoe Launch, 10030918 Fox River WBIC: 742500 Latitude: 42.977695, Longitude: -88.2647 Jayne Jenks, Waukesha County Ben and Karen Johnson Reporting Period: 01/01/2016 to 12/31/2016
Bears Grass Creek Feet Upstream Of Sth 12 Bridge(#Bg 2a), Bears Grass Creek
, Bears Grass Creek") Bears Grass Creek - 100 Feet Upstream Of Sth 12 Bridge(#Bg 2a), 10016662 Bears Grass Creek WBIC: 2130300 Latitude: 44.7306508, Longitude: -91.199377 Anna Mares, Beaver Creek Citizen Science Center Reporting
Bears Grass Creek - 100 Feet Upstream Of Sth 12 Bridge(#Bg 2a), 10016662 Bears Grass Creek WBIC: 2130300 Latitude: 44.7306508, Longitude: -91.199377 Anna Mares, Beaver Creek Citizen Science Center Reporting
Factsheet: Town of Trumbull Water Quality and Stormwater Summary
 79 Elm Street Hartford, CT 06106-5127 www.ct.gov/deep Affirmative Action/Equal Opportunity Employer Factsheet: Town of Trumbull Water Quality and Stormwater Summary This document was created for each town
Wakefield Lake TMDL Public Meeting 3/17/2014. Jen Koehler, PE Barr Engineering
 Wakefield Lake TMDL Public Meeting 3/17/2014 Jen Koehler, PE Barr Engineering Outline Project Contacts Introduction to Wakefield Lake Thoughts/Questions/Concerns About TMDL Studies Lake Water Quality and
Owasco Lake Day
 Introductions Halfman apologizes for not presenting this talk himself. A family reunion took precedent. Owasco Lake Day 6-25--14 1 The beginnings Preliminary water quality comparison of the Finger Lakes
What is it? Why is it important? What impacts it?
 Supplement C: Water Quality Information Sheet Water Quality Information SheetMeasure Water Temperature What is it? Why is it important? What impacts it? The level of heat in the degrees Fahrenheit ( F).