Dan Lucas, P.E. RETAP
|
|
|
- Ethelbert Leonard
- 5 years ago
- Views:
Transcription
1 Dan Lucas, P.E. RETAP
2 THE TOOL IS COMPOSED OF CALCULATORS THAT MEASURE THE REDUCTION OF POLLUTION AT ITS SOURCE
3 THE POLLUTION PREVENTION TOOL INCLUDES THE FOLLOWING CALCULATORS: P2 COST SAVINGS CALCULATOR P2 GREENHOUSE GAS CALCULATOR GALLONS TO POUNDS CONVERTER WASTE REDUCTION MODEL (WARM)
4 THE P2 COST SAVINGS CALCULATOR IS USED FOR ASSESSING COST SAVINGS ASSOCIATED WITH: REDUCED COSTS FOR HAZARDOUS INPUTS AND HAZARDOUS WASTE REDUCED AIR PERMITTING FEES REDUCED CHARGES FOR WATER USAGE AND ELECTRICITY
5 THE GREENHOUSE GAS CALCULATOR IS USED FOR ASSESSING GREENHOUSE GAS EMISSION CHANGES DUE TO: ELECTRICITY CONSERVATION GREEN ENERGY FUEL & CHEMICAL SUBSTITUTIONS WATER CONSERVATION IMPROVED MANAGEMENT THE GREENHOUSE GAS CALCULATOR IS ABLE TO USE DATA FROM THE COST SAVINGS CALCULATOR TO MAKE A DIRECT CONVERSION OF GREENHOUSE GAS REDUCTIONS TO RELATED COST SAVINGS

6 THE CONVERTER PROVIDES CONVERSIONS FROM COMMON BUSINESS UNITS TO UNITS REPORTED FOR THE P2 GRANT PROGRAMS. THE CONVERTER CONVERTS GALLONS TO POUNDS OF HAZARDOUS MATERIALS REDUCED.

7 THE WARM REDUCTION MODEL HELPS SOLID WASTE PLANNERS AND ORGANIZATIONS TRACK AND VOLUNTARILY REPORT GREENHOUSE GAS EMISSION REDUCTIONS FROM SEVERAL DIFFERENT WASTE MANAGEMENT PRACTICES
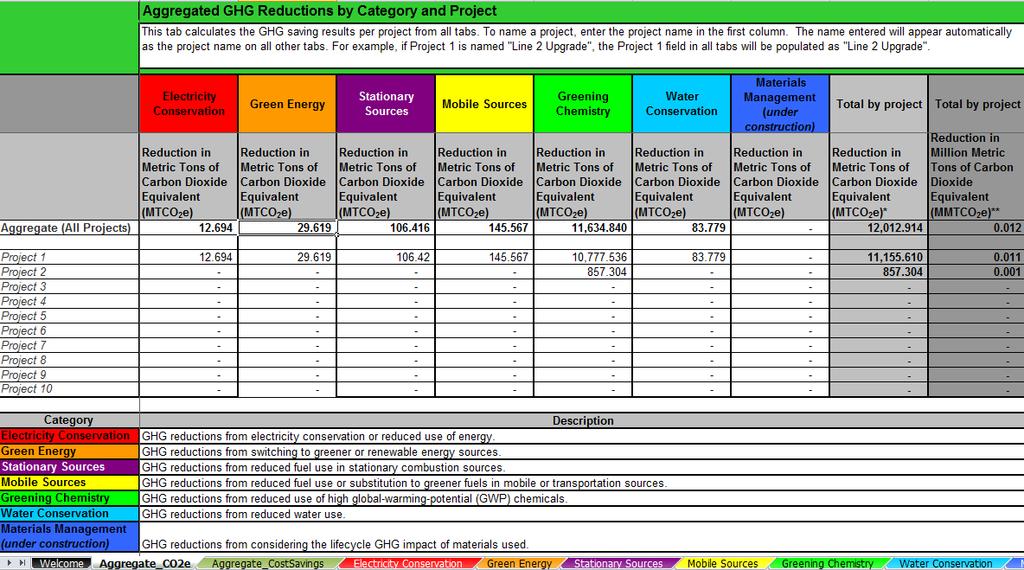
 TO CO 2 E AGGREGATES GHG CHANGES FROM INDIVIDUAL PROJECTS AND CATEGORIES CALCULATES THE COST SAVINGS ASSOCIATED WITH MOST OF")
8 THE GHG CALCULATOR CONVERTS THE UNITS FOR VALUES ENTERED (E.G., KWH SAVED, WATER REDUCED, ETC.) TO CO 2 E AGGREGATES GHG CHANGES FROM INDIVIDUAL PROJECTS AND CATEGORIES CALCULATES THE COST SAVINGS ASSOCIATED WITH MOST OF THE GHG-REDUCING ACTIVITIES ENTERED

9 THE P2 COST CALCULATOR ADDRESSES THE FINANCIAL VALUE OF REDUCING: HAZARDOUS INPUTS AND WASTES AIR EMISSIONS WATER POLLUTION WATER USE ENERGY ELECTRICITY NON-HAZARDOUS INPUTS AND SOLID WASTE (EPA/P2 TRACKS THESE BUT DOES NOT REPORT)

10 THE P2 GHG CALCULATOR ACCOMMODATES: ELECTRICITY CONSERVATION GREEN ENERGY STATIONARY AND MOBILE SOURCE FUEL REDUCTION AND/OR SUBSTITUTION GREENING CHEMISTRY WATER CONSERVATION
11 POLLUTION PREVENTION THROUGH SOURCE REDUCTION REDUCES: FINANCIAL COSTS THROUGH WASTE MANAGEMENT WASTE CLEANUP ENVIRONMENTAL COSTS FROM HEALTH PROBLEMS ENVIRONMENTAL DAMAGE
12 POLLUTION PREVENTION PROTECTS THE ENVIRONMENT BY: CONSERVING NATURAL RESOURCES PROTECTING NATURAL RESOURCES STRENGTHENING ECONOMIC GROWTH THROUGH: MORE EFFICIENT INDUSTRIAL PRODUCTION LESS NEED TO HANDLE WASTE
13 THE CALCULATOR IS NOT MEANT TO CALCULATE A PROGRAM S GREENHOUSE GAS FOOTPRINT, WHICH IS A MEASURE OF A PROGRAM S ENTIRE GREENHOUSE GAS EMISSIONS FOR ALL OPERATIONS. GHG REDUCTION IS NOT APPLICABLE TO WATER POLLUTION. THEREFORE, WATER POLLUTION IS NOT REPRESENTED IN THE GHG CALCULATOR.

14 THE FOLLOWING ARE EXAMPLES OF USING THE GREENHOUSE GAS AND COST SAVINGS CALCULATORS GHG REDUCTION IS NOT APPLICABLE TO WATER POLLUTION. THEREFORE, WATER POLLUTION IS NOT REPRESENTED IN THE GHG CALCULATOR.
15 GHG CALCULATOR: ELECTRICITY CONSERVATION TAB - REDUCTIONS FROM ELECTRICITY CONSERVATION ARE BASED ON STATE-SPECIFIC EMISSIONS AS DEFINED BY E-GRID. COST CALCULATOR: ELECTRICITY TAB - REDUCTIONS IN TRADITIONAL ELECTRICITY USE WILL RESULT IN COST SAVINGS($)
16 A MICHIGAN COMPANY DEVELOPED AN ELECTRICITY CONSERVATION PROGRAM IN THEIR FACILITY THAT CONSERVED 15,000 KWH. INPUT: GHG CALCULATOR: ELECTRICITY CONSERVATION TAB STATE OR US = MI ELECTRICITY CONSERVED = 15,000 UNIT REPORTED = KWH COST CALCULATOR: ELECTRICITY USE TAB STATE OR US = MI QUANTITY ELECTRICITY REDUCED = 15,000 UNIT = KWH OUTPUT: GHG CALCULATOR = MTCO 2 E

17

18
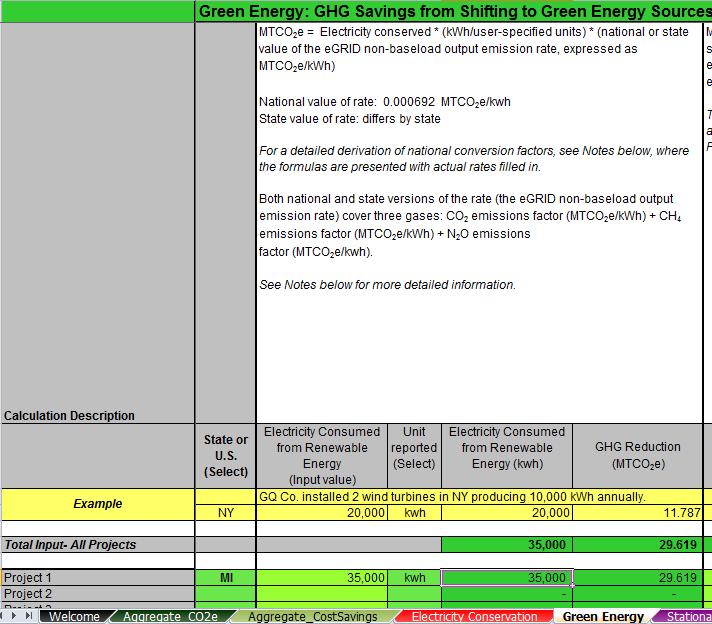
19 THIS MICHIGAN COMPANY PURCHASED 35,000 KWH OF GREEN ELECTRICITY. INPUT: GHG CALCULATOR: GREEN ENERGY TAB STATE OR US = MI ELECTRICITY CONSUMED FROM RENEWABLE ENERGY = 35,000 UNIT REPORTED = KWH COST CALCULATOR: ELECTRICITY USE TAB STATE OR US = MI QUANTITY ELECTRICITY REDUCED = 35,000 UNIT = KWH OUTPUT: GHG CALCULATOR = MTCO 2 E (EMISSIONS REDUCTION) COST CALCULATOR = $ (ADDITIONAL COST)
20

21
22 GHG CALCULATOR: GREEN ENERGY TAB ASSUMPTION: NO GHG EMISSIONS ASSOCIATED WITH GREEN POWER 1 KWH OF FOSSIL-FUEL ELECTRICITY REPLACED WITH 1 KWH OF RENEWABLY- GENERATED ELECTRICITY IS THE SAME AS REDUCING ELECTRICITY USE BY 1 KWH COST CALCULATOR: ELECTRICITY USE TAB PURCHASE OF GREEN ELECTRICITY WILL INCREASE COSTS CALCULATOR USES STATE-SPECIFIC DATA WHEN AVAILABLE, OR THE NATIONAL AVERAGE


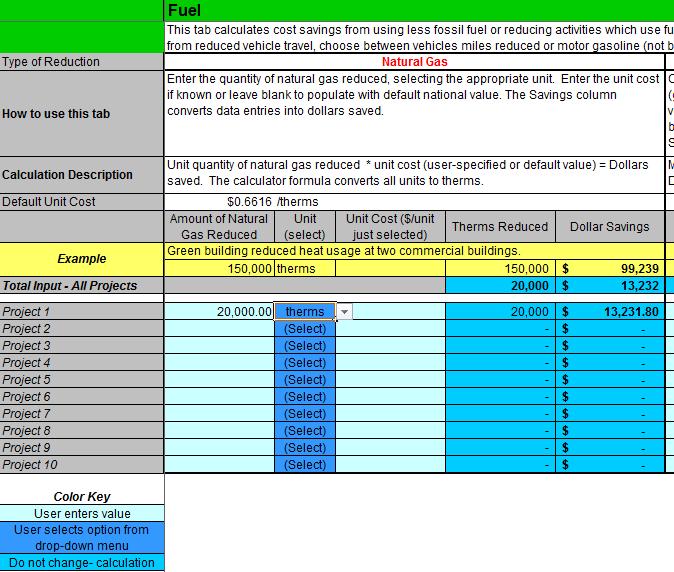
23 GHG CALCULATOR: STATIONARY SOURCES TAB CALCULATE GHG EMISSIONS REDUCTIONS ASSOCIATED WITH REDUCED FUEL USE INCLUDES EMISSION FACTORS FOR 14 COMMON FUEL TYPES USED TO POWER STATIONARY SOURCES (HIGH CARBON INTENSITY TO LOW) P2 COST CALCULATOR: FUEL USE TAB CALCULATES SAVINGS FROM REDUCED FUEL USE EXAMPLES OF DATA ENTRY OPTIONS INCLUDE NATURAL GAS, HEATING OIL, AND BIODIESEL.
24 THIS SAME MICHIGAN COMPANY ADJUSTED ITS PRODUCTION PROCESS WHICH REDUCED THE NATURAL GAS USED BY 20,000 THERMS ANNUALLY. INPUT GHG CALCULATOR: STATIONARY SOURCES TAB NATURAL GAS REDUCED = 20,000 UNITS = THERMS COST CALCULATOR: FUEL USE TAB AMOUNT NATURAL GAS REDUCED = 20,000 UNITS = THERMS OUTPUT GHG CALCULATOR = MTCO 2 E COST CALCULATOR = $13,231.80

25
26
27 P2 GHG CALCULATOR: MOBILE SOURCES TAB INCLUDES THE ABILITY TO CALCULATE SAVINGS FROM REDUCED VEHICLE AND AIRPLANE MILES USER ENTERS EITHER FUEL REDUCED OR VEHICLE / AIR MILES AVOIDED, BUT NOT BOTH P2 COST CALCULATOR: FUEL USE TAB CALCULATES SAVINGS FROM REDUCED FUEL USE EXAMPLES OF DATA ENTRY OPTIONS INCLUDE VEHICLE MILES DRIVEN AND MOTOR
28 ANOTHER MICHIGAN COMPANY UPGRADED ITS COMMUNICATIONS SYSTEM ALLOWING FOR ENHANCED VIDEOCONFERENCING CAPABILITY. THIS ALLOWED THE SAVINGS OF 150,000 AIR MILES TRAVELED ON SHORT FLIGHTS AND 700,000 MILES ON LONG HAUL FLIGHTS, AVOIDING 35 FLIGHTS AT AN AVERAGE FLIGHT COST OF $700. INPUT: GHG CALCULATOR: MOBILE SOURCES TAB AIR MILES LENGTH OF FLIGHT = MULTIPLE DISTANCES CALCULATOR FOR AIR MILES REDUCED OVER MULTIPLE DISTANCES SHORT HAUL: < 300 MILES = 150,000 LONG HAUL: > 700 MILES = 700,000 COST CALCULATOR: FUEL USE TAB AIR TRAVEL NUMBER OF FLIGHTS AVOIDED = 35 AVERAGE COST PER FLIGHT = $700 OUTPUT: GHG CALCULATOR = MTCO 2 E COST CALCULATOR = $24,500 (COST SAVINGS)

29

30
31 A VEHICLE MANUFACTURER CONVERTED HALF OF ITS VEHICLE FLEET TO USE BIODIESEL B100 INSTEAD OF DIESEL. THIS RESULTED IN SAVING 3,900 GALLONS OF DIESEL FUEL ANNUALLY. INPUT: GHG CALCULATOR DIESEL DIESEL FUEL REDUCED (GAL.) = 3,900 BIODIESEL BLEND = B100 BIODIESEL REDUCED (GAL.) = 3,900 COST CALCULATOR DIESEL FUEL REDUCED (GAL.) = 3,900 BIODIESEL REDUCED (GAL.) = 3,900 OUTPUT: GHG CALCULATOR (AGGREGATE TAB) = MTCO 2 E (IN EMISSION REDUCTIONS) COST CALCULATOR = $14, (REDUCTION IN DIESEL IS COST SAVINGS) $16, IN BIODIESEL COSTS = $1, IN ADDITIONAL COSTS

32

33

34
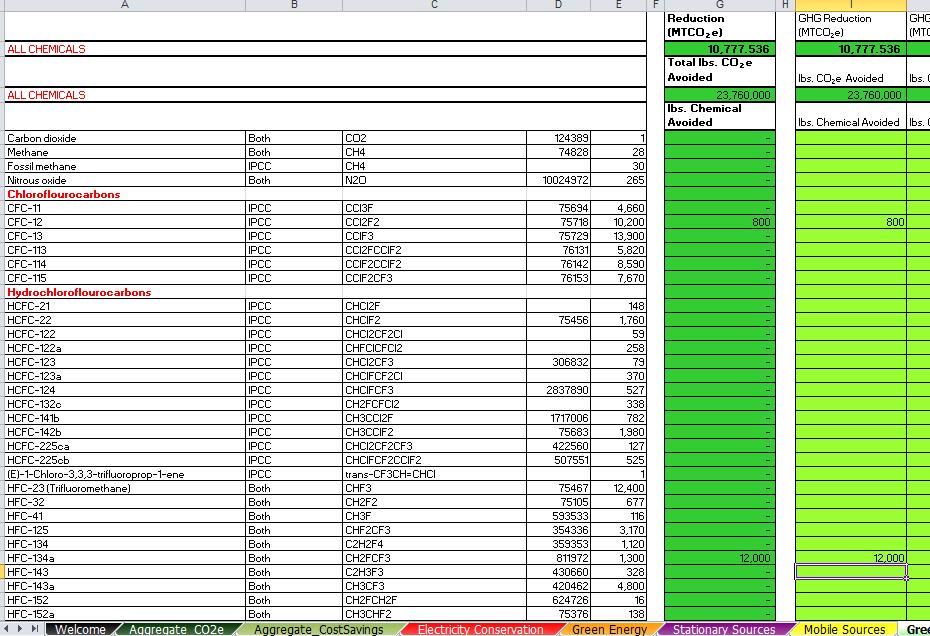
35 P2 GHG CALCULATOR: GREENING CHEMISTRY TAB MORE THAN 200 CHEMICALS IN THE CALCULATOR EMISSIONS OF GASES ARE TRANSLATED INTO CO 2 EQUIVALENTS USING GLOBAL WARMING POTENTIALS THE 100 YEAR GWP IS A MEASURE OF THE GLOBAL WARMING IMPACT OF A GAS, RELATIVE TO CO 2. NOTE: COST REDUCTIONS ASSOCIATED WITH THE REDUCTION OF SPECIFIC CHEMICALS HAS NOT BEEN INCORPORATED INTO THE P2 COST CALCULATOR.
36 THROUGH A COMBINATION OF REFRIGERANT TRACKING AND IMPROVED LEAK DETECTION, A MICHIGAN COMPANY SAVED 12,000 POUNDS OF HFC-134A. THEY ALSO REPLACED 800 POUNDS OF CFC- 12 WITH HFC-134A. INPUT: GHG CALCULATOR: GREENING CHEMISTRY TAB CFC-12 LBS. CHEMICAL AVOIDED = 800 HFC-134A LBS. CHEMICAL AVOIDED = 12,000 OUTPUT: GHG CALCULATOR (AGGREGATE TAB) = 10, MTCO 2 E (IN EMISSION REDUCTION)
37
38 THE SAME MICHIGAN COMPANY USED AN IMPROVED, SCALED-UP PROCESS FOR THE SYNTHESIS OF DARUNAVIR, A PHARMACEUTICAL INGREDIENT IN PREZISTA TM, BASED ON GREEN CHEMISTRY PRINCIPLES TO ELIMINATE 105 TONS OF METHYLENE CHLORIDE IN 2006, AMONG OTHER BENEFITS (INCLUDING AN 81% REDUCTION IN THE MANUFACTURING COST AND A 40% IN OVERALL YIELD). INPUT: GHG CALCULATOR: GREENING CHEMISTRY TAB METHYLENE CHLORIDE LBS. CHEMICAL AVOIDED = 210,000 (105 TONS) OUTPUT: GHG CALCULATOR (AGGREGATE TAB) = MTCO 2 E (IN EMISSION REDUCTION)

39
40 P2 GHG CALCULATOR: WATER CONSERVATION TAB WATER AND ENERGY CONSERVATION ARE LINKED THROUGH THE ENERGY THAT IT TAKES TO PUMP, TREAT, AND TRANSPORT WATER. THE CALCULATOR DOES NOT ACCOUNT FOR THE HEATING OF WATER; THIS IS CAPTURED IN THE ELECTRICITY TAB. THE CALCULATOR DOES NOT NEED TO ACCOUNT FOR ALTERNATIVE HEAT BECAUSE IT HAS THE SAME IMPACT OF COLD WATER. P2 COST CALCULATOR: WATER USE TAB CALCULATES SAVINGS FROM REDUCTIONS OF INCOMING RAW WATER (DOES NOT TAKE INTO ACCOUNT HEATING WATER, BUT MERELY THE AMOUNT OF WATER THAT COMES IN ORIGINALLY THROUGH A P2 ACTIVITY).
41 OUR MICHIGAN COMPANY IMPROVED COOLING TOWER EFFICIENCY IN THEIR FACILITY THROUGH THE INSTALLATION OF MAGNETIC PULSE TECHNOLOGY AND SAVED 30,000,000 GALLONS OF WATER. INPUT: GHG CALCULATOR WATER CONSERVATION TAB WATER CONSERVATION STATE OR US = MI NON-HEATED WATER REDUCED (GALLONS) = 30,000,000 COST CALCULATOR WATER USE TAB STATE OR US = MI GALLONS REDUCED = 30,000,000 OUTPUT: GHG CALCULATOR = MTCO 2 E (IN EMISSIONS REDUCTIONS) COST CALCULATOR = $69, (IN COST SAVINGS)

42

43
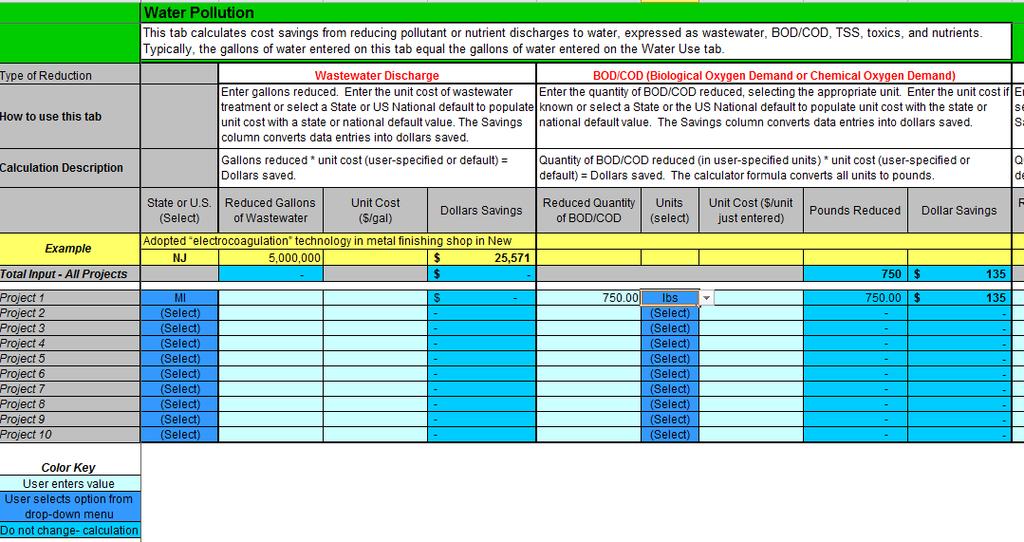
44 P2 COST CALCULATOR WATER POLLUTION TAB CALCULATES SAVINGS FROM REDUCED DISCHARGES OF WATER POLLUTANTS WASTE WATER INCLUDES CONTAMINANTS IN WATER AND STORM WATER DISCHARGED TO SEWER SYSTEMS, SEPTIC SYSTEMS, INJECTION WELLS, AND GROUND WATER WATER POLLUTANTS INCLUDE BIOCHEMICAL OXYGEN DEMAND (BOD), CHEMICAL OXYGEN DEMAND (COD), TOXICS, NUTRIENTS, TOTAL SUSPENDED SOLIDS (TSS) NOTE: GHG REDUCTION IS NOT APPLICABLE TO WATER POLLUTION, THEREFORE THIS ACTIVITY IS NOT REPRESENTED IN THE GHG CALCULATOR. SIMILARLY, OTHER ACTIVITIES NOT REPRESENTED IN THE GHG CALCULATOR INCLUDE HAZARDOUS AND NON- HAZARDOUS WASTE REDUCTION AND AIR POLLUTANTS (NO X, SO X, VOC S, PM 10, HAP S).
45 THROUGH THE IMPLEMENTATION OF A NEW FILTRATION SYSTEM IN OF ONE OF ITS PLANTS, OUR COMPANY REDUCED THE QUANTITY OF BIOLOGICAL OXYGEN DEMAND (BOD) AND CHEMICAL OXYGEN DEMAND (COD) DISCHARGED BY 750 POUNDS. INPUT: COST CALCULATOR: WATER POLLUTION TAB BOD/COD STATE OR US = MI QUANTITY REDUCED = 750 UNITS = LBS. OUTPUT: COST CALCULATOR = $135.00
46
47

48

49
50 ENGINEERING TOOL-KIT COMMON SOLVENTS FUELS AND OILS REFRIGERANTS HOUSEHOLD PAINTS METAL WORKING FLUIDS LIQUIDS
51 CALCULATING GREENHOUSE GAS EMISSIONS WITH THE WASTE REDUCTION MODEL
52 THE WASTE REDUCTION MODEL (WARM) WAS CREATED BY THE U.S. ENVIRONMENTAL PROTECTION AGENCY (EPA) TO ASSIST SOLID WASTE PLANNERS ESTIMATE GREENHOUSE GAS (GHG) EMISSION REDUCTIONS FROM SEVERAL DIFFERENT WASTE MANAGEMENT PRACTICES THERE ARE BOTH A WEB BASED CALCULATOR AND AN MICROSOFT EXCEL SPREADSHEET BOTH VERSIONS ARE AVAILABLE AT TOOLS-AND-CALCULATORS#CALC
53 WARM WAS DEVELOPED FOR SOLID WASTE MANAGERS WHO WANT TO CALCULATE THE GHG EMISSIONS ASSOCIATED WITH DIFFERENT WASTE MANAGEMENT OPTIONS WARM IS NOT A GHG INVENTORY TOOL
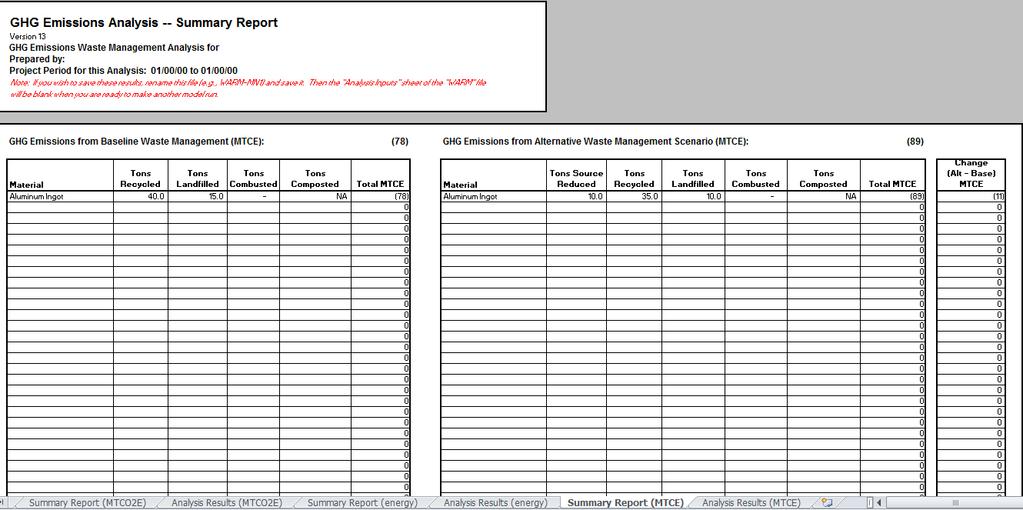
54 DATA IS GATHERED ON HOW MUCH WASTE IS MANAGED USING CURRENT PRACTICES TO GENERATE A BASELINE. AS ALTERNATE PRACTICES ARE CONSIDERED OR CURRENT PRACTICES ARE REVISED, THE WASTE REDUCTION MODEL RECALCULATES THE MTCO 2 E AND IS COMPARED AGAINST THE BASELINE DATA.
55 A MICHIGAN COMPANY IS CONSIDERING REVISING THEIR CURRENT PRACTICES FOR PROCESSING ALUMINUM INCLUDING IMPROVED EFFICIENCIES AND INCREASED RECYCLING. BASELINE: TONS RECYCLED = 40.0 TONS LANDFILLED = 15.0 PROPOSED:TONS SOURCE REDUCTION = 10.0 TONS RECYCLED = 35.0 TONS LANDFILLED = 10.0 NOTE: TONS PROCESSED IN BASELINE MUST EQUAL TONS PROCESSED IN PROPOSED REVISION.

56 ANALYSIS INPUT SCREEN:
57
58

59
60

61
62
63
64
65 www2.epa.gov/p2/pollution-prevention-tools-and-calculators Questions Dan Lucas, P.E.
Overview of Pollution Prevention (P2) GHG & Cost Calculators
 GHG & Cost Calculators") Overview of Pollution Prevention (P2) GHG & Cost Calculators Training Module: 2014 Natalie Hummel and Kathy Davey Office of Chemical Safety and Pollution Prevention Pollution Prevention Division Hummel.Natalie@epa.gov
Overview of Pollution Prevention (P2) GHG & Cost Calculators Training Module: 2014 Natalie Hummel and Kathy Davey Office of Chemical Safety and Pollution Prevention Pollution Prevention Division Hummel.Natalie@epa.gov
Overview of Pollution Prevention (P2) GHG-Cost and Hazardous Materials Calculators
 GHG-Cost and Hazardous Materials Calculators") Overview of Pollution Prevention (P2) GHG-Cost and Hazardous Materials Calculators Training Module: 2010 Natalie Hummel/Kathy Davey Office of Chemical Safety and Pollution Prevention Pollution Prevention
Overview of Pollution Prevention (P2) GHG-Cost and Hazardous Materials Calculators Training Module: 2010 Natalie Hummel/Kathy Davey Office of Chemical Safety and Pollution Prevention Pollution Prevention
Overview of Pollution Prevention (P2) GHG-Cost and Hazardous Materials Calculators
 GHG-Cost and Hazardous Materials Calculators") Overview of Pollution Prevention (P2) GHG-Cost and Hazardous Materials Calculators Training Module: 2011 Natalie Hummel/Kathy Davey Office of Chemical Safety and Pollution Prevention Pollution Prevention
Overview of Pollution Prevention (P2) GHG-Cost and Hazardous Materials Calculators Training Module: 2011 Natalie Hummel/Kathy Davey Office of Chemical Safety and Pollution Prevention Pollution Prevention
Step by Step Instructions for the Using Sustainable Jersey Spreadsheet Tool to Calculate a Municipal Carbon Footprint
 Step by Step Instructions for the Using Sustainable Jersey Spreadsheet Tool to Calculate a Municipal Carbon Footprint Inventory methods that municipalities can use to calculate their municipal carbon footprint
Overview of Pollution Prevention (P2) GHG Calculator Training Module: April 2010
 GHG Calculator Training Module: April 2010") Overview of Pollution Prevention (P2) GHG Calculator Training Module: April 2010 Natalie Hummel Kathy Davey Charles Bevington Office of Pollution Prevention and Toxics (OPPT) Pollution Prevention Division
Overview of Pollution Prevention (P2) GHG Calculator Training Module: April 2010 Natalie Hummel Kathy Davey Charles Bevington Office of Pollution Prevention and Toxics (OPPT) Pollution Prevention Division
PARK CITY MUNICIPAL CORPORATION 1990 & 2007 CARBON INVENTORY BASELINE ASSESSMENT
 EXECUTIVE SUMMARY C6 PARK CITY MUNICIPAL CORPORATION 1990 & 2007 CARBON INVENTORY BASELINE ASSESSMENT Executive Summary Park City Municipal Corporation 1990 & 2007 Carbon Inventory Baseline Assessment*
Clark University Greenhouse Gas Emissions Update: Clark University on Track for Emissions and Carbon Neutrality Goals.
 Clark University Greenhouse Gas Emissions Update: 2013 Clark University on Track for Emissions and Carbon Neutrality Goals Background In June 2007 President Bassett signed the American College and University
Data and Units Required for the Climate Smart GHG Management Tool
 page 1/6 Data and Units Required for the Climate Smart GHG Management Tool Table of Contents Introduction... 1 Note on Unit Conversions... 1 1. Electricity & Heat... 2 2. Transportation People... 2 Road
Table TSD-A.1 Source categories included under Section 202 Section 202 Source IPCC Sector IPCC Source Category Greenhouse Gases
 Technical Support Document Section 202 Greenhouse Gas Emissions Roadmap to Annex This Annex describes greenhouse gas emissions information from Section 202 source categories. The Annex provides an overview
GREENHOUSE GAS INVENTORY FY 2015 UPDATE
 GREENHOUSE GAS INVENTORY FY 2015 UPDATE OVERVIEW Temple University (Temple) has prepared a greenhouse gas (GHG) inventory program in support of its participation in Second Nature s Climate Commitment.
Allergan s Approach to GHG Emissions Reductions
 Allergan s Approach to GHG Emissions Reductions Michael B. Whaley, Tom Quinn, Clare Elser Allergan, Inc., 2525 Dupont Drive, P. O. Box 19534, Irvine, CA 92623-9534 ABSTRACT Allergan, Inc. has developed
2015 GHG Emissions Report
 INTREN, Inc. 2015 GHG Emissions Report Kiwanda Evans September 1, 2016 Table of Contents Abstract... 2 Program Overview... 3 GHG Emission Charts... 1 2015 Greenhouse Gas Emissions Results & Summary...
Tulane University 2013 & 2014 Greenhouse Gas Emissions Inventory
 Tulane University 2013 & 2014 Greenhouse Gas Emissions Inventory Introduction As the urgency of climate change increases, it is crucial that major institutions take responsibility for their contribution
Clark University Greenhouse Gas Emissions Update: Clark University on Track for Carbon Reduction and Carbon Neutrality Goals.
 Clark University Greenhouse Gas Emissions Update: 2012 Clark University on Track for Carbon Reduction and Carbon Neutrality Goals Background In June 2007 President Bassett signed the American College and
2016 GHG Emissions Report
 INTREN, Inc. 2016 GHG Report Kiwanda Evans August 18, 2017 1 Table of Contents Abstract... 3 Program Overview & GHG Results... 4 Fuel Use Scope 1 Emission... 5 Purchased Electricity Scope 2 Emission...
Greenhouse Gas Assessment / EYP Architecture and Engineering P.C.
 Greenhouse Gas Assessment 2009-2010 / EYP Architecture and Engineering P.C. a project of the EYP Planet program Content Prepared By: The Green Roundtable 38 Chauncy Street Boston, MA 02111 / EYP Architecture
Sustainability: The Next Step Estimating the University of Wisconsin Green Bay s Carbon Footprint
 Sustainability: The Next Step Estimating the University of Wisconsin Green Bay s Carbon Footprint Chapter 1 Scope 1 Direct sources of GHG emissions from sources that are owned or controlled by the university
U.S. Emissions
 PSEG Voluntary Greenhouse Gas Emissions Inventory 2000 2006 U.S. Emissions Public Service Enterprise Group (PSEG) 80 Park Plaza Newark, NJ 07102 www.pseg.com October 2007-1- Printed on Recycled Paper Table
Clark University Greenhouse Gas Emissions Update: Clark University Still on Track for Emissions and Carbon Neutrality Interim Goal.
 Clark University Greenhouse Gas Emissions Update: 2014 Clark University Still on Track for Emissions and Carbon Neutrality Interim Goal Background In June 2007 President Bassett signed the American College
Lake George Climate Action Plan Project Public Workshop, November 8 th, Jim Yienger, Climate Action Associates LLC
 Lake George Climate Action Plan Project Public Workshop, November 8 th, 2017 Jim Yienger, Climate Action Associates LLC Project Goal and Timeline Joint Project of Town and Village Climate Action Plan (9
Fast Facts. U.S. Transportation Sector Greenhouse Gas Emissions
 U.S. Transportation Sector Greenhouse Gas Emissions 1990-2014 Office of Transportation and Air Quality EPA-420-F-16-020 June 2016 Transportation Emissions of the United States The transportation sector
Davidson College Climate Action Planning Process Greenhouse Gas Emissions Primer
 Davidson College Climate Action Planning Process Greenhouse Gas Emissions Primer Greenhouse Gases What are greenhouse gases? Greenhouse gases are a group of gases present in the atmosphere both naturally
BOULDER COUNTY S 2016 GREENHOUSE GAS EMISSIONS INVENTORY AND MODELING REPORT
 BOULDER COUNTY S 2016 GREENHOUSE GAS EMISSIONS INVENTORY AND MODELING REPORT June 2018 [Page was intentionally left blank] TABLE OF CONTENTS EXECUTIVE SUMMARY... 1 KEY FINDINGS FROM 2016 INVENTORY... 1
Completing a Municipal Carbon Footprint requires an accounting-like inventory of all the sources of GHG in your buildings, fleet, and operations.
 Municipal Carbon Footprint For more information, see www.sustainablejersey.com A Municipal Carbon Footprint measures the amount of greenhouse gas (GHG) emissions produced by local government operations
APPENDIX B: CITY OF RED LODGE BASELINE INVENTORY
 APPENDIX B: CITY OF RED LODGE BASELINE INVENTORY CITY OF RED LODGE BASELINE ASSESSMENT October 2017 An Energy Use, Cost & Greenhouse Gas Emissions Inventory of City Government Operations Kathryn Eklund
2017 VINEYARD CUP EMISSIONS FOOTPRINT REPORT
 2017 VINEYARD CUP EMISSIONS FOOTPRINT REPORT Sail Martha s Vineyard is an organization committed to operating in an environmentally responsible manner. As a regatta, the Vineyard Cup supports LOCALLY Sourced
GREENHOUSE GAS INVENTORY FY 2016 UPDATE
 GREENHOUSE GAS INVENTORY FY 2016 UPDATE OVERVIEW Temple University (Temple) has prepared a greenhouse gas (GHG) inventory program in support of its participation in Second Nature s Climate Commitment.
Greenhouse Gas Emissions Inventory FY 11
 Summary Greenhouse Gas Emissions Inventory FY 11 The Fiscal Year 2011 Greenhouse Gas Inventory details greenhouse gasses (GHG) emitted by Hobart and William Smith Colleges (HWS) during the 2011 fiscal
Sustaining Our Operation in a Changing World. Michael Younis October
 Sustaining Our Operation in a Changing World Michael Younis October 16 2008 Business Case Energy Consumption Cook Clean Refrigerate Cost Escalation 2 nd largest conversion cost 5.5% CAGR Environmental
NORTHERN VIRGINIA COMMUNITY COLLEGE GREENHOUSE GAS INVENTORY JULY 2011-JUNE 2016
 NORTHERN VIRGINIA COMMUNITY COLLEGE GREENHOUSE GAS INVENTORY JULY 2011-JUNE 2016 Publication date: November 2018 Table of Contents EXECUTIVE SUMMARY... 1 INTRODUCTION AND METHODS... 2 FINDINGS... 3 DATA
ENVIRONMENTAL FOOTPRINT 2O16
 ENVIRONMENTAL FOOTPRINT REPORT 2O16 WHAT WE CARE ABOUT AND WHY...3 ENERGY AND AIR EMISSIONS...5 FLEET...5 REFRIGERATION...6 GHG EMISSIONS...6 TOTAL ENERGY USE...7 WATER...8 WASTE...9 LANDFILL DIVERSION...9
Climate Wise Data collection Reporting :: tracking :: benchmarking
 Climate Wise Data collection Reporting :: tracking :: benchmarking Seth Jansen, The Brendle Group sjansen@brendlegroup.com 207.0058 John Armstrong, City of Fort Collins jarmstrong@fcgov.com 416.2230 Data
City of Tacoma Community and Municipal Greenhouse Gas Emissions Inventory
 City of Tacoma Community and Municipal Greenhouse Gas Emissions Inventory 2012 12/18/13 Table of Contents List of Figures and Tables ii Overview 3 Methodology 5 Emissions from Municipal Operations 7 Incorporating
Carbon Management 101
 Carbon Management 101 West Michigan Sustainable Business Forum January 12, 2009 Clinton S. Boyd, PHD Sustainable Research Group Decarbonization The systematic reduction of the carbon intensity* of emissions
GHG EMISSIONS INVENTORY AT USU
 GHG EMISSIONS INVENTORY AT USU To assess the impact an organization imposes on the climate, a thorough evaluation of its carbon footprint is necessary. A greenhouse gas (GHG) emissions inventory identifies,
GHG Inventory. Executive Summary
 2007 08 GHG Inventory Executive Summary This report is the first annual update to the Macalester College Greenhouse Gas Emissions Audit conducted by the Environmental Studies Senior Seminar in Spring 2008.
Sustainability Data and Trends Report
 2017 Sustainability Data and Trends Report 1 INTRODUCTION This report provides data and supporting information on Genentech s company-wide sustainability performance trends, including greenhouse gas emissions
Greenhouse Gas Emissions
 Greenhouse Gas Emissions Table GHG-1 Summary of Annual GHG Emissions Construction Emissions Operational Direct Emissions Operational Indirect Emissions Fugitive Emissions Total Total Amortized* Motor Area
2017 Data Factsheet: Environmental Indicators
 2017 Data Factsheet: Environmental Indicators As part of Microsoft s commitment to disclose information about our environmental footprint, below is a compilation of environmental indicators including our
EUGENE WATER & ELECTRIC BOARD 2015 OPERATIONAL GREENHOUSE GAS INVENTORY
 EUGENE WATER & ELECTRIC BOARD 2015 OPERATIONAL GREENHOUSE GAS INVENTORY TABLE OF CONTENTS EXECUTIVE SUMMARY.... P. 4 OVERVIEW....... P. 4 2015 OPERATIONS INVENTORY............... P. 8 TREND IN OPERATIONS
Terrie Boguski Harmony Environmental, LLC Kansas State University. January 2010
 Terrie Boguski Harmony Environmental, LLC Kansas State University January 2010 What are Greenhouse Gases? Gases that allow sunlight to enter the atmosphere freely. When sunlight strikes the Earth s surface,
Baseline Carbon Footprint
 Baseline Carbon Footprint June 2008 Temporal Boundary June 2007 thru May 2008 Prepared by The Loyalton Group A Sodexo Education Partner Contents 1. Cover 2. Contents 3. Basic Terminology 4. Strategic Focus
Fast Facts. U.S. Transportation Sector Greenhouse Gas Emissions
 U.S. Sector Greenhouse Gas Emissions 1990-2011 Office of and Air Quality EPA-420-F-13-033a September 2013 Emissions of the United States The transportation end-use sector 1 is one of the largest contributors
SAINT JOHN S UNIVERSITY COLLEGEVILLE, MN GREENHOUSE GAS EMISSIONS INVENTORY REPORT
 SAINT JOHN S UNIVERSITY COLLEGEVILLE, MN GREENHOUSE GAS EMISSIONS INVENTORY REPORT 2009-2010 REPORT ISSUE DATE: JANUARY 2010 EXECUTIVE SUMMARY The Office of Sustainability at Saint John s University (SJU)
Arizona Department of Environmental Quality Pollution Prevention (P2) Program
 Program") Arizona Department of Environmental Quality Pollution Prevention (P2) Program April 8, 2015 Presentation Outline Arizona P2 Policy P2 program thresholds Review of P2 Plan sections P2 Plan maintenance P2
Arizona Department of Environmental Quality Pollution Prevention (P2) Program April 8, 2015 Presentation Outline Arizona P2 Policy P2 program thresholds Review of P2 Plan sections P2 Plan maintenance P2
IBM TRIRIGA Version 10 Release 3.1. Real Estate Environmental Sustainability User Guide
 IBM TRIRIGA Version 10 Release 3.1 Real Estate Environmental Sustainability User Guide Note Before using this information and the product it supports, read the information in Notices on page 39. This edition
City of Pasadena Greenhouse Gas Emissions Inventory
 City of Pasadena Greenhouse Gas Emissions Inventory November 013 Photo Credits Left:Rincon Consultants, Inc. U. Right: Rincon Consultants, Inc. L. Right: http://www.placesonline.com/north_america/united_states/california/pasadena/photo_detail.asp?filename=849_the_rose_bowl_stadium_pasadena
Public Outreach & Education
 Environmental Review Educational Sessions Chevron Revised Renewal Project Greenhouse Gas (GHG) Emissions and Accounting 101 Monday July 25, 2011 6 pm to 8 pm Public Outreach & Education 2 1 Public Outreach
Greenhouse Gas Emission Factors Info Sheet
 Greenhouse Gas Emission Factors Info Sheet Are you putting together a greenhouse gas (GHG) inventory or climate action plan for a business, city, or county? Do you want to estimate the GHG savings associated
Clean Air and Climate Protection Software Overview
 STAPPA/ALAPCO Clean Air and Climate Protection Software Overview * * * On-Line Training Session* * * October 5, 2005 Jim Yienger and Ryan Bell ICLEI CCP The Cities for Climate Protection Campaign CCP is
All images courtesy U.S. Navy
 All images courtesy U.S. Navy Environmental Footprint Impacts to environmental media and society resulting from an action We are focusing on footprint of soil, sediment, and groundwater remedies Think
2016 SUSTAINABILITY DATA AND TRENDS REPORT
 216 SUSTAINABILITY DATA AND TRENDS REPORT 1. Table of Contents This document presents Genentech s company-wide environmental sustainability data and -216 performance trends. p. 2 5 p. 6 p. 7 11 Section
Greenhouse Gases How to track and set reduction goals using the CW Baseline Tool
 Greenhouse Gases How to track and set reduction goals using the CW Baseline Tool Matt Gibbs Environmental Planner ClimateWise May 6, 2013 Agenda Introductions Importance of GHG emissions What are GHGs
QUEEN S UNIVERSITY GREENHOUSE GAS EMISSIONS INVENTORY SUMMARY 2015
 QUEEN S UNIVERSITY GREENHOUSE GAS EMISSIONS INVENTORY SUMMARY 2015 INTRODUCTION In 2010, Queen s University signed onto the University and College Presidents Climate Change Statement of Action for Canada,
GHG. Richey Student Researcherr. Steven. For
 Illinois State University 100 North University Street Normal, IL 61761-4402 2010 ISU ACUPCC GHG G Inventory Prepared by: Steven Richey Student Researcherr Major: Renewable Energy spriche@ilstu.edu Supervised
STONE AGE PACKAGING INC. 666 Burrard St, Suite 500, Vancouver, BC. V6C3P6
 STONE AGE PACKAGING INC. 666 Burrard St, Suite 500, Vancouver, BC. V6C3P6 Tel: + 1800-361-1317 Fax: +1866-457-1632 www.stoneagepack.com sales@stoneagepack.com Material Production (MT) ENVIRONMENTAL COMPARISON
WASTEWATER PROBLEMS ASSOCIATED WITH SOLVENTS
 WASTEWATER PROBLEMS ASSOCIATED WITH SOLVENTS James L. Walsh, Jr., P.E. Senior Research Engineer Georgia Tech Research Institute Atlanta, Georgia 30332 Introduction There a number of advantages to elimination
SUSTAINABLE CLEVELAND MUNICIPAL ACTION PLAN EXECUTIVE SUMMARY
 SUSTAINABLE CLEVELAND MUNICIPAL ACTION PLAN EXECUTIVE SUMMARY October 2013 1 I SUSTAINABLE CLEVELAND MUNICIPAL ACTION PLAN EXECUTIVE SUMMARY Sustainable Cleveland 2019 is an initiative that engages the
Clark University on Track for Carbon Reduction and Carbon Neutrality Goals
 Clark University Greenhouse Gas Emissions Update: 2010 Clark University on Track for Carbon Reduction and Carbon Neutrality Goals Background In June 2007 President Bassett signed the American College and
Appendix D: Carbon Model
 Appendix D: Carbon Model Carbon Model Dave Erickson, Climate Protection Campaign, September 2009 The Carbon Model is a mathematical representation of all of the significant sources of direct and indirect
Climate Friendly Parks Program
 Climate Friendly Parks Program Climate Leadership in National Parks Inventorying Greenhouse Gas Emissions in the National Park Service Julie Thomas McNamee May 14 th, 2008 CFP Program Overview The Climate
Overview of the Small Can Automotive Refrigerants Regulation Used Oil/HHW Training & Conference Sacramento Convention Center November 3, 2016
 Overview of the Small Can Automotive Refrigerants Regulation 2016 Used Oil/HHW Training & Conference Sacramento Convention Center November 3, 2016 Overall ARB Program for Automotive Refrigerants Program
Myths or Distractions Is the Global Climate Changing? g Does Man play a significant part in Global Warming? Are CO2 emissions the proper measuring sti
 Greenhouse Gas Emissions i Inventory Development FPA Environmental Summit Bobby Cullom January 2009 Myths or Distractions Is the Global Climate Changing? g Does Man play a significant part in Global Warming?
GREENHOUSE GAS EMISSIONS INVENTORY FOR THE UNIVERSITY OF WYOMING Fiscal Year 2015
 GREENHOUSE GAS EMISSIONS INVENTORY FOR THE UNIVERSITY OF WYOMING Fiscal Year 2015 By Jay Quintanilla For The Campus Sustainability Committee of the University of Wyoming And The American College and University
ONONDAGA COUNTY CLIMATE ACTION PLAN UPDATE REPORT FOR
 ONONDAGA COUNTY CLIMATE ACTION PLAN UPDATE REPORT FOR 2014-15 CLIMATE ACTION PLAN GHG EMISSIONS 2014-15 SUMMARY REPORT June 1, 2016 In April of 2012 Onondaga County finalized its Climate Action Plan (CAP)
Overview of GHG Inventory Management & Reporting. Alex Carr, Director of Special Projects Ryan Cassutt, Program Associate
 Overview of GHG Inventory Management & Reporting Alex Carr, Director of Special Projects Ryan Cassutt, Program Associate April 24, 2018 Agenda Introduction to TCR Overview of GHG accounting Benefits of
The Energy and Carbon Footprint of Water Reclamation and Water Management in Greater Chicago
 METROPOLITAN WATER RECLAMATION DISTRICT OF GREATER CHICAGO The Energy and Carbon Footprint of Water Reclamation and Water Management in Greater Chicago Joseph Kozak, PhD, PE Catherine O Connor, O PhD,
CLIMATE ACTON PLANNING & MITIGATION: Base Year 2016 Greenhouse Gas Inventory Results
 CLIMATE ACTON PLANNING & MITIGATION: Base Year 2016 Greenhouse Gas Inventory Results Taking Action on Climate Change The City of St. Petersburg is taking bold action to reduce its contributions to global
Greenhouse Gas Inventory University of North Carolina at Wilmington
 Greenhouse Gas Inventory University of North Carolina at Wilmington August 2017 Acknowledgements This report was prepared by graduate student Daniel Pate with the help of methodologies developed by The
GREENHOUSE GAS EMISSIONS INVENTORY FOR THE UNIVERSITY OF WYOMING: Fiscal Year 2014
 GREENHOUSE GAS EMISSIONS INVENTORY FOR THE UNIVERSITY OF WYOMING: Fiscal Year 2014 by Julia Scott For The Campus Sustainability Committee of the University of Wyoming And The American College and University
GREENHOUSE GAS EMISSIONS INVENTORY FOR THE UNIVERSITY OF WYOMING: Fiscal Year 2013
 GREENHOUSE GAS EMISSIONS INVENTORY FOR THE UNIVERSITY OF WYOMING: Fiscal Year 2013 by Divantha Ekanayake For The Campus Sustainability Committee of the University of Wyoming And The American College and
CITY OF ROCHESTER COUNCIL AGENDA Room 104, City Hall 201 Fourth Street SE
 CITY OF ROCHESTER COUNCIL AGENDA Room 104, City Hall 201 Fourth Street SE Committee of The Whole 03:30 PM COMMITTEE OF THE WHOLE MEETING ITEMS 1 Energy Action Plan Update (attachment) Presentation 2 Parks
City of Edmonds CY 2017 Greenhouse Gas Inventory 1
 Prepared by Good Company December 2018 City of Edmonds CY 2017 Greenhouse Gas Inventory 1 TABLE OF CONTENTS I. EXECUTIVE SUMMARY... 3 II. INTRODUCTION... 8 III. INVENTORY BOUNDARIES... 9 IV. INVENTORY
Aircraft Deicing Fluid Recovery System
 Aircraft Deicing Fluid Recovery System Presentation to: Airports Going Green Conference - 2012 Presented by: William E. Dempsey Sr. Director Airport Environmental Services Discussion Topics ThermoEnergy
Introduction to Greenhouse Gas Accounting
 Introduction to Greenhouse Gas Accounting New to GHG accounting? Start here. 1. Setting Boundaries 2. Keeping a Collection Journal 3. Collecting Data a. Institutional Data b. What are Scopes? c. Scope
City of Baltimore Greenhouse Gas Emissions Analysis Community Emissions Inventory & 2007 Government Operations Emissions Inventory
 City of Baltimore Greenhouse Gas Emissions Analysis 2007 Community Emissions Inventory & 2007 Government Operations Emissions Inventory October 7, 2009 Credits and Acknowledgements City of Baltimore Office
2007 UW-Stevens Point Greenhouse Gas Inventory
 Summary of Approach and Findings for the 2007 University of Wisconsin-Stevens Point Greenhouse Gas Inventory 2007 UW-Stevens Point Greenhouse Gas Inventory Submitted by the University of Wisconsin- Stevens
The Lynn University Carbon Footprint and Analysis. Baseline Report. December, Prepared by Frank Lucas and Alex Keller
 1 The Lynn University Carbon Footprint and Analysis Baseline Report December, 17 2012 Prepared by Frank Lucas and Alex Keller 2 Table of Contents I. Executive Summary 3 II. Introduction 7 III. Methods
DuPage County Energy & Emissions Profile
 DuPage County Energy & Emissions Profile Prepared for: DuPage County Green Government Council Joy Hinz, Environmental Specialist Submitted by: CNT Energy and the Center for Neighborhood Technology November
9/20/2017 FROM TRASH TO GAS EQUALS CASH
 FROM TRASH TO GAS EQUALS CASH ALTERNATIVE FUELS AS A SOURCE OF STATE REVENUES Kerryn de Verteuil &Tim Nehring APC Committee 1 2 From Trash to Gas Equals Cash Goals of Presentation Fossil Fuels A Diminishing
GHG Inventory Report February 2018 KENT COUNTY REGIONAL RESOURCE RECOVERY FACILITY 2017 GREENHOUSE GAS (GHG) EMISSION INVENTORY
 EMISSION INVENTORY") KENT COUNTY REGIONAL RESOURCE RECOVERY FACILITY 2017 GREENHOUSE GAS (GHG) EMISSION INVENTORY FEBRUARY 2018 1 INTRODUCTION Greenhouse gases (GHG) are believed to contribute to the global warming phenomenon
KENT COUNTY REGIONAL RESOURCE RECOVERY FACILITY 2017 GREENHOUSE GAS (GHG) EMISSION INVENTORY FEBRUARY 2018 1 INTRODUCTION Greenhouse gases (GHG) are believed to contribute to the global warming phenomenon
Washtenaw Community College Greenhouse Gas Inventory
 2014 Washtenaw Community College Greenhouse Gas Inventory Prepared by: Dale Petty Executive Summary This report on the greenhouse gas emissions of Washtenaw Community College has been prepared in support
CHAPTER 2. Greenhouse Gas Emission Inventories, Forecasts, and Targets
 CHAPTER 2 Greenhouse Gas Emission Inventories, Forecasts, and Targets CLIMATE ACTION PLAN GHG EMISSION INVENTORIES, FORECASTS, AND TARGETS CHAPTER 2 2.1 INTRODUCTION This chapter summarizes our community
CARBON FOOTPRINT 2015 Vieira de Almeida & Associados
 CARBON FOOTPRINT 2015 Vieira de Almeida & Associados March 2016 CONTENTS Index Executive Summary 03 About VdA s Green Project and Carbon Footprint 05 About this report This report presents Vieira de Almeida
included Included in FTSE4Good Index Carbon emissions (CO 2 Carbon Disclosure Project performance band FTSE Russell/JSE Responsible Investment Index
 ENVIRONMENT Carbon emissions (CO 2 ) 117 176 metric 2017: 118 434 metric tonnes tonnes 2016: 114 044 metric tonnes Carbon Disclosure Project performance band A- 2017: A- 2016: A- FTSE Russell/JSE Responsible
Sustainable Manufacturing
 Sustainable Manufacturing A Comprehensive Strategy Sabine Klages-Buechner Manager, International Government Affairs OECD Workshop, Copenhagen, Denmark June 21, 2007 2 DuPont in 1802 DuPont in 2006 100
Appendix C: Greenhouse Gas Reduction Calculations
 San Rafael Climate Change Action Plan C-1 Appendix C: Greenhouse Gas Reduction Calculations This document provides a summary of the calculations of potential greenhouse gas emission reductions resulting
Calculating Mode Shift and Congestion Relief-Related Greenhouse Gas Displacement For the Current Year (see last slide for contact information)
") Calculating Mode Shift and Congestion Relief-Related Greenhouse Gas Displacement For the Current Year (see last slide for contact information) 1 Step 1: Estimate Reductions in Annual Auto Vehicles Miles
Calculating Mode Shift and Congestion Relief-Related Greenhouse Gas Displacement For the Current Year (see last slide for contact information) 1 Step 1: Estimate Reductions in Annual Auto Vehicles Miles
UH Carbon Footprint Katrina Wamble -Sustainability Task Force
 UH Carbon Footprint 2010 -Katrina Wamble -Sustainability Task Force 21 February 2011 Approach http://www.cleanair-coolplanet.org/toolkit/inv-calculator.php v. 6.3 Copyright Clean Air - Cool Planet, 2008
Report of Independent Accountants
 To the Board of Directors of Ball Corporation, Report of Independent Accountants We have reviewed management s assertion, included in the accompanying Appendix A, Management Assertion, that the selected
8. Greenhouse Gas Emissions
 8. Greenhouse Gas Emissions This section provides a summary of the greenhouse gas assessment undertaken, and the potential impacts identified, in regards to the Project (Mine) during construction and operation.
Making Waste Productive. Creating Energy from Waste
 Making Waste Productive Creating Energy from Waste 1 Creating Energy Inputs from Current Waste Outputs Organic material (waste) can be converted into energy (methane) through a process called anaerobic
Fonterra Sustainability Report Environmental Data Reporting Notes
 Fonterra Sustainability Report 2017 - Environmental Data Reporting Notes Introduction This document is a supplement to our Sustainability Report 2017 published to provide additional supporting information
Ten years and moving forward... Inventory of Greenhouse Gas Emissions University of Missouri St. Louis. Commitment to Climate Action
 Inventory of Greenhouse Gas Emissions 2002-2012 University of Missouri St. Louis Commitment to Climate Action The University of Missouri St. Louis signed the American College and University President s
Are You Meeting the Kyoto Protocol Calculating Your Carbon Dioxide Footprint
 Are You Meeting the Kyoto Protocol Calculating Your Carbon Dioxide Footprint Experiment 14 OBJECTIVE Students will calculate their yearly CO 2 emissions and compare their results with the amounts listed
U.S. Environmental Protection Agency
 Spreadsheets for Environmental Footprint Analysis (SEFA) Tutorial Exercises U.S. Environmental Protection Agency Office of Superfund Remediation and Technology Innovation and Region 9 Land Division Prepared
The Coca-Cola Company s Carbon Accounting Manual. Operational Boundary
 The Coca-Cola Company s Carbon Accounting Manual Operational Boundary The Coca-Cola global business system is composed of The Coca-Cola Company (TCCC) and nearly 275 bottling partners. TCCC manufactures
prepared by the 1913 North Broad Street Philadelphia, PA Office of Sustainability 04 May 2011
 TEMPLE UNIVERSITY GREENHOUSE GAS INVENTORY PROGRAM F ISCAL Y EAR 2010 UPDATE prepared by the Office of Sustainability 1913 North Broad Street Philadelphia, PA www.temple.edu/sustainability 04 May 2011
Carbon Footprint and Project Register Training
 Carbon Footprint and Project Register Training Craig Dun, Chris Asensio, Clare Wharmby Agenda Agenda Introduction to SSN and housekeeping 10.30 10.35 Introduction to workshop, CFPR tool and identification