WATER SHORTAGE MITIGATION PLAN APRIL 17, Go Back
|
|
|
- Reginald Mitchell
- 5 years ago
- Views:
Transcription


1 WATER SHORTAGE MITIGATION PLAN APRIL 17, 2017
2 WATER SHORTAGE MITIGATION PLAN Table of Contents Section 1.0 Introduction Background Description of Revisions to Tampa Bay Water s Water Shortage 2 Mitigation Plan 1.3 Goals and Objectives of the WSMP for Tampa Bay Water The WSMP Technical Advisory Committee 3 Section 2.0 Hydrologic and Water Shortage Triggers and Stages Hydrologic and Supply Shortage Trigger Identification Determining Entry and Exit Conditions for 8 Water Shortage Phases WSMP Decision Procedures Consistency with District Declarations 9 Section 3.0 Demand and Supply Management Actions WSMP Demand Management Actions Phase I: Drought Alert 14 (40D Moderate Water Shortage) Phase II: Drought Warning 14 (40D Severe Water Shortage) Phase III: Regional Supply Shortage 14 (40D Extreme Water Shortage) Phase IV: Water Supply Crisis 14 (40D Critical Water Shortage) 3.2 WSMP Supply Management Actions WSMP Recovery Actions 16
3 Section 4.0 Communication Plan Communication Goals and Objectives WSMP Triggers and Actions Key Stakeholder Communication WSMP Key Stakeholders Primary Contacts for Tampa Bay Water 22 Member Governments and District Tampa Bay Water and Member 22 Government Communication Tampa Bay Water and District 23 Communication Member Government and District 23 Communication Public Official and Internal 23 Communication 4.4 Public Outreach and Education Key Messages and Delivery Methods Media Strategy Develop/Update Key Messages Coordinate Uniform Outreach to 25 the Media and Public Plan, Develop and Implement 25 Communication Tactics District Required Communication Communication Timing Establishing a Budget for Public 26 Outreach and Education
4 Section 5.0 WSMP Implementation Implementing Water Shortage Actions Implementation of Demand and Supply 29 Management Activities Tampa Bay Water Actions Member Government Actions Planned Revisions 30 WSMP Appendices Appendix A: Modeling and Analyses of Regional 31 Water Shortage Mitigation Plan Tables Table 1.1 WSMP TAC Members and Other Participative Staff 4 Table 2.1 Summary of WSMP Water Shortage Stages 8 Table 3.1 Summary of WSMP Stages, Triggers and Actions 12 Table A-1 Different Indicators for on and off triggers for 50 distinct water shortage stages Table A-2 Water accounts and water demand- five levels of 59 household income in six member governments of TBW Table A-3 Summary of Mitigation Scenarios 74 Table A-4 Summary statistics for median recovery time and median 82 water level change between pre- and post-over-production event conditions. Table A-5 RCD-rainfall, RMD-flow and simulate water shortage (WS) 92 Stages during water year Figures Figure 2.1 WSMP Decision Flow Chart 10
5 Figure 4.1 WSMP Communications Structure 19 Figure 4.2 Tampa Bay Water Public Communication Effort 22 Determination Figure 5.1 WSMP Implementation Procedure 28 Figure A-1 Tampa Bay Water Enhanced 32 Surface Water System (ESWS) Figure A-2 Modeling framework incorporating flow and demand 39 uncertainty in running RPEM Figure A-3 Modeling framework for environmental impact 41 Analysis Figure A-4 Rainfall stations used in calculating RCD-rainfall 43 Figure A-5 An illustrative example of forecasted 46 reservoir level for the next three months Figure A-6 Seasonal-varying reservoir target level 48 Figure A-7 Single family accounts and water use 51 for the study period Figure A-8 Water shortage stage declared by Tampa Bay Water 53 (WY ); and water restrictions enacted by District for same time period Figure A-9 Correlation between water use and variable of interest 54 Figure A-10 Normalized water use and box plots for 55 watering days/sf accounts Figure A-11 Water accounts w/wo reclaimed in TBW service area 57 Figure A-12 Seasonality of water use- reclaimed v. restrictions 58 Figure A-13 Monthly water use/account v. income levels 60
6 Figure A-14 Simulated water shortage stages w/wo mitigation 65 Figure A-15 Alafia River withdrawal w/wo mitigation v. 66 Stages of water shortage Figure A-16 TBW finished water delivery to Tampa 67 (model simulation v. actual data) Figure A-17 Boxplots normalized % water shortage stage and 68 occurrences of water shortage events for mitigation Figure A-18 Scatterplot ave. annual demand v. % of time CWUP 70 exceedance Figure A-19 Scatterplot ave. annual demand v. median magnitude 71 CWUP exceedance- no mitigation v. mitigation Figure A-20 Scatterplot ave. annual demand v. median duration 73 CWUP exceedance- no mitigation v. mitigation Figure A-21 Monitoring wells used (OROP control points) 77 Figure A-22 Median recovery time for 67 events (1 to 12 months) 81 Figure A-23 WSMP Decision Procedure Flowchart 84 Figure A-24 RCD-rainfall, RMD-flow and simulated 91 water shortage stages, Figure A-25 Water shortage stages-triggered during WY using original WSMP v. updated WSMP Figure A-26 Aggregated monthly reservoir usage/filling 98 (
7 April 17, 2017 Section 1.0 Introduction The purpose of this updated Water Shortage Mitigation Plan (WSMP) is to provide Tampa Bay Water and its Member Governments a strategy for identifying and responding to water supply shortages caused by hydrologic drought conditions. The WSMP focuses on providing Tampa Bay Water with early indications of a potential drought and the ability to predict a corresponding occurrence of a surface water supply shortage arising from below-normal hydrologic conditions. An important outcome of this updated WSMP is a groundwater and surface water supply management strategy that allows Tampa Bay Water to meet its members water needs during hydrologic droughts with its existing regional system in an environmentally sustainable manner. Implementation of this strategy would prevent building additional capacity that is not needed under normal hydrologic conditions. The WSMP defines four stages of water shortage with hydrologic and supply-based triggers for determining entry and exit conditions for each defined water shortage stage. Recommended supply management actions, potential demand management actions, and a communications plan are included in the Plan to guide the selection of appropriate actions for minimizing the impacts of water shortage in areas served by Tampa Bay Water Member Governments. The WSMP is described in Sections 1 through 5 of this report. Appendix A describes the analyses conducted to update the WSMP and provides supporting documentation for the first three sections of this report. Section 1 provides an introduction and background of the WSMP; identifies the WSMP goal and objectives; and identifies the technical advisory committee that provided input to the updated plan throughout its development. Description of the hydrologic-based triggers and water shortage stages are presented in Section 2. Specific demand and supply management actions suggested for each stage are discussed in Section 3. Section 4 defines the WSMP communications plan, including the communications strategy, key messages and delivery tactics. Section 5 describes WSMP implementation and identifies a schedule for future updates. 1.1 Background Tampa Bay Water, the largest wholesale water provider in Florida, and its Member Governments (Hillsborough, Pasco, and Pinellas Counties, and the cities of St. Petersburg, New Port Richey and Tampa) provide water for more than 2.5 million customers. The agency is the sole and exclusive water provider for its Member Governments with the exception for the City of Tampa s permitted use of the Hillsborough River. During water shortage events the City of Tampa relies upon Tampa Bay Water to meet its water needs as flow in the Hillsborough River declines. The agency began diversifying its water supply sources in 1998 following the adoption of the Master Water Plan in 1995 and subsequent agreements made with the Southwest Florida Water Management District (District) to reduce groundwater withdrawals by almost 100 million 1
8 April 17, 2017 gallons per day (MGD). These events resulted in the implementation of our System Configuration I projects which included development of an Enhanced Surface Water System (ESWS) as an alternative supply to make up for those reductions and provide for future growth. The ESWS includes three surface water sources, a large surface water treatment plant, and an offstream storage reservoir (operational in 2005). Tampa Bay Water has made subsequent upgrades to its regional surface water treatment plant by increasing treatment and hydraulic capacities through additional pumping facilities between the regional reservoir, the water treatment plant and delivery into the regional system. A seawater desalination plant with permitted capacity of 25 MGD was also added to enhance the agency s supply capacity and its resilience to drought conditions. The Tampa Bay region has historically experienced numerous occurrences of reduced rainfall and subsequent water shortages. For example, following a very active El Nino winter rainfall pattern in December 1997, the Tampa Bay area entered a period of increasing rainfall deficit which lead to the worst water supply conditions the region has experienced to date. The U.S. Geological Survey, Circular 1295, The Drought of : Impacts on Florida s Hydrology and Landscape (2006), indicates that the drought of was as severe, if not more so, than the 9-year drought of , which previously had been considered the most severe drought of the twentieth century within the regional service area. The rainfall deficit and severe water supply shortage conditions lasted from 1999 through From January 2007 through June 2009, the Tampa Bay region experienced similar water shortage conditions due to continuing below-normal hydrologic conditions. During the spring of 2009, conditions were so extreme that the City of Tampa issued a ban on all outdoor irrigation until the summer rains returned (references include SWF order and SWF order ). In response to increased reliance on surface water supplies, where fluctuations in rainfall and associated hydrologic condition changes can impact water supply availability, Tampa Bay Water developed a three-phase drought mitigation plan which was approved by its Board in December This plan was modified to coincide with redevelopment of water shortage rules (Chapter 40D-21, FAC) by the District. Modifications to the updated WSMP were approved by Tampa Bay Water s Board in These modifications included adding a fourth phase so this Plan was more consistent with District rules and added an additional trigger to monitor flow in the Hillsborough River. 1.2 Revisions to Water Shortage Mitigation Plan The 2009 WSMP contains definitions of four water shortage phases which signify sequentially more severe hydrologic water shortage conditions. The current update to the WSMP maintains the same structure of incremental water shortage stages. To differentiate between District (regulatory) triggered water shortages and Tampa Bay Water (non-regulatory) triggered water shortages, phases are now referred to as stages. In other words, originally, both the District rule and the WSMP had phases; now the District rule has phases and the WSMP has 2
9 April 17, 2017 stages. Tampa Bay Water s WSMP stages are consistent with the District s use of a four-phased water shortage process in its water shortage rules. One major difference between the existing WSMP and the updated WSMP is the triggers used to define water shortages at stages III and IV. In addition to looking at past and current climate/hydrological conditions, the updated WSMP employs forecasted reservoir levels at the end of a three-month period using predicted streamflow as one indicator. Developing this leading indicator of predicted hydrologic conditions allows the agency to incorporate uncertainty into supply and demand-side models, use enhanced weather/climate modeling and statistical methods, and most importantly, it allows the region to implement proactive mitigation actions. Additionally, the Agency is differentiating drought/hydrologic-induced water shortage vs. the need for new water supply based on forecasted long-term growth in regional water demand, optimizing the relationship between regional environmental and fiduciary expectations. 1.3 Goal and Objectives of Water Shortage Mitigation Plan The goal of this WSMP update is to provide a supply management plan which proactively mitigates water supply shortages driven by prolonged below-normal hydrologic conditions in Tampa Bay Water s service area. To achieve this goal, the update to the WSMP has the following objectives: Integrate supply infrastructure improvements and changes in water use permit limits since the 2009 WSMP. Use new modeling tools to evaluate water supply actions for various levels of water shortages. Integrate the WSMP into the Long-term Master Water Plan. Analyze and explore how the Consolidated Water Use Permit wellfields could be used to meet demands during low surface water availability events in an environmentally sustainable manner while planning for future water supplies in fiscally-responsible manner. 1.4 Technical Advisory Committee As an initial step in the WSMP update, a WSMP Technical Advisory Committee (TAC) was re-established in April The TAC, comprised of representatives from Tampa Bay Water, its Member Governments and the District, provided critical technical evaluation during the WSMP update and revision process. Personnel representing the Member Government and the District are identified in Table 1.1. Eight WSMP TAC meetings were conducted over the course of the project. TAC representatives provided review of project documents including but not limited to the proposed modifications to WSMP water shortage stages and hydrologic triggers, demand management and supply management/augmentation actions, communications plan, implementation strategies and the final WSMP Report. 3

10 April 17, 2017 Table 1.1 WSMP TAC Members and Other Participating Staff 4
11 Section 2.0 Hydrologic Triggers and Water Shortage Stages April 17, 2017 Nearly 50 percent of potable water supplies in the Tampa Bay Water service area, including the City of Tampa s self-supply from the Hillsborough River, are derived from surface water sources. These surface water sources are the first and most adversely impacted during hydrologic drought events; therefore, decline in surface water flow is indicative of impending water supply shortage conditions. Current surface water sources in Tampa Bay Water s service area include the Hillsborough River, Tampa Bypass Canal (TBC) and the Alafia River. The City of Tampa utilizes the Hillsborough River as its primary source, with dry season augmentation from Tampa Bay Water through the TBC. Tampa Bay Water s surface water system includes permitted withdrawals from the Hillsborough River via the middle pool of the TBC, the lower pool of the TBC below structure S-162, and the Alafia River at Bell Shoals. Permitted withdrawals from these sources are used to produce potable water via a regional surface water treatment plant and to store water for later treatment in the C.W. Bill Young pumped-storage reservoir. The surface water system alone provides about 30 to 40 percent of the total supplies needed to meet demands of the agency s Member Governments but is also the supply source most adversely impacted by drought. The ability to produce sufficient surface water to address Member Government demand is an important factor in determining whether water shortage actions are appropriate. The WSMP water shortage stages are defined using up-to-date measurements of regional rainfall deficits, streamflow, and actual and predicted reservoir levels for the upcoming threemonth period as indicators of supply shortage conditions. Initial water shortage stages are triggered as early indications of a potential drought as lower-than-normal rainfall and flow conditions occur and persist. More severe stages are then proactively triggered as lower-thannormal flows lead to surface water supply shortfalls and eventually to potential reservoir storage exhaustion. The WSMP triggers are based on hydrologic conditions designed to detect and anticipate occurrences of surface water supply shortage arising from below-normal rainfall and corresponding reduced streamflow within our permitted surface water sources. Within the WSMP, these triggers define water shortage stages which indicate sequentially more severe water shortage conditions. Appendix A describes the development of the hydrologic triggers and water shortage stages in detail. The analysis includes an evaluation of supply actions that can be implemented by Tampa Bay Water to extend the region s ability to meet demands during hydrologic drought events in an environmentally sustainable manner. Tampa Bay Water has developed a regional system evaluation model that is used to determine how much demand can be met through a managed surface water-ground water strategy during drought events and determine when new water supply capacity is needed to meet future water needs due to growth. Based on this analysis, regional demands up to approximately 280 MGD can be met even under hydrologic drought 5
12 April 17, 2017 events through implementation of the water supply actions identified in this plan. The analysis, detailed in Appendix A, demonstrates that implementing additional groundwater pumpage to meet demands during a Stage 4 Water Supply Crisis can be accomplished in a manner that is environmentally sustainable. Implementing this ground water-surface water strategy as defined in this updated WSMP will avoid building new water supply facilities prior to when they are needed to meet new growth in demands, saving money for the water customers of our Member Governments and allowing Tampa Bay Water to maintain operational efficiency. 2.1 Hydrologic and Supply Shortage Trigger Identification The WSMP consists of four water shortage stages of increasing severity defined by hydrologicand/or supply-based triggers that establish both entry and exit conditions from each water shortage stage. Two types of triggers were developed for the WSMP: Hydrologic triggers, used to provide early warning of a potential drought; and Supply shortage triggers, used to describe the severity of surface water supply shortage. Under normal conditions, the natural variability in seasonal rainfall and streamflow does not lead to a water shortage condition; therefore, no water shortage stage would exist per the WSMP. The hydrologic triggers are based on the following hydrologic indicators. Measurements for each indicator are taken on the first day of each month: Rainfall: characterized by the 12-month rolling cumulative deficit rainfall (RCD-rainfall); calculated based on the past 12 months of rainfall from a network of rainfall reporting stations across the Tampa Bay Water service as illustrated in Figure A-4. See Appendix A.4.1 for calculation details. It is expressed as either a rolling cumulative rainfall surplus or deficit. Streamflow: characterized by the rolling median deficit flow (RMD-flow); expressed as the median of the previous 12 monthly streamflow surpluses or deficits at the Hillsborough River USGS Morris Bridge gauge. See Appendix A.4.2 for calculation details. The supply shortage triggers are based on streamflow conditions plus predicted reservoir stage, which is used to determine reservoir storage. The three-month prediction of reservoir stage is based on the current field measurement of reservoir stage. Surface Water Storage: characterized by reservoir water surface elevation (Reservoir Elev); expressed as water level (feet NVGD) in the C.W. Bill Young Regional Reservoir measured on the last day of the previous month, corresponding to remaining days of supply. See Appendix A.4.3 for calculation details. Numerical values for the indicators were developed to trigger entering and exiting each stage based on various combinations of RCD-rainfall, RMD-flow, and Reservoir Level as listed in Table
13 April 17, 2017 The first two WSMP stages are defined by hydrologic indicators, while the last two WSMP stages are defined by stream flow conditions and a three-month projection of predicted reservoir levels, which indicates reservoir storage. A Drought Alert (Stage I) is the first indication of a potential water shortage condition. In Stage I, there is a shortage in rainfall or streamflow (but not necessarily both) as indicated by RCD-rainfall exceeding a 5-inch deficit or RMD-flow exceeding a 10 MGD deficit. Stage I conditions indicate that hydrologic conditions are either deteriorating and could lead to a potential supply shortage or have improved from more severe conditions. A Drought Warning (Stage II) is the next level indicating severe hydrologic conditions; if these conditions continue, a water shortage condition could occur. In Stage II, there is a shortage in both rainfall and streamflow as indicated by RCD-rainfall exceeding a 5-inch deficit and RMD-flow simultaneously exceeding a 10 MGD deficit, but reservoir storage is not impacted. This stage indicates that a loss of surface supply availability may occur requiring the use of storage. For exiting this stage, either rainfall deficit has diminished or RMD-flow has reached a 5 MGD or less deficit. A Regional Supply Shortage (Stage III) condition indicates an extreme water supply situation. In Stage III, a shortfall in streamflow, is indicated by RMD-flow exceeding a 10 MGD deficit, and a shortfall in reservoir storage, as indicated by the predicted reservoir level below the 25th percentile at the end of the three-month prediction period. This stage indicates surface supply is compromised due to dry hydrologic conditions and may be lost altogether if those conditions persist. For exiting this stage, the reservoir storage must have recovered as indicated by a reservoir level at the 35th percentile or greater. A Water Supply Crisis (Stage IV) is the most critical water shortage condition. In this situation, a prolonged shortage in streamflow (RMD-flow exceeding a 10 MGD deficit) has required extended use of reservoir storage. The three-month predicted reservoir level is at or below the 10th percentile at the end of the threemonth period resulting in near or total exhaustion of reservoir storage. When this stage occurs, increased reliance on other water sources and consistent District water shortage phase adoption will likely occur soon. For exiting this stage, reservoir storage must have recovered as indicated by an increase in the reservoir level to the 25th percentile or greater. Once the hydrologic triggers signal a given diminished hydrologic condition and subsequent water supply shortage, the corresponding water shortage stage is triggered, initiating the implementation of supply management actions by Tampa Bay Water as described in Section 3.2. Demand management actions implemented by the Member Governments as described in Section 3.1 are triggered by and correspond to the provisions of any applicable emergency water shortage order or executive director order issued by the District. 7
14 April 17, 2017 Table 2.1 Summary of WSMP Water Shortage Stages Water Shortage Stages Triggers I. Drought Alert (Moderate) II. Drought Warning (Severe) III. Regional Supply Shortage (Extreme) IV. Water Supply Crisis (Critical) ON RCD Rainfall: deficit > 5 OR RMD Flow: deficit > 10 mgd RCD Rainfall: deficit > 5 AND RMD Flow: deficit > 10 mgd RMD Flow: deficit > 10 mgd AND Reservoir forecasts less than reservoir elevation defined by Stage III -supply shortage curve RMD Flow: deficit > 10 mgd AND Reservoir forecasts less than reservoir elevation defined by Stage IV - water supply crisis curve OFF RCD-rainfall: deficit eliminated and surplus created AND RMD-flow: deficit relieved to less than 5 MGD RCD-rainfall: deficit eliminated and surplus created OR RMD-flow: deficit relieved to less than 5 MGD RMD Flow: deficit < 5 mgd OR Both current AND forecasted reservoir levels above Stage III exit levels RMD Flow: deficit < 5 mgd OR Both current AND forecasted reservoir levels above Stage IV exit levels 2.2 Determining Entry and Exit Conditions for Water Shortage Stages WSMP Decision Procedure The WSMP triggers listed in Table 2.1 are evaluated using a structured decision procedure (Figure 2-1). This decision procedure is applied at the beginning of each month using data up through the end of the previous month. Based on the current conditions of the hydrologic indicators, the procedure identifies Tampa Bay Water s proposed water shortage stage for the current month. The decision rules of this procedure are designed such that water shortage stages must be triggered in a step-wise fashion from month to month. Shortage declarations can improve or worsen by at most one stage per month, even if trigger conditions dictate larger changes. The reason is to allow Member Governments and end customers the ability to respond to changing conditions in a step-wise fashion through regular media updates. This approach has been found to result in better community communication and demand reductions during drought events. To assess the water shortage stage for the current month using the flowchart in Figure 2-1, the following steps are taken. Determine initial status: Determine the previous month s water shortage stage, if any, and identify the corresponding rectangular box on the flowchart as a starting location. 8
15 April 17, 2017 Collect data: Calculate RCD-rainfall and RMD-flow based on data through the end of the previous month and obtain reservoir elevation at the end of the previous month. Move through tests: Within the flowchart, follow arrows leaving the starting location, evaluating any tests (YES/NO questions within numbered diamond boxes) as directed. a. If a test evaluates as TRUE, follow the YES arrow leaving that diamond box (and ignore the NO arrow). b. If a test evaluates as FALSE, follow the NO arrow leaving that diamond box (and ignore the YES arrow). c. Continue following arrows and evaluating tests until an arrow leads into a rectangular box. Once a rectangular box is reached, stop. That rectangular box contains the water shortage phase for the new month (if any) Consistency with District Declarations The implementation of the Tampa Bay Water WSMP does not affect the authority of the District to declare or rescind a water shortage within the same geographic areas affected by this WSMP. Thus, Member Governments will implement demand management actions, as described in Section 3.1, which correspond to the provisions of any applicable District-issued water shortage order or executive director order. Those actions will continue for the duration of the District declaration regardless of the current stage established by the Tampa Bay Water WSMP. Member Governments may maintain or implement watering days or times more restrictive, or equally restrictive but different, than those allowed by a District water shortage declaration to address local water supply system constraints or extend the availability of regional water supplies, given concurrence from the District. For supply management actions by Tampa Bay Water and demand management actions by the Member Governments to be consistent, it is necessary that the District declare water shortage phases, within Tampa Bay Water s service area, which correspond to a Tampa Bay Water WSMP stage declaration. Consistency between the WSMP stage and District 40D-21 phase will assist the region in effectively managing water shortage conditions and meet water demand requirements. Once Tampa Bay Water applies the Decision Procedure to identify the current water shortage stage for the month, the Member Government and District primary contacts identified in a list maintained in accordance with Section are notified of the current WSMP water shortage stage and associated hydrologic conditions leading to this stage. Supply management actions are then implemented as described in Section 3.2, based on the hydrologic conditions defined as triggers in WSMP. While the analysis described in Appendix A suggests this WSMP will generally trigger a higher stage and subsequent level of response prior to a District declaration of the same numerical 9


16 April 17, 2017 phase or corresponding response level, a District declaration may last longer than the comparable stage defined in the WSMP. Figure 2.1 WSMP Decision Flow Chart 10
17 April 17, 2017 Section 3.0 Demand and Supply Management Actions This section presents information on the demand and supply management actions recommended for implementation in each WSMP water shortage stage. These actions were assigned to the various water shortage stages based on the severity of the shortage and/or their ability to moderate water demands. Combining the water shortage stage and triggers as described in Section 2.0 with the demand and supply management actions described herein, forms the basis of the response strategy for the Tampa Bay Water WSMP. The rationale behind the development of these actions is to increase surface water supply reliability and moderate water demands which will minimize reliance on groundwater withdrawals during hydrologic-based shortage periods. Demand management actions prescribed in the District s Water Shortage rule, Chapter 40D-21, FAC, are intended to achieve decreases in demand based on District declaration of water shortages and implementation of water restrictions. Demand reductions during water shortages will extend the ability of the surface water system to meet demands. The demand management activities referenced in the WSMP are those of the District s Water Shortage Plan, Chapter 40D-21 F.A.C. Therefore, it is important that the District declare water shortage phases consistent Tampa Bay Water s declaration of water shortage stages. The supply management actions identified in the WSMP are those that can be initiated by Tampa Bay Water. Member Governments are encouraged to implement interconnects to alleviate local hydraulic or pressure issues within their distribution systems. Table 3.1 summarizes the four water shortage phases and the demand and supply management activities associated with each. The following sections detail the demand and supply management activities for each water shortage stage. 3.1 WSMP Demand Management Actions In updating the WSMP, Tampa Bay Water conducted an evaluation of regional water shortage restriction enforcement using historic data up through 2015 and determined an overall 1% reduction in regional demand (decreased by some users, such as those regularly irrigating and increased by other users, such as those who only irrigate during dry conditions) occurred through implementation of District watering restriction (See Appendix Section A.6.1 Evaluation of Water Restriction Tightening). The WSMP TAC reviewed this analysis and concurred that for planning purposes, Tampa Bay Water can assume a 1% reduction in demand could occur during water shortage events through implementation of the District s water shortage rule (Chapter 40D-21, FAC). Member Government implementation of demand management activities during a water shortage is based on the provisions of any applicable water shortage declaration or executive director order issued by the District. 11
18 April 17, 2017 Triggers Actions Water Shortage Stages (with District Name) Stage I: Drought Alert (Moderate) Stage II: Drought Warning (Severe) Stage III: Regional Supply Shortage (Extreme) Stage IV: Water Supply Crisis (Critical) Enter Stage RCD-rainfall: deficit exceeds 5 OR RMD-flow: deficit exceeds 10 MGD RCD-rainfall: deficit exceeds 5 AND RMD-flow: deficit exceeds 10 MGD RMD Flow: deficit > 10 mgd AND Reservoir forecasts less than reservoir elevation defined by supply shortage curve RMD Flow: deficit > 10 mgd AND Reservoir forecasts less than reservoir elevation defined by water supply crisis curve Exit Stage RCD-rainfall: deficit eliminated AND RMD-flow: deficit less than 5 MGD RCD-rainfall: deficit eliminated OR RMD-flow: deficit less than 5 MGD RMD Flow; deficit < 5 mgd OR Both current AND forecasted reservoir levels above Stage III exit levels RMD Flow; deficit 5< mgd OR Both current AND forecasted reservoir levels above Stage IV exit levels Demand Management (Member Governments) Demand Management (Tampa Bay Water) Upon District declaration of a water Upon District declaration of a water shortage or water shortage or water shortage emergency, and shortage emergency, and execution of a water shortage, execution of a water shortage, water water shortage emergency or executive director order, shortage emergency or executive director implement response mechanisms as required by Chapter order, implement response mechanisms as 40D , F.A.C.,((3)(B)3.b or any applicable District required by Chapter 40D , F.A.C., order. or any applicable District order. Upon District declaration of a water shortage or water shortage emergency, and execution of a water shortage, water shortage emergency or executive director order, implement response mechanisms as required by Chapter 40D , F.A.C., or any applicable District order. Upon District declaration of a water shortage or water shortage emergency, and execution of a water shortage, water shortage emergency or executive director order, implement response mechanisms as required by Chapter 40D , F.A.C., or any applicable District order. Upon District declaration of a water shortage or water shortage emergency, and execution of a water shortage, water shortage emergency or executive director order, implement response mechanisms as required by Chapter 40D , F.A.C., or any applicable District order. Upon District declaration of a water shortage or water shortage emergency, and execution of a water shortage, water shortage emergency or executive director order, implement response mechanisms as required by Chapter 40D , F.A.C., (3)(B)2.a. or any applicable District order. Upon District declaration of a water shortage or water shortage emergency, and execution of a water shortage, water shortage emergency or executive director order, implement response mechanisms as required by Chapter 40D , F.A.C. (3)(B)3.b., or any applicable District order Upon District declaration of a water shortage or water shortage emergency, and execution of a water shortage, water shortage emergency or executive director order, implement response mechanisms as required by Chapter 40D , F.A.C.(3)b, or any applicable District order. Supply Management (Tampa Bay Water) Initiate public notices of water supply conditions. Monitor regional water supplies and continue public notices. Monthly reporting of ESWS production and storage limitations to Board and District. Obtain maximum sustainable production rates at Tampa Bay Desal Plant Request emergency authorization from the District to increase Alafia River withdrawals in Stage III. Request emergency authorization to lower middle pool stage to 10 feet for augmentation of Hillsborough River Reservoir Monitor regional water supplies and continue public notices. Monthly reporting of ESWS production and storage limitations to Board and District. Alafia River Withdrawals increased to 19%. Continue TBC middle pool for Harney Augmentation until pool stage reaches 10 feet Request District approval to activate TBC lower pool in Stage IV (9ft to 7.5ft) Monitor regional water supplies and continue public notices. Monthly reporting of ESWS production and storage limitations to Board and District Activate TBC lower pool to 7.5 feet Request authorization to continue groundwater pumping to meet public health and safety demands Table 3.1. Summary of WSMP Stages, Triggers, and Actions 12
19 April 17, 2017 Tampa Bay Water communicates with its Member Governments on water shortage stages, while the District s Water Shortage Plan, Chapter 40D-21 F.A.C. includes four phases of water shortage severity. The rule presents the water use restrictions and other response mechanisms required for each of the District s four water shortage phases. It also describes how the District, in conjunction with local governmental entities and law enforcement officials, will enforce the provisions of a water shortage or water shortage emergency declared by the District. Individual Member Governments opting to maintain or implement more stringent demand management actions than those specified in the District Chapter 40D-21, FAC, such as more restrictive days and times for lawn and landscape watering, should consult with the District as to the applicability of those local measures with respect to the District rules. Water restrictions and other response mechanisms are established in Chapter 40D-21 F.A.C., for each water shortage phase in the District s Water Shortage Plan, as follows: Phase I: Moderate Water Shortage, Chapter 40D , F.A.C Phase II: Severe Water Shortage, Chapter 40D , F.A.C. Phase III: Extreme Water Shortage, Chapter 40D , F.A.C. Phase IV: Critical Water Shortage, Chapter 40D , F.A.C. Within the District s rules, a water user may be classified according to one or more of the following uses of water, as defined in Chapter 40D , F.A.C.: Indoor uses Essential uses, including a sub-classification for water utility use Commercial and industrial uses Agricultural uses Landscape uses, sub-classified as follows: 1. Lawn and landscaping 2. Cemeteries 3. Golf courses 4. Driving ranges 5. Other athletic play areas Within each of the landscape use sub-classifications, there is a further sub-classification of existing or new plant material. Response mechanisms for other uses including cooling, heating, air conditioning use, aesthetic use, recreation area use, water body augmentation, washing or cleaning of outdoor impervious surfaces, and various types of vehicular/mobile equipment washing are also defined for each phase. Various combinations of the response mechanisms described in the WSMP may be employed by the District during any water shortage or water shortage emergency declaration. Member Government implementation of response mechanisms and enforcement of water use 13
20 April 17, 2017 restrictions will occur based on the provisions of any applicable water shortage declaration and/or executive director order issued by the District Phase I: Drought Alert (40D Moderate Water Shortage) Upon triggering a Stage I Drought Alert, Tampa Bay Water will notice its Member Governments on the changed stage status. During a District Phase I declaration, Member Governments will enforce water use restrictions and implement other response mechanisms as described in Chapter 40D , F.A.C., or as required by any applicable water shortage (board) order or water shortage emergency (executive director) order issued by the District Phase II: Drought Warning (40D Severe Water Shortage) Upon triggering a Stage II Drought Warning, Tampa Bay Water will begin public noticing about the current hydrologic conditions, weather predictions, local water restrictions and other response mechanisms as applicable. During a District Phase II declaration, Member Governments will enforce water use restrictions and implement other response mechanisms as described in Chapter 40D , F.A.C., or as required by any applicable water shortage (board) order or water shortage emergency (executive director) order issued by the District. Unless further restricted by the District, seasonal one-day-per-week water use restrictions are implemented during a Phase II shortage and District Chapter 40D (6)(c), during Dec., Jan., Feb. only (rest of year 2x week). These activities will continue for the period of time established in the order, or until the order is modified or rescinded by the District s Governing Board Phase III: Regional Supply Shortage (40D Extreme Water Shortage) Upon triggering a Stage III Regional Supply Shortage, Tampa Bay Water will continue public noticing about the current hydrologic conditions, weather predictions, local water restrictions and other response mechanisms as applicable. During a District Phase III declaration, Member Governments will enforce water use restrictions and implement other response mechanisms as described in Chapter 40D , F.A.C., or as required by any applicable water shortage (board) order or water shortage emergency (executive director) order issued by the District. Unless further restricted by the District, one-day-per-week water use restrictions are in effect. These activities continue for the period of time established in the order, or until the order is modified or rescinded by the District s Governing Board Phase IV: Water Supply Crisis (40D Critical Water Shortage) Upon triggering a Stage IV Water Supply Crisis, Tampa Bay Water will continue public noticing about the current hydrologic conditions, weather predictions, local water restrictions and other response mechanisms as applicable. 14
21 April 17, 2017 During a District Phase IV declaration, Member Governments will enforce water use restrictions and implement other response mechanisms as described in Chapter 40D , F.A.C., or as required by any applicable water shortage (board) order or water shortage emergency (executive director) order issued by the District. Unless further restricted by the District, year-round one-day per-week water use restrictions are limited to four hours and include other stricter limitations on water use. When necessary to protect public health, safety and welfare additional response mechanisms in accordance with Chapter 40D (2)(c) may be required. These activities continue for the period of time established in the order, or until the order is modified or rescinded by the District s Governing Board. 3.2 Water Shortage Mitigation Plan Supply Management Actions This section describes the specific supply management actions, to be undertaken by Tampa Bay Water, for each stage in the WSMP. The actions presented herein have been identified by Tampa Bay Water to extend the capability of existing supply sources and include the temporary use of emergency supply sources during periods of extreme shortage. It is assumed the agency will continue to maximize its use of the surface water system and desalination facility during various water shortage stages as part of its internal operations program. Implementation of many of these supply augmentation actions require approval by District. Therefore, the actions include when Tampa Bay Water submit a request for authorization from the District to implement the required supply actions. Maximize Use of Desalination When a Stage II Drought Warning is declared by Tampa Bay Water, the agency will implement increased production at the Tampa Bay Desalination Facility to the maximum sustainable water production, subject to any physical constraints or water treatment constraints. Production rates at the Tampa Bay Desalination Facility will remain at sustainable levels until the region returns to normal hydrologic conditions. Maximum sustainable production rates will be determined by Tampa Bay Water. Temporary increase in Alafia River withdrawals, allowing withdrawal of 19 percent of previous-day Alafia River flow at Bell Shoals (when River flow at Bell Shoals flow is greater than 80 MGD) up to the maximum permitted limit of 60 MGD. This action consists of increasing the percent-of-flow specified in the current Alafia River withdrawal rule from 10 to 19 percent. Withdrawals would still only occur when Bell Shoals flow is greater than 80 MGD. When the request for emergency authorization is approved by the District, this action is implemented once Stage III is declared. Activate Tampa Bypass Canal Middle Pool for Harney Augmentation (to City of Tampa) 15
22 April 17, 2017 Tampa Bay Water maintains a Water Use Permit granted by SWFWMD which, during periods of low flow and low reservoir elevation in the Hillsborough River Reservoir, allows water in the Tampa Bypass Canal Middle Pool to be pumped back into the Hillsborough River Reservoir. To alleviate low elevations in the Hillsborough River Reservoir and maintain City of Tampa supply, Hillsborough River Reservoir Augmentation from the Middle Pool and Harney Canal is often performed, referred to as Harney Augmentation. The augmentation permit allows the TBC middle pool to be drawn down to a stage of 12 feet. When Tampa Bay Water has declared a Stage 2 - Drought Warning, the agency will request emergency authorization by the District to lower the TBC middle pool stage to 10 ft. NVGD. This authorization increases water availability for City of Tampa to meet its demand. Once the pool stage reaches 10 feet, augmentation through the Harney Canal will cease. Activate Tampa Bypass Canal Lower Pool emergency operation The TBC Lower Pool is the primary source of regional water supply during water shortage periods. Permitted withdrawals are defined to allow use of stored water above a pool elevation of nine feet. Under Stage IV emergency operation, when the request for emergency authorization is approved by the District, the Lower Pool elevation can be further lowered to 7.5 feet NVGD. Request emergency authorization to continue groundwater pumping from the Consolidated Water Use Permit wellfields to meet demand when all other sources are exhausted When all other supply management activities are exhausted during a water shortage crisis and there remains unmet water demand, Tampa Bay Water anticipates it will meet this demand with groundwater. Tampa Bay Water will request emergency authorization from the District to continue groundwater pumping to meet demands and prevent a public health and safety incident from occurring. This request will occur when there is greater than a 50% chance of exhaustion of usable storage in the regional reservoir within the 3- month prediction period, there is no permitted river flows and the desalination plant is operating at sustainable maximum levels. Both during the emergency authorization and until water levels at control point monitoring wells under the Consolidated Water Use Permit are back to pre-drought water levels, all surface water sources shall continue to be maximized to minimize groundwater level recovery time. See analysis in Appendix A WSMP Recovery Actions When a Stage IV Water Supply Crisis occurs, one of supply action Tampa Bay Water will implement is to continuing production from the Consolidated Wellfields to meet demands and avoid a public health and safety emergency from occurring. While the expected occurrence of this action is rare, the updated WSMP contemplates this action. If the agency has had to continue groundwater pumpage, resulting in production greater than the regulatory limit during Stage IV, then the agency will implement recovery actions once hydrologic conditions 16
23 April 17, 2017 improve. When hydrologic conditions begin to improve and Tampa Bay Water moves from a Stage IV Water Supply Crisis to a Stage III Regional Water Supply Shortage, recovery of groundwater levels starts. The surface water system and the desalination facility will continue at their maximum sustainable production rates until groundwater level recovery is achieved. Water level recovery occurs when the post-event groundwater levels are equal to pre-event levels. Included in this updated WSMP is a detailed analysis on the effects of increasing groundwater pumpage from the Consolidated Wellfields over the permit limits and the ability of the groundwater system to recover once favorable hydrologic conditions return (see Appendix A.6.5). Table A-4 provides summary statistics for the median recovery time and median water level change between pre- and post-over-production event conditions. The median water level change in groundwater head increases with increasing duration and magnitude of CWUP groundwater pumpage over the 90 MGD regulatory limit event. The median water level change in groundwater heads is less than 1 foot for all possible events. Implementation of this groundwater - surface water management framework is the foundation of this WSMP. 17
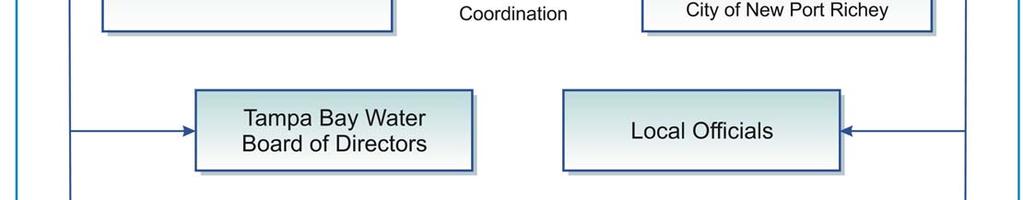
24 April 17, 2017 Section 4.0 Communication Plan When water shortage conditions are present or expected, the level of communication with key stakeholders and the media should be increased to enhance the delivery of key messages and implementation of demand management activities. The success of these efforts relies on the existence of predefined strategies to be used by key stakeholders for communicating with the public and media as the level of shortage intensifies and subsequently decreases. A water shortage communication plan delineates a wide range of key messages and communication tactics for use once a water shortage is triggered. The effectiveness of a communication plan generally relies on the identification of the following aspects prior to a water shortage declaration: stakeholder groups and communication roles specific demand and supply management activities required during a shortage appropriate key messages, communication tools and delivery tactics public outreach and media strategies timing of expected communications Section 4.1 of the Communication Plan provides an overview of the WSMP triggers and actions and how they relate to the suggested communication activities during a water shortage. Communication goals and objectives intended to help delineate a common direction among the key stakeholder groups during a water shortage are identified in Section 4.2. Once a WSMP water shortage stage is entered or exited, and in consideration of the District declaring the same water shortage phase or some slight modification to the phase, effective and ongoing communication is essential. Section 4.3 provides a stakeholder communications structure that identifies the communication roles as illustrated in Figure 4-1 and identified in Table 3.1. Public outreach and education strategies to help guide Tampa Bay Water and its Member Governments in their efforts to educate and inform tri-county residents about specific water conservation methods that may be used to reduce the risk and/or severity of a regional water supply shortage are provided in Section

25 April 17,
26 4.1 Communication Goals and Objectives During each Tampa Bay Water declared water shortage stage and any applicable District water shortage order, ongoing communication with the media and public is essential. These communications help increase awareness about the current water supply conditions and request specific water conservation actions considered necessary to help manage demand and reduce the severity of supply shortage in the Tampa Bay Water Member Government service areas. Given that surface water sources are the first to be impacted by hydrologic drought events, the WSMP triggers and decision procedure used to enter or exit water shortage stages are designed to provide early warning of a potential drought. When coupled with a communication strategy, the ability to detect a potential water shortage condition improves the abilities of key stakeholders to prepare for and respond to a pending or declining state of water shortage. The primary goal of the WSMP communication plan is to define a communication strategy for the key stakeholder groups that will support accurate, timely and consistent communication with the public and media, efficient implementation of appropriate actions and help minimize the impact of water shortage on the community. When requests are made to reduce demand, the public must understand the impacts of a water supply shortage on their community and what they can do to help. As such, the communication plan was developed with the following objectives: Inform key stakeholders of the current WSMP hydrologic- and/ or supply-based trigger conditions and water shortage stage during the 1st week of each month Provide accurate, timely and consistent messaging to the media and public about current hydrologic and supply conditions, weather predictions and water restrictions Increase media and public awareness about water shortage stages and trigger conditions, anticipated effects on primary and back-up water supplies, water restrictions and other response mechanisms as supply availability declines Distribute information about water use efficiency and ongoing water conservation projects that may assist customers in their efforts to reduce demand As a water supply wholesaler, Tampa Bay Water must rely on Member Governments to help meet these objectives. The WSMP communications plan is therefore comprised of two primary elements tailored to foster the proactive coordination needed among collaborating agencies to convey accurate, timely and consistent messaging throughout the region during the various Tampa Bay Water-water shortage stage and any applicable District water shortage order. The two elements are: Stakeholder Communication: This element consists of increased communication and coordination between Tampa Bay Water, the District, and the Member Governments once a water shortage is triggered. Section 4.3 provides the details of this element. 20
27 Public Outreach and Education: This second element of the communications plan involves the delivery of recommended key messages through implementation of a media strategy developed for use by Tampa Bay Water, the District, and Member Governments. Section 4.4 provides the details of this element. The success of these elements relies on a proactive, collaborative approach among the key stakeholders during a water supply shortage. When conducted concurrently and with appropriate coordination, these combined elements will facilitate demand reduction during a water shortage. 4.2 WSMP Triggers and Actions The WSMP consists of hydrologic triggers for entering and exiting four water shortage stages of increasing severity as defined in Section 2.1. For ease of reference in the Communications Plan, the triggers and the supply and demand response actions for each water shortage stage are summarized in Table 3.1. While the information contained in this table forms the basis of the content to be carried forward in the communications plan, a complete description of WSMP triggers and stages and the corresponding demand management and supply augmentation actions are detailed in Sections 2.0 and 3.0 respectively. 4.3 Key Stakeholder Communication The WSMP communication plan defines potential roles of the key stakeholder groups to ensure efficient and effective communication during a water shortage. The stakeholder communication structure aims to support a common goal of providing accurate, timely and consistent information to the public that fosters the implementation of the appropriate actions needed to curtail demands as water supply availability declines WSMP Key Stakeholders The development of the WSMP involved the coordinated efforts of the following key stakeholder groups: Tampa Bay Water The regional water supply wholesaler, governed by a nine-member board of directors consisting of elected officials from its six Member Governments including Hillsborough County, Pasco County, Pinellas County, City of New Port Richey, City of St. Petersburg and the City of Tampa. Member Governments - Includes public officials, governmental departments and employees of Tampa Bay Water s six Member Governments, together serving a combined population of more than 2.4 million people. Southwest Florida Water Management District (District) One of five state water management districts identified in Chapter 373, Florida Statutes, responsible for ensuring adequate supply of 21
28 water through regulation and water supply planning and enforcement of the Water Shortage Plan, Chapter 40D-21, F.A.C. During a water shortage, Tampa Bay Water fosters an enhanced communication process with Member Governments and District representatives to encourage proactive coordination of consistent messaging efforts, identify ways to improve the effectiveness of communication activities and to promote collaboration between stakeholders when feasible. Tampa Bay Water will communicate and/or meet monthly with representatives from these agencies as appropriate during a Stage II, III and IV water shortage or District Phase II, III or IV water shortage to discuss current demand and supply management activities, ongoing communication efforts, and future activities that could be temporarily employed should conditions continue to deteriorate Primary Contacts for Tampa Bay Water, Member Governments and District Tampa Bay Water s contact list will be consistent with contacts established by Tampa Bay Water s Demand Management Coordinator during monthly meetings of Member Government conservation staff Tampa Bay Water and Member Government Communication Tampa Bay Water evaluates WSMP trigger conditions and alerts the primary contacts during the 1st week of each month if water shortage conditions exist. Once a water shortage stage is triggered as described in Section 2.2, Tampa Bay Water will determine the timing and need for additional communication efforts as provided in Figure 4-2 and solicit Member Government feedback on the development of communication efforts such as news releases and broadcast media campaigns, and coordinate concurrent use of key messages and communication tactics as appropriate. Figure 4.2- Tampa Bay Water Public Communication Effort Determination 22
29 The current WSMP water shortage stage and trigger conditions, and links to Member Government water use restrictions will be maintained on Tampa Bay Water s web site. Suggested key messages, delivery methods and other considerations for conveying this information to the media and public are provided in Section 4.4, Public Outreach and Education. To assist Tampa Bay Water in preparing for regional drought-related water supply challenges, Member Governments should inform Tampa Bay Water about encountered or anticipated local water supply challenges and any planned strategies for demand management in the event the drought continues or worsens Tampa Bay Water and District Communication Tampa Bay Water will coordinate with District staff at regular intervals during drought and nondrought periods as required in Chapter 40D-21, F.A.C. or any applicable water shortage order. Following evaluation of the WSMP trigger conditions and determination of the current WSMP stage, Tampa Bay Water will alert the District primary contacts if water shortage conditions exist. Within 30 days of a District Phase III declaration, unless stated otherwise in any applicable District declaration or order, a report regarding the status of the Tampa Bay Water potable water system will be provided to the District. The report should focus on any current or anticipated shortage-related challenges, such as well failure, distribution pressure problems, quantity or quality concerns about primary and back-up supplies and planned strategies for supply supplementation if the drought continues or worsens. During a District Phase III and Phase IV declaration, unless stated otherwise in any applicable District declaration or order, a monthly or weekly status update will be provided to District staff as required in Chapter 40D (3)(b)3 and Chapter 40D (3)(b)1, F.A.C. In addition, Tampa Bay Water will inform the District about drought-related challenges with water supplies as reported by Member Governments and any planned strategies for demand management in the event the drought continues or worsens Member Government and District Communication Member Government participation in demand management, enforcement, communication and reporting activities will be carried out as required by Chapter 40D-21, F.A.C. or any applicable water shortage order, as described in Section 3.1. During a District Phase II, II or IV water shortage, unless stated otherwise in any applicable District declaration or order, the provisions of Chapter 40D-21, F.A.C. require specific communication with District staff: Public Official and Internal Communication Notification of regional water shortage stage changes from Tampa Bay Water to the primary contacts identified in section generally occurs during the first week of each month. Additionally, notification of District water shortage phase modifications should also be provided upon occurrence. Once alerted, internal communication with public officials and other impacted governmental 23
30 departments should be initiated. As part of their efforts to notify local elected officials, affected users and other interested parties, Member Governments may elect to commence the following activities: Notice to wholesale water customer(s) Notice to public officials Notice to impacted governmental departments, including: Customer Service Public Works Safety Services Communications Environmental Services Information Technology Parks & Recreation Tampa Bay Water staff will notify the Tampa Bay Water Board of Directors following a modification of a Tampa Bay Water stage or District water shortage phase and continue to provide bi-monthly water shortage status updates as considered necessary or requested by the Board of Directors. More frequent reporting may occur as the severity of a water shortage increases. 4.4 Public Outreach and Education Tampa Bay Water and Member Governments are responsible for supplementing the District s messaging efforts about water shortage conditions and the demand management actions needed to help mitigate a pending or existing water supply shortage. Member Government s efforts should focus on direct communication with utility customers while Tampa Bay Water focuses on regional communication tactics. Coordination between Tampa Bay Water and Member Governments is, therefore, critical to ensure the content and timing of messaging efforts is effective in communicating with the public and meets the requirements of Chapter 40D-21, F.A.C. or any applicable declaration or order. Effective public education outreach increases public awareness and enhances public involvement and support. These efforts rely on a predefined strategy which includes a specific set of recommended key messages and delivery tactics for each water shortage phase. During the early stages of a water shortage, the strategy relies on low-cost, relatively infrequent, measures (as determined by each utility) and can include utilization of web sites, social media and opportunities. As water shortage conditions become more severe, higher-cost, more frequent measures, such as a multi-media advertising campaign may be necessary to fully satisfy communication plan objectives (see Figure 4-2) Key Messages and Delivery Methods Once a water shortage stage is triggered by Tampa Bay Water or phase declared by the District, ongoing and effective communication among stakeholders is essential. Through education and outreach, Tampa Bay Water and the Member Governments will provide the media and public with 24
31 key messages for each water shortage phase, describing the current hydrologic and supply conditions, actions being taken, and what can be expected in the future. The initial phase of the public outreach and education campaign should focus on increasing public understanding of current hydrologic conditions and the need for increased water conservation should conditions worsen into a supply shortage. Various communication tactics can be used to reach out to utility customers. Because Member Government utilities are part of a larger organization, they may not be able to unilaterally determine the frequency and content of its communication efforts. Therefore, development of a communication plan to deal with shortages are not intended to be used mechanically, but a guide for use in development or enhancement of an internal communication plan that identifies activities to be implemented during a water shortage. While preferred delivery methods among members may vary, the uniformity of the key message and timing of delivery occurring throughout the region during a water shortage can be effectively managed with proper planning and coordination Media Strategy Media strategies will be developed to assist efforts in conveying accurate and consistent messages at the onset of a water shortage and to continue while water shortage conditions exist. The key messages, tactics and timing of communication events provide the basis for this strategy. Insights gained from review of communications plans gathered from the Member Governments and techniques used by water utilities across the country will guide media strategy development. When applied uniformly throughout the region, the media strategy will help ensure key messages delivered to the media and public are accurate, timely and consistent throughout the duration of a water shortage Develop/Update Key Messages Key messages, driven by the water shortage phase, communicate information such as current hydrologic indicator and supply conditions, supply management actions being taken by Tampa Bay Water and the Member Governments, required demand management activities as well as what can be expected in the near future. These messages should be updated on a regular basis to reflect the prevailing conditions, water shortage phase and stage and associated requirements Coordinate Uniform Outreach to the Media and Public Tampa Bay Water, the Member Governments and the District communication efforts are expected to be conducted simultaneously during a water shortage. Key messages should be used concurrently when a water shortage is triggered to reinforce the significance of the information conveyed. Agencies should coordinate media messaging efforts such as news releases, media interviews, and TV/radio specials to ensure consistent communications throughout the region. Monthly communication/meetings through Tampa Bay Water will provide the key stakeholder groups the opportunity to review and share their messaging tactics Plan, Develop and Implement Communication Tactics For each set of recommended key messages, tactics and timeframes for conveying this information to the public will be provided. The extent to which the tactics will be implemented is expected to vary 25
32 among stakeholders, therefore a separate list of tactics will be developed for both Tampa Bay Water and the Member Governments. The suggested tactics are intended to provide an assortment of flexible messaging options and the ability to adjust to varying timeframes for implementation, budgetary constraints and prevailing water supply conditions. Member Governments should determine how tactics supporting the WSMP communication objectives can and will be funded, developed and implemented in a timely manner, well in advance of an event necessitating the need for such communication actions. To minimize overlap with other public outreach events, agencies should consider joining efforts with other groups, organizations and community decision makers and expand their public outreach efforts as opportunities arise District Required Communication Water utilities shall supplement the District's messaging efforts by disseminating pertinent water conservation and demand management information as required by Chapter 40D-21, F.A.C., and any applicable District order. Such messaging includes informing utility customers about a water shortage declaration, including how their primary and back-up water supplies could be affected and any ongoing local water conservation projects, such as rebate or inspections offered by the utility that may assist its customers in their efforts to curtail water use Communication Timing A communication schedule determines the frequency of communication events supported by an approved budget. The suggested timing of communication events is recommended for each WSMP water shortage phase. Frequency of messaging and overall penetration rate throughout the region is expected to increase as a water shortage becomes more severe. The monthly communication/meetings suggested in Section will provide key stakeholder groups the opportunity to discuss the timing and frequency of communication with the media and ways to enhance market penetration Establishing a Budget for Public Outreach and Education Implementing a comprehensive ongoing public outreach program and communication strategy during a water shortage can represent a major undertaking for many utilities. A challenge inherent in most major communication events is ensuring adequate financial resources are available and devoted to the program. Specific costs will vary depending on communication tactics selected, the timing and potential extent and severity of the shortage and other factors. In the case of a more severe water shortage, the need for funding could potentially exist for more than one season/year. Obtaining a commitment of funds for implementing any water shortage communication plan is critical, in many cases well in advance of the need to utilize such funds. Planning the development and implementation of anticipated communication tactics and obtaining estimates of those costs will assist in establishing a formal budget prior to or within a budget year. 26
33 Section 5.0 Water Shortage Mitigation Plan Implementation Implementation of the WSMP will be coordinated between Tampa Bay Water, the District and Member Governments, who have direct contact with their customers enabling communication, enforcement, and monitoring at the local level. During WSMP implementation, Tampa Bay Water s primary focus is placed on the evaluation of hydrologic indicators and supply-side management actions and informing the District of local hydrologic/supply issues while the Member Governments focus is on implementation of demand-side management actions. The District s role is to track water shortage conditions in the region, insure timely response to shortages and consider execution of executive orders identified at various stages of shortage identified in this document. Implementation of Communication Plan elements will be a cooperative effort carried out by all agencies. The key components of the Tampa Bay Water WSMP are summarized in Table 4.1 and illustrated by the Implementation Procedure, Figure Implementing Water Shortage Actions The adoption of the modified WSMP by the Tampa Bay Water Board of Directors provides approval for implementation of WSMP activities by the agency during each water shortage stage. However, the existence of the WSMP does not preclude Tampa Bay Water and the Member Governments from having to comply with any water shortage (District Board) order or water shortage emergency (executive director) order issued by the District. Because the demand management actions in the WSMP refer directly to the implementation of the District Chapter 40D-21, F.A.C. rules, further action from the Tampa Bay Water Board of Directors or the Member Government s decision-making bodies is not required to implement the measures contained herein. Member Governments can maintain or implement watering days or times more restrictive, or equally restrictive but different, than those otherwise allowed by a District water shortage declaration, water shortage emergency or executive director order through the appropriate local processes. As a new water shortage stage occurs as described in Section 2.0, whether through entry into or exit from a given stage, Tampa Bay Water will implement the appropriate supply management actions. The Member Governments will continue to implement demand management actions required under the District s water shortage (board) order or water shortage emergency (executive director) order. Tampa Bay Water supply management actions, triggered by the hydrologic- and/or supply-based indicators defined in the WSMP, will continue to be implemented during a water shortage as necessary to meet Member Government demands. Alternatively, Member Government demand management actions are triggered by and correspond to the provisions of any applicable water shortage (board) order or water shortage emergency (executive director) order issued by the District and continue for the period of time established in the order or until the order is modified or rescinded by the District Governing Board. 27

34 28
35 5.2 Implementation of Demand and Supply Management Activities Specific actions to be implemented by Tampa Bay Water and Member Governments during a water shortage are outlined below Tampa Bay Water Actions Collect and evaluate data for the four hydrological triggers during the first week of each month (Section 2.1, Hydrologic Triggers and Water Shortage Stages); Apply WSMP decision procedure to determine WSMP water shortage stage for the current month (Section 2.2.1, WSMP Decision Procedure); Verify current District phase for Member Government demand management actions (Section 2.2.2, Consistency with District Declarations); Request District make water shortage declarations for the areas served by Tampa Bay Water consistent with Tampa Bay Water s WSMP; Implement supply management actions including coordination with the District regarding any requested emergency authorization (Section 3.2, WSMP Supply Management Actions); Report current WSMP water shortage stage to Member Governments and District primary contacts in a list maintained as indicated in Section 4.3.2in the 1st week of each month if water shortage conditions exist (Section and 4.3.4, Communication Plan); Maintain the current WSMP water shortage stage and trigger conditions, and links to Member Government water use restrictions on Tampa Bay Water web site (Section 4.3.3, Communication Plan); Communicate and/or meet monthly with Member Governments and District during a Stage II, III and IV water shortage (Section 4.3.1, Communication Plan); Provide report on the status of the potable water system to the District within 30 days of Stage III declaration, (Section 4.3.4, Communication Plan); Provide report on the status of recovery of water levels when Tampa Bay Water has exited a Stage 4 Water Supply Crisis. Notify Tampa Bay Water Board of Directors following a modification of a WSMP water shortage stage or District water shortage phase. Continue to provide updates to the Board of Directors as necessary or requested by the Board (Section 4.3.6, Communication Plan); Participate in media and public outreach activities to supplement District messaging efforts; Address Member Government concerns and offer technical or other as-needed assistance Member Government Actions Participate in water use restriction enforcement and other demand management activities as required by Chapter 40D-21, F.A.C. or any applicable declaration or order (Section 3.1, Demand Management Actions); 29
36 Review of current water conservation programs to assure permit required elements are fully implemented (Section 3.1, Demand Management Actions); Develop process through which District and public inquiries regarding flushing can be addressed. (Section 3.1, Demand Management Actions); Communicate with local elected officials and other city/county staff regarding the changing status of water shortage conditions (Communication Plan, Section 4.3.6); Notify Tampa Bay Water and District of current or anticipated shortage-related challenges regarding system (Section and 4.3.5, Communication Plan); Report status of potable water system to the District within 30 days of District Phase III declaration (Section 4.3.5, Communication Plan); Transmittal of enforcement data to the District. (Section 4.3.5, Communication Plan); Implement public education and outreach and media outreach activities as appropriate (Section 4.4, Communication Plan) 5.3 Planned Revisions This water shortage mitigation plan update is being completed as part of the Long-term Master Water Plan 5-year update. The update includes an evaluation of how using a groundwater-surface water management strategy, which includes using more groundwater during hydrologic droughts, can be accomplished in an environmentally sustainable manner. Implementing this strategy could extend the supply capabilities of Tampa Bay Water s existing regional system. Updates will occur at least once every five years, consistent with the Long-term Master Water Plan updates, and/or District rule changes, or when new experience gained. In addition, the WSMP may be incorporated into the Consolidated Water Use Permit during the renewal process in
37 Appendix A - Modeling and Analysis of Regional Water Shortage Mitigation Plan A.1 WSMP Background: Nearly 50 percent of potable water supplies in the Tampa Bay Water service area, including the City of Tampa s self-supply from the Hillsborough River, are derived from surface water sources. These sources are the first to be impacted during hydrologic-drought events, and are indicative of impending water supply shortage conditions. Existing surface water supplies for the region are produced by: City of Tampa s David L. Tippin Water Treatment Facility Tampa Bay Water s Enhanced Surface Water System (ESWS) The primary source of water for the David L. Tippin Water Treatment Facility is the Hillsborough River. The Tampa Bypass Canal is the primary source of augmentation to the City s Hillsborough River Reservoir. The Tampa Bypass Canal (TBC) is used during periods of low Hillsborough River flow. A schematic of Tampa Bay Water s ESWS is shown in Figure A-1. The three surface water sources for the ESWS include the Alafia River at Bell Shoals Road, the Tampa Bypass Canal Lower Pool, and the Hillsborough River via the Tampa Bypass Canal Middle Pool. Maximum daily permitted surface water withdrawals for the three sources are defined in the water use permits for the Hillsborough River/TBC system (Water Use Permit No ) and Alafia River (Water Use Permit No ) issued by the Southwest Florida Water Management District (District). These permits contain withdrawal rules based on previous-day streamflow measurements and/or water surface elevations at specific gauging stations on the Tampa Bypass Canal, Hillsborough River, and Alafia River that are hydrologically associated with withdrawal points. Alafia River withdrawal is limited by estimated 1 flow measurements at the Tampa Bay Water withdrawal location near Bell Shoals Road Bridge. 1 According to water use permit , flow at the Bell Shoals Bridge on the Alafia River is estimated from two upstream gauged flows: Alafia Lithia Springs and Alafia Lithia Gauge, by the equation qbs = qls qLG. 31
38 Lower Pool withdrawals are limited by Lower Pool surface elevation as measured at the S160 control structure. Middle Pool withdrawals are limited by flow at the Hillsborough River Dam (HRD) on the Hillsborough River and by Middle Pool surface elevation as measured at the S162 control structure Permitted surface water withdrawals from these sources are used to produce potable water via Tampa Bay Water s surface water treatment plant (SWTP) that has a sustainable capacity of 90 MGD and/or are stored in the C. W. Bill Young Regional Reservoir for subsequent treatment and delivery. Figure A-1: Tampa Bay Water Enhanced Surface Water System (ESWS) In addition to Tampa Bay Water s enhanced surface water system, the Agency also operates 13 groundwater wellfields and two dispersed groundwater systems (Carrollwood wells and Eagles Wells). 32
39 The District issued the Consolidated Water Use permit (No ) to Tampa Bay Water for 11 of these wellfields located in Pasco, northern Hillsborough, and northeast Pinellas counties in This water use permit was renewed in Under the Consolidated Water Use Permit (CWUP) the combined pumpage of all 11 wellfields is limited to 90 MGD on a 12-month running average basis. The other two groundwater wellfields are the Brandon Urban Dispersed Wellfield which is limited to 6 MGD on a 12-month running average basis and the South-Central Hillsborough Regional Wellfield which is limited to 24.1 MGD on a 12-month running average basis. The remaining dispersed wells are limited to about 1 MGD on a 12-month running average basis. Tampa Bay Water has an Optimized Regional Operations Plan (OROP) to rotate pumpage among different wellfields to satisfy regional demand and ensure environmental sustainability. The objectives of the Operations Plan are to improve Tampa Bay Water's ability to understand the water-level effects of water supply operations that affect environmental conditions, enhance water supply management programs to benefit the surrounding environment, and increase water levels in areas of interest while meeting Member Government water demands. Tampa Bay Water also operates a seawater desalination plant, which is currently used to meet spring dry season demands. The plant is operated to produce between 12 and 20 MGD of potable water. The amount of product water depends on several operational constraints including source water temperature, source water quality, and salt removal efficiency. Tampa Bay Water has developed a Regional Performance Evaluation Model (RPEM), which calculates daily withdrawals from each of the three surface water sources based on actual or simulated river flows and the withdrawal rules specified in the water use permits. Permitted daily withdrawals are then used within the model to calculate actual withdrawals based on operating rules and infrastructure limitations, reservoir storage and surface water treatment plant production. The model also includes the operating protocols for the Tampa Bay Seawater Desalination facility. The model incorporates sustainable pumping capacities which reflect operational protocols, water quality considerations and infrastructure limitations. For additional information on the RPEM, the reader is referred to Section 12 - System-Wide Reliability and Future Needs, Tampa Bay Water Long-Term Master Water Plan 2013 (Tampa Bay Water 2013). For development of the water shortage triggers, the RPEM model was used to conduct analyses using the following assumptions: 33
40 Permitted surface water withdrawal availability is based on the current water use permit regulatory limits. Maximum sustainable surface water treatment plant production of 90 MGD. TBC pumping station sustainable pumping capacity of 250 MGD. Alafia River pump station sustainable pumping capacity of 43 MGD. Groundwater production aggregated by 12-month running average permit quantities (CWUP, SCH, and BUD). Seawater Desalination plant operated at an annual average sustainable production level of 15.4 MGD. The existing WSMP 2 contains definitions of four water shortage stages which signify sequentially more severe hydrologic water shortage conditions. The updated WSMP maintains the same structure of incremental water shortage stages, which are consistent with the District s use of a four-phased water shortage process in its rules. These stages are designed to detect and anticipate increased potential for and occurrences of surface water supply shortage arising from below-normal rainfall and reduced streamflow. One of the major differences between the existing WSMP and updated WSMP is triggers used to define water shortage conditions at stages III and IV. In addition to looking at past and current climate/hydrological conditions, the updated WSMP employs forecasted reservoir levels at the end of a 3-month period as an indicator of future hydrologic conditions. This is the use of a proactive signal featured in the updated WSMP. Primary reasons for using predicted reservoir levels at the end of a 3- month forecast are: This approach is forward-looking, recognizing the importance of near future hydrologic/climatic conditions; Incorporates uncertainty into supply and demand models; Approach can be easily implemented with substantial improvement in seasonal flow forecasts (3-months ahead) owing to enhanced weather/climate modeling, statistical predictive techniques and having a relatively long database of operational and flow data for reservoir operation; and Allows implementation of proactive mitigation actions in a timely fashion 2 Water Shortage Mitigation Plan, Final Report, November
41 Water shortage stages are defined using threshold values of regional rainfall, streamflow, and reservoir levels. Water shortage is indicated, and water shortage stages are triggered, when up-to-date measurements of streamflow and rainfall, and forecasted reservoir level exceed these thresholds. Two types of triggers were originally developed and used in the Tampa Bay Water Board-approved WSMP from 2009 to current; hydrologic indicators to provide early warning of a potential drought and water shortage triggers to describe the surface water supply shortage. The first two shortage stages are defined by hydrologic indicators (i.e. rainfall and streamflow). In the original WSMP, the last two stages were defined using only existing flow and reservoir levels with no hydrologic/climate outlook. In the updated WSMP, these last two stages have been modified based on availability of long-term operational data to include a three-month forecast of predicted reservoir levels as an indicator of water shortage severity. WSMP triggers are designed to be evaluated on or close to the first day of each month. At that time, rainfall, streamflow, and reservoir data up through the end of the preceding month are collected and forecasted reservoir elevation at the end of a 3-month period are processed. The data are then applied to a defined decision procedure to determine if conditions warrant entering or exiting WSMP stages, declaring a new water shortage stage, or remaining at the prior stage. Once a water shortage stage is triggered by Tampa Bay Water, specific supply enhancement actions are initiated by Tampa Bay Water. In addition, demand management actions implemented by the Member Governments, are triggered by and correspond to the provisions of any applicable District issued water shortage order or executive director order. A goal of the WSMP process is to have consistency between water shortage stage declaration by Tampa Bay Water and the District s declaration of a water shortage phase. This Appendix explains tools used in the WSMP update, WSMP design goals and procedures, data collection and processing needs, definition of water shortage stages, and development of the decision procedure for declaring water shortage stages. A.2 WSMP Design Procedure WSMP water shortage stages and decision procedures were designed and assessed by applying WSMP triggers and stage definitions to the historical flow and rainfall record from October 2004 through 35
42 September The regional reservoir was offline for renovation from late 2012 through mid-2014, so reservoir levels were simulated over the period of using the RPEM. Based on these historical data and simulation results, multiple combinations of WSMP decision procedures and stage definitions were developed, applied, and assessed to determine when water shortage stages would have been triggered within the historical period. The WSMP decision procedure was also tested using stochastic demand and flow scenarios for the year 2030 to examine benefits associated with proactive trigger development and mitigation strategies. Definitions for water shortage stages and decision procedures were identified to trigger stages at appropriate times and periods, based on the following criteria: Stage I indicates the mildest water shortage condition, wherein streamflow or rainfall is lower than normal, but reservoir storage is not impacted. At this stage, the potential of significant flow loss that could reduce surface water supply availability would exist if hydrologic conditions deteriorate. Stage I indicates a high likelihood of Stage II occurring should hydrologic conditions continue to deteriorate. Stage II- Drought warning- indicates severe hydrologic conditions and water shortage conditions as streamflow and rainfall are further reduced, but reservoir storage remains good. At this stage, the potential reduction in surface water supply availability could occur requiring the use of reservoir storage should hydrologic conditions continue to deteriorate. Stage III Regional Supply Shortage - indicates an extreme surface water supply shortage wherein reservoir storage is declining due to the lack of permitted surface water withdrawal. At this stage, the three-month outlook of reservoir storage is sufficient to continue meeting supply needs at the regional surface water treatment plant, even if hydrologic conditions persist. Stage IV- Water Supply Crisis- indicates a water supply crisis wherein exhaustion of Tampa Bay Water s regional reservoir storage is likely. At this stage, the three-month outlook of reservoir storage is low and shutdown of the surface water treatment plant is likely to occur within the 3-month window without an increase in allowable surface water withdrawals. 36
43 A.3 Model Development tools used in the WSMP Update Several in-house modeling tools, including a demand forecasting model, stochastic flow generation model and RPEM were used in updating the WSMP: A long-term demand forecasting (LTDFS) model that incorporates demographic, socioeconomic factors and weather variables, developed for the agency, using data from This model is used to generate monthly regional demand in future years for each member government. The monthly predicted demands are then disaggregated to a daily time scale for use in the RPEM. Flow Modeling System (FMS, version 2), developed in 2010, is used for stochastic flow generation. In FMS2, Gaussian mixture models are applied to generate monthly rainfall time series ensemble for rainfall stations in the service area. Seasonal multivariate linear regression models are then used to generate monthly flow for both the Morris Bridge station on the Hillsborough River and Bells Shoals on the Alafia River. To obtain daily time scale streamflow at both stations, a multivariate nonparametric disaggregation procedure is implemented 3 (Tampa Bay Water Future Need Analysis, 2010). A stochastic flow ensemble of 1,000 realizations was generated to evaluate flow uncertainty using 100 years of rainfall data. Each realization is based on long-term rainfall while preserving historical flow characteristics. Similarly, 1,000 realizations of demand for the time slice 2030 were generated using the same 100-year period of rainfall. The 2030-time slice includes the uncertainty in the socioeconomic parameters such as income, price, persons per household, etc. used in the demand forecast model. This allows the evaluation to include both uncertainty due to hydrologic variability and also uncertainty in the parameters driving the demand forecast. For the year 2030, the range of annual demand is from 230 to 330 MGD. Latin hypercube sampling (a statistical method for generating a near-random sample of parameter values from a multidimensional distribution) was used to generate pairs of flow and demand 3 Tampa Bay Water Future Need Analysis (Version 2): New Models for Stochastic Simulation and Forecasting of Regional Surface Water Supply and Operations, December
44 projections to represent a bivariate distribution of the two variables. One pair of flow and demand projections is defined as a realization. This sampling resulted in 334 realizations selected to represent the full range of uncertainties, instead of one million combinations of flow and demand realizations that were generated. Of these realizations, only those with a long-term annual regional (including City of Tampa) demand of 280 MGD or less were used for WSMP update. Based on prior analysis of Tampa Bay Water s regional water supply system including the City of Tampa s system, it was demonstrated that regional demands up to 280 MGD could be met even during hydrologic droughts with some additional groundwater pumpage. Regional demands beyond 280 MGD required additional supply capacity to be built to sustainability meet those demands. RPEM is built in AMPL (a mathematical programming language) to reflect the flow network carrying water from various supply sources to wholesale delivery points and incorporates operational preference and hydraulic constraints. Surface water availability is calculated in a separate model to determine water availability at the three surface water sources; TBC, Alafia River and the reservoir. Surface water availability is then passed to the RPEM to determine optimal water use from different sources. Actual surface water used is based on operational protocols. Actual surface water use is then passed back to surface water availability model to update initial status for the next period. Interprocess communication is used to send messages between the surface water availability model and system operation model. To reduce computing time, computation of 334 realizations is distributed across a computer cluster using Matlab Distributed Computing Toolbox. The flowchart in Figure A- 2 depicts all the processes involving different models. 38
 and 2030 demand scenario analysis (")

45 Figure A-2: Modeling framework incorporating flow and demand uncertainty in running RPEM. The flowchart presented in Figure A-2 was applied to both historical data during ( Retrospective analysis ) and 2030 demand scenario analysis ( Future scenario analysis ). To evaluate the benefits of demand-side and supply-side mitigation actions, two distinct runs were conducted for both retrospective analysis and future scenario analysis: without and with mitigation actions. The runs without mitigation scenario are defined as the no-mitigation scenario and the runs with mitigation actions are defined as the mitigation scenario. 39
46 One important question is to examine the possibility of continuing to pump groundwater from the 11 Consolidated Permit wellfields beyond the 12-month permitted average annual production of 90 MGD in a manner that is environmentally sustainable. Maintaining wetland health in the vicinity of the 11 wellfields was used to evaluate environmental sustainability. In these analyses, groundwater levels at the Optimized Regional Operations Plan control point monitoring wells are used as a surrogate for wetland health conditions 4. To conduct this analysis, two additional in-house modeling tools the Integrated Hydrologic Model (IHM) and Unit Response Matrix (URM) were used. The IHM was co-developed by Tampa Bay Water and the District and is an acceptable application used by both agencies. The URM was developed by Tampa Bay Water and has been approved for use by the District as a component of the Optimized Regional Operations Plan. The District requires its use in the Optimized Regional Operations Plan (OROP) model to rotate groundwater production among different wellfields. The URM is a two-dimensional matrix with its elements derived from pulsing a pumping well and simulating the response of groundwater levels. In essence, it provides a time series of groundwater level drawdown at a certain location, usually a monitoring well site, caused by pulses at production wells. In this case, the URM was applied to examine how much time is needed for those monitoring wells, identified in section A.6.5, to recover to pre-drought event groundwater levels. Figure A-3 shows how the two modeling tools are used in this environmental analysis. Detailed explanation of this figure is provided in section A Tampa Bay Water Operations Plan Update, Revised April
 from multiple stations")
 in the C.W. Bill Young Regional Reservoir measured on the last day of the previous month.")
47 Figure A-3: Modeling framework for environmental impact analysis. A.4 Trigger Development and Mitigation Actions Evaluation The WSMP is based on evaluating conditions that govern surface water supply availability. As such, the WSMP is evaluated using two types of data generally available on the first day of each month; Actual data collected: The previous month s total rainfall (inches) from multiple stations across Hillsborough, Pasco, and Pinellas counties, The previous month s average streamflow (MGD) at the USGS Morris Bridge gauge on the Hillsborough River, and Water level (feet NVGD) in the C.W. Bill Young Regional Reservoir measured on the last day of the previous month. Model simulation output: 50 th percentile of forecasted water level (feet NVGD) in the C.W. Bill Young Regional Reservoir at the end of the future three-month period. Both demand and supply mitigation actions were proposed, examined, and evaluated using the retrospective analysis and future scenario analysis. 41
48 In this section, the data and processing necessary to support WSMP evaluations are described followed by evaluations for demand and supply mitigation actions in Section A.6. A.4.1 Calculating Rainfall Deficit: RCD-rainfall In evaluating WSMP stages, up-to-date historical rainfall records are maintained for 28 regional rainfall stations. These rainfall records are used to characterize the degree that region-wide rainfall has exceeded or fallen short of normal levels over the previous 12 months. This regional rainfall surplus/deficit value is known as Rolling Cumulative Deficit Rainfall, abbreviated RCD-rainfall. Rainfall stations used for analyses in this document are illustrated in Figure A-44. The up-to-date value is one of four variables applied in the WSMP decision procedure at the beginning of each month. RCD-rainfall is determined as follows: For each rainfall station, long-term mean monthly rainfall is determined for each month of the year. Long-term is based on observations between 1981 and 2010 (base period). These are considered normal rainfall values for each month of the year at that station. For example, a station s normal rainfall for January is determined by averaging together all of the January rainfall values in the base period. For each station, rainfall measurements are obtained for the most recent 12 months (up through the previous month). Normal rainfall values are then subtracted from each of these rainfall measurements. This subtraction produces monthly rainfall surpluses or deficits over the previous 12 months for that station, with positive values indicating surpluses and negative values indicating deficits. For each of the most recent 12 months (up through the previous month), average rainfall surplus/deficit is calculated across all stations. This produces the regional average rainfall surplus or deficit condition for each of the last 12 months. Finally, RCD-rainfall is calculated as the sum of regional average rainfall surplus/deficit values over the most recent 12 months. 42

49 RCD-rainfall is therefore the total rainfall surplus or deficit over the most recent 12-month period as judged by average surplus or deficit conditions across multiple rainfall stations. Figure A-4: Rainfall stations used in calculating RCD-rainfall. A.4.2 Calculating Streamflow Deficit: RMD-flow In addition to rainfall, WSMP stages are evaluated using up-to-date historical records of streamflow at the Hillsborough River Morris Bridge U.S.G.S. gauge (Morris Bridge). The flow record is used to characterize the degree that streamflow has exceeded or fallen short of normal conditions over the previous 12 months. This gauge data, which is upstream of both the City of Tampa s intake from the Hillsborough River Reservoir and Tampa Bay Water s diversion point to the Tampa Bypass Canal system, represents long-term basin storage in the Hillsborough River watershed. This flow surplus/deficit value is known as the Rolling Median Deficit flow, abbreviated RMD-flow. The up-to-date 43
50 RMD-flow value is the second of four variables applied in the WSMP decision procedure at the beginning of each month. The period-of-record Morris Bridge flow data (1981 to 2010) is used to determine long-term median flow for each month of the year. These are considered normal flow values for each month of the year at Morris Bridge. At the beginning of a month, Morris Bridge flow measurements are obtained for the most recent 12 months (up through the previous month). Normal flow values are subtracted from each of these flow measurements. This subtraction produces monthly Morris Bridge flow surpluses or deficits over the previous 12 months, with positive values indicating surpluses and negative values indicating deficits. Finally, RMD-flow is calculated as the median of flow surplus/deficit values over the most recent 12 months. A.4.3 Rationale for Using the Median 12-Month Flow Surplus/Deficit Where RCD-rainfall is determined by summing monthly surplus/deficit values, RMD-flow is determined by calculating the median of monthly surplus/deficit values. Using a 12-month median prevents RMD-flow from being influenced by flow skewness. The median specifically handles cases in the historical record where short but extremely high-flow events are preceded and followed by persistent lower-than-normal flow conditions. For example, a flow surplus/deficit average or sum allows a large surplus in one or a few months to counteract many subsequent months of sustained flow deficits. As such, 12-month cumulative or average flow surplus/deficit calculations either understate the severity of subsequent deficits or indicate surplus conditions following the event, disguising the return of persistent flow deficits. On the other hand, the 12-month median flow surplus/deficit reveals the subsequent flow deficits. The median reflects the most common surplus/deficit values over the previous 12 months, filtering out extreme surpluses and deficits. When deficits outnumber surpluses before and after a high-flow event, 44
51 deficits continually outnumber surpluses through the 12-month period, reflecting the fact that the high-flow event provides no persistent flow replenishment/system storage. Also, note that because RMD-flow summarizes the relative prevalence of flow surpluses or deficits, it characterizes the entire 12-month flow history, even though it is a single surplus/deficit value taken from the previous 12-month period. When the RMD-flow is a deficit, this indicates that there are more monthly flow deficits than flow surpluses over the previous 12 months; indicating persistent flow deficits over the previous year. Conversely, a surplus RMD-flow can only be produced by occurrence of more flow surpluses than deficits over the previous 12 months. A.4.3 Calculating Surface Water Storage: Reservoir Elevation In addition to rainfall and streamflow, WSMP stages are evaluated using up-to-date measurements of reservoir water surface elevation, or water level (feet NGVD), in the C.W. Bill Young Regional Reservoir. Reservoir elevation is measured on the last day of the previous month; no further processing is necessary. Any given reservoir water level corresponds to reservoir volume and an equivalent number of days of SWTP supply (dividing reservoir volume by SWTP capacity) through a stage-storage relationship curve. A.4.4 Simulating Future Three-month Surface Water Storage: Reservoir Elevation In addition to data collection for rainfall, streamflow, and reservoir elevation on the last day of the previous month, forecasted reservoir elevation in three-month blocks of time need to be obtained through Tampa Bay Water in-house simulation models. Forecasted reservoir elevation in three-month blocks is obtained through RPEM simulations incorporating uncertain demand and flow outlooks over the next three months. Multiple pairs of flow and demand daily time series for the three-month period represent all possible scenarios. FMS2 and a multivariate disaggregation model are used to generate ensemble forecasts of daily streamflow at the Hillsborough River Morris Bridge gauge and the Alafia River at Bell Shoals Road. Flow conditions are passed to the surface water availability model to calculate water availability at the TBC, Alafia River and the reservoir. This information, combined with scenarios of demand forecasts, is then used as input to the RPEM to decide groundwater production, surface water withdrawal from each source and desalination production on a daily time scale. End-of-day reservoir elevation is one output from 45

52 the RPEM and the time series of daily reservoir elevation in the next three-month period corresponds to one pair of flow and demand combination. Hence, multiple time series of reservoir elevation representing the full spectrum of uncertainty/variability associated with demand/supply are obtained at the end. The 50 th percentile (median) of reservoir elevation at the end of the third month is one variable applied in the WSMP decision procedure at the beginning of each month. Figure A-5 shows an illustrative example of three-month reservoir elevation forecasting for March The blue line represents the 50 th percentile reservoir elevation for the three-month forecast period. Figure A-5: An illustrative example of forecasted reservoir level for the next three months. A.4.5 Seasonal-varying Reservoir Target Elevation A target level for the C.W. Bill Young Regional Reservoir for each calendar month is derived using historical reservoir levels to recognize seasonal-varying risk profiles of the surface water system. This 46
53 allows a certain reservoir level in different months to indicate the risk in surface water supply. For instance, a reservoir level of 110 ft. in May, which is the peak demand and dry season, does not indicate an eminent water shortage crisis as the summer rainy season is ahead. Whereas a reservoir level of 110 ft. in October, right after the rainy season ends, signifies a much different risk and may act as an indication of the region s entry into a severe water shortage condition. This underlying philosophy is in line with standard reservoir operation curves with changing target levels in different seasons adopted by water utilities. By recognizing seasonal-varying risk profiles, the updated WSMP captures potential risk of regional water shortage in different seasons. Reservoir stage elevations, corresponding to the 25 th and 10 th percentile of historical reservoir levels, were used to develop the reservoir target levels for triggering WSMP Stage III and Stage IV conditions, respectively (Figure A-6). The 25 th and 10 th percentile reservoir levels were selected based on the analysis of historic data analysis including reservoir operational protocols. The use of these percentiles will be evaluated in future updates to the WSMP. Tampa Bay Water s operational protocols for the surface water system includes a typical drawdown and refill cycle for reservoir operation. Drawdown of reservoir storage is typically targeted to occur in the dry and high-demand season, when permitted surface water flows are normally not available. The reservoir is normally refilled using higher river flows during the rainy season when permitted surplus flows are available. If the amount of surplus water available in the summer to replenish reservoir storage is insufficient, then there is a greater likelihood of insufficient surface water available in the upcoming dry season. The surface water supply system, hence, is in a higher potential risk of not meeting demand later in the next dry season. 47
 corresponds to 25 th percentile of historical data and water supply crisis curve (Stage IV) at the bottom is the 10 th percentile of reservoir elevation for")
54 Figure A-6: Seasonal-varying reservoir target level is defined based on historical data. Regional supply shortage curve (Stage III) corresponds to 25 th percentile of historical data and water supply crisis curve (Stage IV) at the bottom is the 10 th percentile of reservoir elevation for each calendar month. A.5 WSMP Water Shortage Stages The WSMP consists of four water shortage stages of increasing severity (Table A-1) defined by hydrologic triggers signaling both entry into and exit from each water shortage stage. Under normal conditions, the natural variability in seasonal rainfall and streamflow does not lead to a water shortage condition; therefore, no water shortage stage exists within the WSMP for normal hydrologic conditions. However, once the hydrologic triggers signal conditions associated with a given diminished hydrologic condition and/or subsequent water supply shortage, the first water shortage stage is triggered. Water shortage stages are based on the hydrologic triggers (measurements of RCD-rainfall, RMD-flow, reservoir elevation, and median forecast of reservoir elevation for a three-month period as described in Section A.4. 48
55 A Drought Alert (Stage I) is the first indication of a potential water shortage condition. In Stage I there is a shortage in rainfall or streamflow (but not necessarily both) as indicated by RCD-rainfall exceeding a 5-inch deficit or RMD-flow exceeding a 10 MGD deficit. Stage I conditions indicate that hydrologic conditions are either deteriorating, leading to a potential supply shortage, or have improved from more severe conditions. A Drought Warning (Stage II) is next level indicating severe hydrologic conditions; and if these continue, could lead to a water shortage condition. In Stage II there is a shortfall in both rainfall and streamflow as indicated by RCD-rainfall exceeding a 5-inch deficit and RMD-flow simultaneously exceeding a 10 MGD deficit, but reservoir storage is not impacted. This stage indicates that a loss of surface supply availability may occur requiring the use of storage. For exiting this stage, surface water flows must return to normal. A Regional Supply Shortage (Stage III) condition indicates an extreme water supply situation. In Stage III, a shortfall in streamflow is indicated by RMD-flow exceeding a 10 MGD deficit and reservoir storage is required to meet demands as indicated by the reservoir stage that could fall below 25 th percentile at the end of the three-month forecast period. This stage indicates that surface supply is compromised due to dry hydrologic conditions and may be lost altogether if those conditions persist. For exiting this stage, the reservoir storage must be recovering as indicated by a stage of 35 th percentile or greater. A Water Supply Crisis (Stage IV) is the most critical water shortage condition. In this situation, a prolonged shortage in streamflow (RMD-flow exceeding a 10 MGD deficit) and extended use of reservoir storage has produced near or total exhaustion of reservoir storage with stage predicted below the 10 th percentile at the end of the three-month forecast period. When this stage occurs, increased reliance on other water sources will likely need to occur. For exiting this stage, the reservoir storage must be recovering as indicated by a stage of 25 th percentile or greater. By defining water supply shortage using both loss in reservoir storage and streamflow, Stages III and IV can only be triggered if a water supply deficit exists in surface water flow and reservoir storage is low or critically low. 49
56 Water Shortage Stages ENTERING HYDROLOGIC and WATER SUPPLY TRIGGERS EXITING I. Drought Alert (Moderate) II. Drought Warning (Severe) III. Regional Supply Shortage (Extreme) IV. Water Supply Crisis (Critical) RCD Rainfall: deficit > 5 OR RMD Flow: deficit > 10 mgd RCD Rainfall: deficit > 5 AND RMD Flow: deficit > 10 mgd RMD Flow: deficit > 10 mgd AND Reservoir forecasts less than reservoir elevation defined by supply shortage curve RMD Flow: deficit > 10 mgd AND Reservoir forecasts less than reservoir elevation defined by water supply crisis curve RCD-rainfall:deficit eliminated and surplus created AND RMD-flow:deficit relieved to less than 5 MGD RCD-rainfall: deficit eliminated and surplus created OR RMD-flow:deficit relieved to less than 5 MGD RMD Flow; deficit < 5 mgd OR Both current AND forecasted reservoir levels above Stage III exit levels RMD Flow; deficit < 5 mgd OR Both current AND forecasted reservoir levels above Stage IV exit levels Table A-1: Triggers for entering and exiting the distinct water shortage stages A.6 WSMP Mitigation Actions Evaluation Effective mitigation strategies during the life of the existing WSMP helped guide Tampa Bay Water through different water shortage events. Demand-side mitigation potential is triggered due to tightening of water restrictions by order of the District based on Chapter 40D-21, F.A.C. These orders are often coincident with water shortage Stage III and IV declarations by Tampa Bay Water. Some supply-side mitigation occurs through Tampa Bay Water requesting District approval of temporary supply enhancements, e.g., increased withdrawal from the Alafia River, based on stage triggers and mitigation strategies in the approved WSMP. District approval is generally through executive director or water shortage emergency orders. This section evaluates potential water savings from tightening water restrictions (demand-side mitigation) and lists supply-side mitigation actions that could be taken in water shortage Stages III and IV. Benefits of those mitigation actions in mitigating the shortage and reducing groundwater 50
57 production from CWUP wellfields are demonstrated by the retrospective analysis and future scenario analysis. A.6.1 Evaluation of Water Restriction Tightening Water delivery data compilation Evaluation of water restriction tightening focused on single family (SF) residential use, as it comprises nearly half of total water delivery by Tampa Bay Water to its service area and seasonal changes indicate that most potable irrigation demand changes occur within this sector. In addition, only SF billing data for the study period from January 2000 to December 2013 had been gathered and was available for use in this WSMP update. This data includes; Member governments SF accounts and water use data by month during the study period. Figure A-7 shows aggregated SF accounts and water use data. The impact of the economic recession (December June 2009) is reflected in the decline of both variables during the time. Figure A-7: Single family accounts and water use for the study period Tampa Bay Water water shortage declaration and District water restriction tightening To evaluate if quantifiable water use difference is observed due to water shortage-based outdoor water use restriction tightening, regional District-based water shortage restriction data (e.g., number of days per week of outdoor water use) was compiled monthly. These water restrictions imposed by the District are based on water shortage phases defined by SWFWMD Chapter 40D-21, F.A.C. which is different from water shortage stage defined in Tampa Bay Water s WSMP. The water shortage phases in Chapter 40D-21, F.A.C. are monitored and triggered by the District based on regular monitoring 51
58 and processing of regional water resources and demand, including rainfall, levels in surface and ground waters, demands of permittees, and demand of water users not subject to permitting but subject to Chapter 40D-21, F.A.C. Without any declaration of water shortage, two-day per week outdoor water use is allowed in Tampa Bay Water s service area. When a Phase III or Phase IV water shortage is declared, specific water use restrictions and response mechanisms as set forth in 40D-21, F.A.C. (which includes reducing two-day per week outdoor water use to one-day per week outdoor water use) are required to be implemented by member governments. Although specific member government water restrictions, including days/hours and/or enforcement mechanisms, may differ from District rules/orders, this analysis assumes uniform District restriction implementation by each member government. Data limitations required this uniform examination of measurable relationships between water shortage restrictions enacted by the District and water use in the overall Tampa Bay Water service area. Member government-based analysis using other metrics may provide additional information for future implementation strategy development by those entities. Figure A-8 (a) shows water use restrictions enacted by the District and Figure A-8 (b) displays water shortage stages declared by Tampa Bay Water. When water shortage Stages III or IV are declared by Tampa Bay Water, the District often enacts tightening water restrictions. Note: Stage IV declared in 2013 by Tampa Bay Water was not due to hydrologic conditions, but primary due to reservoir renovation that reduced surface water availability. 52

")

59 (a) (b) Figure A-8: (a) Water shortage stage declared by Tampa Bay Water during WY ; and (b) water restrictions enacted by the District for the same time period. 53

60 In addition to member government SF accounts and water use and District water shortage restriction in number of days per week outdoor watering per week, the following data has also been collected: Weather data: Monthly average rainfall Monthly average maximum daily temperature Socio-economic data: Unemployment rate for Tampa-St. Pete-Clearwater Metropolitan Service Area Explanatory data analysis was conducted to evaluate the relationships, if any, between SF water use and variables of interest including SF accounts, temperature, rainfall and unemployment rate. Unemployment rate was use as a surrogate for local economic conditions. Explanatory data analysis results in Figure A-9 show the relationship between SF water use and variables of interest. The results indicate that increasing water use is positively correlated with increasing number of accounts and increasing temperatures and is negatively correlated with increasing rainfall and declining economic conditions. Figure A-9: Correlation between water use and variables of interest. 1 denotes one-day watering and 2 denotes two-day watering per week. 54
61 Monthly SF water use is normalized using total SF accounts and total number of days in the month to eliminate the effects of account number on total water use. Figure A-10 (a) below shows normalized water use in different calendar months and Figure A-10 (b) presents boxplots of normalized water use of one-day and two-day per week watering months. As expected, water use per account per day is the highest in May. The median use of two-day watering is 205 gallons per account per day, which is 3% less than that of one-day watering restriction. Figure A-10: Normalized water use (in gallons per day per account) (A-10a) and boxplots for one-day watering and two-day watering for SF accounts (A-10b). Multiple linear regression analyses were used to establish the relationship between normalized water use and monthly average rainfall, monthly average maximum daily temperature, unemployment rate and water restrictions (e.g., number of days per week outdoor watering allowed). Water restriction is treated as a categorical variable and an indicator variable is used to represent calendar month. For May, the fitted linear regression model for two-day watering per week is:
62 For one-day watering per week, the model is: Where WU denotes normalized water use in gallons per day per account, T represents monthly average maximum daily temperature; P is monthly average rainfall and Ur denotes monthly unemployment rate. The relationship between water use and all other attributes are well captured in the model. The difference between one-day restriction water use and two-day restriction water use; however, is not statistically significant. Therefore, no quantifiable savings in SF water use is found due to water use restriction increased from two-day to one-day per week. Additional analyses were undertaken to examine if a measurable relationship exists between water shortage restrictions enacted by the District and water use in the Tampa Bay Water service area, when accounting for reclaimed water use or household income. Water use with and without reclaimed water Water use data during the study period was segregated based on reclaimed water availability as an irrigation source. The number of accounts with reclaimed water in the Tampa Bay Water service area has increased from 43,000 to 65,000, with major increases in Pasco County and the Northwest Hillsborough water demand planning area. As of December 2013, SF water use for the accounts with reclaimed water was 12 MGD (65,000 accounts), compared to 90 MGD (450,000 accounts) for the accounts without reclaimed water. Figure A-11 (a) shows the comparison between the number of water accounts with reclaimed water and without reclaimed water at the end of the study period. Figure A-11 (b) compares SF water use (in MGD) between the two types of water accounts, where water use for those with reclaimed water is nearly 10% of total SF water use. 56

63 (a) (b) Figure A-11: (a) Water accounts with and without reclaimed water; (b) water use for SF homes with and without reclaimed water in TBW service area; Seasonal pattern in SF water use with and without reclaimed water is similar with peak use in May and the lowest in the summer rainy season. The variability in SF water use without reclaimed water, however, is larger. Further segregation of each subgroup based on water restrictions enacted by the District reveals that for SF accounts with reclaimed water (Figure A-12), the median use of one-day per week watering (184 gallons/day/account is 11% less than that of two-day per week watering (208 gallons/day/account). Minimal difference due to increasing water restrictions are observed for SF water use for those without reclaimed water. This indicates that water demand declines for potable accounts with reclaimed water with increased restrictions. Total potential for this is small, since SF water use with reclaimed water accounts for only about 10% of total SF water use in Tampa Bay Water service area. 57
64 (a) (b) Figure A-12: (a) seasonality of water use with reclaimed water and boxplots for one-day and two-day watering per week restrictions based on segregated data; (b) seasonality of water use without reclaimed and the boxplots for one-day and two-day watering per week restrictions based on segregated data. Effects of Income on Water Use Analysis To examine if a measurable relationship exists between water shortage restrictions enacted by the District and water use in the Tampa Bay Water service area when accounting for household income, SF water use data was first segregated by income level and each subgroup was then divided based on water restrictions. Since median household income at the census block group level is the finest spatial resolution income data available, it was used as an approximation for income at individual household level. The following five distinct income levels were used to group SF water accounts: Median Household Income (US Dollars) o Income level I: <25K o Income level II: 25K 50K o Income level III: 50K 75K o Income level IV: 75K 100K o Income level V: >100K Table A-2 lists the number of accounts and total water use for each group at the end of The numbers in parentheses in the second and third columns denote the relative percentage of water accounts and water use for each distinct income group. For the first three groups (income level I to 58
65 III), the relative percentage of accounts is larger than the relative percentage of total water demand for each group. The opposite is true for the two higher income groups. For instance, only 9% of water users fall into income level V but they consume nearly 13% of regional SF water use. This reflects difference in water use behavior and outdoor irrigation among distinct groups. Table A-2: water accounts and water demand-five levels of household income in six member governments of TBW. Group Water Accounts (% of Water Use (MGD) (% total SF accounts) of Total SF water use) Income level I 15,000 (3%) 2.3 (2%) Income level II 164,000 (37%) 25 (30%) Income level III 154,000 (35%) 28 (34%) Income level IV 80,000 (18%) 19 (23%) Income level V 40,000 (9%) 11 (13%) SF water use for each group is normalized by the number of accounts and days in each month to obtain water use in gallons per day per account. As shown in Figure A-13, a striking difference among the five groups is observed in the amount of water used per account, although the same seasonal pattern is preserved among all five income groups. Annual average demand for income level I is about 173 gallons per day per account (GPDPA), compared to 325 GPDPA for income level V. 59
66 Figure A-13: Boxplot of monthly water use (in gallons per day per account) for water users at different income levels. 60
67 Further analysis of segregated data based on watering restrictions provides insights on water savings potential for each group. For water accounts of income level I, the median of 1-day watering restriction water use is 176 GPDPA, which is 4% higher than 2-day watering restrictions. This shows increased watering restrictions has no visible effect on actual water use for such group. It is understandable that minimal to no outdoor watering exists for households of income level I during normal hydrologic conditions. Tightened formal watering restrictions are typically enacted by the District under dry and hot weather conditions. Outdoor water use would be expected to increase under such weather conditions, as reflected in the income level 1 water use. Negligible difference in 1-day watering restrictions and 2- day watering restrictions is observed for income level II data, while slightly reduced water use for 1- day watering restrictions occurs in income level III and level V (4% and 3%), respectively. Comparatively, increased water use for 1-day watering restrictions (4%) compared to 2-day watering was discovered for income level IV. This denotes that tightening water restrictions, only during periods of increased plant supplemental irrigation water need, doesn t lead to water demand reduction for this group. The difference illustrates the effect water restrictions have on water use of different income levels and reveals different water needs and water use habits in different socioeconomic strata. To increase the effectiveness of short-term demand management, members could investigate targeting public awareness programming based on median income and location. Data analysis of segregated historical demand data, based on income level, suggests potential saving for some levels of income groups. The District has imposed watering restrictions for the region including Tampa Bay Water s service area for many years. These analyses were conducted to determine how much reduction in demand can be expected to occur through implementation of enhanced District watering restrictions as hydrologic conditions deteriorate, given that this area has a year-round restriction on outdoor watering. Based on the analyses some key conclusions are: No quantifiable savings in SF water use due to water restrictions increasing from 2-day to 1- day. Water use seasonality is higher for users without reclaimed water. 61
68 Water demand for water users with reclaimed water declined with increased watering restriction, but regional saving potential is small. The effect of increased water restrictions on water use of different income levels varies. Income-related public awareness programming could be investigated by members to reduce regional demand. With implementation of water shortage based water restrictions, there is approximately a 1% reduction of demand regionally (accounted for in demand-side mitigation evaluations). A.6.2 Supply Side Mitigation Actions Supply-side mitigation actions to enhance water supply in water shortage Stages III and IV are identified in this section. At Stage III: Increase Alafia River withdrawals per District approval Tampa Bay Water is currently authorized to withdraw 10% of flows in the Alafia River when calculated baseline flows are greater than 92 mgd at Bell Shoals Road. If flows are above 82 mgd but below 92 mgd, Tampa Bay Water may withdraw the difference above 82 mgd. Temporary authorization by the District to increase withdrawals from 10 to 19% during water shortages, generally offers the least expensive, most readily-implemented supply enhancement alternative. This increase in withdrawal percentage from the Alafia River has been requested by Tampa Bay Water and granted by the District during the life of the existing WSMP. Once a Stage II drought warning declaration is made by Tampa Bay Water, a request for authorization to increase the percent withdrawal from the Alafia River from 10% to 19% will be made. Upon approval from the District, Tampa Bay Water will implement this authorization in a Stage III Supply shortage. Activate TBC Middle Pool for Harney Augmentation Tampa Bay Water also maintains a WUP which, during periods of low-flow in the Hillsborough River and when the Hillsborough River Reservoir elevation drops below 22.5 feet (full), allows water in the Tampa Bypass Canal Middle Pool to be pumped back into the Hillsborough River Reservoir. When this occurs, S161 diversions are not allowed and flow over or through the Hillsborough River Dam is 62
69 generally maintained at zero, except to meet the minimum flow required by the District. To alleviate low elevations in the Hillsborough River Reservoir and maintain City of Tampa supply, Hillsborough Reservoir Augmentation from the Middle Pool and Harney Canal is often performed, referred to as Harney Augmentation. The Harney Augmentation Water Use Permit (NO ) allows pumping water from the Middle Pool and Harney Canal, over S161, when certain low flow and reservoir conditions are met. This augmentation is normally continued at a rate not to exceed 40 MGD and 20 MGD 12-month annual average until the pool level reaches 12.0 ft. Typically, this action to begin augmentation of Hillsborough River Reservoir can happen prior to a Stage I drought warning. Under the WSMP emergency operation, its elevation can be further lowered to 10 ft. NVGD. This increases water availability for the City of Tampa to meet its demand. The WSMP implementation indicates that a request to the District be made during Stage II drought warning to allow the TBC middle pool to be lowered to 10 feet. Upon approval by the District, this would be activated when the pool reaches a level of 12 feet and at least a Stage II drought warning is declared. At Stage IV Activate TBC Lower Pool emergency operation The TBC Lower Pool is the primary source of Tampa Bay Water s supply availability from the TBC. Permitted withdrawals are defined by stored volume when the Lower Pool elevation is above nine feet; i.e., Tampa Bay Water is allowed to withdraw water as long as the Lower Pool elevation is kept above nine feet. During a Stage III water shortage, Tampa Bay Water will request authorization from the District to allow the pool level in the Lower Pool go to 7.5 feet. Upon approval from the District, Tampa Bay Water will implement this authorization in a Stage IV water supply shortage. A.6.3 Retrospective Analysis This section describes evaluation of both demand-side and supply-side actions in mitigating water shortage situations. Retrospective analysis using historical flow and demand data in the period of was conducted. The primary purposes of retrospective analysis are to: (a) validate the system operation tool simulation of water production from different sources; and (b) examine the benefit of mitigation strategies. System simulation with no activation of mitigation actions is defined as the no- 63
70 mitigation scenario and the retrospective analysis with mitigation actions is defined as the mitigation scenario. Figure A-14 (a) shows simulated water shortage stages in different colors, RCD-rainfall, and RMDflow for the simulation period for the no-mitigation scenario. As expected, rainfall and streamflow indicators are highly correlated (correlation coefficient of 0.80). For shortage Stages III and IV, both hydrologic indicators show low values of RCD-rainfall and RMD-flow. Figure A-14 (b) shows water shortage stages if proposed mitigation strategies had been implemented in the past. Based on these results, proactive mitigation actions can delay the start of a severe water shortage situation, leading to reduced duration of a Stage IV shortage. When the system recovers from the severe conditions, proactive actions, e.g., increased Alafia River withdrawal, result in a higher reservoir elevation reflected by a decrease in Stage III (regional water supply shortage) duration and an increase in Stage II (drought warning) duration. This lessening of Stage III duration is a positive regional outcome of supply mitigation. 64


71 (a) (b) Figure A-14: Panel (a) shows simulated water shortage stages for the year under a no-mitigation scenario; and (b) shows simulated water shortage stages for the year mitigation scenario. 65


72 Increased withdrawal from the Alafia River is one of the most effective mitigation supply actions, available to Tampa Bay Water as it enhances surface water production. Figure A-15 compares Alafia River withdrawals between the no-mitigation scenario and mitigation scenario. Increased withdrawals from the Alafia River, once approved by the District, are not activated until the system is under a regional supply shortage (Stage III). In the mitigation scenario, average withdrawal from the Alafia River in Stages III and IV is increased by 45%, from 12.2 MGD to 17.9 MGD. It is worth noting that even with an increased withdrawal allowance in these conditions, flow availability does not always allow water to be pumped from the Alafia River. During the evaluated historical period, there was no available water for withdrawal from the Alafia River for 11 of the 52 months, under a water shortage event. Figure A-15: Comparison of Alafia River withdrawal between the no-mitigation scenario (dark line) and mitigation scenario (green line). Colored areas denote water shortage stage declaration over the time period At stages III and IV, increased Alafia River withdrawal, when allowed, is observed. To further examine if system operations are properly captured by the model, simulated Tampa Bay Water finished water delivery to the City of Tampa was compared to actual data. As shown in Figure A-16, consistency is observed between model simulation and actual delivery data. Most of the delivery of water from Tampa Bay Water to the City of Tampa occurs in Stage III and IV situations. From 2012 through 2016, the City of Tampa managed its own system without purchasing any finished water from Tampa Bay Water, primarily due to favorable hydrologic conditions indicated by RCD-rainfall and RMD-flow, as shown in Figure A

73 Figure A-16: Comparison of Tampa Bay Water s finished water delivery to the City of Tampa between model simulation and actual data. A.6.4 Future Scenario Analysis Stochastic daily demand and flow data for the year 2030 scenario were used to run the system operation model. For the WSMP future analysis, future annual average demands of 280 MGD or less were used to evaluate the implementation of the updated WSMP. Beyond a regional demand of 280 MGD, new water supplies are necessary to meet the increased demands. The length of different water shortage stages is normalized as percentage of occurrences by months in 100 years (each realization simulates 100 years of hydrologic variability), as shown in Figure 17 (a) for the mitigation scenario. Each boxplot is comprised of percentage values from 243 realizations. This is the total number of realizations for annual average demands of 280 MGD or less. The median percentage time of being in a Stage IV shortage is 26%, which is larger than other shortage stages. This reflects the severity of a Stage IV shortage, which takes longer for the system to recover, but occurs infrequently. This is validated by Figure 17 (b) which illustrates that the number of Stage IV shortage events is the least of all stages. Results presented in Figure 17 for the mitigation scenario 67
74 is similar to the no-mitigation scenario (not shown), which is consistent with retrospective analysis that mitigation actions may delay the start of a severe stage but not eliminate its occurrence. (a) (b) Figure A-17: Panel (a) boxplots of normalized percentage of water shortage stage over the 100-year simulation period for the mitigation scenario; Panel (b) boxplots of number of occurrences of different water shortage events for the mitigation scenario. 68
75 To examine the benefits of mitigation strategies in reducing groundwater production, characteristics of CWUP groundwater pumpage over 90 MGD on a 12-month running average basis is compared between the no-mitigation and mitigation scenarios. Results reveal that the potential risk of exceeding CWUP regulatory quantity limits is substantially reduced when supply actions are implemented as illustrated in the mitigation scenario. Figure A-18 (a) shows the scatterplot between annual average demand and percent of time the CWUP exceeds 90 MGD for all realizations without implementing mitigation strategies. For those scenarios with an annual average demand less than 235 MGD, there is no occurrence of CWUP pumpage over 90 MGD on a 12-month running average basis. With increasing demand, there is a greater chance for the 12-month average CWUP production to exceed 90 MGD during hydrologic drought events. Without implementing WSMP supply actions, the maximum percent of time when groundwater pumpage could exceed the regulatory limit of 90 MGD is 3.8%. Figure A-18 (b) provides these results when supply actions are implemented for the mitigation scenario. Compared to the no-mitigation scenario, there are significantly less number of realizations where groundwater pumpage over the CWUP regulatory limit is needed to meet demands during the hydrologic drought event. The number of realizations is reduced from 104 to 56. The maximum percent of time groundwater production could exceed the regulatory limit decreased from 3.8% to 3.3%. The number of realizations with a percent of time value over 2.0% is lessened from 11 realizations for the no-mitigation scenario to only 2 realizations for the mitigation scenario. Figure A-19 displays the median magnitude of CWUP exceedance events for all the realizations in both no-mitigation and mitigation scenarios. For each realization, the median groundwater pumpage over the regulatory limit of 90 MGD is calculated. The maximum of the median magnitudes across all the realizations in the no-mitigation scenario is 26 MGD, while the maximum pumpage over the 90 MGD regulatory limit in the mitigation scenario is 20 MGD. In addition, the number of realizations with a median groundwater pumpage over the regulatory limit greater than 10 MGD is substantially reduced from 18 to 6. This is due to water supply mitigation actions. There is nearly an 8% reduction in CWUP production during those periods of producing more groundwater during a hydrologic drought comparing the no-mitigation scenario with the mitigation scenario. 69
76 (a) (b) Figure A-18: Panel (a) shows the scatterplot between average annual demand and percent of time CWUP pumpage exceeds regulatory limit for all the realizations for the no-mitigation scenario; Panel (b) shows the scatterplot between average annual demand and percent of time CWUP pumpage exceeds regulatory limit for all the realizations for the mitigation scenario. 70
77 (a) (b) Figure A-19: Panel (a) shows the scatterplot between average annual demand and median magnitude of CWUP exceedance in each realization for the no-mitigation scenario; Panel (b) shows the scatterplot between average annual demand and median magnitude of CWUP exceedance in each realization for the mitigation scenario. 71
78 It is important to evaluate both the magnitude of CWUP groundwater pumpage over the regulatory limit of 90 MGD and duration of this event to analyze the effects of groundwater pumpage during hydrologic drought events. For each realization, the median duration of the groundwater pumpage event exceeding the regulatory limit is calculated and plotted. Figure A-20 (a) shows the median duration of the groundwater pumpage events across all the realizations for the no-mitigation scenario. Similar information for the mitigation scenario is shown in Figure A-20 (b). The maximum of median durations is 26 months for the no-mitigation scenario compared to a maximum of 20 months for the mitigation scenario. The number of realizations with median magnitude greater than 10 MGD is reduced from 13 for the no-mitigation scenario to 5 for the mitigation scenario. 72
79 (a) (b) Figure A-20: Panel (a) shows the scatterplot between annual average demand and median duration of CWUP exceedance events in each realization for the no-mitigation scenario; Panel (b) shows the scatterplot between annual average demand and median magnitude of CWUP exceedance events in each realization for the mitigation scenario. 73
80 A summary of the results for the future scenario is provided in Table A-3. For regional demands of less than 250 mgd the chance of needing additional groundwater over the 90 MGD 12-month running average during a hydrologic drought event is extremely rare (two realizations out of 243 realizations and for one realization only 0.5% of time). Table A-3: Summary of Mitigation Scenarios Regional Demands Percent of Time Average Magnitude Average Duration of (MGD) production over 90 of pumpage over 90 pumage over 90 MGD (%) MGD MGD (months) As demonstrated in the future scenario analysis, there is about a 3% chance a given realization model run could have an event greater than 10 months, while the likelihood any month having an exceedance, in all combinations of flow and demand scenarios for the year 2030 (model scenario described in Section A.6.4), is extremely low (0.17%). With implementation of proposed mitigation actions, the number of realizations that groundwater pumpage could exceed the CWUP regulatory limit under hydrologic drought events have been reduced to 56 out of 243 total. For those 56 realizations, one or multiple events in which groundwater pumpage of the CWUP is needed during hydrologic droughts occurred in each of the 100-yr long periods. The total number of events is 77. A.6.5 Environmental Impact Analysis Although the chance of occurrence is small, it is critical to understand and evaluate what, if any, environmental impact on wetland health is associated with those infrequent CWUP groundwater pumpage events more than the permitted quantity. Tampa Bay Water has an environmental monitoring program that monitors and evaluates wetland health. Wetland health in the CWUP wellfields can be evaluated by analyzing different wetland data, e.g., wetland plant community structure, species composition change over time, and water levels in the wetlands and underlying aquifers. Among those variables, groundwater levels at nearby surficial aquifer monitoring wells are 74
81 used as a surrogate indicator for wetland health condition, which is an agreed-upon metric between TBW and the District 5. Key questions and assumptions In the context of the environmental impact analysis for the WSMP update, the pre-event condition is defined as groundwater levels at OROP control points prior to the occurrence of a CWUP overproduction event. The post-event condition is defined as the groundwater levels at OROP control points during or after the CWUP over-production event. Event recovery occurs when the postevent groundwater levels are equal to pre-event levels. Based on the WSMP strategies identified in this report, the two key questions in this environmental impact analysis are: How long does it take groundwater levels to recover to pre-event condition? What is the maximum difference in groundwater levels between pre-event condition and postevent condition? Modeling framework and methodology As shown in Figure A-3, Tampa Bay Water s two modeling tools the Integrated Northern Tampa Bay Hydrologic Model (INTB) and the Unit Response Matrix (URM) were employed to conduct this analysis. Examining potential groundwater changes at OROP control points under a variety of weather conditions rather than certain rainfall scenarios is important to address the above-mentioned questions. Therefore, 1,000 rainfall scenarios covering the full ranges of dry and wet periods were pregenerated and used. The 1,000 rainfall scenarios and reference pumpage of 90 MGD CWUP production in each month, were used as input to the INTB to generate reference groundwater head time series for the 22-year simulation at 42 OROP control points. Available data for INTB calibration and validation is limited to this 22-year period. The URM was developed by Tampa Bay Water and has been approved for use by the District. It provides a time series of groundwater level drawdown at a certain location, usually a monitoring site, caused by pulsing at production wells. In this case, the URM was employed as a surrogate for the INTB model to examine potential groundwater level changes under different rainfall scenarios (Figure 5 Tampa Bay Water Operations Plan Update, Revised April
82 A-3). In simulating groundwater levels at OROP control points (Figure A-21) in response to identified CWUP over-production events, reference groundwater levels and different rainfall scenarios are used as input to the URM. Alternatively, the INTB model can be used to simulate groundwater levels under different rainfall scenarios. The primary reason of using URM rather than running INTB directly is to save computing time because one INTB model run with one rainfall and pumpage scenario is not trivial. To address specific questions raised here, even with parallel computing facilities at Tampa Bay Water, the computation time could add up to weeks. For seven of those control points, unit responses have not been determined and are not included in the URM. Therefore, these control point wells are not used in the following step-wise analysis. 76
.")
83 Figure A-21: Monitoring wells used (OROP control points). 77
84 STEP-WISE ANALYSIS 1. Produce lump sums of WSMP pumpage; WSMP pumpage is defined as the weekly CWUP production at individual wellfields being evaluated before, during and after any events where the 12-month average CWUP production exceeds 90 MGD. Such pumpage is a lump sum in RPEM simulated output of CWUP production. 2. Spatial disaggregation of the total CWUP production; This is needed to obtain production at the 11 individual wellfields. Specific analysis includes; a. Generation of weekly production at different wellfields- the CWUP production weekly pattern from 2008 was used and assumed to repeat in each future year. Although weekly production from each wellfield varies among different years, the general pattern has little change. Therefore, the 2008 CWUP weekly production pattern is used in the analysis. b. Weekly CWUP production of the over-production event, as well as groundwater production for the six years (if available) prior to the beginning of and up to 10 years after the end of the over-production event, are necessary to achieve spatial disaggregation. c. Developing event based groundwater levels- Different rainfall scenarios and reference pumpage are used as input to INTB model to derive reference head at CROP control points. Such reference head and weekly CWUP production obtain from step 2 are used as input to the URM. d. For each event when groundwater pumpage from the CWUP is over 90 MGD, there are 1,000 time-series of groundwater heads at each OROP control point produced which represent rainfall uncertainty. These 1000 time-series are analyzed to address the two key questions posed for environmental impact analysis outcomes. 3. Determine pre-event groundwater levels at OROP control points. The pre-event condition is defined as groundwater levels at OROP control points prior to the occurrence of a CWUP over-production event. Event recovery occurs when the post event groundwater levels are equal to pre-event levels. The median value of groundwater levels at each OROP control point, over a 6-year window ending at the beginning of an over production event, is used to represent pre-event conditions. This 6-year window method is consistent with methodology in District 78
85 Chapter 40D-8, which establishes minimum flows and levels for lakes, wetlands, aquifers, and rivers. However, the 6-year window effectively removes 10 events from further evaluation due their occurrence during the beginning of the simulation. The total number of events evaluated was reduced from 77 to Evaluate post-event groundwater levels at OROP control points. The post-event condition is defined as the groundwater levels at OROP control points after the CWUP over-production event. The 6-year window identified in step 4 is transformed into a 6-year moving window, which is how post event conditions are evaluated. The median value of groundwater levels at each OROP control point, over the 6-year moving window, is used to represent post-event condition. 5. Evaluate when event recovery occurs through groundwater levels at each OROP control point for each event with 1,000 rainfall scenarios. The post-event conditions at each OROP control point are compared to the corresponding pre-event conditions on a weekly basis. Event recovery occurs when the post-event groundwater levels at each OROP control point, evaluated with the moving weekly update to the 6-year median water level, is equal to the corresponding pre-event levels. 6. Calculate median event recovery time at each OROP control point for all CWUP production events. 7. Calculate median of the recovery times across all the OROP control points in step 7. This creates an overall representation of recovery time needed under different CWUP production events. 8. Determine maximum changes in groundwater levels at each OROP control point for each CWUP production event, under 1,000 different rainfall scenarios. The change in groundwater levels at every OROP control point between each pre-event condition and corresponding post-event condition, until it recovers, was examined. The maximum of these changes at each OROP control point for each CWUP production event was obtained to represent potential impact on groundwater levels. 79
86 This represents the overall potential impact on groundwater levels for all CWUP production events. The median of the maximum changes of water levels across different CWUP production events at a control point is used as a summary statistic. Results To illustrate results, the 67 evaluated events are ordered by length in months of CWUP groundwater pumpage exceeding the regulatory limit. Figure A-22 shows the recovery time for these events which are presented on the X axis in increasing order of event duration. The Y axis represents median recovery time in months across all OROP control points. To illustrate event duration increases by month, the first 12 colored areas represents 1- to 12-month long events. The last colored area denotes events with a duration over 12 months. As illustrated in the figure, the 25 th event is of CWUP groundwater pumpage over the regulatory limit for a duration of 5 months and a median recovery time of 9 months. Results indicate; An increasing trend in the median recovery time is observed with increasing event duration. For all events with a duration of less than 12 months, median recovery time is less than one year. There are 14 CWUP over-production events with a duration of less than 3 months, with the magnitude of groundwater pumpage ranging from 0.5 to 3.3 MGD. Median recovery time is 1-5 months. There are 19 CWUP over-production events with a duration of 4-6 months, the magnitude of groundwater pumpage ranges from 0.7 to 7.6 MGD. Median recovery time is between 1-10 months. There are 23 CWUP over-production events with a duration of 7-9 months, the magnitude of groundwater pumpage which ranges from 2.3 to 7.1 MGD. Median recovery time for those events is 3-10 months. For the seven events with a duration of months, the magnitude of groundwater pumpage for the event is larger than for the shorter duration events. The groundwater pumpage magnitudes range from MGD. Median recovery time for those events is 7-12 months. Only four events in which groundwater pumpage had durations greater than 12 months, (13, 14, 20 and 30 months). These over-production events were simulated to occur under extended extreme drought conditions where surface water is exhausted and groundwater becomes the primary supply source. These events are predicted to have groundwater pumpage magnitudes 80


87 between 8.4 to 13.6 MGD. Median recovery time ranges from 13 to 30 months, which is much longer for those events with shorter duration and smaller magnitude. Figure A-22: Median recovery time for 67 events which are presented on X axis and in the increasing order of event duration, ranging from one month to over 12 months. Table A-4 provides summary statistics for the median recovery time and median water level change between pre- and post-over-production event conditions. The median water level change in groundwater head increases with increasing duration and magnitude of CWUP groundwater pumpage over the 90 MGD regulatory limit event. The median water level change in groundwater heads is less than 1 foot for all possible events. 81
88 Table A-4: Summary statistics for median recovery time and median water level change between pre- and postover-production event conditions. Duration of CWUP Pumpage over Regulatory Probability of Occurrence in any month (%) Groundwater Pumpage Magnitude over Regulatory Limit Median recovery time (months) Median water level change between preand post-condition (feet) Limit (months) (MGD) > CONCLUSIONS Major findings from the Environmental Impact Analysis for CWUP groundwater pumpage over the regulatory limit of 90 MGD during hydrologic drought events are: Temporarily-increasing CWUP production over the regulatory limit would be a rare event (< 6 times/100(once every 133 years when regional demand reaches MGD) in an extended drought condition. The WSMP allows the agency to reduce the magnitude and number of over-production events and allows the Agency to manage recovery from an over-production events. The range of median change in groundwater levels for the 6-year moving window between pre- and post-over-production event is foot depending on the extent of the drought. For CWUP groundwater production over the regulatory limit events with a duration of less than 12 months, median recovery time for ground water levels at the control points less than 12 months. A.7 WSMP Decision Procedure At the beginning of each month, when all applicable data is available for use, a structured decision procedure is applied to determine which water shortage stage, if any, should be triggered for that month. The stage for an upcoming month is based on the stage of the previous month and the trigger conditions listed in Table A-1. The decision flowchart procedure is illustrated in Figure A-23. To assess the water shortage stage for the current month using the flowchart, the following steps are taken: 82
89 1. Determine initial status: Determine the previous month s water shortage stage, if any, and identify corresponding rectangular box on the flowchart as a starting location. 2. Collect data: Calculate RCD-rainfall and RMD-flow based on data through the end of the previous month and obtain reservoir elevation at the end of the previous month. Note that observed reservoir elevation is not used unless the region is in a Stage III or IV condition, which is also used as one of the water shortage stage exit conditions. 3. Model simulation (Skip this step if initial status is Stage I or II): Run regional performance evaluation model incorporating the future three-month demand and flow outlooks to obtain ensemble forecasts of reservoir elevation in a three-month projection. Calculate the 50 th percentile of reservoir elevation forecasts. 4. Move through tests: Within the flowchart, follow arrows leaving the starting location, evaluating any tests (YES/NO questions within numbered diamond boxes) as directed. If a test evaluates as TRUE, follow the YES arrow leaving that diamond box (and ignore the NO arrow). If a test evaluates as FALSE, follow the NO arrow leaving that diamond box (and ignore the YES arrow). Continue following arrows and evaluating tests until an arrow leads into a rectangular box. Once a rectangular box is achieved, stop. That rectangular box contains the water shortage stage for the new month (if any). 83

90 Figure A-23: WSMP Decision Procedure Flowchart. 84
91 A.7.1 Basic Application of WSMP Decision Rules Using WY Period During the period of WY , all four stages could have been triggered using this WSMP. The complete evaluation period (August 2005 May 2010), including values of RMD-flow, RCD-rainfall, reservoir elevation, median forecasts of reservoir elevation and triggered water shortage stages, is presented in Table A-5 and shown graphically in Figure A-24. The decision procedure is illustrated by examining how water shortage stages would have been triggered for several months during this period. Example A.1 WSMP Decision Procedure in August 2005 August 2005 was just before the drought started. Therefore, at the beginning of October 2005, no water shortage stage would have been triggered. To determine how this decision is made, we applied the WSMP decision procedure at the beginning of August 2005 (shown in the first row of Table A- 5). Determine initial status: Determine the previous month s water shortage stage, if any, and identify the corresponding rectangular box on the flowchart as a starting location. August 2005 had normal hydrologic conditions with no existing water shortage stage according to the WSMP (Column 2). The starting location is the Normal Condition box. Collect data: Calculate RCD-rainfall and RMD-flow based on data through the end of the previous month and obtain reservoir elevation at the end of the previous month. Note that the observed reservoir elevation is not used unless it is in Stage III or IV, which is used as one of water shortage stage exit conditions. End-of-August RCD-rainfall = inches (Column 3) End-of-August RMD-flow = MGD (Column 4) End-of-August Reservoir Elevation = feet (Column 5) Model simulation was skipped since the initial status was not Stage III or IV. Move through decisions: Within the flowchart, follow arrows leaving the starting location, evaluating any tests (YES/NO questions within numbered diamond boxes) as directed. Continue following arrows and evaluating tests until an arrow leads into a rectangular box. Once a rectangular box is 85
92 reached, stop. That rectangular box contains the water shortage stage to trigger for the new month (if any). The arrow leaving the starting location leads to Test 1: Is RCD-rainfall< -5 inches OR RMD-flow < -10 MGD? This test evaluation indicates we were not within this range because RCD-rainfall = inches at and RMD-flow = MGD at the end of August Follow the NO arrow leaving Test 1. The NO arrow leaving Test 1 leads back to the Normal Condition box. Since this is a rectangular box, stop. The results of Test 1 led to the Normal Condition box which, in this case, was the same as the initial status. The water shortage stage for September 2005 therefore does not change from August 2005: trigger no water shortage in September 2005 and remain outside of the WSMP. Example A.2 WSMP Decision Procedure in October 2005 The transition from September to October 2005 marked the beginning of water shortage conditions as defined by the WSMP, and it would have been determined at the beginning of October 2005 that Water Shortage Stage I would be triggered. To determine how this decision was made, the WSMP decision procedure was applied at the beginning of October 2005 (shown in the third row of Table A-5). 1. Determine initial status: Determine the previous month s water shortage stage, if any, and identify the corresponding rectangular box on the flowchart as a starting location. September 2005 had normal hydrologic conditions with no existing water shortage stage according to the WSMP (Column 2). The starting location is the Normal Condition box. 2. Collect data: Calculate RCD-rainfall and RMD-flow based on data through the end of the previous month and obtain reservoir elevation at the end of the previous month. Note that 86
93 the observed reservoir elevation is not used unless it is in Stage III or IV, which is used as one of water shortage stage exit conditions. End-of-August RCD-rainfall = inches (Column 3) End-of-August RMD-flow = MGD (Column 4) End-of-August Reservoir Elevation = feet (Column 5) 3. Model simulation was skipped since the initial status was not Stage III or IV. 4. Move through decisions. The arrow leaving the starting location leads to Test 1: Is RCD-rainfall < -5 inches OR RMD-flow < -10 MGD? This test evaluation determined that we were within this range because RCD-rainfall =-7.30 inches at the end of September Follow the YES arrow leaving Test 1. The YES arrow leaving Test 1 leads to Stage I box. Since this is a rectangular box, stop. The results of Test 1 led to the Stage I box which, in this case, is one stage more severe than the initial status. The water shortage stage for October 2005 therefore changes from to WSMP stage to Water Shortage Stage I. Example A.3 WSMP Decision Procedure in September 2006 The transition from August to September 2006 marked the end of the first two water shortage stages where a Stage III water shortage would have been triggered. During August 2006, a Stage II Water Shortage would have existed. At the beginning of September 2006, it would have been determined that a Water Shortage Stage III should be triggered. To determine how this decision was made, the WSMP decision procedure was applied at the beginning of September Determine initial status. August 2006 was a Stage II condition (Column 2). The starting location is the Stage II box. 87
94 2. Collect data. September RCD-rainfall = inches (Column 3) September RMD-flow = MGD (Column 4) September Forecasted Reservoir Elevation = feet (Column 5) 3. Model simulation: Run system operational model incorporating forecasted three-month demand and flow uncertainty to obtain ensemble forecasts of reservoir elevation in a threemonth period. Calculate the 50 th percentile of reservoir elevation forecasts. Forecasted reservoir elevation at the end of three months, which is the end-of-november, = feet (Column 6) 4. Move through decisions. The arrow leaving the starting location leads to Test 4: Is RMD-flow < -10 MGD OR Forecasted reservoir level < Stage III entry reservoir level? Note as discussed earlier, entry reservoir level varies seasonally depending on the specific month, which is 105 ft. in evaluating this month. This test evaluates TRUE because RMD-flow is MGD and forecasted reservoir elevation is lower than Stage III entry reservoir level. Either of these condition warrants TRUE of Test 4. Follow the YES arrow leaving Test 4. The YES arrow leaving Test 4 lead to the Stage III box. Since this is a rectangular box, stop. Example A.4 WSMP Decision Procedure in November 2006 During October 2006, a Stage III water shortage would have existed. At the beginning of November 2006, it would have been determined that a Water Shortage Stage IV should be triggered. To determine how this decision was made, the WSMP decision procedure was applied at the beginning of November
95 1. Determine initial status. October 2006 was a Stage III condition (Column 2). The starting location is the Stage III box. 2. Collect data. November RCD-rainfall = inches (Column 3) November RMD-flow = MGD (Column 4) November Reservoir Elevation = feet (Column 5) 3. Model simulation: Run system operational model incorporating forecasted three-month demand and flow uncertainty to obtain ensemble forecasts of reservoir elevation at the end of three months. Calculate the 50 th percentile of reservoir elevation forecasts. Forecasted reservoir elevation in three months, which is the end-of-january, = feet (Column 6) 4. Move through decisions. The arrow leaving the starting location leads to Test 6: Is RMD-flow > -5 MGD OR both reservoir elevation and Forecasted reservoir level > Stage III exit level? Stage III exit level is 120 ft. in this case. This test evaluates FALSE because RMD-flow is MGD and the forecasted reservoir elevation is lower than Stage III exit reservoir level. Either of these condition warrants FALSE of Test 4. Follow the NO arrow leaving Test 6. The NO arrow leaving Test 6 leads to the Test 7: Is RMD-flow < -10 MGD AND Forecasted reservoir level < Stage IV entry reservoir level? This test evaluates TRUE because RMD-flow is MGD and the forecasted reservoir elevation is lower than Stage IV exit reservoir level. Follow the YES arrow leaving Test 7. The YES arrow leaving Test 7 leads to the Stage IV box. Since this is a rectangular box, stop. 89
96 The same four-step procedure was followed at the end of each month; conditions were reevaluated and tests were applied in the order listed on the flowchart to determine whether the water shortage stage should be maintained, relaxed, or increased. 90


97 Figure A-24: RCD-rainfall, RMD-flow and simulated water shortage stages during
98 Table A-5: RCD-rainfall, RMD-flow and simulated water shortage (WS) stages during water year Month Previous Month s WS Stage RCD RMD Previous Month s Reservoir elevation Forecasted reservoir elevation (3 months) Stage III entry reservoir elevation Stage IV entry reservoir elevation Stage III exit reservoir elevation Stage IV exit reservoir elevation Aug-05 None None Sep-05 None None Oct-05 None Nov Dec Jan Feb Mar Apr May Jun Jul Aug Sep Oct Nov Dec Jan Feb Mar Apr May Jun Jul Aug Current Month s WS Stage 92
99 Month Previous Month s WS Stage RCD RMD Previous Month s Reservoir elevation Forecasted reservoir elevation (3 months) Stage III entry reservoir elevation Stage IV entry reservoir elevation Stage III exit reservoir elevation Stage IV exit reservoir elevation Sep Oct Nov Dec Jan Feb Mar Apr May Jun Jul Aug Sep Oct Nov Dec Jan Feb Mar Apr May Jun Jul Aug Sep Oct Current Month s WS Stage 93
100 Month Previous Month s WS Stage RCD RMD Previous Month s Reservoir elevation Forecasted reservoir elevation (3 months) Stage III entry reservoir elevation Stage IV entry reservoir elevation Stage III exit reservoir elevation Stage IV exit reservoir elevation Nov Dec Jan Feb Mar Apr None May-10 None None Current Month s WS Stage 94
101 A.7.2 Preventing Rapid Oscillation in Water Shortage Stages Between Months As demonstrated in the above examples, the WSMP decision rules allow shortage stages to be triggered in response to changing flow, rainfall, and reservoir conditions (as defined in the triggers presented in Table A-1). However, these rules also ensure that triggered shortage stages advance or regress by, at most, one stage between months. Based on the triggers in Table A-1 alone, it is possible for flow, rainfall, and reservoir conditions to justify advancing or regressing more than one stage between months. For example, August 2006 was a Stage I condition. The RMD-flow deficit exceeded 10 MGD in the following month and the forecasted three-month reservoir elevation was less than the Stage III reservoir entry level. In September 2006, the data indicate that Stage III could have been triggered, skipping Stage II altogether. Such rapid movement is problematic as frequent, multi-stage jumps from month-to-month could confuse messaging efforts from a public information perspective and ultimately complicate the public s ability to respond appropriately to modified water use restrictions and requests for increased water conservation. To prevent this rapid movement, the WSMP decision process is designed to enforce a tapering rule, whereby water shortage declarations are restricted to progress upward or downward by at most one stage between months. Based on the data discussed above, Stage III would have been triggered for September 2006 instead of Stage II, since conditions warrant a water shortage stage higher than the previous stage; however, since water shortage stages can only advance or regress one stage per month, a Stage II condition was triggered. A Stage III declaration would have been allowed in October 2006 only if Stage III conditions were still in effect at the end of September. A.7.3 Comparing the updated WSMP and the original WSMP Figure A-25 compares water shortage stage that would have been triggered by the original WSMP and the updated WSMP for the years A few differences in the stage declarations between the two are evident in this figure. An earlier declaration of severe shortage stages, e.g., Stage III or IV, is observed in using the updated WSMP. As a specific example, Stage III is declared in September 2006 for the updated WSMP but it was declared two months later in November 2006 for the original WSMP. This is primarily due to shortage stage evaluation in the updated WSMP of the introduced variable forecasted reservoir elevation at the end of the three-month period. By so including 95
102 forecasted reservoir stage, the updated WSMP allows mitigation actions to proactively take place, the benefit of which has been demonstrated in the retrospective analysis in section A.6.3. In the existing WSMP, Stage III Water Shortage was declared for August to October 2008, which was between the two Stage IV periods. Such oscillation in shortage stages increases the likelihood of confused public information messaging efforts and could affect mitigation actions tailored for different stages. This confusion would be avoided by using the updated WSMP, owing to the two tests used to exit Stage III and Stage IV conditions included in the decision procedure flowchart. In examining exit conditions for the two severe stages, both current reservoir elevation and forecasted elevation in three months are compared to the exit reservoir level. This indicates that the system could exit the current month s stage if the supply system storage improved. Figure A-26 displays simulated reservoir usage and filling quantified in volume for each month during the simulation period, along with shortage stages that would have been declared using the updated WSMP. A Stage IV condition was not exited until October 2009 when reservoir filling occurred for the prior three consecutive months substantially improving surface water availability. 96


103 Figure A-25: Water shortage stages as would have been triggered during Water Year using the original WSMP and updated WSMP. 97

104 Figure A-26: Aggregated monthly reservoir usage/filling during simulation period
Water Shortage Mitigation Plan
 Water Shortage Mitigation Plan Table of Contents Section 1.0 Introduction...1-1 1.1 Background... 1-1 1.2 Revisions to Tampa Bay Water s Drought... 1-2 Mitigation Plan 1.3 Goals and Objectives of the WSMP
AGENDA ITEM C9 TAMPA WATER
 TAMPA WATER Supplying Water To The Region AGENDA ITEM C9 DATE: June 3, 28 TO: Gerald J. Seeber, General Manager FROM: Donald J. Polmann, Director of Science and Engineering SUBJECT: Regional Water Supply
AGENDA ITEM D6. Climate Outlook
 AGENDA ITEM D6 DATE: June 1, 2016 TO: Matt Jordan, General Manager FROM: Alison Adams, Chief Technical Officer SUBJECT: Regional Water Supplies and Member Demands Status Report SUMMARY: RECOMMENDATION:
Tampa Bay Water Drought Mitigation Plan
 Tampa Bay Water Drought Mitigation Plan December 2001 Tampa Bay Water Drought Mitigation Plan December 2001 Executive Summary Purpose The purpose of the drought mitigation plan (DMP) is to identify and
AGENDA ITEM. RECOMMENDATION: Receive Status Report.
 AGENDA ITEM C2 DATE: June 3, 13 TO: Charles H. Carden, Interim General Manager FROM: Christine Owen, Senior Manager Regulatory Compliance SUBJECT: Production Update and Hydrologic Conditions Report for
Planning Today For Water Tomorrow
 Planning Today For Water Tomorrow Planning ahead is always smart, especially when it comes to something as important as drinking water. The Tampa Bay region expects to gain half a million people by 2030,
Chapter Nine, Potable Water Subelement City of St. Petersburg Comprehensive Plan
 POTABLE WATER SUBELEMENT Chapter Nine, Potable Water Subelement Sections: 9.1.1 INTRODUCTION 9.1.2 GOAL, OBJECTIVES AND POLICIES ISSUE: Rehab/Upgrade of Potable Water Facilities ISSUE: Extension of Potable
Tampa Bay Water: A Case Study SRF National Workshop November 2, 2015
 Tampa Bay Water: A Case Study 2015 SRF National Workshop November 2, 2015 Who We Are New Port Richey Tampa St. Petersburg Agency Mission and Vision Mission: Tampa Bay Water reliably provides clean, safe
Comprehensive Plan for Unincorporated Hillsborough County Potable Water Element - DRAFT
 Results Neutral Revision Critical Findings Hillsborough County supplies residents with a managed potable water system of sufficient quantity and quality that meets current demand and future needs. This
WATER SHORTAGE RESPONSE PLAN. Tacoma Water
 WATER SHORTAGE RESPONSE PLAN Tacoma Water March 2005 TACOMA WATER WATER SHORTAGE RESPONSE PLAN TABLE OF CONTENTS PAGE Purpose of the Water Shortage Response Plan 1 Droughts and System Emergencies 2 Previous
Tampa Bay Water Long-Term Master Water Plan 2013
 Tampa Bay Water Long-Term Master Water Plan 2013 December 2013 Table of Contents Executive Summary ES-1 A. Section 1- Introduction and Overview ES-1 B. Section 2-Existing Facilities Inventory ES-2 C. Section
Water and Energy: Can we conserve both? Water Conservation: half-empty or half-full? Regional Webinar Series April 12, 2011
 Water and Energy: Can we conserve both? Water Conservation: half-empty or half-full? Regional Webinar Series April 12, 2011 Water and Energy: Can We Conserve Both- The View from the Water Supply Side Dave
Subsequent to these early efforts, the complexities associated with potable water provision have increased significantly.
 10.1 INTRODUCTION The reliable supply, treatment and distribution of potable water is vital to the health, safety and welfare of urban areas. The citizens and officials of the have long been involved with
Potable Reuse as an Alternative Water Supply. AWRA Conference Orlando, FL
 Potable Reuse as an Alternative Water Supply AWRA Conference Orlando, FL Who We Are New Port Richey Tampa St. Petersburg 100 percent groundwater pumped from 13 wellfields Tampa Bay Water History Integrated,
Potable Water Supply, Wastewater & Reuse Element
 Potable Water Supply, Wastewater & Reuse Element GOAL ONE: HIGH QUALITY AND AFFORDABLE POTABLE WATER WILL BE AVAILABLE TO MEET THE EXISTING AND PROJECTED DEMANDS OF PINELLAS COUNTY UTILITY CUSTOMERS. 1.1.
WATER SHORTAGE CRITERIA COMPARISON
 PROGRAM COMPONENTS SFWMD SJRWMD SWFWMD Policy and purpose Protect resource from serious harm Equitable distribution of available water Minimize economic impact Provide advance knowledge of apportionments
Comprehensive Plan Update - Potable Water Section Planning Commission Workshop: November 10, 2014
 Comprehensive Plan Update - Potable Water Section Planning Commission Workshop: November 10, 2014 Application type Agency Review Comments Applicable Plan Sections Staff Planner Staff Recommendation Publicly
Illinois in Drought. June 19, 2012, Updated June 21, 2012
 June 19,, Updated June 21, Illinois in Drought The ISWS now considers central and southern Illinois to be fully in drought based on several impacts including the early season onset of reservoir drawdown
CHAPTER 40D-21 WATER SHORTAGE PLAN
 CHAPTER 40D-21 WATER SHORTAGE PLAN 40D-21.011 40D-21.031 40D-21.051 40D-21.211 40D-21.221 40D-21.231 40D-21.251 40D-21.275 40D-21.281 40D-21.331 40D-21.371 40D-21.391 40D-21.421 40D-21.441 40D-21.511 40D-21.531
Water Conservation Plan
 Water Conservation Plan Page 1 of 11 1 Water Conservation Plan for the City of Lawrence TABLE OF CONTENTS INTRODUCTION 3 WATER CONSERVATION PLAN. 4 LONG TERM WATER USE EFFICIENCY 4 Water Use Conservation
SOUTHERN WATER USE CAUTION AREA REVIEW
 COMPONENT Water Supply Mission Components The Southern Water Use Caution Area (SWUCA) was designated in 1992 to address declines in aquifer levels occurring throughout the groundwater basin. Due to growing
Chapter Nine, Potable Water Subelement City of St. Petersburg Comprehensive Plan
 POTABLE WATER SUBELEMENT Sections: 9.1.1 INTRODUCTION 9.1.2 GOAL, OBJECTIVES AND POLICIES ISSUE: Rehab/Upgrade of Potable Water Facilities ISSUE: Extension of Potable Water Facilities ISSUE: Level of Service
TABLE OF CONTENTS SECTION PAGE ATTACHMENT A: Drought Management Guidelines
 TABLE OF CONTENTS SECTION PAGE 1. INTRODUCTION... 1 Plan Goals and Description... 1 Historical Droughts... 2 Other Water Shortage Conditions... 3 2. WATER SUPPLY AND DEMAND... 4 Water Supply Availability...
Springfield Utility Board, Oregon Rainbow Water District, Oregon
 WATER MANAGEMENT AND CONSERVATION PLAN Springfield Utility Board, Oregon Rainbow Water District, Oregon August 2012 WATER MANAGEMENT AND CONSERVATION PLAN FOR SPRINGFIELD UTILITY BOARD AND RAINBOW WATER
ENHANCED SURFACE WATER SYSTEM: THE REGION'S FIRST ALTERNATIVE
 ENHANCED SURFACE WATER SYSTEM: THE REGION'S FIRST ALTERNATIVE AN IMPORTANT ALTER Since late 2002, Tampa Bay Water s state-of-the-art surface water treatment plant has provided high-quality drinking water
Notice of Proposed Rule
 Notice of Proposed Rule WATER MANAGEMENT DISTRICTS Southwest Florida Water Management District RULE NO.: RULE TITLE: 40D-21.011: Policy and Purpose 40D-21.031: Elements of the Plan 40D-21.051: Definitions
PEACE RIVER MANASOTA REGIONAL WATER SUPPLY AUTHORITY BOARD OF DIRECTORS MEETING December 5, 2018 ROUTINE STATUS REPORTS ITEM 1
 PEACE RIVER MANASOTA REGIONAL WATER SUPPLY AUTHORITY BOARD OF DIRECTORS MEETING December 5, 218 ROUTINE STATUS REPORTS ITEM 1 Hydrologic Conditions Report MEMORANDUM Project: Hydrologic Conditions Report
Framework for Evaluating a Complex Water Resources System Performance under a Changing Climate
 Framework for Evaluating a Complex Water Resources System Performance under a Changing Climate Tirusew Asefa, Ph.D., P.E., Tampa Bay Water, Clearwater, FL March 29, 2012 Davie, FL Contributors Nisai Wanakule
OPTIMIZED REGIONAL OPERATIONS PLAN ANNUAL REPORT FOR WATER YEAR 2001 SUBMITTED JULY 2002
 OPTIMIZED REGIONAL OPERATIONS PLAN ANNUAL REPORT FOR WATER YEAR 2001 SUBMITTED JULY 2002 OPTIMIZED REGIONAL OPERATIONS PLAN ANNUAL REPORT FOR WATER YEAR 2001 TABLE OF CONTENTS Page Number EXECUTIVE SUMMARY...v
AGENDA ITEM. RECOMMENDATION: Status Report. COST/FUNDING SOURCE: Fiscal Year 2013 budgeted funds. DISCUSSION:
 AGENDA ITEM A3a DATE: April 2, 2013 TO: Gerald J. Seeber, General Manager FROM: Michelle Biddle Rapp, Chief Communications Officer SUBJECT: Tampa Bay Water Spring Dry Season Outreach Campaign SUMMARY:
Model Drought Contingency Plans
 Model Drought Contingency Plans Table of Contents Model Drought Contingency Plan for Public Water Suppliers Model Drought Contingency Plan for Irrigation Districts Model Drought Contingency Plan for Wholesale
Central Florida has historically utilized
 FWRJ Leveraging Conjunctive Use to Develop a Cost-Effective Regional Alternative Water Supply Project Brian J. Megic, Oscar Vera, Kevin Felblinger, Deb Beatty, Michael Hudkins, Mark Addison, and Ted McKim
A Risk Management Framework for Evaluating Climate Change Impacts on Water Supply Reliability
 A Risk Management Framework for Evaluating Climate Change Impacts on Water Supply Reliability Jack C. Kiefer, Ph.D. PD--Sw025 PD Hazen and Sawyer, P.C. 1 Acknowledgements Alison Adams, Ph.D., Tampa Bay
Tampa Bay Water s Regional Drinking Water System and Environmental Resource Management Challenges
 Tampa Bay Water s Regional Drinking Water System and Environmental Resource Management Challenges American Water Resources Association 2016 Annual Conference November 16, 2016 R. McConnell, Tampa Bay Water
CHAPTER 3 Water Supply
 CHAPTER 3 3.1 WATER SUPPLY OVERVIEW This chapter describes the sources of water available to the City and MID. The chapter includes a description of each water source, including limitations, water quality
Drought Contingency Plan
 for San Jacinto River Authority Lake Conroe Division Prepared by San Jacinto River Authority Adopted: February 28, 2019 This page intentionally left blank. Table of Contents Table of Contents Section Page
City of Portsmouth Department of Public Works
 City of Portsmouth Department of Public Works August 2, 2018 Portsmouth Water Supply Status Report Overview The following Portsmouth Water Supply Status Report provides the Portsmouth Water customers an
CHAPTER 10 NATURAL GROUNDWATER AND AQUIFER RECHARGE ELEMENT
 CHAPTER 10 NATURAL GROUNDWATER AND AQUIFER RECHARGE ELEMENT Page 1 of 7 G:\Comp\Adopted Comprehensive Plans\15. Cylce 16-2 and 16-3\Elements not changed\ Groundwater & Aquifer A. OVERVIEW CHAPTER 10 NATURAL
DRAFT REGULATIONS IMPLEMENTING 25% CONSERVATION STANDARD
 DRAFT REGULATIONS IMPLEMENTING 25% CONSERVATION STANDARD On April 1, 2015, Governor Jerry Brown issued the fourth in a series of Executive Orders on actions necessary to address California s severe drought
Water Supply Outlook. Interstate Commission on the Potomac River Basin (ICPRB) 30 W. Gude Drive, Suite 450 Rockville, MD Tel: (301)
 30 W. Gude Drive, Suite 450 Rockville, MD Tel: (301)") Water Supply Outlook October 3, 2014 To subscribe: please email sahmed@icprb.org Interstate Commission on the Potomac River Basin (ICPRB) 30 W. Gude Drive, Suite 450 Rockville, MD 20850 Tel: (301) 274
Water Supply Outlook October 3, 2014 To subscribe: please email sahmed@icprb.org Interstate Commission on the Potomac River Basin (ICPRB) 30 W. Gude Drive, Suite 450 Rockville, MD 20850 Tel: (301) 274
AGENDA DOCKET FORM. RECOMMENDED ACTION: Receive update on the rate structure analysis and provide direction.
 AGENDA DOCKET FORM SUBJECT: RATE STRUCTURE ANALYSIS UPDATE Agenda Item No. Revised 11 Meeting Date: July 11, 2018 Resolution: No SUMMARY: Contra Costa Water District (District) is conducting a comprehensive
POTABLE WATER ELEMENT
 Goal 4.0. Provide current and future residents of the County's utility service areas, and large users of the regional raw water system a cost-effective and equitable potable or raw water supply system
A Robust Water Supply System:
 A Robust Water Supply System: Incorporating Climate Variability, Climate Change & Uncertainty in Decision Making Tirusew Asefa Ph.D., P.E., D.WRE Co-Chair, Florida Water Climate Alliance (www.floridawca.org)
CITY AND BOROUGH OF WRANGELL WATER SHORTAGE MANAGEMENT PLAN
 CITY AND BOROUGH OF WRANGELL WATER SHORTAGE MANAGEMENT PLAN SECTIONS: Findings Purpose and Intent Waste of Water Prohibited Authorization Action for Hydrological Shortage Action for Emergency Shortage
Drought Management in PA And Current Conditions
 Drought Management in PA And Current Conditions DRBC WMAC October27, 2016 Hoss Liaghat, P.E. Presented to an advisory committee of the DRBC. Contents should not be published or re-posted in whole or in
Lower Rio Grande Water Users Organization Water Symposium June, 2007 Jorge A. Garcia, Ph.D., P.E. Utilities Director
 Water Planning, Infrastructure Development and Conservation Lower Rio Grande Water Users Organization Water Symposium June, 2007 Jorge A. Garcia, Ph.D., P.E. Utilities Director The census listed 12,325
DEFINITION OF TERMS AND ACRONYMS 31 TAC EFFECTIVE DECEMBER 8, 2016
 DEFINITION OF TERMS AND ACRONYMS 31 TAC 357.10 EFFECTIVE DECEMBER 8, 2016 The terms and acronyms used in this guidance document as defined in 31 TAC 357.10 have the following meanings: 1. Agricultural
Special Publication SJ2004-SP27. Affordability Analysis of Alternative Water Supply
 Special Publication SJ2004-SP27 of Alternative Water Supply of Alternative Water Supply Technical Memorandum February 9, 2004 TABLE OF CONTENTS Section Page EXECUTIVE SUMMARY i A. Background and Scope
Ithaca Area Intermunicipal Cooperation NYAWWA Conference. Chris Bordlemay Padilla Cornell University Water Manager 4/27/17
 Ithaca Area Intermunicipal Cooperation NYAWWA Conference Chris Bordlemay Padilla Cornell University Water Manager 4/27/17 Three Water Purveyors in Ithaca Area Cornell University City of Ithaca Bolton Point
Overview of the Draft 2010 Water Supply Assessment Report. Suwannee River Water Management District
 Overview of the Draft 2010 Water Supply Assessment Report Suwannee River Water Management District Elements of the Water Supply Assessment SRWMD 2010 Water Supply Assessment Statutory Requirements Water
Drought Hazard Annex. Causes and Characteristics of Drought
 Drought Hazard Annex Causes and Characteristics of Drought A drought is a period of drier than normal conditions that results in water- related problems. 1 Drought occurs in virtually all climatic zones,
MUNICIPAL WATER CONSERVATION PLAN FOR THE CITY OF CHANUTE JUNE 2010
 MUNICIPAL WATER CONSERVATION PLAN FOR THE CITY OF CHANUTE JUNE 2010 Municipal Water Conservation Plan For the City of Chanute TABLE OF CONTENTS INTRODUCTION LONG TERM WATER USE EFFICIENCY Water Use Conservation
A. POTABLE WATER SUB-ELEMENT GOAL I-1: STRIVE TO PROVIDE HIGH QUALITY POTABLE WATER TO CURRENT AND FUTURE RESIDENTS AND VISITORS.
 A. POTABLE WATER SUB-ELEMENT GOAL I-1: STRIVE TO PROVIDE HIGH QUALITY POTABLE WATER TO CURRENT AND FUTURE RESIDENTS AND VISITORS. Objective I-1.1 Water Supply Planning Walton County shall develop and maintain
A Path to Resilient Water Resources
 Water Resources Management A Path to Resilient Water Resources Jason M. Bird CH2M August 17, 2017 (8:30-9:30 am) Tampa Convention Center Tampa, Florida About Presenter Jason Bird - Principal Technologist
Model Drought Management Plan and Response Ordinance
 Model Drought Management Plan and Response Ordinance (Provided by the South Carolina Department of Natural Resources as required by the South Carolina Drought Response Act of 2000.) Contents Drought Management
Tampa Bay Water. Special District Public Facilities Report
 2575 Enterprise Road, Clearwater, FL 33763-1102 Phone: 727.796.2355 / Fax: 727.791.2340 www.tampabaywater.org Tampa Bay Water Special District Public Facilities Report March 1, 2017 Special District Public
APPENDIX B. LOWER COLORADO RIVER AUTHORITY DROUGHT CONTINGENCY PLAN RULES FOR WATER SALE CONTRACTS December 2013 TABLE OF CONTENTS
 APPENDIX B LOWER COLORADO RIVER AUTHORITY DROUGHT CONTINGENCY PLAN RULES FOR WATER SALE CONTRACTS December 2013 FORWARD TABLE OF CONTENTS Chapter 1: Purpose and Authority 1.1. Purpose.....4 1.2. Authority.....4
City of Dallas Water Utilities Drought Management Update. September 20, 2006
 City of Dallas Water Utilities Drought Management Update September 20, 2006 1 Briefing Purpose Provide an update on the current drought conditions and impact on the City s water supply, and obtain feedback
Water Shortage Response Plan Town of Beech Mountain, North Carolina April 5, 2010
 Water Shortage Response Plan Town of Beech Mountain, North Carolina April 5, 2010 The procedures herein are written to reduce potable water demand and supplement existing drinking water supplies whenever
Tampa Bay Water uses the results of the long-term forecast models for two primary purposes:
 AGENDA ITEM H3 DATE: December 2, 2013 TO: FROM: SUBJECT: Matt Jordan, General Manager Charles H. Carden, Chief Operating Officer Annual Demand Forecast Evaluation and Long-term Demand Forecast Update -
Water Supply Outlook. Interstate Commission on the Potomac River Basin (ICPRB) 30 W. Gude Drive, Suite 450 Rockville, MD Tel: (301)
 30 W. Gude Drive, Suite 450 Rockville, MD Tel: (301)") Water Supply Outlook June 2, 2015 To subscribe: please email sahmed@icprb.org Interstate Commission on the Potomac River Basin (ICPRB) 30 W. Gude Drive, Suite 450 Rockville, MD 20850 Tel: (301) 274 8120
Water Supply Outlook June 2, 2015 To subscribe: please email sahmed@icprb.org Interstate Commission on the Potomac River Basin (ICPRB) 30 W. Gude Drive, Suite 450 Rockville, MD 20850 Tel: (301) 274 8120
The Southwest Florida Water Management
 FWRJ Providing Minimum Flows to the Lower Hillsborough River and Sulphur Springs Run While Minimizing Impacts to Tampa s Potable Water Supply Brian D. Pickard, David W. Schoster, Mike Pekkala, Kenneth
DROUGHT MANAGEMENT AND WATER CONSERVATION IN CHARLOTTESVILLE AND ALBEMARLE COUNTY
 DROUGHT MANAGEMENT AND WATER CONSERVATION IN CHARLOTTESVILLE AND ALBEMARLE COUNTY Albemarle County Sewer Authority Gary Fern, P.E., Executive Director Rivanna Water and Sewer Authority Tom Frederick, P.E.,
FOR EXCEPTIONAL UTILITY PERFORMANCE
 A M WA P L AT I N U M AWA R D A P P L I C AT I O N FOR EXCEPTIONAL UTILITY PERFORMANCE Tampa Bay Water Utility Profile Tampa Bay Water supplies wholesale drinking water to Hillsborough County, Pasco County,
U.S. Geological Survey (USGS) Florida Water-Use Program
 Florida Water-Use Program") U.S. Geological Survey (USGS) Florida Water-Use Program By Richard L. Marella Florida Water Science Center - Orlando U.S. Department of the Interior U.S. Geological Survey USGS Florida Water-Use Program
U.S. Geological Survey (USGS) Florida Water-Use Program By Richard L. Marella Florida Water Science Center - Orlando U.S. Department of the Interior U.S. Geological Survey USGS Florida Water-Use Program
Partnerships Changing Water Management Challenges & Strategies. David MacIntyre Parsons Brinckerhoff
 Partnerships Changing Water Management Challenges & Strategies David MacIntyre Parsons Brinckerhoff Outline Introduction Regulatory Agency Partnerships Water/Wastewater/Stormwater Utility Partnerships
DROUGHT CONTINGENCY PLAN SUMMARY
 May 01, 2014 DROUGHT CONTINGENCY PLAN SUMMARY CANYON RESERVOIR Canyon Reservoir 8,200 surface acres -- Impounds 378,852 acre feet Conservation Pool Between 800 mean sea level (msl) and elevation of 909
AN ORDINANCE OF THE BOARD OF THE SOUTH GRANVILLE WATER AND SEWER AUTHORITY (SGWASA), NORTH CAROLINA
, NORTH CAROLINA") Water Shortage Response Plan Ordinance South Granville Water And Sewer Authority, North Carolina Originally Adopted January 8, 2008 Modified This August 10, 2010 AN ORDINANCE OF THE BOARD OF THE SOUTH
Water Shortage Response Plan Ordinance South Granville Water And Sewer Authority, North Carolina Originally Adopted January 8, 2008 Modified This August 10, 2010 AN ORDINANCE OF THE BOARD OF THE SOUTH
Executive Summary. ES-1 Water Resources Infrastructure for Apex, Cary, Morrisville, and RTP South
 Executive Summary Since the mid-1990s the Towns of Apex, Cary, and Morrisville, and Wake County have worked to develop and manage a flexible portfolio of water resources options. This approach is preferable
Hydrologic Basis for SLVWD Drought Management Plan presented to SLVWD Board of Directors March 6, 2014
 Hydrologic Basis for SLVWD Drought Management Plan presented to SLVWD Board of Directors March 6, 2014 by Nicholas M. Johnson, Ph.D., P.G., C.Hg. Principal Hydrogeologist, MWH SLVWD Service Areas SLVWD
M E M O R A N D U M. Workshop Discussion: Review of Results Neutral Crosswalk Methodology for Reforming the Comprehensive Plan Utility Elements
 M E M O R A N D U M DATE: April 14, 2015 TO: FROM: RE: Planning and Zoning Board Alaina Ray, Director Planning, Zoning and Building Department Workshop Discussion: Review of Results Neutral Crosswalk Methodology
AGENDA ITEM M6. DATE: August 3, 2015
 AGENDA ITEM M6 DATE: TO: Matt Jordan, General Manager FROM: Alison Adams, Chief Technical Officer SUBJECT: Science and Technology Activity Report for June 2015 and July 2015 SUMMARY: The Science and Technology
CHAPTER 2 TECHNICAL APPROACH 2 TECHNICAL APPROACH
 CHAPTER 2 TECHNICAL APPROACH 2 TECHNICAL APPROACH The approach used in the update of the County of Hawaii WUDP was documented in the Project Description, as required by the Framework. The Project Description
SOUTHEAST FLORIDA S RESILIENT WATER RESOURCES INCLUDING A CASE STUDY FOR THE CITY OF POMPANO BEACH
 SOUTHEAST FLORIDA S RESILIENT WATER RESOURCES INCLUDING A CASE STUDY FOR THE CITY OF POMPANO BEACH SOUTHEAST FLORIDA S WATER INFRASTRUCTURE IS VULNERABLE TO CLIMATE CHANGE THE WATER INFRASTRUCTURE IN FLORIDA
Water Supply Conditions Summary
 NJDEP Drought Warning Public Hearing October 20, 2016 Water Supply Conditions Summary Photo Credit: Photo: George George M. M. Aronson Aronson Drinking Water Supply Indicators Developed after 1999 drought
MEMORANDUM. RAI Responses Related to East Lake Road Wellfield Drawdown Analysis, WUP No SDI Project No. PCF-180.
 SDI Environmental Services, Inc. 13911 N. Dale Mabry Hwy. Suite 201, Tampa, FL 33618; (813) 961-1935 MEMORANDUM TO: FROM: SUBJECT: Dave Slonena, P.G., Pinellas County Cathleen Beaudoin Jonas RAI Responses
Aquifer Storage and Recovery: Implementation of a Drought Management Plan
 ABSTRACT & POWERPOINT PRESENTATION Aquifer Storage and Recovery: Implementation of a Drought Management Plan Roberto Macias Plant Manager San Antonio Water System San Antonio, Texas Managed Aquifer Recharge
A. POTABLE WATER AND GROUNDWATER RECHARGE WATER SUB-ELEMENT
 GOAL I-1: STRIVE TO PROVIDE HIGH QUALITY POTABLE WATER TO CURRENT AND FUTURE RESIDENTS AND VISITORS. Objective I-1.1 Water Supply Planning Walton County shall develop and maintain a Water Supply Facilities
Advanced Metering Infrastructure and Water Use Analytics
 Advanced Metering Infrastructure and Water Use Analytics NCAWWA/WEA Annual Conference November 13, 2017 Adam Sharpe Sarah Braman, Town of Cary Jeff Adkins, Town of Cary Presentation Overview Brief Summary
Appendix D Low Inflow Protocol for the Catawba River Basin
 Appendix D Low Inflow Protocol for the Catawba River Basin Attachment G - Low Inflow Protocol (LIP) for the Catawba-Wateree Project PURPOSE The purpose of this Low Inflow Protocol (LIP) is to establish
Comprehensive Plan Update - Stormwater Management Section Planning Commission Workshop: November 10, 2014
 Comprehensive Plan Update - Stormwater Management Section Planning Commission Workshop: November 10, 2014 Application type Agency Review Comments Applicable Plan Sections Staff Planner Staff Recommendation
3. Water Conservation Program
 3. Water Conservation Program The City of Tumwater s conservation program consists of both independent and regional cooperative efforts. Tumwater partners with the LOTT Alliance, the regional wastewater
Conn. Agencies Regs d-2 Preparation of plans and schedule for submission
 As of February 1, 2012 Conn. Agencies Regs. 25-32d-2 Preparation of plans and schedule for submission (a) Each water company supplying water to 1,000 or more persons or 250 or more consumers, and any other
Northern Tampa Bay Phase II Projects December 2004
 Northern Tampa Bay Phase II Projects December 2004 1999 Northern Tampa Bay II Objectives Expand and Improve Data Collection Evaluate Existing MFL Methods and Develop New MFL Methods Evaluate the Effects
Reservoir Drought Operations
 Reservoir Drought Operations Kevin J. Landwehr, P.E., D.WRE Chief, Hydrology and Hydraulics Branch 4 March 2013 Purpose Awareness of Drought Contingency Plans 2012/13 Reservoir Operations Drought Management
Volume II: Hazard Annex Drought
 Volume II: Hazard Annex Drought Causes and Characteristics of Droughts A drought is a period of drier than normal conditions that results in waterrelated problems. 81 Drought occurs in virtually all climatic
NJDEP Drought Management Overview October 27, 2016
 NJDEP Drought Management Overview October 27, 2016 Presented to an advisory committee of the DRBC. Contents should not be published or re-posted in whole or in part without the permission of the author(s)
Overview of the Draft 2010 Water Supply Assessment Report
 Overview of the Draft 2010 Water Supply Assessment Report Elements of the Water Supply Assessment SRWMD 2010 Water Supply Assessment Statutory Requirements Water Use Demand Projections Assessment of Current
Delaware River Basin Commission
 New York City Water Supply System is greater than 100 years old Provides water to 9 million people 1.3 billion gallons per day on average The Delaware System provides 50% of the City s water supply need
Water Supply Outlook. Interstate Commission on the Potomac River Basin (ICPRB) 30 W. Gude Drive, Suite 450 Rockville, MD Tel: (301)
 30 W. Gude Drive, Suite 450 Rockville, MD Tel: (301)") Water Supply Outlook April 2, 2019 To subscribe: please email sahmed@icprb.org Interstate Commission on the Potomac River Basin (ICPRB) 30 W. Gude Drive, Suite 450 Rockville, MD 20850 Tel: (301) 274 8120
Water Supply Outlook April 2, 2019 To subscribe: please email sahmed@icprb.org Interstate Commission on the Potomac River Basin (ICPRB) 30 W. Gude Drive, Suite 450 Rockville, MD 20850 Tel: (301) 274 8120
SLIDES: Status of Southern Nevada Water Authority (SNWA): Third Intake into Lake Mead and Groundwater Project
: Third Intake into Lake Mead and Groundwater Project") University of Colorado Law School Colorado Law Scholarly Commons Western Water Law, Policy and Management: Ripples, Currents, and New Channels for Inquiry (Martz Summer Conference, June 3-5) Getches-Wilkinson
University of Colorado Law School Colorado Law Scholarly Commons Western Water Law, Policy and Management: Ripples, Currents, and New Channels for Inquiry (Martz Summer Conference, June 3-5) Getches-Wilkinson
Appendix 3 MIA and Ridge Lakes Stakeholder Outreach Response and Results
 SOUTHERN WATER USE CAUTION AREA RECOVERY STRATEGY, FIVE-YEAR ASSESSMENT FY2007-2011 Appendix 3 MIA and Ridge Lakes Stakeholder Outreach Response and Results Executive Summary The SWUCA Recovery Strategy
Lake Texoma Water Management Frequently Asked Questions (FAQs)
") Lake Texoma Water Management Frequently Asked Questions (FAQs) Q1: Why is Lake Texoma so low? A1: A combination of factors is contributing to the current lake level. Even though there was substantial rainfall
Lake Texoma Water Management Frequently Asked Questions (FAQs) Q1: Why is Lake Texoma so low? A1: A combination of factors is contributing to the current lake level. Even though there was substantial rainfall
Dear Chair Marcus and Members of the Water Board:
 Chair Felicia Marcus and Members of the Water Board State Water Resources Control Board P.O. Box 100 Sacramento, CA 95812-0100 Sacramento, CA 95814 Dear Chair Marcus and Members of the Water Board: On
ARTICLE 10 WATER SHORTAGE CONTINGENCY PLAN 90
 ARTICLE 10 WATER SHORTAGE CONTINGENCY PLAN 90 5.1001 DECLARATION OF PURPOSE AND PRINCIPLES In accordance with Water Code 10632 requirements, Eastern Municipal Water District (EMWD) is responsible for conserving
Planning for Our Water Future: City of Santa Cruz & Soquel Creek Water District. September
 Planning for Our Water Future: City of Santa Cruz & Soquel Creek Water District September 2011 www.scwd2desal.org 1 Overview Background information on City of Santa Cruz and Soquel Creek Water District
Low Inflow Protocol for the Yadkin & Yadkin-Pee Dee River Hydroelectric Projects
 Low Inflow Protocol for the Yadkin & Yadkin-Pee Dee River Hydroelectric Projects GOAL The fundamental goal of this Low Inflow Protocol (LIP) is to take staged actions in the Yadkin- Pee Dee River Basin
DROUGHT RESPONSE PLAN DEVELOPED APRIL 2003 UPDATED MARCH 2018
 DROUGHT RESPONSE PLAN DEVELOPED APRIL 2003 UPDATED MARCH 2018 INTRODUCTION Drought can be defined as an extended period of below-average precipitation and/or stream flow that stresses a water supply. Drought
Water Supply FAQ August 11, 2015
 Water Supply FAQ August 11, 2015 1) What s the latest information on water supply? After the driest May-July on record, and in preparation of a potentially drier-than-normal fall, Tacoma, along with Everett
Santa Cruz Water Department: Water Resources, Conservation, and Water Shortage Contingency Plan. Santa Cruz Neighbors February 18, 2009
 Santa Cruz Water Department: Water Resources, Conservation, and Water Shortage Contingency Plan Santa Cruz Neighbors February 18, 2009 Presentation Overview Overview of City s Water Supply System Challenges