HYDRAULIC MODEL REPORT
|
|
|
- Eustacia Young
- 5 years ago
- Views:
Transcription

1 J0261 HYDRAULIC MODEL REPORT KENT COUNTY WATER AUTHORITY WEST WARWICK, RHODE ISLAND Prepared By: C&E Engineering Partners, Inc. 342 Park Avenue Woonsocket, RI June 2004 Printed on Recycled Paper
2 Table of Contents Section Page 1.0 Introduction Authorization and Purpose Project Background Overview of Study Acknowledgements Existing Water System Description General Service Area Distribution Pipelines Pressure Zones Sources of Supply Interconnections Storage Facilities Pumping Facilities System Demand Demand Allocation Zones Characteristics of Customer Consumption Supply/Demand Rates Hydraulic Model Development Representation of System Facilities Simulations Overview Average Day Simulation Maximum Day Simulation Peak Hour Simulation Model Calibration General 30 Appendix A Average Day Summary Results Pipeline Database Results Junction Node Database Results Appendix B Maximum Day Summary Results Appendix C Peak Hour Summary Results Appendix D Hydrant C-Value Test Results Appendix E Booster Pump Station / Well Station Pump Curves Appendix F KCWA Historic Hydrant Test Results Attachment No. 1 Model Node and Pipeline Plan (3 sheets)
3 1.0 Introduction 1.1 Authorization and Purpose The development of a computerized hydraulic model of the Kent County Water Authority s Supply, Transmission and Distribution System was completed by C&E Engineering Partners, Inc. (C&E) under authorization of the Kent County Water Authority (KCWA). The need for this project stems from the KCWA s desire to develop an accurate and representative hydraulic model of the water system in order to evaluate overall water system performance and operational techniques and to replicate the hydraulic capabilities of system operation. The purpose of the model development phase was to develop an accurate and calibrated hydraulic model of the major infrastructure facilities and pipelines of the water transmission and distribution system. This was accomplished utilizing a computer software program entitled WaterCAD Version 6.5. This program is intended for the design and analysis of pressure flow pipe distribution systems such as municipal water systems. The computational methods employed in WaterCAD were developed at Haestad Methods, Waterbury, Connecticut. 1.2 Project Background C&E was retained by the KCWA to develop an accurate, complete and representative hydraulic model of their water system, which would serve as a means to evaluate the overall system performance and operational techniques as well as replicate the hydraulic capabilities of system operation. The completed hydraulic model presented in this report is a tool that can be utilized in the future planning, current operation and maintenance, and emergency studies. Modifications to system facilities can also be evaluated using the model. Typical examples of model utilizations include: Future demand predictions on the existing system Investigating the sizing and routing of future pipelines Sizing and locating future pumping and storage facilities Determining the effects of improving pipelines (i.e. cleaning and lining pipes, replacing pipelines, etc.) Development of emergency operating procedures Investigation of source supply alternatives Removal of facilities from service for maintenance Evaluation of fire flow availability Analysis of interconnections with neighboring water systems Modifications of pressure zones The completed model is also ready for use in an extended period (i.e. hour-by-hour) simulation process. This type of analysis simulates the hydraulic behavior of water system facilities over a selected period of time in sequential time increments. For 1
4 example, the system can be viewed over a 24-hour period in time steps of one-hour increments. Hydraulic behaviors include changing system demand and movement of water storage volumes. The extended period simulation is extremely useful for detailed hydraulic analysis including system component sizing and operational modes. 1.3 Overview of Study The development of this hydraulic model consisted of investigation and research into the major hydraulic facilities, customer demands, and operating practices of the water system. The practices used in the development of this model include five major categories of activities that are further detailed within this report: 1. System operations 2. Demand zone allocation system 3. Junction node system 4. Pipeline system 5. Model calibration and simulation Production and consumption data from the last four (4) years was reviewed in order to determine consumer demand and flow data that was most representative of the existing water system. The completed hydraulic model accurately depicts the Average Day, Maximum Day, and Peak Hour conditions of the KCWA supply and distribution system. 1.4 Acknowledgements C&E wishes to acknowledge the information and assistance provided by the following individuals of the Kent County Water Authority during this project and without whose input the hydraulic modeling study could not have been accurately developed: Mr. Timothy Brown, P.E., General Manager and Chief Engineer Mr. John Duchesneau, Director of Technical Services Staff of the Water Department Billing Division We would also like to extend special thanks to the following individuals that provided invaluable assistance and countless hours of effort in verifying the water distribution system pipeline configuration. The effort from these individuals served to provide an accurate representation of the water distribution system that was portrayed in the completed model. Mr. Rick Burns, Chief of Facilities Mr. Robert Austin, Chief of Systems 2
5 2.0 Existing Water System Description 2.1 General Service Area The KCWA serves customers in the Towns of Coventry, East Greenwich, West Greenwich, and West Warwick and the City of Warwick. In addition, the KCWA serves customers in isolated areas of Cranston, North Kingston, and Scituate. There are approximately 26,000 service accounts (including residential, commercial/industrial, and governmental users) in these locales. Two primary sources of water supply for the KCWA system are wholesale interconnections through Providence Water and the City of Warwick (which also receives water from Providence Water) and groundwater from wellfields owned and operated by KCWA. KCWA s existing piping system consists of approximately 377 miles of water main with pipe sizes ranging from 2-inches to 24-inches in diameter (exclusive of customer service connections). For purposes of the model, transmission mains are defined as water mains of 16-inches or greater in diameter. Elevations throughout the KCWA water system range from 15 feet Mean Sea Level (MSL) along coastal areas to 400 feet MSL in West Greenwich in the southwestern portion of the system. There are two (2) main transmission booster pump stations and three (3) system booster pump stations in the KCWA system. The transmission pump stations boost water from the wholesale interconnections into the system while the system booster pump stations increase pressure in localized areas with high elevations to prevent these areas from experiencing low pressure problems. Based on historical data, the KCWA serves a residential population of approximately 60,000 people. A total of twenty three (23) of the largest water consumers (i.e. consumers that use upwards of several million gallons or greater per year) were identified and included in the model. A majority of the large users consist of residential entities (trailer parks, condominium associations, etc.), large industrial enterprises, hospitals, laundromats, etc. 2.2 Distribution Pipelines As previously indicated, the KCWA transmission and distribution system consists of approximately 377 miles of piping. All of this piping has been incorporated into the hydraulic model pipeline database, exclusive of customer service connections. Pipe sizes range in diameter from 2-inches to 24-inches. Generally, the pipelines were installed between the 1880 s to the present. A large portion of the pipes installed between 1880 and 1949 are unlined cast iron (CI). Asbestos cement (AC) or transite pipes were predominately installed between the late 1930 s and 1970 s. Polyvinyl chloride (PVC) pipes were generally installed from the late 1970 s to the late 1980 s while ductile iron (DI) pipes were installed between the late 1960 s and the present. 3
6 Although a majority of the piping system consists of CI, AC, PVC, or DI, there are some pipelines of small diameter (less than 4-inches) made of materials such as copper and galvanized iron. 2.3 Pressure Zones The KCWA water distribution system is divided into eight (8) pressure zones operating at varying hydraulic pressure gradients. Of these 8 pressure zones, three (3) service the majority of the KCWA service territory. These three (3) main pressure zones are the Low Service (334 ) Pressure Gradient, the High Service (500 ) Pressure Gradient, and the Intermediate High (430 ) Pressure Gradient. There are ten (10) water storage facilities maintaining the pressure gradients of the individual pressure service areas. Following is a brief description of each pressure zone, its primary method of operation and critical infrastructure components. Low Service (334 ) Pressure Gradient This zone is the primary pressure gradient of the KCWA water distribution system. It extends to the northern, southern, and western limits of the KCWA service area. The low service area is maintained at an approximate hydraulic grade of 334 feet MSL. There are six (6) water storage facilities operating within this pressure zone, which are supplied with water via groundwater sources and wholesale interconnections to Providence Water and the City of Warwick (also wholesaled through Providence Water). The major infrastructure facilities are as follows: Setian Lane (Crompton) Tank Seven Mile Road Underground Reservoirs* (Two Storage Reservoirs) Frenchtown Road Tank Tiogue Avenue Tank Wakefield Street Tank West Street Tank (currently offline) Mishnock Wells East Greenwich Well Spring Lake (Coventry) Well Clinton Avenue Pump Station (Providence Water wholesale interconnection) Bald Hill Road Pump Station (City of Warwick wholesale interconnection). * These reservoirs are online however they tend to remain locked up due to the influence from Clinton Avenue Pump Station and Tiogue Tank. The reservoirs are manually operated (i.e. opened to the water system at minimum once per week). This is the primary zone of the KCWA and serves to supply the majority of all source water to the system. Source water is generally boosted from this zone to supply the remaining pressure zones. This zone also extends geographically into the majority of the service territory of the KCWA. 4
7 The majority of the water supplied to this zone is from the Clinton Avenue Transmission Booster Pump Station facility. This facility rarely shuts down even during low flow periods at night. Currently, operation of the Clinton Avenue facility is controlled from the water level in the Tiogue water storage tank, which is set at an overflow elevation of 355 feet or approximately 21 (approximately 9 psi) feet above the 334 gradient. This tank is currently the control tank and is operated well below the overflow in order that the remainder of the system tanks can fluctuate. The Bald Hill Road Pump Station is manually controlled in response to water system demand(s). In addition, the Seven Mile Road Reservoirs are normally kept full or locked up due to the pump station head pressure influence and the proximity of the reservoirs to the Clinton Avenue Pump Station and Tiogue Tank. The reservoirs do not fluctuate during operation of the Clinton Avenue Pump Station facility and must be manually operated (partially drained) weekly to maintain water quality. This zone is also supplied with groundwater from the three (3) wellfields. The Mishnock and Spring Lake (Coventry) wells are on normal hand off / on operation whereby operators manually turn these facilities on and off locally at the facility as demand on the system dictates the need to run the wells. Normally, at least one of these well stations is in operation at all times. The East Greenwich well is operated in level response with the Frenchtown Road storage tank. In addition, there are near term improvement projects to increase the flow capacity of the Clinton Avenue facility as well as to isolate the Tiogue Tank from this pressure zone. The Clinton Avenue facility upgrade will also include new booster pumps to transfer water directly to the Read School House Road (RSHR) pressure zone. This will also include the addition of a new transmission main to the RSHR. The RSHR pressure zone will also be increased from 430 to 500 feet through the addition of a new storage tank with overflow elevation equal to 500 feet. Intermediate High (430 ) Pressure Gradient The intermediate high service area extends eastward from Read School House Road to Blackrock Road to the north of Route 117 in Coventry, Rhode Island. This pressure gradient is maintained at a hydraulic grade of 430 feet MSL. The Read School House Road Tank is the single, primary water storage facility operating within this pressure zone. Water is supplied to this area by hydraulically boosting the water from the 334 foot low pressure service area via the Knotty Oak Pump Station in order to fill the Read School House Road Tank. The Knotty Oak Pump Station is equipped with two (2) million gallon per day (MGD) pumps. Typically, one pump operates with the other as an in line backup. Operation of the pumps is rotated to promote even wear and reliability. As indicated previously, this pressure zone will be increased to 500 feet through several capital improvements slated for the near future. High Service (500 ) Pressure Gradient This pressure zone is maintained at a hydraulic grade of approximately 500 feet MSL. The high service area provides service to the 5
8 southern portion of West Warwick, areas south and east of Tiogue Lake in Coventry, the northwest portions of West Greenwich, and the western half of East Greenwich. The Technology Park Tank and the Carrs Pond Road Tank are operated within this pressure gradient. Water is supplied to this area via the Johnson Boulevard Pump Station. The Johnson Boulevard Pump Station, which contains one (1) MGD pump and two (2) MGD pumps can be set on level control with the Technology Park Tank or Carrs Pond Road Tank. A new booster pump station facility at the intersection of Route 2 and J.P. Murphy Drive was recently placed into service. This facility was installed to help meet the increasing water demands from the Amgen industrial facility in this portion of the system. Another booster pump station located at the Setian Lane Tank Site will be placed into service upon completion of the project in June This will add an additional 2.0 MGD pumping capacity into the 500-foot (High Service) gradient. Low Service Reduced (334 ) Pressure Gradient The low service reduced pressure gradient services the low lying coastal areas of East Greenwich, Apponaug in Warwick, then extending south to the North Kingstown Town line, from Narragansett Bay to Love Lane in Warwick, and to South County Trail in East Greenwich. There exist six (6) Pressure Reducing Valve stations controlling this pressure gradient that reduce water pressure from the low service area. These pressure reducing stations are in the following locations: Centerville Road Division Road Middle Road Cowesett Road Love Lane Post Road Generally, these facilities are controlled by the pressure set point on the downstream side of the Pressure Reducing Valve. The facilities are intended to operate at a hydraulic grade in the range of 270 feet MSL. Each PRV station is equipped with a check design feature whereby if the pressure on the inlet side drops below the preset downstream pressure the PRV will permit reverse flow. This is installed primarily as a safety design feature. Oaklawn (231 ) Pressure Gradient The Oaklawn pressure gradient services the Oaklawn section of Cranston and the extreme northeastern portion of West Warwick. This pressure area receives water from Providence Water via the Oaklawn Avenue wholesale interconnection. A 12-inch master meter records the flow through the interconnection supplying this portion of the KCWA system. Water is then received at a hydraulic grade of approximately 231 feet MSL. A new master meter facility with a 10-6
9 inch meter is currently being installed. There are no water storage facilities operating within the Oaklawn pressure gradient. High Service (500 ) Reduced Pressure Gradient The high service reduced pressure gradient services the extreme southwestern portion of West Greenwich as well as Wood Estates and Monroe Drive in Coventry. There are two (2) Pressure Reducing Valve stations that control this pressure gradient located on Mishnock Road and Helen Avenue. These pressure reducing stations reduce water from the high service area. Operation of these facilities is controlled by the pressure setting on the downstream pilot of the valve, which permits flow to be transferred to this location. The Mishnock Road PRV is set at an approximate hydraulic grade of 430 feet. The Helen Ave PRV is set at an approximate hydraulic grade of 435 feet. Warwick Tanks (232 ) Pressure Gradient The Warwick Tanks pressure gradient is a localized service area that is fed from the transmission main (owned by the KCWA) to the Bald Hill Road Pump Station, which is located between the Warwick Tanks and Kent County Courthouse. This pressure zone is maintained at a hydraulic grade of approximately 232 feet MSL. The Warwick Tanks total 12.0 million gallons in storage capacity that supplies the water main to the Bald Hill Road Pump Station. This pressure gradient also provides service to a small number of KCWA customers along Bald Hill Road in Warwick. Hope Road Booster Pressure Gradient The Hope Road booster pressure gradient provides water to 18 residences located along Hope Road in Cranston. This area is serviced from the low service pressure gradient via a booster pump station located on Hope Road. No water storage facilities operate within this pressure zone. The booster pump station is designed to pump water from the 334 gradient to approximately 510 feet. 2.4 Sources of Supply The KCWA maintains three (3) wellfields within its water supply system. A description of each groundwater supply source is provided below. Mishnock Wells The Mishnock Wells are located in Coventry, Rhode Island. The Mishnock Wellfield contains three wells with only one of the wells serving as an active production well (Mishnock Well No. 3). Mishnock Well No. 1 (350 gpm) currently serves as a stand by well for emergency purposes and Mishnock Well No. 2 has been abandoned and replaced by Mishnock Well No. 3. Mishnock Well No. 3 was installed in September 1999 and placed into service in March Eventually, Mishnock Well No. 1 will be replaced by an additional well (Mishnock Well No. 4) located in the same wellfield. Mishnock Well No. 3 consists of a gravel-packed well, which was constructed in 1999 by R.E. Chapman. The well is a total depth of 67.5 feet with 10 feet of stainless steel screen. There is a 700 gallon per minute (GPM) submersible pump which is designed to operate at 168 feet total dynamic head (TDH) discharging into an 8-inch ductile iron main. The 7
10 well now operates in the range of 500 gpm. Pumping history indicates that Mishnock Well No. 3 produces an average of approximately 218 million gallons of water per year. Spring Lake Well The Spring Lake Well is 79 feet deep with 15 feet of screen. This facility consists of a gravel-packed well constructed in 1960 by R.E. Chapman. The Spring Lake Well contains a 1,350 GPM vertical turbine pump designed to operate at 200 feet TDH discharging into an 8-inch ductile iron main. In 1998, the Spring Lake Well was redeveloped and re-screened at a smaller diameter. Currently, the well facility has been reduced in capacity to approximately 300 gpm due to excessive drawdown in the well casing. Pumping history for the Spring Lake Well indicates that it produces an average of approximately 85.6 million gallons of water per year. East Greenwich Well The East Greenwich Well was constructed in 1964 by R.E. Chapman. This well is 118 feet deep with 30 feet of screen. The East Greenwich Well is equipped with a 1,600 GPM vertical turbine pump with a rated capacity of 1,000 GPM at 407 feet TDH. The facility will produce 1,600 gpm when not restricted (i.e. wide open) but is typically throttled back to 1,100 gpm. This facility contains a diesel driven engine to provide stand by power to the well. The East Greenwich Well was redeveloped in Pumping history for the East Greenwich Well indicates that it produces an average of approximately 226 million gallons of water per year. 2.5 Interconnections The primary source of water supply for the KCWA is through wholesale interconnections through Providence Water and the City of Warwick (also indirectly through Providence Water). Following is a description of each wholesale interconnection. Clinton Avenue Pump Station The Clinton Avenue Pump Station, located in Scituate, Rhode Island, is the main source of water supply for the KCWA. This facility is fed via a 30-inch water main that is tied into Providence Water s 78-inch aqueduct. The pump station boosts water from the Providence system operating at a hydraulic grade of approximately 233 feet MSL to the KCWA s low service system, which operates at a hydraulic grade of 334 feet MSL. The Clinton Avenue Pump Station contains three 2,800 GPM (4.0 MGD) vertical turbine pumps and a 5,600 GPM (8.0 MGD) emergency backup pump. There is a 30-inch discharge main from the pump station, which diverges into a 20-inch and 16-inch transmission main outside the station on Clinton Avenue. The Tiogue Tank which is set at a higher overflow elevation than the remaining tanks in this zone forces the facility to operate at a somewhat higher TDH which reduces the output capacity minimally. 8
11 Pumping history for the Clinton Avenue Pump Station indicates that an average of approximately 2.47 billion gallons of water per year is produced by the facility. This accounts for approximately 70% of the total system demand for the KCWA system. Oaklawn Avenue Interconnection The Oaklawn Avenue interconnection is the second wholesale interconnection to Providence Water. It is located near the intersection of Oaklawn Avenue and Old Spring Road in Cranston, Rhode Island. Primarily, the Oaklawn Avenue interconnection services small portions of Cranston and West Warwick. There is a closed gate valve at the intersection of Providence Street and Wakefield Street in West Warwick isolating the interconnection from the KCWA s low service system. Water is supplied from the Oaklawn Avenue interconnection to the KCWA by gravity at a hydraulic grade of approximately 231 feet MSL. Historic master meter records for the Oaklawn Avenue interconnection indicate that an average of approximately 130 million gallons of water per year is supplied to the KCWA. Bald Hill Road Pump Station The Bald Hill Road Pump Station boosts water from a hydraulic grade of 232 feet MSL to 334 feet MSL. This facility is located at the intersection of Bald Hill Road and Centerville Road in Warwick. The Bald Hill Road Pump Station is equipped with three (3) 2,400 GPM centrifugal pumps and one (1) 2,100 GPM centrifugal pump. The source of this water supply originates from the 102-inch aqueduct that feeds the 78-inch aqueduct that is owned and maintained by Providence Water. The pumping history for one year (September 2001 to August 2002) indicates that an average of approximately 490 million gallons of water per year was supplied by the City of Warwick at the Bald Hill Road Pump Station interconnection. Potowomut Interconnection (Wholesale) The KCWA wholesales water to the City of Warwick via the Potowomut interconnection. The Potowomut interconnection is located on LaForge Road in Warwick. This interconnection services approximately 950 residents. Historical records from September 2001 to August 2002 for the Potowomut interconnection indicate that an average of approximately 76.1 million gallons of water per year are wholesaled by the KCWA to the City of Warwick. 2.6 Storage Facilities The KCWA water supply system consists of ten (10) water storage facilities. The West Street Tank is currently offline. In addition, the Seven Mile Road Reservoirs (Fiskeville Tanks) are routinely isolated from the system due to hydraulics and their proximity to the Clinton Avenue Pumping Station facility. The storage facilities are described as follows: 9
12 NAME TYPE MATERIAL YEAR CONSTRUCTED VOLUME (GAL) MAX ELEV. (FEET MSL) Setian Lane / Reservoir Steel Circa ,000, Crompton Seven Mile Reservoir Reinforced 1944, ,500, Rd. (No. 1 & No. 2) concrete (combined) Frenchtown Reservoir Concrete ,500, Rd. Tiogue Ave. Reservoir Steel , Wakefield St. Reservoir Concrete ,000, West St. Reservoir Steel ,000, Read School Reservoir Steel ,500, House Rd. Technology Elevated Steel ,500, Park Carrs Pond Rd. Spheroid Reservoir Concrete ,000, As previously indicated the KCWA has a capital improvement project scheduled for the Clinton Avenue Pump Station. This also includes efforts to increase the local carrying capacity of the water mains in this general area by pipeline replacements with larger mains. As a result of these improvements, the station will increase flow capacity and remove the Tiogue Avenue Tank as the control tank for the facility. A project is planned to localize the area in and around the Tiogue Tank such that the pressure gradient will be maintained with the actual overflow elevation of the Tiogue Tank. Another, as yet undetermined, low service storage tank will then be utilized to control the operation of the Clinton Avenue facility. The upgrade of this facility will also include new booster pumps, which will be designed to boost water into the Read School House Road Pressure zone. This will also include increasing the hydraulic grade from 430 to 500 feet. This will also necessitate construction of a new water storage tank in the RSHR zone to accommodate this increase in hydraulic grade. The Knotty Oak Pump Station will likely be obsolete or serve as an emergency backup as a result of these future improvements. 2.7 Pumping Facilities The KCWA owns and operates three (3) system booster pump stations and two (2) transmission booster pump stations. Following is a brief description of each pumping facility. Knotty Oak Booster Pump Station (System Booster Pump Station) The Knotty Oak Booster Pump Station is equipped with two (2) 1,300 GPM pumps and is also equipped with an emergency generator. This pumping facility boosts water from the low service zone to the Read School House Road high service zone. 10
13 Johnson Boulevard Booster Pump Station (System Booster Pump Station) The Johnson Boulevard Booster Pump Station was constructed in order to supply the high service pressure gradient that includes the Technology Park, Arnold Road, Mishnock, and Wood Estates areas of Coventry, East Greenwich, West Warwick, and West Greenwich. This facility contains three vertical turbine pumps. There is one (1) 1,200 GPM pump operating at 175 feet TDH and two (2) 2,300 GPM pumps operating at 208 feet TDH. Emergency power is also provided at this booster pump station. Operation of this facility is controlled from the Technology Park tank. Hope Road Booster Pump Station (System Booster Pump Station) The Hope Road Booster Pump Station is equipped with two (2) pump and hydro pneumatic tank arrangements. No permanent stand by power is available at this facility however; the station is fitted with an auxiliary power connection (plug in receptacle for portable generator) for use with a portable generator system. The Hope Road Booster Pump Station was designed to support a customer base of 18 residences located along Hope Road in Cranston. This was extended to an additional home making 18 residences served by this pump station. Clinton Avenue Pump Station (Transmission Booster Pump Station) The Clinton Avenue Pump Station serves as the primary interconnection to Providence Water as well as a pump station that boosts water from the Providence Water system to the KCWA low service area. The pump station contains three (3) 2,800 GPM vertical turbine pumps and one (1) 5,600 GPM emergency backup pump. Bald Hill Road Pump Station (Transmission Booster Pump Station) The Bald Hill Road Pump Station is an interconnection with the City of Warwick. Water from this interconnection is also obtained from Providence Water. This facility transports water from the City of Warwick to the KCWA water system. The facility contains three (3) 2,400 GPM centrifugal pumps and one (1) 2,100 GPM centrifugal pump. The pump station also has an emergency generator that is capable of operating three pumps during a water supply emergency. 11
14 3.0 System Demand 3.1 Demand Allocation Zones A proper allocation and accounting of consumer water system demands is crucial to the development of an accurate hydraulic model. The demand allocation zones are a method that applies the realistic distribution of consumer system demands to the hydraulic model database. The demand allocation zones correlate the water consumer demands in each portion of the service territory to a particular demand situation (i.e. average day, maximum day, and peak hour). To establish and allocate the water demands, the service territory was divided into smaller sections referred to as demand allocation zones. The KCWA water distribution system consists of seven (7) cities and towns. In this hydraulic model, each city and town was designated and tracked as a particular demand allocation zone. The hydraulic model therefore contains seven (7) such demand allocation zones. The demand data from water meter records for each city and town was incorporated into each demand allocation zone. The following table depicts the designated demand allocation zones: DEMAND ALLOCATION ZONE TOWN 1 West Warwick 2 Warwick 3 West Greenwich 4 East Greenwich 5 Cranston 6 Scituate 7 Coventry The KCWA provided consumer demand information for all the customer accounts in the water system. This information was provided in the form of consumption data totaling the metered use by each street in each city and town for four (4) years from 1999 to A typical billing cycle (year) for the KCWA begins on September 1 and ends on August 31. In addition, consumption data for the system s twenty (20) largest users was also provided for the similar four (4) year period. For the purpose model development, the consumption data from the time period of September 1, 2001 to August 31, 2002 was utilized. This time period was selected for the model base year because of the completeness of the data and due to the fact that the consumer demands best represented the system s water consumption. The water consumption per demand zone was developed by utilizing the total consumption per street throughout the service territory and the total consumption per large user for the time period of September 1, 2001 through August 31, The following table depicts the breakdown of the consumption totals for the water demand zone allocation for the KCWA water supply system. 12
15 DEMAND ALLOCATION ZONE TOWN / CITY TOTAL ANNUAL USAGE (GAL) 1 West Warwick 888,064,047 1, Warwick 649,312,545 1, West Greenwich 116,041, East Greenwich 784,535,993 1, Cranston 100,122, Scituate 33,720, Coventry 860,640,176 1, TOTALS 3,432,436,987 7, AVG. DAY + UNMETERED (GPM) The total annual usage from the table above corresponds to an average day rate of 9.40 million gallons per day (MGD). The percentage of unmetered water in the system was determined to be 9.53% that had to be added to the consumption demand data to account for water that is not billed. Adding this unmetered demand brings the total average day demand to MGD. A further detailing of the method by which unmetered water was computed is provided in following sections. The MGD served as the base demand for the average day system demand that was utilized in the model. It should be noted that the above demands also include the large users. The large users are included and have been individually identified within each demand zone. Below is a table of the large users with their usage and corresponding demand zone. SYSTEM LARGE USERS TOTAL ANNUAL USAGE DEMAND ZONE LOCATION (GAL) Riverpoint Lace Works 24,491,764 1 Soluol Chemical Co. 11,335,192 1 Bradford Soap Works 8,660,942 1 WWW Realty Assoc. 10,364,512 1 Kent County Hospital 36,521,743 2 Cowesett Hills 20,023,960 2 Cowesett Hills Assoc. 19,275,960 2 Briarwood Meadows 19,051,560 2 Electro Films 24,654,080 2 AIMCO Warwick LLC 19,714,288 2 Bald Hill Realty 9,364,960 2 Amgen 68,507,824 3 G-Tech 16,074,520 3 ON Semiconductor 194,761,248 4 Amtrol Inc. 19,103,920 4 E & A Portfolio Ltd. 9,925,960 4 Wholesale to Warwick 72,294,200 4 Arkwright Interlaken 12,056,309 5 Clariant 158,473,524 7 Westwood Trailer Park 26,711,080 7 Maple Root Corp. 7,689,440 7 Haven Eldercare of New England 9,646,956 7 Sherwood Valley Trailer Park 9,113,
16 The above list of large users depicts usage from September 1, 2001 to August 31, 2002, which corresponds to the base year of the average day model. 3.2 Characteristics of Customer Consumption The consumer classification makeup of each demand allocation zone must be determined in order to develop appropriate usage multipliers for maximum day and peak hour. These usage multipliers are used in the model to develop simulations for maximum day and peak hour demand allocations in each demand zone. Generally speaking, residential users typically have a higher maximum day and average day multiplier than commercial and industrial users because of the irrigation of lawns and larger number of water-using appliances. Low and medium density residential customers have a higher maximum day and average day multiplier than high-density residential customers also due to the irrigation of lawns and large number of water-using appliances. For a predominately residential community, the maximum day multipliers are characteristically high. These high multipliers are due to lawn watering, bathing and pool facility demands. These activities usually cause greater system demands during the dry, warmer periods of the year. Lawn watering and bathing and pool facility demands have the ability to increase the per capita water demand during periods of the year when maximum day demands occur. Daily peaks during these periods occur in the morning between the hours of 6 AM and 9 AM and again in the evening between the hours of 5 PM and 9 PM. These peaks are highest in the evening hours of the summer months. The average day and peak hour multipliers vary with consumer classifications and are also dependent on the hour of the day that the peak hour and average day demands occur. Commercial and industrial consumers utilize water on a more consistent basis throughout the day and year. Industries with multiple shifts have a more consistent water use pattern throughout the entire day. Residential consumers have higher peak hour multipliers during the early morning and evening hours. 3.3 Supply/Demand Rates Consumption data was correlated with actual flow record data from all system sources to develop the maximum day and peak hour demand allocations. All of the water for the KCWA water distribution system is produced via the three wells and received directly from interconnections with Providence Water and the City of Warwick (indirectly through Providence Water). Each of these facilities is metered on a continual basis. Production and source water data was reviewed for the base year in which the consumer demand data was utilized. The average day demand for the KCWA water distribution system was computed as 7, GPM (10.30 MGD) which also includes the unaccounted for water volume. This demand serves as the base demand and is simply an average of all water 14
17 consumption over a 365 day period for the base year. This actual base demand was utilized as the average day demand scenario that was incorporated into the model. Unaccounted for water volumes, or unmetered water, consist of water used for fire fighting, hydrant flushing, system leaks, theft, or malfunctioning meters. For the time period of September 1, 2001 to August 31, 2002, the unmetered water volume was calculated to be 9.53% or roughly 361 million gallons. This value was calculated by totaling the volume of water produced or purchased during the base year period and compared to the actual water that was billed or accounted for through actual billing records. Due to the fact that locations of unmetered water are difficult to predict, the calculated value of unmetered water was distributed across the system service territory evenly amongst the demand allocation zones. Multipliers are developed to represent the fluctuation in water use within the water system on a day when demands vary significantly from the average demand. Varying demand patterns are examined in order to determine the multipliers. This is accomplished primarily by reviewing daily recordings and charts for sources of supply, storage facilities, booster pump stations, and pressure reducing valve stations. Specific multipliers are also developed for each large user and are primarily based on the characteristic of the large user. For example, a large industry will generally have a low multiplier Historical production data for the past four years from 2000 was evaluated to develop the maximum day and peak hour multipliers. This included identifying maximum days that occurred in the system for each of the four years. These were determined to be as follows. CALENDAR YEAR TOTAL ANNUAL PRODUCED (GAL) AVERAGE DAY CONSUMPTION (GAL) MAXIMUM 24 HOUR CONSUMPTION (GAL) DATE OF MAXIMUM DAY ,509,974,400 9,616,368 15,682, ,566,515,100 9,771,274 18,549, ,736,988,144 10,238,324 18,583, ,448,580,308 9,448,165 18,564, A review of the data suggests that a maximum day demand for the system is in the range of 18.6 MGD as evidenced through the years 2000 to Based on this historical record data, it was determined that a demand of 18.6 MGD would most accurately represent a maximum day demand for the water system. An appropriate maximum day demand factor(s) was developed for the water system, which was determined to be This factor is in consideration of the fact that the large users were also assigned varying multipliers based on the type of use of the large user. 15
18 The remaining water usage was appropriated to the consumers in the water system. The following table identifies the multipliers for the large users for both maximum day and peak hour. LARGE WATER USERS TOTAL ANNUAL USAGE (GAL) MAP ID LOCATION* MAXIMUM DAY MULTIPLIER PEAK HOUR MULTIPLIER Riverpoint Lace Works 24,491,764 1A Soluol Chemical Co. 11,335,192 1B Bradford Soap Works 8,660,942 1C WWW Realty Assoc. 10,364,512 1D Kent County Hospital 36,521,743 2A Cowesett Hills 20,023,960 2B Cowesett Hills Assoc. 19,275,960 2C Briarwood Meadows 19,051,560 2D Electro Films 24,654,080 2E AIMCO Warwick LLC 19,714,288 2F Bald Hill Realty 9,364,960 2G Amgen 68,507,824 3A G-Tech 16,074,520 3B ON Semiconductor 194,761,248 4A Amtrol Inc. 19,103,920 4B E & A Portfolio Ltd. 9,925,960 4C Wholesale to Warwick 72,294,200 4D Arkwright Interlaken 12,056,309 5A Clariant 158,473,524 7A Westwood Trailer Park 26,711,080 7B Maple Root Corp. 7,689,440 7C Haven Eldercare 9,646,956 7D Sherwood Trailer Park 9,113,632 7E * Identifies the location in the particular demand allocation zone on the node and pipeline plan. Large Users Multipliers: The multipliers (maximum day and peak hour) for the large users were developed from a combination of available resources. In addition, C&E s past experience through development of numerous models for water systems has resulted in a database of various user types and multipliers (i.e. hospitals, large residential users, industrial and manufacturing, etc.) that also served as a basis of reference. Generally, large users were classified into specific groups in an attempt to characterize their water usage patterns. One group, which includes apartment complexes, trailer parks, condominium developments and similar residential users, were assigned similar peaking factors (i.e. 2.0 for maximum day and 2.5 for peak hour) that were developed for the overall model. Facilities such as hospitals and large office facilities were included in a separate group that generally maintains a fairly consistent water use throughout the day and year as 16
19 evidenced from historical investigations with these types of facilities. The increase in demand at these facilities is typically associated with increased seasonal irrigation. Industrial and commercial users, most notably the larger facilities that were included in the model, tend to operate on a consistent basis while employing multiple shifts and weekends. These usage patterns are generally well defined by their average daily demand. Maximum day and peak hour multipliers tend to be lower than residential but do however increase in the summer. This is typically associated with hot weather and increased use and evaporation from cooling towers, increased air-cooling demand and irrigation. Several of the large users were contacted and surveyed as to typical water demand patterns. This included ON Semiconductor, Clarient and Amgen. These contacts were utilized to generally confirm the multipliers that were utilized herein. Largely, it was reported that water use as developed from the average day demand is spread evenly throughout the day. Usually, the bias may be toward a larger demand during the first shift that employs the largest staff. In order to develop a peak hour demand multiplier it was necessary to review the historical records for the maximum days. This included obtaining flow data for pump stations, tank charts, well stations and other available data related to system operation during this period. Through review of this data it was determined that the peak demand of the water system occurred during a period on July 2, 2002 between the hours of 6:00 AM and 9:00 AM. It was determined that at this time, the total system production from all sources of supply was approximately 18.9 MGD with an aggregate volume of water from storage to the system of approximately 2.3 MGD on an average hourly basis over this three (3) hour period. In other words, during this period the demand was such that the supply rate was exceeded and reserve water capacity was withdrawn from the tanks. The peak hour demand rate was determined to be 22.1 MGD (18.9 supply rate plus 2.3 tank volume plus 0.9 unmetered volume). This translates to a peak hour multiplier of It should be noted that the unaccounted for water is assigned a multiplier of 1.0, as it is not considered to vary significantly with customer demands during maximum day and peak hour periods. 17
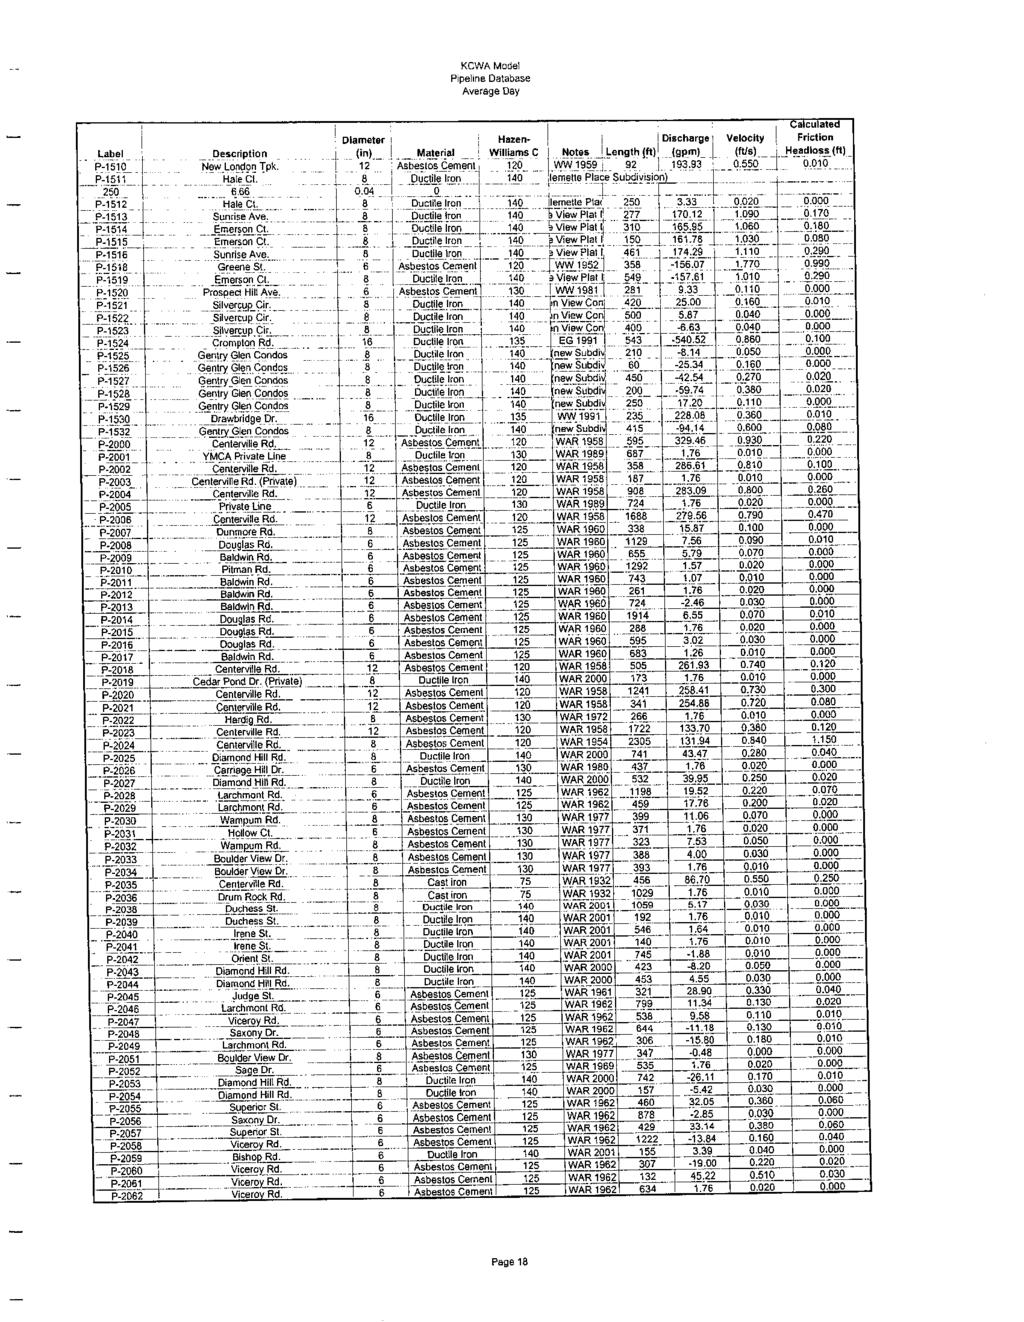
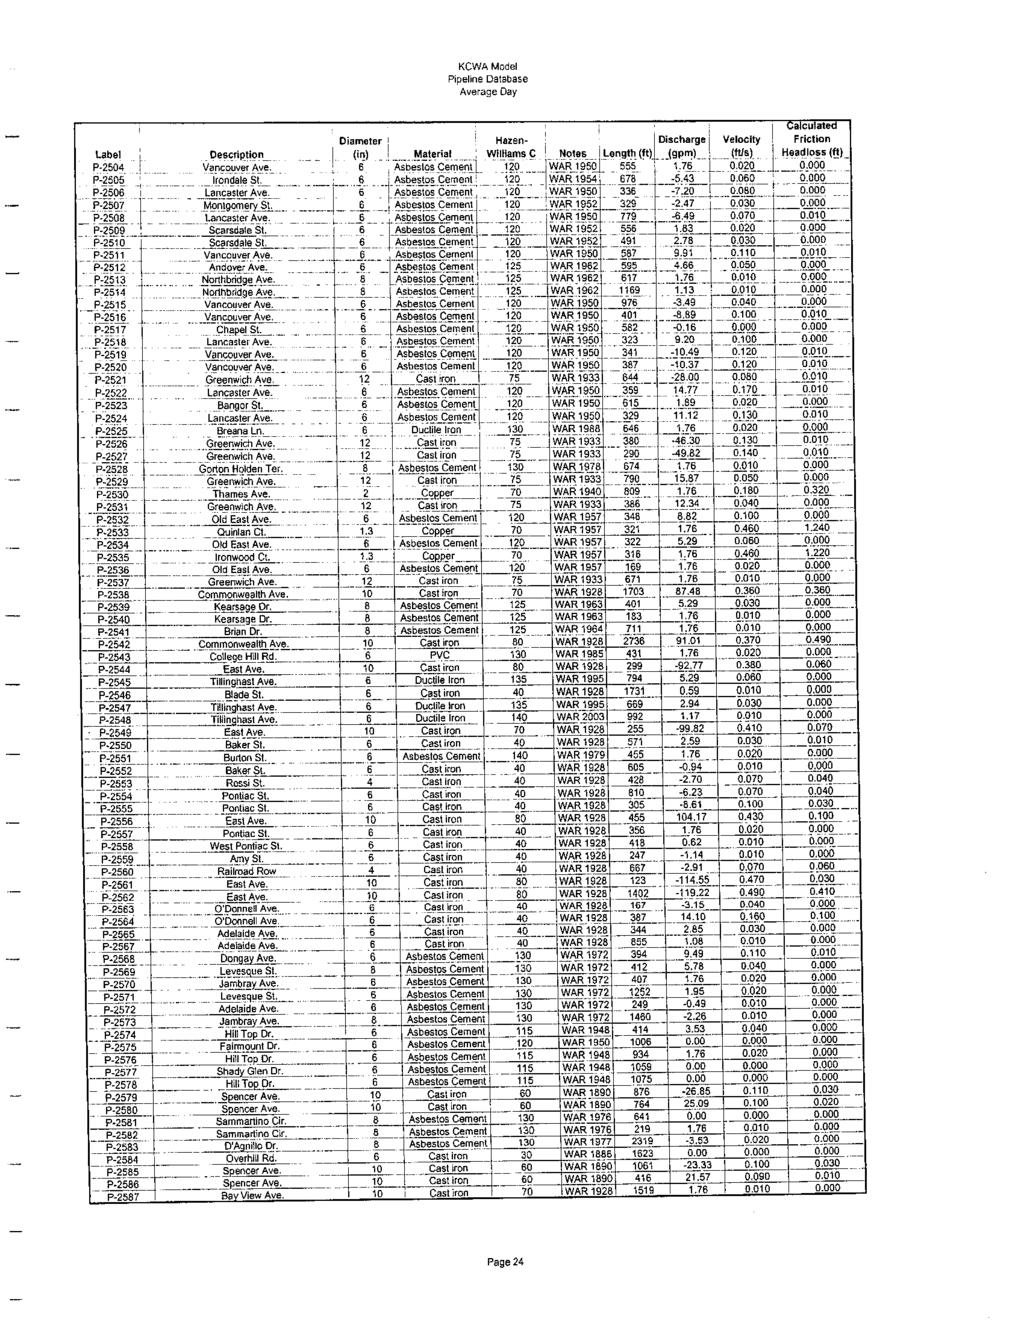
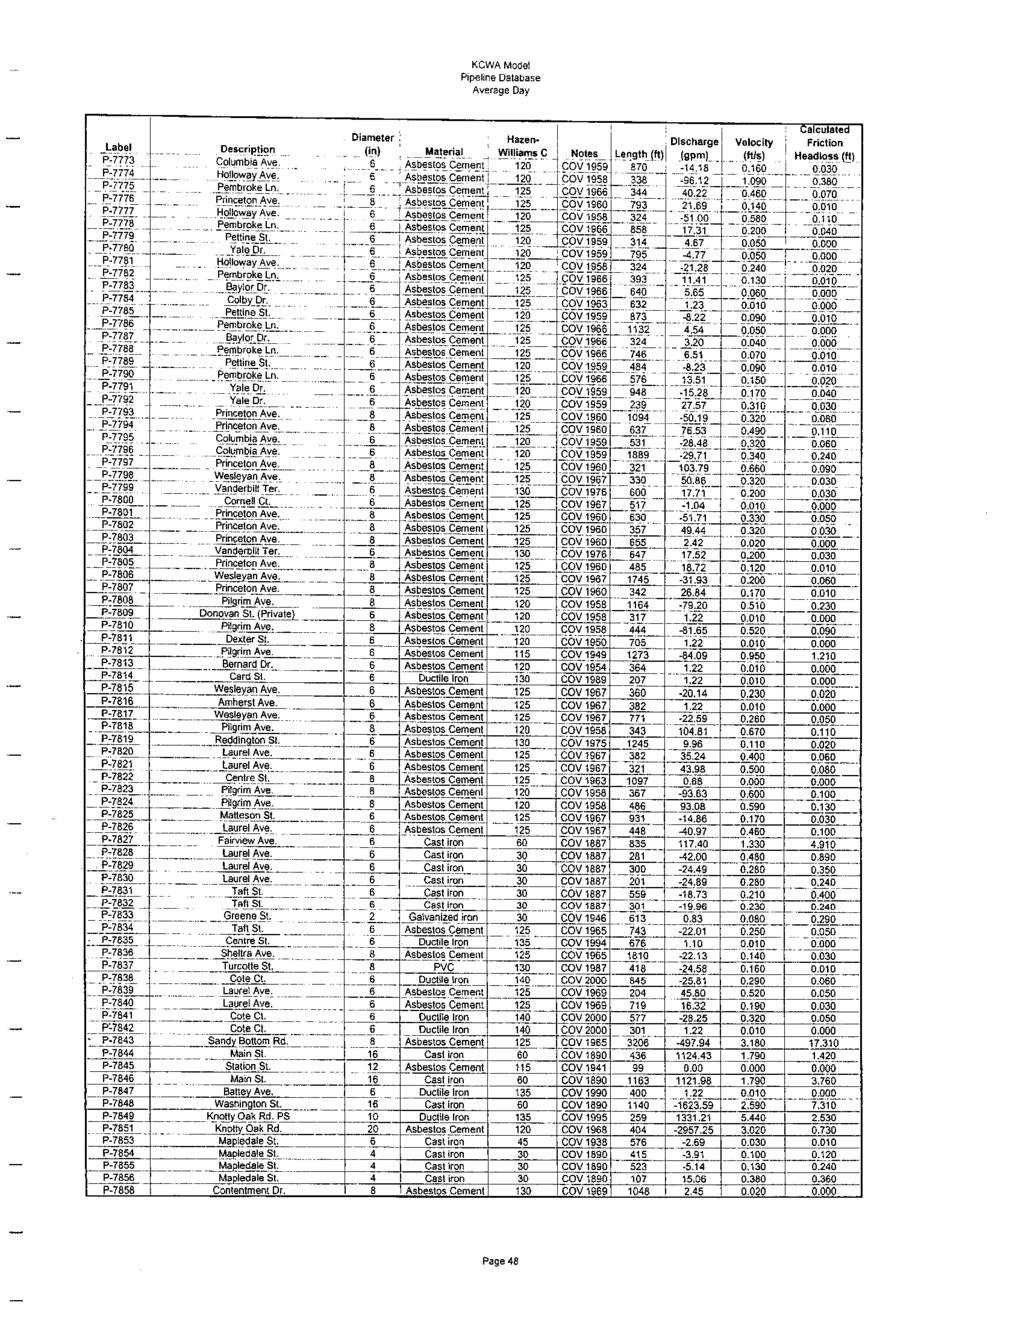
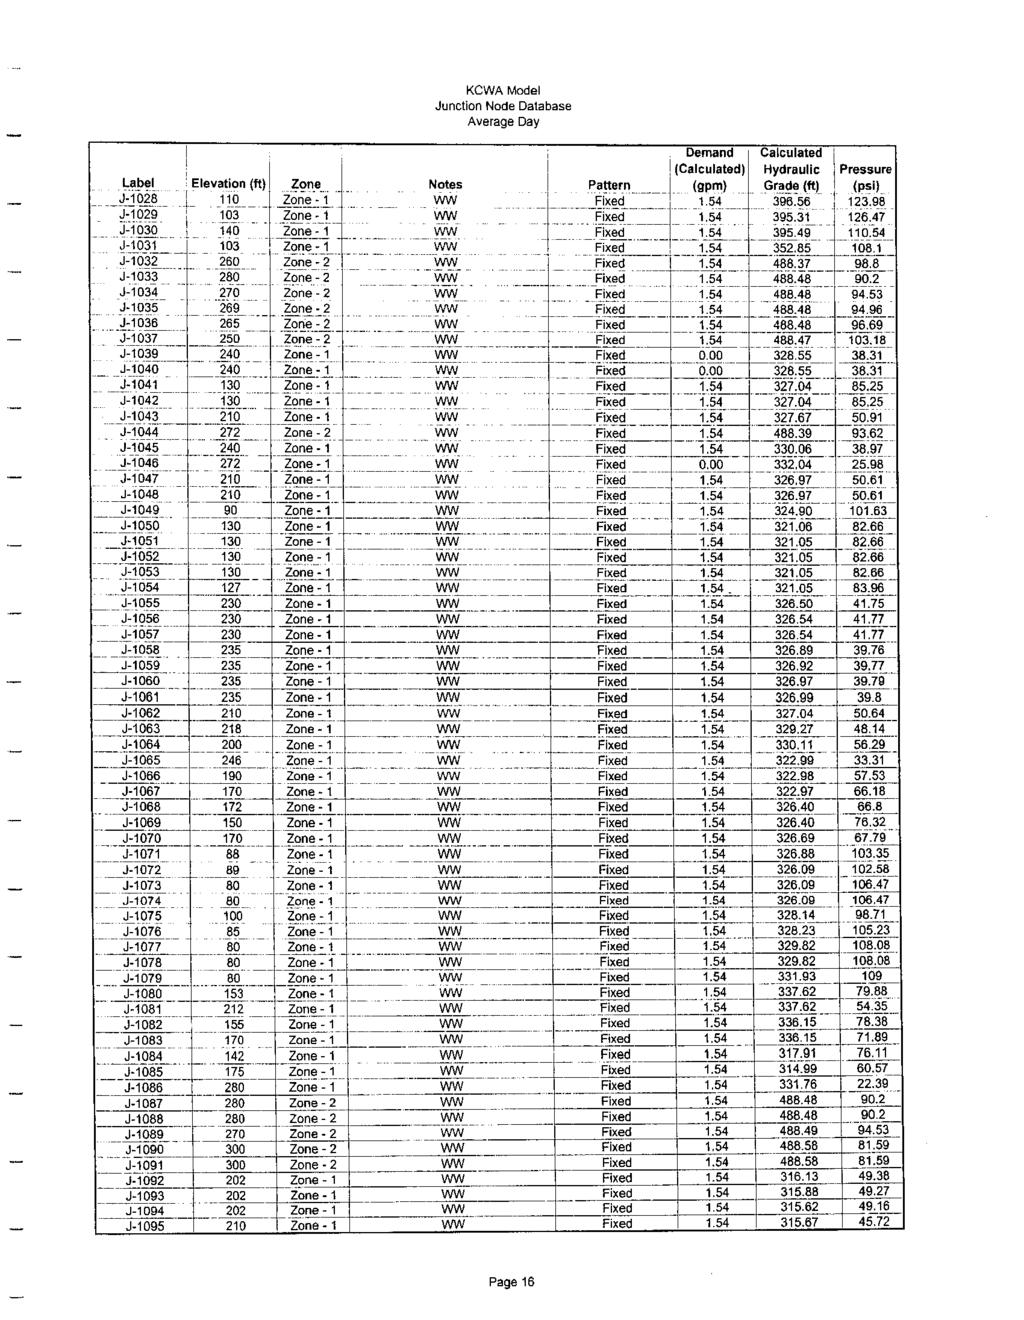
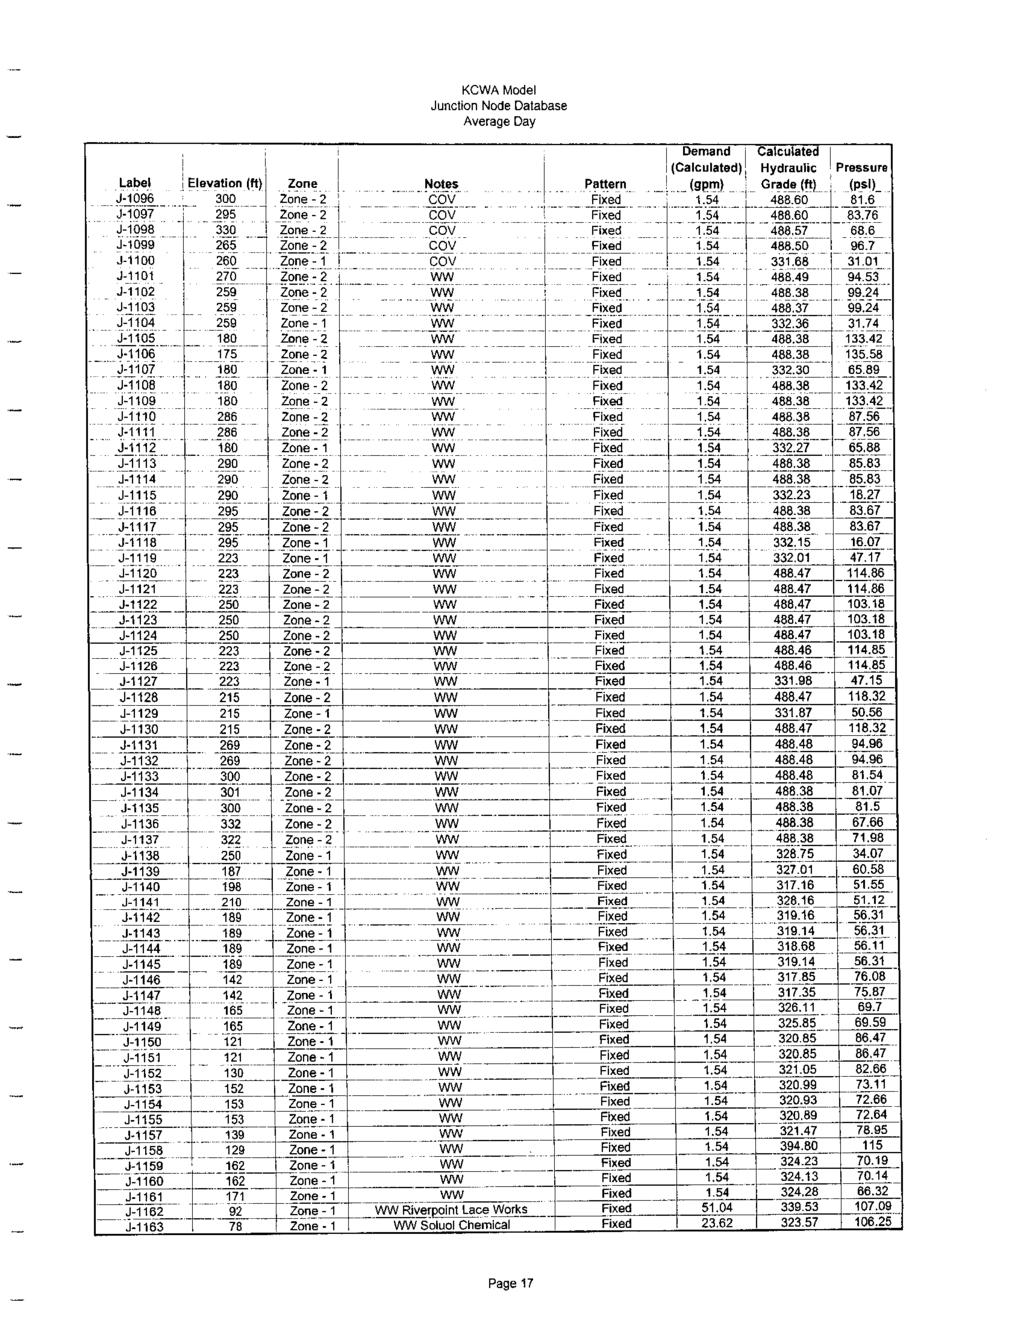
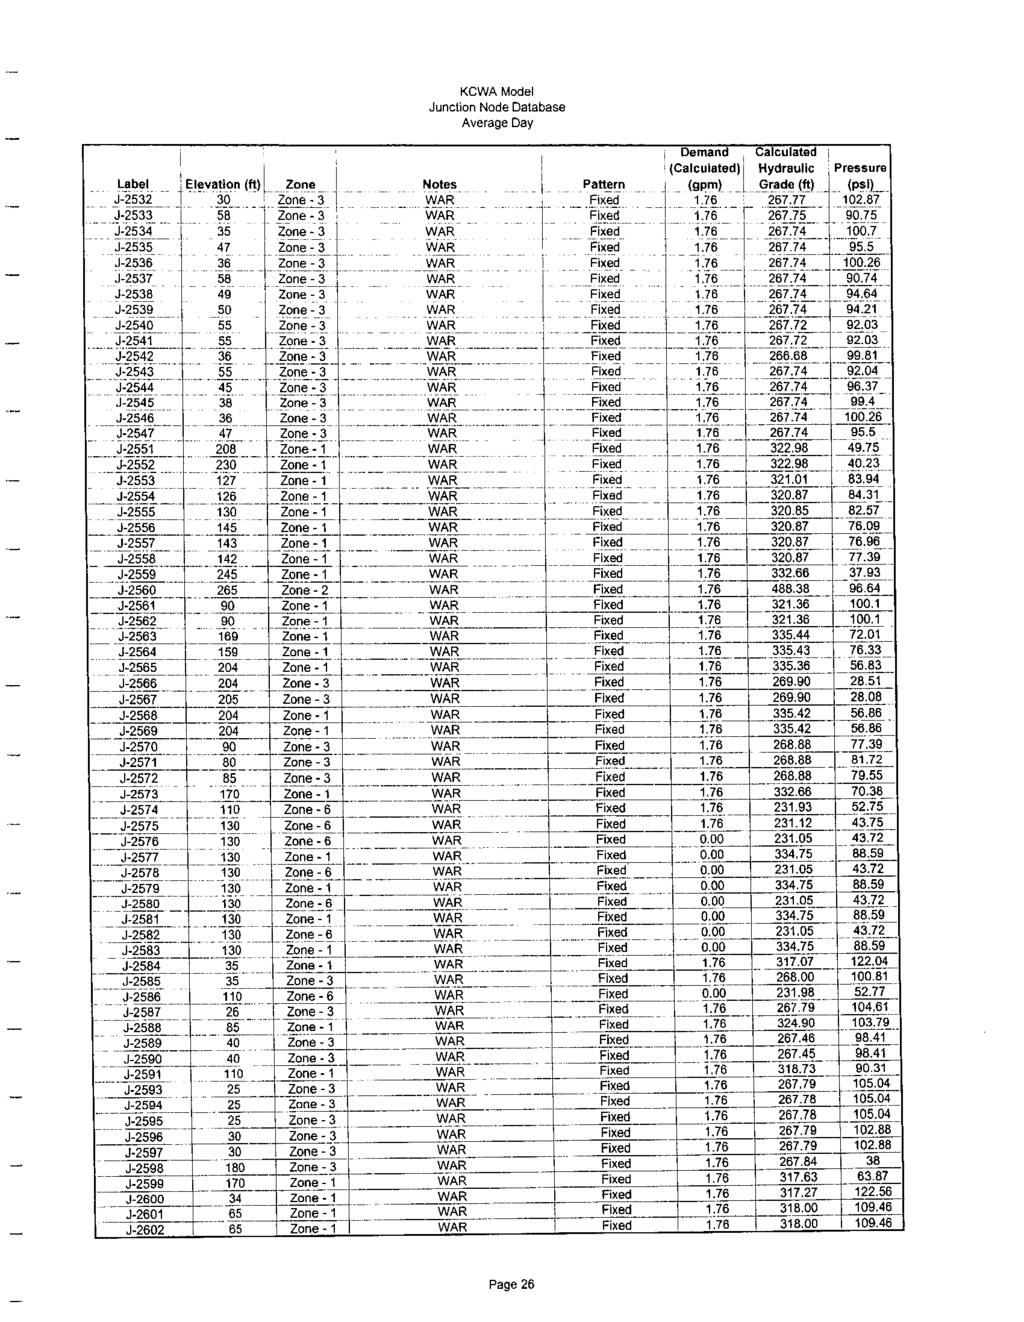
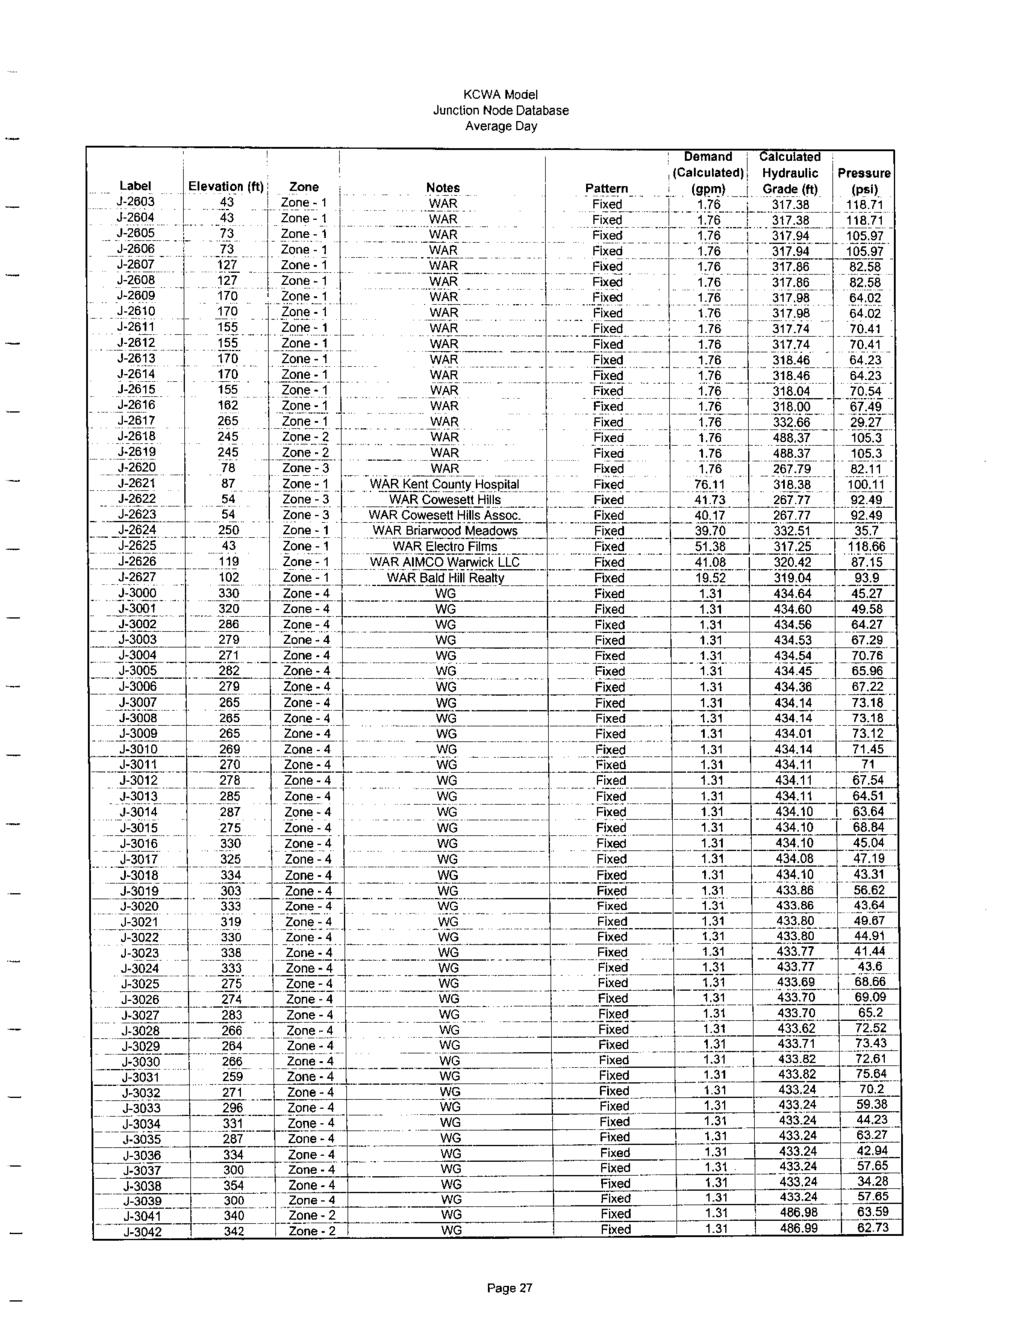
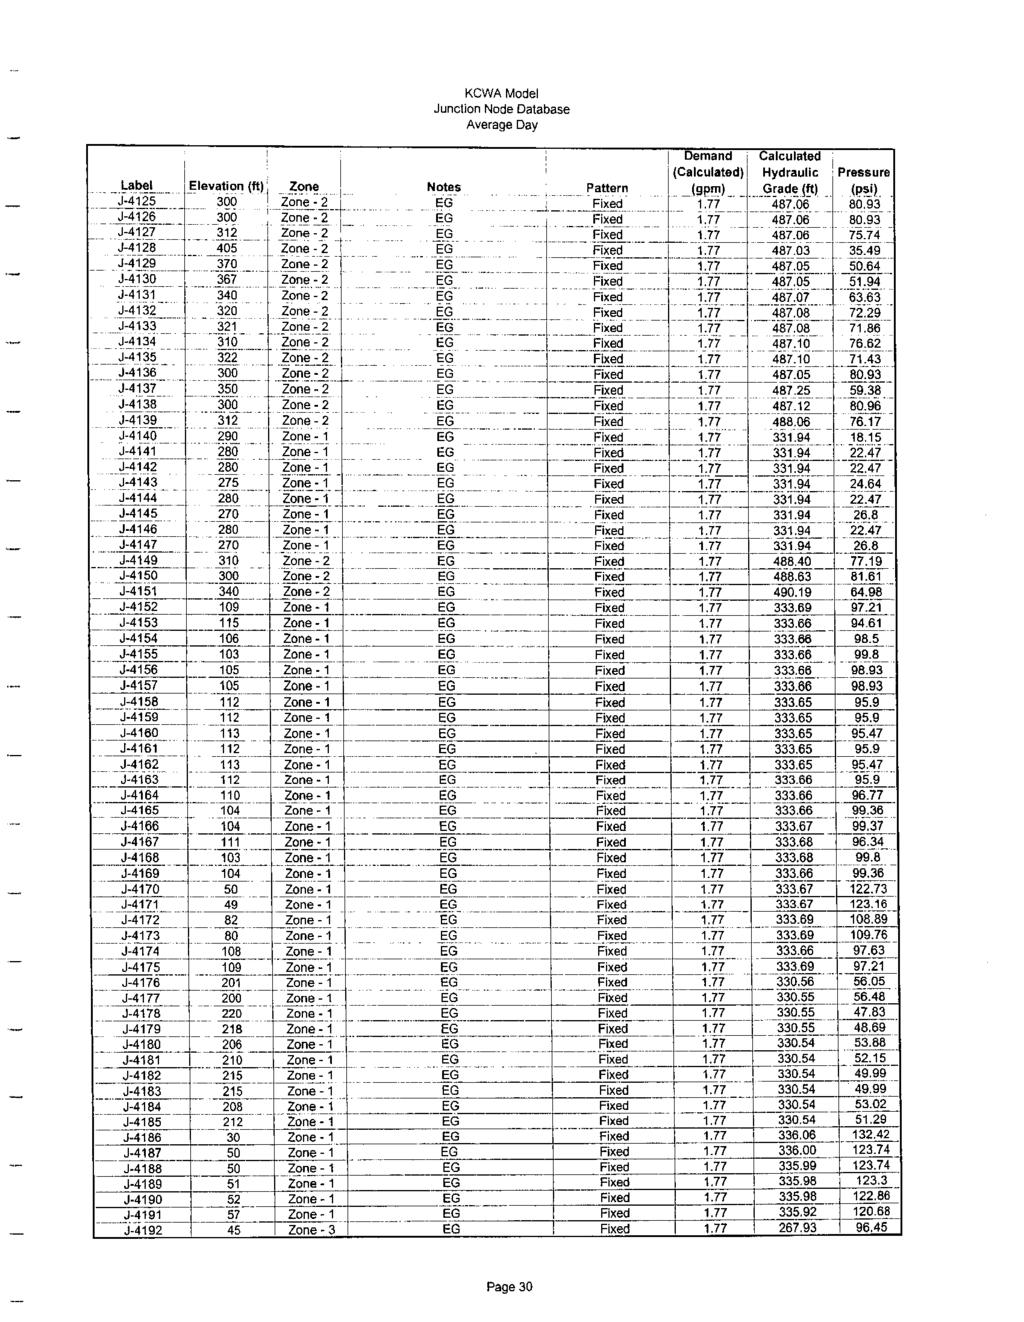
20 4.1 Representation of System Facilities 4.0 Hydraulic Model Development All of the major facilities of the KCWA water distribution system are represented in the mathematical hydraulic model. This includes all sources of supply (including wholesale), booster pumping and storage facilities, well stations, pressure reducing valves stations, and pipelines. Information describing the characteristics of each of the water system facilities was acquired from available records of the KCWA. This also included numerous meetings and discussions with KCWA staff during development of the model to verify system geometry including pipeline layout, size, age, material, etc. A general overview of the operation of the system including pump sequencing, booster pump operation, manual and automatic operation of facilities, etc. was also obtained from KCWA staff in order to properly establish initial operating conditions for model scenarios. The following is a general description of the facilities and the method by which they are represented in the WaterCAD hydraulic modeling software program. Junction Nodes Junction nodes connect two or more pipe segments together and are a point at which flow is introduced or removed from the water distribution system. This is the location where consumer demands are assigned to the model. A junction node must also be inserted in the model at points where the size, age, or material of a pipe section changes. Junction nodes are assigned a prefix of J- followed by an identifying number. Each junction node is also assigned an elevation in feet (mean Sea Level). These elevations allow the model to compute pressures. Each junction node in the model has been assigned an elevation that was obtained from United States Geological Survey (USGS), 7.5-minute series topographic maps. In addition, each junction node is further identified in the Notes column of the model by an identifying town / city description. For example, WW represents West Warwick, EG represents East Greenwich, WAR represents Warwick, etc. This further aids in identifying the location of a particular junction node. Pipelines Pipelines are model elements that have a constant diameter, material, and age and are connected to a junction node. Pipelines can also be connected to tanks, reservoirs, pumps, and PRVs. The characteristics of each pipeline in the model include size or diameter, length, material, age, Hazen-Williams C-Value coefficients, and connection nodes, tanks, reservoirs, pumps, or PRVs. Each pipe segment was also identified in the model database with material of construction (i.e. Ductile Iron, Cast Iron, etc.) and a general notes column that identifies the town or city in which it is located along with the date of installation. All pipeline characteristics were obtained from maps and pipeline databases provided by the KCWA. C-values were determined from hydrant flow tests conducted by C&E with 18
21 assistance from KCWA staff on December 16, 2003 through December 17, The results of these tests are provided in Appendix D Hydrant C-Value Test Results. The C-values of the pipelines are dependent on the age, material, and diameter of the pipe. Pipes that are made from asbestos cement (AC), polyvinyl chloride (PVC), and ductile iron (DI) have higher C-values due to the fact that they are generally free from corrosion and deterioration. Pipes that are constructed from cast iron (CI) have lower C- values because they are typically older and subject to tuberculation. In addition, CI pipe segments that experience low flows (i.e. in residential neighborhoods or on dead ends) exhibit higher rates of tuberculation and are therefore assigned lower C-values. CI pipes that are considered transmission mains and have higher flow rates typically exhibit less tuberculation and have a higher C-value. The following is table contains the values of C- factors used for the pipelines in the hydraulic model. AGE PIPE AC CI PVC DI DIAMETER (INCHES) ,6,8,10,12,16, ,6,8,10,12,16, ,6,8,10,12,16, ,6,8,10,12,16, ,6,8,10,12,16, ,6,8,10,12,16, , , 10,12,16, , , 10,12,16, ,6 40 8,10,12,16, ,6 35 8, 10,12,16, s ,6 30 8, 10,12,16,20 60 Further, the junction nodes and pipelines in the model are such that they are grouped by a numbering sequence that allows easier identification and relation to the node and pipeline plan. The numbering sequence was performed by town / city in which the junction node or pipeline is located. This assignment of numbers by location allows future expansion for additional pipe and junction node segments within each town / city as the water system is expanded. The following is the general numbering sequence and reserved numbers for future system additions that was incorporated in the model. 19
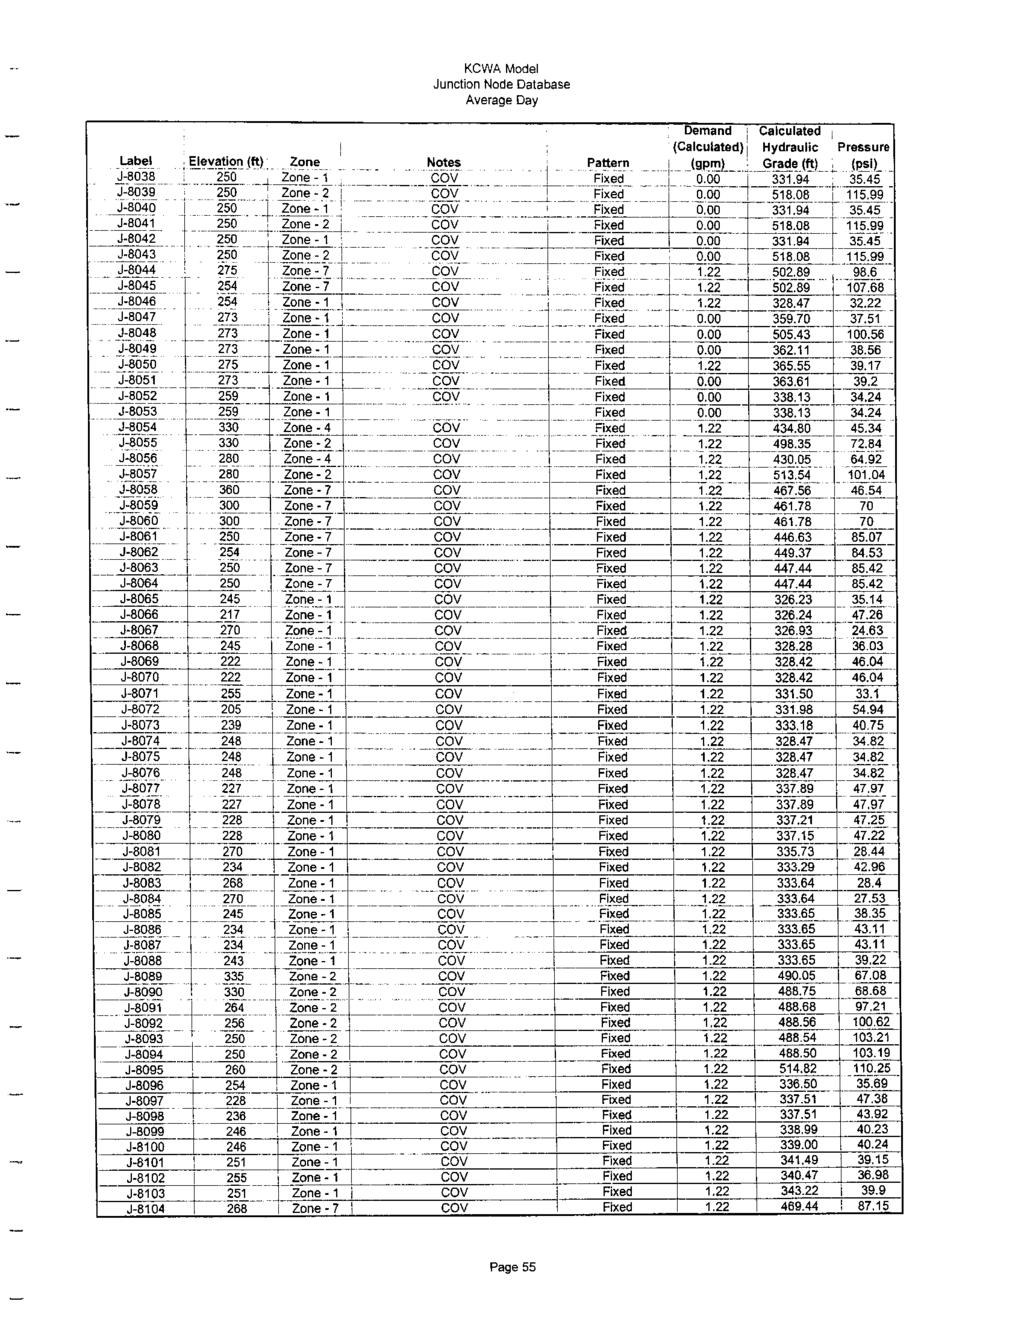
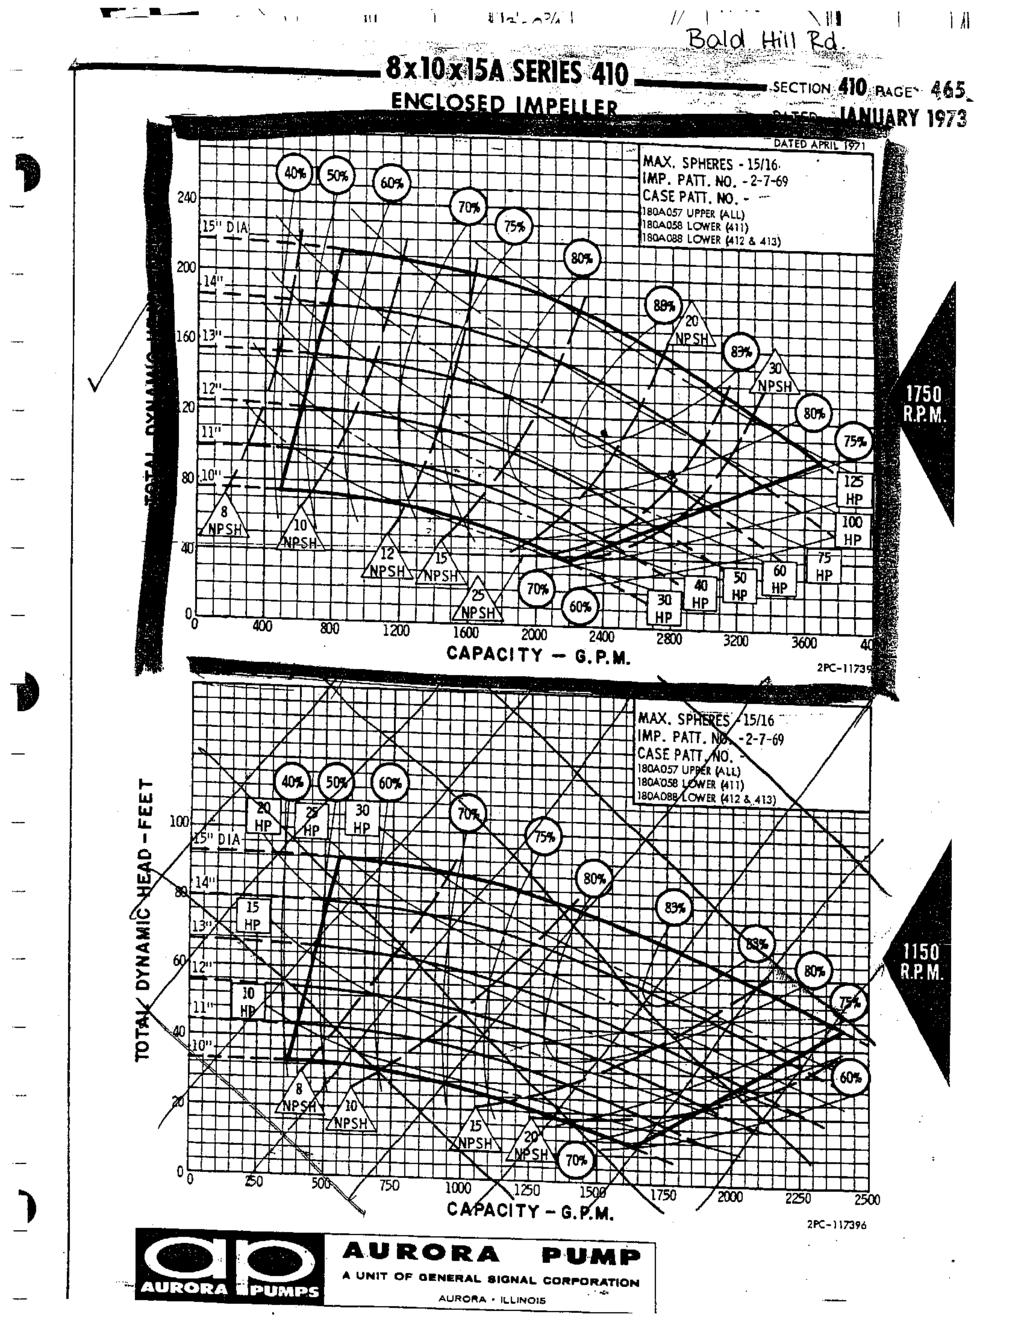
22 CITY / TOWN PIPE SEGMENT JUNCTION NUMBER NUMBER West Warwick P-1 to P-1999 J-1 to J-1999 Warwick P-2000 to P-2999 J-2000 to J-2999 West Greenwich P-3000 to P-3999 J-3000 to J-3999 East Greenwich P-4000 to P-4999 J-4000 to J-4999 Cranston P-5000 to P-5999 J-5000 to J-5999 Scituate P-6000 to P-6999 J-6000 to J-6999 Coventry P-7000 to P-8999 J-7000 to J-8999 Pressure Reducing Valves (PRVs) PRV s are depicted in the model in areas where the water pressure is reduced. A PRV will decrease water pressure from a higher hydraulic gradient to a lower hydraulic gradient. The model incorporates the following PRV stations and labeling scheme. Label PRV-1 PRV-2 PRV-3 PRV-4 PRV-5 PRV-6 PRV-7 PRV-8 PRV-9* Description Love Lane PRV Station Middle Road PRV Station Post Road PRV Station Division Street PRV Station Centerville Road PRV Station Cowesett Road PRV Station Helen Avenue PRV Station Mishnock Road PRV Station Hope Road Booster Pump Station * The Hope Road Booster Pump Station employs a hydro pneumatic pressure tank. By using a PRV with a downstream setting equal to the boosted pressure, the PRV is acting similar to a booster pump system to this zone. This is a standard method recommended by the software developer to represent and model these types of system facilities. Reservoirs In the model, a reservoir represents a source of water that is not readily depleted and offers a constant source of supply. The Providence Water aqueduct is represented as a reservoir set equal to the hydraulic grade of 232 feet. This represents a continual uninterrupted source of supply that would not vary even under extended period simulation. Groundwater wells or similar sources of supply are also represented as reservoirs with fixed elevations. If the reservoir is representing a well, the water elevation in the reservoir is set to the pumping water level in the well casing. Tanks A total of ten (10) water storage tanks have been represented in the model. Critical information for each tank includes the type of tank (standpipe, elevated, reservoir), overflow elevation, initial water level, base elevation, height, and diameter. This information is essential especially for performing extended period simulations. The following tanks and labeling scheme have been incorporated into the model. 20
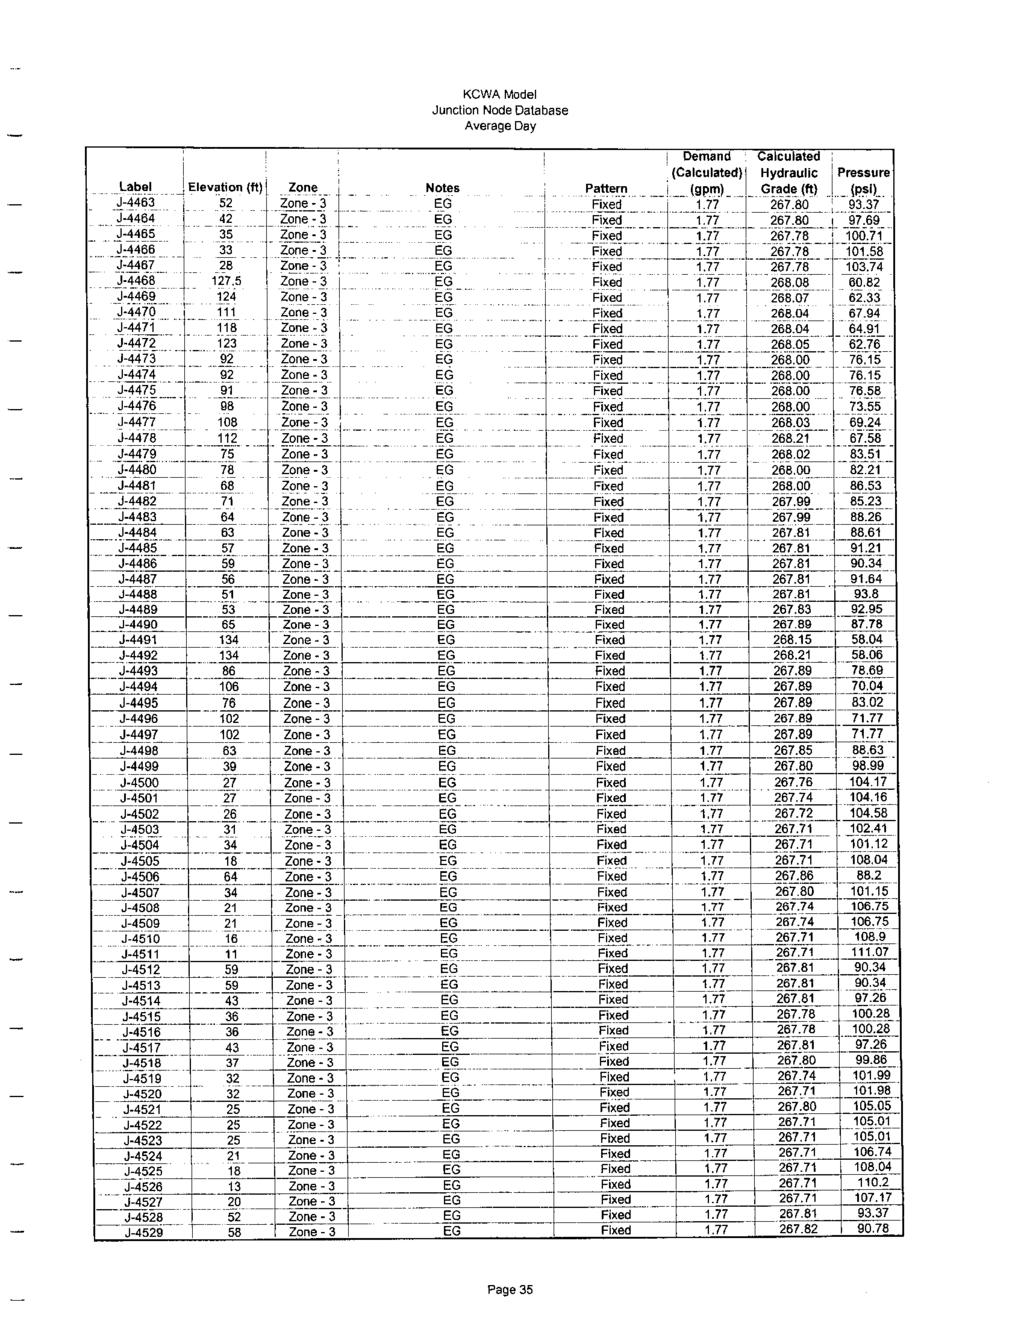
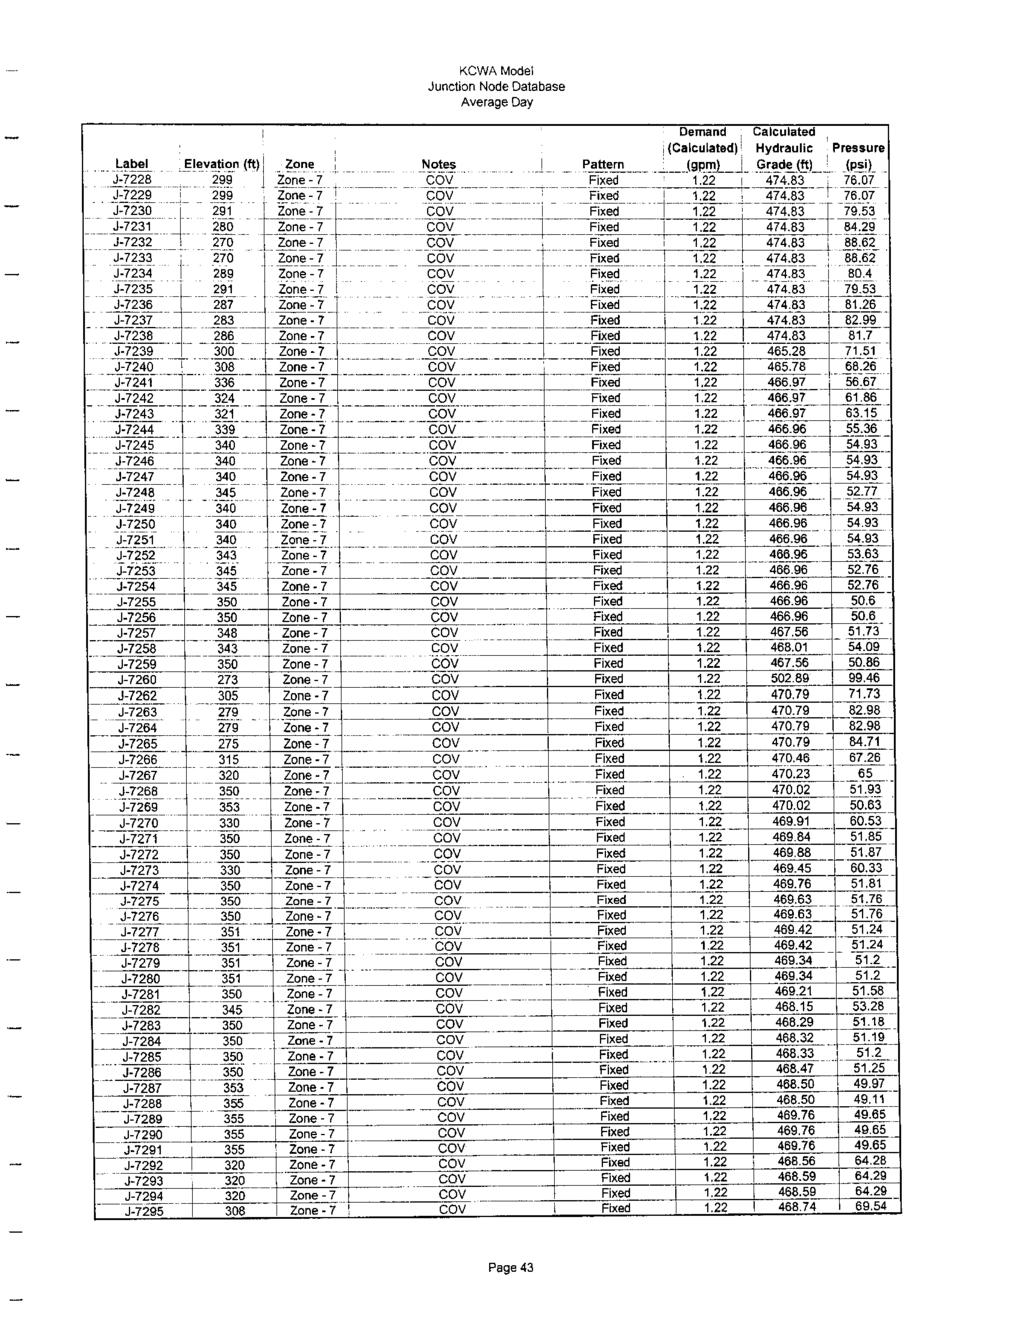
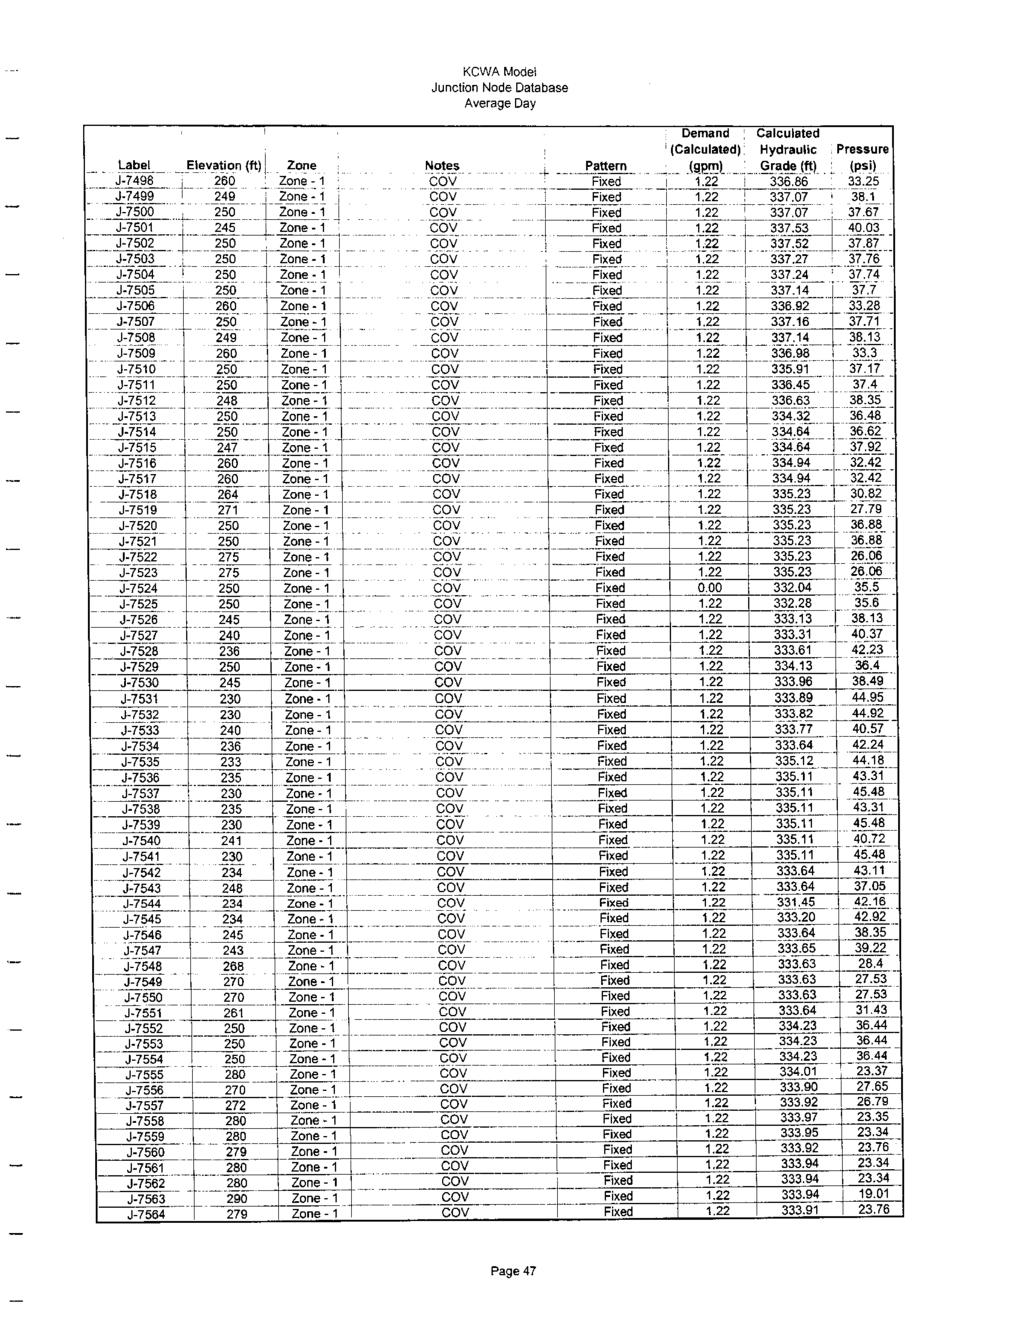
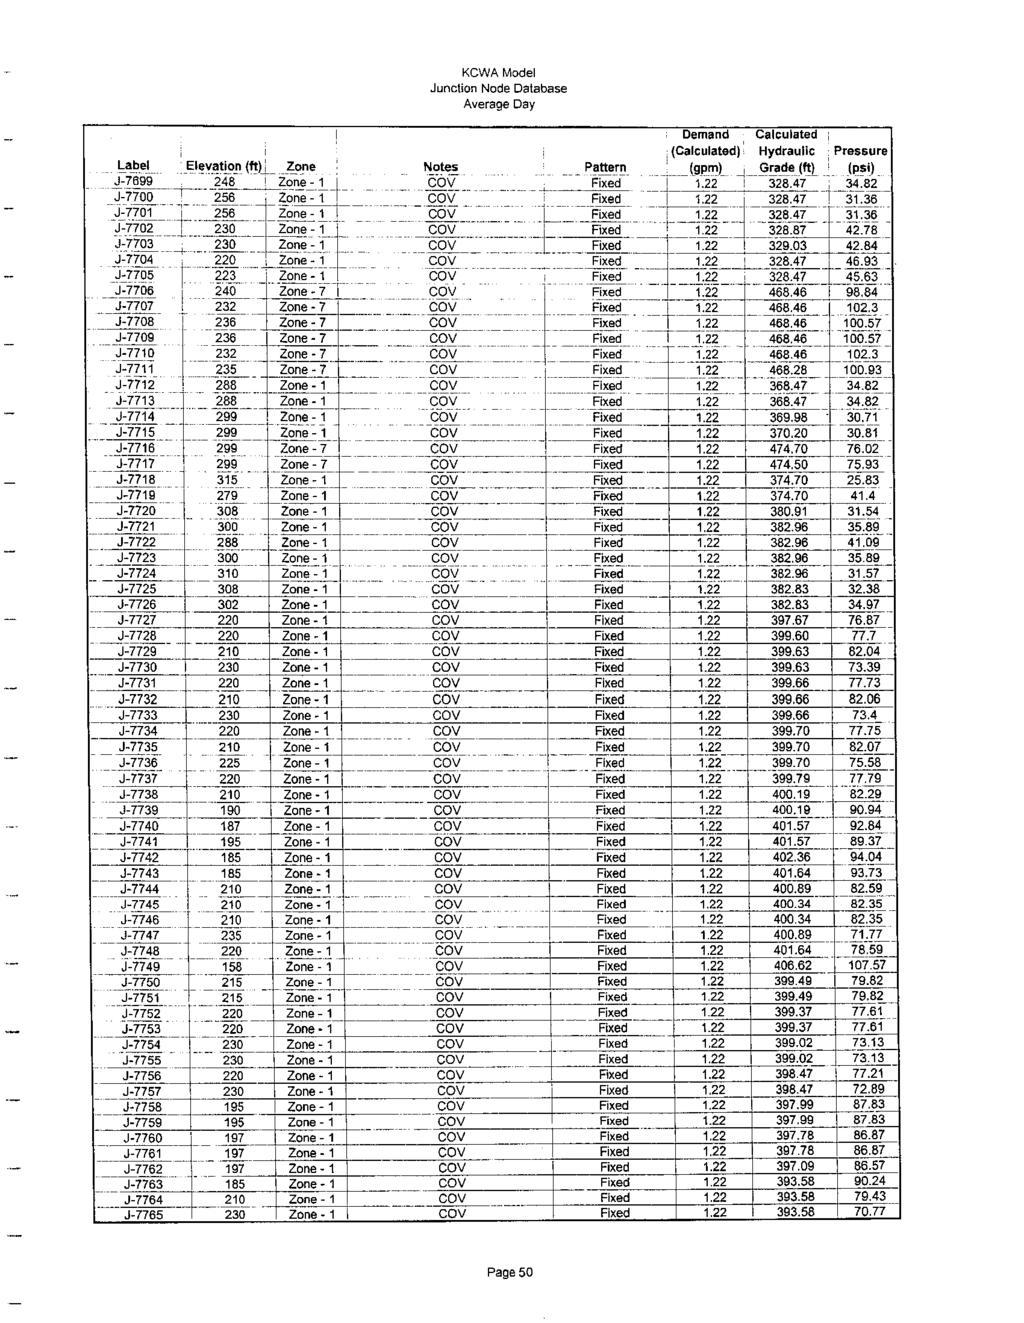
23 Label Description T-1 Read School House Road Tank T-2 Tiogue Tank T-3 Frenchtown Road Tank T-4 Technology Park Tank T-5 Carrs Pond Road Tank T-6 West Street Tank (currently off line) T-7 Crompton (Setian Lane) Tank T-8 Wakefield Street Tank T-9 Seven Mile Road Underground Tank 1 T-10 Seven Mile Road Underground Tank 1 Pumps Pumps are hydraulic elements that add hydraulic head (power) to the water system. They generally represent booster stations, transmission pump stations and well stations. A number of pump systems have been incorporated into the model to represent the booster and transmission pump systems at Clinton Avenue, Bald Hill Road, Knotty Oak and Johnson Boulevard pump stations. They are also representative of the well fields including Mishnock, East Greenwich and Spring Lake well stations. Each of the pumps has been represented in the model by a pump curve, which correlates head and flow for a particular pump at each facility. These pump curves were obtained from KCWA records or in certain instances directly from the pump manufacturer. A copy of these pump curves are provided in Appendix E Booster Pump Station / Well Station Pump Curves. 4.2 Simulations Overview Demands from the consumption data provided by the KCWA were sorted by street address for each of the Town and Cities. Demands were correlated to a street in each Town or City and applied to the junction nodes in each of the respective demand allocation zones. Large user demands for the large users are individually tracked and assigned to a specific location in the system. The junction node and pipeline database directories for the system serve as the basis of information for input to the model. All information regarding pipelines (i.e. length, diameter, material, C-value, etc.), junction nodes (i.e. demand, elevation, etc.), pumps (i.e. pump curves, etc.), tanks (i.e. overflow elevations, level in tank, etc.), reservoirs (i.e. initial hydraulic grade line, etc.), and PRVs (i.e. hydraulic grade lines, etc.) can be found in Appendix A for the Average Day scenario. Also included in Appendix A is a summary sheet of the Calculation Results for this particular scenario. When viewing the pipe and junction node result tables, the calculated values consist of each pipeline segment in the system along with a solved flow, head loss, and velocity. The results for each junction node in the system consist of the demand, elevation, solved pressure, pressure head, and hydraulic grade line. It should be noted that a pipeline that 21
24 has a minus sign preceding the flow rate simply means that flow is occurring in the direction opposite to the direction in which the pipeline was originally entered in the database. As demand situations change the direction of flow in pipelines may also change. This is especially evident when pipelines supplying tanks are filling or draining or when conducting fire flow scenarios. Appendix B and C contain Calculation Results that summarize both the maximum day and peak hour scenarios. The full output of the junction nodes and pipe segments for these scenarios were not included due to the volume of sheets (over 100 per scenario) but can readily be obtained from the model results files. The critical information for these scenarios is however included which includes total system demand, tank fill and draw rates, reservoir supply rates, booster pumping rates and total dynamic head and PRV flow rates. It should be noted that all completed simulations were conducted with the West Street tank off line. The Seven Mile Road tanks are normally locked up due to the hydraulic influence of the Clinton Avenue Pump Station. These tanks tend to drain under peak demand conditions in the system. The Warwick Tanks are floated at the same elevation of the Providence Water gradient in the main 78 inch supply aqueduct. These tanks contain an aggregate storage capacity of 12 million gallons. 4.3 Average Day Simulation A complete summary of this simulation is provided in Appendix A. Initial Modeling Conditions: The following is a summary of the initial model conditions (i.e. tank levels, pumps on / off, etc.) categorized by the various pressure gradients: Facility Status Low Service (334 ) Gradient - Setian Lane Tank 332 feet - Seven Mile Road Reservoirs 334 feet (locked up) - Frenchtown Road Tank 332 feet - Tiogue Avenue Tank 333 feet - Wakefield Street Tank 327 feet - West Street Tank Out of Service - Offline - Mishnock Wells Off Inactive - East Greenwich Well On Active - Spring Lake (Coventry) Well On Active - Clinton Avenue Pump Station On Two Pumps Active - Bald Hill Road Pump Station On One Pump Active 22
25 Intermediate High (430 ) Gradient - Read School House Road Tank 427 feet - Knotty Oak Pump Station On One Pump Active High Service (500 ) Gradient - Technology Park Tank 497 feet - Carrs Pond Tank 487 feet - Johnson Boulevard Pump Station On One Pump Active Low Service Reduced (334 ) Gradient - Centerville Road PRV Station Active - Open - Division Road PRV Station Active - Open - Middle Road PRV Station Active - Open - Cowesett Road PRV Station Active - Open - Love Lane PRV Station Active - Open - Post Road PRV Station Active - Open High Service (500 ) Reduced Gradient - Mishnock Road PRV Station Active Open - Helen Ave. PRV Station Active Open Warwick Tanks (232 ) Gradient - Warwick Tanks (12 MGD Storage) Active - Open Hope Road (510 ) Gradient - Hope Road Booster Pump Station Active Hydro pneumatic Tank Oaklawn (231 ) Gradient - Wholesale Connection to Providence Water Active - Open Results Summary: This scenario was premised on a total system demand of 7,244 gpm or 10.4 MGD, which is the total system demand. The scenario indicates that the total volume of flow being stored in the tanks (aggregate volume going to storage tanks) is equal to 1,563 gpm or 2.25 MGD. Overall, the hydraulic gradients for the various pressure zones were calculated to be in the range in which these pressure zones are normally operated. Facility Output Results Summary Low Service (334 ) Gradient - Setian Lane Tank Filling 407 gpm - Seven Mile Road Reservoirs Locked up - Frenchtown Road Tank Filling 147 gpm - Tiogue Avenue Tank Draining 45 gpm - Wakefield Street Tank Filling 218 gpm 23
26 - West Street Tank Out of Service - offline - Mishnock Wells Off inactive - East Greenwich Well 1,130 gpm output - Spring Lake (Coventry) Well 294 gpm output - Clinton Avenue Pump Station 5,286 gpm output - Bald Hill Road Pump Station 2,020 gpm output Intermediate High (430 ) Gradient - Read School House Road Tank Filling 1,055 gpm - Knotty Oak Pump Station 1,331 gpm output High Service (500 ) Gradient - Technology Park Tank Draining 277 gpm - Carrs Pond Tank Filling 205 gpm - Johnson Boulevard Pump Station 1,080 gpm output Low Service Reduced (334 ) Gradient - Centerville Road PRV Station Open 176 gpm - Division Road PRV Station Open 327 gpm - Middle Road PRV Station Open 275 gpm - Cowesett Road PRV Station Open 199 gpm - Love Lane PRV Station Open 324 gpm - Post Road PRV Station Inactive - Closed High Service (500 ) Reduced Gradient - Mishnock Road PRV Station Open 272 gpm - Helen Ave. PRV Station Open 45 gpm Warwick Tanks (232 ) Gradient - Warwick Tanks (12 MGD Storage) Draining 2,024 gpm (total) Hope Road (510 ) Gradient - Hope Road Booster Pump Station 4.45 gpm output Oaklawn (231 ) Gradient - Wholesale Connection to Providence Water Open 246 gpm 4.4 Maximum Day Simulation A complete summary of this simulation is provided in Appendix B. Initial Modeling Conditions: The following is a summary of the initial model conditions (i.e. tank levels, pumps on / off, etc.) categorized by the various pressure gradients: 24
27 Facility Status Low Service (334 ) Gradient - Setian Lane Tank 332 feet - Seven Mile Road Reservoirs 334 feet (locked up) - Frenchtown Road Tank 332 feet - Tiogue Avenue Tank 333 feet - Wakefield Street Tank 327 feet - West Street Tank Out of Service - Offline - Mishnock Wells Off Inactive - East Greenwich Well On Active - Spring Lake (Coventry) Well On Active - Clinton Avenue Pump Station On Three Pumps Active - Bald Hill Road Pump Station On Three Pumps Active Intermediate High (430 ) Gradient - Read School House Road Tank 427 feet - Knotty Oak Pump Station On One Pump Active High Service (500 ) Gradient - Technology Park Tank 497 feet - Carrs Pond Tank 487 feet - Johnson Boulevard Pump Station On One Pump Active Low Service Reduced (334 ) Gradient - Centerville Road PRV Station Active - Open - Division Road PRV Station Active - Open - Middle Road PRV Station Active - Open - Cowesett Road PRV Station Active - Open - Love Lane PRV Station Active - Open - Post Road PRV Station Active - Open High Service (500 ) Reduced Gradient - Mishnock Road PRV Station Active Open - Helen Ave. PRV Station Active Open Warwick Tanks (232 ) Gradient - Warwick Tanks (12 MGD Storage) Active - Open Hope Road (510 ) Gradient - Hope Road Booster Pump Station Active Hydro pneumatic Tank Oaklawn (231 ) Gradient - Wholesale Connection to Providence Water Active - Open 25
28 Results Summary: This scenario was premised on a total system demand of 13,543 gpm or 19.5 MGD, which is the system demand including unmetered water volume. The scenario indicates that the total volume of flow being depleted from the tanks (aggregate volume draining out of storage tanks) is equal to 407 gpm or 0.59 MGD. Overall, the hydraulic gradients for the various pressure zones were calculated to be in the range in which these pressure zones are normally operated. Facility Output Results Summary Low Service (334 ) Gradient - Setian Lane Tank Filling 1,414 gpm - Seven Mile Road Reservoirs Locked up - Frenchtown Road Tank Draining 140 gpm - Tiogue Avenue Tank Draining 758 gpm - Wakefield Street Tank Draining 693 gpm - West Street Tank Out of Service - offline - Mishnock Wells Off inactive - East Greenwich Well 1,144 gpm output - Spring Lake (Coventry) Well 298 gpm output - Clinton Avenue Pump Station 6,400 gpm output - Bald Hill Road Pump Station 5,037 gpm output Intermediate High (430 ) Gradient - Read School House Road Tank Filling 873 gpm - Knotty Oak Pump Station 1,433 gpm output High Service (500 ) Gradient - Technology Park Tank Draining 692 gpm - Carrs Pond Tank Draining 395 gpm - Johnson Boulevard Pump Station 1,110 gpm output Low Service Reduced (334 ) Gradient - Centerville Road PRV Station Open 425 gpm - Division Road PRV Station Open 483 gpm - Middle Road PRV Station Open 367 gpm - Cowesett Road PRV Station Open 530 gpm - Love Lane PRV Station Open 275 gpm - Post Road PRV Station Open 537 gpm High Service (500 ) Reduced Gradient - Mishnock Road PRV Station Open 293 gpm - Helen Ave. PRV Station Open 343 gpm 26
29 Warwick Tanks (232 ) Gradient - Warwick Tanks (12 MGD Storage) Draining 5,043 gpm (total) Hope Road (510 ) Gradient - Hope Road Booster Pump Station 9.04 gpm output Oaklawn (231 ) Gradient - Wholesale Connection to Providence Water Open 501 gpm 4.5 Peak Hour Simulation A complete summary of this simulation is provided in Appendix B. Initial Modeling Conditions: The following is a summary of the initial model conditions (i.e. tank levels, pumps on / off, etc.) categorized by the various pressure gradients: Facility Status Low Service (334 ) Gradient - Setian Lane Tank 332 feet - Seven Mile Road Reservoirs 334 feet (locked up) - Frenchtown Road Tank 332 feet - Tiogue Avenue Tank 333 feet - Wakefield Street Tank 327 feet - West Street Tank Out of Service - Offline - Mishnock Wells Off Inactive - East Greenwich Well On Active - Spring Lake (Coventry) Well On Active - Clinton Avenue Pump Station On Three Pumps Active - Bald Hill Road Pump Station On Three Pumps Active Intermediate High (430 ) Gradient - Read School House Road Tank 427 feet - Knotty Oak Pump Station On One Pump Active High Service (500 ) Gradient - Technology Park Tank 497 feet - Carrs Pond Tank 487 feet - Johnson Boulevard Pump Station On One Pump Active Low Service Reduced (334 ) Gradient - Centerville Road PRV Station Active - Open - Division Road PRV Station Active - Open - Middle Road PRV Station Active - Open - Cowesett Road PRV Station Active - Open 27
30 - Love Lane PRV Station Active - Open - Post Road PRV Station Active - Open High Service (500 ) Reduced Gradient - Mishnock Road PRV Station Active Open - Helen Ave. PRV Station Active Open Warwick Tanks (232 ) Gradient - Warwick Tanks (12 MGD Storage) Active - Open Hope Road (510 ) Gradient - Hope Road Booster Pump Station Active Hydro pneumatic Tank Oaklawn (231 ) Gradient - Wholesale Connection to Providence Water Active - Open Results Summary: This scenario was premised on a total system demand of 15,315 gpm or 22.1 MGD, which is the system demand including unmetered water volume. The scenario indicates that the total volume of flow being depleted from the tanks (aggregate volume draining out of storage tanks) is equal to 1,894 gpm or 2.7 MGD. Overall, the hydraulic gradients for the various pressure zones were calculated to be in the range in which these pressure zones are normally operated. Facility Output Results Summary Low Service (334 ) Gradient - Setian Lane Tank Filling 1,200 gpm - Seven Mile Road Reservoirs Locked up - Frenchtown Road Tank Draining 568 gpm - Tiogue Avenue Tank Draining 1,030 gpm - Wakefield Street Tank Draining 950 gpm - West Street Tank Out of Service - offline - Mishnock Wells Off inactive - East Greenwich Well 1,150 gpm output - Spring Lake (Coventry) Well 302 gpm output - Clinton Avenue Pump Station 6,525 gpm output - Bald Hill Road Pump Station 5,095 gpm output Intermediate High (430 ) Gradient - Read School House Road Tank Filling 804 gpm - Knotty Oak Pump Station 1,444 gpm output High Service (500 ) Gradient - Technology Park Tank Draining 819 gpm - Carrs Pond Tank Draining 567 gpm 28
31 - Johnson Boulevard Pump Station 1,106 gpm output Low Service Reduced (334 ) Gradient - Centerville Road PRV Station Open 429 gpm - Division Road PRV Station Open 582 gpm - Middle Road PRV Station Open 447 gpm - Cowesett Road PRV Station Open 515 gpm - Love Lane PRV Station Open 433 gpm - Post Road PRV Station Open 615 gpm High Service (500 ) Reduced Gradient - Mishnock Road PRV Station Open 340 gpm - Helen Ave. PRV Station Open 400 gpm Warwick Tanks (232 ) Gradient - Warwick Tanks (12 MGD Storage) Draining 5,104 gpm (total) Hope Road (510 ) Gradient - Hope Road Booster Pump Station gpm output Oaklawn (231 ) Gradient - Wholesale Connection to Providence Water Open 571 gpm 29
32 5.0 Model Calibration 5.1 General As stated previously, every effort was made to mathematically reproduce the KCWA s water supply and distribution system in such a manner as to realistically simulate existing physical operation of the water system under various flow and operating conditions. The completed hydraulic model as described herein accurately represents the physical system infrastructure of the water system facilities in order to perform simulations to realistically simulate the existing operation practices of the KCWA water supply and distribution system. To accomplish this task, all readily available system operation data was reviewed (i.e. flow records, consumption data, drawings and cut sheets of infrastructure, mapping, etc.) and applied to each scenario in the model in order to represent actual system operating conditions. This was supplemented by information obtained from operations personnel. The data provided by the KCWA was applied to an average day, maximum day and peak hour scenario in the model. Calibration is achieved by comparing results of various scenarios in the model with the performance of the physical system. Actual recorded system conditions (i.e. flow records, tank charts, pressure readings, etc.) are compared to calculated values in the model during a time when the system is most closely experiencing a particular demand scenario. The model is considered calibrated when it is concluded that the actual physical conditions as evidenced through historic and current records are within an acceptable tolerance to the model output results. According to the American Water Works Association (AWWA) Distribution Network Analysis for Water Utilities, a model is acceptably calibrated if it predicts performance within 5 to 10 percent of observed performance. For purposes of completing and calibrating the model for the KCWA system, it is expected that the completed model is able to predict observed performance in the system to 5 percent or better thus achieving a relative accuracy of upwards of 95 percent. An inherent problem in calibrating a hydraulic computer model is the vast number of system infrastructure changes that occur routinely through ongoing capital and infrastructure improvement projects. For example, when reviewing historic data with which to compare computed results, it is critical to consider that various improvements are likely to have occurred since the recording of the data. This may impact the results in that the improvements are likely to have been included in the model yet the historical data was collected when these improvements were not in place. Most critical are pipeline improvement projects involving large water transmission mains. Such improvements can dramatically alter the flow patterns throughout the water system. Nevertheless an attempt was made to correlate historic data with actual model results in order to achieve a relative accuracy of the model that is consistent with standard hydraulic modeling practices. 30
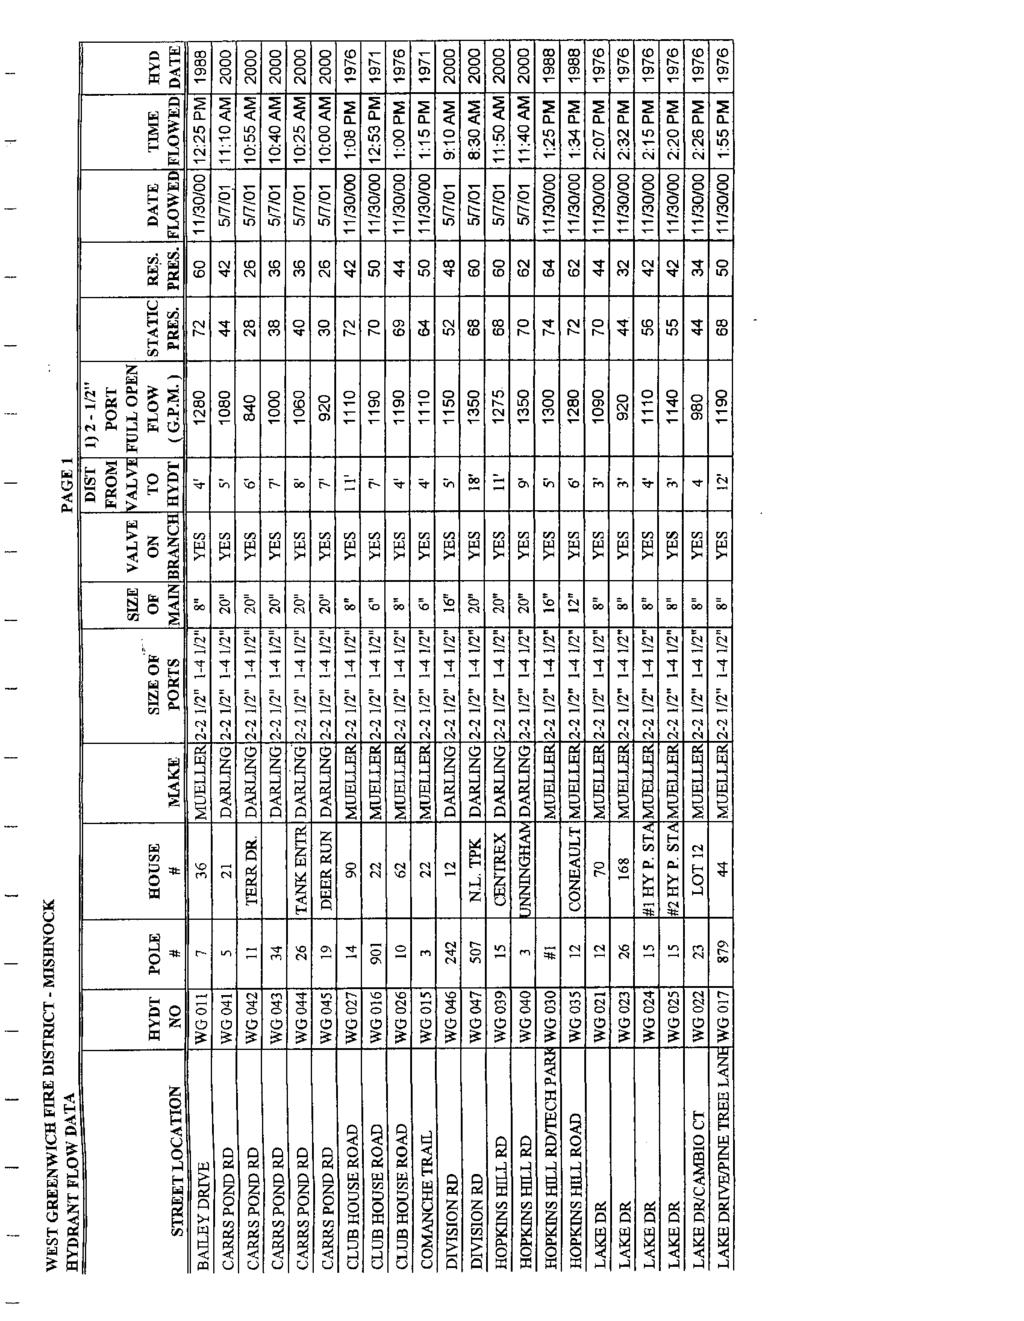
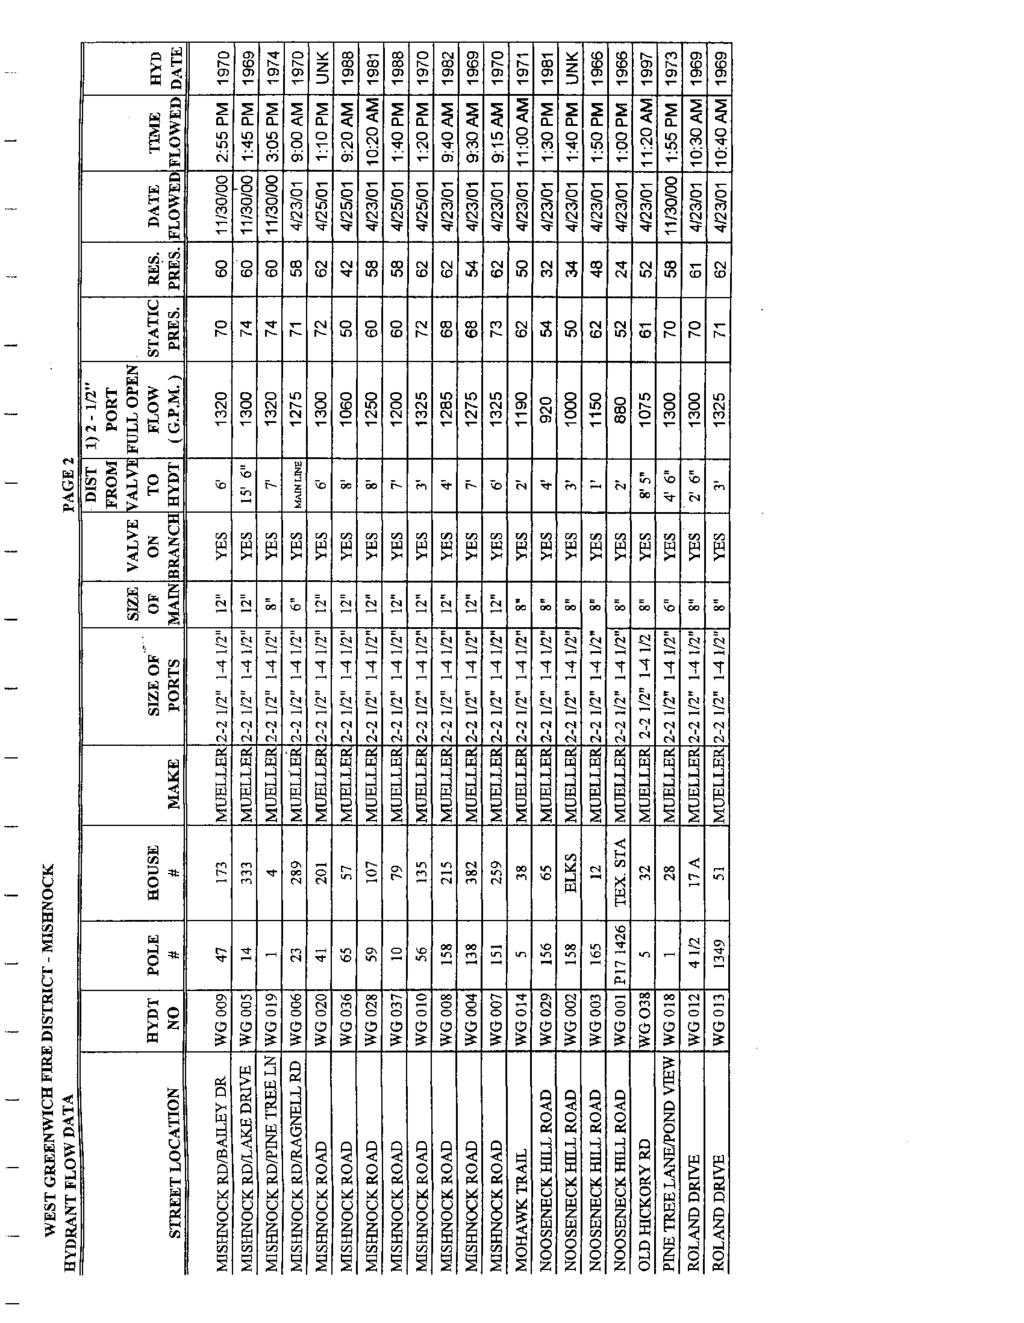
33 For purposes of calibration, it is ideal to collect operational data during the periods at which the maximum day and peak hour demands occur. The system experiences the greatest head losses at times when these maximum demand conditions occur and are most measurable by the model. The model calculates head losses at specific demand conditions therefore, field measurements of operational conditions will be more accurate due to the fact that there is more head loss during periods at which the flows are highest. To establish data in the base scenario of the model, it is best to collect physical data when demands are low to ensure that interference with system operations is minimized. As part of the model verification and calibration process, C&E was provided with field test results from a series of hydrant tests conducted by KCWA personnel from 2000 and 2001 in East Greenwich, West Greenwich and Coventry. This data was correlated by street location and was completed on various fire hydrants throughout the system. As a means to compare model results and to obtain a level of verification, a comparison was made to the recorded static pressure obtained from the field test results and that predicted by the model under an average day simulation. It should be noted that historical records were available as to the tank level, pumps operating, etc. at the time of the tests, however it is considered impractical to attempt to correlate the actual flow test data to predicted model results. This is due to the fact that since the tests were completed (two years previous) substantial infrastructure improvements were conducted which were included in the model thus making calibration with the use of these actual flow tests impossible. The following table illustrates a comparison of a random selection of twenty two (22) historical hydrant flow test data compared to predicted model results for an Average Day simulation. The nearest junction node to the test hydrant was utilized for purposes of comparison. In general, the percentage of accuracy was in the range of 93 to near 100 percent with an average relative accuracy of 96.1 percent. 31
34 STREET CITY/TOWN STATIC PRESSURE* (PSI) CALCULATED MODEL PRESSURE (PSI) JUNCTION NODE** % ACCURACY Brayton St. EG J Brisas Cir. EG J J J Chief Botelho Ct. EG J J Arrowhead Tr. EG J J Boxwood Dr. EG J J Bailey Dr. WG J J Lake Dr./Cambio Ct. WG J Lake Dr./Pine WG J Tree Ln. Mohawk Tr. WG J Old Hickory WG J Rd. Mishnock Rd./Ragnell Rd. WG J Chandler COV J Dr./Daniel Dr. Diane Dr. COV J Gail Ct. COV J J Lloyd Dr./Alvero Rd. COV J Average 96.1 ** The location of the hydrant was correlated to the nearest junction node in the model. * Hydrant flow tests were conducted by KCWA from October 2000 to June Further verification as to the relative accuracy of the model was achieved through a review of the historical pump flow and head and tank chart data supplied by KCWA. The comparison of the computer outputs from the major pumping stations such as Clinton Avenue have been found to be near accurate to historic data when comparing station output and total system head with various combinations of pumps running. This is further affirmed through additional comparison of results to other booster pump stations and tank charts for rates of tanks filling and draining. 32
35
36
37
38
39
40

41
42
43
44
45
46
47
48
49
50
51
52

53
54
55
56
57
58
59
60
61
62

63
64
65
66
67
68
69
70
71
72
73
74
75
76
77
78
79
80

81
82
83
84
85

86
87
88
89

90
91
92

93

94
95

96

97

98

99

100
101

102

103

104

105
106

107
108

109

110

111
112
113

114
115

116

117

118

119

120

121
122
123

124
125
126

127

128

129

130
131

132

133

134

135

136

137
138
139

140

141
142
143

144

145
146

147

148

149

150
151
152
153
154
155
156
157
158
159
160
161
162
163
164
165
166
167
168
169
170
171
172
173
174
175
176
177
178
179
180

181
182
183

184

185
186
187
188

189

190

191
192
193

194
195
196
197
198

199

200
KENT COUNTY WATER AUTHORITY WATER SUPPLY SYSTEM FIVE YEAR CAPITAL IMPROVEMENT PROGRAM UPDATE
 J0711.02 KENT COUNTY WATER AUTHORITY WATER SUPPLY SYSTEM FIVE YEAR CAPITAL IMPROVEMENT PROGRAM UPDATE 2012-2017 Prepared By: C&E Engineering 342 Park Avenue Woonsocket, RI 02895 January 2012 Table of Contents
Kent County Water Authority Distribution Storage Tank Hydraulic Evaluation
 C&E Engineering Partners, Inc. 342 Park Avenue Woonsocket, RI, 02895 Ph: (401) 762-1711 Fax: (401) 235-9088 Kent County Water Authority Distribution Storage Tank Hydraulic Evaluation Technical Memorandum
Section 7 Hydraulic Model Development and Evaluation Criteria
 Section 7 Hydraulic Model Development and Evaluation Criteria The hydraulic evaluation conducted to develop this master plan was performed using a computer model of the reclaimed water distribution system.
Report. Lake Water Supply Hydraulic Modeling. Village of. Lindenhurst, IL. April 2012
 Lake Water Supply Hydraulic Modeling Report Village of Lindenhurst, IL April 2012 R:\MAD\Documents\Reports\Archive\2012\Lindenhurst, IL\Lake Water Supply.HM.1290.039.mjf.jan\Report\!Front Cover (Blue=Water)
Table of Contents. 3.1 Source Capacity Analysis
 Table of Contents 3.1 Source Capacity Analysis... 3-1 3.1.1. Design Criteria... 3-1 3.1.2. Source Capacity Evaluation... 3-1 3.1.2.1 Plateau Zone... 3-1 3.1.2.2 Cascade View Zone... 3-4 3.2 Storage Capacity
FREELAND WATER & SEWER DISTRICT BERCOT ROAD INTERTIE STUDY
 FREELAND WATER & SEWER DISTRICT ISLAND COUNTY WASHINGTON BERCOT ROAD INTERTIE STUDY G&O #13507 NOVEMBER 2013 FREELAND WATER & SEWER DISTRICT ISLAND COUNTY WASHINGTON BERCOT ROAD INTERTIE STUDY G&O #13507
TOWN OF MOUNT PLEASANT WESTCHESTER COUNTY, NEW YORK
 TOWN OF MOUNT PLEASANT WESTCHESTER COUNTY, NEW YORK COST EVALUATION FOR ROLLING HILLS AREA WATER MAIN EXTENSION PROFESSIONAL CONSULTING, LLC. Octagon 10, Office Center 1719 Route 10, Suite 225 Parsippany,
CHAPTER 4 HYDRAULIC ANALYSIS
 CHAPTER 4 HYDRAULIC ANALYSIS This chapter presents information on the computer hydraulic model of the City s water system and the results of hydraulic analyses. The purpose of the hydraulic analysis is
Section 9 Distribution System Analysis
 Section 9 Distribution System Analysis This section presents the analysis of the City of Sunnyside s (City) distribution system. Hydraulic modeling was performed to evaluate the adequacy of existing facilities
2014 Plan of Conservation and Development. Municipal Infrastructure
 The Town of Hebron 2014 Plan of Conservation and Development Section 5 Municipal Infrastructure H. Utilities 1. Water Both the residential and business sections of the Town of Hebron rely to a large extent
EXECUTIVE SUMMARY. The capital improvements costs through Year 2025 have been summarized as follows: RECOMMENDED IMPROVEMENTS (Ref.
 EXECUTIVE SUMMARY This report evaluates the ability of the Dothan Water System to adequately meet the City s short range and future water supply, infrastructure and maintenance needs. The report evaluated
West Bountiful City. Water System Capital Facilities Plan
 Water System Capital Facilities Plan August 2008 TABLE OF CONTENTS 1.0 Executive Summary... 1 2.0 Definition of Terms and Abbreviations... 2 3.0 Introduction... 3 3.1 Background...3 3.2 Scope of Investigation...3
CITY OF LAGRANGE, GEORGIA UTILITY DEPARTMENT WATER CONSERVATION AND DROUGHT CONTINGENCY PLANS
 CITY OF LAGRANGE, GEORGIA UTILITY DEPARTMENT WATER CONSERVATION AND DROUGHT CONTINGENCY PLANS Modified: May 2012 WATER CONSERVATION PLAN SYSTEM MANAGEMENT AND SALES Permit Information. The City of LaGrange
Hydraulic Modeling and System Optimization
 DRINKING WATER ENERGY MANAGEMENT WORKSHOP SERIES TAKING ENERGY IMPROVEMENTS TO THE NEXT LEVEL: Hydraulic Modeling and System Optimization Steven Jones, M.S., P.E. September 4, 2013 What is a Water System
Utilities are constantly striving to
 Comprehensive Approach to Increase Effectiveness & Efficiency of Flushing Programs Using Latest Hydraulic & Water Quality Monitoring Tools Kelcia D. Mazana, Edward H. Talton Jr., and C. Robert Reiss Utilities
Water Storage Feasibility Study
 Water Storage Feasibility Study Charter Township of Commerce Prepared By: Giffels-Webster Engineers, Inc. 2871 Bond Street Rochester Hills, MI 48309 Table of Contents Introduction..... Page 1 Scope of
About Me. Overview. Seattle Regional Water System. Seattle Regional Water System. Water System Analysis and Design at Seattle Public Utilities
 About Me Water System Analysis and Design at Seattle Public Utilities Jon C. Ford, P.E. CEE 481 October 1, 8 Senior Civil Engineer, Seattle Public Utilities BSCE, Seattle University MSCE, University of
South Coast Water District 2017 Master Plan Updates
 South Coast Water District 2017 Master Plan Updates SCWD Sara Mathis, PE AECOM Henry Liang, PE Kelly McEnerney, EIT June 22, 2017 2017 Master Plan Update Presentation Outline Approach Potable Water System
ENGINEERING REPORT WATER SUPPLY
 PROPOSED RESIDENTIAL DEVELOPMENT, CORAL SPRINGS TRELAWNY FCS #: 1124/76/C ENGINEERING REPORT WATER SUPPLY PREPARED FOR Gore Developments Limited 2c Braemar Ave, Kingston 10 FEBRUARY 2012 1 TABLE OF CONTENTS
El Margarita Development Analysis
 303 Second Street, Suite 300 South San Francisco, California 94107 415-243-2150 FAX: 415-896-0999 El Margarita Development Analysis 28 January 2015 Prepared for City of Yuba City 1201 Civic Center Boulevard
COLLECTION AND DISTRIBUTION OF WATER
 COLLECTION AND DISTRIUTION OF WATER Addis Ababa University Addis Ababa Institute of Technology Department of Civil Engineering Collection and Distribution of Water Deals with the transport of water from
Ivins City Standard Specifications for Design and Construction Part 2 Engineering and Design Standards
 2.9. WATER SYSTEM DESIGN Ivins City Standard Specifications for Design and Construction All culinary water mains and appurtenances shall be designed to provide for adequate future service for all contiguous
APPENDIX K. Water Supply Report
 APPENDIX K Water Supply Report WATER SUPPLY REPORT FOR THE CHESTER DEVELOPMENT PROJECT Chester Development Town of Chester Section 2, Block 1, Lot 39 Village of Chester Section 107, Block 3, Lot 4 Section
ADVANCED WATER DISTRIBUTION MODELING AND MANAGEMENT
 H A E S T A D M E T H O D S ADVANCED WATER DISTRIBUTION MODELING AND MANAGEMENT F i r s t E d i t i o n Table of Contents Preface Continuing Education Units About the Software xv xix xxi Chapter 1 Introduction
Section 5 - Planning Criteria. Section 5
 Section 5 - Planning Criteria Section 5 SECTION 5 PLANNING CRITERIA This section presents the design criteria and methodologies for analysis used to evaluate the existing distribution system and its facilities
SECTION 4 RECOMMENDED DISTRIBUTION SYSTEM IMPROVEMENTS
 4.1 General SECTION 4 RECOMMENDED DISTRIBUTION SYSTEM IMPROVEMENTS Distribution system improvements, which have been organized and prioritized in this section, are forecasted and intended to be completed
APPENDIX B. WSSC Design Criteria for Water Distribution Systems
 a. System Requirements ) Pressure Requirements APPENDIX B WSSC Design Criteria for Water Distribution Systems a) The water distribution system shall have adequate capacity to supply domestic demand to
Description of Water Systems
 Description of Water Systems 1 WATER SYSTEM OWNERSHIP AND MANAGEMENT The City is a Washington State municipal corporation that owns and operates a Group A community water system within the boundaries of
1. Required Minimum Flow:
 SECTION 6 6. 6.01 General The City of Castle Rock Water System Minimum Standards and Specifications are minimum base level performance, design, and construction standards used to maintain uniformity of
WATER SUPPLY CHALLENGES FOR AN ISLAND COMMUNITY
 WATER SUPPLY CHALLENGES FOR AN ISLAND COMMUNITY Britton Corbin, P.E. Janet McSwain, P.E. AUTHORS: Britton Corbin, Project Engineer, Earth Tech AECOM 2456 Remount Rd. Charleston, SC 29406 Janet McSwain,
Water Distribution System Facility Plan
 Water Distribution System Facility Plan July 2007 CVO\070040005 Contents Section Page Executive Summary...ES-1 1 Introduction...1-1 Financial Plan...1-1 Acknowledgements...1-1 MWC Staff...1-1 MWC Commissioners...1-1
VILLAGE OF BEAR LAKE. Water Reliability Study & General Plan Update
 VILLAGE OF BEAR LAKE MANISTEE COUNTY, MICHIGAN Water Reliability Study & General Plan Update November 2013 Project No. 811320 TABLE OF CONTENTS PAGES I. EXECUTIVE SUMMARY..........................................
Table of Contents Part Title Page
 Table of Contents Part Title Page 1 System Information 1 2 Rate Structure 1 3 Conservation Goals 2 4 Implementation and Tracking 3 5 Conservation Measures 4 Appendix A Appendix B Appendix C Utility Profile
WATER SUPPLY AND DISTRIBUTION PLAN. City of Medina. Adopted November 17, Project Number:
 WATER SUPPLY AND DISTRIBUTION PLAN City of Medina Adopted November 17, 2009 Project Number: 000190-07011-0 CITY OF MEDINA WATER SUPPLY AND DISTRIBUTION PLAN Table of Contents Executive Summary...1 Introduction...
PRELIMINARY WASTEWATER CAPACITY STUDY
 PRELIMINARY WASTEWATER CAPACITY STUDY Tentative Tract Map No. 18955 CITY OF HESPERIA Prepared for: HESPERIA VENTURES I, LLC 10410 Roberts Road Calimesa, CA 92320 Tel (714) 785 2381 Mr. John Ohanian Prepared
Draft. Saipan Final Water Project List
 Saipan Final Water Project List Airport Catchment Yield Enhancement & Treatment Airport owned Tank Modification Annual Leak Detection & Repair As Lito Distribution Project Chalan Galaide Waterline Chinatown/Sugar
EXISTING SYSTEM ANALYSIS
 Chapter 6 EXISTING SYSTEM ANALYSIS This chapter describes the evaluation of the existing water distribution system, using the calibrated hydraulic model and the 2006 water demands. The system evaluations
Utility Partner Data Report
 Utility Partner Data Report Project Title: Studying Distribution System Hydraulics and Flow Dynamics to Improve Water Utility Operational Decision Making Water Distribution System: Paris, Kentucky Project
Why does my water bill cost so much?
 Why does my water bill cost so much? A brief overview from an engineer/operator June 24, 2017 Presented by: Mark Hurley, M.S., P.E., S-1, D-2 What is a water system? Water Production I. Surface Water Intakes
Water Treatment Plant and Water Supply Study CITY OF SNOHOMISH, WASHINGTON
 Water Treatment Plant and Water Supply Study CITY OF SNOHOMISH, WASHINGTON May 2009 TABLE OF CONTENTS EXECUTIVE SUMMARY Page Purpose and Background... ES-1 Existing Water System... ES-1 Water Demands...
Woodbury - Aurora Metro Station
 Woodbury - Aurora Metro Station Master Utility Report Aurora, Colorado E. Centrepoint Dr. and E. Alameda Dr. Prepared By: Galloway 6162 S. Willow Drive, Suite 32 Greenwood Village, CO 8111 33.77.8884 POC:
CHAPTER 4 SYSTEM DESIGN CRITERIA
 INTRODUCTION CHAPTER 4 SYSTEM DESIGN CRITERIA Adequate design of the District s wastewater conveyance facilities requires the determination of the quantity of wastewater from contributing sources. The
CHAPTER 8 CAPITAL IMPROVEMENT PLAN
 INTRODUCTION CHAPTER 8 CAPITAL IMPROVEMENT PLAN This chapter presents 6-, 10-, and 20-year Capital Improvement Plans (CIPs) in accordance with the requirements of WAC 26-290. Water system capital improvements
DRAFT TECHNICAL MEMORANDUM
 Stetson Engineers, Inc. Technical Memorandum - New City of Solvang Well Field, May 14, 2010 DRAFT TECHNICAL MEMORANDUM 2171 E. Francisco Blvd., Suite K San Rafael, California 94901 TEL: (415) 457-0701
To: From: Date: Subject: Sherwood Lakes Drainage Alternatives Analysis 1
 To: From: The City of Virginia Beach Lewis White and Rachael Johnson on behalf of WSP Date: June 6, 2017 Subject: s Drainage Alternatives Analysis This memorandum represents the summary of findings from
TOWN OF LONDONDERRY, NEW HAMPSHIRE WASTEWATER FACILITIES PLAN UPDATE TABLE OF CONTENTS
 6%34(6%4(2 )%&+-+4+(3 1-%/ 51 %4( :=>?;9 406/ 0) -0/ 0/ (227! /(6 *%.13*+2(,8A #""$ TOWN OF LONDONDERRY, NEW HAMPSHIRE WASTEWATER FACILITIES PLAN UPDATE TABLE OF CONTENTS SECTION DESCRIPTION PAGE ES
Montara Water and Sanitary District 2011 New Customer CIP and Water Capacity Charge. Presentation to Board April 21, 2011
 Montara Water and Sanitary District 2011 New Customer CIP and Water Capacity Charge Presentation to Board April 21, 2011 PRESENTATION OUTLINE Master Plan Overview Purpose and Approach Supply and Demand
CHAPTER 6 Evaluation of Future Water System at Buildout
 CHAPER 6 Evaluation of Future Water System at Buildout 6.1 OVERVIEW his chapter presents an evaluation of the City s future expanded water distribution system and its ability to meet recommended water
PRESSURIZED IRRIGATION SYSTEM MASTER PLAN
 PRESSURIZED IRRIGATION SYSTEM MASTER PLAN (HAL Project No.: 314.04.100) FINAL REPORT January 2009 ACKNOWLEDGMENTS Successful completion of this study was made possible by the cooperation and assistance
Northridge Earthquake: A Review of the Performance of Various Water Main and Service Line Materials
 TITLE: Northridge Earthquake: A Review of the Performance of Various Water Main and Service Line Materials AUTHOR: Keith A. Abercrombie (contact and presenter) General Manager Valencia Water Company 24631
SYSTEM ID: KY 10 NARRATIVE DESCRIPTION
 SYSTEM ID: KY 10 NARRATIVE DESCRIPTION KY 10 is primarily a branched system in Kentucky with the following assets: 13 Tanks, 13 Pumps, 1 Water Treatment Plant, and approximately 1353879 feet of pipe. KY
Water Distribution System Calibration Report
 Project Title: Studying Distribution System Hydraulics and Flow Dynamics to Improve Water Utility Operational Water Distribution System: Paris, Kentucky Project No.: 02-10-UK Grant No.: HSHQDC-07-3-00005
SYSTEM ID: KY 3 NARRATIVE DESCRIPTION
 SYSTEM ID: KY 3 NARRATIVE DESCRIPTION KY 3 is primarily a grid system in Kentucky with the following assets: 3 Tanks, 5 Pumps, 1 Water Treatment Plant, and approximately 277,022 feet of pipe. KY 3 provides
SALEM CITY REQUEST FOR PROPOSAL CULINARY AND SECONDARY WATER MASTER PLAN 5/2/2018
 SALEM CITY REQUEST FOR PROPOSAL CULINARY AND SECONDARY WATER MASTER PLAN 5/2/2018 Salem City (City) is now accepting Proposals for the development of a comprehensive Salem City Culinary Water and Secondary
TOWN OF AURORA DRINKING WATER QUALITY ANNUAL REPORT
 TOWN OF AURORA DRINKING WATER QUALITY ANNUAL REPORT JANUARY 1 TO DECEMBER 31, 2009 New Regulations Amendments to Ontario Regulation 170/03 came into effect on June 5, 2006. The provincially mandated amendments
Teton County Solid Waste Transfer Station Water Supply Study
 Teton County Solid Waste Transfer Station Water Supply Study Prepared for TETON COUNTY INTEGRATED SOLID WASTE & RECYCLING November 2018 NELSON ENGINEERING 430 S. CACHE STREET JACKSON, WY INTRODUCTION Teton
South Coast Water District 2016 Master Plan Updates
 South Coast Water District 2016 Master Plan Updates SCWD Sara Mathis, PE AECOM Henry Liang, PE Greg Bradshaw, PE Kelly McEnerney, EIT November 14, 2016 2016 Master Plan Update Presentation Outline Approach
SEWER SYSTEM DESIGN GUIDELINES
 SEWER SYSTEM DESIGN GUIDELINES PART 1 GENERAL 1.1 GENERAL GUIDELINES A. The following sewer system design guidelines are based on Federal, State and Local health requirements, and the Berkeley County Water
2006 Water Master Plan
 2006 Water Master Plan Prepared for: City of Fountain 116 South Main Street Fountain, Colorado 017 Prepared by: Black & Veatch Corporation 6300 South Syracuse Way Suite 300 Centennial, Colorado 0111 Project
Section 4 Existing Reclaimed Water Demands
 Section 4 Existing Reclaimed Water Demands Historical reclaimed water billing and pumping records and individual customer metering data were analyzed to determine current demands on the reclaimed water
EAST SMITHFIELD WATER DISTRICT WATER SUPPLY SYSTEM MANAGEMENT PLAN EXECUTIVE SUMMARY. REPORT PARE Project No
 REPORT PARE Project No. 05136.12 EAST SMITHFIELD WATER DISTRICT WATER SUPPLY SYSTEM MANAGEMENT PLAN EXECUTIVE SUMMARY PREPARED FOR: EAST SMITHFIELD WATER DISTRICT 307 WATERMAN AVENUE SMITHFIELD, RHODE
UNIFORM DESIGN AND CONSTRUCTION STANDARDS FOR EXTENDING WATER DISTRIBUTION SYSTEMS SECTION 2 DESIGN STANDARDS
 UNIFORM DESIGN AND CONSTRUCTION STANDARDS FOR EXTENDING WATER DISTRIBUTION SYSTEMS SECTION 2 DESIGN STANDARDS DESIGN STANDARDS SECTION 2 INDEX ITEM DESCRIPTION 2.00 GENERAL STATEMENT 2.01 WATER DISTRIBUTION
Utility Partner Data Report
 Utility Partner Data Report Project Title: Studying Distribution System Hydraulics and Flow Dynamics to Improve Water Utility Operational Decision Making Water Distribution System: Nicholasville, Kentucky
Thermal and Hydro Power Plant Maintenance Deer Island Treatment Plant
 Massachusetts Water Resources Authority Presentation to MWRA Board of Directors Thermal and Hydro Power Plant Maintenance Deer Island Treatment Plant March 12, 2014 On-Site Thermal/Power Plant Built in
MEMORANDUM. The general findings of the assessment are as follows:
 November 28, 2006 MEMORANDUM Project No.: 030009-002-01 To: From: Re: WRIA 31 Planning Unit Steve Germiat, LHG, CGWP, and Timothy J. Flynn, LHG, CWGP Evaluation of Winterizing Existing River Pump/Conveyance
2013 ANNUAL WATER REPORT
 2013 ANNUAL WATER REPORT May 2014 TABLE OF CONTENTS Page 2 1.0 INTRODUCTION... 3 2.0 PARKSVILLE WATER SYSTEM... 3 3.0 DISTRIBUTION SYSTEM... 6 4.0 SCADA... 9 5.0 WATER SAMPLING AND TESTING... 10 6.0 WATER
North and South Plan ALBERT JUNE 2. G:\2013\ \Reports\N and S Water AFC\Cover Page North and South AFC Water Master Plan.docx.
 North and South Plan AFC Water Master Prepared for: WESTERN MUNICIPAL WATER DISTRICT 14205 Meridian Parkway. Riverside, CA 92518 (951) 571-7100 Prepared by: ALBERT A. WEBBB ASSOCIATES 3788 MCCRAY STREET
CITY OF SASKATOON DESIGN AND DEVELOPMENT STANDARDS MANUAL SECTION FOUR WATER DISTRIBUTION SYSTEM
 CITY OF SASKATOON DESIGN AND DEVELOPMENT STANDARDS MANUAL SECTION FOUR WATER DISTRIBUTION SYSTEM 2018 TABLE OF CONTENTS Section Four Water Distribution System SECTION PAGE NUMBER 1. Objective...1 2. Submissions
Table A Summary Water System Data Data
 PS OMAS TECHNICAL MEMORANDUM NO. 2 To: From: Trish Rhay, Mark Cuneo Mike Swan, PE, Harvey Gobas, PE and Neha Gajjar, PE Date: Subject: EXECUTIVE SUMMARY The of Beverly Hills (CBH) has ten (10) active reservoirs
Section V WATER DISTRIBUTION SYSTEM DESIGN GUIDELINES
 Section V WATER DISTRIBUTION SYSTEM DESIGN GUIDELINES A. GENERAL 1. The following water system design guidelines are based on Federal, State and local health requirements and the Hilton Head No. 1 Public
Permit for Construction of an Extension to a JEA Drinking Water Distribution System and/or JEA Wastewater Collection/Transmission System
 Permit for Construction of an Extension to a JEA Drinking Water Distribution System and/or JEA Wastewater Collection/Transmission System INSTRUCTIONS: This form shall be completed and submitted (in duplicate)
SECTION 4 - DESIGN STANDARDS FOR WATER DISTRIBUTION FACILITIES
 SECTION 4 - DESIGN STANDARDS FOR WATER DISTRIBUTION FACILITIES 4.1 GENERAL REQUIREMENTS 4.1.1 Water and fire protection distribution facilities are to be provided solely for the purpose of supplying potable
Water and Wastewater Impact Fee Analysis Capital Improvement Plan City of Lockhart February 2017
 TABLE OF CONTENTS 1.0 INTRODUCTION... 1 2.0 ANALYSIS OF WATER & WASTEWATER SYSTEMS... 1 2.1 Present Water Demands... 1 2.2 Water Supply... 3 2.3 Water Treatment Plant... 4 2.4 Storage, High-Service Pumps,
SYSTEM ID: New York Tunnels System
 SYSTEM ID: New York Tunnels System NARRATIVE DESCRIPTION The New York Tunnels System represents the major water supply transmission tunnels for the City of New York in 1969. The system consists of 1 reservoir
AUGUST 30, 2016 DRAFT WATER SYSTEM PLAN TEXT AND TABLES BYWATER BAY WATER SYSTEM WITHOUT SHINE PLAT
 AUGUST 30, 2016 DRAFT WATER SYSTEM PLAN TEXT AND TABLES BYWATER BAY WATER SYSTEM WITHOUT SHINE PLAT 1. SYSTEM OVERVIEW The Bywater Bay Water System (DOH Water System ID number 02043P) is located in eastern
ALL ABOUT WATER IN HOT SPRINGS VILLAGE
 ALL ABOUT WATER IN HOT SPRINGS VILLAGE Lake & Water Management Committee - 2006 Revised January 2009 #1 Water Overview #2 Water Issues 2009 #3 Water in the Future #4 Water Conservation Measures #1- Hot
The Impact of Pressure Management Techniques on the Water Age in an Urban Pipe Network The Case of Kos City Network
 Proceedings The Impact of Pressure Management Techniques on the Water Age in an Urban Pipe Network The Case of Kos City Network Anastasia Kravvari, Vasilis Kanakoudis * and Menelaos Patelis Civil Engineering
A Balancing Act: Complex Distribution System Planning in the Western North Carolina Foothills Tina Whitfield - HDR
 A Balancing Act: Complex Distribution System Planning in the Western North Carolina Foothills Tina Whitfield - HDR 2017 HDR, Inc., all rights reserved. Agenda 01 Overview 02 Approach 03 Findings 04 Alternatives
A SIMPLE SOLUTION TO BIG SNAIL PROBLEMS - A CASE STUDY AT VSFCD S RYDER STREET WASTEWATER TREATMENT PLANT
 A SIMPLE SOLUTION TO BIG SNAIL PROBLEMS - A CASE STUDY AT VSFCD S RYDER STREET WASTEWATER TREATMENT PLANT Timothy R. Tekippe, P.E.,* Robert J. Hoffman, P.E.,* Ronald J. Matheson,** Barry Pomeroy** *Carollo
2011 ANNUAL WATER REPORT
 2011 ANNUAL WATER REPORT June 2012 Engineering and Operations Department TABLE OF CONTENTS Page 2 1.0 INTRODUCTION... 3 2.0 PARKSVILLE WATER SYSTEM... 3 3.0 DISTRIBUTION SYSTEM... 6 4.0 SCADA... 9 5.0
CITY OF MILTON PIERCE/KING COUNTY, WASHINGTON WATER SYSTEM PLAN
 CITY OF MILTON PIERCE/KING COUNTY, WASHINGTON WATER SYSTEM PLAN G&O #08474 July 2010 EXECUTIVE SUMMARY TABLE OF CONTENTS CHAPTER 1 DESCRIPTION OF THE WATER SYSTEM INTRODUCTION... 1-1 SYSTEM OWNERSHIP
APPENDIX A71.1. President Promises Funds for K-IV, DAWN, Tuesday January 15, 2008
 CHAPTER 7 APPENDIX A71.1 President Promises Funds for K-IV, DAWN, Tuesday January 15, 2008 A71.1 President Promises Funds for K-IV, DAWN Tuesday January 15, 2008 A71-1 APPENDIX A72.1 Notification of the
MUNICIPAL WASTEWATER PUMP STATION DESIGN PROBLEMS AND SOLUTIONS Jeff Chapin, P.E. Dewberry 8401 Arlington Boulevard Fairfax, VA 22032
 MUNICIPAL WASTEWATER PUMP STATION DESIGN PROBLEMS AND SOLUTIONS Jeff Chapin, P.E. Dewberry 8401 Arlington Boulevard Fairfax, VA 22032 ABSTRACT The growth of the Northern Virginia Area around Washington
TABLE OF CONTENTS PART III MINIMUM DESIGN STANDARDS Section 115 WATER DISTRIBUTION SYSTEM GENERAL SIZING LINES 115.
 TABLE OF CONTENTS PART III MINIMUM DESIGN STANDARDS Section 115 WATER DISTRIBUTION SYSTEM SECTION TITLE PAGE 115.1 GENERAL 115.1 115.2 SIZING LINES 115.1 115.3 DISTRIBUTION SYSTEM 115.2 115.3.1 Layout
The Sustainability of Floods Pond
 The Sustainability of Floods Pond Bangor Water District s Public Water Supply Presented By: Rick Pershken Bangor Water District Overview Brief BWD History Watershed Characteristics Lake Characteristics
Municipal Service Review
 Willow Creek Community Services District Municipal Service Review May 2008 Prepared by: For the District Sphere of Influence Report TABLE OF CONTENTS Page Local Agency Formation Commission Authority...
2012 ANNUAL WATER REPORT
 2012 ANNUAL WATER REPORT May 2013 TABLE OF CONTENTS Page 2 1.0 INTRODUCTION... 3 2.0 PARKSVILLE WATER SYSTEM... 3 3.0 DISTRIBUTION SYSTEM... 6 4.0 SCADA... 9 5.0 WATER SAMPLING AND TESTING... 10 6.0 WATER
AUGUST 30, 2016 DRAFT WATER SYSTEM PLAN TEXT AND TABLES BYWATER BAY WATER SYSTEM WITH SHINE PLAT
 AUGUST 30, 2016 DRAFT WATER SYSTEM PLAN TEXT AND TABLES BYWATER BAY WATER SYSTEM WITH SHINE PLAT 1. SYSTEM OVERVIEW The Bywater Bay Water System (DOH Water System ID number 02043P) is located in eastern
Springfield Utility Board, Oregon Rainbow Water District, Oregon
 WATER MANAGEMENT AND CONSERVATION PLAN Springfield Utility Board, Oregon Rainbow Water District, Oregon August 2012 WATER MANAGEMENT AND CONSERVATION PLAN FOR SPRINGFIELD UTILITY BOARD AND RAINBOW WATER
WATER AND WASTEWATER MASTER PLAN
 WATER AND WASTEWATER MASTER PLAN PRINCE GEORGE COUNTY ENGINEERING AND UTILITIES DEPARTMENT DEI Project No.: 50068442 January 2016 SUBMITTED BY: Dewberry 4805 Lake Brook Drive, Suite 200 Glen Allen, Virginia
CHAPTER 5 WATER SYSTEM DESIGN STANDARDS
 CHAPTER 5 WATER SYSTEM DESIGN STANDARDS TABLE OF CONTENTS CHAPTER 5 WATER SYSTEM DESIGN STANDARDS 5.00 Objective Page 1 5.01 Additional Referenced Standards Page 1 5.02 Special Design Problems Page 2 5.03
CHAPTER 1 DESCRIPTION OF WATER SYSTEM
 CHAPTER 1 DESCRIPTION OF WATER SYSTEM This Chapter presents information on ownership and management of the water system, system history and background information, inventory of existing facilities, related
Why is protecting the groundwater so important?
 Protecting our water resources from infiltration has been a major concern for units of government for several years. Prompted by the Michigan Department of Environmental Quality, government officials have
CITY AND VILLAGE OF PEWAUKEE WATER UTILITY CONSOLIDATION STUDY
 CITY AND VILLAGE OF PEWAUKEE WATER UTILITY CONSOLIDATION STUDY CITY/VILLAGE OF PEWAUKEE WAUKESHA COUNTY, WISCONSIN AUGUST/2009 RUEKERT/MIELKE W233 N2080 Ridgeview Parkway 2009 Copyright Ruekert & Mielke,
The purpose of distribution system is to deliver water to consumer with appropriate quality, quantity and pressure. Distribution system is used to
 Water Distribution System INTRODUCTION The purpose of distribution system is to deliver water to consumer with appropriate quality, quantity and pressure. Distribution system is used to describe collectively
This is a digital document from the collections of the Wyoming Water Resources Data System (WRDS) Library.
 Library.") This is a digital document from the collections of the Wyoming Water Resources Data System (WRDS) Library. For additional information about this document and the document conversion process, please contact
This is a digital document from the collections of the Wyoming Water Resources Data System (WRDS) Library. For additional information about this document and the document conversion process, please contact
Introduction. Purpose
 Introduction This Master Plan update includes updating the text of the Utilities Section of the current Master Plan and adding a report concerning telecommunications. Each element examines the existing
WATER SYSTEM PRESENTATION. Presenter: Mike Oemcke Company: OCWA Central New York s Water Authority Department: Water System Engineering
 WATER SYSTEM PRESENTATION 2017 Presenter: Mike Oemcke Company: OCWA Central New York s Water Authority Department: Water System Engineering OUTLINE SYSTEM OVERVIEW SOURCES OF SUPPLY MAJOR FACILITIES PRESSURE
This is only a general checklist; please refer to the CVWD Development Design Manual (DDM) for all requirements and regulations.
 for all requirements and regulations.") COACHELLA VALLEY WATER DISTRICT DOMESTIC WATER CHECKLIST Tract/Parcel No: Project Common Name: Developer: Engineer: Engineer Signature: Date: Phone: Phone: Print: This is only a general checklist; please
COACHELLA VALLEY WATER DISTRICT DOMESTIC WATER CHECKLIST Tract/Parcel No: Project Common Name: Developer: Engineer: Engineer Signature: Date: Phone: Phone: Print: This is only a general checklist; please
WATER SYSTEM MASTER PLAN 10. DISTRIBUTION SYSTEM EVALUATION
 WATER SYSTEM MASTER PLAN 10. DISTRIBUTION SYSTEM EVALUATION This section provides an analysis of the current water distribution system s performance. Evaluation criteria, supply scenarios, and evaluations