Technical Report. Part 1 of 5: The Application of Target Value Design in the Design and Construction of the UHS Temecula Valley Hospital
|
|
|
- Carmel Sherman
- 6 years ago
- Views:
Transcription


1 Technical Report Part 1 of 5: The Application of Target Value Design in the Design and Construction of the UHS Temecula Valley Hospital Doanh Do, Glenn Ballard, Patricia Tillmann Project Production Systems Laboratory University of California, Berkeley October 2015
2 Table of Contents 1 Introduction Research Objectives The Case Study Project Literature Review Target Value Design Target Value Design Benchmarks Integrated Project Delivery (IPD) Sutter Health s 5 Big Ideas Research methodology Case Study Method Analytical framework Data Collection Techniques Interviews Document Analysis Surveys Target Value Design Research Group Meeting Research Findings Project History Lean Training at Temecula Valley Project Timeline Forming the Project Team Contractual Structure Project Definition Business Case Stakeholder Values Conditions of Satisfaction Target Setting Expected Cost During Design and Construction Steering to Targets During Design Cross-functional Teams For Design Integrated Governance Joint Responsibility and Transparency Co-location and Big Room Meetings Collaborative Design Conversation Simulation of Operations Building Information Modeling Last Planner System of Production Control For Design Set-Based Design A3 Reports Value Engineering Cost Modeling and Cost Tracking Risk Identification and Risk Management Moving Money Between Boundaries Challenges During Design Innovations During Design Steering to Targets During Construction
3 4.4.1 Last Planner for Construction Location Based Planning Value Stream Mapping Process Mapping First Run Studies Whys Analysis Community of Practice (COP) Shared Key Performance Indicators (KPIs) Financial Position Billed to Date Budget and Path to Budget Current Risks Schedule and Milestones PPC and Schedule Variance Man Power Curves Weekly Production Rates Monthly Rework Implemented Improvements Lessons Learned / 5 Good Whys Project Photos Safety Metrics Inspection Metrics Project Performance Metrics Cost Schedule Quality Safety Productivity Profitability Cultural Outcomes Product Innovations Process Innovations Conclusion Challenges Lessons Learned Processes that Led to Cost Savings Areas for Improvement Updating the P2SL Current Process Benchmark on Target Value Design Acknowledgments References Appendices Monthly A3 Status Updates June July August September October
4 8.1.6 November December January February March April May June July August September October November December Sample A3 Documents Cardio Vascular Services at Temecula Valley Developing Paths of Travel to ICUs that are Acceptable to Licensing and OSHPD Modular OR Ceilings Secondary Portable Water Source for TVH Select the Supply Chain Methodology for TVH Selecting Location of Hand Wash Sink at Med/Surg Patient Room Selecting the Optimal ICU Patient Room Layout Selecting the Optimal Universal Care Unit Treatment Room Temecula Valley Hospital Integration TVH Lessons Learned Spreadsheet TVH Implemented Innovations Spreadsheet TVH Ah Ha Moments Spreadsheet Sutter s 5 Big Ideas Survey List of Figures Figure 1: The Temecula Valley Hospital Figure 2: The LCI triangle model (Thomsen et al., 2009) Figure 3: Sutter s 5 Big Ideas (Macomber, 2004) Figure 4: Major Milestone Schedule Figure 5: Onboarding of Team Members Figure 6: ConsensusDocs Figure 7: Integrated Team Figure 8: Cost Benchmarking Figure 9: Components of Cost Model Figure 10: Initial Target Cost ($151 million)
5 Figure 11: Expected Cost Throughout the Project Figure 12: Expected Profit (Tracked During Construction) Figure 13: Cluster Groups Figure 14: Flow of Requests and Communication Figure 15: Role of Integrated Team and Clusters Figure 16: Daily Check-ins and Meeting Schedules Figure 17: Design, Estimate, Schedule, Construction Responsibilities within Clusters Figure 18: Core Team and Community of Practices Roles Figure 19: Cluster Leaders and Cluster Member s Responsibilities Figure 20: Integrated Team Figure 21: Field Board at Temecula (Seed, 2014) Figure 22: Co-location Space (Temecula Valley) Figure 23: Co-location Trailer Layout (Temecula Valley) Figure 24: Big Room Meeting Scheduling Software Figure 25: Big Room Meeting Agenda Figure 26: Collaborative Design Conversation Figure 27: Sets of Corridor Design Alternatives Figure 28: The Role of Simulation in TVD Figure 29: UHS Temecula ED Simulation Figure 30: Executive Summary Figure 31: Simulation Overview Figure 32: Assumptions and Input Parameters Figure 33: Simulation Model Results Figure 34: Value Stream Mapping of Kitchen Operations Figure 35: Temecula Valley BIM Model Figure 36: Prefabricated Exterior Walls Figure 37: Prefabricated Roof Truss Figure 38: BIM for Piping Coordination and Quantity Take-offs Figure 39: Framing Layout and Spool Sheets from BIM Model
6 Figure 40: Pull Planning Session Figure 41: Set-Based Design Figure 42: Temecula Valley A3 (Cardio Vascular Services) Figure 43:Temecula Valley A3 (Location of Hospital) Figure 44: December 2012 Report Figure 46: Cost Tracking Figure 47: Risk Identification and Risk Management Figure 48: Expected Cost Throughout the Project Figure 49: Cost Tracking Figure 50: The Path Back Figure 51: Budget and Billing Update Figure 52: Changes in Scope Initiated by the Owner Figure 53: Challenges That Increased Cost Figure 54: Target Value Design Innovations Figure 55: Weekly Planning Meeting Figure 56: OurPlan Figure 57: Percent Plan Completed Figure 58:Flowline for Location-based Planning Figure 59: Video Recording of Work Figure 60: Value Stream Map of Door Installations Figure 61: Waste vs. Value Figure 62: Video Study of 2 nd Floor Exterior Figure 63: Resulting Improvement from Video Study Figure 64: Process Map for RFIs Figure 65: Process Map for Submittals Figure 66: First Run Studies Figure 67: Production Rates and First Run Studies Figure 68: Example of 5 Whys Analysis Figure 69. Financial Position
7 Figure 70. Billed to Date Figure 71. Path to Budget Figure 72. Current Risks Figure 73. Schedule Milestones Figure 74. PPC Trends Figure 75. Man Power Curves Figure 76. Weekly Production Rates Figure 77: Leveraging Productivity Data for Day to Day Decisions Figure 78: Leveraging Productivity Data for Preplanned Decisions Figure 79: Leveraging Productivity Data for the Work Week Figure 80. Monthly Rework Figure 81. Implemented Improvements Figure Good Whys Figure 83. Project Photos Figure 84. Safety Log Figure 85. Inspection Metrics Figure 86: Cost per sf Figure 87: Cost per patient bed Figure 88: Safety Log Figure 89: Labor Productivity Figure 90: Garage Door Figure 91: Using ipads to Document RFIs, Rework, and Change Orders Figure 92: Masking Top Track Prior to SFRM Figure 93: Screeding Z-Clips Figure 94: All Materials on Carts Figure 95: Backing Layout Color Coded Figure 96: Dry Erase Boards on All Floors Figure 97: Spool Sheet Framing Layout Figure 98: Labor Productivity Transparency in the Field
8 List of Tables Table 1: Case study characteristics Table 2: Analytical Framework Matrix Table 3: Interviewees on the case studies Table 4: Results from a Survey Conducted to Rate the Implementation of the TVD Benchmark Table 5. Choosing By Advantages Example Table 6: Percentage in Risk Pool Table 7: Cultural Survey Summary
9 1 Introduction 1.1 Research Objectives Target Value Design (TVD) is a management practice that drives the design [and construction] to deliver customer values within project constraints (Ballard, 2009). It is an application of Taiichi Ohno s practice of self-imposing necessity as a means for continuous improvement (Ballard, 2009). The TVD Research Group was originally a three-year research initiative launched in June 2010 by UC Berkeley s Project Production Systems Laboratory (P2SL) and DPR Construction Inc. to study the application of TVD on three hospital projects. The original goals of the group were to: 1) Improve TVD application within IPD projects. 2) Adapt TVD to other applications such as Design-Build and proposal development (Denerolle, 2011) In 2013, the P2SL TVD Research Group expanded in both membership and in the scope of the research efforts. Several companies within the Northern California AEC industry joined the research group. The scope of the research investigation expanded to include the study of Universal Health Services Temecula Valley Hospital Project (Table 1) and the Palo Alto Medical Foundation s Sunnyvale Medical Office Building (the subject of a separate report). Stephane Denerolle (2013) previously documented the application of TVD in the design phase of the three original case study projects: Sutter Health Eden Castro Valley, Sutter Health Alta Bates Medical Pavilion, and the UCSF Mission Bay Hospital. This technical report documents both the design and construction of the UHS Temecula Valley Project (Table 1). This study compares the practice of TVD on Temecula Valley to P2SL s process benchmarks. The goal of this technical report is to present an in-depth case analysis of the TVD application on the UHS Temecula Valley Project. This report documents: (1) the project s history, (2) how TVD was applied during design, (3) how TVD was applied in construction, (4) the challenges of TVD, (5) the outcomes of the project, (5) the lessons learned, and (6) key innovations that resulted from TVD. For industry practitioners, this report may help them better understand TVD and be able to transfer some of these practices to their own projects. For researchers, this report can be a source of empirical data for theory building and replication. 1.2 The Case Study Project The UHS Temecula Valley Hospital (Figure 1) is a $151 million; five-story, 140-bed, 177,508-sq.-ft hospital located just north of San Diego in Southern California. The hospital includes 20 intensive care units (ICU), five high-tech surgical suites, a cardiac catheterization lab/interventional suite, and emergency room services (DPR, 2014). The new hospital project was commissioned and is operated by Universal Health Services (UHS), Inc. In the future, UHS plans to add an additional 150 beds, a medical office building, and a fitness center next to the current project site. 9

10 Figure 1: The Temecula Valley Hospital 1 Table 1: Case study characteristics UHS Temecula Valley Total Project Cost $151 million Estimated Maximum Price $125 million (EMP) 2 Square Footage 177,506 Number of Patient Beds 140 patient bed Collaboration level Multi-party Integrated Project Delivery Contract Type Consensus Docs Literature Review 2.1 Target Value Design Target Value Design (TVD) is an adaptation of Target Costing, a strategic profit planning practice used in new product development (Cooper and Slagmulder, 1997). To ensure that products are sufficiently profitable when launched is to design them to a target cost determined by subtracting the product s desired profit from the expected selling price. Under this approach, cost is viewed as an input in the design stage rather than an outcome of it (Cooper and Slagmulder, 1997). Target Costing has been used 1 Retrieved from the project blog at from: (03/02/2014) 2 Total Project Cost includes owner costs and costs for work scopes within the risk pool (reimbursable), and for work scopes outside the risk pool (fixed price). EMP only includes costs for work within the risk pool. 10
11 in the Japanese industry since the 1960s under the name Genka Kikaku but it remained a trade secret until the 1980s (Feil et al., 2004). Target Costing and Kaizen Costing make up the total cost management program of Japanese automotive and manufacturing companies (Monden and Hamada, 1991). Within the Japanese construction industry, Target Costing is regarded as one of the most important management practices (Yook et al., 2005). Target Costing was documented in the construction industry in the early 1990s by British Petroleum (BP) in the development of the Andrew Oil Field (Sakal, 2005; Knott, 1996). The relational contract and terms used for Target Costing by BP would later become known as Project Alliancing (Sakal, 2005), which is practiced in Europe and Australia. Nicolini et al. (2000) reported two case studies of Target Costing in the UK construction industry. Unfortunately, the application was unsuccessful because, according to the case study authors, the builders had become accustomed to buying and selling rather than designing and making. Ballard and Reiser (2004) reported the first application of Target Costing in the United States construction industry on the St. Olaf Fieldhouse Project, which was completed in 2002 (Ballard and Reiser, 2004). The term Target Value Design was later coined by John Barberio to emphasize that the practice is not purely motivated by cost reduction but rather to ensure that the appropriate value is delivered to the customer (Macomber et al., 2007) a feature of product development s target costing, but not evident in the name itself. During the 5-year research project with the P2SL TVD Research Group, the term Target Value Delivery has emerged to emphasize that TVD is applicable beyond the design phase. The goal of TVD is to deliver value to stakeholders within the physical, social, and financial constraints of the project. Since its introduction, TVD has been widely accepted by the construction industry in the United States and appears in legal documents such as Sutter Health s Integrated Form of Agreement (IFOA) and the ConsensusDocs 300 (Lichtig, 2005; ConsensusDocs 2014). Several researchers have reported positive cost to market performance and cost certainty performance of TVD (Zimina et al., 2012; Do et al., 2014). 2.2 Target Value Design Benchmarks The University of California, Berkeley s Project Production Systems Laboratory (P2SL) periodically publishes a TVD Process Benchmark. The first version of the TVD Process Benchmark was published in 2005, then revised and republished in (Ballard, 2011). The current TVD Benchmark provides the guidelines for applying TVD and includes: 1. With the help of key service providers, the customer develops and evaluates the project business case and decides whether to fund a feasibility study; in part based on the gap between the projects allowable and market cost. 2. The business case is based on a forecast of facility life cycle costs and benefits 3, preferably derived from an operations model; and includes specification of an allowable cost what the customer is able and willing to pay to get life cycle benefits. Financing constraints are specified in the business case; limitations on the customer s ability to fund the investment required to obtain life cycle benefits. 3. The feasibility study involves all key members (designers, constructors, and customer stakeholders) of the team that will deliver the project if the study findings are positive. 3 This is the original language of the Benchmark, but on reflection, a better term is whole life costs and benefits. Life cycle is commonly used to refer to the costs associated with operations and maintenance, whereas whole life includes the business use of the constructed asset. Example: Operations and maintenance of a hospital building versus the delivery of healthcare in the building. 11
12 4. Feasibility is assessed through aligning ends (what s wanted), means (conceptual design), and constraints (cost, time, location, etc.). The project proceeds to funding only if alignment is achieved, or is judged achievable during the course of the project. 5. The feasibility study produces a detailed budget and schedule aligned with scope and quality requirements. 6. The customer is an active and permanent member of the project delivery team. 7. All team members understand the business case and stakeholder values 8. Some form of relational contract is used to align the interests of project team members with project objectives. 9. A cardinal rule is agreed upon by project team members cost and schedule targets cannot be exceeded, and only the customer can change target scope, quality, cost or schedule. 10. The cost, schedule and quality implications of design alternatives are discussed by team members (and external stakeholders when appropriate) prior to major investments of design time. 11. Cost estimating and budgeting is done continuously through collaboration between members of the project team over the shoulder estimating. 12. The Last Planner system is used to coordinate the actions of team members. 13. Targets are set as stretch goals to spur innovation. 14. Target scope and cost are allocated to cross-functional TVD teams, typically by facility system; e.g., structural, mechanical, electrical, exterior, interiors, etc. 15. TVD teams update their cost estimates and basis of estimate (scope) frequently. Example from a major hospital project during the period when TVD teams were heavily in design: estimate updates at most every three weeks. 16. The project cost estimate is updated frequently to reflect TVD team updates. This could be a plus/minus report with consolidated reports at greater intervals. Often project cost estimates are updated and reviewed in weekly meetings of TVD team coordinators and discipline leads, open to all project team members. 17. Co-location is strongly advised, at least when teams are newly formed. Co-location need not be permanent; team meetings can be held weekly or more frequently. The TVD Process Benchmarks were derived from theory and from empirical studies of TVD projects. Researchers from the UC Berkeley s Project Production Systems Laboratory (P2SL) have been conducting action research on TVD since 2002 and the benchmarks reflect practices that have been observed to lead to favorable outcomes on TVD projects. This research compares the application of TVD on the UHS Temecula Valley Project to the TVD Process Benchmarks published by Ballard (2011). Based upon our findings from this case study (and from the 5-year research on TVD), the UC Berkeley s P2SL will publish an updated process benchmark to incorporate lessons learned and the best practices in TVD, as well as challenges and opportunities for further improving the benchmark. 2.3 Integrated Project Delivery (IPD) All projects contain three domains within which they operate: the project organization, the project operating system, and the commercial terms binding the project participants (Thomsen et al., 2009; Figure 2). The project organization refers to how the project members are organized and includes the organizational structure, communication flows, decision-making process, project governance, etc. On a construction project, people can come at various stages and stay for varying amounts of time depending 12
, a project organization practice, has been gaining popularity within the United States since the creation of the firm named Integrated Project Delivery in 1999, led")
13 upon their role and their scope of work. Integrated Project Delivery (IPD), a project organization practice, has been gaining popularity within the United States since the creation of the firm named Integrated Project Delivery in 1999, led by Owen Matthews of Westbrook Air Conditioning in Orlando, Florida ( Matthews and Howell, 2005; AIA, 2007; Cohen, 2012). In addition to multi-party contracts, IPD is characterized by early involvement of the key participants including the contractors, designers, trade partners, and facilities managers, and by promoting collaboration through co-location, big room meetings, and shared governance. Raisbeck et al. (2010) stated that the notable differences between IPD and Project Alliancing (a project organization practiced in Australia and Europe) is that the use of Building Information Modeling (BIM), co-location, and big room meeting are mandatory on IPD projects. With Project Alliancing, these practices are not always required (Raisbeck et al., 2010). Figure 2: The LCI triangle model (Thomsen et al., 2009) The operating system includes methods and tools used to manage the project. The Lean operating system, which can be used with IPD, includes the Last Planner System 4, A3 problem-solving/reports, Set-Based Design, Choosing by Advantages, Target Value Design, etc. In the case study, the project relied heavily on the Lean operating system as the contract language required the use of Lean management methods. The commercial terms are the contract language that binds the participants together. IPD projects typically use a multi-party relational contract such as the Integrated Form of Agreement (IFOA) or the ConsensusDocs 300 (Lichtig 2005; Thomsen et al. 2009; Ballard and Howell 2005) 5. In situations where signing a multi-party contract is prohibited, as is the case for some public entities, more traditional GMP and Lump Sum contracts can be modified to promote the behaviors of IPD and encourage the use of TVD (Darrington and Lichtig, 2010). The University of California San Francisco s recent hospital project was such an IPD-ish project 6. It is included in Denerolle s (2009) report on the design phase. Its construction phase and outcomes will be the subject of a future report from this research. 4 The Last Planner System is a registered trademark of the Lean Construction Institute (leanconstruction.org). 5 AIA (American Institute of Architects) forms of contract are also used on IPD projects, but do not specify lean management as the operating system. 6 We follow the common distinction in use of the terms IPD and IPDish, but it may be more useful to think in terms of shared risk and reward, with different contractual means for achieving alignment of commercial interests. 13

14 2.3.1 Sutter Health s 5 Big Ideas In 2004, Sutter held a conference with its service providers outlining their vision for the future (Macomber, 2004). At the time, Sutter was faced with a $6 billion construction program. In the past years, many of their projects had been over budget, over schedule, did not deliver its intended value, and in some instances resulted in lengthy litigation. Their goal at the conference was to: set out to transform how capital projects are designed and delivered. This initiative is noble and necessary. They believe that capital projects cost too much; they take far too much time; they often fall short of their objectives; and they kill or injure too many along the way. It need not be this way (Macomber, 2004). With the help of Lean Project Consulting, Inc. Sutter developed their 5 Big Ideas as the foundation of their Lean Project Delivery System. These 5 Big ideas form the basis of the Integrated Form of Agreement, the first multi-party contract for Integrated Project Delivery (IPD), as well as other relational contracts such as the Consensus Docs 300 (Lichtig, 2005). Sutter s 5 big ideas are used in this report to gauge the cultural outcomes of the project. The soft metrics of the cultural outcomes include: degree of collaboration, relatedness amongst the project team, learning, optimizing for the whole, and managing the project as a network of commitments (Figure 3). A survey was sent out to the project team and the outcome is included in the results section. Collaborate, Really Collaborate Figure 3: Sutter s 5 Big Ideas (Macomber, 2004) Constructable, maintainable, and affordable design requires the participation of the range of project performers and constituencies. Since abandoning the master-builder concept, and separating design from construction, we have been patching together a poorly conceived design practice. Value engineering, design assist, and constructability reviews mask an underlying assumption that design can be successful when separated from engineering and construction. Design is an iterative conversation; the choice of ends affects means and available means affects ends. Collaborative design and planning maximizes positive iterations and reduces negative iterations. (Macomber, 2004) Optimize the Whole Project work is messy. Projects get messier and spin out of control when contracts and project practices push every activity manager to press for speed and lowest cost. Pushing for high 14
15 productivity at the task level may maximize local performance but it reduces the predictable release of work downstream, increases project durations, complicates coordination, and reduces trust. In design, we incur rework and delays. In the field, this means greater danger. We have a significant opportunity and responsibility to reduce workers exposure to hazards on construction projects. Doing so can bring about greater than 50% improvements in the safety on the work site. We are committed to do all that is possible so that the people who build these projects are able to go home each night the way they came to work. The way we understand work and manage planning can increase that messiness or reduce it. (Macomber, 2004) Tightly Coupled Learning with Action Continuous improvement of costs, schedule, and overall project value is possible when project performers learn in action. Work can be performed so that the performer gets immediate feedback on how well it matched the intended conditions of satisfaction. Doing work as single-piece flow avoids producing batches that in some way don t meet customer expectations that later on must be reworked. The current separation of planning, execution, and control contributes to poor project performance and to declining expectations of what is possible. (Macomber, 2004) Projects are Single Purpose Network of Commitments Projects are not processes. They are not value streams. The work of management in project environments is the ongoing articulation and activation of unique networks of commitment. The work of leaders is bringing coherence to the network of commitments in the face of the uncertain future and co-creating the future with project participants. This contrasts with the commonsense understanding that planning is predicting, managing is controlling, and leadership is setting direction. (Lichtig, 2005) Increase Relatedness People come together on AEC projects as strangers. They too often leave as enemies. Facilities projects today are complex and long-lived, requiring ongoing learning, innovation, and collaboration to be successful. The chief impediment to transforming the design and delivery of capital projects is an insufficient relatedness of project participants. Participants need to develop relationships founded on trust if they are to share their mistakes as learning opportunities for their project, and all the other projects. This will not just happen. However, we are learning that relationships can be developed intentionally. (Lichtig, 2005) 3 Research methodology 3.1 Case Study Method According to Yin (2009), the case study method is appropriate when: 1) asking why and how questions, 2) if the researcher has little control in the experiment, 3) if the focus is on a contemporary phenomenon within real-life context. Eisenhardt (1989) defines a case study as a research strategy that focuses on understanding the dynamics of a single setting. A properly designed case study can be generalized and used to develop theories (Eisenhardt, 1989; Flyvbjerg, 2006). In order for a case study to be scientifically rigorous, its design and data collection practices must meet: 1) construct validity, 2) internal validity, 3) external validity, and 4) reliability (Yin, 2009). 15
16 Construct validity refers to the degree to which the research is measuring what it was designed to measure. Internal validity deals with the degree to which the causal relationships drawn by the research is warrant based on the data collected. External validity refers to the scope and boundary within which the findings from the case study can be generalized. And finally, the reliability of the research ensures that proper research protocols were taken so that other researcher can reproduce the results if they followed the same research steps (Yin, 2009). In order to maintain construct validity, Yin (2009) recommends the following tactics: 1) use multiple sources of evidence, 2) establish a chain of evidence, 3) have key informants review the draft of the report. To maintain internal validity, Yin (2009) recommends using logical models and pattern matching techniques. To maintain external validity, Yin (2009) recommends using replication logic to compare the findings from multiple cases. And finally, to maintain reliability, the researcher should use a case study protocol and develop a case study database (Yin 2009). The research for this technical report follows Yin s (2006) recommendations in order to maintain construct validity, internal validity, external validity, and reliability. After writing the technical report, we asked project participants to review our draft to ensure accuracy. 3.2 Analytical framework This study uses a modification of Denerolle s analytical framework (Denerolles, 2013; Table 2). The research framework for this study includes four major sections: (1) project definition, (2) steering to target during design, and (3) steering to targets during construction. Table 2 lists the key concepts and the portion of the existing TVD benchmark that references each component. Table 2: Analytical Framework Matrix Project Definition Business Case Key concepts Access to owner s business case Whole life cost TVD benchmark practices With the help of key service providers, the customer develops and evaluates the project business case and decides whether to fund a feasibility study; in part based on the gap between the projects allowable and market cost. Stakeholder Values Conditions of Satisfaction Forming the Team Definition of value Link value directly to design components Scope changes Translating Stakeholder values into measurable outcomes Early involvement The business case is based on a forecast of facility life cycle costs and benefits All team members understand the business case and stakeholder values The feasibility study involves all key members (designers, constructors, and customer stakeholders) of the team that will deliver the project if the study findings are positive. Lean Training Training the project team on the basics of Lean philosophy, methods, and tools Target Setting Promote and develop a Lean culture How are the targets set? Linkage to business case A cardinal rule is agreed upon by project team members cost and schedule targets cannot be exceeded, and only the customer can change target scope, quality, cost or schedule. Targets are set as stretch goals to spur innovation. 16
17 Validating Targets Ensuring that the targets are achievable Feasibility is assessed through aligning ends (what s wanted), means (conceptual design), and constraints (cost, time, location, etc.). The project proceeds to funding only if alignment is achieved, or is judged achievable during the course of the project. The feasibility study produces a detailed budget and schedule aligned with scope and quality requirements. Steering to Targets During Design Contractual Structure / Sharing Risk and Reward Cross Functional Team For Design Integrated Governance Joint Responsibility and Transparency Co-location / Big Room Meetings Collaborative Design Conversation Simulation of Operations Last Planner for Design Set Based Design A3s Value Engineering Cost Modeling and Cost Tracking Contractual agreement Incentives, accountability Clusters Collaboration The cost, schedule and quality implications of design alternatives are discussed by team members (and external stakeholders when appropriate) prior to major investments of design time. Process for making decisions within a shared governance model which ensures that value is being delivered Allow for close collaboration and exchange of ideas Talking before drawing Simulate the operations of the space to inform its design Coordinate and organize key milestones and decision in the design phase Eliminate negative iteration by keeping a set of feasible alternatives Document improvements and decisions on a single page Reducing cost through innovation while maintain the desired functionalities, capacities, and quality Cost estimating Some form of relational contract is used to align the interests of project team members with project objectives. The customer is an active and permanent member of the project delivery team. Target scope and cost are allocated to cross-functional TVD teams, typically by facility system; e.g., structural, mechanical, electrical, exterior, interiors, etc. The project is managed by the people in the risk pool IPD members share in the roles and responsibility of managing the project Co-location is strongly advised, at least when teams are newly formed. Co-location need not be permanent; team meetings can be held weekly or more frequently. The Last Planner system is used to coordinate the actions of team members. Cost estimating and budgeting is done continuously through collaboration between members of the project team over the 17
18 Budget reporting shoulder estimating. Steering to Targets During Construction Building Information Modeling Risk Identification and Risk Management Moving Money Between Boundaries Last Planner for Construction Location Based Planning Value Stream Mapping Process Mapping First Run Studies BIM Identify, classify, and mitigate risks Transfer of money and scope across organizational boundaries Coordinate the key activities and milestones during construction Integrate space and time as a resource to avoid trade stacking Understand the value of a process so that waste can be eliminated Mapping out and standardizing common processes Prototype a production run to learn and improve TVD teams update their cost estimates and basis of estimate (scope) frequently. The Last Planner system is used to coordinate the actions of team members. Record trades at work to find areas for improvement 5 Whys Analysis Learning from breakdowns Community of Practice Shared KPIs Develop a group that shares best practices and continues the Lean journey Communicating and sharing project and production data with the integrated team 3.3 Data Collection Techniques Interviews Interviews are the main source of data for this research. To collect data from several different perspectives, the researcher conducted face-to-face and telephone interviews with the key participants from the UHS Temecula project. These interviews were semi-structured and typically lasted between 30 minutes to 1 hour (although some lasted much longer). The notes from the interviews were compared with other sources of data in order to triangulate the findings. Table 3 shows the list of interviewees, their title, and the date of the first interview. As an iterative process, the researcher maintained contact with several of the interviewees throughout the research in order to request for information, to ask for the context of the data, and to gather in-depth examples for this report. Table 3: Interviewees on the case studies UHS Temecula Valley 18
19 Name Title Date Scott Dater Electrical Trade Partner 11/13/2013 Jason Herrera General Contractor (Drywall) 06/15/2015 Kristen Hill Lean Coach 07/20/2015 Tara Laski Owner s Rep 10/29/2013 Ken Lindsey Mechanical Trade Partner 12/17/2013 Tom Mccready General Contractor 11/05/2013 Brent Nikolin General Contractor 11/05/2013 Bill Seed Owner 10/17/2013 Lee Tsangeo General Contractor 10/25/203 George Vangelatos Architect 10/28/2013 Steve Wilson Architect 11/4/2013 George Zettel General Contractor 10/29/ Document Analysis In addition to interviews, several other data sources were used to expand the findings. By relying on several independent sources of evidence, the researchers were able to increase the construct reliability of the research. The additional data sources include: 1) Schedule and Budget Reports 2) Contract Documents 3) A3 reports 4) Lessons Learned Presentation 5) Other forms of documented information on the project (e.g., Excel files, photos, and videos) The UHS Temecula Valley project was completed in August of One limitation of this research is that we measured TVD application after the project had been completed. People moved to different projects and their personal accounts may be distorted over time. In order to counteract this effect, the research carefully triangulated evidence from multiple sources and used documented data to support the interviews. One benefit of collecting data after the project has already been completed is that we can report on both the application and the outcomes. The lessons learned presentations that were collected by the participants at the end of these projects have been one such valuable resource of information Surveys Two surveys were sent to the participant of the project. The first survey was sent to 9 participants of UHS Temecula on March 18, The survey asked the participants about the components of the TVD benchmarks and the Lean Construction methods (i.e., CBA, Set-Based Design, and A3 reports) that were used on their project. The second survey was sent out in September The second survey focused on the cultural outcomes of the project. The scale of the survey ranged from 1 to 5 (1 => highly disagree, 2 => disagree, 3 => neutral, 4 => agree, 5 => highly agree). This section discusses the outcomes of the first survey. The outcomes of the second survey are available in the results section. The goal of the first survey was to gauge quantitatively the TVD application of the projects and to serve as starting point for more in-depth interviews. There were 6 respondents from the Temecula Valley Project. Although the number of sample points is too small to be statistically significant, the results from the survey gave a high-level picture about the TVD application. The results table included: (1) the component of the TVD benchmarks, (2) the mean score, (3) the lower range, (4) the upper range, and (5) the standard deviation. Standard deviations greater than 1 (highlighted in Table 4) indicate areas where 19
20 Mean Lowest Rating Highest Rating Stand. Dev. there were differing opinions between the participants. Standard deviations less than 1 indicate that there was more or less a consensus. Table 4: Results from a Survey Conducted to Rate the Implementation of the TVD Benchmark Components of the current TVD benchmark (rated on a scale of 1 to 5) Temecula 1. With the help of key service providers, the customer develops and evaluates the project business case and decides whether to fund a feasibility study; in part based on the gap between the project s allowable and market cost. 2. The business case is based on a forecast of facility life cycle costs and benefits, preferably derived from an operations model; and includes specification of an allowable cost what the customer is able and willing to pay to get life cycle benefits. Financing constraints are specified in the business case; limitations on the customer s ability to fund the investment required to obtain life cycle benefits. 3. The feasibility study involves all key members (designers, constructors, and customer stakeholders) of the team that will deliver the project if the study findings are positive. 4. Feasibility is assessed through aligning ends (what s wanted), means (conceptual design), and constraints (cost, time, location, ). The project proceeds to funding only if alignment is achieved, or is judged achievable during the course of the project. 5. The feasibility study produces a detailed budget and schedule aligned with scope and quality requirements The customer is an active and permanent member of the project delivery team All team members understand the business case and stakeholder values Some form of relational contract is used to align the interests of project team members with project objectives. 9. A cardinal rule is agreed upon by project team members cost and schedule targets cannot be exceeded, and only the customer can change target scope, quality, cost or schedule. 10. The cost, schedule and quality implications of design alternatives are discussed by team members (and external stakeholders when appropriate) prior to major investments of design time. 11. Cost estimating and budgeting is done continuously through intimate collaboration between members of the project team over the shoulder estimating The Last Planner system is used to coordinate the actions of team members Targets are set as stretch goals to spur innovation Target scope and cost are allocated to cross-functional TVD teams, typically by facility system; e.g., structural, mechanical, electrical, exterior, interiors, 15. TVD teams update their cost estimates and basis of estimate (scope) frequently. Example from a major hospital project during the period when TVD teams were heavily in design: estimate updates at most every three weeks. 16. The project cost estimate is updated frequently to reflect TVD team updates. This could be a plus/minus report with consolidated reports at greater intervals. Often project cost estimates are updated and reviewed in weekly meetings of TVD team coordinators and discipline leads, open to all project team members. 17. Co-location is strongly advised, at least when teams are newly formed. Co-location need not be permanent; team meetings can be held weekly or more frequently. 18. Set-Based Design was used in the design stage Choosing By Advantages was used to select between alternatives A3s were used to document design alternatives A3s were used to solve problems TVD SCORE (%) 85.7% 20
21 Out of the 21 questions, five questions had a mean score of less than 4.0 and five had a mean score greater than 4.5. For the questions with low scores, our goal is to determine why the respondents believe that the benchmark was not achieved. For the questions high scores, our goal is to collect evidence to show how these benchmarks were accomplished on the project and report these practices. There are five questions with a standard deviation greater than 1. The relatively high standard deviation suggests that there is a disagreement between the respondents about the degree to which a benchmark was achieved. Our goal for the questions with the high standard deviation is to investigate the root cause of this disagreement. The questions with scores lower than 4.0 are: question 1, question 2, question 3, question 5, and question 9. Questions 1, 2, 3, and 5 all pertain to the business plan, validation study, setting the target cost based on the business plan, and developing the target cost with the key participants. According to the interviewees, the owner did not involve all the key trades in the development of the target cost and the business plan. The history of the project shows that the owner engaged with 3 teams each consisting of an architect and a general contractor for a design competition. The results of the design competition and the owner s financial constraints formed the basis for the business plan, the target scope, and the target cost. It appears that some of the trade partners that entered the project later during the design phase were not as informed about the basis of the target cost. Question 9 had the highest standard deviation and the biggest range with the owner giving a score of 5 and a trade partner giving a score of 1. Based on the interviews that were conducted after the survey and other sources of data, we believe that some people may have interpreted the question incorrectly. The data revealed that the cost and schedule objectives were accomplished. The only major changes in scope were the addition of a cardiovascular center and a helipad initiated by the owner. The Target Cost increased by $7 million for the cardiovascular center and $500,000 for the helipad. The questions with standard deviations greater than 1.0 include: question 2, question 3, question 5, question 6, and question 9. The reason for the high standard deviations for questions 2, 3, 5, and 9 were explained in the previous section. Question 6 pertains to the owner s role and commitment to be a permanent and active participant in the project delivery. Only one survey respondent rated a low score while all the other respondents rated a high score for this question. The follow-up interviews revealed that the owner was very actively involved in the project and most likely the high standard deviation observed in this question is due to noise that arises from analyzing data from such a small sample size Target Value Design Research Group Meeting The UC Berkeley s Target Value Design Research Group includes 12 members within the Northern California AEC industry including: a general contractor, MEP trade partners, architects, electrical engineer, structural engineers, and specialty contractors. The TVD Research Group was formed in 2010 with the goal of improving TVD and Lean application on design and construction projects. In 2010, TVD and IPD were fairly new concepts and the group wanted to learn from and improve their Lean project delivery. Since the inception of the group, the members met regularly with the researchers from UC Berkeley to discuss findings on their case study projects. These research meeting took place every 2-3 months, typically on a Friday and lasted from 10am to 2pm. The researchers from UC Berkeley would present new findings on the five case study project (including the Temecula Valley project) and the people who were involved on the project would be engage in the discussion, clarify the issue, and correct any misunderstanding. By using the TVD Research meetings as a forum, this research benefited from: (1) ensuring that the research questions were relevant to the industry, (2) leveraging the 21
22 experiences of industry practitioners in the development of the research, (3) gathering rapid feedback on the findings, and (4) having the people involved on the project to ensure the accuracy of the findings. 4 Research Findings 4.1 Project History Founded in 1981, UHS is one of the largest healthcare providers in the United States with approximately $8 billion of revenue annually (UHS, 2012). They are organized as a non-profit organization and provide services in Washington D.C., Puerto Rico, and the U.S. Virgin Islands (UHS, 2012). In 2012, UHS spent $363 million on capital expenditures, which includes renovations of existing buildings and new construction of healthcare facilities (UHS, 2012). In California, UHS has 7 hospitals dedicated to Behavioral Health Services, 5 hospitals dedicated to acute care services, and one ambulatory surgery center (Surgery Center at the Temecula Valley) (UHS, 2014). Annually, they commission over 100 construction projects most of these projects are small renovation projects but there are several largescale construction projects as well (Seed, 2013). UHS started using Lean after hearing about the success from Sutter Health, Inc. at a conference in March of They contacted Greg Howell from Lean Project Consulting, Inc. to help them get started on their Lean journey. Since 2007, UHS has completed over 40 Lean IPD and TVD projects and have 60 projects in development/construction (Seed, 2014). Out of their 40 completed Lean IPD and TVD projects, they have not had any major problems and are very happy with the outcomes. These projects have typically been completed 10% to 30% below market price (Seed, 2014). For the Temecula Valley project, UHS also expected to achieve the same outcomes, implementing lean from the beginning of the project. The project was originally designed in It was re-assessed in late 2009 at which point UHS realized that the cost was more than they can afford. At that time, the owner (UHS) had developed a business plan based on market research of the area s demographic to determine their anticipated revenues from the hospital services. If they could not build the project within their cost constraint, the project would not proceed any further. The re-assessment process started with 3 teams each composed of one architect and one contractor. The teams were tasked with developing a design that could be completed for 30% below historical cost benchmarks for a California hospital. The 30% stretch goal was created by the owner to meet their budget constraints and was based on their assessment of potential increases in efficiency by using IPD. The combination of UHS s internal budget for the project and the design proposals (including the challenge to develop a design that is 30% below the California cost benchmarks) formed the basis for the target cost. After reviewing the proposals, UHS decided that two of the teams had good ideas that they wanted to incorporate into the project and had the two GCs and two architects form a joint venture. In the construction industry it is more common for GCs to form a Joint Venture than for architects to do so. At the end of the schematic design, HMC remained as the architect since the difficulties of organizing and integrating two architects was greater than its benefits. DPR and Turner formed a Joint Venture as the General Contractor. Besides the design proposals, there were no other formal validation studies conducted for the project Lean Training at Temecula Valley Kristin Hill from Inside Out Consulting was involved for 7 months during the design phase. She first came onboard in Q when the project cost was at its highest point. She left the project in Q just before the start of construction. Her role as a Lean Construction coach was to: (1) help the team develop their TVD process, (2) to teach Lean Construction methods, tools, and concepts, and (3) to help the team become self-sufficient in continuing the Lean culture. During the construction phase, the Lean training 22
23 was a joint effort by Turner, DPR, Southland, and UHS. Each person who joined the project (project managers, project engineers, and field supervisors) had to go through an onboarding orientation, which covered the basics of Lean Construction, the project s culture, owner s goals, and the project s expectations. The onboarding orientations took place monthly or more frequently depending upon the needs of the project. In addition to the training, each member was also given an onboarding manual. For the field staff, there was a condensed version of the training, which lasted half a day. People who had not gone through the on boarding process could not attend the big room meetings Project Timeline The TVD/IPD team entered the project in March of 2010 with a GMP contract. In April of 2010, the design was approved by the city council. In February of 2011, the TVD/IPD team signed the ConsensusDocs 300. Increment 1 & 2 OSHPD documents were submitted in February of The key dates for the construction phase include (Figure 4): Groundbreaking June 2011 Start of foundation work August 2011 Start of steel erection November 2011 Steel topped out February 2012 Roof deck placements March 2012 Project completion August 2013 Hospital open for the first patient October Forming the Project Team Figure 4: Major Milestone Schedule During the schematic design phase, DPR-Turner, HMC, and UHS used Choosing By Advantages (CBA; Suhr, 1999) to select the remaining TVD/IPD members. They determined the trades that would be the major drivers for the project (e.g., MEP, fire protection, drywall). The criterion for choosing the disciplines to include in the risk pool was: does the work have large impact on the success of the project? The impact on project success can be measured by high contract value, critical path work, or work that needs to be highly coordinated. They developed a shortlist of 3 to 5 trades for each discipline and evaluated the candidates based on the following factors: (1) company experience, (2) qualification of project staff, (3) proposed design solution, (4) BIM capabilities, and (5) QA/QC process. Part of the selection process included a discussion of the overhead, profit, and personnel billing hours of each discipline. The team members that were already selected vetted the numbers to make sure that they were consistent with the market rates. They did not conduct a formal audit for each company. The team 23
24 used CBA 7 because they wanted a formal process to select the best company and the best people to work on the project. Table 5. Choosing By Advantages Example Factors Criteria Design Assist Steel Company 1 Company 2 Company 3 Company Experience Must have high rise experience Attribute $400 to $500 MM company value. $150 M in Socal. Has inhouse design capabilities through Jay. Importanc e $225 M company. $80 M in Socal employees doing a very good job on the 49ers stadium Importance $500 M to $600 M value. They completed LA Live Importance Advantage Staff Qualificati on Strong project manager with DA Experience Attribute Jay is very qualified engineer. PX has local experience and foreman is very solid Importanc e Solid team. I see less depth on the design support Importance Bob, Lee, and Randy have good local experience Importance Advantage Design Solutions Ability to meet design requireme nts Attribute Jay offered an alternative that enables a 1.3 floor height reduction Importanc e Recommend the use of grade 65 steel. Generally not as strong on the design side Importance They have support many of the design solutions that have been studied to date. Importance Advantage Project Approach Innovative ideas such as prefabricati on Attribute Very active design assist team. Very solid understanding of the schedule requirements Importanc e Can improve the schedule by 1 month. Solid experience builder Importance Will buy plates overseas and fabricate either in CA or Asia Importance Advantage Proposal Complete proposal with reasonable assumption s and clearly defined exceptions Attribute Advantage They have the labor risk and use limited risk on shapes Importanc e Have price protection through Nucour Importance Lead the proposal developmen t process Importance Value Ideas Provide innovative design and Attribute Use cable brace at column support. Use cap Importanc e Use a shipbuilder to fabricate Importance Propose linking steel, the Importance 7 Note that CBA, like Best Value Selection processes, separates qualifications and cost, but CBA does not weight qualification criteria or cost and Best Value Selection processes do. 24
25 constructio n solutions plates at column splices the plates. The ship builder is offering $4.5 M in savings concrete, decking, and curtain wall through a GMP with savings participation Advantage BIM Capabilitie s BIM capabilities for design developme nt, clash detection, and asbuilt drawings Attribute 5 modelers inhouse use of etabs, tekla, navis Importanc e In house modeling and detailing. Has been 100% BIM for fabrication for the past 10 years Importance Full modeling capabilities Importance Advantage QA/QC Process Well defined QA/QC process Attribute Will QC any offshore purchased material Importanc e Full QC in the shop with 3 rd party Nasco Importance Will provide QC for any offshore materials and utilize third party inspections Importance Advantage Importance of Advantages Cost The 7 members that formed the TVD/IPD team included: Owner Universal Health Services Architect HMC Architects General Contractor DPR-Turner Joint Venture Electrical Design Assist Contractor Bergelectric Mechanical and Plumbing Design Assist Contractor Southland Industries Drywall and Framing Contractor DPR Drywall Fire Protection Design Assist Contractor Southwest Fire Protection Figure 5 shows the onboarding schedule for the both the members within the risk pool and the members outside the risk pool. This figure was taken from an internal presentation and is presented without modifications. 25

26 4.1.4 Contractual Structure Figure 5: Onboarding of Team Members During the design stage of the project, which lasted from March of 2010 until February of 2011, the TVD/IPD team was paid a not-to-exceed time and materials contract. In February 2011, the team signed the ConsensusDocs 300, which then covered both the construction and design phase and superseded the prior agreement. The ConsensusDocs 300 is a relational contract inspired by the Integrated Form of Agreement (IFOA) (Lichtig, 2005; ConsensusDocs, 2013). The ConsensusDocs series of contracts were developed by a coalition of 36 members from the construction industry including: Design Professionals, Owners, Constructors, Subcontractors, and Sureties [to] literally spell the [word] DOCS in ConsensusDocs (ConsensusDocs, 2013). The goal of the coalition was to create a set of contracts that fairly allocates risks and do not unjustly favor one party over another (ConsensusDocs, 2013). The ConsensusDocs 300 includes terms that stipulate: (1) the use of Lean Construction principles, (2) a Management Group composed of the IPD members, (3) Target Value Design is used to ensure that cost and schedule constraints are taken into account by designers, (4) pain/gain sharing between the IPD members, (5) cost of work is reimbursed, with open book accounting practices (e.g., the right to audit), and (6) disputes are resolved collaboratively by the Management Group (ConsensusDocs, 2013). UHS made minimal modifications to the contract template and only altered the agreement to allow for 7 parties instead of the original tri-party agreement. The 7 members of the TVD/IPD team signed the ConsensusDocs 300 in February of 2011 (Figure 6). According to the Temecula Valley team, the signing of the contract was a symbolic event with all the key members present there was no mailing in of signatures. 26

27 Figure 6: ConsensusDocs Project Definition Business Case The business case for the Temecula Valley project was developed by UHS based on their market research and the anticipated revenues from the hospital over its lifetime. The business case reflected the fact that the hospital is in a rural region of Southern California, the demographics of the area, and new healthcare legislation in the United States (The Affordability Care Act), which will impact future revenues. The initial cost estimate for the project was $149.4 million dollars for 140 patient beds. The Target Cost was set at $144 million dollars, which is an average of $1.1 million/patient bed, substantially under the average for California hospitals of $1.8 million/patient bed Stakeholder Values The programming for the hospital called for 140 patient beds (120 medical/surgical and 20 ICU). All of the beds had to be private rooms with their own window view. The program also includes: (a) an emergency department, (b) six operating rooms, (c) one minor procedure room, and (d) a helipad. The only major changes to the scope of the project were a $6.8 million cardiovascular center that was added in late 2011 and a $500,000 helipad. The addition of the cardiovascular center and the helipad increased the Target Cost from $144 million to $151 million. During programming and schematic design, the team collected inputs from a number of internal and external stakeholders to gather requirements and inform the design. Figure 7shows the different groups of stakeholders involved in the program development. 8 The average $1.8 million cost per bed includes all hospitals in California, with no adjustment for size, functionality or location. It is also relevant to note that this metric is becoming less useful as the average duration of patient stays in hospitals decreases. 27

28 Figure 7: Integrated Team The vision for Temecula Valley Hospital is "to deliver exceptional and compassionate patient care. To achieve this vision, the requirements for the hospital project included: 140 patient beds with the ability to expand to 320 beds in the future 24-hour visiting 28 private treatment rooms for outpatient services 20 intensive care unit (ICU) beds High-tech surgical suites and a minor procedure room Cardiac catheterization laboratory Cardiovascular operating room Central operations center In-room computer workstations for timely and accurate documentation 100 percent electronic medical records, in-room charting, and other technology enablers Training room for technology 24-hour room service for patients In-room physical therapy Full-service kitchen with seating for 100 Ample parking for patients, visitors, physicians, and employees Final build out entitled for up to three medical office buildings The key patient-care features included: Optimum lighting levels Noise reduction strategies (operational and architectural) Care areas designed to minimize walking distances for staff Room-service dining and guest trays for visitors Bistro-style coffee shop Outdoor dining Home-like waiting areas 28
29 Family sleep zone Local art Conditions of Satisfaction UHS established the following conditions of satisfaction: 1) Project Delivery Success Maintain Conditional Use Permit by securing major modification approval in November 2010 Maintain or reduce the Target Value Cost of $144M for 140 beds Deliver the Owner s Manual six months prior to opening (approximately 3rd quarter 2012) Certificate of Occupancy by the 1st quarter of 2013 Construction safety 2) Project Team Participation and Satisfaction Every team member firm finishes this project with a profit Predictable outcomes as a result of labor efficiency Reliability and trust as shown by measuring promises made versus promises kept 3) Community and Social Responsibility Positive press in the local and regional press Physician buy-in as reflected by hiring rates Neighborhood satisfaction survey to be conducted 4) Relationships with Regulatory Agencies Maintain promise of UHS being OSHPDs best customer Zero defects in all agency submittals Drawings in OSHPD possession for a time period 15% lower than the lowest established records No excuses surrounding OSHPD, City, etc. for not meeting COS, milestones, etc. Trade partners considered a business partner of OSHPD at the completion of the project 5) Facility Operational Success 30% more operationally efficient than the best performing UHS facility Patient Family Centered Care Delivery and Design reflected by HCAHPS scores 9. Safe Patient Care Environment Community endorsement by the use of our facilities versus others in the area Target Setting Recognizing a need for healthcare services in the Temecula Valley, UHS embarked on a traditional design-bid-build process in 2005 to construct a new hospital in Temecula. The hospital was first designed by a Texas-based architectural firm in 2006 with 173 beds and expansion capability up to 320 licensed beds using a reinforced concrete and precast structure. The plans were submitted to the Office of Statewide Health & Planning Development (OSHPD) in 2007 and approved in The design received
30 approval from the City of Temecula ( entitlements ), an environmental impact review was conducted, and construction drawings were completed. The project was placed on hold in 2008 when the economy slowed and the population growth in the community was predicted to decrease. In the meantime, the City entitlement expiration date grew closer and OSHPD approval of a similar project with precast concrete encountered challenges and delays. The Temecula Valley Hospital project was revived in December of 2009 with a concept for a smaller hospital that did not require precast concrete. UHS issued a request for qualifications to three design firms, asking them to select contractors to form self-directed teams to validate the new concept. (UHS, 2014) The target cost was set by three different requirements: (1) UHS anticipated revenues from the area, (2) UHS limited budget for the project, and (3) UHS challenge to the three design teams to develop a concept that is 30% below the historic market average. UHS believed that they could delivery the project well below the market average because the team would be integrated and thus be able to reduce waste in traditional project delivery systems. Due to UHS limited funds for the Temecula Valley project, there would be no project if none of the teams can develop a concept that is within their requirements. The original 10 target cost of $144 million was a result of the design competition. At the end of the design competition, the concept from the Turner team was chosen by UHS as the most economical approach. Turner validated the Target Cost with a financial benchmark of their historic urban and green field hospital construction (Figure 8 and Figure 9). The team kept the estimate dynamic and updated it on a weekly basis. There might be one section of the estimate that needed to be revised and so we updated it. Maybe the next week, there was a discussion on the structural system. We have a variance every week. We would do a total project re-estimate every 6 weeks. We used the models to pull out quantities. General Contractor 10 The initial target cost did not include the cardiovascular center and the helipad. 30
31 Figure 8: Cost Benchmarking 31

32 Figure 9: Components of Cost Model Figure 10 shows how project costs were broken down. From the total estimated cost of work ($ ) the TVD/IPD team carried 83%. The remaining 17% were contracted out to GMP and Lump Sum trade partners. The contingency was set at ~3% of the project cost and is significantly lower than on projects that do not use TVD/IPD (Do et al., 2014). As part of the agreement, cost overruns first come out of the team s contingency and profit pool. The owner will pay for all cost of work (no profit) beyond the depletion of the contingency and risk pool. Any savings will be shared 50/50 between the TVD/IPD team members (i.e., risk pool members) and the owner. The team is able to earn up to 150% of their negotiated profits with any additional savings beyond 150% of their profit returned to the owner. During the project, the owner reimburses the team based on their cost of work 11 (i.e., actual invoices) and anticipated profits are dispersed to the team at regular intervals. Out of the $116 MM of work that was to be performed by the risk pool members, their negotiated profit was $4.2 MM 12 and $4.4 MM was set for the project contingency. The project 11 Cost of work includes all the direct and indirect cost for the companies inside the risk pool. Direct cost includes personnel salaries, medical insurance for workers, and retirement fund contribution. Indirect cost includes corporate overhead (marketing, accounting, etc.) 12 In accounting terms, the negotiated profit for the risk pool members is the net profit. The firm s overhead costs are included in their cost of work (Figure 10). 32
33 contingency was a fix amount of money allocated to absorb unanticipated problems (e.g., differing site conditions, environmental impacts, unanticipated escalations, design mistakes). Any money that was not spent from the team s contingency pool would become part of their shared profit. Material and labor escalations were included in the cost of work as a line item. Parties outside the risk pool performed the remainder of the work ($24.4 MM). Project Cost Breakdown Cost (millions) Reimbursible Cost of Work Fixed Price Contingency Profit Figure 10: Initial Target Cost ($151 million) The Interviewees provided several reasons for a lower contingency: Since the contractors are involved in the design phase and the team is steering the design towards a Target Cost, there is less risk of cost overruns. The project team members pooled their contingency together and therefore less contingency was needed to cover the same amount of risk. The project contingency covered: (1) errors and omissions, (2) rework, and (3) escalation of labor and materials. By the time of signing the Consensus Docs 300, the team had already completed most of their construction documents and had already locked in the prices for their materials (e.g., steel, conduits, pipes) so there was less risk of escalation. Since the construction phase was relatively quick (14 months total), it was possible for the Temecula team to lock in the prices of their most essential materials. For projects with much longer durations, there may be the question as to who bears the risk of material escalation. Standard practice is to carry a separate contingency for escalation, and maintain it as long as the team as a whole, owner included, consider it to be needed. Each company had a negotiated profit based on their respective business models 13. The profit for the whole TVD/IPD team was fixed and they placed 100% of it into the risk pool. The total profit pool is the summation of each company s negotiated profit times their total cost of work (Profit total = n i=1 Cost of Work i Negotiated Profit i ). Table 6 shows the percentage of the risk pool for each of the companies. Note that although Southwest Fire only held 1.5% of the risk pool profits, they were included as a TVD/IPD member because their scope of work is critical to the success of the project and highly interdependent with other trades. 13 The exact profit margins of each company are not listed in this report for confidentiality reasons. 33
34 Table 6: Percentage in Risk Pool Company Percentage in the Risk Pool HMC 17.9% DPR/Turner JV 30.5% Southland 25.7% Bergelectric 14.6% Southwest Fire 1.5% DPR Drywall 9.8% Total 100% Expected Cost During Design and Construction Figure 11 shows the expected cost of the project throughout the design and construction phase. Figure 11: Expected Cost Throughout the Project Figure 12 shows the expected profit of the team. The team tracked the expected profit during construction. The black area indicates the amount of profit that had been realized. When the joint venture was formed in January 2010, there was a $5 MM gap between the expected cost ($149 MM) and the target cost ($144 MM). This gap corresponded to about 3.5% of the target cost (Figure 11). When the major trade partners onboarded the project in Q1 and Q2 of 2010, the gap between the expected cost and the target cost had grown to $9 MM. The root causes of the increase in the expected cost are documented in Figure 53. In Q2 and Q3 of 2010, it was uncertain if the team could achieve the Target Cost. Bill Seed s (VP of construction from UHS) leadership was instrumental in keeping the team together and getting them to focus on driving the design to the Target Cost. Confident that the team would be able to achieve the Target Cost, UHS continued to develop the design. By the beginning of 2011, the TVD/IPD team s estimate was still above their Target Cost but they were heading in the right direction. In February of 2011, the gap between the estimated cost and the Target Cost was $7 million. And although there was still a ~5% gap to close, the team and the owner trusted each other and believed that if they continue with their Lean processes, they should be able to close the gap and ensure that all the members earn a profit. This was a leap of faith for both the owner and the team. If the project was to be completed at the estimated cost, the team would earn zero profit and the owner would have to pay more than their allowable cost. It is important to note that both the owner and the team were well aware of the financial situation when they signed the multi-party contract. In 2010, the state of California was in a recession caused by the housing bubble. There were not many projects at the time, 34
.")
35 which is why the team was willing to sign the multi-party contract because it would allow them to keep their employees. Figure 12: Expected Profit (Tracked During Construction) 4.3 Steering to Targets During Design Cross-functional Teams For Design The project teams were organized into 7 cross-functional clusters (Figure 13). The clusters allowed for efficient communication within the cluster group and dispersed the decision-making to the cluster and cluster leads. For example, MEP, Fire Protection, and Information Technology trades were placed in the same cluster because there is high level of interaction and coordination between these trades. The crossfunctional clusters were: MEP/Fire Protection/ Information Technology Schedule/Project Systems/Agencies Core/Shell/Envelope Planning/Operations/Architecture Site/Community Budget Core Croup 35

36 Figure 13: Cluster Groups The team s guiding principle for the project was to: (1) have trusted, qualified, and profitable partners, (2) provide a creative and innovative environment, and (3) make learning a priority. Early on, the team identified events or activities that can have a major impact on cost, permitting, and schedule. After these activities were identified, cross-functional teams were created to focus on them. The goal of their cluster groups was to be problem focused. It was okay to assemble or re-assemble the cluster groups as needed. For example, when the core/shell group was no longer needed, they dismantled the group so that people could focus in other areas. They kept reassessing the necessity of the cluster groups. According to one interviewee, the tricky part was making sure that each of those clusters were communicating with other clusters and reporting the information in Big Room meeting. For the majority of the design phase, the integrated team was divided into 7 clusters (Figure 13). Each of the clusters was responsible to deliver their scope of work within their part of the project target cost, but both scope and money could move across clusters when doing so improved total project performance. Each cluster had a designated cluster lead responsible for decision-making and conflict resolution within his or her cluster. The core group, which consists of representatives from the owner, contractor, and architect, managed issues that relate to more than one cluster. In terms of decision-making and conflict resolution, most decisions were made at the cluster level or individual level. The core group only intervenes in situations that could not be resolved or in situations where there is a major impact (e.g., schedule, cost, quality). The organizational structure promotes the flow of communication between the cluster groups and the core group (Figure 14). There were no legal or contractual boundaries that inhibited communication. Figure 14 and Figure 15 show the interaction between the integrated team and the clusters. The integrated team is composed of the cluster leader. Both the integrated team and the cluster groups held regular meetings throughout the project. The integrated team met less frequently than the cluster groups (2x per week vs. daily). After every 3 weeks, the teams have a dedicated session for reflections (Figure 14). To promote dialogue, they organize their reflections into: (1) start doing, (2) stop doing, and (3) keep doing. 36


37 Figure 14: Flow of Requests and Communication Figure 15: Role of Integrated Team and Clusters Figure 16 shows a typical daily check-ins and meeting schedules for the clusters and the core team. On Tuesdays, the integrated team (i.e., cluster leaders) would meet and conduct a macro-level pull plan for the project. Based upon the commitments of the cluster leaders on Tuesday, each cluster group would update their micro-level pull plan. 37
.")
38 Figure 16: Daily Check-ins and Meeting Schedules One goal of the project organization is to place the responsibility for design, estimate, schedule, and construction within each cluster group. The integrated team aggregates the data from the clusters to create the project budget and schedule. This practice avoids breakdowns and miscommunications (Figure 17). 38
 core group, (2) community of practice, (3) cluster leaders, and (4) cluster members (Figure 18; Figure")
39 Figure 17: Design, Estimate, Schedule, Construction Responsibilities within Clusters Integrated Governance The integrated governance structure includes four distinct roles: (1) core group, (2) community of practice, (3) cluster leaders, and (4) cluster members (Figure 18; Figure 19). The core group consisted of the members from the owner, contractor and architect. Their role is to coordinate, manage the overall day-to-day work, and ensure that the project is being delivered according to Target Value Design and Integrated Project Delivery principles. The core group had regular meetings and was ultimately responsible for solving problems that could not be resolved by the cluster teams. They signed off on major design decisions including decisions that required CBA and A3 documentations. The community of practice included members from the owner and TVD/IPD team. All members of the TVD/IPD had to have at least one representative within the community of practice 14. The goal of the community of practice is to advance the team s application of Lean methods, tools, and behaviors. The members inside the community of practice held regular sessions dedicated to learning and sharing best practices. 14 The only exception was Southwest Fire. They were a relatively small company and therefore could not have dedicated personnel involved in the community of practice. 39
 use pull planning to organize the work within the clusters, (2) ensure that commitments are being met, (3) verify to constraints within the")
40 Figure 18: Core Team and Community of Practices Roles The roles of the cluster leaders and cluster members are summarized in figure 18. The cluster leader s main responsibilities are: (1) use pull planning to organize the work within the clusters, (2) ensure that commitments are being met, (3) verify to constraints within the clusters are removed, (4) ensure that the key topics/concerns of the clusters are included in the agenda of the integrated team meeting, (5) represent the cluster in the integrated meetings, (6) be involved in the on-boarding process, and (7) promote the use of Lean Construction methods, principles, and tools. The members work with the cluster leaders on: (1) developing the pull plan, (2) ensuring that commitments are being met, (3) removing constraints, (4) developing the A3s for problem solving and decision-making, and (5) continuously learning and applying. The integrated governance model ensures that the responsibility of work is distributed across the team members. For example, the cluster leaders are responsible for the onboarding process. This governance structure avoids bottlenecks in the decision-making process and gives more control to the people doing the work at the cluster level. 40

41 Figure 19: Cluster Leaders and Cluster Member s Responsibilities Joint Responsibility and Transparency As described earlier, the responsibility for the project was distributed amongst the members of the team via the cluster groups. Since the risk and reward was shared between the members, it makes sense that each of the partners had an oar to steer the ship. Joint responsibility and shared governance was very important in promoting a team environment. The organization of the team is centered on delivering the best possible results for the project. Figure 20 shows the members of this integrated team. 41
. By displaying project Key Performance Indicators (KPIs) in accessible locations (e.g., in the trailer and on the job site), the people who needed the information could access it quickly.")
42 Figure 20: Integrated Team Transparency was a key principle that was actively promoted on this project. All of the TVD/IPD team members had the right to audit each other s finances. The labor productivity and production rates were tracked and publicly displayed on-site (Figure 21). By displaying project Key Performance Indicators (KPIs) in accessible locations (e.g., in the trailer and on the job site), the people who needed the information could access it quickly. The practice of making the workplace visual reduced the number of times that people needed to ask for the information, which can be a time-consuming and expensive process. Miscommunication and miscoordination of information can be reduced by this practice. 42
 meeting every 2 weeks.")

43 Figure 21: Field Board at Temecula (Seed, 2014) Co-location and Big Room Meetings During the early stages of the project, the team developed several temporary big rooms. Overall the team shuffled between 3 big rooms before establishing a permanent space on-site. During the schematic design phase, the team had big room (aka integrated team) meeting every 2 weeks. These meetings occurred off-site at another project site in Corona, California. During the design development and construction document phase, the team had big room meetings twice a week on Tuesday and Wednesday at the Corona site. At the start of construction, the team was continuously co-located on-site and held formal big room meetings twice a week. Figure 22 and Figure 23 show the layout of the colocation at Temecula Valley. Figure 22: Co-location Space (Temecula Valley) 43

44 Figure 23: Co-location Trailer Layout (Temecula Valley) In order to maximize the efficiency of the big room meeting, the TVD/IPD established several ground rules: This is a Safe Zone Everyone is encouraged to speak his or her mind without concern for embarrassment or ridicule by others. We all have equal status and say in all matters. No one person has more authority than others. Speak up - get engaged in conversation and share ideas. Your opinion is important in helping guide the team. Listen to others - focusing on what others have to say helps you understand their point of view. No side conversations. Only have one meeting at a time. Conversations should be heard and shared by all. Help keep the meeting and participants on track by eliminating phone disruptions. No multi tasking. This includes laptop computers and PDA s. Stay on time. This includes start time, end time, break times and agenda Figure 24 shows the layout of the team s scheduling software for the big room meetings. Some key components include: (1) big room facilitator, (2) color codes for breakout sessions within clusters, (3) timing of the meetings, (4) expected outcomes of the meeting, (5) attendees, and (6) contact information. 44
, conduct pull planning, and identify lessons learned.")
45 Figure 24: Big Room Meeting Scheduling Software During DD and CD, the team held big room meetings on Tuesdays and Wednesdays. Tuesday s meeting was with the cluster group and breakout group. Wednesday s meeting was for the whole team. On Wednesdays, they would talk about their numbers (cost, schedule, and burn down rates), conduct pull planning, and identify lessons learned. During construction, they had 1 big room meeting per week for the key trades. The management team met 1 hour each week to go over elevated issues. Towards the end of the project the meetings got shorter and the cluster group was no longer needed during construction. Although the contents of the big room meetings varied through out the project s timeline, the team developed a structured approach for the meetings, which included (Figure 25): 1. Introduction / Ice Breaking - to get people comfortable with each other and breakdown barriers. 2. AH Ha Moments something that happened that surprise you or something that came to you. 3. Budget Reporting - burn rate, status of the overall budget, review of saving items, review of risk items. 4. Hot Topics items that came up from the daily check-ins, which needs to be addressed quickly in order to maintain schedule or budget constraints. 5. Pull Planning - sometimes there would be multiple pull plans being done in the same day with different cluster groups. 6. Community of Practice / Time Reserve for Learning they would invite someone outside to come in to present to the group. This person could be a vendor or person knowledgeable about a topic. Additionally they would send two people from the project to visit another job and presented what they learned. Sometimes, they would have people within the group present their lean practices or innovations. 7. Break out groups (rest of the day). 45
 with the construction crew.")
46 8. Plus/Deltas the plus deltas were conducted in the morning (before lunch) and in the afternoon (at the end of the day). Figure 25: Big Room Meeting Agenda In addition to the big room meetings, they also had daily check-in call (~15 minute) with the construction crew. It was created so that if a constraint came up, they can quickly remove them. The daily check-in call was well scripted so that people were not getting bogged down. At that meeting they would go through the following items: 1. Report whether or not they were on track. 2. Identifying constraints 3. Determine who is the primary contributor to that constraint. 4. Gather commitments 5. Develop follow-up actions items that could be resolved within the cluster group were done within the group. Items that required cross-group problem solving were reported to the integrated team at the big room meetings. According to the team, co-location, big room meetings, and the daily check-in calls led to: More accurate documents Early constructor inputs in the design Labor savings ideas incorporated into the design A higher rate of information flow (no RFIs) Better cost decisions and cost control Tighter tolerances 46
.")
47 Designing and installing the right sized systems More innovation Collaborative Design Conversation The team used a collaborative process where the designers took inputs from the trades and engineers to develop the design together (Figure 26). These collaborative design sessions included between 10 and 15 members in the same room. The designer(s) would propose several alternative design solutions and the rest team would give feedback, add information, and help evaluate the design. Using Smartboards, the information is documented electronically, which allows the team to revisit their work in the future. Figure 26: Collaborative Design Conversation Figure 27 shows a set of alternatives that were considered for the corridor design. The options include: (1) Double 40 Gen 2, (2) Double 40 Compact, (3) Double-Loaded 40, and (4) Traditional 40. Following the CBA methodology, objective data about the sets of alternatives were first collected and then the team decided between the alternatives based on the advantages each offered. The design decisions were locked in at the Last Responsible Moment, which is the point in time when failing to decide results in losing one or more of the options (Ballard and Howell, 2003). According to the architect (Mr. Wilson), the goal of set-based design is to lock in decisions at the appropriate time. Set-based design and the Last Planner allowed the team to select a building system and stick with it knowing that any changes after the Last Responsible Moment would lead to costly redesign and additional permitting problems with OSHPD. During the construction document stage, the design team was solely focused on detailing the design for shop fabrication and did not try to re-optimize the initial design. 47

48 4.3.6 Simulation of Operations Figure 27: Sets of Corridor Design Alternatives After the development of the Target Cost and the initial target program, the architects met with the users to understand their needs. The goal is to make sure that there is an alignment between the initial program and the needs of the users. Once an alignment was established between the Target Cost, target program, and the needs of the users (Figure 28), the architect began the programming phase where they and a team of industrial engineers simulated the workflow and throughput based on the intended operations of the facilities. For example, the program may require a certain number of operating rooms and one of the tasks for the team is to simulate the average wait time, walking time, and overall capacity. The data from the simulation was used to inform the schematic design and detailed design. User needs Validate Capacity (Simulation) Schematic Design Figure 28: The Role of Simulation in TVD Figure 29 through Figure 34 show an example of a simulation conducted on the Emergency Department. In this example, the design team used the initial floor layout to develop a value stream map of the intended service. They then translated the value stream map into a discrete event simulation. After 48


49 inputting assumptions for the activity durations, arrival rates, batch sizes, etc. they were able to calculate the capacity of the Emergency Department, average wait time, and resource utilization. The simulation model for the Emergency Department allowed the team to validate whether or not the needs of the users can be met with the design. In some cases, the design team used the simulation to inform the development of design alternatives. They then used Choosing By Advantages to select the alternative that offered the greatest advantages while meeting the must-have requirements. See appendix 6.2 for some examples of this process. Figure 29: UHS Temecula ED Simulation Figure 30: Executive Summary 49


50 Figure 31: Simulation Overview Figure 32: Assumptions and Input Parameters Figure 33: Simulation Model Results 50
 they on-boarded the BIM modelers too early in the design process.")

51 4.3.7 Building Information Modeling Figure 34: Value Stream Mapping of Kitchen Operations The team started using BIM early in the schematic design phase. According to the team (see Lessons Learned Report) they on-boarded the BIM modelers too early in the design process. Figure 35: Temecula Valley BIM Model The BIM coordination allowed the team to reap substantial savings because they could reduce their tolerance and prefabricate some of the construction off-site. The exterior wall and the roof trusses were prefabricated in major panels and erected on-site. The team went as far as brainstorming ideas to prefabricate bathrooms off-site, which ultimately did not happen. 51

.")
52 Figure 36: Prefabricated Exterior Walls Figure 37: Prefabricated Roof Truss At the time of the Temecula Valley project in 2010, BIM technology was not advanced enough for the team to use a single model. The team used mainly Autodesk 3-D for model coordination and exported the model dimensions into specific software packages for CNC and shop fabrications. The team did not use Revit because it did not have the information and data compatibility capabilities that it currently has. The team only used BIM for model-based quantity takeoffs on a select number of scope (ducts, piping, and framing; Figure 38; Figure 39). In the design phase, the cost estimates were forecasted based on the alternatives in the set-based design process using on-screen takeoffs. Future projects may look at using 52

53 BIM for automatic quantity takeoffs to aid in the TVD process. During the construction phase, the cost estimates were forecasted based on labor productivity rates, general conditions, and market prices of materials that had not yet been bought out. The TVD/IPD provided more transparency in the BIM process. The team found that: We (and the industry ) are over-modeling The BIM process is approximately 30% to 40% too costly BIM Leadership is young and inexperience Models are created for differing purposes The main trades that can benefit from BIM are the ducts, piping, and framing. BIM works best when the key players are co-located BIM requires a process plan o Understand the needs/uses o Understand the dependencies o Understand what is generating cost o Modularize the model Mechanical, plumbing, and framing needs to share leadership for BIM coordination BIM can make costs more predictable Figure 38: BIM for Piping Coordination and Quantity Take-offs 53
.")
54 Figure 39: Framing Layout and Spool Sheets from BIM Model Last Planner System of Production Control For Design The team used the Last Planner in both the design and construction phase. The collaborative pull scheduling and commitment planning of the Last Planner was brainstormed with sticky notes and then recorded and tracked using OurPlan (Figure 40; Figure 55; Figure 56). The Last Planner System of Production Control breaks the project schedule into: a master schedule, phase schedules, lookahead schedules, and weekly work plans (Ballard, 2000). The schedule is developed in greater detail as it approaches the work. The Percent Plan Complete (PPC) measures the percentage of work that was completed vs. the amount of work that was planned for a particular day. This metric encourages reflection and learning from breakdowns (Ballard, 2000). On the Temecula Valley project, the PPC clustered around 80% (Figure 57). The team revised their master schedule every 3 weeks, their phase schedule every week, and their weekly work plan on a daily basis. 54
 components, and (5) the details and finishes. The team used Set-Based Design, also known as Set-Based Concurrent Engineering, which was originally developed by Toyota (Sobek et al.")
55 4.3.9 Set-Based Design Figure 40: Pull Planning Session The process during schematic design and design development followed the progression of developing: (1) the systems, (2) the assembly, (3) subsystems, (4) components, and (5) the details and finishes. The team used Set-Based Design, also known as Set-Based Concurrent Engineering, which was originally developed by Toyota (Sobek et al., 1999). Under the Set-Based Design approach, the team generates alternatives and chooses between them at the last responsible moment (Parrish, 2009; Figure 41). An acceptable alternative is developed early in the design process as insurance against the first irresponsible moment ; i.e., extending the project schedule. The alternatives are reviewed by a crossdisciplinary team using Choosing by Advantages to ensure that stakeholder values are met (Arroyo, 2014). 55
.")
 Follow-up. Figures 42 and 43 show two examples of A3s that were used to document design alternatives.")
56 A3 Reports Figure 41: Set-Based Design The design team documented all major design alternatives using A3s (Figure 42). The A3 document is a single sheet of paper that was used at Toyota to in a systematic problem solving process (Shook, 2009). At Temecula Valley, the A3 document included sections for: (1) The issue, (2) Background, (3) Current condition / problem analysis, (4) Target condition, (5) Analysis, (6) Proposed countermeasures, and (7) Follow-up. Figures 42 and 43 show two examples of A3s that were used to document design alternatives. Within the A3s, the advantages of each of the alternatives are listed and used to aid the decision-making process. The team used A3s to document all major decisions including: (1) building system selection, (2) selection of team members, (3) component selections, and (4) material selections. New members who joined the project could look through a binder of A3s to quickly get up to speed on the major decisions and understand the history of the project. Likewise, the A3s documentation process reduced the loss of institutional knowledge when an individual left the project. Figure 42: Temecula Valley A3 (Cardio Vascular Services) 56
 and lessons learned (Figure 44).")
57 Figure 43:Temecula Valley A3 (Location of Hospital) The Temecula team also documented all of their monthly updates using A3s. The A3s includes the key performance metrics (e.g., budget, schedule, safety) and lessons learned (Figure 44). Figure 44: December 2012 Report 57
58 Value Engineering Dell Isola (1982) states, the optimum time to conduct a value review is after the preliminary submittal stage and before working drawings are started ; however, most construction projects perform VE after a substantial portion of the design has already been completed. Due to the reactive nature of VE and the use of the practice to cut costs (often with compromises to scope and quality), the term VE has a bad connotation in the construction industry. One owner representative on Temecula Valley said: We had a very specific business model. We do not need the fancy glamorous hotel, we just needed a facility that was fit for our needs. The process of evaluating the design based on its functional value and optimizing it to fit the user s need is a core practice of TVD. The participants on Temecula Valley reported in our interviews that they did not use Value Engineering. While true that they did not do VE after design was nominally complete, but needed to be brought into budget, the basic concept of value engineering was used, but proactively in generating the design, not after-the-fact. Their practice of VE followed the disciplined approach of Setbased Design and relied on Choosing By Advantages and A3 reports for decision-making and documentation (Appendix 6.2) Cost Modeling and Cost Tracking The project team used a centralized spreadsheet to track all of their costs, uncertainties (risk and opportunity), and monthly billables. As the project progressed, cost items gradually became locked into place through the Set-based Design process. At the Last Responsible Moment, certain decisions were made and the cost associated with them became fixed. Decisions not yet made were assigned rough order of magnitude (ROM) estimates. The current cost estimate shown in Figure 45 is the sum of the cost that has been fixed and the remaining ROM items. At any point in time, there were cost items that were locked in place because the design had already been committed or the work was already finished. Any attempts at changing the cost items that were already locked in would result in greater cost due to negative iterations, rework, and delays. The remainder of the cost items is still malleable. The malleable cost items have associated uncertainties with them that reflect either a risk or an opportunity. The TVD/IPD team tracked these cost items very carefully and set targets to reduce waste in the remaining work (Figure 45). These targets created a pathway for the team to realize their full profits at the end of the project. Figure 45 shows the cost spreadsheet on February At this time in the project, the team needs to reduce $2.5 million from the project cost in order to realize 100% of their negotiated profits. The TVD/IPD had $84.2 million that has not yet been spent. 58

59 Figure 45: Budget and Billing Tracking 59
 estimate to each risk or opportunity s potential impact on the project. The shared pains and gains meant that the team had to trust each other.")
60 Figure 46: Cost Tracking Risk Identification and Risk Management The team tracked all potential known risks and opportunities on an Excel marker log. They then assigned a rough order of magnitude (ROM) estimate to each risk or opportunity s potential impact on the project. The shared pains and gains meant that the team had to trust each other. Within in this trust; however, is also the permission to challenge and question other members of the team. Since everyone s best interest is aligned with the interest of the project, the challenges are not construed as personal or professional doubt but rather as a way to ensure that the actions taken are best for the project. 60
 At-risk cost of")
 Realized profit (8) Anticipated profit on remaining work, and (8) the design team s burn down")
61 Moving Money Between Boundaries Figure 47: Risk Identification and Risk Management Figure 48: Expected Cost Throughout the Project In order to drive the design to the Target Cost, the team kept track of: (1) At-risk cost of work (2) Not at-risk cost of work (3) Contingency (4) Realized savings (5) Risk items (6) Anticipated savings that have not yet been realized (7) Realized profit (8) Anticipated profit on remaining work, and (8) the design team s burn down rate. 61

 Joint-venture, (2) Mechanical and Plumbing, (3) Electrical, (4) Drywall and")
62 Figure 49: Cost Tracking As a way to realize their full profits, the team kept track of cost saving opportunities (Figure 50). They placed all of their opportunities inside an Excel sheet that they called The Path Back. In the figure below, the team needs to achieve $2,935,744 in savings in order to recognize 100% of the planned profit. Figure 50: The Path Back For the work at risk, the team developed the following categories to track the finances: (1) Joint-venture, (2) Mechanical and Plumbing, (3) Electrical, (4) Drywall and Framing, (5) Fire Protection, (7) Owner s scope at risk, (8) Design Contingency, and (9) Construction Contingency. Every month, the team reviews their current monthly budget report and compares it with the previous month s budget report (Figure 51). They documented risk and opportunity items that were realized in that month and the associated change in the cost that resulted from them. The total monthly change in cost is documented as the Month Delta. All items listed on the budget report include: (1) the dollar impact, (2) the parties involved, and (3) a short description. To facilitate the movement of money between organizational and 62

 whether the change was foreseeable.")
63 cluster boundaries, each transaction also includes a documentation of the parties that the funds are being transferred from and to. Figure 51: Budget and Billing Update The team documented all owner-initiated items in a spreadsheet. For each item they recorded: (1) a description, (2) the members involved, (3) the dollar impact, (4) the driver of the scope change, (5) the reason for the scope change, (6) whether or not the scope was added on a whim, and (7) whether the change was foreseeable. Using this process, they were able to track changes to the scope and determine who is financially responsible for the change -- the IPD/TVD team or the owner Challenges During Design Figure 52: Changes in Scope Initiated by the Owner After starting the project, the team faced many challenges that increased the estimated cost (Figure 53). Some these problems arose from legacy designs that the team had inherited from the architect that left the joint venture. As they looked at the design further, they discovered items that were not included in their estimates or were not finished in design (e.g., extra 12 in width in patient rooms). The 63

64 preconstruction manager from the Joint Venture commented: The increases in cost during the design phase is very common when detailing from an initial schematic design. These are often expected on most projects. In total the challenges increased the total project cost from $144 MM to $156.6 MM. The $162 MM number shown in figure 11 also includes the owner s IT/IS budget. Some of the cost increases during design (Figure 53) would typically be taken from an owner s contingency. On this project, the allowable cost was all that the owner could spend for this project and there all cost increases, regardless of its origins, are part of the project s cost Innovations During Design Figure 53: Challenges That Increased Cost The Target Value Design process started in Q and lasted until the start of construction in Q During this time, the team was able to develop innovations that resulted in a $16 MM savings. Figure 54 shows $13.3 MM as the anticipated savings from the TVD process. During the schematic design phase, the superintendents from the general contractors took an active role in planning the construction sequence with the architects and engineers who were designing the project. The effort to include the superintendents in the early design phase allowed the team to make improvements to the construction schedule and saved 6 months from their initial schedule. The 6 months reduction in the schedule resulted in approximately $2.25 million in savings from the general conditions alone with much greater benefits for the client in terms of being able to open the hospital early. As a result of the innovations and the reduction in the project s schedule, the team was able to save ~ $16 MM during design. According to the owner, team saved an additional $7 million during the construction phase due to improved labor productivity as a result of applying Lean in the field. 64
, project manager, and architect.")
65 Figure 54: Target Value Design Innovations 4.4 Steering to Targets During Construction Last Planner for Construction The team used the Last Planner to coordinate the work of the trades during construction. The weekly planning meetings included the representatives of the key trades (i.e., superintendents and foremans), project manager, and architect. The goal of the Last Planner is to increase the reliability of the workflow and the hand-offs between the trades. The team developed and updated their Last Planner schedule on the wall with stickie notes. At the end of their planning session, a project engineer would enter the data into the OurPlan software. The team used OurPlan to track and visual the commitments and production schedule. 65
 and Task Anticipated (TA).")

66 Figure 55: Weekly Planning Meeting Figure 56: OurPlan In addition to tracking the Percent Plan Completed (PPC), the Temecula Valley team also kept track of the Task Made Ready (TMR) and Task Anticipated (TA). TA measures the percentage of tasks anticipated on the lookahead plan two weeks ahead of execution. TMR measures the performance of lookahead planning in identifying and removing constraints to make tasks ready for execution (Hamzeh et al., 2012). 66

67 To measure the covariance of the variables for TMR and TA relative to PPC, we use a statistical tool known as the Pearson Coefficient. The Pearson Coefficient of the PPC and Task Made Ready (TMR) is.79; this suggests that there is a strong correlation between the percent of TMR and PPC. The Pearson Coefficient of the PPC and the Task Anticipated is.2; this suggests that there is a weak correlation between the percentage of TA and PPC. Hamzeh et al. (2012) hypothesized that: improving the performance of lookahead planning (i.e., increasing TA and TMR) results in improving the reliability of weekly work plans (i.e., increasing PPC). More data are needed to independently verify these findings. Additionally, a theory is required to explain why there is a strong correlation between PPC and TMR and a weak correlation between PPC and TA Location Based Planning Figure 57: Percent Plan Completed For the production planning, the team used a line of balance software from Vico called Flowline (Figure 48). To use the Flowline software, the team first divided the building into 4 different zones (a, b, c, d) for each floor. On the vertical axis of the Flowline software is space (floor and zone). On the horizontal axis is the timeline of the project from the beginning to the end of construction. The goal of the line of balance (also known as location-based planning) is to ensure that only one trade is working in an area at one time and thus avoid the problem of trade stacking. The line of balance tracks two things: (1) when a particular trade should be working in a particular area and (2) the anticipated production rate of each trade assuming a certain crew size. First is shown by when the trade s color line crosses the box that is surrounded by a space and time intersection. The slope of the trade s line shows the later. The slope is a visual representation of production rate (ΔY/ ΔX = Δ Zone/ ΔTime). For example, if a trade can complete zones A and Zones B in 1 week their production rate would be 2 zones per week. The location-based plan supported and was used with the Last Planner to improve the reliability of workflow and PPC. The Last Planner uses reliable commitments, a lookahead schedule, constraint removal, and learning from breakdowns to improve PPC over time. The Last Planner does not explicitly tie the production with the layout of the building and as result commitments may be made which are not physically possible with trade stacking. The location-based schedule uses the physics of the building to further support the objectives of the Last Planner. 67

68 The location-based planning was developed by the superintendents who had the most knowledge on construction techniques and anticipated labor productivity rates. The superintendents helped developed the Flowline schedule during the design development and their involvement helped the team shorten the schedule by 6 months. The interviewees reported that for the trades working in the field, the Flowline schedule was much more intuitive to visualize their work than Gantt charts. Figure 58:Flowline for Location-based Planning Value Stream Mapping One of the reasons why the Temecula Valley project was able to hit its aggressive cost and schedule targets was their practice of bringing Lean to the field crew. The TVD/IPD team encouraged their crews to practice 5S and conduct Value Stream Mapping studies. The people who were doing the work took video recording, analyzed the videos, identified waste, and developed ideas to make the process more efficient. In total, the TVH team conducted over 150 value streams and video recording studies. The team extended Lean training beyond just the members in the risk pool. One such example is the door installation trade, which was a Lump Sum subcontractor (Figure 61). Using Value Stream Mapping, the door installation trade was able to reduce waste and improve their profitability. 68


69 Figure 59: Video Recording of Work Figure 60: Value Stream Map of Door Installations Figure 61: Waste vs. Value 69


70 Figure 62: Video Study of 2 nd Floor Exterior Process Mapping Figure 63: Resulting Improvement from Video Study The Temecula Valley team developed process maps for some of the most common activities. Figure 64 and Figure 65 show a process map for an RFI and Submittal. The goal of the process map is to make tacit knowledge transparent through documentation, to standardize their processes, and to seek opportunities for improvement from the current state. 70


71 Figure 64: Process Map for RFIs Figure 65: Process Map for Submittals 71

72 4.4.5 First Run Studies In addition to the Value Stream Mapping studies, the field crew also conducted several first run studies. The first run studies allowed them to simulate the work either with mock-ups or through discussion to develop a plan for installing key components. Additionally, the first run studies allowed the team to collect preliminary data on labor productivity. Using the productivity data, the team could determine whether or not they can meet their productivity objectives and take corrective action early. They could also significantly reduce constructability risks and they can have better data of the overall prior to construction so they can better allocate their time and attention on the more risky scopes of work. Figure 66: First Run Studies 72


73 Whys Analysis Figure 67: Production Rates and First Run Studies The team used a 5 Whys Analysis to find the root cause of problems and take action to prevent the problem from occurring again in the future. The 5 Whys Analysis was used to diagnose and fix problems that can came up from the Last Planner s PPC tracking. Figure 68 shows a sample 5 Whys Analysis Community of Practice (COP) Figure 68: Example of 5 Whys Analysis To facilitate learning and sharing of knowledge on Temecula Valley, the team developed their own community of practice (COP). The community of practice was modeled after the Lean Construction Institute s Communities of Practice. The members in the COP members met once a month for approximately 1-2 hours. The goals of the COP are to promote knowledge sharing, sustain the Lean culture, and to get the people who are responsible for the daily project activities to advance Lean implementation. All the members in the risk pool had a representative within the COP and they each 73
74 took turns in organizing the events. The COP events included a mixture of: (1) sharing internal best practices, (2) sharing lessons learned from another project, (3) having guests come to present information to the group, and (4) discussing Lean books that the team has been reading Shared Key Performance Indicators (KPIs) This section documents the Key Performance Indicators that were recorded and shared with the Temecula Valley team. These KPIs appear in the monthly status updates to the owner (appendix 6.1). It is important to note that the KPIs first appeared in June 2012 approximately 1 year after the start of construction. The reason for the shared KPIs to appear so late is that this was the first TVD project for most of the participants. Many of the practices of TVD are different that more traditional project delivery methods and it took some time to for the team to develop these KPIs. The shared KPIs and shared financial tracking metrics were developed in response to Bill Seed s (the owner) question: Are you going to make money on this project? One of Bill s conditions of satisfaction for this project is for the team to make a reasonable profit. And although this might sound like an easy question to answer, it was big challenge for the team. Ken Lindsey from Southland (mechanical trade partner) rose to the challenge and developed a spreadsheet to integrate the team s spending, cost projections, and labor productivity rates. The main KPIs include: Financial Position Billed to Date Budget and Path to Budget Current Risks Schedule and Milestones PPC and Schedule Variance Man Power Curves Weekly Production Rates Monthly Rework Video Studies Lessons Learned / 5 Good Whys Project Photos Safety Metrics Inspection Metrics Financial Position The financial position shows the team s current cost and profit projections. The goal of this KPI is to communicate with the team the current state of the project and to encourage the team to work together to drive down cost and increase their profits. 74

75 Billed to Date Figure 69. Financial Position The billed to date keeps track of the total amount that has been spent relative to the contract value. This metric gives the team a good indicator of how much of the project s remaining budget is still malleable. 75

76 Budget and Path to Budget Figure 70. Billed to Date The path to budget is a list of opportunities that the team can still realize. The realization of these opportunities would allow the team to bring the project back to budget and increase profitability. 76


77 Current Risks The current risks KPI lists the major risk items. Figure 71. Path to Budget Figure 72. Current Risks 77


78 Schedule and Milestones This KPI tracks the key schedule milestones of the project. Figure 73. Schedule Milestones 78


79 PPC and Schedule Variance PPC and Schedule Variance are metrics of the Last Planner. PPC measures the degree to which commitments in the weekly work plan are met Man Power Curves Figure 74. PPC Trends The man power curves includes the projected and the actual labor hours of each trade Weekly Production Rates Figure 75. Man Power Curves The team tracked their production rates for each crew on a weekly basis. The actual production rate is compared with the estimated or target production rate, which was set at the beginning of the project. The production rate tracking revealed that their Lean operations in the field had a positive effect of the crew s productivity rates. This metric was key in allowing the team to forecast their anticipated cost to completion in the construction phase. 79


80 Figure 76. Weekly Production Rates One of the advantages of tracking labor productivity on a weekly basis is that the team can experiment with their production system (the batch sizes, work packages, crew sizes, etc.). The rapid feedback between action and result means that the team could run small experiments to uncover hidden nuggets for improving productivity. Instead of rely on heuristics, myths, and our assumptions of productivity; the experiment-based approach uses real to inform decisions. Figure 77: Leveraging Productivity Data for Day to Day Decisions Using their productivity data, the team decided to re-sequence the work of the drywall and the cast iron trades. They decided to install plumbing before framing contrary to the traditional method. This sped the overall process and although the cost increased for drywall and framing, the team saved an estimated 80


81 $200,000 in plumbing costs. The team was only able to make this change in the work sequence because they had modeled all of the framing studs and had very good data on the production rates. Figure 78: Leveraging Productivity Data for Preplanned Decisions For the Med-Gas trade, the team found that they were more productive when they worked over-time. The conventional way of thinking is that productivity decreases with over-time work. This trade required a significant amount of set up and set down time and their scope of work required intense concentration. By working overtime, the Med-Gas had longer stretches of productivity, higher rates of tool time, and a quieter working environment during the after hours. Figure 79: Leveraging Productivity Data for the Work Week Monthly Rework The team tracked the rework of the electrical, plumbing, drywall, and HVAC trades and included this information in the monthly report. The goal of the rework tracking is to use the 5 Whys Analysis to identify the root causes for why these rework items occurred so that they could take preventative action. According to the team s documents, they observed labor hours of rework, which is equivalent to 81


82 $38, (assuming $65 per labor hours). It is unclear exactly how much cost savings were realized from this practice since that information was not documented Implemented Improvements Figure 80. Monthly Rework The team shared a list of their key improvements in the monthly reports. The goal of the improvements announcement was to commend the efforts of those who came up with new ideas and to encourage all the people on their projects to innovate Lessons Learned / 5 Good Whys Figure 81. Implemented Improvements The team reported their key lessons learned and results from their 5 whys analysis to the monthly report. 82


83 Figure Good Whys Project Photos Figure 83. Project Photos Safety Metrics Figure 84. Safety Log 83
.")

84 Inspection Metrics Figure 85. Inspection Metrics 5 Project Performance Metrics 5.1 Cost The Temecula Valley Project began with a very aggressive Target Cost. According to the project team, the Temecula Valley project was completed for $480 / SF which is 30% less than the average for California hospitals (Figure 86; Figure 87). In terms of the cost per patient bed, the Temecula Valley project reported a cost $1.1 million per bed compared the $1.8 million per bed average in California even though the Temecula Valley project had private rooms and window views in each room. The cost savings came from a rigorous examination of what was truly valuable to the owner, more thought-out design, less waste in the design process, prefabrication of building components, and increased labor productivity in the field due to first run studies and value stream mapping. 84

. 5.")
85 $680 / SF $500 / SF $480 / SF 0 CA Ave. Hospital Cost (SF) Temecula Target (SF) Temecula Actual (SF) Figure 86: Cost per sf $1.8MM / Bed $1.1MM / Bed CA Ave. Hospital Cost per Bed Temecula Ave. Hospital Costs per Bed 5.2 Schedule Figure 87: Cost per patient bed The project was completed a month-and-a-half ahead of schedule despite 82 days of delay due to environmental conditions (DPR, 2014b). The total duration was 18 months for the preconstruction phase and 2 years for the construction phase (DPR, 2014b). 5.3 Quality According to interviews with 2 owner representatives, UHS is very happy with their project. They set aggressive targets in terms of cost, quality, and scope and were able to achieve them. The owner commented that the biggest thing they wanted from the project delivery method was reliability and cost control, which they achieved through this project. Since this research is solely focused on the design and construction phase, we did not investigate the quality of the facility from the perspective of the doctors, 85

86 nurses, and patients. Future research is needed to examine the quality of projects that use TVD and IPD with projects that do not use these practices. Post occupancy studies will be performed to determine whether or not the TVD process truly delivered the intended value to the users and patients. 5.4 Safety Safety is an important metric for any project. According to the Temecula Valley team, out of 407,958 man-hours there was 2 recordable events, 13 first aid incidents, 0 lost time, and 2 near miss (Figure 85). One thing worth noting is that the number of recordable and near misses are the same (2 each). Typically, the difference there is one or two orders of magnitudes between the number of near misses and the number of recordable. Limited information about the safety program at Temecula Valley and how they recorded violations restricts further conclusion on these results. Construction safety is difficult to track because it depends on the person tracking it and the criteria used to measure safety violations. 5.5 Productivity Figure 88: Safety Log Productivity was tracked for every trade and publicly shared with the team. Overall, the productivity of the project, through the implementation of Lean in the field, was greater than the projected productivity. The median labor productivity were: Sheet Metal: + 16% Mechanical Piping: + 77% Plumbing: + 46% Electrical: + 16% Drywall: - 7% In some areas, the drywall trade was less productive than they had planned. This phenomenon may be due to: (1) the practice of optimizing for the whole rather than for each individual scope and (2) being too optimistic about the anticipated labor productivity rate. For example, some trades might sacrifice their productivity if it helps the overall project be completed faster. Overall, the priority trades such as sheet metal, mechanical, plumbing, and electrical all had labor savings while the drywall trade (which has a lower labor cost) took a hit. In the example below, the Mechanical crew installing the black Victaulic piping finished the project over 4 times faster than their initial estimate. A project manager from the Joint Venture remarked that the drywall trade set the bar too high, which resulted in the final productivity rate looking less favorable than it should. It is important to note that these productivity metrics were measure based on the difference between the actual rates and the budgeted rate. As more data is gathered, we intend to do a comparison with other projects with similar scopes of work. 86

87 5.6 Profitability Figure 89: Labor Productivity Due to the cost savings in both the design and construction phase, the members of the risk pool were able to earn 150% of their negotiated profits, which was the maximum amount of profit that they could earn on the project. Out of $111 of their at-risk-work, companies earned $6 million in net profit, which is a pre-tax net profit margin of 5.1%. We currently do not have enough information to conclude how this profit margin compares with the industry average for a similar project. It is also important to note that the net profit margin is an aggregate of all the TVD/IPD members. For confidentiality purposes, we do not publish the profit margins of specific firms. It is worth noting that the profit margins of designers are 87
88 higher than that of contractors. Contractors have labor, materials, and equipment while the designer s main cost is labor. 5.7 Cultural Outcomes In order to capture the cultural outcomes of the project, the researcher sent out survey to the Temecula Valley participants. The survey questions are based on Sutter Health s 5 Big Ideas. The questions were sent out in a randomized shuffle order, which eliminates the bias that can result from the sequence of the questions. Each participant was asked to rate on a Likert Scale to the extent that they believe the statements of Sutter s 5 Big Ideas were true for the Temecula Valley project. The scales for the responds are as follows: 1 => Strongly Disagree 2=> Disagree 3=> Neither Agree nor Disagree 4=> Agree 5=> Strongly Agree In total 6 participants answered the survey and the mean score of their response is shown in Table 7. Cultural Outcomes Survey (rated on a scale of 1 to 5) Table 7: Cultural Survey Summary 1. The team collaborated, "really" collaborate 5 2. The project was optimized for the whole rather than optimized for local maxims. Mean 3. The team tightly coupled learning with action The project was managed as a network of commitments Long lasting friendships and trust were formed as a result of this project. The cultural survey showed very positive results. Four out of the five questions received a mean score greater than or equal to 4.5. The survey revealed the management of the project as a network of commitments is one area for improvement. Often times project outcomes only measure the dimensions of scope, schedule, and cost. The human dimensions of project success in terms long last friendships, rapport, relationships, and trust may be just as important as the scope, schedule, and cost outcomes. Many of the participants will be working together on future projects and the trust that they build on this project will carry over to their next project. This survey showed that in addition to achieving the aggressive goals of the project, the team was also able to build long lasting personal and professional relationships. The Ah Ha Moments, which documented the team s learning and reflection on their lean practices, showed some evidence of the positive cultural outcomes that came from the Temecula Valley project. Below are some examples: I was touched by the threading s showing compassion and concern about our team member. General Contractor


89 This was the best project in years. - Mechanical Trade Partner I feel that the people in the big room are friends. - Architect I reflected on the project during the holiday break and felt that it hasn t consumed me as with other projects. There were no worries. General Contractor Once you are exposed to a lean project, you wish that all your other projects work this way. Architect At my office, my colleagues told me that I have changed. My thought process and procedures truly reflected the big room culture. Mechanical Trade Partner I was able to create a pull plan for a dinner for my wife. The dinner was very successful and well organized. Trade Partner 5.8 Product Innovations The Temecula Valley team generated numerous innovations. Below are some examples of product innovations that were documented in the monthly reports. 89


90 90

91 5.9 Process Innovations In addition to the product innovations, there were many process innovations / improvements that reduced cost and increased the productivity. 91

92 92


93 93

94 94

95 95

96 96

97 Figure 90: Garage Door Typically the drywall framers would begin work after the mechanical trades. After the framing is completed, the electrical trades would come in and install the lighting fixtures and then remaining trades would come in and finish up the room. On this project, the team decided to spend more money to build a garage door system between the rooms. The garage doors allow framing drywall top out prior to large ductwork. It also creates a scissor lift path of travel from room to room. The inclusion of the garage door initially cost more money. This is an example of designing for constructability because the team spent 97

98 more money on the materials but gain back greater returns on the labor productivity. This innovation was only possible due to TVD because the builders were able to work with the designers in the early stages of the project. Figure 91: Using ipads to Document RFIs, Rework, and Change Orders In order to expedite communication of RFIs and change orders, the team used ipads and photo-sharing applications to document problems. 98


99 Figure 92: Masking Top Track Prior to SFRM They used a piece of blue painters tape and masking off the slots of our toptrack prior to Sprayed- Applied Fireproofing. Afterwards they can easily remove the tape and discard the overspray without having to chip and scrape the overspray from our top track. This saves labor on scrapping and cleaning, which would eventually follow. Figure 93: Screeding Z-Clips The drywall team installed Z-Clips to the thickness of the Spray-Applied Fireproofing. This allowed them to have the SFRM sub screed the bottom of the beam flat with the surface of Z-Bar. The benefit is that now when they install toptrack to the Z-Bar they don t have to scrape the monokote and sweep up. All the screeding waste is picked up in the fireproofers tarps. 99


100 Figure 94: All Materials on Carts All the materials on-site are required to be on carts. The Temecula Valley team had a 30/30 rule. All materials on carts must be within 30 seconds or 30 feet from the installation site. This rule made sure that the materials were located near the scope of work and prevents people from hoarding space. Figure 95: Backing Layout Color Coded 100

101 Figure 96: Dry Erase Boards on All Floors Dry erase boards were placed on every floor. These boards allow the field crew to quickly write notes and read pertinent information. 101


102 Figure 97: Spool Sheet Framing Layout The layouts of the drywall frames are color coded and tagged. The color-coding practice (also known as poka yoke) helps reduce the number of mistakes and eliminates unnecessary measurement. Figure 98: Labor Productivity Transparency in the Field 102

103 The labor productivity information is shown on-site for each crew. This information gave the field crew constructive feedback about their performance, promotes positive competition, and showed the field crew how their work is contributing to the project as a whole. 103


104 104

105 105

106 6 Conclusion 6.1 Challenges The application of TVD and IPD on the Temecula Valley project was not without its challenges. Some of the challenges that the team reported include: Overcoming the natural tendency to design and make decisions from a silo perspective. 106
107 There was one or two instances where people stayed silo and eventually failed. They ended up leaving the job. General Contractor It is very easy to slip into old mindsets. When things get tough, people have a natural tendency to revert back to the way of working that had worked for them in the past. Trade Partner Understanding the level of accuracy that is required at certain time in the design. The team required extensive training to understand the TVD/IPD process. If you are just coming from a design-bid-build [project] to a big room meeting it can be a shock. Trade Partner Tracking production rates was very challenging. Each team had their own method for tracking productivity and it took us quite a while to understand each other s methods. Trade Partner Developing trust within the project environment. People outside the risk pool did not want to go to the big room meeting. They thought that their work was too specialized and did not think that they should go to the meeting. There was one individual, a designer, that did not continue with the project for this reason. Project Manger General Contractor Some people did not collaborate as well and ended up leaving the project. Contractors do not have a lot of experience with design. Construction is very linear but in design you have lots of exploration of ideas. One of the things that we noticed is that contractors are used to working with finished drawings and they kept asking for us to freeze the plan. -Architect It takes time and effort to learn other people s workflow. It took the team several months of training and working together to develop an understanding of each other s work. This common understanding ultimately led to design innovations. Overcoming the history of firms previous projects with each other. Some people had prior working experiences with each other on some successful projects and some not so successful projects. There is a tradition of fear of asking others to improve (e.g. a trade partner does not want to challenge the general contractor). 6.2 Lessons Learned The following are the lessons learned from the Temecula Valley project participants that they wish to carry with them on future projects. The information was collected from the interviews and a lessons learned presentation that the tem had put together internally. 107
108 Make sure that everyone attends the onboarding orientation. When we had a failure from one of the trade partners and we would look back and realize that the failures came from the party that we did not include in the formal onboarding process. General Contractor TVD and IPD require commitment and investment of time and money early on in the project. The start of the project is more staff intensive but what you spend upfront, you end up saving. The number of people in design is double than a traditional project. It may be difficult to convince an owner to spend as much money in pre-construction as required for an IPD/TVD project. General Contractor The importance of talk before drawing. Architect The team learned through their collaborative whiteboard sessions, that better design solutions comes from talking through the problems first with a multi-disciplinary group suggesting and testing out ideas. Only after the solution was agreed upon should the architect develop drawings. The biggest practice was the trades sharing their production rate forecasts and actual production rates weekly along with the continual improvement ideas, mutual challenges to improve, and adjustments to help each other to improve. Trade Partner Co-location of the team throughout the design phase is dynamic in terms of the numbers of days and the specific attendees. There is no one size fits all for how to structure the co-location and big room meeting. At different parts in the project, different people are required and their commitments also shift depending upon the needs of the project. It is prudent to develop a co-location plan that is right for the project context. We learn to share our thoughts and unfinished work with the owner and contractor to engage them in the evolution of the design (not just a critique of it). Architect The design process became more collaborative and the iteration cycles were quicker when the architect involved the contractor, owner, and trades in developing design solutions. Rather than just relying on the contractor and trades for constructability review on a completed design, the architect was able to find much better solutions by involving the other parties from the beginning. 6.3 Processes that Led to Cost Savings In this section, we list some of the processes that the Temecula team reported which led to cost savings on the project. These processes were reported by the Temecula Valley team through either the interviews or through the lessons learned presentation. Only having to design the building once. In the past, we would have to review shop drawings from the subs which is a copy of our own drawings. Every time that you pass the baton, there is a probability that you can drop it. -Architect Reduce over designing and over communicating in documents, reducing batch sizes of design products, and reducing unnecessary tolerances of the design. 108
109 You don t have to specify all the criteria [in the design documents] because the person that you need to communicate with is there in the same room. Over specifying is a safety measure that we used [on more traditional projects] to protect ourselves. We also reduced the batch size of our design work. For example, we did not need to have the [whole] floor plan done all at once; we just need to complete the portion that is necessary for the next step. We can have different groups working on individual rooms. Parallelizing the working and making smaller batches allows the design work to proceed much quicker. -Architect Significant savings resulted from pooling resources and purchasing in bulk. When we looked at the trade s bids, many trades budgeted money for the same stuff. You don t have to buy it seven times if you identify it early. Instead it is better to just buy it once for the whole project and share. Items such as: fork truck, scissors lift, cleaning, insulation, fire stopping, caulking were shared on this project. In terms of materials, when we bulk order them, we could get a cheaper price. General Contractor Taking a closer examination of how people do work. Having carts together so that people do not have to walk to get their tools, packaging and labeling materials, and putting everything on wheels [improved the efficiency]. Trade Partner A continual search for opportunities for prefabrication. The exterior wall was prefabricated in major panels and brought up. The more work that you can do off-site, the more savings that you have in your labor rate in the field. On future projects, we plan on prefabricating the restrooms. General Contractor Elimination of change orders and RFIs. I learned that there is so much knowledge from the subs and contractors that we can benefit from. IPD in a co-location environment was a huge benefit. If you had a question about clearance for a structural element, you have the structural engineering, MEP, and estimator to really give you the data to make decisions. -Architect More rigorous analysis of the owner s business case and value added components. There is a lot of waste in healthcare where a lot of things are overdone when they do not add value to the owner s business case. Corridors, hallways, and anything that takes up room in the building that is not functional is essentially waste. On Temecula, we designed a single corridor that is double loaded. In our concept we were able to reduce the corridor space by 30%. Certain spaces have common functionality but are used at different times and by different departments. We looked for ways to reduce duplicates. The client demanded that there be no departmental boundaries [in the operations department]. We also talked a lot designing the building to support the operations. - Architect Money was able to move between boundaries. The fire sprinklers cost half a million dollars more but made the project progress better in other areas. This led to an overall cost savings Trade Partner We spend some extra money building the garage doors between the patient rooms. The garage doors had no impact on the final usage of the building but gave us greater efficiency during 109
110 construction because our scissor lifts, materials, and equipment could be more easily moved in after the drywall framing was already erected. General Contractor Understanding everyone s perspective instead of just passing the blame. We are better informed and ready to make corrections. No one is sitting around pointing fingers. Since we are all there together, we cannot assign fault. It is a great experience when people want to find the best solution rather than point fingers. Architect Slowing down in order to speed up. We can now wait longer before committing to a specific design because we now have a better team. -Architect Swarming around problems. We were able to found cross-functional teams to quickly fix problems as they arise. Since we all share in pains and gains of the project, we did what was right for the project. We did not have to go through a lengthy RFI/Change Order process before addressing a problem. -Trade Partner Problem solving and documenting design alternatives with A3s. The A3s were great because it allowed us to document all of our ideas in one place. After doing several A3s, I realize that the results from the process is almost always different than my initial idea. By going through the [structured] process, I was able come up with more thoughtful solutions. General Contractor Using A3s and Choosing by Advantages to make sound and transparent decisions. CBA helped us make more informed decisions. The method allows us to engage with the owner and ask for their inputs. Architect Design in sets and narrowing the sets based on looking at the whole of the project, including price and schedule, and narrowing at the last responsible moment not rushing to make decisions early-on. Co-location of an integrated team that included the key trades. The trade partner s involvement was key in the TVD process. They had so much valuable knowledge to contribute to the design. - Architect Measuring productivity and openly sharing forecasts and actual rates weekly. The use of plus/deltas and rigorous efforts to eliminate repeat deltas. Periodic reflections using start, stop, and continue. Increased level of trust between parties who are usually adversarial. Many of the members on this project have worked together on projects in the past. Some of those projects turned out well and some of those projects resulted in adversarial relationships. The ability to overcome the adversarial past and build trust was key to our success as a team. - Architect 110
111 We focused on delivering the project rather than on our own companies. The shared risk and reward meant that we were going to be successful only if the project was successful. This made people focus on doing what is best for the project rather than what is best for their own team (e.g., moving scope of work to the parties who is able to do it the cheapest). General Contractor Improved quality of life of the individuals had time for fun (golf, ping pong etc.), did not feel pressure to work 14-hour days. The processes that we used gave us much better control over the project as a whole. As a result, we spent less time fire fighting problems which made the work environment less stressful. General Contractor 6.4 Areas for Improvement The following are some areas for improvement from the Temecula Valley project participants that they wish to carry with them on future projects. Better communication of the business case and the Target Cost to the team. Several of the project participants within the risk pool reported that they did not know the owner s business case and how the Target Cost was set. In the future, the team should spend time during the onboarding process to educate members about the business case. The team should know how and why their cost saving innovations relate to the business case. The target cost of the project needs to be grounded on the owner s allowable cost in the business case, otherwise the practice of setting a cost target can be construed as arbitrary and exploitative. Keep better notes from big room and coordination meetings. One project participant reported that many good ideas were presented at coordination meeting but were not incorporated into the project. Perhaps having a dedicated person record the ideas presented at the big room and following up with the implementation can allow more ideas to be fully realized. One suggestion is to de-couple the person who raises an idea from the person who has to champion it. The team may benefit from more idea generation if people who do not feel the pressure of doing more work after they have raised an idea. After an idea is raised, if it is valid, the best person to carry the idea forward should take it. This person may or may not be the person who raised the idea in the first place. Apply BIM at the right time. On this project we brought some trade partners too early and try to have them model when not enough of the design was completed. We wasted money by starting the BIM process too early. General Contractor At the time of the application of this project, BIM technology had not yet matured. There are still many opportunities to improve on the coordination, model-based estimating, etc. Determining the acceptable level of detail and what needs to be modeled was a challenge on this project and future implementation and research may help resolve this problem. Research better ways to manage BIM tolerances. 111
112 Tolerances management for the BIM model was reported as one of the trouble areas for the project. Motivate and incentivize members outside the risk pool to be as engaged as members inside the risk pool. There were several instances where members outside the risk pool did not attend the coordination or big room meetings. One way to rectify this issue is to explicitly state that attending the coordination meetings is mandatory. Lump Sum contractors should be informed of this requirement and include it in their bid. 6.5 Updating the P2SL Current Process Benchmark on Target Value Design Every case study project is examined for practices and methods that can be incorporated into a revised TVD Benchmark. The following features of the Temecula Valley Hospital project will be examined for incorporation: Modeling and simulation of healthcare operations On-boarding process Co-designing process Shared governance; including the joint pay application process involving all risk pool member companies Steering to Targets in Construction; including First Run Studies and tracking profitability 6.6 Acknowledgments The P2SL TVD Research Group would like to thank the participants of the Universal Health Services (UHS) Temecula Valley project for taking time out of their busy schedule to share information and the lessons learned from this project. From UHS, Bill Seed and Tara Laski have been invaluable resources of information and knowledge. Steve Wilson from HMC Architects, Tom McCready from DPR Construction, Brent Nikolin from Turner Construction, Ken Lindsey from Southland Industries, Kristin Hill from Inside Out Consulting, and George Vangelatos from HMC Architects provided data and reviewed the report. This research would not have been possible without the collaboration between the UC Berkeley s Project Production Systems Laboratory and our industry sponsors. Dean Reed from DPR Construction has been an adamant supporter of the research effort since its inception in 2010 and has been instrumental in funding this research. On the academic side, Professor Glenn Ballard and Professor Iris D. Tommelein have provided the direction and feedback for this research. In addition to all the named parties, I would also like to give an extended acknowledgment to the men and women were involved on the UHS Temecula Hospital project. Their hard work and dedication has made this report possible. 7 References AIA, Integrated Project Delivery: A Guide. AIA CC Ballard, G., The last planner system of production control. PhD dissertation, Civil Engineering, University of Birmingham, Birmingham. 112
113 Ballard, G., Target Value Design. Retrieved on 06/02/2011 from: 26/Glenn% %20=%20Target%20Value%20Design.pdf Ballard, G., Current Benchmark for Target Value Design. P 2 SL Report. Retrieved on 5/2/2014 from: Ballard, G., Howell, G., An update on Last Planner. Proc., 11th IGLC Conference, Blacksburg, VA. Ballard, G., Reiser, P., The St. Olaf College Fieldhouse Project: A Case Study in Designing to Target Cost. IGLC Ballard, G., Howell, G., Relational Contracting and Lean Construction. Lean Construction Journal, 2(1), pp Cohen, IPD Case Studies. Retrieved on 5/20/2014 from: ConsensusDocs, The ConsensusDocs Guidebook. Retrieved on 05/02/2014 from Cooper and Slagmulder, Target Costing and Value Engineering. Productivity Press Inc. Darrington, J., Lichtig, W., Rethinking the G in GMP: Why Estimated Maximum Price Contracts Make Sense on Collaborative Projects. The Construction Lawyer, 30(2). Dell Isola, A., Value Engineering in the Construction Industry. Denerolle, S., The Application of Target Value Design to the Design Phase of 3 Hospital Projects. Retrieved on 06/02/2014 from: Do, D., Chen, C., Ballard, G., Tommelein, I., Target Value Design as a Method for Controlling Project Cost Overrun. Proceedings at the International Conference for Lean Construction. DPR, 2014a. DPR-Turner Construction Company Joint Venture Breaks Ground Today on UHS Temecula Valley Hospital. Retrieved from on 5/2/2014 from: DPR, 2014b. Pushing the Limits of Productivity on New UHS Temecula Hospital Project. Retrieved on 5/2/2014 from: Eisenhardt, K. M., Building theories from case study research. Academy of Management Review, 14: Feil, P., Yook, K.H., Kim, L.W., Japanese Target Costing: A Historical Perspective. International Journal of Strategic Cost Management. pp Flyvbjerg, B., Five misunderstandings about case study research. Qualitative Inquiry 12, 2, Frandson, A., Berghede, K., Tommelein, I.D., Takt Time Planning and the Last Planner. Proc. 22 nd International Group for Lean Construction (IGLC-22). Oslo, Norway. Hamzeh, F., Ballard, G., Tommelein, I.D., Rethinking Lookahead Planning to Optimize Construction Workflow. Lean Construction Journal Pp
114 Knott, T No Business as Usual: An Extraordinary North Sea Result. The British Petroleum Company, London. Lichtig, W., Sutter Health: Developing a Contracting Model to Support Lean Project Delivery. Lean Construction Journal, 2(1), pp Macomber, H., Putting the 5 Big Ideas to Work White Paper. Lean Project Consulting. Macomber, H., Howell, G., Barberio, J., Target-Value Design: Nine Foundational Practices for Delivering Surprising Client Value. The American Institute of Architects, Practice Management Digest. Matthews, O., Howell, G Integrated Project Delivery: An Example of Relational Contracting. Lean Construction Journal, 2(1) pp Monden, Y., Hamada, K., Target Costing and Kaizen Costing in Japanese Automobile Companies. Journal of Management Accounting Research, pp Nicolini, D., Tomkins, C., Holti, R., Oldman, A., Smalley, M., Can Target Costing and Whole Life Costing be Applied in the Construction Industry?: Evidence from Two Case Studies. British Journal of Management, 11, pp Raisbeck, P., Millie, R. and Maher, A. (2010) Assessing integrated project delivery: a comparative analysis of IPD and alliance contracting procurement routes. Proceedings of the 26th Annual ARCOM Conference, Leeds, UK, 6 8 September, Association of Researchers in Construction Management, Reading, Vol. 2, pp Sakal, Project Alliancing: a Relational Contracting Mechanism for Dynamic Projects. Lean Construction Journal, 2(1), pp Seed, B., Personal conversation. 10/17/2013. Seed, W. (2014). Integrated Project Delivery Requires a New Project Manager. Proc. 22 nd International Group for Lean Construction (IGLC-22). Oslo, Norway. Shook, J. (2009). Toyota s Secret: The A3 Report. MIT Sloan Management Review, 50(4), Sobek, D. K., A. C. Ward, J. K. Liker Toyota s Principles of Set-based Concurrent Engineering. Sloan Management Rev.39(Winter) Suhr, J. (1999). The choosing by advantages decisionmaking system. Greenwood Publishing Group. Thomsen, C., Darrington, J., Dunne, D., Lichtig, W., Managing Integrated Project Delivery. CMAA. UHS, Annual Report. Retrieved on 5/13/2014 from: UHS, Temecula Valley Hospital Newsroom. Retrieved on 5/3/2014 from: Yin, R. K. (2009). Case study research: Design and methods (4th ed.). Thousand Oaks.CA: Sage. Yook, K., Kim, I., Yoshikawa, T., Target Costing in the Construction Industry: Evidence from Japan. Construction Accounting & Taxation 15 (3),

115 Zimina, D., Ballard, G., Pasquire C Target Value Design: Using Collaboration and a Lean Approach to Reduce Construction Cost. Construct Management and Economics. pp Appendices Monthly A3 Status Updates June All appendix files are available at: 115


116 8.1.2 July


117 117

118 8.1.3 August
119 119

120 8.1.4 September


121 8.1.5 October

122 122
123 8.1.6 November


124 8.1.7 December

125 125

126 8.1.8 January

127 8.1.9 February
128 128


129 March
130 April
131 131

132 May

133 June
134 July August
135 September October


136 November December

137 137


138 8.2 Sample A3 Documents Cardio Vascular Services at Temecula Valley Developing Paths of Travel to ICUs that are Acceptable to Licensing and OSHPD Modular OR Ceilings 138


139 8.2.4 Secondary Portable Water Source for TVH Select the Supply Chain Methodology for TVH 139


140 8.2.6 Selecting Location of Hand Wash Sink at Med/Surg Patient Room Selecting the Optimal ICU Patient Room Layout 140


141 8.2.8 Selecting the Optimal Universal Care Unit Treatment Room Temecula Valley Hospital Integration 141


142 8.3 TVH Lessons Learned Spreadsheet 142


143 143

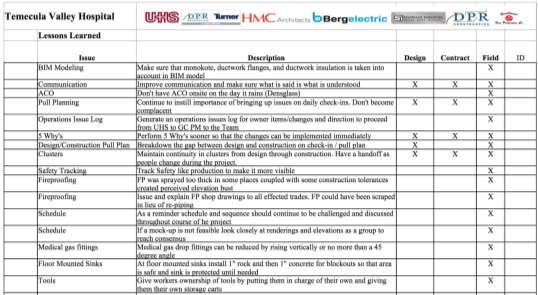
144 144


145 8.4 TVH Implemented Innovations Spreadsheet 8.5 TVH Ah Ha Moments Spreadsheet Temecula Valley Ah Ha Moments Directory Name Title Seena Hassouna Architect Rebecca Hathaway Mechanical Trade Partner 145

146 Kristen Hill Bob Kenz Margie De Laurell Marius Nimitz Ken Lindsey Dave Seastrom Nancy Squartino Ward Thompson Lee Tsangos Steve Wilson Steve Yots George Zettle Lean Coach Fire Protection Trade Partner Engineer Architect Mechanical Trade Partner General Contractor Owner Architect General Contractor Architect Mechanical Trade Partner General Contractor 146


147 147
Target Value Design and BIM: Delivering the targets of construction 2025
 Target Value Design and BIM: Delivering the targets of construction 2025 Prof Lauri Koskela, University of Huddersfield Dr Paul Coates, University of Salford Amit Kaushik, MSc, University of Salford Presentation
Integrated Lean Project Delivery. Glenn Ballard University of California, Berkeley
 Integrated Lean Project Delivery Glenn Ballard University of California, Berkeley Trading Ponies for Horses Why was IPD formed? * To overcome the obstacle to innovation: Who pays? Who gains? How does IPD
Three Opportunities Glenn Ballard Lean Construction Institute University of California, Berkeley
 Three Opportunities Glenn Ballard Lean Construction Institute University of California, Berkeley ballard@ce.berkeley.edu Graphic courtesy of Extemin Lean in the Construction Industry: Three Connected Opportunities
Different Ways to Contract for Lean Project Delivery. Joel Darrington San Diego COP 3/27/19
 Different Ways to Contract for Lean Project Delivery Joel Darrington San Diego COP 3/27/19 Relevance of Contracts? Increase alignment among parties Parameters for Lean behavior and activities First collaborative
THE KEY PERFORMANCE INDICATORS OF CONSTRUCTION
 THE KEY PERFORMANCE INDICATORS OF CONSTRUCTION See Ahead Think Ahead Stay Ahead Research conducted in collaboration with Dodge Data & Analytics Introduction 7 KPIs of Construction 1. Problems Discovered
Why Projects Excel? The Business Case for Lean Construction
 California Communities of Practice June 14-152017 Why Projects Excel? The Business Case for Lean Construction John Pemberton Lean Construction Institute Bevan Mace, Ph.D. National VP, Operations & Lean
Program Management Professional (PgMP)
") Program Management Professional (PgMP) E X A M I N AT I O N CO N T E N T O U T L I N E Project Management Institute Program Management Professional (PgMP ) Examination Content Outline April 2011 Published
Program Management Professional (PgMP) E X A M I N AT I O N CO N T E N T O U T L I N E Project Management Institute Program Management Professional (PgMP ) Examination Content Outline April 2011 Published
Target Value Design. Glenn Ballard Lean Construction Institute University of California, Berkeley
 Target Value Design Glenn Ballard Lean Construction Institute University of California, Berkeley Target Value Design is: a management practice that drives design to deliver customer values, and develops
A FRAMEWORK FOR INTEGRATING TAKT PLANNING, LAST PLANNER SYSTEM AND LABOR TRACKING
 Emdanat, S., Meeli, L. and Christian D. (2016) A Framework for Integrating Takt Planning, Last Planner System and Labor Tracking In: Proc. 24 th Ann. Conf. of the Int l. Group for Lean Construction, Boston,
ICMI PROFESSIONAL CERTIFICATION
 ICMI PROFESSIONAL CERTIFICATION Contact Center Management Competencies The ICMI Professional Certification Contact Center Management Competencies specify job role-specific knowledge, skills and abilities
Design-Assist Delivery for Prefabricated Building Components
 Design-Assist Delivery for Prefabricated Building Components Darren Olsen, Duncan Varner, Mark Taylor, Salman Azhar and Mark Tatum Auburn University Auburn Alabama Prefabrication offers a potential means
Descriptive Data Sheet
 Descriptive Data Sheet Project Name: Patient Care Pavilion Facility type: Acute Care Hospital Project Type: Patient Tower Replacement Project Location: Oakland, California Project Stats: 13 Stories 35,000
Please comply with the Lean Construction Institute s Usage Policies and Attribution Guidelines at
 Please comply with the Lean Construction Institute s Usage Policies and Attribution Guidelines at http://www.leanconstruction.org/usage.pdf when using this file. Thank you. LEVERAGING VIRTUAL DESIGN &
Texas Health Resources, Methodist Alliance Hospital, Fort Worth, Texas. Hospital; 188,000 s.f. $46.5m 58 beds with growth potential of 300 beds
 Seminar Objectives 1) IPD and its impact on team behavior 2) Lean and its role in a collaborative process. 3) Pre-Fabrication 4) How Lean, BIM and collaborative processes impact project value. The Project
Solution Evaluation. Chapter Study Group Learning Materials
 Chapter Study Group Learning Materials 1 2015, International Institute of Business Analysis (IIBA ). Permission is granted to IIBA Chapters to use and modify this content to support chapter activities.
Bringing Order out of Chaos
 Bringing Order out of Chaos How architects can use simple Lean concepts to double the project team s productivity and maximize client satisfaction Susan Pratt Susan@PrattAandM.com AEC Labor Productivity
The St. Jerome s University team in Waterloo are delivering lean IPD, scaled to suit the size and complexity of their project
 The St. Jerome s University team in Waterloo are delivering lean IPD, scaled to suit the size and complexity of their project Presentation by Darren Becks St Jerome s University Samir Emdanat Ghafari and
Lean Construction Institute 2016 Annual Report
 Lean Construction Institute 2016 Annual Report Summary The year 2016 was a transformational year for LCI thanks to the record-breaking 18th annual LCI Congress attendance, the publication of Target Value
Introduction to the Last Planner System
 Introduction to the Last Planner System Dick Bayer October 3, 2016 1 Agenda: Welcome, overview and introductions Current Practice Last Planner System (LPS) as a series of countermeasures Establishing milestones
WE MAKE YOUR HEALTHCARE REAL ESTATE WORK FOR YOU PROJECT DELIVERY METHODS FOR HEALTHCARE CONSTRUCTION
 WE MAKE YOUR HEALTHCARE REAL ESTATE WORK FOR YOU PROJECT DELIVERY METHODS FOR HEALTHCARE CONSTRUCTION PROJECT DELIVERY METHODS FOR HEALTHCARE CONSTRUCTION Table of Contents 1. Introduction 2. Design-Bid-Build
Target Value Delivery
 Target Value Delivery Katherine Copeland, Southland Industries OCTOBER 16, 2017 LCI Education & Training Lean Construction Institute Provider Number H561 LCI Training Block: Target Value Delivery LCITB.TVD
Lean Project Delivery Operating System
 Lean Project Delivery Operating System David MacNeel & Dan Passick, On Point Lean OCTOBER 16, 2017 LCI Education & Training Lean Construction Institute Provider Number H561 LCI Learning Module: Introduction
Introduction to Lean CAPTURE AND LEVERAGE THE LEAN ADVANTAGE. Introduction to Lean. Learning Objectives
 Plus / Delta Key Take-Aways: 1. High value for full day class 2. A lot of material was covered 3. CoP will address Last Planner & Target Value Design by holding workshops in 2017 Austin CoP Event: ; Presented
INTEGRATED PROJECT DELIVERY IN PUBLIC PROJECTS: LIMITATIONS AND OPPORTUNITY
 Kim, Y., Rezquallah, K., Lee, H., and Angeley, J. (2016). Integrated Project Delivery in Public Projects: Limitations and Opportunity." In: Proc. 24 th Ann. Conf. of the Int l. Group for Lean Construction,
This is the third and final article in a series on developing
 Performance measurement in Canadian government informatics Bryan Shane and Gary Callaghan A balanced performance measurement system requires that certain principles be followed to define the scope and
Requirements Analysis and Design Definition. Chapter Study Group Learning Materials
 Requirements Analysis and Design Definition Chapter Study Group Learning Materials 2015, International Institute of Business Analysis (IIBA ). Permission is granted to IIBA Chapters to use and modify this
Building Information Modeling to Facilities Information Management and Beyond
 Building Information Modeling to Facilities Information Management and Beyond Meghan Ruffo, Thomas Koltoniak, & Geoffrey Coon Carolinas HealthCare System Join the conversation #AU2016 Class summary Carolinas
Projectwide ROI. A team approach to gaining BIM Benefits (Arizona State University ISTB IV) Dan Russell / Sundt Construction / November 2, 2011
 Dan Russell / Sundt Construction / November 2, 2011") Projectwide ROI A team approach to gaining BIM Benefits (Arizona State University ISTB IV) Dan Russell / Sundt Construction / November 2, 2011 The Associated General Contractors of America (AGC) is a Registered
Projectwide ROI A team approach to gaining BIM Benefits (Arizona State University ISTB IV) Dan Russell / Sundt Construction / November 2, 2011 The Associated General Contractors of America (AGC) is a Registered
Self-Study Guide Administrative Program Review
 Self-Study Guide Administrative Program Review Introduction This guide is a companion document to the APR Program Handbook. Its purpose is to assist selfstudy team members with conducting their department
GETTING STARTED WITH LEAN CONSTRUCTION. A guide for project teams
 GETTING STARTED WITH LEAN CONSTRUCTION A guide for project teams HOW TO USE THIS DOCUMENT Outlined in this guide are foundational steps for helping project teams improve the predictability and profitability
Lean Practices from Competition through Construction
 Lean Practices from Competition through Construction UCSF MISSION HALL PROJECT RUDOLPH & SLETTEN, INC WRNS STUDIO Introductions RUDOLPH & SLETTEN, INC Gary Taylor Senior Project Executive Kelli Quinn Senior
Agile Portfolio Management for a Fast- Paced World. Are you ready? Are you ready?
 Agile Portfolio for a Fast- Paced World Are you ready? Are you ready? 1 Ask a company today what its top priorities are, and you ll hear about growth and customer obsession. For enterprise architects working
Making it Happen: How Project Managers Drive Strategic Alignment and Strategy Execution. Jacob Parrish, MPH, PMP Vice President, Systems & Procedures
 Making it Happen: How Project Managers Drive Strategic Alignment and Strategy Execution Jacob Parrish, MPH, PMP Vice President, Systems & Procedures Session Objectives Recognize the value of project management
THE SIMPLE FRAMEWORK FOR INTEGRATING PROJECT DELIVERY
 THE SIMPLE FRAMEWORK FOR INTEGRATING PROJECT DELIVERY PRESENTATION THESIS STATEMENT Dean Reed, DPR Construction LCI Los Angeles / Orange County CoP Los Angeles, CA June 27, 2018 AGENDA The Simple Framework
FOR. Developed by The Maine Commission for Community Service 38 State House Station, Augusta, ME
 COMPETENCIES FOR MANAGERS OF VOLUNTEERS Novice to Expert Continuum --------------------------------------------------------------- MANAGING SELF: TRAITS AND CORE COMPETENCIES ---------------------------------------------------------------
International Diploma in Project Management. (Level 4) Course Structure & Contents
 Course Structure & Contents") Brentwood Open Learning College (Level 4) Page 1 Unit 1 Overview of Project Management The unit 1 covers the following topics: What is A Project? What is Project Management? Project Constraints Tools and
Brentwood Open Learning College (Level 4) Page 1 Unit 1 Overview of Project Management The unit 1 covers the following topics: What is A Project? What is Project Management? Project Constraints Tools and
Managing Design as an Information Supply Chain
 Managing Design as an Information Supply Chain Fall BIMForum Orlando, FL Disney's Yacht Club Resort October 20 21, 2015 Matthew Jogan, AIA Ghafari Associates mjogan@ghafari.com Managing Design as an Information
BUSINESS PROGRAMS UNDERGRADUATE PURPOSE 7 HANDBOOK. Managing Capital Markets. School of Management, Business Programs
 BUSINESS PROGRAMS UNDERGRADUATE PURPOSE 7 HANDBOOK Managing Capital Markets School of Management, Business Programs Updated: June 2011 Contents OVERVIEW OF THE PURPOSE Purpose Deliverables, Competencies
Introduction to Lean Construction: What is Lean Construction and How Can It Benefit You?
 Introduction to Lean Construction: What is Lean Construction and How Can It Benefit You? BY DAVID UMSTOT, PE, CEM UMSTOT PROJECT AND FACILITIES SOLUTIONS, LLC ABC Webinar November 19, 2013 1 Lean Construction
PROJECT EXECUTION PLANNING FOR COST AND SCHEDULE MANAGERS
 PROJECT EXECUTION PLANNING FOR COST AND SCHEDULE MANAGERS ALLEN C. HAMILTON PMP CCE Project Management Associates LLC 3 Totten Way, Suite 110 Morris Plains, New Jersey 07950 USA Telephone: +1 973 984-1853
BU21079 Building Information Modeling to Facilities Information Management and Beyond
 BU21079 Building Information Modeling to Facilities Information Management and Beyond Meghan Ruffo, BIM Manager / Carolinas HealthCare System Thomas Koltoniak, BIM Specialist / Carolinas HealthCare System
DEFINING THE SPECTRUM OF PROJECT DELIVERY OPTIONS AND THEIR IMPLICATIONS FOR YOUR PROJECT 2017 Airport Construction Strategy Summit
 DEFINING THE SPECTRUM OF PROJECT DELIVERY OPTIONS AND THEIR IMPLICATIONS FOR YOUR PROJECT 2017 Special Thanks To: DEFINING THE SPECTRUM OF PROJECT DELIVERY OPTIONS AND THEIR IMPLICATIONS FOR YOUR PROJECT
Strategy Analysis. Chapter Study Group Learning Materials
 Chapter Study Group Learning Materials 2015, International Institute of Business Analysis (IIBA ). Permission is granted to IIBA Chapters to use and modify this content to support chapter activities. All
Project Design and Performance Management Guide A Logic Modeling Approach [WORKING DRAFT]
![Project Design and Performance Management Guide A Logic Modeling Approach [WORKING DRAFT]](/thumbs/95/124381773.jpg "Project Design and Performance Management Guide A Logic Modeling Approach [WORKING DRAFT]") Project Design and Performance Management Guide A Logic Modeling Approach [WORKING DRAFT] Developing meaningful measures that accurately communicate your program s or project s performance requires a clear
Project Design and Performance Management Guide A Logic Modeling Approach [WORKING DRAFT] Developing meaningful measures that accurately communicate your program s or project s performance requires a clear
How Do We Start a Project? Ensuring the Right Sponsorship, Stakeholder Alignment and Thoughtful Preparation for a Project
 How Do We Start a Project? Ensuring the Right Sponsorship, Stakeholder Alignment and Thoughtful Preparation for a Project Donald G. Gardner, President, Gardner Project Integration Group, Ltd. Introduction
Project Management. Objectives 3/17/2015. David Borrill, MT, MBA, PMP
 Project Management David Borrill, MT, MBA, PMP Objectives Nobody falls asleep or walks out. Presentation of some of the main points in the management of projects in the healthcare environment. Everybody
THE CUSTOMER EXPERIENCE MANAGEMENT REPORT & RECOMMENDATIONS Customer Experience & Beyond
 www.sandsiv.com THE CUSTOMER EXPERIENCE MANAGEMENT REPORT & RECOMMENDATIONS TM 1 Customer Experience & Beyond www.sandsiv.com TM Customer Experience & Beyond Legal Notice: Sandsiv 2015. All Rights Reserved.
BRITISH COLUMBIA INSTITUTE OF TECHNOLOGY
 BRITISH COLUMBIA INSTITUTE OF TECHNOLOGY THREE-YEAR BUSINESS PLAN 2014 /15 2016 /17 September 2014 95% Employment among recent degree graduates One of BC s Top Employers since 2011 TABLE OF CONTENTS Executive
The Effects of Comparative 4D Models on Schedule Development and Controls. Abstract
 The Effects of Comparative 4D Models on Schedule Development and Controls Kevin Coyne, P.E. Managing Engineer, Exponent, Inc. Abstract In this paper the argument is made that the use of comparative 4D
Please comply with the Lean Construction Institute s Usage Policies and Attribution Guidelines at
 Please comply with the Lean Construction Institute s Usage Policies and Attribution Guidelines at http://www.leanconstruction.org/usage.pdf when using this file. Thank you. Provider Name: Lean Construction
Conceptual Framework and Process for Strategic Planning
 Conceptual Framework and Process for Strategic Planning Defining Essentials and Aspirations, Evaluating Resources and Tradeoffs, Decisioning, and Developing an Actionable Approach for Achievement Version
Meeting the Standard of Care in an Evolving Project Delivery Environment
 Meeting the Standard of Care in an Evolving Project Delivery Environment Russell Jumper & Tim Fandrey Gray Reed & McGraw Texas Society of Professional Engineers Denton Chapter March 9, 2018 Gray Reed &
SECTION TARGET VALUE DELIVERY INTRODUCTION. TARGET VALUE DELIVERY: Practitioner Guidebook to Implementation Current State 2016
 SECTION 1 TARGET VALUE DELIVERY INTRODUCTION 9 TARGET VALUE DELIVERY (TVD) OVERVIEW Chapter Chapter 1 BUSINESS CASE PLANNING Chapter 2 VALIDATION Chapter 3 VALUE DELIVERY: STEERING TO TARGET IN DESIGN
KEY SUCCESS FACTORS FOR MAJOR PROGRAMS THAT LEVERAGE IT. The 7-S for Success Framework
 KEY SUCCESS FACTORS FOR MAJOR PROGRAMS THAT LEVERAGE IT The 7-S for Success Framework May 2014 This document sets forth a framework of critical success factors for large scale government IT projects. ACT-IAC
Project Portfolio Management Assessment
 Management Assessment PREPARED FOR: Ross Little, IAG DIAGNOSTIC PROGRAM POWERED BY INFO-TECH RESEARCH GROUP January 13th, 2017 Powered by: Data is comprised of feedback from 2 respondents, including: James
THE CULTURE CANVAS A Working Guide and Checklist to Support the Development of a High-Performing Culture
 denison TM THE CULTURE CANVAS A Working Guide and Checklist to Support the Development of a High-Performing Culture The Denison Model of High Performance A Systems Approach to Understanding and Managing
Operational Modeling: Informed solutions for complex problems
 Operational Modeling: Informed solutions for complex problems 16 th LCI Congress October 7-10, 2014 Our Big Idea Adapting standard practices from the semiconductor industry enables new techniques in design
The Path to Clinical Enterprise Maturity DEVELOPING A CLINICALLY INTEGRATED NETWORK
 The Path to Clinical Enterprise Maturity DEVELOPING A CLINICALLY INTEGRATED NETWORK dhgllp.com/healthcare Kevin Locke PRINCIPAL Kevin.Locke@dhgllp.com 330.606.4699 Michael Strilesky SENIOR MANAGER Michael.Strilesky@dhgllp.com
Project Integration Management
 Project Integration Management Presented by Project Masters Inc. *Throughout this presentation, we reference and recognize the following trademarks, service marks, and copyrights of the Project Management
Lean Construction & Integrated Project Delivery (IPD) Overview. Introducing Lean and the Lean Construction Institute to NWCCC September 28, 2017
 Overview. Introducing Lean and the Lean Construction Institute to NWCCC September 28, 2017") Lean Construction & Integrated Project Delivery (IPD) Overview Introducing Lean and the Lean Construction Institute to NWCCC September 28, 2017 Topics Why consider lean? Origin of Lean Construction Institute
Lean Construction & Integrated Project Delivery (IPD) Overview Introducing Lean and the Lean Construction Institute to NWCCC September 28, 2017 Topics Why consider lean? Origin of Lean Construction Institute
CERTIFIED ADMINISTRATOR OF SCHOOL FINANCE AND OPERATIONS
 SFO SCHOOL FINANCE AND OPERATIONS CERTIFIED ADMINISTRATOR OF SCHOOL FINANCE AND OPERATIONS SFO Exam Guidebook ASBO International s certification program is governed by the Certification Commission, a semi-independent
Do not open this paper until instructed by the invigilator. Please note: This question paper must not be removed from the examination room.
 APM Project Fundamentals Qualification Examination paper Candidate Number Date Location Examination Paper Sample Paper v1.4 General Notes Time allowed 1 hour. Answer all 60 multiple choice questions Use
Enterprise Data Strategy and Governance
 Project Charter DATE: 9/20/2017 VERSION 1.0 Prepared By: Melany Leavitt and Paul Given Page 1 Document Revision History Version Number Date Description.01 5/25/2017 Draft Charter.02 9/1/2017 Draft for
How Can Technology Support Collective Impact and Improve Outcomes?
 How Can Technology Support Collective Impact and Improve Outcomes? SUMMARY Health departments, hospitals, health systems, and nonprofits are using emerging technologies to enact successful collective impact
Integrated Design Build and a Lean Delivery
 Integrated Design Build and a Lean Delivery Managing a complex business case while delivering a lean project Holly Cindell, Jim Bostic and John Vaught Background Agenda Contracts and Creating an integrated
Career opportunity: Executive Vice President and General Manager, Worldwide - Wolters Kluwer Finance, Risk and Regulatory Reporting (FRR) - London
 - London") Career opportunity: Executive Vice President and General Manager, Worldwide - Wolters Kluwer Finance, Risk and Regulatory Reporting (FRR) - London About Wolters Kluwer Financial Services Wolters Kluwer
Career opportunity: Executive Vice President and General Manager, Worldwide - Wolters Kluwer Finance, Risk and Regulatory Reporting (FRR) - London About Wolters Kluwer Financial Services Wolters Kluwer
Systems Analyst Position Description
 Position Description October 5, 2015 Analysis Position Description October 5, 2015 Page i Table of Contents General Characteristics... 1 Career Path... 2 Explanation of Proficiency Level Definitions...
Consulting Highlights & Studies
 Consulting Highlights & Studies Master the change change management during project execution By Shula Hadi Introduction Today s business environment is characterized by one factor above all others: the
Overall Equipment Effectiveness: A Strategic and Practical Improvement Tool
 Overall Equipment Effectiveness: A Strategic and Practical Improvement Tool Used strategically, overall equipment effectiveness can be a valuable key in unlocking a manufacturer s production potential
Delivery capacity rubric
 Delivery capacity rubric This rubric is a tool to assist in understanding the current state of your system s capacity for effective implementation. In this rubric, system refers to the organization being
Please comply with the Lean Construction Institute s Usage Policies and Attribution Guidelines at
 Please comply with the Lean Construction Institute s Usage Policies and Attribution Guidelines at http://www.leanconstruction.org/usage.pdf when using this file. Thank you. Provider Name: Lean Construction
Federal Segment Architecture Methodology Overview
 Federal Segment Architecture Methodology Background In January 2008, the Federal Segment Architecture Working Group (FSAWG) was formed as a sub-team of the Federal CIO Council s Architecture and Infrastructure
CHAPTER 7: BUSINESS SKILLS FOR TECHNICAL PROFESSIONALS
 CHAPTER 7: BUSINESS SKILLS FOR TECHNICAL PROFESSIONALS A Guide to Customer Service Skills for the Service Desk Professional Third Edition 302 OBJECTIVES In this chapter students will learn: How to acquire
Continuing Education Credits
 Recent Developments in (IPD) for NECA Members October 14, 2013 9:00-9:50 AM Following this session, you will be able to: Explain the concept and structure of an IPD project. Identify the issues and risks
Decision Support and Business Intelligence Systems (9 th Ed., Prentice Hall) Chapter 9: Business Performance Management
 Chapter 9: Business Performance Management") Decision Support and Business Intelligence Systems (9 th Ed., Prentice Hall) Chapter 9: Business Performance Management Learning Objectives Understand the all-encompassing nature of performance management
Decision Support and Business Intelligence Systems (9 th Ed., Prentice Hall) Chapter 9: Business Performance Management Learning Objectives Understand the all-encompassing nature of performance management
CORROSION MANAGEMENT MATURITY MODEL
 CORROSION MANAGEMENT MATURITY MODEL CMMM Model Definition AUTHOR Jeff Varney Executive Director APQC Page 1 of 35 TABLE OF CONTENTS OVERVIEW... 5 I. INTRODUCTION... 6 1.1 The Need... 6 1.2 The Corrosion
KEY TERMS & DEFINITIONS IN STRATEGIC PLANNING
 KEY TERMS & DEFINITIONS IN STRATEGIC PLANNING Term Definition Related Terms Academic An organized sequence or grouping of courses leading to a defined objective - such as a major, degree, certificate,
Taking Design to Operation
 Taking Design to Operation Presenters: Jacob D Albora Associate VP, Director of BIM-FM Services McVeigh & Mangum Engineering, Inc. Bernie Sublette, CHC Project Executive, Project Development Healthcare
Unit 3: Traditional Project Delivery Using IT Applications
 Unit 3: Traditional Project Delivery Using IT Applications 3.1 Construction Project Process Flow i. In a typical construction project, the major key to its success hinges on how well the project process
Guidance on project management
 BSI Standards Publication NO COPYING WITHOUT BSI PERMISSION EXCEPT AS PERMITTED BY COPYRIGHT LAW raising standards worldwide Guidance on project management BRITISH STANDARD National foreword This British
Define and Initiate SubPhase
 Project Management Methodology Project Management Methodology Training Define and Initiate SubPhase Course Purpose Familiarize team members with the Start Project Sub-Phase processes. Understand process
PMP Exam Preparation Workshop. Chapter # 5 Project Scope Management
 PMP Exam Preparation Workshop Chapter # 5 Copyright PMI SOC 2013 1 Learning Objectives By the end of this session you will understand: How scope management processes relate to the process groups Project
Three Opportunities Created by Lean Construction
 Three Opportunities Created by Lean Construction Gregory Howell, P.E. Lean Project Consulting How do we manage projects now? Determine client requirements including quality, time and budget limits and
Align Projects with Strategic Objectives
 GET MORE OUT OF YOUR BUSINESS IMPROVEMENT INITIATIVES Achieve annual and longer-term objectives by maintaining strong connections between LeanSigma improvement projects and business strategies. Executive
The Strategy Alignment Model: Defining Real Estate Strategies in the Context of Organizational Outcomes
 The Strategy Alignment Model - Site Selection Magazine, January 2002 http://www.siteselection.com/issues/2002/jan/p46/ 1 of 4 3/14/2010 1:32 PM From Site Selection magazine, January 2002 M A N A G E M
LCI CAROLINAS COP MAY 14, 2014
 LCI CAROLINAS COP MAY 14, 2014 lean intro WHAT IS LEAN? Production practice that considers the expenditure of resources for any goal other than the creation of value for the end customer to be wasteful,
Manager, Supervisor & CEMA Skill Set Model County of Santa Clara
 Leads Innovation Leadership Styles Manages Change Models Integrity, Trust & Transparency Strategic Thinking and Planning Manager, Supervisor & CEMA Skill Set Model County of Santa Clara Conflict Management
Bravely Addressing Disputed Claims John Woerly, RHIA, CHAM, FHAM Senior Principal, Accenture
 Bravely Addressing Disputed Claims John Woerly, RHIA, CHAM, FHAM Senior Principal, Accenture Session Outline Session Objectives Defining Disputed Claims Operational Impacts Conceptual Model Organizational
The Accenture 2011 High Performance Finance Study. Redefining High Performance in the Insurance Finance Function
 The Accenture 2011 High Performance Finance Study Redefining High Performance in the Insurance Finance Function Contents Introduction Introduction 03 Delivering greater value to the enterprise 09 Dealing
LEANING YOUR ORGANIZATION
 LEANING YOUR ORGANIZATION Dick Bayer, Interim Executive Director San Diego Community of Practice January 26, 2012 THREE OPPORTUNITIES OF LEAN Impeccable coordination Projects as production systems Collective
Engineers as Entrepreneurs (Class 11.1 April 2, 2013) CSE 3316 Professional Practices Spring 2013 Instructor Bill Carroll, Professor of CSE
 CSE 3316 Professional Practices Spring 2013 Instructor Bill Carroll, Professor of CSE") Engineers as Entrepreneurs (Class 11.1 April 2, 2013) CSE 3316 Professional Practices Spring 2013 Instructor Bill Carroll, Professor of CSE Where Are We? Contemporary issues (1/15 1/31) Professional ethics
Engineers as Entrepreneurs (Class 11.1 April 2, 2013) CSE 3316 Professional Practices Spring 2013 Instructor Bill Carroll, Professor of CSE Where Are We? Contemporary issues (1/15 1/31) Professional ethics
Collaborative Design and Scoping. CH2M s practice of Target Value Design
 Collaborative Design and Scoping CH2M s practice of Target Value Design Agenda Purpose of the Collaborative Design and Scoping Process How does the CDS relate to Target Value Delivery? CDS outcome: the
1. Discuss the rationale behind the implementation of a systematic performance appraisal system Age Discrimination in Employment Act - FAIRNESS
 Learning Objectives: 1. Discuss the rationale behind the implementation of a systematic performance appraisal system --Age Discrimination in Employment Act - FAIRNESS *This mostly deals with legal issues,
AN OVERVIEW OF DESIGN-BUILD. Presented by: David Umstot, PE, CEM Umstot Project and Facilities Solutions, LLC January 20, 2014
 AN OVERVIEW OF DESIGN-BUILD Presented by: David Umstot, PE, CEM Umstot Project and Facilities Solutions, LLC January 20, 2014 Design-Build Not a New Concept In California: Multiple statutes govern design-build
Using a collaboration platform to manage inspections on an IPD project.
 Using a collaboration platform to manage inspections on an IPD project. Stéphane Denerolle, Fieldwire James Pease, Sutter Health Thursday, October 19 th 2017 CAPTURE AND LEVERAGE THE LEAN ADVANTAGE About
ACHIEVING SUPPLY CHAIN EFFICIENCIES THROUGH USE OF AN ELECTRONIC TRADING EXCHANGE FOR HEALTHCARE
 ACHIEVING SUPPLY CHAIN EFFICIENCIES THROUGH USE OF AN ELECTRONIC TRADING EXCHANGE FOR HEALTHCARE Supply chain optimization can contribute to both better quality of care and lower healthcare costs. Supply
Information Technology Project Management, Eighth Edition. Note: See the text itself for full citations.
 Management, Eighth Edition Note: See the text itself for full citations. } Understand the importance of good project scope management } Describe the process of planning scope management } Discuss methods
LEGAL ISSUES WITH INTEGRATED PROJECT DELIVERY UNC Charlotte ERIK M. ROSENWOOD HAMILTON STEPHENS STEELE & MARTIN, PLLC
 LEGAL ISSUES WITH INTEGRATED PROJECT DELIVERY UNC Charlotte - 2013 ERIK M. ROSENWOOD HAMILTON STEPHENS STEELE & MARTIN, PLLC ERIK ROSENWOOD PARTNER HAMILTON, STEPHENS, STEELE & MARTIN 704.227.1078 EROSENWOOD@LAWHSSM.COM
ADVERTISEMENT FOR QUALIFICATION AND PROPOSALS OF DESIGN/ASSIST TRADE PARTNER
 ADVERTISEMENT FOR QUALIFICATION AND PROPOSALS OF DESIGN/ASSIST TRADE PARTNER PROJECT NOTICE Skanska USA Inc. hereinafter called SKANSKA, intends to award a design-assist subcontract to a Framing & Drywall
Quadrant I. Module 25: Balanced Scorecard
 Quadrant I Module 25: Balanced Scorecard 1. Learning Outcomes 2. Introduction 3. Balanced Scorecard Framework 4. Balanced Scorecard 5. Organisational Effectiveness 6. Balanced Scorecard & Organisational