March to Wisbech Rail Study Capital Cost of Re-opening the Line Cambridgeshire County Council. 4 April 2014
|
|
|
- Brent Bradford
- 6 years ago
- Views:
Transcription

1 Cambridgeshire County Council 4 April 2014
2 Notice This document and its contents have been prepared and are intended solely for Cambridgeshire County Council s information and use in relation to the March to Wisbech line. Atkins Ltd assumes no responsibility to any other party in respect of or arising out of or in connection with this document and/or its contents. This document has 70 pages including the cover. Document history Job number: Document ref: Revision Purpose description Originated Checked Reviewed Authorised Date Rev 1.0 Client Draft SG / KT JML 31/01/14 Rev 2.0 Final for Issue SG DB ACB ACB 13/02/14 Rev 3.0 Final Updated SG JML JML SG 10/02/14 Rev 4.0 Revised Economics SA MA JML JML 25/03/14 Rev 4.1 Rev 4.2 Initial Comments Addressed P3 Comments Addressed SA MA JML JML 26/03/14 SA NP JML JML 31/03/14 Rev 4.3 Exec Summary Updated SA SL JML JML 03/04/14 Rev 4.4 Final Issue SA NP JML JML 04/04/14 Client signoff Client Cambridgeshire County Council Project March to Wisbech Rail Study Document title Draft Report Job no Copy no. Document reference
3 Table of contents Chapter Pages 1. Introduction Study Purpose 5 Background 5 Previous Study 6 This Capital Cost Study 6 Core Assumptions 6 Report Structure 7 2. Site Visit 8 Introduction 8 Infrastructure Overview 8 Operations Overview 9 3. Developing the Capital Cost 12 Introduction 12 Summary of cost estimates 12 Discussion 13 Risks Economic Appraisal 16 Rail Revenue and Operating Costs 18 Bus Abstraction 18 Marginal External Costs 19 Vehicle Operating Costs 21 Capital Costs 22 Benefit Cost Ratios Conclusion 25 Appendices 25 Appendix A. Cost Estimate Option A 26 Appendix B. Cost estimate Option B 31 Appendix C. Cost Estimate A47 Bridge 36 Appendix D. Economic Appraisal Tables 39 D.1. Scenario A1 40 D.2. Scenario A1 No Revenue Clawback 43 D.3. Scenario A2 46 D.4. Scenario A2 No Revenue Clawback 49 D.5. Scenario B1 52 D.6. Scenario B1 No Revenue Clawback 55 D.7. Scenario B2 58 D.8. Scenario B2 No Revenue Clawback 61 D.9. Scenario B3 64 D.10. Scenario B3 No Revenue Clawback 67
4 Executive Summary The stage 2 assessment of the March-Wisbech Rail Study has considered the capital costs of reopening the rail line and outline user benefits, building on the rail fare revenue and operating cost assumptions and approach adopted in stage 1. This stage of the study has examined the capital costs of providing station facilities and track upgrading suitable for safe and sustainable rail based passenger operation. The appraisal has considered the capital costs and benefits accruing over an assumed 60 year operation. Further options around the stage 1 core recommendation of heavy rail operation have been examined to include a road over bridge spanning the A47 to mitigate any traffic disruption associated with a level crossing on the A47. The viability of moving the northern terminus of the rail line to be south of the A47 has also been considered with a corresponding assessment of the patronage impacts. The capital cost including optimism bias of reinstatement of the line for passenger services, overhaul of the signalling and level crossings is estimated to be in the range of million depending on the station location and whether or not an over bridge for the A47 is included or not. These costs were calculated in line with a GRIP 1 cost estimate. The costs could be higher once ongoing maintenance is considered in the appraisal. This capital cost estimate of each option for reinstatement represents a mid-point estimate around a potential variance of ± 50%. This represents a degree of cost accuracy that is consistent with the rail industry s GRIP 1 level of scheme design and is also aligned with WebTAG 1. The uncertainty derives from a range of factors, including but not limited to, length of time the line has been out of use, level of scheme design, high number of signalised crossings along a relatively short length of track, requirement to meet current safety regulations, the need for more detailed site investigation, and key stakeholder liaison (e.g. Network Rail and Highways Agency). The overall BCR of the scheme is in the range 0.99 to 1.43 excluding revenue clawback and 0.99 to 1.98 including revenue clawback. In both cases, the scenario without the rail over-bridge allied to the centrally located station performed the strongest. It should be noted that the estimated line reopening costs are based on the assumption that the rail regulator would accept the numerous level crossings across the public highways can be re-commissioned. There is a risk that the current status of the rail line (which has not been checked with the Office of the Rail Regulator) may mean the previous status of the level crossings cannot be transferred and that road over bridges would need to be built. 1 WebTAG is the Department for Transport s guidance for the appraisal of transport schemes.

5 1. Introduction Study Purpose Background 1.1. The Wisbech to March Railway Line, known locally as the Bramley Line, was in operation for passenger services between 1847 and The line continued to be used for freight purposes until Figure 1 shows the alignment of the rail corridor in relation to the Peterborough Ely line. Figure 1. March to Wisbech Line 1.2. Wisbech East Station was lost to redevelopment following closure in 1968 and the station site is now occupied by a housing development dating from The track now ends at Weasenham Lane crossing following the tarmacing over of the rails from the level crossing in Beyond this point, the old Wisbech East Goods Yard (acquired by Nestle Purina from Railtrack in 1995) was last used in Three years after the last pet food train from Wisbech, the remaining three sidings were lifted. Most of the yard area now forms the factory and car park extension The remaining single track, owned by Network Rail, it is still connected to the National Rail network via Whitemoor Junction near March. It was officially closed to traffic by Network Rail in 2002 due to the poor state of the infrastructure. New signalling was installed at the junction during late 2007 for the benefit of outward bound engineering trains from the re-opened Whitemoor Yard, once the second biggest freight yard in Europe during World War II and now a stabling point for engineering trains.
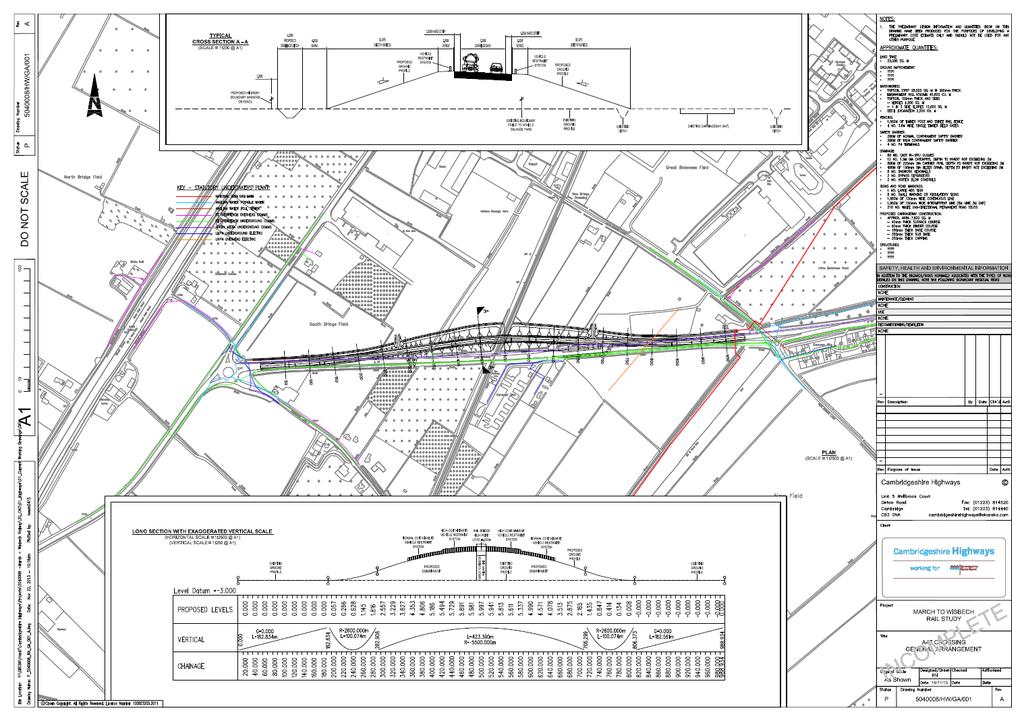
6 1.5. Current rail access from Wisbech is predominately via the X1 bus service between Great Yarmouth and Peterborough. This bus service is linked to the rail timetable and takes passengers from Wisbech direct to Peterborough railway station. There is a regular, half hourly, bus service seven days a week from early morning to the late evening. There is no direct bus service between Wisbech and Cambridge There is local political support to see the rail line reopened and a view that passenger services should be available direct from Wisbech. There is however a difference of opinion about what form the reopening of the line should take and what the new service should be. One view supports the need for a train company operated service as part of the national rail timetable. There is also a group known as The Bramley Line Group who are looking at the potential for this line to be a heritage railway. Previous Study 1.7. In 2012 Atkins assessed passenger demand for the line, should it be reinstated, and the potential for revenue generation. The study concluded that there may be a commercial case for reopening the March to Wisbech line to passenger traffic. The analysis did not take account of capital costs that would be required to reopen the line, but analysis undertaken by ATOC in 2009 indicated a capital investment of 12m would be required. The core test results from the Atkins assessment showed that the March to Wisbech rail service might be expected to generate an overall operating surplus up to 1.1m over a 13 year period between 2014 and The study recommended further work be undertaken to better understand the capital cost of reopening the line taking into account: Cost of any work required at March station to accommodate the extra services. Construction costs of the new station in Wisbech town centre. Provision of level crossings between Wisbech and March. If applicable, costs of the second station should Cambridgeshire County Council and Fenland District Council choose to proceed with this option, although this report has shown that a second station would not be commercially viable. Potential work required at the Whitemoor sidings junction to ensure there was no disruption to maintenance trains. Any other right of way costs, or upgrades to the line required. The cost of a bridge taking the A47 over the rail line as an alternative to a level crossing. This Capital Cost Study 1.9. This study was commissioned by Cambridgeshire County Council to provide: Base Case: an assessment of the GRIP1 capital costs involved in bringing the March to Wisbech line to a standard where a regular passenger service at a variable track speed of up to 60mph could be introduced. This would include, amongst other things, costs for work required at March Station, costs associated with level crossings on key roads and farm and local crossings, and links to Whitemoor Sidings. A47 crossing: an indicative cost for a bridge taking the A47 over the railway. Core Assumptions Two locations for Wisbech station were considered: Option A Wisbech station is located in the centre of the town and the line crosses the A47 using a level crossing or under a new bridge. Option B Wisbech station is located to the south of the A47 removing the need for an A47 bridge crossing and a level crossing.
7 1.11. For Option A the costs will include both the cost of a level crossing on the A47, and the cost of providing a new bridge for the A47 to cross the line. The costs for the bridge assume a two way single carriageway road, as currently exists for the A47 at this location The level of scheme development provides sufficient detail for a GRIP1 2 pre-feasibility level of appraisal only, and at this level of detail, the level of certainty regarding the quantum are not high and have a tolerance of ±50%. Report Structure The rest of this report is structured as follows: Chapter 2: details the findings of a site visit by a railway engineer and operations expert. Chapter 3: provides the capital cost estimates for two line options and discusses the issues which determine the robustness and accuracy of the cost estimates. Chapter 4: outlines the economic appraisal for the scheme and presents the calculated benefit : cost ratio. Appendices: provide the detail behind the capital cost estimates for the line as well as the detailed economic appraisal tables. 2 GRIP (Guide to Railway Investment Projects) describes how Network Rail manages and controls projects that enhance or renew the national rail network.
8 2. Site Visit Introduction 2.1. A day long site visit and survey was undertaken by a railway civil engineer and a railway operations and management specialist on 4 th October 2013 in advance of any costing exercise taking place. This section presents the findings of the visit, and the recommendations made to the quantity surveyor. Infrastructure Overview Introduction 2.2. The line from March to Wisbech is approximately 7½ miles (12km) in length. The track is currently single line although the formation originally provided double track. Evidence suggests the down line was lifted in the early 1970s. The route is virtually straight except at the March end where there is a relatively sharp (approximately 200m radius) 90-degree curve and a flatter reverse curve between this location and Elm Road level crossing The track is mostly in-situ but has been disused since 2000 when the freight service was discontinued, passenger services having ceased in The turnout to the branch from the Whitemoor Yard access line remains in-situ (presumably clipped and padlocked out of use). Existing Track Material 2.4. Track material is mostly jointed bullhead rail on softwood timber sleepers although there are some short sections of flat-bottom rail on either concrete or hardwood timber sleepers. The bullhead rail may be suitable for retention under light-axle vehicles at speeds up to 60mph, but the softwood sleepers must be considered life-expired Whilst replacement of these softwood sleepers with new or serviceable hardwood may be practicable, it is suggested that the preferred option, based on capital costs rather than whole life costing, could be for the line to be mostly re-laid using serviceable flat-bottom rail on serviceable concrete sleepers, allowing the use of continuously welded rail in order to minimise future maintenance requirements. Suitable materials may be readily available from Whitemoor depot at March. Existing Structures 2.6. There are three riveted metal bridges carrying the railway over watercourses, these being adjacent to the Chain Bridge level crossing (track on longitudinal timbers), south of Waldersea level crossing (ballasted), and adjacent to Redmoor level crossing (ballasted) The first has had the second track span removed but the other two remain as double-track structures There were gas main works in progress at the Chain bridge location at the time of the site visit, which could present a risk to line reinstatement / opening and would require further investigation Whilst from a superficial inspection, all three bridges appear in reasonable condition, it is suggested that, in conjunction with track renewal, it would be prudent to remove old ballast to allow inspection of the deck and renewal of waterproofing There are also a number of smaller culverts which will need to be examined. Level Crossings There are seven public-road level crossings, one over the A47 (Wisbech bypass), two over the B1101, and four over unclassified roads.
9 2.12. Elm Road and Chain Bridge level crossings over the B1101 are equipped with Automatic Half- Barriers (currently non-operational) and with rubber road surfaces The unclassified Coldham level crossing is equipped with train-crew operated gates and a timber road surface The unclassified Waldersea level crossing is equipped with train-crew operated gates and a tarmac road surface (with rails still in place) The unclassified Redmoor Drove level crossing is equipped as an AOCL (Automatic Opening Crossing, Locally Monitores) level crossing with flashing lights and is currently non-operational. The road surface is formed of Bomac concrete panels The A47 (By-Pass) level crossing is equipped as an AOCL (currently non-operational). The road surface is tarmac it appears that the rails have been removed The unclassified Weasenham Lane is equipped with train-crew operated gates. The road surface is tarmac the rails appear to have been removed There are some eighteen occupation / private crossings shown on the Network Rail plans / mapping, although some may be disused. These are mostly protected by user-worked gates and provided with timber crossing surfaces Engagement with Network Rail has confirmed that all public road level crossings will need to be equipped with automatic half-barriers in order to permit 60mph speeds on the railway line Requirements for any new safety arrangements at the Occupation Crossings will need to be assessed with a Risk Assessment. It is noted however that visibility is generally good. Possible Wisbech Station Site There is currently disused land alongside the Metal Box building to the north of Weasenham Lane which appears to be of sufficient size to accommodate a simple single-platform station Road vehicle access could be provided from Cromwell Road crossing over Oldfield Lane and land currently disused or in use for vehicle parking Additional pedestrian access routes could be provided to Railway Road (and hence towards the town centre) across the green space to the north of the Metal Box property, and alongside the railway to Weasenham Lane. Operations Overview Methodology The site visit included discussion with local Network Rail staff and inspection of the route from March Station to Wisbech including site inspections of several of the various level crossings on it. The Present Route A schematic of the present route is shown overleaf.
10 Figure 2. March to Wisbech line The March to Wisbech line runs from the points leading into Whitemoor Sidings at around 86m 16chs to its end at Wisbech at around 93m 20chs a distance of some 7.5 miles The line is single and has some 18 level crossings of various types / status on it these are marked on the sketch at their approximate mileage locations At the Wisbech end the former railway goods yard site has been converted to industrial units with securely locked gates placed across the line shortly after the points into the former Metal Box Siding The route at the March end is controlled and signalled from March East Junction signal box which includes the signals on and off the Wisbech single line and routes into Whitemoor Sidings and the east and west facing routes to the Ely / Peterborough main line The line was worked on the One Train Woking system of signalling, after passenger services ceased, meaning a rail movement had to enter the single at the March end, run to Wisbech and return and clear the single line at the March end before another rail movement could proceed towards Wisbech. Potential Issues with re-opening the Wisbech line for passenger trains A separate report is being submitted in respect of civil engineering issues so this section covers operations issues only The present route could run into platform two on the Up Main line at March Station, with trains terminating and then reversing to run back to Wisbech. However this is unlikely to be accepted by Network Rail as for the time the train was in the platform this would block the Main line for rail traffic from Peterborough to Ely and any movements in or out of the Whitemoor Sidings from or to the east This being so it is suggested a short stretch of new line, with associated new points and signalling, be constructed from the former Whitemoor Junction area into one or both former Joint Line platforms at March station which are still in situ This new infrastructure would require associated signalling with main aspect signals for passenger train working. The former One Train Working signalling controls could be installed at the Whitemoor Junction end of the single line unless it was an aspiration to have more than one
11 train on the Whitemoor to Wisbech section of the route in which case something more flexible would be required. This could be trainman operated electric token instruments at either end of the single line or axle counters at each end controlled from March East Junction signal box The concept of a separate route into March Station would ensure March to Wisbech passenger trains do not conflict with engineering train movements in and out of the Whitemoor Sidings complex and would provide the potential for direct running between the Wisbech line and either the Ely or Peterborough directions in the future The principal issue on the route is the operation and status of all the level crossings. Discussions over this issue with Network Rail are pending. However, much will depend on risk assessments which will need to be carried out for each and all the level crossings on the route. This in turn may be influenced by the frequency of passenger train services it is desired to operate, line speeds, sighting distance between train / level crossing etc. Some Accommodation / Occupation crossings might be able to be closed although this can be a lengthy process while others may have to be upgraded to a safer form of operation. The former train crew operated level crossings (wooden gates) will definitely have to be upgraded and it is not impossible the AHB and AOCL level crossings will also need to be replaced with an alternative method of operation Network Rail will need to seek guidance from the Office of Rail Regulation (ORR) who can be quite strict on what form of level crossing they deem as acceptable in respect with new or reinstated parts of the rail network. Possible Train Service Timings As stated previously, the March to Wisbech line is likely to be between 7 and 7½ miles long depending where the new station at Wisbech is sited and whether a new section of line is provided between Whitemoor and March station. This would make an hourly service each way using one DMU a practical option (e.g. journey time at an average speed start to stop at 45mph would be 10 minutes and at 40mph would be 11 minutes). This could leave margins for any freight running if the two trips each hour were timed close together with a short turnaround at one end and a longer turnaround at the other. Present Network Rail Anglia Timetable Rules of the Plan minimum turnaround for a DMU of up to four vehicles requires four minutes. A 45mph average speed service with five minute turnarounds could achieve a half hourly service each way but in timetabling terms this would be very tight with virtually no recovery allowance built in to cover any causes of late running and would occupy the line almost 100% of the time allowing no margin whatsoever for any freight traffic. Presumably, however, at this stage one round trip per hour would be quite adequate, but a full assessment of operations and timetabling would be needed to ensure full integration with calling patterns of main line services in March.
12 3. Developing the Capital Cost Introduction 3.1. A quantity surveyor has developed estimates for the capital cost of reinstating the March to Wisbech line for passenger services based upon the infrastructure assessment and the operations overview by rail industry specialists, The detailed cost estimates for Options A and B (see paragraph 1.10), and the A47 bridge option can be found in the appendices. Summary of cost estimates 3.3. Based on the high level assessment of the line from the site visit the following cost estimates have been calculated: Table 3-1 Summary of cost estimates (2014 prices, excluding Optimism Bias) Option Line Reinstatement Without A47 Bridge ( m) 3 Line Reinstatement With A47 Bridge ( m) 4 A47 Bridge ( m) Option A Option B Not applicable Not applicable 3.4. The cost for one Manually Controlled Level Crossing and associated rubber track protection has been removed from the cost estimate for the option where the A47 bridge is considered, since this level crossing would not be required if a bridge was constructed. This is reflected in the costs passed into the economic appraisal, as set out later in this report Notes 5 : The cost estimate includes a 15% contingency which the quantity surveyors regarded as being of an appropriate order for this scheme at the current level of design. A significant proportion of the cost arises from the level crossings and associated signalling. There is a large number of crossings on this short stretch of line for both Options A and B, and their cost, compared to the overall cost, is proportionately high. Most crossings are private rural crossings across unclassified roads, but there are also three crossings across major roads. Private rural crossings are of the lowest cost variety (i.e. stop line with red/green signal), but crossings across major roads need a full barrier with obstruction detection in order to meet current safety standards and they are relatively expensive. An allowance for preliminaries has been included. This would cover overhead costs, for example, insurance, contractor procurement and set-up etc. The capital cost assumes new items (e.g. sleepers and rail) rather than refurbished infrastructure. Refurbished items could be used, but their availability cannot be guaranteed. It is the opinion of the quantity surveyors that refurbished items would reduce the capital cost, but not by any significant percentage. A detailed assessment of the impact of using 3 These costs are subject to a variance of ±50% which is commensurate with the level of design detail at this stage of scheme development and is consistent with GRIP1 4 These costs are subject to a variance of ±50% which is commensurate with the level of design detail at this stage of scheme development and is consistent with GRIP1 5 Full notes and assumptions on which the cost estimates have been derived can be found in the appendices.
13 refurbished items could be undertaken as part of the next stage of the work in order to better understand their impact on the overall capital cost. Derivation of the capital cost is based on use of SPONS (Architects and Builders Price Book) and benchmarked using recent tendered prices for other rail projects. Additionally, the quantity surveyor performed a sense check based on cost per km; the high number of level crossings over a short stretch of line is the main contributor to the cost. In 2002 Atkins Rail estimated the cost of reopening the line at 9.25m. There are a number of factors which have led to the increase in cost between 2002 and 2014: o o o o In 2002 the line had only been out of use for two years and so would have only needed upgrade and repair work rather than full renewal to make it operational. Based on the site visit, the recommendation is that after 12 years of non-use and neglect, the infrastructure is in need of full renewal. It has been assumed that all level crossings will need full renewal because of the combined impact of deterioration in crossing infrastructure over time. Most importantly there is the requirement to meet current rail safety standards on level crossings. Earlier estimates allowed for locally controlled signalling, whereas this estimate uses the current rail industry safety standard of centrally controlled signalling, which will be more costly. The 2002 cost estimate was based on a 1995 study s figure ( 4.25m) inflated to 2002 without a formal assessment of infrastructure need. In 1995 a freight service was in operation, hence it is reasonable to assume that this cost figure was for reinstatement of passenger services on the freight line. The 2014 figures in this report are based on a high level assessment of the infrastructure needed to reopen the line. Discussion 3.6. In arriving at these cost estimates for the reinstatement of the line, a number of guidance documents were taken into consideration. These all informed the process by which the cost estimates were derived and the ±50% cost variance was confirmed as being justified. A summary of these is provided below: WebTAG is the Department for Transport s Transport Analysis Guidance which sets guidelines for the conduct of transport studies and also includes advice on the modelling and appraisal appropriate for major highway and public transport schemes, serving as a best practice guide. WebTAG itself is based on The Green Book, Appraisal and Evaluation in Central Government, used by all central departments and executive agencies. WebTAG Unit The Estimation and Treatment of Scheme Costs recommends that for rail schemes a 66% optimism bias should be applied at GRIP3 (pre-feasibility) note that this scheme is currently at GRIP1 2 and hence the optimism bias would be in excess of 66%. The latest GRIP guidance 6 from Network Rail shows that outline scheme design only takes place at GRIP4 and detailed design, which produces a complete, robust engineering design that underpins definitive cost / time / resource and risk estimates takes place at GRIP5. It is only at this level of design that cost certainty exceeds 90% Greater cost certainty for the reinstatement of services on the March Wisbech line can be achieved but only with a detailed scheme design and associated works (for example ground assessments, environmental and ecological assessments etc) having taken place. 6 GRIP Policy, NR_L1_INI_PM_GRIP100 (April 2012)
14 Risks 3.8. The following table presents a risk register for the reinstatement of the March Wisbech line which identifies the key risks that impact on the capital cost. Table 3-2 Risk Register No. Risk Potential Impact Potential Mitigation Probability 1 Ground conditions. Ground conditions along the line and potential A47 bridge site are unknown. Fen land conditions may require extra piling or support works which will increase the capital cost of the scheme. 2 Signalling Modern signalling requirements will need to be understood and met. It is one of the key risks. 3 Number and complexity of level crossings to meet current Network Rail safety standards 4 ORR acceptance of the number of level crossings on the line The high number of level crossings over a short distance adds a disproportionately high cost to the overall cost of the scheme. If the ORR required level crossings to be closed or be replaced by bridge access this will deliver safety benefits, but will increase the estimated capital cost significantly. Furthermore, Network Rail s level crossing policy 7 states provision of new level crossings would introduce additional risk and therefore would be permitted only in exceptional circumstances. Detailed ground investigative work to understand the ground conditions. Engagement with Network Rail to understand current practices and detailed survey and analysis to understand the cost impact of meeting modern standards in signalling hardware and software requirements. Network Rail supports closure of level crossings to improve safety. Engagement with Network Rail and local land owners could reduce the number of level crossings and hence the overall cost of the scheme. H H (H, M, L) Unknown at this stage Unknown H H Impact (H, M, L) H H H 7 Our Approach to Managing Level Crossing Safety. Network Rail
15 No. Risk Potential Impact Potential Mitigation Probability (H, M, L) 5 A47 level crossing Objections to a level crossing on the A47 may mean it is not deliverable. If Option A was the preferred option, then the capital cost of the scheme would require a bridge to carry the A47 across the reinstated line. 6 Structures. Bridges along the line may need significant upgrade or even replacement. 7 Utilities. The precise extent of utilities in the A47 is unknown. 8 Stakeholders Statutory Consultees. If the bridges have deteriorated significantly over time they will need either significant works or potentially replacement if the line is to be reinstated. This would impact on the scheme cost. Significant cost impact if utilities need to be relocated. Highways Agency, Network Rail, Natural England, and the Environment Agency would need to be consulted as all would have an interest in the scheme. Objections could cause delays and increase costs as a consequence of, for example, redesign. 9 Land owner objections. If the A47 was to have a new bridge it would require land acquisition for an off-line construction. Engagement with the Highways Agency to understand its position on options for the A47 should the March to Wisbech line be reinstated. Detailed bridge survey needed to understand current condition and, if necessary, to understand the extent of work needed to ensure the bridges, or their replacements can carry a rail service. Early engagement with utility providers to understand which utilities would be affected and whether there is scope of mitigation to reduce the cost of relocation Early engagement with stakeholders to understand their position and to arrive at a mutually agreeable solution. Early engagement with landowners with the intention that land is acquired through negotiation rather than compulsory purchase orders. H M M H M Impact (H, M, L) H H H H H 3.9. These costs have been converted into 2010 Market Prices for use with the following economic appraisal.
16 4. Economic Appraisal 4.1. In 2012, a study was undertaken by Atkins to investigate the potential demand and revenue that may arise from reintroduction of the passenger rail line between Wisbech and March. The appraisal period used was 2016 to Table 4-1 below sets out the input assumptions applied to the 2012 study that are responsible for the patronage forecasts. Item Table 4-1 Service Frequency Rail journey time Station Location Rail Fares Connectivity to Peterborough Ely services Input Assumptions to 2012 Patronage Forecasts Assumption Forecasts assume an hourly service frequency in each direction. Rail in-vehicle time assumed to be 12 minutes. Station assumed to be located in the original station location north of Weasenham Lane. The station-to-station fare matrix has been extended to include movements to/from Wisbech, where these values have been derived from MOIRA. Given that March to Wisbech will operate as a branch line, fares to/from Wisbech are modified from the corresponding fare to/from March. Trains to and from Wisbech are assumed to provide a shuttle service to dedicated platforms at March station Onward rail connections would require rail interchange. Since the scheduling and operation of Peterborough to Ely trains are not likely to be synchronised with the Wisbech to March trains and the relative timetabling of those services could change over the appraisal period considered, average connection times have been assumed for interconnecting services This chapter extends the appraisal period to 60 years in accordance with current guidance, from 2016 to 2075, and as well as rail demand, revenue and operating costs, the journey time saving benefits and bus operator revenue losses for the rail users that have switched mode from bus. The marginal external costs from highway de-congestion have also been assessed Table 4-2 below summarises the scenarios examined. Table 4-2 Description of Scenarios Scenario Location of Wisbech Rail Station A1 A2 Centre of Wisbech Centre of Wisbech A47 Crossing New A47 Bridge A47 Level Crossing Station Access Penalty Accessibility to the station would be convenient to the local users with no station access penalty applied. B1 South of A47 N/A The station access penalty for Wisbech rail station on the urban fringe has been assumed to be 20 minutes for all rail users regardless of access mode and purpose. Typically walk times are perceived as 1.5 times the equivalent in-vehicle times.
17 Scenario Location of Wisbech Rail Station A47 Crossing Station Access Penalty B2 South of A47 N/A The station access penalty has been calculated reflecting the respective available access mode, based on an access distance of 1.5 miles. The following bullets list the key assumptions: Those who access Wisbech rail station by car will have no additional access penalty. Walking speed is 3.5 miles per hour; and cycle speed is 10 miles per hour. The access penalties for buses and taxi are 75% of walk to reflect higher taxi fare that would be payable for the built up area of Wisbech to reach the revised station location. The access penalty weightings used for all non-work purposes are 2 for walk, cycle and buses whilst for taxi, the weighting is 3.5. This is consistent with the rail station access penalty weightings used for the 2012 study. B3 South of A47 N/A For scenario B3, the station access penalty has been calculated reflecting the respective available access mode, similar to scenario B2, but it was assumed that a free shuttle bus service will be provided from Wisbech town centre to the rail station, reducing the access penalties for those who would otherwise walk It should be noted the rail demand for 2029 and beyond has been capped at the 2029 level since this is the horizon of the passenger demand forecasts although the revenue accrued is appraised for the full 60 year period The station access penalties used are likely to be pessimistic as the area to the south of Wisbech develops in the future, the access penalties will reduce. The underlying local demand associated with development in south Wisbech may be of such as scale that the patronage level growth could be understated in this assessment For scenarios where the level crossing across the A47 will cause delay to the trunk road traffic, traffic queuing theory has been applied periods of barrier down times for existing and forecast traffic flow levels to estimate additional highway delay. It has been assumed that the delays due to the level crossing are confined to A47 traffic and that blocking back to adjacent junctions would not occur An estimation was made as to the level of decongestion benefit that this A47 level crossing delay would remove and this was factored in to the marginal external costs of the relevant scenarios An estimation has not been made as to the monetisation of any journey time changes that may be experienced by users who transfer from either highway or bus to rail. It is recognised the modelling approach is not underpinned by a fully specified area wide multi-modal demand model so aspects such as the access to rail station trips are not captured in any detail. A proportionate approach has therefore been adopted in line with other rail patronage assessments in line with the limited guidance in WebTAG (now WebTAG A5-3) All monetary values presented in this chapter are expressed in 2010 market prices (using the indirect tax correction factor of 19%) and have been discounted to 2010 values. The discount rates used are 3.5% for the first 30 appraisal years (i.e. up to 2045) and 3% for the remaining 30 appraisal years (i.e to 2075).
18 Rail Revenue and Operating Costs Table 4-3 shows the total rail revenue and operating costs from the 60 year appraisal. Table 4-3 Rail Revenue and Operating Costs Scenario Total Rail Passenger Boarding (m) 2010 market prices, discounted to 2010 values Revenue ( m) A A B B B Operating Costs ( m) It should be noted that the costs associated with the operation of the free shuttle bus have not been included within the operating costs used within the economic appraisal The data in Table 4-3 shows that the rail revenue is likely to be lower for a rail station located on the urban fringe, approximately 1.5 miles south of the Wisbech town centre, as might be expected due to the higher station access penalty It should be also noted that for scenario A1 and A2, the rail journey time between Wisbech and March was forecasted to be 12 minutes whilst for scenario B1, B2 and B3, the rail journey time was assumed to be 10 minutes. The train fuel costs have also been adjusted to reflect that for scenario B1, B2 and B3, the rail travel distance is 1.5 miles shorter than scenario A1 and A Two scenarios have been considered, both with and without a revenue clawback to local government. Such a clawback would mean that the difference between the revenue and operating cost over the appraisal period will be accrued back to government to offset against the cost of the scheme. Given that it is uncertain if this clawback would be available in this instance, both scenarios are reported Indirect Taxation loss would accrue in line with the increased rail fare revenue, since rail fares are tax exempt. This has been accounted for by application of the Average Indirect Taxation Factor of 19% to the total Rail Revenue. These values have been carried into the economic appraisal as positive costs to central government in the Public Accounts table. Table 4-4 highlights the Indirect Tax Revenue cost to government for each scenario over the 60 year appraisal. Table 4-4 Indirect Taxation Cost to Central Government from Rail Fares ( m) Scenario 2010 market prices, discounted to 2010 values Indirect Taxation Costs to Government From Rail Fares A A B B B Bus Abstraction There are regular services between March and Wisbech that currently run every 30 minutes, with a journey time of approximately 30 minutes between the centre of Wisbech and the centre of
19 March. A rail service that operates hourly with a journey time of 10 or 12 minutes is anticipated to abstract some of these journeys The abstraction from bus will have a negative impact to the revenue streams of the bus operators. This has been calculated by combining the level of abstracted trips with the assumed fare of 2 to determine the level of revenue loss accrued over the appraisal period. Table 4-5 Sum of the Bus Operator Revenue Change Scenario 2010 market prices, discounted to 2010 values Bus Operator Revenue Change ( m) A A B B B As with rail fares, bus fare changes will impact on the Indirect Taxation raised by central government. Table 4-6 highlights the changes as a result of the changes in bus operator revenue. Table 4-6 Indirect Taxation Cost to Central Government from Bus Fares ( m) Scenario 2010 market prices, discounted to 2010 values Bus Operator Revenue Change ( m) A A B B B Marginal External Costs As a proportion of highway trips switch mode to rail, the demand for the highway network reduces and there are de-congestion and other external benefits for the other highway network users and network operators. The Marginal External Cost methodology from WebTAG 2014 was used to estimate the scale of the benefits for each scenario The proportion of roads falling into different congestion bands was taken from WebTAG 2014 table A5.4.1 for the East Anglia region and was used to generate a cost in pence per kilometre for savings that can be attributed to a reduction in car kilometres due to a modal shift to rail. The table below presents the values used in this analysis. The congestion benefits also include an allowance for the vehicle operating cost savings for the users.
20 Table 4-7 Proportion of Total Traffic by Average Congestion Band and Road Type - East Anglia Region Year London Inner and Outer Conurbations Other Urban Rural Grand Total M-way A Rd Other M-way A Rd Other A Rd Other M-way A Rd Other % 0.0% 0.0% 0.0% 0.0% 0.0% 17.4% 16.3% 17.5% 28.1% 20.8% 100% % 0.0% 0.0% 0.0% 0.0% 0.0% 17.4% 16.2% 17.5% 28.1% 20.8% 100% % 0.0% 0.0% 0.0% 0.0% 0.0% 17.3% 16.1% 17.6% 28.2% 20.8% 100% % 0.0% 0.0% 0.0% 0.0% 0.0% 17.2% 16.0% 17.7% 28.3% 20.8% 100% % 0.0% 0.0% 0.0% 0.0% 0.0% 17.2% 16.0% 17.8% 28.3% 20.8% 100% % 0.0% 0.0% 0.0% 0.0% 0.0% 17.1% 16.0% 17.8% 28.3% 20.8% 100% Table 4-8 Marginal External Costs & Indirect Tax (pence per car km, 2010 Market Prices) Cost Congestion Infrastructure Accident Local Air Quality Noise Greenhouse Gases Indirect Taxation Note that the Indirect Taxation change from reduced vehicle kilometres is only applicable to nonbusiness trips. The Congestion values include an allowance for the vehicle operating cost savings that non-users would accrue due to reduced congestion enabling more efficient journeys to be completed. The reduced vehicle operating cost savings for users who switch from highway to rail needs to be accounted for separately An estimation of the car kilometre reductions for each scenario was made by analysis of the number of rail trips forecast minus those abstracted from bus. The remainder of the trips are assumed to be existing users abstracted from the highway network. By combining these trip numbers with WebTAG average car occupancy values and the assumed distances between origins and destinations from the mode choice model, the number of car kilometres removed can be estimated for each scenario, separately for Employers Business, Journey to Work and Other trip purposes. Table 4-9 Car Occupancy per Vehicle Kilometre Purpose Car Occupancy (person / vehicle) Work / Employers Business 1.20 Commuting 1.14 Leisure 1.85
21 Table 4-10 Annual Vehicle Kilometre Reductions (000's km) Scenario A A B B B The value for vehicle kilometre reductions for 2030 onwards remain at the 2029 level Table 4-11 below summarises the Marginal External Costs from each of the 5 different scenarios for the 60 year appraisal period. Table 4-11 Marginal External Cost Summary ( 000s, 2010 Market Prices, Discounted to 2010) Cost A1 A2 B1 B2 B3 Congestion 50,576 50,576 35,732 29,353 30,772 Infrastructure Accident 7,642 7,642 5,400 4,435 4,649 Local Air Quality Noise Greenhouse Gases 3,561 3,561 2,516 2,066 2,166 Indirect Taxation - 11,642-11,642-7,872-6,500-6, Decongestion benefits are reported as benefits to highway journey times, while Infrastructure benefits are reported as negative investment costs to local government. Indirect taxation changes are combined with the indirect taxation changes from the rail and bus revenue changes. All other elements are reported individually within the Analysis of Monetised Costs and Benefits table. Vehicle Operating Costs There will be a reduction in costs to users who switch from highway to rail, since there will be a removal of the vehicle operating costs for the highway trips that are no longer undertaken. Savings for fuel and non-fuel elements of the journeys have been accounted for, with an assumed network speed of 70 kph. Values for work and non-work trips are calculated separately using WebTAG default values Table 4-12 below reports the vehicle operating cost savings for each scenario. Table 4-12 Vehicle Operating Cost Savings ( 000s, 2010 Market Prices, Discounted to 2010) Journey Purpose A1 A2 B1 B2 B3 Work 2,453 2,453 2,067 1,659 1,738 Non-work 9,936 9,936 6,719 5,541 5, No other benefits have been included for users switching from highway to rail. While there is clear guidance as to the monetisation of benefits for travel time changes within a mode, and in the case of rail, access/egress and waiting time changes, there is less clear guidance for users who switch between modes. Proportionate appraisal techniques have therefore been applied to capture benefits that are largely rail derived.
22 Capital Costs The capital costs for rail line reinstatement and the A47 Bridge have been provided earlier in this report in Table 3-1. Table 4-13 overleaf shows the total capital costs with optimism bias and the assumed spend profile; and Table 4-14 shows the costs expressed in 2010 prices and values. Table 4-13 Capital Costs in Factor Prices Wisbech Town Centre Station Without A47 Bridge Wisbech Town Centre Station With A47 Bridge A47 Bridge South of A47 Station Cost ( m) Optimism Bias 66% 66% 32% 66% Total Cost ( m) Spend Profile ( m) 2015 (40%) (60%) For use within the economic appraisal, these costs have been converted to 2010 market prices and have been discounted back to The table below highlights the capital costs that have been used within the economic appraisal and BCR calculations. Table 4-14 Capital Costs (2010 market prices, discounted to 2010 values) Total Cost ( m) Wisbech Town Centre Station A47 Bridge South of A47 Station A A B B B Benefit Cost Ratios Table 4-15 below summarises the estimated benefits and costs (for 60 appraisal years) and the benefit cost ratios (BCR) for all scenarios utilising the Analysis of Monetised Costs and Benefits (AMCB) table The data shows that a town centre rail station for Wisbech will generally give a higher BCR than an out of centre station. This is due the less accessible out of town centre station attracting lower patronage and providing lower user benefits.
23 Table 4-15 Analysis of Monetised Costs and Benefits Table ( m, 2010 Market Prices, Discounted to 2010) Including Revenue Clawback to Local Government Scenario A1 A2 B1 B2 B3 Noise Local Air Quality Greenhouse Gases Journey Quality Physical Activity Accidents Economic Efficiency: All Users Economic Efficiency: Providers Wider Public Finances (Indirect Taxation Revenues) Present Value of Benefits 8 (PVB) Broad Transport Budget Present Value of Costs 9 (PVC) Net Present Value (NPV) Benefit to Cost Ratio (BCR) This table includes costs and benefits which are regularly or occasionally presented in monetised form in transport appraisals, together with some where monetisation is in prospect. There may also be other significant costs and benefits, some of which cannot be presented in monetised form. Where this is the case, the analysis presented above does NOT provide a good measure of value for money and should not be used as the sole basis for decisions. 9 This table includes costs and benefits which are regularly or occasionally presented in monetised form in transport appraisals, together with some where monetisation is in prospect. There may also be other significant costs and benefits, some of which cannot be presented in monetised form. Where this is the case, the analysis presented above does NOT provide a good measure of value for money and should not be used as the sole basis for decisions.
24 Table 4-16 Analysis of Monetised Costs and Benefits Table ( m, 2010 Market Prices, Discounted to 2010) Excluding Revenue Clawback to Local Government Scenario A1 A2 B1 B2 B3 Noise Local Air Quality Greenhouse Gases Journey Quality Physical Activity Accidents Economic Efficiency: All Users Economic Efficiency: Providers Wider Public Finances (Indirect Taxation Revenues) Present Value of Benefits 10 (PVB) Broad Transport Budget Present Value of Costs 11 (PVC) Net Present Value (NPV) Benefit to Cost Ratio (BCR) The Transport Economic Efficiency (TEE) and Public Accounts (PA) tables for each scenario are included alongside the full AMCB tables in Appendix D. 10 This table includes costs and benefits which are regularly or occasionally presented in monetised form in transport appraisals, together with some where monetisation is in prospect. There may also be other significant costs and benefits, some of which cannot be presented in monetised form. Where this is the case, the analysis presented above does NOT provide a good measure of value for money and should not be used as the sole basis for decisions. 11 This table includes costs and benefits which are regularly or occasionally presented in monetised form in transport appraisals, together with some where monetisation is in prospect. There may also be other significant costs and benefits, some of which cannot be presented in monetised form. Where this is the case, the analysis presented above does NOT provide a good measure of value for money and should not be used as the sole basis for decisions.
25 5. Conclusion 5.1. This stage 2 assessment has included a GRIP1 level cost assessment, which includes an appropriate level of risk within the cost estimates. These capital costs have been combined with a consideration of the rail line operating costs, which have been taken forward and are used within the economic analysis undertaken in this assessment This economic analysis was undertaken on largely rail focused benefits that are yielded by the scheme for five different options for combinations of station location and line construction options. Consideration was given to scenarios both with and without a revenue clawback being made available The economic analysis concluded that the BCR range for options with a revenue clawback available ranged between 0.99 and Without an option for a revenue clawback, this range moved to 0.99 to In both cases, the option for the centrally located rail station allied to the level crossing on the A47 performed the strongest All services within this stage 2 assessment are assumed to operate on a shuttle basis between March and Wisbech with no continuous service to or from other destinations. Further work to refine the inputs to the economic appraisal and to review the impact of the scheme on the wider rail network should be considered if continuous services to and from other stations beyond March are considered viable. Appendices
26 Appendix A. Cost Estimate Option A March to Wisbech COST ESTIMATE REPORT Project No : Project : March to Wisbech Estimate Revision: Revision 0 Estimate Stage : GRIP 1-2 Prepared By: D Joshi Reviewed By: C Rannert Approved By: A Rogers Date: 26 November 2013 Disclaimer This document and its contents have been prepared and are intended solely for the client's information and use in relation to the March to Wisbech Project. Faithful+Gould nor Atkins assumes any responsibility to any other party in respect of or arising out of or in connection with this document and/or its contents. Copyright The copyright of this document is vested in Faithful+Gould. This document may not be reproduced in whole or in part without their express written permission.
27 Assumptions and Exclusions Cost Estimate at 4Q2013 The following assumptions and exclusions have been made in the compilation of the Order of Magnitude cost estimate: General For the estimate, we used the most suitable units for the information available. The rates were arrived by using the rates from internal cost data and pricing books. The rates were adjusted for inflation and location. The estimate has a cost certainty of +- 50%. Whilst the cost certainty for P-way is higher, it is lower fort the signalling costs. The estimate is based on current prices 4 th Quarter 2013 with no allowance for inflation. There is no allowance for planning, development or legal fees. No allowance for Operating disruption and compensation costs Only a high level design proposals have been prepared, therefore the scope of works might change. No allowance for land purchasing costs No allowance for VAT No allowance has been made for operation or maintenance costs. No allowance was made for Capital Allowance costs, finance charges etc. We have allowed for 15% contingence. This needs to be reassessed when more information is available. Track works 1 The trains from March to Wisbech will run on an independent line, separate from the depot sidings. 2 We did not allow for any crossover between the March to Wisbech line and the depot line. 3 2Nr of the farming crossing will be closed. 4 Crossing and signalling based on information from Atkins 5 Plain line track concrete sleepers considered to be of welded joint. 6 Site clearance is considered for the length of the track, assuming width as 10m 7 Disposal of excavated material assumed as non-contaminated 8 5m width assumed for preparation of surface for new tack 9 Extra allowance for re-signalling included within level crossing cost 10 For waterproof paint we have allowed 20m2/Ton of paint for steel bridges. 11 Assuming track bed is in a good condition and no work to formation is required 12 We allowed for 4 Nr of possessions for the slewing work of the track work in the depot area and for signalling work. All other work was assumed to be done away from the running line and therefore outside of possessions. Civil Works 1 New station at Wisbech is considered as single block paved platform, with a width of 3.5m 2 Cost of refurbishment of March platform includes finishes, services and superstructure. 3 Approach road considered as single carriageway with approx 3.7m wide 4 Walking road to village is considered as normal Bitumen Macadam Road 5 We have considered 20m2 space per car with tarmac surfaced, marked out with thermoplastic road paint 6 Post wire fencing is considered for both sides of the track, 1.5m height 7 Existing bridges are adequate to support new track work. No strengthening required.
28 March - Wisbech - P Way Description Quantity Unit Rate Cost Remarks PERMANENT WAY WORK SITE CLEARANCE Clear trees, bushes and vegetation 119,654 m ,270 Considering 10m of width Extra over for heavy clearance around new Wisbech station 2,000 m ,000 For approach and villege road 4,000 m ,000 Take up and clear away Remove plane line 11,965 m ,196,541 Removal of bridge track 27 m ,050 considered 1m extra at each side Take out existing turnout at Whitemoor Junction 1 Nr 10, ,000 Excavation Generally in track ballast 20,341 m ,976 Disposal of excavated material to on site stockpiles 20,341 m ,094 (assume non-contaminated) (assume non-contaminated) TRACK FOUNDATIONS (Plain line only - Turnouts include exc. and ballast) Ballast Bottom m Top 7,778 m ,189 Blankets Sand 100mm thick 49,058 m ,766 Geotextile membrane Terram 4000 or similar 49,058 m ,175 Materials supply New RT60/113A flat bottom rail 1,436 t ,292,264 Twist rails no 7, G44 concrete sleepers (incl fittings) 16,752 no ,507,641 Hardwood sleepers (incl baseplates/fittings) 0 no 0 Prefabricated IBJ no 3, A - RT60 transition panel 9.14 m long 0 no 8, Buffer stop (including installation) 2 no 15, ,000 PLAIN LINE Lay only Track ; Flat bottom rail on conc.sleeper CWR 11,965 m ,509 Welds (To new rails) 1,308 no ,001 S&C Supply and Lay Cv 13 Turnouts 1 no 150, ,000 Cv 9.25 Crossover 0 no 284, Adjustment switches 0 no 16, Destressing/restressing of P.Way Allowance only - dependant on number of separate operations SIGNALLING Protection Signal (Single post incl head) 2 No 5, ,000 Train Protection & Warning System (TPWS) 4 No 42, ,980 2 per signal Automatic Warning System (AWS) 2 No 16, ,330 Cables and Cable routes 12 km 35, ,789 Signalling Power Supply Principal Supply Point 2 Nos 400, ,000 Functional Supply Point 2 Nos 25, ,000 Axle counter 2 Nos 69, ,833 Allow for cost of working in possessions 1 item 250, ,000 LEVEL CROSSING Automatic half barrier (AHB) 4 Nos 750, ,000,000 Extra allowance for re-signalling included within Manual controlled barrier with obstruction detection (CCTV barr 3 Nos 1,250, ,750,000 cost Minister stop line 9 Nos 300, ,700,000 LEVEL CROSSING PROTECTION Public road - Rubber track protection 3 no 50, ,000 Private Road - Wood track protection 4 no 25, ,000 Anticross passing - Wooden 32 no 25, ,000 Farmer Crossing 9 no 20, ,000 BRIDGE WORK PROTECTION Waterproof Paint to the steel bridge 1,386 m ,300 3 Ton/m span of bridge, 20m2/Ton of bridge TAMPING S&C tamper 1 shift 5, ,852 Plain line tamper 14 shift 5, ,076 Ballast Regulator 12 shift 3, ,382 Labour hr COSS hr Road Rail Machine nr 2, Possessions for depot line slewing 4 nr 15, ,000 Engineering Train nr 14, Total for siding 21,266,019
29 March - Wisbech Description Quantity Unit Rate Cost Remarks Construct new platform 50 m 3, ,000 single block paved platform Assumed width 3.5m Ticket Machine 2,500 Waiting Shelter at platform 1 Nr 50, ,000 Refurbishment of March platform 70 m 1, ,000 Includes finishes, services, superstructure etc Bus shelter 1 No 25, ,000 Bus stop and turn around area 150 m ,000 Approach Road 200 m ,000 Single carriageway (approx 3.7m) road Walking road to village 200 m ,000 Bitumen macadam road Car Park 400 m ,000 Tarmacadam surfaced, marked out with thermoplastic road paint (20 car park spaces), An allownace of 20m2/car made Supply and fix concrete post wire fencing 1.5m high Utilities - allowance for enhancing/alteration and protection of existing public services 22,531 m ,616 Considered both sides of the track 1 item 500, ,000 1,548,116
30 March - Wisbech Cost Estimate Cost Estimate at 4Q /11/2013 Description Cost Remarks Permanent Way 21,266,019 Civil Works 1,548,116 Base Construction Work SUB - TOTAL 22,814,136 Preliminaries allowance 15.0% 3,422,120 Testing commissioning 2.5% 570,353 Training 1.0% 228,141 Spares 1.0% 228,141 Project Sub- Total 27,262,892 Project Management 8.0% 2,181,031 Design 8.0% 2,181,031 Possession Management item 100,000 Project Sub- Total rounded 31,725,000 Contingency 15% 4,758,800 PROJECT Total 36,483,800
31 Appendix B. Cost estimate Option B March to Wisbech COST ESTIMATE REPORT Project No : Project : March to Wisbech - A47 Station option Estimate Revision: Revision 0 Estimate Stage : GRIP 1-2 Prepared By: D Joshi - Ammended by C Rannert Reviewed By: C Webster Approved By: A Rogers Date: 07 January 2014 Disclaimer This document and its contents have been prepared and are intended solely for the client's information and use in relation to the March to Wisbech Project. Faithful+Gould nor Atkins assumes any responsibility to any other party in respect of or arising out of or in connection with this document and/or its contents. Copyright The copyright of this document is vested in Faithful+Gould. This document may not be reproduced in whole or in part without their express written permission.
32 Assumptions and Exclusions Cost Estimate at 4Q2013 The following assumptions and exclusions have been made in the compilation of the Order of Magnitude cost estimate: General For the estimate, we used the most suitable units for the information available. The rates were arrived by using the rates from internal cost data and pricing books. The rates were adjusted for inflation and location. The estimate has a cost certainty of +- 50%. Whilst the cost certainty for P-way is higher, it is lower for the signalling costs. The estimate is based on current prices 4 th Quarter 2013 with no allowance for inflation. There is no allowance for planning, development or legal fees. No allowance for Operating disruption and compensation costs Only a high level design proposals have been prepared, therefore the scope of works might change. No allowance for land purchasing costs No allowance for VAT No allowance has been made for operation or maintenance costs. No allowance was made for Capital Allowance costs, finance charges etc. We have allowed for 15% contingence. This needs to be reassessed when more information is available. Track works 1 It is assumed the track is shorter by 900m at this option. 2 No crossing for A47 required. This will reduce the level crossings in total by 3 Nr from 16 Nr to 13 Nr. 3 The trains from March to Wisbech will run on an independent line, separate from the depot sidings. 4 We did not allow for any crossover between the March to Wisbech line and the depot line. 5 2Nr of the farming crossing will be closed. 6 Crossing and signalling based on information from Atkins 7 Plain line track concrete sleepers considered to be of welded joint. 8 Site clearance is considered for the length of the track, assuming width as 10m 9 Disposal of excavated material assumed as non-contaminated 10 5m width assumed for preparation of surface for new track 11 Extra allowance for re-signalling included within level crossing cost 12 For waterproof paint we have allowed 20m2/Ton of paint for steel bridges. 13 Assuming track bed is in a good condition and no work to formation is required 14 We allowed for 4 Nr of possessions for the slewing work of the track work in the depot area and for signalling work. All other work was assumed to be done away from the running line and therefore outside of possessions. Civil Works 1 We have allowed for 50 instead of 20 car parking spaces as advised for this option. 2 We have assumed the ground condition in the proposed station area are suitable and we have not allowed for any ground improvement or pile foundations or similar 3 We have assumed that a 50m footpath and a 50m access road are sufficient for this option. 4 New station at Wisbech is considered as single block paved platform, with a width of 3.5m 5 Cost of refurbishment of March platform includes finishes, services and superstructure. 6 Approach road considered as single carriageway with approx 3.7m wide which we reduced to 50m for this option 7 Walking road to village is considered as normal Bitumen Macadam Road 8 We have considered 20m2 space per car with tarmac surfaced, marked out with thermoplastic road paint 9 Post wire fencing is considered for both sides of the track, 1.5m height 10 Existing bridges are adequate to support new track work. No strengthening required.
33 March - Wisbech - P Way Description Quantity Unit Rate Cost Remarks PERMANENT WAY WORK SITE CLEARANCE Clear trees, bushes and vegetation 105,170 m ,850 Considering 10m of width Extra over for heavy clearance around new Wisbech station 1,200 m ,000 For approach and village road 1,000 m ,000 Take up and clear away Remove plane line 10,517 m ,051,700 Removal of bridge track 27 m ,050 considered 1m extra at each side Take out existing turnout at Whitemoor Junction 1 Nr 10, ,000 Excavation Generally in track ballast 17,879 m ,549 Disposal of excavated material to on site stockpiles 17,879 m ,547 (assume non-contaminated) (assume non-contaminated) TRACK FOUNDATIONS (Plain line only - Turnouts include exc. and ballast) Ballast Bottom m Top 6,836 m ,594 Blankets Sand 100mm thick 43,120 m ,437 Geotextile membrane Terram 4000 or similar 43,120 m ,359 Materials supply New RT60/113A flat bottom rail 1,262 t ,135,836 Twist rails no 7, G44 concrete sleepers (incl fittings) 14,724 no ,325,142 Hardwood sleepers (incl baseplates/fittings) 0 no 0 Prefabricated IBJ no 3, A - RT60 transition panel 9.14 m long 0 no 8, Buffer stop (including installation) 2 no 15, ,000 Carried forward 5,943,064 PLAIN LINE Lay only Carried forward 5,943,064 Track ; Flat bottom rail on conc.sleeper CWR 10,517 m ,224 Welds (To new rails) 1,149 no ,687 S&C Supply and Lay Cv 13 Turnouts 1 no 150, ,000 Cv 9.25 Crossover 0 no 284, Adjustment switches 0 no 16, Destressing/restressing of P.Way Allowance only - dependant on number of separate operations SIGNALLING Protection Signal (Single post incl head) 2 No 5, ,000 Train Protection & Warning System (TPWS) 4 No 42, ,980 2 per signal Automatic Warning System (AWS) 2 No 16, ,330 Cables and Cable routes 11 km 35, ,095 Signalling Power Supply Principal Supply Point 2 Nos 400, ,000 Functional Supply Point 2 Nos 25, ,000 Axle counter 2 Nos 69, ,833 Allow for cost of working in possessions 1 item 250, ,000 LEVEL CROSSING Automatic half barrier (AHB) 3 Nos 750, ,250,000 Extra allowance for re-signalling included within Manual controlled barrier with obstruction detection (CCTV barr 2 Nos 1,250, ,500,000 cost Minister stop line 8 Nos 300, ,400,000 LEVEL CROSSING PROTECTION Public road - Rubber track protection 2 no 50, ,000 Private Road - Wood track protection 3 no 25, ,000 Anticross passing - Wooden 22 no 25, ,000 Farmer Crossing 8 no 20, ,000 BRIDGE WORK PROTECTION Waterproof Paint to the steel bridge 1,386 m ,300 3 Ton/m span of bridge, 20m2/Ton of bridge TAMPING S&C tamper 1 shift 5, ,852 Plain line tamper 13 shift 5, ,642 Ballast Regulator 11 shift 3, ,934 Labour hr COSS hr Road Rail Machine nr 2, Possessions for depot line slewing 4 nr 15, ,000 Engineering Train nr 14, Total for siding - carried to Summary 17,544,941
34 March - Wisbech - Civil Engineering Works Description Quantity Unit Rate Cost Remarks Construct new platform 50 m 3, ,000 single block paved platform Assumed width 3.5m Ticket Machine 2,500 Waiting Shelter at platform 1 Nr 50, ,000 Refurbishment of March platform 70 m 1, ,000 Includes finishes, services, superstructure etc Bus shelter 1 No 25, ,000 Bus stop and turn around area 150 m ,000 Approach Road 50 m ,500 Single carriageway (approx 3.7m) road Footpath to A47 50 m ,000 Bitumen macadam road Car Park 1,000 m ,000 Tarmacadam surfaced, marked out with thermoplastic road paint (20 car park spaces), An allownace of 20m2/car made Supply and fix concrete post wire fencing 1.5m high Utilities - allowance for new utility supplies to station and protection of existing public services 19,634 m ,680 Considered both sides of the track 1 item 750, ,000 Total for Civil Engineering Works - carried to Summary 1,672,680
35 March - Wisbech Summary Cost Estimate at 4Q /01/2014 Description Cost Remarks Permanent Way 17,544,941 Civil Works 1,672,680 Base Construction Work SUB - TOTAL 19,217,621 Preliminaries allowance 15.0% 2,882,643 Testing commissioning 2.5% 480,441 Training 1.0% 192,176 Spares 1.0% 192,176 Project Sub- Total 22,965,057 Project Management 8.0% 1,837,205 Design 8.0% 1,837,205 Possession Management item 100,000 Project Sub- Total rounded 26,739,500 Contingency 15% 4,010,900 PROJECT Total 30,750,400
36 Appendix C. Cost Estimate A47 Bridge Summary of Estimate for March to Wisbech Highways & Structure 100 Preliminaries 1,525, Site Clearance 45, Fencing 30, Road Restraint Systems (Vehicle and Pedestrian) 70, Road Restraint Systems (Vehicle and Pedestrian) Bridge Prarapets Only 90, Drainage and Service Ducts 170, Earthworks 1,450, Earthworks - Foundations to Structures Only 80, Road Pavements - General 710, Kerbs, Footways and Paved Areas 205, Traffic Signs 15, Piling and Embedded Retaining Walls 560, Stone Vibro columns for Fill 2,135, Structural Concrete 2,115, Waterproofing for Concrete Structures 40, Miscellaneous 105, Landscape (allowance made) 50, Ecology (allowance made) 25,000 Total Construction cost 9,420,000 Risks (see sheet two) 725,000 Design fee (10% of construction cost) 945,000 Public Enquiry - no allowance made 0 Archaeology (allowance made) 50,000 Geotechnical Investigation (allowance made) 100,000 Pt 1 claims (allowance made) 25,000 Legal/ CCC costs (allowance made) 10,000 Stats Diversions (allowance made) 100,000 Land (assumed to all be agricultural, 25,000/ha) 65,000 3rd party costs - EA, IDB (allowance made) 5,000 Landscape maintenance (allowance made for 5 yrs) 20,000 NR possessions (no allowance made as NR involved) 0 Supervision fee (3.5% of construction cost) 330,000 Total 11,795,000 Optimism 32% 3,775,000 Grand Total 15,570,000
37 Risk Register Inflation Risk 245,000 4% included for one year inflation Structures Risk Highways risks Risk register output 380,000 5% risk included, NR possession risk included in the Structural estimate Stats risks 100,000 Lumpsum as risk, also there is protection slab constrution included in the Road works. Large quantities of stats diversions have not been allowed for but careful design could mitigate any high risk/cost items. Total cost of risks 725,000
38
39 Appendix D. Economic Appraisal Tables
40 D.1. Table D-1 Scenario A1 Transport Economy and Efficiency Table Transport Economic Efficiency (TEE) Table Users ALL MODES ROAD Bus & Coach RAIL Other User benefits TOTAL Private Cars and LGVs Passengers Passengers Travel time Vehicle operating costs User charges During Construction & Maintenance NET CONSUMER BENEFITS (1) Rail Breakdow n Private sector provider impacts Bus Rail NR TOC Revenue Operating costs Investment costs Grant/subsidy Revenue Claw back Subtotal (3) Other business impacts Developer contributions (4) NET BUSINESS IMPACT (5) = (2) + (3) + (4) TOTAL Present Value of Transport Economic Efficiency Benefits (6) = (1) + (5) Notes: Benefits appear as positive numbers, w hile costs appear as negative numbers. All entries are discounted present values, in 2010 prices and values.
41 Table D-2 Public Accounts Table Public Accounts (PA) Table ALL MODES ROAD BUS and COACH RAIL OTHER Local Government Funding TOTAL INFRASTRUCTURE Revenue Operating Costs Investment Costs Developer and Other Contributions Grant/Subsidy Payments NET IMPACT (7) Central Government Funding: Transport Revenue Operating costs Investment Costs Developer and Other Contributions Grant/Subsidy Payments NET IMPACT (8) Central Government Funding: Non-Transport Indirect Tax Revenues (9) TOTALS Broad Transport Budget (10) = (7) + (8) Wider Public Finances (11) = (9) Notes: Costs appear as positive numbers, w hile revenues and Developer and Other Contributions' appear as negative numbers. All entries are discounted present values in 2010 prices and values.
42 Table D-3 Analysis of Monetised Costs and Benefits Table Analysis of Monetised Costs and Benefits Noise 0.52 (12) Local Air Quality 0.01 (13) Greenhouse Gases 3.56 (14) Journey Quality (15) Physical Activity (16) Accidents 7.64 (17) Economic Efficiency: All Users (1) Economic Efficiency: Providers (5) Wider Public Finances (Indirect Taxation Revenues) (11) - sign changed from PA table, as PA table represents costs, not benefits Present Value of Benefits (see notes) (PVB) (PVB) = (12) + (13) + (14) + (15) + (16) + (17) + (1) + (5) - (11) Broad Transport Budget (10) Present Value of Costs (see notes) (PVC) (PVC) = (10) OVERALL IMPACTS Net Present Value (NPV) NPV=PVB-PVC Benefit to Cost Ratio (BCR) 1.35 BCR=PVB/PVC Note : This table includes costs and benefits w hich are regularly or occasionally presented in monetised form in transport appraisals, together w ith some w here monetisation is in prospect. There may also be other significant costs and benefits, some of w hich cannot be presented in monetised form. Where this is the case, the analysis presented above does NOT provide a good measure of value for money and should not be used as the sole basis for decisions.
43 D.2. Table D-4 Scenario A1 No Revenue Clawback Transport Economy and Efficiency Table Transport Economic Efficiency (TEE) Table Users ALL MODES ROAD Bus & Coach RAIL Other User benefits TOTAL Private Cars and LGVs Passengers Passengers Travel time Vehicle operating costs User charges During Construction & Maintenance NET CONSUMER BENEFITS (1) Rail Breakdow n Private sector provider impacts Bus Rail NR TOC Revenue Operating costs Investment costs Grant/subsidy Revenue Claw back Subtotal (3) Other business impacts Developer contributions (4) NET BUSINESS IMPACT (5) = (2) + (3) + (4) TOTAL Present Value of Transport Economic Efficiency Benefits (6) = (1) + (5) Notes: Benefits appear as positive numbers, w hile costs appear as negative numbers. All entries are discounted present values, in 2010 prices and values.
44 Table D-5 Public Accounts Table Public Accounts (PA) Table ALL MODES ROAD BUS and COACH RAIL OTHER Local Government Funding TOTAL INFRASTRUCTURE Revenue Operating Costs Investment Costs Developer and Other Contributions Grant/Subsidy Payments NET IMPACT (7) Central Government Funding: Transport Revenue Operating costs Investment Costs Developer and Other Contributions Grant/Subsidy Payments NET IMPACT (8) Central Government Funding: Non-Transport Indirect Tax Revenues (9) TOTALS Broad Transport Budget (10) = (7) + (8) Wider Public Finances (11) = (9) Notes: Costs appear as positive numbers, w hile revenues and Developer and Other Contributions' appear as negative numbers. All entries are discounted present values in 2010 prices and values.
45 Table D-6 Analysis of Monetised Costs and Benefits Table Analysis of Monetised Costs and Benefits Noise 0.52 (12) Local Air Quality 0.01 (13) Greenhouse Gases 3.56 (14) Journey Quality (15) Physical Activity (16) Accidents 7.64 (17) Economic Efficiency: All Users (1) Economic Efficiency: Providers (5) Wider Public Finances (Indirect Taxation Revenues) (11) - sign changed from PA table, as PA table represents costs, not benefits Present Value of Benefits (see notes) (PVB) (PVB) = (12) + (13) + (14) + (15) + (16) + (17) + (1) + (5) - (11) Broad Transport Budget (10) Present Value of Costs (see notes) (PVC) (PVC) = (10) OVERALL IMPACTS Net Present Value (NPV) NPV=PVB-PVC Benefit to Cost Ratio (BCR) 1.19 BCR=PVB/PVC Note : This table includes costs and benefits w hich are regularly or occasionally presented in monetised form in transport appraisals, together w ith some w here monetisation is in prospect. There may also be other significant costs and benefits, some of w hich cannot be presented in monetised form. Where this is the case, the analysis presented above does NOT provide a good measure of value for money and should not be used as the sole basis for decisions.
46 D.3. Table D-7 Scenario A2 Transport Economy and Efficiency Table Transport Economic Efficiency (TEE) Table Users ALL MODES ROAD Bus & Coach RAIL Other User benefits TOTAL Private Cars and LGVs Passengers Passengers Travel time Vehicle operating costs User charges During Construction & Maintenance NET CONSUMER BENEFITS (1) Rail Breakdow n Private sector provider impacts Bus Rail NR TOC Revenue Operating costs Investment costs Grant/subsidy Revenue Claw back Subtotal (3) Other business impacts Developer contributions (4) NET BUSINESS IMPACT (5) = (2) + (3) + (4) TOTAL Present Value of Transport Economic Efficiency Benefits (6) = (1) + (5) Notes: Benefits appear as positive numbers, w hile costs appear as negative numbers. All entries are discounted present values, in 2010 prices and values.
47 Table D-8 Public Accounts Table Public Accounts (PA) Table ALL MODES ROAD BUS and COACH RAIL OTHER Local Government Funding TOTAL INFRASTRUCTURE Revenue Operating Costs Investment Costs Developer and Other Contributions Grant/Subsidy Payments NET IMPACT (7) Central Government Funding: Transport Revenue Operating costs Investment Costs Developer and Other Contributions Grant/Subsidy Payments NET IMPACT (8) Central Government Funding: Non-Transport Indirect Tax Revenues (9) TOTALS Broad Transport Budget (10) = (7) + (8) Wider Public Finances (11) = (9) Notes: Costs appear as positive numbers, w hile revenues and Developer and Other Contributions' appear as negative numbers. All entries are discounted present values in 2010 prices and values.
48 Table D-9 Analysis of Monetised Costs and Benefits Table Analysis of Monetised Costs and Benefits Noise 0.52 (12) Local Air Quality 0.01 (13) Greenhouse Gases 3.56 (14) Journey Quality (15) Physical Activity (16) Accidents 7.64 (17) Economic Efficiency: All Users (1) Economic Efficiency: Providers (5) Wider Public Finances (Indirect Taxation Revenues) (11) - sign changed from PA table, as PA table represents costs, not benefits Present Value of Benefits (see notes) (PVB) (PVB) = (12) + (13) + (14) + (15) + (16) + (17) + (1) + (5) - (11) Broad Transport Budget (10) Present Value of Costs (see notes) (PVC) (PVC) = (10) OVERALL IMPACTS Net Present Value (NPV) NPV=PVB-PVC Benefit to Cost Ratio (BCR) 1.98 BCR=PVB/PVC Note : This table includes costs and benefits w hich are regularly or occasionally presented in monetised form in transport appraisals, together w ith some w here monetisation is in prospect. There may also be other significant costs and benefits, some of w hich cannot be presented in monetised form. Where this is the case, the analysis presented above does NOT provide a good measure of value for money and should not be used as the sole basis for decisions.
49 D.4. Table D-10 Scenario A2 No Revenue Clawback Transport Economy and Efficiency Table Transport Economic Efficiency (TEE) Table Users ALL MODES ROAD Bus & Coach RAIL Other User benefits TOTAL Private Cars and LGVs Passengers Travel time Vehicle operating costs User charges During Construction & Maintenance NET CONSUMER BENEFITS (1) Private sector provider impacts Bus Rail NR TOC Revenue Operating costs Investment costs Grant/subsidy Revenue Claw back Subtotal (3) Other business impacts Developer contributions (4) NET BUSINESS IMPACT (5) = (2) + (3) + (4) Passengers Rail Breakdow n TOTAL Present Value of Transport Economic Efficiency Benefits (6) = (1) + (5) Notes: Benefits appear as positive numbers, w hile costs appear as negative numbers. All entries are discounted present values, in 2010 prices and values.
50 Table D-11 Public Accounts Table Public Accounts (PA) Table ALL MODES ROAD BUS and COACH RAIL OTHER Local Government Funding TOTAL INFRASTRUCTURE Revenue Operating Costs Investment Costs Developer and Other Contributions Grant/Subsidy Payments NET IMPACT (7) Central Government Funding: Transport Revenue Operating costs Investment Costs Developer and Other Contributions Grant/Subsidy Payments NET IMPACT (8) Central Government Funding: Non-Transport Indirect Tax Revenues (9) TOTALS Broad Transport Budget (10) = (7) + (8) Wider Public Finances (11) = (9) Notes: Costs appear as positive numbers, w hile revenues and Developer and Other Contributions' appear as negative numbers. All entries are discounted present values in 2010 prices and values.
51 Table D-12 Analysis of Monetised Costs and Benefits Table Analysis of Monetised Costs and Benefits Noise 0.52 (12) Local Air Quality 0.01 (13) Greenhouse Gases 3.56 (14) Journey Quality (15) Physical Activity (16) Accidents 7.64 (17) Economic Efficiency: All Users (1) Economic Efficiency: Providers (5) Wider Public Finances (Indirect Taxation Revenues) (11) - sign changed from PA table, as PA table represents costs, not benefits Present Value of Benefits (see notes) (PVB) (PVB) = (12) + (13) + (14) + (15) + (16) + (17) + (1) + (5) - (11) Broad Transport Budget (10) Present Value of Costs (see notes) (PVC) (PVC) = (10) OVERALL IMPACTS Net Present Value (NPV) NPV=PVB-PVC Benefit to Cost Ratio (BCR) 1.43 BCR=PVB/PVC Note : This table includes costs and benefits w hich are regularly or occasionally presented in monetised form in transport appraisals, together w ith some w here monetisation is in prospect. There may also be other significant costs and benefits, some of w hich cannot be presented in monetised form. Where this is the case, the analysis presented above does NOT provide a good measure of value for money and should not be used as the sole basis for decisions.
52 D.5. Table D-13 Scenario B1 Transport Economy and Efficiency Table Transport Economic Efficiency (TEE) Table Users ALL MODES ROAD Bus & Coach RAIL Other User benefits TOTAL Private Cars and LGVs Passengers Travel time Vehicle operating costs 8.79 User charges During Construction & Maintenance NET CONSUMER BENEFITS (1) Private sector provider impacts Bus Rail NR TOC Revenue Operating costs Investment costs Grant/subsidy Revenue Claw back Subtotal (3) Other business impacts Developer contributions (4) NET BUSINESS IMPACT (5) = (2) + (3) + (4) 8.79 Passengers Rail Breakdow n TOTAL Present Value of Transport Economic Efficiency Benefits (6) = (1) + (5) Notes: Benefits appear as positive numbers, w hile costs appear as negative numbers. All entries are discounted present values, in 2010 prices and values.
53 Table D-14 Public Accounts Table Public Accounts (PA) Table ALL MODES ROAD BUS and COACH RAIL OTHER Local Government Funding TOTAL INFRASTRUCTURE Revenue Operating Costs Investment Costs Developer and Other Contributions Grant/Subsidy Payments NET IMPACT (7) Central Government Funding: Transport Revenue Operating costs Investment Costs Developer and Other Contributions Grant/Subsidy Payments NET IMPACT (8) Central Government Funding: Non-Transport Indirect Tax Revenues (9) TOTALS Broad Transport Budget (10) = (7) + (8) Wider Public Finances (11) = (9) Notes: Costs appear as positive numbers, w hile revenues and Developer and Other Contributions' appear as negative numbers. All entries are discounted present values in 2010 prices and values.
54 Table D-15 Analysis of Monetised Costs and Benefits Table Analysis of Monetised Costs and Benefits Noise 0.36 (12) Local Air Quality 0.01 (13) Greenhouse Gases 2.52 (14) Journey Quality (15) Physical Activity (16) Accidents 5.40 (17) Economic Efficiency: All Users (1) Economic Efficiency: Providers (5) Wider Public Finances (Indirect Taxation Revenues) (11) - sign changed from PA table, as PA table represents costs, not benefits Present Value of Benefits (see notes) (PVB) (PVB) = (12) + (13) + (14) + (15) + (16) + (17) + (1) + (5) - (11) Broad Transport Budget (10) Present Value of Costs (see notes) (PVC) (PVC) = (10) OVERALL IMPACTS Net Present Value (NPV) NPV=PVB-PVC Benefit to Cost Ratio (BCR) 0.99 BCR=PVB/PVC Note : This table includes costs and benefits w hich are regularly or occasionally presented in monetised form in transport appraisals, together w ith some w here monetisation is in prospect. There may also be other significant costs and benefits, some of w hich cannot be presented in monetised form. Where this is the case, the analysis presented above does NOT provide a good measure of value for money and should not be used as the sole basis for decisions.
55 D.6. Table D-16 Scenario B1 No Revenue Clawback Transport Economy and Efficiency Table Transport Economic Efficiency (TEE) Table Users ALL MODES ROAD Bus & Coach RAIL Other User benefits TOTAL Private Cars and LGVs Passengers Travel time Vehicle operating costs 8.79 User charges During Construction & Maintenance NET CONSUMER BENEFITS (1) Private sector provider impacts Bus Rail NR TOC Revenue Operating costs Investment costs Grant/subsidy Revenue Claw back Subtotal 6.89 (3) Other business impacts Developer contributions (4) NET BUSINESS IMPACT 6.89 (5) = (2) + (3) + (4) 8.79 Passengers Rail Breakdow n TOTAL Present Value of Transport Economic Efficiency Benefits (6) = (1) + (5) Notes: Benefits appear as positive numbers, w hile costs appear as negative numbers. All entries are discounted present values, in 2010 prices and values.
56 Table D-17 Public Accounts Table Public Accounts (PA) Table ALL MODES ROAD BUS and COACH RAIL OTHER Local Government Funding TOTAL INFRASTRUCTURE Revenue Operating Costs Investment Costs Developer and Other Contributions Grant/Subsidy Payments NET IMPACT (7) Central Government Funding: Transport Revenue Operating costs Investment Costs Developer and Other Contributions Grant/Subsidy Payments NET IMPACT (8) Central Government Funding: Non-Transport Indirect Tax Revenues (9) TOTALS Broad Transport Budget (10) = (7) + (8) Wider Public Finances (11) = (9) Notes: Costs appear as positive numbers, w hile revenues and Developer and Other Contributions' appear as negative numbers. All entries are discounted present values in 2010 prices and values.
57 Table D-18 Analysis of Monetised Costs and Benefits Table Analysis of Monetised Costs and Benefits Noise 0.36 (12) Local Air Quality 0.01 (13) Greenhouse Gases 2.52 (14) Journey Quality (15) Physical Activity (16) Accidents 5.40 (17) Economic Efficiency: All Users (1) Economic Efficiency: Providers 6.89 (5) Wider Public Finances (Indirect Taxation Revenues) (11) - sign changed from PA table, as PA table represents costs, not benefits Present Value of Benefits (see notes) (PVB) (PVB) = (12) + (13) + (14) + (15) + (16) + (17) + (1) + (5) - (11) Broad Transport Budget (10) Present Value of Costs (see notes) (PVC) (PVC) = (10) OVERALL IMPACTS Net Present Value (NPV) NPV=PVB-PVC Benefit to Cost Ratio (BCR) 0.99 BCR=PVB/PVC Note : This table includes costs and benefits w hich are regularly or occasionally presented in monetised form in transport appraisals, together w ith some w here monetisation is in prospect. There may also be other significant costs and benefits, some of w hich cannot be presented in monetised form. Where this is the case, the analysis presented above does NOT provide a good measure of value for money and should not be used as the sole basis for decisions.
58 D.7. Table D-19 Scenario B2 Transport Economy and Efficiency Table Transport Economic Efficiency (TEE) Table Users ALL MODES ROAD Bus & Coach RAIL Other User benefits TOTAL Private Cars and LGVs Passengers Travel time Vehicle operating costs 7.20 User charges During Construction & Maintenance NET CONSUMER BENEFITS (1) Private sector provider impacts Bus Rail NR TOC Revenue Operating costs Investment costs Grant/subsidy Revenue Claw back Subtotal (3) Other business impacts Developer contributions (4) NET BUSINESS IMPACT (5) = (2) + (3) + (4) 7.20 Passengers Rail Breakdow n TOTAL Present Value of Transport Economic Efficiency Benefits (6) = (1) + (5) Notes: Benefits appear as positive numbers, w hile costs appear as negative numbers. All entries are discounted present values, in 2010 prices and values.
59 Table D-20 Public Accounts Table Public Accounts (PA) Table ALL MODES ROAD BUS and COACH RAIL OTHER Local Government Funding TOTAL INFRASTRUCTURE Revenue Operating Costs Investment Costs Developer and Other Contributions Grant/Subsidy Payments NET IMPACT (7) Central Government Funding: Transport Revenue Operating costs Investment Costs Developer and Other Contributions Grant/Subsidy Payments NET IMPACT (8) Central Government Funding: Non-Transport Indirect Tax Revenues (9) TOTALS Broad Transport Budget (10) = (7) + (8) Wider Public Finances (11) = (9) Notes: Costs appear as positive numbers, w hile revenues and Developer and Other Contributions' appear as negative numbers. All entries are discounted present values in 2010 prices and values.
60 Table D-21 Analysis of Monetised Costs and Benefits Table Analysis of Monetised Costs and Benefits Noise 0.30 (12) Local Air Quality 0.01 (13) Greenhouse Gases 2.07 (14) Journey Quality (15) Physical Activity (16) Accidents 4.43 (17) Economic Efficiency: All Users (1) Economic Efficiency: Providers (5) Wider Public Finances (Indirect Taxation Revenues) (11) - sign changed from PA table, as PA table represents costs, not benefits Present Value of Benefits (see notes) (PVB) (PVB) = (12) + (13) + (14) + (15) + (16) + (17) + (1) + (5) - (11) Broad Transport Budget (10) Present Value of Costs (see notes) (PVC) (PVC) = (10) OVERALL IMPACTS Net Present Value (NPV) 0.76 NPV=PVB-PVC Benefit to Cost Ratio (BCR) 1.03 BCR=PVB/PVC Note : This table includes costs and benefits w hich are regularly or occasionally presented in monetised form in transport appraisals, together w ith some w here monetisation is in prospect. There may also be other significant costs and benefits, some of w hich cannot be presented in monetised form. Where this is the case, the analysis presented above does NOT provide a good measure of value for money and should not be used as the sole basis for decisions.
61 D.8. Table D-22 Scenario B2 No Revenue Clawback Transport Economy and Efficiency Table Transport Economic Efficiency (TEE) Table Users ALL MODES ROAD Bus & Coach RAIL Other User benefits TOTAL Private Cars and LGVs Passengers Travel time Vehicle operating costs 7.20 User charges During Construction & Maintenance NET CONSUMER BENEFITS (1) Private sector provider impacts Bus Rail NR TOC Revenue Operating costs Investment costs Grant/subsidy Revenue Claw back Subtotal (3) Other business impacts Developer contributions (4) NET BUSINESS IMPACT (5) = (2) + (3) + (4) 7.20 Passengers Rail Breakdow n TOTAL Present Value of Transport Economic Efficiency Benefits (6) = (1) + (5) Notes: Benefits appear as positive numbers, w hile costs appear as negative numbers. All entries are discounted present values, in 2010 prices and values.
62 Table D-23 Public Accounts Table Public Accounts (PA) Table ALL MODES ROAD BUS and COACH RAIL OTHER Local Government Funding TOTAL INFRASTRUCTURE Revenue Operating Costs Investment Costs Developer and Other Contributions Grant/Subsidy Payments NET IMPACT (7) Central Government Funding: Transport Revenue Operating costs Investment Costs Developer and Other Contributions Grant/Subsidy Payments NET IMPACT (8) Central Government Funding: Non-Transport Indirect Tax Revenues (9) TOTALS Broad Transport Budget (10) = (7) + (8) Wider Public Finances (11) = (9) Notes: Costs appear as positive numbers, w hile revenues and Developer and Other Contributions' appear as negative numbers. All entries are discounted present values in 2010 prices and values.
63 Table D-24 Analysis of Monetised Costs and Benefits Table Analysis of Monetised Costs and Benefits Noise 0.30 (12) Local Air Quality 0.01 (13) Greenhouse Gases 2.07 (14) Journey Quality (15) Physical Activity (16) Accidents 4.43 (17) Economic Efficiency: All Users (1) Economic Efficiency: Providers (5) Wider Public Finances (Indirect Taxation Revenues) (11) - sign changed from PA table, as PA table represents costs, not benefits Present Value of Benefits (see notes) (PVB) (PVB) = (12) + (13) + (14) + (15) + (16) + (17) + (1) + (5) - (11) Broad Transport Budget (10) Present Value of Costs (see notes) (PVC) (PVC) = (10) OVERALL IMPACTS Net Present Value (NPV) 0.76 NPV=PVB-PVC Benefit to Cost Ratio (BCR) 1.02 BCR=PVB/PVC Note : This table includes costs and benefits w hich are regularly or occasionally presented in monetised form in transport appraisals, together w ith some w here monetisation is in prospect. There may also be other significant costs and benefits, some of w hich cannot be presented in monetised form. Where this is the case, the analysis presented above does NOT provide a good measure of value for money and should not be used as the sole basis for decisions.
64 D.9. Table D-25 Scenario B3 Transport Economy and Efficiency Table Transport Economic Efficiency (TEE) Table Users ALL MODES ROAD Bus & Coach RAIL Other User benefits TOTAL Private Cars and LGVs Passengers Travel time Vehicle operating costs 7.55 User charges During Construction & Maintenance NET CONSUMER BENEFITS (1) Private sector provider impacts Bus Rail NR TOC Revenue Operating costs Investment costs Grant/subsidy Revenue Claw back Subtotal (3) Other business impacts Developer contributions (4) NET BUSINESS IMPACT (5) = (2) + (3) + (4) 7.55 Passengers Rail Breakdow n TOTAL Present Value of Transport Economic Efficiency Benefits (6) = (1) + (5) Notes: Benefits appear as positive numbers, w hile costs appear as negative numbers. All entries are discounted present values, in 2010 prices and values.
65 Table D-26 Public Accounts Table Public Accounts (PA) Table ALL MODES ROAD BUS and COACH RAIL OTHER Local Government Funding TOTAL INFRASTRUCTURE Revenue Operating Costs Investment Costs Developer and Other Contributions Grant/Subsidy Payments NET IMPACT (7) Central Government Funding: Transport Revenue Operating costs Investment Costs Developer and Other Contributions Grant/Subsidy Payments NET IMPACT (8) Central Government Funding: Non-Transport Indirect Tax Revenues (9) TOTALS Broad Transport Budget (10) = (7) + (8) Wider Public Finances (11) = (9) Notes: Costs appear as positive numbers, w hile revenues and Developer and Other Contributions' appear as negative numbers. All entries are discounted present values in 2010 prices and values.
66 Table D-27 Analysis of Monetised Costs and Benefits Table Analysis of Monetised Costs and Benefits Noise 0.31 (12) Local Air Quality 0.01 (13) Greenhouse Gases 2.17 (14) Journey Quality (15) Physical Activity (16) Accidents 4.65 (17) Economic Efficiency: All Users (1) Economic Efficiency: Providers (5) Wider Public Finances (Indirect Taxation Revenues) (11) - sign changed from PA table, as PA table represents costs, not benefits Present Value of Benefits (see notes) (PVB) (PVB) = (12) + (13) + (14) + (15) + (16) + (17) + (1) + (5) - (11) Broad Transport Budget (10) Present Value of Costs (see notes) (PVC) (PVC) = (10) OVERALL IMPACTS Net Present Value (NPV) 4.40 NPV=PVB-PVC Benefit to Cost Ratio (BCR) 1.21 BCR=PVB/PVC Note : This table includes costs and benefits w hich are regularly or occasionally presented in monetised form in transport appraisals, together w ith some w here monetisation is in prospect. There may also be other significant costs and benefits, some of w hich cannot be presented in monetised form. Where this is the case, the analysis presented above does NOT provide a good measure of value for money and should not be used as the sole basis for decisions.
67 D.10. Scenario B3 No Revenue Clawback Table D-28 Transport Economy and Efficiency Table Transport Economic Efficiency (TEE) Table Users ALL MODES ROAD Bus & Coach RAIL Other User benefits TOTAL Private Cars and LGVs Passengers Travel time Vehicle operating costs 7.55 User charges During Construction & Maintenance NET CONSUMER BENEFITS (1) Private sector provider impacts Bus Rail NR TOC Revenue Operating costs Investment costs Grant/subsidy Revenue Claw back Subtotal (3) Other business impacts Developer contributions (4) NET BUSINESS IMPACT (5) = (2) + (3) + (4) 7.55 Passengers Rail Breakdow n TOTAL Present Value of Transport Economic Efficiency Benefits (6) = (1) + (5) Notes: Benefits appear as positive numbers, w hile costs appear as negative numbers. All entries are discounted present values, in 2010 prices and values.
68 Table D-29 Public Accounts Table Public Accounts (PA) Table ALL MODES ROAD BUS and COACH RAIL OTHER Local Government Funding TOTAL INFRASTRUCTURE Revenue Operating Costs Investment Costs Developer and Other Contributions Grant/Subsidy Payments NET IMPACT (7) Central Government Funding: Transport Revenue Operating costs Investment Costs Developer and Other Contributions Grant/Subsidy Payments NET IMPACT (8) Central Government Funding: Non-Transport Indirect Tax Revenues (9) TOTALS Broad Transport Budget (10) = (7) + (8) Wider Public Finances (11) = (9) Notes: Costs appear as positive numbers, w hile revenues and Developer and Other Contributions' appear as negative numbers. All entries are discounted present values in 2010 prices and values.
69 Table D-30 Analysis of Monetised Costs and Benefits Table Analysis of Monetised Costs and Benefits Noise 0.31 (12) Local Air Quality 0.01 (13) Greenhouse Gases 2.17 (14) Journey Quality (15) Physical Activity (16) Accidents 4.65 (17) Economic Efficiency: All Users (1) Economic Efficiency: Providers (5) Wider Public Finances (Indirect Taxation Revenues) (11) - sign changed from PA table, as PA table represents costs, not benefits Present Value of Benefits (see notes) (PVB) (PVB) = (12) + (13) + (14) + (15) + (16) + (17) + (1) + (5) - (11) Broad Transport Budget (10) Present Value of Costs (see notes) (PVC) (PVC) = (10) OVERALL IMPACTS Net Present Value (NPV) 4.40 NPV=PVB-PVC Benefit to Cost Ratio (BCR) 1.10 BCR=PVB/PVC Note : This table includes costs and benefits w hich are regularly or occasionally presented in monetised form in transport appraisals, together w ith some w here monetisation is in prospect. There may also be other significant costs and benefits, some of w hich cannot be presented in monetised form. Where this is the case, the analysis presented above does NOT provide a good measure of value for money and should not be used as the sole basis for decisions.

70 Sunil Gogna Atkins 5 Wellbrook Court Girton Road Cambridge CB3 0NA sunil.gogna@atkinsglobal.com Atkins Ltd except where stated otherwise. The Atkins logo, Carbon Critical Design and the strapline Plan Design Enable are trademarks of Atkins Ltd.
Cambourne to Cambridge Better Bus Journeys: Strategic Outline Business Case Economic Case City Deal Partners. 28 September 2016
 Cambourne to Cambridge Better Bus Journeys: Strategic Outline Business Case City Deal Partners 28 September 2016 Notice This document and its contents have been prepared and are intended solely for the
UK Road Pricing Feasibility Study: Modelling the Impacts Elizabeth Cox 1 UK
 Abstract UK Road Pricing Feasibility Study: Modelling the Impacts Elizabeth Cox 1 UK In July 2003, the UK government set up a comprehensive study to examine how a new system of charging for road use could
GO RAIL NIAGARA SERVICE EXTENSION
 Business Case: Finch Avenue West Rapid Transit GO RAIL NIAGARA SERVICE EXTENSION INITIAL BUSINESS CASE Date: November, 2014 NOVEMBER 2015 Page 1 TABLE OF CONTENTS 1.0 Executive Summary...p.5 2.0 Introduction....p.6
Report to: Greater Cambridge Partnership Joint Assembly 18 January 2018
 Report to: Greater Cambridge Partnership Joint Assembly 18 January 2018 Lead officer: Chris Tunstall Greater Cambridge Partnership Recommendations from the Ely to Cambridge A10 Transport Study and proposed
SOUTH CAMBRIDGESHIRE DISTRICT COUNCIL. Joint Planning Directors / Principal Planning Manager, South Cambridgeshire District Council
 SOUTH CAMBRIDGESHIRE DISTRICT COUNCIL REPORT TO: Cambridge City Fringes Joint Committee 28 September 2009 AUTHOR/S: Joint Planning Directors / Principal Planning Manager, South Cambridgeshire District
THE QUADRO 2017 MANUAL PART 1 ECONOMIC CONCEPTS IN QUADRO. Contents. Chapter. 1. The QUADRO Method. 2. Defining the Options for Appraisal
 THE QUADRO 2017 MANUAL PART 1 ECONOMIC CONCEPTS IN QUADRO Contents Chapter 1. The QUADRO Method 2. Defining the Options for Appraisal 3. Discounting, the Price Basis and Treatment of Taxation 4. Single
Local Transport Plan. Implementation Plan ( )
") Local Transport Plan Implementation Plan (2011-2015) www.cheshireeast.gov.uk/travel Contents 1 Introduction 2 Initiatives to Ensure a Sustainable Future 3 Initiatives to Create Conditions for Business
Local Transport Plan Implementation Plan (2011-2015) www.cheshireeast.gov.uk/travel Contents 1 Introduction 2 Initiatives to Ensure a Sustainable Future 3 Initiatives to Create Conditions for Business
Passenger service for the Dudding Hill line: brief for feasibility study
 Appendix 1: Specification for a Study Passenger service for the Dudding Hill line: brief for feasibility study Introduction The West London Alliance is currently investigating ways of accommodating the
campaigning by the Railway Development Society Limited
 campaigning by the Railway Development Society Limited Department for Transport A14 Challenge Team Roads Policy Great Minster House, 33 Horseferry Road, London SW1P 4DR Please Reply to: 24 Bure Close St.
2004 FEASIBILITY STUDY UPDATE
 Austin-San Antonio Intermunicipal Commuter Rail District 2004 FEASIBILITY STUDY UPDATE December 2004 EXECUTIVE SUMMARY INTRODUCTION Almost 3 million people in Central Texas, living and working between
IPSWICH NORTHERN ROUTES STUDY. Stage 1 Progress
 IPSWICH NORTHERN ROUTES STUDY Stage 1 Progress 17 th January 2017 STUDY CONTEXT 2 The study is being funded in partnership with the Suffolk district and borough councils. Work forms part of the Suffolk
Park and Ride Action Plan Summary. A Catalyst for Change The Regional Transport Strategy for the west of Scotland
 Park and Ride Action Plan Summary A Catalyst for Change The Regional Transport Strategy for the west of Scotland 2007-2021 Strathclyde Partnership for Transport Contents Purpose...2 Issues, Constraints
Greater Cambridge City Deal Executive Board. A428/A1303 Better Bus Journeys Scheme Public Consultation Outcomes and Next Steps
 Report To: Greater Cambridge City Deal Executive Board 3 rd March 2016 Lead Officer: Graham Hughes, Executive Director of Economy, Transport and Environment, Cambridgeshire County Council A428/A1303 Better
Executive Summary. Introduction
 Executive Summary 01 Introduction The City of Southampton lies at the western end of the South Hampshire sub-region. The wider urban South Hampshire area, consisting of Southampton, Eastleigh, Fareham,
The Network Rail Hope Valley Capacity Scheme Frequently Asked Questions February 2015
 The Network Rail Hope Valley Capacity Scheme Frequently Asked Questions February 2015 1. The Plans 1.1 What are you doing and why? Demand for rail travel between Sheffield and Manchester is increasing,
Project Appraisal Using PRISM Simon Hubbard 28 th September 2004
 Project Appraisal Using PRISM Simon Hubbard 28 th September 2004 Introduction : Overview of Presentation - Option Appraisal Policy Context - Potential PRISM Applications - Use of the Model / Scale of the
Cambourne to Cambridge Better Bus Journeys Scheme: Strategic Outline Business Case Delivery Case City Deal Partnership.
 Cambourne to Cambridge Better Bus Journeys Scheme: Strategic Outline Business Case City Deal Partnership 21 September 2016 Notice This document and its contents have been prepared and are intended solely
Chapter 4. Recommendations
 Chapter 4 Recommendations Project Rating Methodology 1.0 Introduction This chapter outlines the prioritization of potential investments that were identified during this MIS process. During this study there
Long-term Plan Transport Proposal. 29 October 2014
 Long-term Plan Transport Proposal 29 October 2014 2 Table of Contents Introduction... 4 The Two Networks... 5 What will it cost?... 12 What are the benefits?... 15 Meeting the government s transport objectives...
9. Asset Management. 9. Asset Management. 9.2 Asset Management and the Shared Priorities. 9.1 Introduction. Headline Targets
 Headline Targets BVPI 223 - Principal Road Condition. BVPI 224a - Non-Principal Classified Road Condition. BVPI 224b - Unclassified Road Condition. BVPI 187 - Footway Condition. How we will tackle Asset
Please complete this checklist by referencing locations where the relevant material can be found in the OBC document
 Large Local Major Schemes: Bid for construction funding Part Two: Checklist Please complete this checklist by referencing locations where the relevant material can be found in the OBC document Strategic
THE COUNTY OF HEREFORDSHIRE DISTRICT COUNCIL HIGHWAYS ACT 1980 ACQUISITION OF LAND ACT 1981 THE HIGHWAYS (INQUIRIES PROCEDURE) RULES 1994
 RULES 1994") THE COUNTY OF HEREFORDSHIRE DISTRICT COUNCIL HIGHWAYS ACT 1980 ACQUISITION OF LAND ACT 1981 THE HIGHWAYS (INQUIRIES PROCEDURE) RULES 1994 THE COUNTY OF HEREFORDSHIRE DISTRICT COUNCIL (SOUTH WYE TRANSPORT
THE COUNTY OF HEREFORDSHIRE DISTRICT COUNCIL HIGHWAYS ACT 1980 ACQUISITION OF LAND ACT 1981 THE HIGHWAYS (INQUIRIES PROCEDURE) RULES 1994 THE COUNTY OF HEREFORDSHIRE DISTRICT COUNCIL (SOUTH WYE TRANSPORT
Document Control and Version Information
 Soham Station Capacity Assessment Registered in England No. 09638982 Document Control and Version Information Project Title Author Soham Station Ed Jeffery Version number 1.0 Status Final Date 1 st July
A Better Connected South Hampshire
 A Better Connected South Hampshire DfT Local Sustainable Transport Fund Bid December 2011 Executive Summary Executive Summary Transport for South Hampshire (TfSH) is delighted to submit a business case
150Intr Transport and Strategic Regeneration Welsh Assembly Government New M4 Project Magor to Castleton WelTAG Appraisal Report Stage 1 DRAFT 3 WORKI
 150Intr Transport and Strategic Regeneration Welsh Assembly Government WelTAG Appraisal Report Stage 1 DRAFT 3 WORKING DOCUMENT 1 Transport and Strategic Regeneration Welsh Assembly Government WelTAG Appraisal
Local Plans CSRM Cambridge and South Cambridgeshire Local Plans Transport Report
 Cambridge and South Cambridgeshire Local Plans Transport Report Cambridge City Council, Cambridgeshire County Council, South Cambridgeshire District Council 27 November 2015 Notice This document and its
Kings Dyke Level Crossing Option Assessment Report
 Kings Dyke Level Crossing Option Assessment Report January 2015 Kings Dyke Level Crossing Option Assessment Report Cambridgeshire County Council January 2015 This document has 52 pages (not including Appendices).
Appendix B5 PT Model Validation
 Appendix B5 PT Model Validation PT Model Validation Report Sheffield and Rotherham Public Transport Model Report for Sheffield City Council August 2009 Document Control Project Title: MVA Project Number:
Draft Submission to the Inquiry into National Freight and Supply Chain Priorities. August 2017
 Draft Submission to the Inquiry into National Freight and Supply Chain Priorities August 2017 KEY POINTS Local government welcomes the government s development of a new freight and ports plan and looks
WORCESTERSHIRE PARKWAY REGIONAL INTERCHANGE
 CABINET 16 JUNE 2016 WORCESTERSHIRE PARKWAY REGIONAL INTERCHANGE Relevant Cabinet Member Dr K A Pollock Relevant Officer Director of Economy and Infrastructure Local Member Mr R C Adams Recommendation
Transit Service Guidelines
 G R E AT E R VA N CO U V E R T R A N S P O RTAT I O N A U T H O R I T Y Transit Service Guidelines PUBLIC SUMMARY REPORT JUNE 2004 Greater Vancouver Transportation Authority TRANSIT SERVICE GUIDELINES
Project Appraisal Guidelines for National Roads Unit CBA Audit Checklist
 Project Appraisal Guidelines for National Roads Unit 6.6 - CBA Audit Checklist October 2016 TRANSPORT INFRASTRUCTURE IRELAND (TII) PUBLICATIONS About TII Transport Infrastructure Ireland (TII) is responsible
Response to a Bridge Strike. at a Bridge carrying the Railway. over a Road
 Response to a Bridge Strike at a Bridge carrying the Railway over a Road A Protocol for Highway and Road Managers, Emergency Services and Bridge Owners NR/GPG/CIV/008 3 rd March 2009 Note This protocol
David King, Railway Procurement Agency 14 th November 2012
 Bus Rapid Transit for Dublin Hugh Creegan, National Transport Authority David King, Railway Procurement Agency 14 th November 2012 Topics Core Dublin BRT Network System Concept BRT in the Transport System
Planning, Reporting and Regulatory Framework
 Planning, Reporting and Regulatory Framework Strategic Business Plan 9 February 2018 Planning, Reporting and Regulatory Framework This document describes the key elements and methods of working in our
Proposed Petone to Grenada Link Road Options
 Report 15.41 Date 2 March 2015 File TP/03/29/02 Committee Author Regional Transport Committee Chris Upton, Chair Chief Executives Forum Proposed Petone to Grenada Link Road Options 1. Purpose This report
Department for Transport Consultation: proposals for the creation of a Major Road Network
 Department for Transport Consultation: proposals for the creation of a Major Road Network ACE response March 2018 The Association is Registered as a company in England with the number 132142, it is limited
APPENDIX B - GLOSSARY FEBRUARY 2017
 APPENDIX B - GLOSSARY FEBRUARY 2017 DENVERMOVES Transit Denver Moves: Transit - ii - APPENDIX B TRANSIT AND MOBILITY GLOSSARY Amenities, stop or station: Objects or facilities (such as a shelter, bench,
DAVID CARTER, DIRECTOR OF INFRASTRUCTURE
 REPORT TO: WECA COMMITTEE DATE: 30 NOVEMBER 2018 REPORT TITLE: DIRECTOR: AUTHOR: TRANSPORT UPDATE DAVID CARTER, DIRECTOR OF INFRASTRUCTURE JASON HUMM, HEAD OF TRANSPORT Purpose of Report: 1. To update
Template Framework Freight Track Access Agreement and HS1 Freight Access Terms: Conclusions Document. Date: June
 Subject: Date: June 2012 Template Framework Freight Track Access Agreement and HS1 Freight Access Terms: Conclusions Document 1. Executive Summary In 2011, HS1 Limited ( HS1 Ltd ) held detailed discussions
Benefit Cost Analysis Narrative
 Chicago Region Environmental and Transportation Efficiency Program (CREATE) Grade Separations of: GS21a - Union Pacific and 95 th Street GS11 - Belt Railway Company of Chicago and Columbus Ave. GS 9 -
A Rail Freight Interchange for Spalding
 A Rail Freight Interchange for Spalding Consultation by South Holland District Council on a proposed development site option for a Rail Freight Interchange facility March 2010 About the proposals Introduction
CROXLEY RAIL LINK ORDER. Stephen Edwin Hunter
 Transport and Works Act 1992 Transport and Works (Inquiries Procedure) Rules 2004 CROXLEY RAIL LINK ORDER Stephen Edwin Hunter Associate, Steer Davies Gleave Volume 2 Proof of Evidence Transport Case 11
Water Supply Project Eastern and Midlands Region. Appendix C Cost-Benefit Analysis of Water Supply Projects for the Eastern and Midlands Region
 Water Supply Project Eastern and Midlands Region Appendix C Cost-Benefit Analysis of Water Supply Projects for the Eastern and Midlands Region Cost-Benefit Analysis of Water Supply Projects for the Eastern
A428 / Western Corridor brief. Background
 A428 / Western Corridor brief Background The Transport Strategy that has been developed to support the current Local Plan review outlines major investment in public transport as a pre-requisite to support
Consultation response. February 2014
 Department for Transport National road and rail networks: draft national policy statement Consultation response pteg Support Unit Wellington House 40-50 Wellington Street Leeds LS1 2DE 0113 251 7445 info@pteg.net
A120 Braintree to A12
 Document Ti tle Client Name A120 Braintree to A12 Essex County Council B3553T41-JAC-GEN-00-RP-C-002 P00 5 April 2016 Project Name Project no: Document title: Document No.: Revision: B3553T41 A120 Braintree
***I POSITION OF THE EUROPEAN PARLIAMENT
 EUROPEAN PARLIAMENT 2004 2009 Consolidated legislative document 23.4.2009 EP-PE_TC1-COD(2008)0247 ***I POSITION OF THE EUROPEAN PARLIAMENT adopted at first reading on 23 April 2009 with a view to the adoption
South Bristol Link Major Transport Scheme Bid
 West of England Partnership Joint Transport Executive Committee 1 October 2009 Agenda item 10 South Bristol Link Major Transport Scheme Bid Purpose of Report 1. To inform Members of progress and seek their
THE COBA 2017 USER MANUAL PART 8 INDEX AND ABBREVIATIONS. Contents. Chapter. 1. Index. 2. Abbreviations
 THE COBA 2017 USER MANUAL PART 8 INDEX AND ABBREVIATIONS Contents Chapter 1. 2. Abbreviations July 2017 Part 8 Chapter 1 1. INDEX Subject Part.Chapter.Paragraph Abbreviations 8.2 Accident "Accident only"
Methodological Approach
 Appendix B Methodological Approach This section sets out the methodology which was utilised in the production of this analysis. It is informed by international literature and knowledge of the Irish transport
Greater Cambridge Partnership Executive Board. Chris Tunstall Interim Transport Director
 Report To: Lead Officer: Greater Cambridge Partnership Executive Board Chris Tunstall Interim Transport Director 26 July 2017 A428/A1303 Better Bus Journeys Scheme Further scheme development update Purpose
Rail Decentralisation: Devolving decision-making on passenger rail services in England Response from Campaign for Better Transport
 Rail Decentralisation: Devolving decision-making on passenger rail services in England Response from Campaign for Better Transport Summary of main points We support the devolution of decision-making on
Public Transport Infrastructure
 Christchurch City Council Public Transport Infrastructure Activity Management Plan Long Term Plan 2015 2025 3 December 2014 Christchurch City Council Quality Assurance Statement Christchurch City Council
Technical note. 1. Introduction. 2. Background. Project: A428 Study - Phase 2 To: Adrian Shepherd
 Project: A428 Study - Phase 2 To: Adrian Shepherd Subject: Post-Consultation Activities From: Elena Martinez Date: 25 Feb 2016 cc: 1. Introduction Six conceptual options were presented as part of the A428
WEST LONDON ORBITAL RAIL SERVICE
 West London Alliance WEST LONDON ORBITAL RAIL SERVICE Outline Case WLO5C OCTOBER 2017 INTERNAL West London Alliance Outline Case TYPE OF DOCUMENT (VERSION) INTERNAL PROJECT NO. 70034419 OUR REF. NO. WLO5C
SECTION 32 TRANSPORT CHAPTER
 SECTION 32 TRANSPORT CHAPTER AUGUST 2014 VERSION 1 CONTENTS 1. STRATEGIC CONTEXT...3 1.1 PURPOSE AND SCOPE OF THE TRANSPORT CHAPTER...3 1.2 PROPOSED DISTRICT PLAN: OVERVIEW AND SYNOPSIS...4 1.3 RESEARCH...5
Stoke and Staffordshire can be key HS2 beneficiaries as well as Crewe
 Stoke and Staffordshire can be key HS2 beneficiaries as well as Crewe Greengauge 21 August 2014 Stoke and Staffordshire can be key HS2 beneficiaries as well as Crewe This report sets out the opportunity
Fishermans Bend Integrated Transport Plan Peer Review John Kiriakidis, GTA Consultants 28/03/2018
 Fishermans Bend Integrated Transport Plan Peer Review John Kiriakidis, GTA Consultants 28/03/2018 GTA creating transport that works 01 Preliminaries GTA creating transport that works Review scope : Review
SUSTAINABLE TRANSPORT: CHALLENGES AND OPPORTUNITIES
 Paper for presentation at the Conference on Public Transport and Urban Citizenship: Making Dublin the Capital of Ireland 21 st September 2007 SUSTAINABLE TRANSPORT: CHALLENGES AND OPPORTUNITIES David Banister
Rail Freight and Passenger
 Take Care of the System Critical Investments in the areas of: Rail Freight rehabilitate rail bridges o Rail Bridge Inventory Database... $0.5 - $1.0 million (one time) Rail Freight rail replacement and
WRITTEN SUBMISSION FROM NETWORK RAIL 28 OCTOBER 2008
 WRITTEN SUBMISSION FROM NETWORK RAIL 28 OCTOBER 2008 Thank you for inviting Network Rail to participate in the Transport, Infrastructure and Climate Change Committee inquiry into the potential benefits
PUBLIC TRANSPORT LONG TERM VISION FOR MILTON KEYNES
 PUBLIC TRANSPORT LONG TERM VISION FOR MILTON KEYNES CONSULTATION January 2004 We are seeking comments on the final results and recommendations from a study (November 2003) of a long term vision for public
13. Traffic and Transport
 13. Traffic and Transport 13.1 Executive Summary The traffic impact of the Facility has been examined for both transport of materials and staff, and with regard to the latter, accessibility of the site
SWDP 4: Moving Around South Worcestershire. SWDP 4: Moving Around South Worcestershire. Managing Travel Demand
 SWDP 4: Moving Around South Worcestershire Managing Travel Demand A. Proposals must demonstrate that: the layout of development will minimise demand for travel, they offer genuinely sustainable travel
Response to a Bridge Strike over the Railway
 Response to a Bridge Strike over the Railway A Protocol for Highway and Road Managers, Police and Bridge Owners NR/GPG/CIV/007 Note This protocol has been produced for the benefit of Network Rail staff
Waterside Rail Study. Final Report. Hampshire County Council
 Hampshire County Council June 2013 Hampshire County Council June 2013 Halcrow Group Limited Lyndon House, 62 Hagley Road, Edgbaston, Birmingham B16 8PE tel 0121 456 2345 fax 0121 456 1569 halcrow.com Halcrow
Waterside Rail Study. Final Report. Hampshire County Council
 Hampshire County Council June 2013 Hampshire County Council June 2013 Halcrow Group Limited Lyndon House, 62 Hagley Road, Edgbaston, Birmingham B16 8PE tel 0121 456 2345 fax 0121 456 1569 halcrow.com Halcrow
THE QUADRO 2017 MANUAL PART 0 THE APPLICATION OF THE QUADRO MANUAL. Contents. Chapter. 1. Detailed Contents of the QUADRO Manual. 2.
 THE QUADRO 2017 MANUAL PART 0 THE APPLICATION OF THE QUADRO MANUAL Contents Chapter 1. Detailed Contents of the QUADRO Manual 2. Introduction 3. Bibliography 4. Enquiries Annex A. Abbreviations July 2017
Commission for Travel Demand Submission from Transport for London March 2017
 Commission for Travel Demand Submission from Transport for London March 2017 Introduction TfL is the strategic transport authority for London, governed by the Mayor of London and responsible for delivering
OUYEN INTERMODAL TERMINAL
 OUYEN INTERMODAL TERMINAL for establishment of a Freight Terminal at Ouyen Rail Yards 1. BACKGROUND This brief presents a rapid appraisal for the potential for an intermodal terminal at Ouyen and recommendation
Transport Assessment Guidelines November 2015 Cambridgeshire County Council
 Transport Assessment Guidelines November 2015 Cambridgeshire County Council Introduction The National Planning Policy Framework (NPPF, March 2012) states that All developments that generate significant
This paper outlines the carbon footprint and greenhouse gas assessment for HS2 Phase One.
 HIGH SPEED TWO INFORMATION PAPER E10: CARBON This paper outlines the carbon footprint and greenhouse gas assessment for HS2 Phase One. It will be of particular interest to those potentially affected by
JULY This guide is to be used for the Sustainable Transport Credits in the Transport Category.
 JULY 2015 This guide is to be used for the Sustainable Transport Credits in the Transport Category. For information on this document, please contact: Green Building Council of Australia (02) 8239 6218
East West Rail GRIP 4 Outline Business Case. Final Report Non Technical Summary. July 2010
 East West Rail GRIP 4 Outline Business Case Final Report Non Technical Summary July 2010 Contents Section Introduction Purpose of the Outline Business Case (OBC) Project Context, Challenges and Objectives
VIA Long Range Plan Glossary
 VIA Long Range Plan Glossary Accessibility. Accessibility is the ability to reach opportunities (economic, social, etc.) within a certain geographical area. Americans with Disabilities Act (ADA). Passed
Appraisal Summary Table (AST)
") Appraisal Summary Table (AST) TAG Reference Guidance for the Senior Responible Officer, Guidance for the Technical Project Manager Version Control Date Description Jan14 Definitive release 17/10/2013 Release
Appraisal Summary Table (AST) TAG Reference Guidance for the Senior Responible Officer, Guidance for the Technical Project Manager Version Control Date Description Jan14 Definitive release 17/10/2013 Release
N4 Collooney to Castlebaldwin Road Scheme
 Traffic Analysis Brief of Evidence N4 Collooney to Castlebaldwin Road Scheme Presented by: Declan Keenan and Shane Dunny of AECOM Designer AECOM Lower Ground Floor Grand Canal House Upper Grand Canal Street
Rail Corridor Feasibility Study
 November 22, 2013 Lee County Rail Corridor Feasibility Study Lee County MPO Rail Feasibility Study Contract 2012-001 November 22, 2013 David Plummer & Associates, Inc. Spikowski Planning Associates David
Evaluation of Alternatives
 Chapter 9.0 Evaluation of Alternatives Chapter 9.0 provides a summary evaluation of the No Build Alternative and the Preferred Alternative. The evaluation contained within this chapter is an assessment
Rail Freight Terminal
 Rail Freight Terminal One of a series of background topic papers prepared by db symmetry in support of a public consultation on proposals for a strategic rail freight interchange in Blaby district, to
That will also contribute to achievement of a number of objectives and policies in the Regional Policy Statement.
 Board of Inquiry MacKays to Peka Peka Expressway Proposal Submitters Evidence Public Transport Voice 5 October 2012 Executive Summary Increasing modal share for public transport is a key outcome in the
Transport User Benefit Calculation
 TAG Unit 3.5.3 April 2004 Department for Transport Transport Analysis Guidance (TAG) This Unit is part of a family which can be accessed at www.webtag.org.uk Contents 1 Introduction 1 2 Transport user
Information supporting the traffic chapters
 Annex I Metro North EIS Information supporting the traffic chapters - Baseline traffic report Information Note Project Title: MVA Project Number: Metro North EIA C8103900 Subject: Alterations to Baseline
Chapter 7 Route Window NE6 Goodmayes station. Transport for London
 Chapter 7 Route Window NE6 Goodmayes station GOODMAYES STATION 7 Route Window NE6 Goodmayes station Baseline conditions 7.7 This route window is in the London Borough of Redbridge. Goodmayes station is
Stakeholder Consultation Outcomes
 City of Hobart TRANSPORT STRATEGY 2018-2030 Consultation Phase MODULE 1 FREIGHT, PORT AND AIR Stakeholder Consultation Outcomes November 2016 in association with T ABLE OF C ONTENTS 1. Background 2. Consultation
As acknowledged in the draft CCP, very little progress has been made in tackling emissions from transport. Transport emissions
 Transform Scotland Draft Climate Change Plan: Evidence to the REC Committee 2 February 2017 1. Introduction Transform Scotland welcomes the opportunity to give evidence to the REC Committee on the Policies
WELLINGTON NORTHERN CORRIDOR. Project Summary Statement 21 December 2009
 WELLINGTON NORTHERN CORRIDOR Project Summary Statement 21 December 2009 1 Table of Contents 1. Purpose of Document 2. Strategic Context 3. Benefits 4. Project Scope and Economics 5. Implementation Plan
EXHIBIT LIST No Exhibit Name Page 1 P5 Traffic Presentation.pdf (P5) 2-20
 2-20") Reference No: HOC/10001 Petitioner: Phase 2a Teach-ins Published to Collaboration Area: Friday 23-Mar-2018 EXHIBIT LIST Page 1 of 20 No Exhibit Name Page 1 P5 Traffic Presentation.pdf (P5) 2-20 HOC/10001/0001
Reference No: HOC/10001 Petitioner: Phase 2a Teach-ins Published to Collaboration Area: Friday 23-Mar-2018 EXHIBIT LIST Page 1 of 20 No Exhibit Name Page 1 P5 Traffic Presentation.pdf (P5) 2-20 HOC/10001/0001
ANNEX F BRESSAY LINK. STAG 1: APPRAISAL SUMMARY TABLES (ASTs)
") ANNEX F BRESSAY LINK STAG 1: APPRAISAL SUMMARY TABLES (ASTs) Table F1 STAG 1 Appraisal Summary Table: Do Minimum Proposal Details Name and address of authority or organisation promoting the proposal:
ANNEX F BRESSAY LINK STAG 1: APPRAISAL SUMMARY TABLES (ASTs) Table F1 STAG 1 Appraisal Summary Table: Do Minimum Proposal Details Name and address of authority or organisation promoting the proposal:
Gravity Model Formulation
 Gravity Model Formulation 2.20 The basic gravity model takes the following formulation, known as the combined power and exponential function: where Cij is the generalised cost between each origin and destination,
Q. Where are all the people to fill these jobs going to come from (local unemployment in the villages is very low)?
?") Northampton Gateway SRFI Questions raised at the Milton Malsor PC meeting 8 th Nov: Q. The proposals are contrary to 2014 Joint Core Strategy where the Inspector (from PINS) concluded no new employment
Northampton Gateway SRFI Questions raised at the Milton Malsor PC meeting 8 th Nov: Q. The proposals are contrary to 2014 Joint Core Strategy where the Inspector (from PINS) concluded no new employment
Transport Model for Scotland. Kevin Lumsden MVA
 1. INTRODUCTION Transport Model for Scotland Kevin Lumsden MVA Transport Model for Scotland (TMfS) is a multi-modal transport demand and assignment model with an interactive Land Use model. The model area
Nicola Detheridge Joint Northern Studies - Stakeholder Reference Group Partner Engagement Manager, Transport for the North
 Nicola Detheridge Joint Northern Studies - Stakeholder Reference Group Partner Engagement Manager, Transport for the North Housekeeping Have we all signed in? Fire alarms and exits Phones Toilets Agenda
Chapter 11 ECONOMIC ANALYSIS
 Chapter 11 ECONOMIC ANALYSIS 11.1 INTRODUCTION The purpose of the undertaking an economic evaluation is to provide an overall picture of the contributions of the MRT system to broadly defined social goals
EXECUTIVE SUMMARY ORGANIZATION OF REPORT
 EXECUTIVE SUMMARY Over the past year, the Dillon Consulting team conducted a comprehensive review of public transit in Guelph. The City of Guelph has for many years been a leader among Canadian municipalities
Melbourne Airport heavy rail line MAH
 Melbourne Airport heavy rail line MAH Option type New assets Location Melbourne central subregion, Melbourne western subregion and Melbourne northern subregion Melbourne Airport north west state-significant
Assessing the benefits The Joint Air Quality Unit (JAQU) have identified three key benefits to capture:
 have identified three key benefits to capture:") Appendix E - Economic Modelling Methodology Introduction This study will explore the economics case for the AZ by demonstrating the value-for money (VFM) of the proposed option and provides value to the
Appendix E - Economic Modelling Methodology Introduction This study will explore the economics case for the AZ by demonstrating the value-for money (VFM) of the proposed option and provides value to the
The London to Fishguard Trunk Road (East of Magor to Castleton) Order 201-
 Order 201-") Proof of Evidence Construction Adran yr Economi a r Seilwaith Department for Economy and Infrastructure The M4 Motorway (Junction 23 (East of Magor) to West of Junction 29 (Castleton) and Connecting Roads)
Proof of Evidence Construction Adran yr Economi a r Seilwaith Department for Economy and Infrastructure The M4 Motorway (Junction 23 (East of Magor) to West of Junction 29 (Castleton) and Connecting Roads)
Macroscopic and Microscopic Simulation for the Evaluation of People Mover Systems. Dr.-Ing. Peter Mott Sven Beller PTV AG, Karlsruhe, Germany
 Macroscopic and Microscopic Simulation for the Evaluation of People Mover Systems Dr.-Ing. Peter Mott Sven Beller PTV AG, Karlsruhe, Germany 1. Introduction This paper is intended to show how a comprehensive