The Potential of Regional Power Sector Integration. PJM Interconnect Developed Country Case Study
|
|
|
- Hubert Robinson
- 5 years ago
- Views:
Transcription


1 The Potential of Regional Power Sector Integration PJM Interconnect Developed Country Case Study Submitted to ESMAP by: Economic Consulting Associates August 2009 Economic Consulting Associates Limited 41 Lonsdale Road, London NW6 6RA, UK tel: , fax:
2 Contents Contents Abbreviations and acronyms Preface v vii 1 Executive summary Motivations/objectives for trade The trade solution put in place Current status and future plans 2 2 Context for trade Economic and political context Supply options Demand Energy tariffs 12 3 History of scheme Overview including timeline/chronology Project concept, objectives, and development Feasibility studies done Assets built and planned resulting (directly and indirectly) from scheme itself Interconnections and electricity trade Environmental and social issues 25 4 Institutional arrangements PJM governance arrangements Overview Governance structure PJM operations Role of national governments and regional institutions 31 i
3 Contents 4.3 Regulatory agencies Role of outside agencies 32 5 Contractual, financial and pricing arrangements Contracts Ownership and finance Pricing arrangements Pricing principles Pricing mechanisms 37 6 Future plans 40 Bibliography 42 A1 Electricity supply 44 A2 Electricity demand 48 A3 Prices 50 A4 Contracts 51 ii
4 Contents Tables and Figures Tables Table 1 Indicators for the United States 5 Table 2 PJM Historical Load 9 Table 3 Annual Average Day-Ahead Prices 15 Table 4 Chronology of PJM Development 16 Table 5 Sales by Generation Ownership Type, Table 6 PJM Installed Capacity by Fuel Source 44 Table 7 PJM Installed Capacity by Zone and Fuel Source 45 Table 8 PJM Generation by Fuel Source 46 Table 9 New and Retiring Generation Within PJM RTO, Table 10 Net Exports by US State, TWh 47 Table 11 PJM Regions and Zones 48 Table 12 PJM Annual Load Forecasts by Zone 49 Table 13 Day-Ahead Load Weighted LMP 50 Table 14 Number of Utilities by Ownership Type, Table 15 Sales of Utilities by Ownership Type, 2007 (GWh) 52 Figures Figure 1 Utility Control Areas and Regions in PJM 4 Figure 2 Resources Potentially Available for Electricity Generation, Figure 3 Generation Capacity by PJM Region 9 Figure 4 Growth in Demand in States Where PJM Operates 10 Figure 5 Monthly Demand in the PJM RTO Area, Figure 6 Daily Load in the PJM RTO Area, Summer and Winter Days 11 Figure 7 Regional Demand Forecast 12 iii
5 Contents Figure 8 Inflation-Adjusted Prices in PJM states (2006 = 100) 13 Figure 9 Locational Marginal Prices by State, 2007 and Figure 10 Capacity Additions by PJM Region to Figure 11 PJM Board-Approved Backbone Transmission Lines, Figure 12 PJM Backbone Transmission System 22 Figure 13 Trends in Regional Net Energy Transfers 23 Figure 14 Hourly Scheduled Day-Ahead Interchange 24 Figure 15 Monthly Pattern of Regional Transfer, Figure 16 PJM Organizational Structure 27 Figure 17 Ownership Structure of Load-Serving Entities, iv
6 Contents Abbreviations and acronyms AE or AECO AEP AP or APS BEA BGE CHP DAY DLCO or DUQ DOE DOM DPL EIA EPA FERC FTR ISO JCPL LLC LMP LSE MC METED MISO MRC NERC NYISO OATT PECO PENELEC or PN PEPCO PJM PPL or PL PSEG or PS RECO RPM RPPWG RRS RTEP Atlantic Electric Power Company, Inc. American Electric Power Allegheny Power Systems Bureau of Economic Analysis Baltimore Gas and Electric Company Combined Heat and Power Dayton Power and Light Company Duquesne Light United States Department of Energy Dominion Delmarva Power and Light Company Energy Information Administration Environmental Protection Agency Federal Energy Regulatory Commission Financial Transmission Rights Independent System Operator Jersey Central Power and Light Company Limited Liability Company Locational Marginal Pricing Load-Serving Entity PJM Members Committee Metropolitan Edison Company Midwest Independent Transmission System Operator Markets and Reliability Committee North American Electric Reliability Council New York Independent System Operator Open Access Transmission Tariffs PECO Energy Pennsylvania Electric Company Potomac Electric Power Company Pennsylvania New Jersey Maryland Interconnection PPL Electric Utilities Public Service Electric and Gas Company Rockland Electric Company Reliability Pricing Model Regional Planning Process Working Group PJM Reserve Requirement Study Regional Transmission Expansion Planning v
7 Contents RTO TEAC VEPCO Regional Transmission Organization Transmission Expansion Advisory Committee Virginia Electric and Power Company vi
8 Contents Preface This case study is part of an Energy Sector Management Assistance Program (ESMAP) project on Regional Power System Integration (RPSI). The objective of the project is to facilitate and accelerate RPSI projects in developing countries around the world. The project will draw on international experience and theoretical analysis in this area to provide a framework to assess: the economic, financial and environmental benefits that can accrue to regional power trading; the institutional and regulatory arrangements needed to sustain and optimize regional projects; and the ways in which obstacles to integration have been successfully overcome. The final output of the project will be an umbrella report, Regional Power Sector Integration Lessons from Global Case Studies and a Literature Review. This review will summarize the 12 case studies and literature review undertaken and analyze common themes on barriers to RPSI and solutions to overcome them. Economic Consulting Associates was contracted to execute the project. In doing so, we are working closely with ESMAP and World Bank staff, as well as government officials, utility, power pool, and regional economic community personnel, and others directly involved in implementing regional power schemes. This and other 11 Case Studies are prepared as clear, factual presentations of the selected projects. The intent is to provide a direct, easily digestible description of each of the selected projects without imposing an analytic framework or making judgments about the degree of success. Such analysis will be undertaken at the global level, considering the entirety of experiences from the Case Studies, in the aforementioned umbrella report. All 12 Case Studies follow a uniform structure to facilitate ease of comparison and reference from one Study to the next. Some sections are longer than others, depending on the specifics of the Study. Additionally, there is some cross-referencing within each Study. vii
9 Executive summary 1 Executive summary 1.1 Motivations/objectives for trade When PJM was started in 1927 as a power pool, the motivation behind the interconnection was to be able to share generation resources and thus improve efficiency as well as minimize investments in generation and transmission capacity of the three utilities involved. The resulting power pool allowed utilities in Pennsylvania and New Jersey to share load. Meeting power demands in Philadelphia was the primary motivation for creating an interconnection and trading energy. In 1956 the arrangements were extended to Maryland, which was when the arrangements were renamed as PJM. The essential beneficiaries of this arrangement were the utilities that formed the PJM pool. These benefits were gradually extended to more utilities in the Mid-Atlantic region of the USA. The 1973 energy crisis led to a rethink in federal energy policy and the setting up of the Federal Energy Regulatory Commission (FERC) as an activist regulator of interstate energy commerce. The consequent development of open-access competition allowed the establishment of independent generation that greatly increased demands on the wholesale pool. Another FERC initiative has been the development of independent system operators (and independent regional transmission organizations, RTOs). PJM was already independent because no single utility controlled it, but it was only formally declared an RTO in The RTO structure was followed by extension of PJM into a western region in 2002 with further expansion to the west and the south in Expansion of the control area highlighted the importance of longer-distance transmission development. 1.2 The trade solution put in place The initial arrangement of PJM was a simple power pool that sought to deliver least-cost dispatch of the mix of generation owned by the utilities in PJM. 1 With the growth of the arrangements both geographically and by the inclusion of nonutility traders, the organizational structure evolved. PJM became substantially independent from its utility owners in 1993 and was converted into a not-for-profit limited liability company in Its current management structure is a two-tier arrangement with a management board supervising day-to-day operation and reporting to an elected Members Committee (MC). Election to the MC is arranged into constituencies representing the different member 1 Throughout this case study PJM refers to the entity PJM Interconnection LLC or else to its predecessor entity. More general references such as to the PJM area can cover other entities such as generators or utilities trading through PJM markets. 1
10 Executive summary interests: transmission owners, generation owners, electricity distributors, end-use customers 2 and pure traders. PJM members can trade bilaterally or else can self-supply, but additional energy and capacity needs are made available through PJM operation of specific markets in energy, capacity and ancillary services. These markets are supported by information provision and analysis tools developed centrally by PJM as well as an independent market monitoring company that ensures transparency and effective competition are in place to protect the interests of all members. The main markets offered are: Day-Ahead Energy Market in which hourly locational marginal prices (LMPs) are calculated for the next operating day based on generation offers, demand bids and scheduled bilateral transactions bid into a day-ahead auction. Real-Time Energy Market, which is a within-day spot market in which current LMPs are calculated separately from day-ahead LMPs. Reliability Pricing Model, a capacity market model that works as a market for capacity three years out. It works in conjunction with PJM s Regional Transmission Expansion Planning (RTEP) process. Its features are: Procurement of capacity commitments for both generation and transmission through competitive auction; Locational pricing for capacity that reflects constraints in the transmission system. Financial Transmission Rights (FTR) auctions for participants to hedge their exposure to locational marginal pricing by buying FTRs that pay out differences between the prices at the entry and exit nodes of specific transmission paths. Transmission services. PJM offers point-to-point firm and non-firm access services for specific bilateral routes from generators to loads. The fees for transmission fund PJM. 1.3 Current status and future plans PJM dispatches about 163,500 megawatts (MW) of generating capacity over 56,350 miles of transmission lines. More than 51 million people live in the PJM region. Since the opening of the regional wholesale market in 1997, PJM has administered more than $103 billion in energy. PJM delivers about 700 TWh of energy a year and serves utilities in 13 states as well as the District of Columbia. PJM has overseen an expansion in interstate trade with significant energy transferring from the states in the Great Lakes region of the USA to the deficit region of the fast-growing southern USA (i.e., Virginia and North Carolina) as well as to the heavily populated area of 2 Customers also compete in provision of demand management by contracting with their local utility. 2
11 Executive summary the original PJM Mid-Atlantic region. It has done this essentially by providing marketclearing facilities in energy and capacity. PJM has ambitions to extend its area of operation by cooperation with neighboring system operators in New York and the Midwest. However, to fulfil these ambitions, PJM still needs to address issues of price differentials between regions. It set up its locational marginal pricing market in This provided pricing signals for location of generation and demand management as well as requirements for transmission investment. However, it also created local monopolies in generation, which it managed by capping generation bids during periods when congestion set differential prices. In 2007, PJM began operation of its Reliability Pricing Model, which operated as a buy auction for forward commitments to deliver new generation and transmission. It modelled locational signals to reward development in energy deficit areas. This model signals an acknowledgement that locational marginal prices in an energy market are not likely to deliver sufficient generation and transmission to ensure reliable operation of the system. However, the model still fails to deliver sufficient reward to transmission investment that relieves congestion, and so significant price differentials between regions persist. 3

12 Context for trade 2 Context for trade 2.1 Economic and political context PJM Interconnection is a not-for-profit, member-driven integrated power pool responsible for wholesale electricity in all or parts of Delaware, Illinois, Indiana, Kentucky, Maryland, Michigan, New Jersey, North Carolina, Ohio, Pennsylvania, Tennessee, Virginia, West Virginia and the District of Columbia. 3 Figure 1 Utility Control Areas and Regions in PJM Source: PJM PJM Interconnection operates the world's largest competitive wholesale electricity market. As of 2005, the PJM area had over 56,070 miles of transmission lines and 1,082 generation 3 PJM stands for Pennsylvania-Jersey-Maryland, the original states in which it operated, but it has long operated in more than just these states and has extended into several more states since
13 Context for trade sources. PJM dispatches about 165,000 MW of generating capacity and delivers around 700,000 GWh of energy annually. Figure 1 shows both the utilities involved and their respective zones of operation. The PJM control area covers only parts of many of the states in which PJM operates. Therefore, when state-level statistics are cited in this study, it must be remembered that these cover more than just the PJM area. Economic environment Table 1 shows some economic indicators for the United States for the years 1965 and 2007 as well as selected current statistics for the states that wholly or partly participate in the PJM pool. In 1965 PJM first expanded to include more than the original three utilities. Because the PJM supply area covers only part of the territory of many of the states in which it has a presence, the numbers in Table 1 for the PJM states will tend to overstate the impact of PJM. The USA is a rich country with a fully developed electricity sector. The available data suggest that the states in the PJM area are very close to the US average on a number of measures. Table 1 Indicators for the United States USA 1965 USA 2007 PJM States 2007 PJM States as % of USA 2007 Population (millions) % Surface area (km 2 ) 9,629,090 9,632, , % GDP (US$ billions) ,751 4, % GNI per capita (PPP) N/A 45,840 44, % GDP growth % Inflation (GDP deflator annual %) 3 3 Exports (% of GDP) 5 11* Life expectancy at birth (years) Mortality rate under 5years (per 1,000) 28 8 Electricity consumption (kwh per capita) 4,890 12,990 13, % Source: World Development Indicators (World Bank), 2007 data, US BEA * Data unavailable for 2007; instead 2006 data are used. Regulatory and political environment US economic development was based on an abundance of primary energy sources for most of the 20 th century. Dependence on coal gradually gave way to oil during the early 20 th century mainly due to relative convenience. The oil crisis of 1973 highlighted a growing 5
14 Context for trade dependence on imports of oil, and from then on there have been intermittent moves toward greater conservation and energy independence. In electricity, there is a long history of development of grid connections, starting with a Niagara Falls power scheme in Therefore, the development of PJM in 1927 was based on a US track record of grid connection for utilities. This initial development therefore occurred during the era of passive legislation on energy. The ownership structure of the electricity industry in America has changed over time. According to Tyson Slocum, 4 the old model consisted of vertically integrated monopolies regulated by a cost-of-service price control. Then: Deregulation was triggered by a series of federal actions over several years, followed by decisions by America s largest states to pass laws ordering the separation of power plants from the distributional utility. With separation of generation from distribution, states ceded regulatory authority to FERC (Federal Energy Regulatory Commission) over wholesale trading. In parallel with this, the energy crisis in the 1970s led to encouragement of alternative providers. 5 This was further promoted by the Energy Policy Act of 1992, which gave FERC authority to order utilities to buy from independent utilities. Therefore, the regulatory environment broke down monopolies and encouraged trading companies to operate in a wholesale market largely free from state price controls. In the general political environment, electricity availability is taken for granted. The industry is considered mature and stable. Supply failures (e.g., the August 2003 failure that cut supply to 50 million people on the East Coast) and price spikes (e.g., the California crisis of 2000 and 2001) can occur, but this will not usually be due to true lack of availability. There was therefore no particular direct political or social driver leading to a regional power pool. The benefits of interconnection were mainly perceived by the utilities themselves. The driver for the PJM power pool therefore came from commercial interests. 2.2 Supply options Figure 2 gives energy resources, both indigenous and importable, for each of the states where some, or all, of the load is served by PJM. The data in Figure 2 give an indication of resource availability. For example, the gas energy imported is for all uses in the state and not just for electricity generation there are no significant gas resources indigenous to the region. The figure shows: There are significant surpluses of coal in Kentucky and West Virginia. Washington DC, Delaware, Maryland, North Carolina and Tennessee have relatively little primary energy resource. 4 Slocum (2008, October) 5 Slocum cites the 1978 Public Utility Regulatory Policy Act as leading to this. 6
15 Context for trade Nuclear and hydro play only a small part in available energy resources, with reliance mainly on thermal energy sources. The data suggest that there is advantage in electricity transfers from resource-rich areas to other areas, but it should be noted that availability of primary energy sources within a state and local generation are not vital to regional development any resource needed can be readily imported. Figure 3 gives generation capacity in each main PJM region as of December It highlights the importance of steam generation (coal-fired) in the PJM generation mix, with the Western region relying significantly on coal mined in West Virginia and Tennessee, while the Mid-Atlantic region uses coal mined in Pennsylvania. 7


16 Context for trade Figure 2 Resources Potentially Available for Electricity Generation, 2007 Source: EIA 8


17 Context for trade Figure 3 Generation Capacity by PJM Region Source: State of the Market Report for PJM: Energy Market, Volume 2, 2008, p Demand Table 2 shows annual load in the PJM area in recent years. Figure 4 shows growth in annual load in the states in which PJM operates. PJM accounted for about 54% of load in the states in which it operates, although there is considerable variation in PJM s share in individual states. Demand growth averaged 3.3% per year in the states where PJM control areas in the PJM Mid-Atlantic region are located. In the Western region states, demand growth was slower at 2.7%, while in the Southern region states, demand growth averaged 4.7% per year. Table 2 PJM Historical Load Year Annual Net Load (GWh) , , , ,893 Source: PJM (accessed on ) 6 The underlying data for the figure, including by utility control zone, are given in Table 6 in Annex A1; the regional groupings of PJM control areas are given in Table 11 in Annex A2. 9


18 Context for trade Figure 4 Growth in Demand in States Where PJM Operates Source: EIA Figure 5 shows monthly load shape for the PJM regional transmission organization (RTO) control area, and Figure 6 gives typical summer and winter load shapes, showing how the PJM control area has a summer peak. 10


19 Context for trade Figure 5 Monthly Demand in the PJM RTO Area, 2008 Source: PJM Figure 6 Daily Load in the PJM RTO Area, Summer and Winter Days Source: PJM PJM load forecasts are given in Figure 7. Annual growth of 1.4% per year is predicted for the PJM RTO area, with the fastest growth (1.4% per year) in the Southern region. Growth in the 11


20 Context for trade Western region is forecast as slightly slower than the average at 1.3% per year while the Mid-Atlantic region is forecast to grow at 1.4% per year. Figure 7 Regional Demand Forecast Source: PJM, Load Forecast Report, Energy tariffs In theory, regional power pools and related cross-border power transfers will promote convergence of consumer prices between regions, especially for larger-scale industrial consumers. Figure 8 explores this by plotting prices for the different states in which PJM has a presence. The data have been adjusted to 2006 values using the US Consumer Price Index. Figure 8 does not indicate convergence of prices between states in the PJM area. Using the USA price for comparison, there is a persistent differential between states in the same region of the PJM area. There is also a persistent variation in price levels between PJM regions, with prices in the Mid-Atlantic region above the average for the USA, while in the Western and Southern regions of PJM, prices tend to be just under the USA average price for most states. 7 See Annex A2, Table 11 for definition of regions. The data used, including data for individual zones, are given in Table 12 12

 approach.")
21 Context for trade Figure 8 Inflation-Adjusted Prices in PJM states (2006 = 100) Source: EIA The retail price in any particular area is made up from a wholesale energy price with additional costs for transmission, distribution and tax. 8 In a common pooled area, the main expected convergence would be in wholesale prices. Wholesale energy pricing in PJM settlements is done via the bid-based locational marginal pricing (LMP) approach. The LMP approach calculates the cost of supplying the next unit of 8 In the PJM pricing methodology, the transmission costs are built into the wholesale prices. 13


22 Context for trade energy at a specific location taking into account generation cost, transmission congestion and losses. Figure 9 shows how LMP prices differ from state to state for the years 2007 and Figure 9 Locational Marginal Prices by State, 2007 and Source: State of the Market Report for PJM: Energy Market, part 1, 2008, p.70 The wholesale price levels shown in Figure 9 partly explain differences in retail price levels between PJM regions, but do not, on the whole, explain differences within regions. The partial exception is the lower retail prices faced by consumers in Pennsylvania where the wholesale price is also lower. The LMP methodology and its implications are discussed in Section 5.3. Table 3 shows annual average day-ahead prices for the past five years. 9 The data can be found on Table 13 in Annex
23 Context for trade Table 3 Annual Average Day-Ahead Prices Year Average Price ($/MWh) Note: Source is PJM Western Hub (a basket of 109 buses from Erie PA to Washington, DC). 15
24 History of scheme 3 History of scheme 3.1 Overview including timeline/chronology PJM was created in 1927 when three utilities decided to share their generating resources, forming the world s first cross-utility power pool. 10 PJM became an organization functionally independent of its utility members in 1993 when the PJM Interconnection Association was formed to administer the power pool. By 1997 PJM had become a completely independent organization. At that time, membership was opened to nonutilities and an independent board of managers was elected. Also, in 1997, PJM opened its first bidbased energy market, and the Federal Energy Regulatory Commission (FERC) approved it as the nation s first fully functioning independent system operator (ISO). 11 In 2001 it became the nation s first fully functioning regional transmission organization (RTO). 12 Table 4 Chronology of PJM Development Year Event 1927 Three utilities in Pennsylvania and New Jersey realize the benefits of an interconnection and form a power pool Federal Power Commission (created in 1930) becomes independent of government. Responsibilities included oversight of interstate electricity transfer and promotion of electrification Baltimore Gas and Electric Company and General Public Utilities join the pool, which is renamed Pennsylvania-New Jersey-Maryland Interconnection, or PJM More utilities join; PJM continues being operated through the utilities Federal Energy Regulatory Commission (FERC) replaces Federal Power Commission Public Utility Regulatory Policy Act promotes energy procurement from 3 rd party generation 1992 Energy Policy Act empowers FERC to order utilities to buy from independent utilities PJM becomes a neutral, independent organization; formation of PJM Interconnection Association. 10 Utilities had started experimenting with least-cost dispatch once they had more than one power station, but this was the first where generation owned by different utilities was dispatched through a single dispatch process. 11 ISOs operate, but do not own, transmission systems in order to provide open access to the grid for non-utility users. 12 A Regional Transmission Organization (RTO) in the United States is responsible for moving electricity over large interstate areas. Like ISOs, they provide an open access system and operate but do not own transmission assets. 16
25 History of scheme Year Event 1996 FERC Order 888: Promoting Wholesale Competition Through Open Access Nondiscriminatory Transmission Services by Public Utilities; Recovery of Stranded Costs by Public Utilities and Transmitting Utilities 1997 PJM energy market commences as cost-based pool with market-clearing prices. FERC approves PJM as the first fully functioning ISO in the US PJM energy market based on LMP PJM capacity markets start. PJM FTR (Financial Transmission Rights) market introduced PJM Regulation market commences. Day-ahead energy market starts. First program for customer load reduction PJM becomes the first fully functioning RTO PJM integrates Allegheny Power s five state transmission systems into the PJM Western region. FERC approves PJM RTO status Start of annual FTR auctions ComEd, AEP and DAY Control Zones integrated into PJM DLCO and Dominion Control Zones integrated into PJM PJM holds first RPM (Reliability Pricing Model) auctions. Marginal losses component added to Locational Marginal Prices PJM starts Day-Ahead Scheduling Reserve market. Separate Market Monitoring Unit created. Source: Monitoring Analytics (2008a, 2008b) 3.2 Project concept, objectives, and development The first PJM arrangements started in 1927 when three utilities realized the benefits and efficiencies that could be attained by interconnecting to share their generating resources. The resulting interconnection allowed Philadelphia Electric, Pennsylvania Power & Light, and 17
26 History of scheme Public Service Electric & Gas of New Jersey to share load. The first goal of the interconnection was to meet power demands in Philadelphia. More generally, the idea was to achieve economies of scale and to incorporate the benefits of diversity on both the generation side and the load side to drive down costs. When the three utilities signed the initial agreement it was based on an estimated savings of $45 million for the time period 1927 to PJM started out in 1927 as a simple agreement between utilities. The purpose of the power pool they created was to dispatch electric generating plants on a lowest-cost basis, thereby reducing the electric costs for all members of the pool. The initial pool had the city of Philadelphia as a primary load center with limited demand elsewhere in the region. Significant expansion of the geographic region began in 1965 and led to the initial more serious consideration of transmission issues. Further transformation of the rules of the organization became necessary in 1978 when access to third-party generation had to be accommodated. The current status as a regional transmission organization was approved in 2002, but the de facto operation of PJM Interconnection as an RTO can be dated from 1993 when the 1993 Operating Agreement was signed; this was later transformed into the current Operating Agreement when PJM converted from an association of utilities into a limited liability company. In its latest form, PJM Interconnection is a market operator that runs auctions and clearing markets that set wholesale prices for electrical energy, generating capacity, transmission capacity and several ancillary services. These markets cover both short-term energy markets and long-term capacity markets. In addition it undertakes long-term planning. 3.3 Feasibility studies done PJM regularly carries out planning and feasibility studies. The PJM transmission feasibility study process currently embraces: 2008 Regional Transmission Expansion Plan Report A central pillar of the PJM framework is the Regional Transmission Expansion Planning (RTEP) process, which identifies transmission system additions and improvements. Studies are conducted that test the transmission system against mandatory national standards and PJM regional standards. These studies look 15 years into the future to identify transmission overloads, voltage limitations and other reliability standards violations. PJM then develops transmission plans in collaboration with transmission owners to resolve violations that could otherwise lead to overloads and blackouts. This process culminates in one recommended plan one RTEP for the entire PJM footprint that is subsequently submitted to PJM s independent governing board for consideration and approval. 18
27 History of scheme Mid-Atlantic Power Pathway (MAPP) This is a major proposed transmission investment. PJM RTEP analysis assessed the impact of the MAPP project on area load deliverability violations that are expected to occur over the 15-year planning horizon. All such plans require PJM approval. PJM has a corresponding generation reserve planning process: PJM Reserve Requirement Study, The annual PJM Reserve Requirement Study (RRS) calculates the reserve margin that is required to comply with the Reliability Principles and Standards as defined in the PJM Reliability Assurance Agreement. This study is conducted each year. The study focuses on the process and procedure for establishing the resource adequacy (capacity) required to serve customer load with sufficient reserve for reliable service. The results of the Reserve Requirement Study provide key inputs to the PJM Reliability Pricing Model (RPM). These values are used in the RPM auctions and are specifically used to determine the Variable Resource Requirement curve for the PJM Regional Transmission Organization (RTO). The Demand Resource Factor is used to determine the unforced capacity value of the two PJM load management products: Demand Resources that can be offered into the RPM auctions and Interruptible Load for Reliability that is nominated and certified prior to the delivery year. The results of the RRS are also incorporated into PJM s Regional Transmission Expansion Plan (RTEP) process. 3.4 Assets built and planned resulting (directly and indirectly) from scheme itself In a scheme that has been in existence since 1927, all generation and transmission has been developed and renewed under the terms required for interconnection within the scheme. Looking ahead from the present, in the years to 2017, generation is planned to grow by 8% in the Mid-Atlantic region, by 5% in the Western region, and by 9% in the Southern region an overall growth of 7%. Over that period, demand in the PJM region is forecast to grow by about 16%. The necessary generation additions which have been planned to 2017 are illustrated in Figure Based on PJM Reserve Requirements Study, 2008 ; Table 9 in Annex A1 is replicated from the study. 19
 Reliability Standards.")

28 History of scheme Figure 10 Capacity Additions by PJM Region to 2017 Source: PJM (data from Table 9 and Table 7) The transmission upgrades needed to meet demand are all planning driven within a framework of meeting the statutory North American Electric Reliability Council (NERC) Reliability Standards. The PJM Regional Transmission Expansion Plan (RTEP) is managed by the PJM Transmission Expansion Advisory Committee (TEAC) on an ongoing basis. The annual reports are summaries of plans approved in the preceding year. 14 The 2008 Regional Transmission Expansion Plan Report states, More than $13.2 billion of transmission upgrades and additions, representing over 1,400 distinct transmission projects ranging from 69 kv to 765 kv, have been authorized by the PJM Board since the inception of the RTEP process in 1999, through December About $11.3 billion of baseline transmission network upgrades across PJM ensure that established reliability criteria will continue to be met. At the same time, $1.9 billion of additional transmission upgrades will enable the interconnection of more than 45,000 MW of new generating resources and merchant transmission projects. Figure 11 reproduces the current approved reinforcements. 14 See 2008 Regional Transmission Expansion Plan Report 20
 from Possum Point to Salem. It is a 500 kv line estimated to cost $1.4 billion, due in service in 2013.")
29 History of scheme Figure 11 PJM Board-Approved Backbone Transmission Lines, 2008 Source: PJM 2008 Regional Transmission Expansion Plan Report, map 1.2, page 3. The projects considered include the Mid-Atlantic Power Pathway (MAPP) from Possum Point to Salem. It is a 500 kv line estimated to cost $1.4 billion, due in service in There are five other reinforcements planned. 3.5 Interconnections and electricity trade Figure 12 shows the PJM Interconnection LLC high-voltage transmission system. The system is dispatched from the Greensberg and Valley Forge dispatch centers, which work in close cooperation. The entire control area is therefore effectively dispatched as a single integrated system. 21

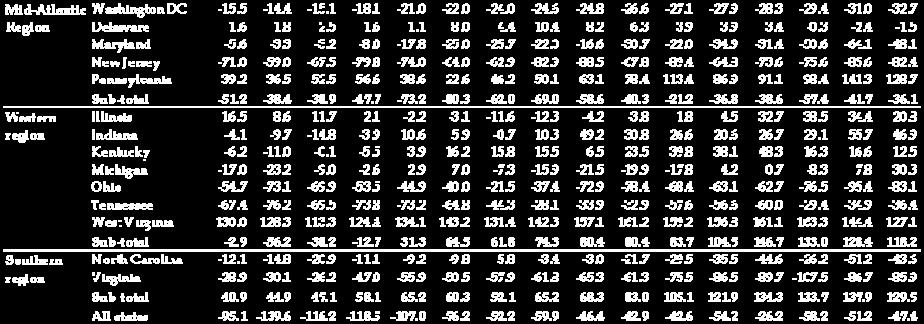
30 History of scheme Figure 12 PJM Backbone Transmission System Source: PJM 2008 Regional Transmission Expansion Plan Report. Figure 13 shows EIA data for net exports by the states in which PJM has a presence. The pattern of inter-regional interchanges has changed considerably over the years, with the Western region becoming a significant exporter. The Southern region, with fast-growing demand, has become a net importer, while the Western region, with slower demand growth, has become a significant power exporter. 22
31 History of scheme Figure 13 Trends in Regional Net Energy Transfers 15 GWh/yr 400, ,000 All Net exports Source: EIA 200, , , , Mid Atlantic region Western region Southern region Figure 14 shows hourly interchanges for typical summer and winter days and Figure 15 shows the monthly pattern of electricity transfer between PJM regions. The data are derived from PJM statistics of day-ahead scheduled interchange. 15 Data for each state are given in Table 10 in Annex A1 23


32 History of scheme Figure 14 Hourly Scheduled Day-Ahead Interchange Source: PJM 24


33 History of scheme Figure 15 Monthly Pattern of Regional Transfer, 2008 Source: PJM The PJM market is essentially a day-ahead clearing market, and this is reflected in the hourly variation of inter-region transfers. 16 The Western region where the surplus generation is found seems to be providing a significant amount of the total seasonal and within-day flexibility that other regions need. However, this is just a part of the overall surplus energy being transferred from the Western region. As a day-ahead market, it cannot effectively support long-term bilateral energy contracts. This problem was resolved in the PJM area soon after the single LPM clearing energy market commenced in The Financial Transfer Rights market commenced operation in In Section 5.1 a description is given of how these work to allow effective long-term bilateral contracts between participants in different regions or control zones. 3.6 Environmental and social issues US environmental policy is implemented at the federal level by the Environmental Protection Agency (EPA). Until 2009, both state and federal environmental policy have been mainly restricted to rules governing pollution levels. Over its history, environmental policy and renewable generation have played a very small role in development in the PJM area. However, in 2009, proposed connections of 48 GW of 16 The PJM data give some transfer information for individual Western region control zones but not for the core PJM area of the Mid-Atlantic region, where all the statistics are presented in amalgamated form. Therefore, this analysis has been restricted to inter-regional transfers. 25
34 History of scheme renewables capacity exceed the 44 GW of proposed connections of nonrenewable capacity. Nearly all proposed renewables are wind farms. If all the proposed renewables capacity is built, it will make a considerable contribution to output, noting that current total installed capacity connected to PJM is 165 GW. 17 PJM is tracking renewable generation contributions and produces what it calls a Dashboard summarizing contributions since It shows that, although hydro is the biggest contributor to renewables generation (7.1 TWh in 2008), wind is the fastest-growing technology. Even so, renewables will not have a significant impact on PJM operations for some time to come, and no significant plans have been made by PJM related to the ensuing reserve and dispatch issues that may arise. 17 Caution is needed in interpreting connection proposals many proposals will not end up being developed. 18 Renewable Energy Dashboard. 26

35 Institutional arrangements 4 Institutional arrangements 4.1 PJM governance arrangements Overview The PJM governance structure has evolved as the nature of the organization has changed. This section describes only the current arrangements. PJM Interconnection LLC is a fully developed independent system operator (ISO) operating across state boundaries and covering the territories of several transmission owners. As a limited liability company incorporated in Delaware, it comes under that state s jurisdiction, but for all practical purposes, it is regulated first by the Federal Energy Regulatory Commission (FERC) and also, for some issues, by the independent state regulatory commissions. The governance structure is set out in, and put into effect by, the Operating Agreement that each market participant must sign. This then gives the market participant voting rights (unless joining as an affiliate or in a limited capacity) on the Members Committee Governance structure Figure 16 PJM Organizational Structure Source: Based on PJM Operating Agreement 27
36 Institutional arrangements PJM s governance structure was set up in such a way as to allow the ISO to have independence from the pressures of market participants in its decision-making process. To achieve independence, PJM relies on a two-tiered structure that includes a fully independent non-stakeholder Board of Governors (the PJM board) and a sectoral Members Committee to provide advisory support. PJM Board The PJM board consists of nine voting members plus the president. It is responsible for maintaining system reliability and creating and maintaining competitive markets which do not allow any member or group of members to exert excessive influence. The PJM board is also in charge of operational matters. Members of the board cannot be affiliated with any party that has signed and is part of the PJM operating agreement. The Members Committee elects board members from a slate of candidates prepared by an independent consultant, not by the PJM members. Members Committee The Members Committee (MC) consists of five sectors, which operate as electoral colleges. A member must decide in which sector its major interests lie (but other members can challenge where they believe that a member is in the wrong sector). The sectors represent the major types of participation: Transmission owners there are currently 58 (15 are voting members and the remainder are affiliates) Generation owners 117 (61 are voting members) Electricity distributors 42 (35 are voting members) End-use customers 26 (14 are voting members) Other suppliers (i.e., traders and others that do not fit into another category) 292 (224 are voting members). 19 The MC reviews and decides upon all major changes and initiatives proposed by committees and user groups and provides advice and recommendations to PJM on all matters relating to: The safe and reliable operation of the PJM grid, The creation and operation of a robust, competitive and nondiscriminatory electric power market, and Ensuring there is no undue influence over PJM s operations by any member or group of members. 19 The Operating Agreement describes other suppliers as traders in energy or capacity products who do not fit into any of the other categories. 28
37 Institutional arrangements The Members Committee meets at least annually. Committees Committees are classified as senior committees and other committees. PJM s two senior committees are the Members Committee (MC) and the Markets and Reliability Committee (MRC). The MC provides advice and recommendations to the PJM board and the Office of the Interconnection on all matters relating to the safe and reliable operation of the PJM Control Area, the creation and operation of a robust, competitive and nondiscriminatory electric power market, and ensuring no undue influence over PJM s operations by any member or group of members. The MRC reports to the MC, as provided in the PJM Operating Agreement. Other PJM committees monitor specific tasks on a continuing basis. These committees report to the senior committees. Members appoint representatives to each committee. Sectors have one vote each on senior standing committees. Secretariat, administration and budget PJM Interconnection has a full-time secretariat known as the Office of the Interconnection. The senior officers are: President, who supervises the Office of the Interconnection and is appointed by the PJM board on an annual contract Secretary Treasurer According to the 2008 financial report, PJM Interconnection had an income of $241 million. PJM has about 600 employees PJM operations Planning PJM operates an ongoing transmission planning function with a rolling 15-year planning horizon. As already noted in Sections 3.3 and 3.4, this is called the Regional Transmission Expansion Plan (RTEP). PJM maintains a standardized planning approach supervised by the Transmission Expansion Advisory Committee (TEAC). This committee reports to the PJM board for investment approvals. The planning methodology is developed by the Regional Planning Process Working Group (RPPWG), which evaluates and makes recommendations to the Members Committee (MC) to reform the present interconnection queue and study process. 29
38 Institutional arrangements Planning is governed by the standards set by the North American Electric Reliability Corporation (NERC). 20 Some additional regional reliability standards may also apply. NERC standards relate to continuity of performance of the interconnected system. This means that there is no economic test governing the cost of any constraint. Therefore, investments are made to ensure that the reliability standards are met and are not driven by price differentials in markets either side of a constraint. Markets PJM operates as an independent neutral operator of distinct electricity markets, with defined market rules. It provides analytical tools to its members as well as trading infrastructure in support of these markets and publishes operational data. This section gives an overview of the markets set up. More details about the operational rules of the markets are given in Section 5.3. The main markets PJM operates are: Day-Ahead Energy Market. This is a forward market in which hourly locational marginal prices (LMPs) are calculated for the next operating day based on generation offers, demand bids and scheduled bilateral transactions. Appended to the Day-Ahead Energy Market are the Operating Reserve Business Rules, which incentivize bidding close to expected real-time operation. Real-Time Energy Market. This is a spot market in which current LMPs are calculated at five-minute intervals based on actual grid operating conditions. Real-time prices are available. PJM settles transactions hourly and issues invoices to market participants monthly. Reliability Pricing Model. This is a capacity market model that works as a market for capacity three years out. It works in conjunction with PJM s Regional Transmission Expansion Planning (RTEP) process. Its features are: Procurement of capacity three years out through a competitive auction; Locational pricing for capacity that reflects constraints in the transmission system. Financial Transmission Rights (FTR) auctions. FTRs are financial instruments that entitle the holder to a stream of revenues (or charges) based on the hourly congestion price differences across a specific transmission path in the Day- Ahead Energy Market. Synchronized Reserve Market. Load-serving entities can meet their obligation to provide synchronized reserve to the grid by using their own generation, by purchasing it under contract with another party or by buying it on the Synchronized Reserve Market. Regulation Market. Load-serving entities can meet their obligation to provide regulation to the grid by using their own generation, by purchasing the required
39 Institutional arrangements regulation under contract with another party or by buying it on the Regulation Market. Transmission services. PJM offers point-to-point firm and non-firm access services for specific bilateral routes from generators to loads. The fees for transmission fund PJM. They are set out in the PJM Open Access Transmission Tariff document. 21 In 2008, PJM further supported market operation by spinning off its market monitoring unit into an independent company called Monitoring Analytics. 22 Dispute resolution procedures PJM has defined dispute resolution procedures set out in Schedule 5 of its Operational Agreement. It includes mediation and arbitration processes. Arbitration decisions will be filed with the Federal Energy Regulatory Commission (FERC). The PJM Operational Agreement is bound by US contract law. 4.2 Role of national governments and regional institutions The US Department of Energy (DOE) is in charge of advancing the national, economic and energy security in the United States ( US federal policy on energy markets has been driven by various energy acts. The most important is possibly the Energy Policy Act of This gave wide powers to the Federal Energy Regulatory Commission (FERC), which has interpreted its role as encouraging the concept of the regional transmission organization (RTO). However, the development of the energy and capacity markets set up by PJM has been driven mainly by its members interests. Individual states continue to have jurisdiction over retail tariffs. 4.3 Regulatory agencies The Federal Energy Regulatory Commission (FERC) was created through the Department of Energy Organization Act in 1977, when the Department of Energy was also established. Its predecessor, the Federal Power Commission, was abolished and its duties divided between FERC and the Energy Department. FERC is an independent agency that regulates the interstate transmission of electricity, natural gas, and oil. FERC s responsibilities with respect to electricity markets include: Regulation of transmission and wholesale sales of electricity in interstate commerce
40 Institutional arrangements Licensing and inspection of private, municipal, and state hydroelectric projects Ensuring reliability of high-voltage interstate transmission system Monitoring and investigating energy markets Using civil penalties and other means against energy organizations and individuals who violate FERC rules in the energy markets Overseeing environmental matters related to natural gas and hydroelectricity projects and major electricity policy initiatives Administering accounting and financial reporting regulations and conduct of regulated companies. In the 1990s, following the Federal Energy Regulatory Commission (FERC) Order 880 that began the deregulation of the traditional utility companies, FERC began to develop the concepts of an independent system operator and a regional transmission organization, which allowed third-party entities to manage functions of the electric grid that were traditionally responsibilities of vertically integrated utility companies. PJM was designated an RTO by FERC in FERC regulates PJM and approves its open access transmission tariff for the wholesale electricity market. FERC is not involved with regulations for retail electricity tariffs, physical construction of electric generation, transmission, or distribution facilities nor the regulation of nuclear power plants (a task governed by the Nuclear Regulatory Commission). 4.4 Role of outside agencies The North American Electric Reliability Council (NERC) is a transnational organization covering the United States as well as utilities in Mexico and Canada. It has no direct effect on trading within the PJM area but sets operational standards with which PJM must comply. There are no other outside agencies of significant relevance to PJM. 32
41 Contractual, financial and pricing arrangements 5 Contractual, financial and pricing arrangements 5.1 Contracts The primary contract governing PJM is the Operating Agreement, which is a civil contract between utilities. This defines membership of the market. However, the governance structure accommodates different types of member interests because there are effectively different types of contracts reflecting the different types of businesses participating in PJM. Energy contracts At the core of PJM is an agreement between mainly integrated utilities with both generation and load in a specific geographic area. The effective energy contract types recognized within the PJM area are: Self-supply. Internal transfer from each utility s own generation to its own loadserving entity (LSE). 23 This accounted for 65.2% of all notified consumption in This is backed up by self-scheduling of a significant proportion of generation (43.1% in 2008). 24 Bilateral contract. This is a transfer of energy between utilities in different zones. Bilateral contracts accounted for 14.6% of energy consumed in Spot sales. Utilities bought 20.1% of their energy requirements through the PJM Day Ahead Energy Market in Pricing in self-supply or bilateral contracts is a private matter between the utilities involved, although the existence of the spot market will affect the pricing decisions made. 26 Capacity contracts generation Load-serving entities (LSEs) have an obligation to provide generation capacity commitments sufficient to meet their share of predicted peak-hour demand. These generation commitments can be sourced from: Own generation resources 23 A load-serving entity delivers energy to consumers. LSEs may be separate businesses but can also be the loadserving function of an integrated utility. 24 Data are based on the Monitoring Analytics 2008 State of the Market Report, Volume 2 The reason why self-scheduling is so much less than self-supply is because some self-supplied capacity must still be offered into the day-ahead spot market if it has been developed with a forward commitment as defined under the PJM Reliability Pricing Model. 25 Small volumes would also have been bought or sold in the real-time market 26 Regulated companies will want their contracts for purchase of energy taken into consideration when setting regulated tariffs but the average wholesale spot prices will be the main benchmark used by the regulator when asked to approve tariffs, especially in the case of self-supply 33
42 Contractual, financial and pricing arrangements Contracts for generation capacity Capacity credits purchased in the capacity credits market. The LSE obligation is locational; the generation must be physically deliverable at the relevant offtake point (i.e., any transmission needed from a remote location must be included in the declared commitment). The PJM capacity credit contract was developed in Part of the planning process involves running the Reliability Pricing Model (RPM), which determines requirements for additional generation capacity (including reserves) and transmission upgrades as well as the locational price differentials that should be applied. Generators offer forward commitments to deliver energy from specific resources in a forward year in one of the following ways: Base residual auctions. These are held in May for delivery in three years time. The capacity sold at auction is allocated to load-serving entities in the form of Financial Transmission Rights with price differentials determined by the RPM. Incremental auctions. Up to three are held in the years between the base residual auction and the delivery year. The first and third incremental auctions cover adjustments to the amount of capacity in the forward commitment due to delays, cancellations or re-rating of the physical resource offered. The second incremental auction covers changes in the locational demand for resources between the base planning year and the delivery year. Bilateral contracts. This market allows generators to procure resources to cover forward commitments made and allows LSEs to hedge against inadequate resource commitments. Additional generation resources and those covered by auctioned forward commitments can be sold in this secondary market. Bilateral contracts can be firm or non-firm. The non-firm contract is one where the seller only offers the capacity during periods where there is no congestion setting a differential energy price on the relevant point-to-point pathway. Capacity contracts transmission Financial Transmission Rights sold as forward commitments are allocated to load-serving entities in proportion to their peak demand levels. FTRs for generation that is not committed forward will also be allocated to LSEs in the same way. An FTR is essentially a right to transfer a certain volume of energy between two physical nodes on the system. As the name implies, this is a financial right rather than a physical right. The value of the FTR is an offset of locational marginal prices derived from the spot market. LMPs are described in Section 5.3. FTRs are tradable in the secondary market. 5.2 Ownership and finance PJM Interconnection LLC is a limited liability company that owns no generation or transmission resources and never takes ownership of any of the energy transferred across the control area. It is a not-for-profit service provider to its members. 34

 and cooperatively owned utilities fail to have a significant impact on retail delivery volumes, although their impact at the very local")
43 Contractual, financial and pricing arrangements The structure of ownership of generation and transmission/distribution assets varies considerably. Figure 17 shows that most energy is distributed and supplied by a small number of integrated utilities in the states in which PJM operates. However, these utilities are predominantly investor-owned. Only in the Mid-Atlantic region are competitive independent providers significant in energy delivery. The large numbers of publicly owned (including federally owned) and cooperatively owned utilities fail to have a significant impact on retail delivery volumes, although their impact at the very local level is significant for the consumers served. The integrated utilities are the main owners of the transmission and distribution infrastructure and will be responsible for all investments in transmission. Figure 17 Ownership Structure of Load-Serving Entities, Source: EIA Table 5 shows generation ownership in the different states. In the Mid-Atlantic region, nearly all the generation is owned by independent producers, but in the other regions, utilities own their own generation to a much greater degree. Therefore, in the Mid-Atlantic region most of the energy will be purchased under bilateral contract or from the spot market rather than by self-supply. It should be noted that the utilities in the Western and Southern regions did not join PJM until 2002 or later. This may be a contributory factor in the differing generation ownership structure in comparison with the more established Mid-Atlantic region. 27 See Annex A4, Table 14 and Table 15 for background data 35


44 Contractual, financial and pricing arrangements Table 5 Sales by Generation Ownership Type, 2007 Source: EIA 5.3 Pricing arrangements Pricing principles Wholesale prices and ancillary service prices should be set by competitive markets that are transparent and well informed. Analytical tools are supplied by PJM to help traders value all products. Generation should recover most of its fixed costs through contracts priced in the energy markets. However, the subsequent development of the Reliability Pricing Model suggests lack of faith in the ability of the market to deliver the required investment in the necessary time frame. One reason why insufficient investment may be forthcoming is that bidding in the day-ahead market is constrained to 10% above cost where congestion applies in order to limit local monopoly power of generation upstream of a transmission constraint. There is a forward market for generation to commit to deliver and this provides some of the revenue for new generation investment. This same mechanism provides revenue for incremental transmission investments. 36
45 Contractual, financial and pricing arrangements The cost of congestion is allocated to the parties who need to import energy across the congested route. However, the Reliability Pricing Model determines the amount and hence the value of extra capacity needed to provide secure operation of the system. The parameters of the model determine how much new generation and transmission capacity is needed, but it seeks to localize the costs of providing that capacity. The Reliability Pricing Model seeks to provide signals for merchant transmission investment but so far such independent investors have been very limited. Fundamentally, PJM operates on the basis of short-run marginal costs and so does not seek to reduce price differentials between regions. The effect of its price signalling mechanism is to incentivize generation close to demand rather than incentivizing additional transit the mechanisms for rewarding such transmission investment are not properly developed. Synapse Energy Economics reports: 28 There has been no significant merchant transmission activity within PJM, demonstrating that market signals alone are inadequate to produce such investments. The reasons for this are well understood. First, the presence of new transmission would reduce or eliminate the congestion costs (price signal) upon which the new transmission would depend, at least in part, to recover its embedded costs. Second, the benefits of such investments in terms of reduced transmission congestion are widely shared, and individual entities are reluctant to shoulder the burden themselves if there is no straightforward mechanism for sharing the cost. PJM mechanisms set wholesale prices. Retail prices are largely regulated and are set by state regulators Pricing mechanisms Energy Energy pricing in PJM is done via the bid-based locational marginal pricing approach. The LMP approach calculates the cost of supplying the next unit of energy at a specific location taking into account generation cost, transmission congestion and losses. Essentially, if there is no transmission congestion, LMP prices should not differ over a given area. LMP pricing is meant to ensure open, transparent and nondiscriminatory transmission of energy. LMP prices are set in the Day-Ahead Energy Market. All generators with capacity available (i.e., capacity not sold outside the PJM region, or as self-supply or under bilateral contract) must offer the capacity into the Day-Ahead Energy Market. Generation capacity that has been sold with a forward commitment contract (as described in Section 5.1) must be offered into the Day-Ahead Energy Market regardless of whether it has been sold under bilateral contract. Load-serving entities can offer demand-side bids into the market but will mainly be nominating the volume of energy they wish to buy in the Day-Ahead Energy Market. Generators are free to set any price for their offers into the Day-Ahead Energy Market and are not constrained by costs. Monitoring Analytics LLC provides an annual market 28 Hausman et al. (2007) 37
46 Contractual, financial and pricing arrangements monitoring report 29 that investigates the extent to which market power may have been exercised in the setting of LMPs by generators. The PJM system operator will then produce a market-clearing, least-cost schedule and will use curtailments on specific generation to assess the contribution of that generation to the marginal cost of serving load at each node. Generators are paid the LMP at their local transmission node, and LSEs pay the LMP at their local transmission node. PJM s system operators conduct dispatch operations and monitor the status of the grid using telemetered data from nearly 74,000 reporting sites. PJM prepares extensive emergency and routine contingency scenarios, taking into account variables that could affect supply and demand such as weather conditions and emergency situations as well as the potential of equipment failures along with daily and seasonal demand fluctuations. Capacity pricing With the energy market setting locational marginal prices, Financial Transmission Rights are made available for load-serving entities (LSE) to hedge the fluctuating cost of spot energy. FTRs are initially allocated to LSEs based on an assessment of peak demand, but they are tradable. The initial cost of an FTR is derived from sales in the auctions for forward commitments, but their value will be derived from the differential in LMP set for the node where the generation is injected into the system compared to the LMP set for the node where the demand is offtaken. Although there are option products on offer, the FTR financial flows are derived from the price differential between nodes regardless of the direction of energy flow. Therefore, a party holding an FTR for a particular delivery route from Node A to Node B can pay a penalty if the LMP at Node A is higher than the LMP at Node B. FTRs are paid out or charged out regardless of whether energy has flowed under contract along the nodal route of the FTR. Ancillary services PJM Interconnection also currently operates two markets for ancillary services: Synchronized reserves. This service supplies electricity if the grid has an unexpected need for more power on short notice. The power output of generating units supplying synchronized reserve can be increased quickly; demand resources can also bid to supply synchronized reserve by reducing their energy use on short notice. Load-serving entities can meet their obligation to provide synchronized reserve to the grid by using their own generation, by purchasing it under contract with another party, or by buying it on the Synchronized Reserve Market. Regulation. This service corrects for short-term changes in electricity use that might affect the stability of the power system. It helps match generation and 29 Monitoring Analytics (2008b) 38
47 Contractual, financial and pricing arrangements load and adjusts generation output to maintain the desired frequency. Loadserving entities can meet their obligation to provide regulation to the grid by using their own generation, by purchasing the required regulation under contract with another party or by buying it on the Regulation Market. 39
48 Future plans 6 Future plans PJM is essentially a service provider to its members. Its growth and longevity are testimony to the services provided being useful to its members. As a service provider, it seeks to incrementally provide new tools and markets in which they can trade. The development of new markets and risk management tools make PJM the most sophisticated electricity trading market anywhere in the world. The most significant recent development has been the Reliability Pricing Model (RPM), which links into PJM s regulatory obligation to plan and invest for future needs for reliable transmission and generation services. It satisfies this requirement by auctioning forward commitments to develop new facilities. However, it should be noted that the locational marginal pricing market that began operation in 1998 was intended to provide full incentives for investment in transmission, generation and demand-side response. The Financial Transmission Rights market that was introduced two years later effectively quantified the value of locational signals. 30 The introduction of the RPM signalled a belief that insufficient investment signals would come from the short-run energy market alone. PJM has periodically expanded its membership since its inception. This fits into plans by FERC to develop a network of large regional transmission organizations to replace stateintegrated utilities. Currently, PJM is one of the five RTOs. For individual states, transmission should be operated by an independent system operator (ISO) according to the intentions of the Federal Energy Regulatory Commission (FERC). There are currently two ISOs. PJM has been in discussion with the Midwest Independent Transmission System Operator (MISO) 31 and the New York Independent System Operator (NYISO) about amalgamating markets. There is no doubt that PJM offers a service valued by its member utilities. However, it is not designed to equalize pricing between utility areas. During times of economic hardship, this could be seen as a defect by politicians who may be loath to allow what they might perceive as excess profits flowing to monopoly businesses in local areas. This will limit the ability of future utilities to participate in PJM. Going forward, the continuing challenges to PJM will include: Meeting future changes in federal energy policy. The new presidency has ambitions to develop renewables and put more emphasis on conservation measures. Operation of a grid in which large volumes of wind are dispatched will put strains on existing market mechanisms, which rely on the system operator to provide physical balancing and to allocate costs of doing so fairly generally. More precise balancing incentives may be needed in the future. Socialization of transmission investment costs. It seems clear that reliance on short-run locational marginal cost signals means that price differentials will 30 Locational marginal prices provide a single spot price covering both energy and locational generation and transmission costs. 31 Despite its name, this should be classed as an RTO. 40
49 Future plans persist. The mechanism for rewarding specific transmission investments seems to be inadequate. The rewards for generators in low-cost regions selling to consumers in high-cost regions are not therefore being fully realized by those generators. Outside of PJM s role as a wholesale transmission services provider is the development of retail competition. This is a challenge for regulation in the USA. The focus of competition policy has hitherto been driven by utilities that have little interest in allowing competing retailers within their delivery areas. 41
50 Bibliography Bibliography Hausman, Ezra, Robert Fagan, David White, Kenji Takahashi, and Alice Napoleon (2007): LMP Electricity Markets: Market Operations, Market Power, and Value for Consumers. Cambridge, MA: Synapse Energy Economics. Marshall, G. & DiCicco, F. (2005): GIS Applied to PJM s Transmission System. Monitoring Analytics (2008a): 2008 State of the Market Report for PJM. Vol Monitoring Analytics (2008b): 2008 State of the Market Report for PJM. Vol Monitoring Analytics (2009): State of the PJM Market Quarter 1, Presentation. et_monitoring_report_20091q.pdf PJM: 2008 Annual Report. annual-report.ashx PJM: 2008 Financial Report. financial-report.ashx PJM: 2008 Regional Transmission Expansion Plan Report. PJM: Amended and Restated Operating Agreement of PJM Interconnection, L.L.C. The PJM Operating Agreement governs how PJM operates. Members sign this agreement to be a part of PJM. PJM: By-Laws of PJM Interconnection, L.L.C. The PJM Bylaws, which are subordinate to the PJM Operating Agreement, include more detailed requirements of the governance and operation of the company; including, for example: composition of the PJM Board of Managers; frequency of Board meetings; standing PJM committees; and appointment of the company's officers. PJM: Consolidated Transmission Owners Agreement. Rate Schedule FERC No x PJM: Load Forecast Report, Data 42
51 Bibliography PJM: Mid-Atlantic Power Pathway (MAPP). PJM: PJM Manuals. The PJM manuals are the administrative, planning, operating and accounting procedures of the PJM Interconnection and are available below in PDF format. The previous version of each manual is also posted below for comparison of the changes that occurred between the current and prior version of the manual. Some that have been used in this study are located at: PJM: PJM Open Access Transmission Tariff. hx This Federal Energy Regulatory Commission approved document governs the operations of PJM PJM: Reliability Assurance Agreement Among Load Serving Entities in the PJM Region. x PJM: Renewable Energy Dashboard. PJM: Reserve Requirement Study, Slocum, Tyson (2008, October): The failure of electricity deregulation: History status and Needed Reforms. 43
52 Electricity supply A1 Electricity supply As of December 2008, about 164,895 MW of generating capacity was available for dispatch in the area covered by PJM. Table 6 shows the capacity breakdown by fuel type as of 31 December All-time peak demand occurred in the summer of 2006: 144,644 MW. Peak demand has decreased to 139,428 MW in 2007 and 130,100 MW in The reserve margin as of summer 2008 was 26% with reserve capacity of 34,079 MW. Table 6 PJM Installed Capacity by Fuel Source Fuel MW Percent Coal 67, % Oil 10, % Gas 48, % Nuclear 30, % Solid waste % Hydroelectric 7, % Wind % Total 164, % Source: Monitoring Analytics (2008b), p. 156 Table 7 shows the capacity as of 2008 broken down by utility control zone. The total figure reported by PJM does not exactly correspond with the figure given in Table 6. Table 8 shows generated energy distributed by fuel source for the year


53 Electricity supply Table 7 PJM Installed Capacity by Zone and Fuel Source Source: State of the Market Report for PJM: Energy Market Volume 2, 2008, p
, p.")
54 Electricity supply Table 8 PJM Generation by Fuel Source Fuel GWh Percent Coal 404, % Oil 1, % Gas 53, % Nuclear 254, % Solid Waste 5, % Hydroelectric 12, % Wind 3, % Total 735, % Source: Monitoring Analytics (2008b), p. 157 Table 9 New and Retiring Generation Within PJM RTO, Source: PJM, Reserve Requirement Study 2008, Table II-8, p


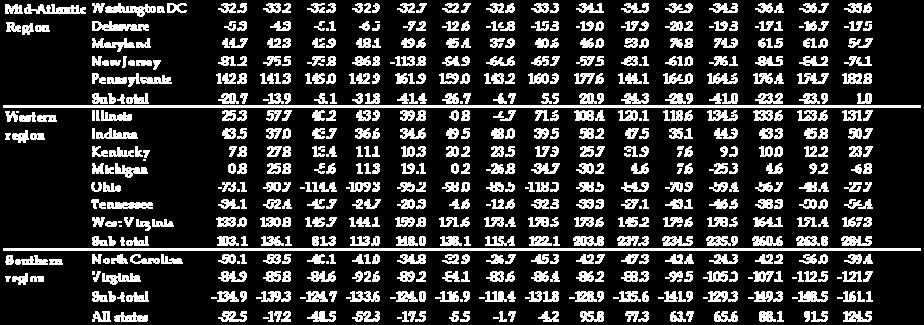
55 Electricity supply Table 10 Net Exports by US State, TWh Source: EIA 47
56 Electricity demand A2 Electricity demand Table 11 is derived from the PJM Load Forecast Report, A regions map was given in Figure 1 on page 4. The zones are defined in the Reliability Assurance Agreement. 33 Table 11 PJM Regions and Zones Region Utility Abbreviation Mid-Atlantic Atlantic Electric Baltimore Gas & Electric Delmarva Power & Light Jersey Central Power & Light Metropolitan Edison PECO Energy Pennsylvania Electric Company Potomac Electric Power PPL Electric Utilities Public Service Electric & Gas Rockland Electric (East) UGI Utilities AECO BGE DPL JCPL METED PECO PENELEC PEPCO PPL PSEG RECO UGI Western American Electric Power Allegheny Power Commonwealth Edison Dayton Power & Light Duquesne Lighting Company AEP APS COMED DAY DLCO Southern Dominion DOM Source: PJM, Load Forecast Report, Report: Data:


57 Electricity demand Table 12 PJM Annual Load Forecasts by Zone Source: PJM, Load Forecast Report,
58 Prices A3 Prices Table 13 Day-Ahead Load Weighted LMP State Year 2007 ($/MWh) Year 2008 ($/MWh) Difference ($/MWh) Difference as Percentage of 2007 Delaware $65.99 $82.99 $ % Illinois $47.27 $53.83 $ % Indiana $48.26 $56.53 $ % Kentucky $48.09 $56.02 $ % Maryland $70.07 $85.98 $ % Michigan $48.73 $57.83 $ % New Jersey $68.25 $86.39 $ % North Carolina $65.10 $78.13 $ % Ohio $47.43 $55.72 $ % Pennsylvania $60.10 $73.58 $ % Tennessee $49.30 $56.50 $ % Virginia $65.42 $78.63 $ % West Virginia $49.33 $57.56 $ % District of Columbia Source: Market Analytics (2008a), p.70 $70.08 $85.66 $ % 50


59 Contracts A4 Contracts Table 14 Number of Utilities by Ownership Type, 2007 Source: EIA 51

 Source:")
60 Contracts Table 15 Sales of Utilities by Ownership Type, 2007 (GWh) Source: EIA 52
During 2009, the PJM geographic footprint encompassed 17 control zones located in Delaware,
 SECTION SECTION SECTION SECTION SECTION SECTION VOLUME SECTION 1 2 3 4 5 6 7 8 A B PJM GEOGRAPHY C D E F G Tennessee, Virginia, West Virginia and the District of Columbia. Figure A-1 PJM s footprint and
PJM Organization and Markets. Saudi Delegation Columbus Ohio May 22, 2012
 PJM Organization and Markets Saudi Delegation Columbus Ohio May 22, 2012 Agenda Introduction & Governance Energy Markets LMP FTRs/ARRs Two Settlement Virtual Bids Ancillary Capacity - Reliability Pricing
Definitions O - P. Open Access Same-Time Information System (OASIS) or PJM Open Access Same-time Information System:
 or PJM Open Access Same-time Information System:") Definitions O - P Offer Data: Offer Data shall mean the scheduling, operations planning, dispatch, new resource, and other data and information necessary to schedule and dispatch generation resources and
Definitions O - P Offer Data: Offer Data shall mean the scheduling, operations planning, dispatch, new resource, and other data and information necessary to schedule and dispatch generation resources and
2006 State of the Market Report. Volume I: Introduction
 2006 State of the Market Report Volume I: Introduction Market Monitoring Unit March 8, 2007 2006 State of the Market Report Preface The Market Monitoring Unit of PJM Interconnection publishes an annual
Load Management Performance Report 2015/2016
 Load Management Performance Report 2015/2016 August 2016 PJM has made all efforts possible to accurately document all information in this report. However, PJM cannot warrant or guarantee that the information
BACKGROUNDER on the first fully functioning regional transmission organization in the United States: PJM Interconnection
 BACKGROUNDER on the first fully functioning regional transmission organization in the United States: PJM Interconnection The Transmission and Delivery of Electricity Electricity transmission refers to
Integrating Renewables
 Integrating Renewables The National RPS Summit Portland, OR October 22, 2010 Timothy C. Burdis Strategist PJM as Part of the Eastern Interconnection 6,038 substations KEY STATISTICS PJM member companies
Workshop H. PJM Basics: An Introduction to PJM Interconnection and How its Energy and Capacity Markets Operate
 Workshop H PJM Basics: An Introduction to PJM Interconnection and How its Energy and Capacity Markets Operate Tuesday, February 19, 2019 1:45 p.m. to 3 p.m. Biographical Information Adam J. Keech, Executive
Load Management Performance Report 2017/2018. (mid Delivery Year update)
") Load Management Performance Report 2017/2018 (mid Delivery Year update) January 2018 PJM has made all efforts possible to accurately document all information in this report. However, PJM cannot warrant
Load Management Performance Report 2017/2018 (mid Delivery Year update) January 2018 PJM has made all efforts possible to accurately document all information in this report. However, PJM cannot warrant
BEFORE THE NEW JERSEY BOARD OF PUBLIC UTILITIES
 EXHIBIT JC- BEFORE THE NEW JERSEY BOARD OF PUBLIC UTILITIES IN THE MATTER OF THE PETITION OF JERSEY CENTRAL POWER & LIGHT COMPANY PURSUANT TO N.J.S.A. 0:D-1 FOR A DETERMINATION THAT THE MONTVILLE - WHIPPANY
CURRENT FEDERAL AND REGIONAL ELECTRIC POLICY ISSUES FOR THE ILLINOIS COMMERCE COMMISSION
 CURRENT FEDERAL AND REGIONAL ELECTRIC POLICY ISSUES FOR THE ILLINOIS COMMERCE COMMISSION Randy Rismiller Manager, Federal Energy Program Illinois Commerce Commission 1 THE FEDERAL ENERGY REGULATORY COMMISSION
2007 State of the Market Report
 Volume 2: Detailed Analysis Market Monitoring Unit March 11, 2008 printed: 04/24/08 Preface The Market Monitoring Unit of PJM Interconnection publishes an annual state of the market report that assesses
OVERVIEW OF REGIONAL ELECTRICITY MARKET INITIATIVES IN THE U.S.
 OVERVIEW OF REGIONAL ELECTRICITY MARKET INITIATIVES IN THE U.S. Hon. Wendell F. Holland Chairman Pennsylvania Public Utility Commission Dr. Rajnish Barua Executive Director Organization of PJM States,
PJM Manual 18: PJM Capacity Market Revision: 38 Effective Date: July 27, Prepared by Capacity Market Operations
 PJM Manual 18: PJM Capacity Market Revision: 38 Effective Date: July 27, 2017 Prepared by Capacity Market Operations PJM 2017 Table of Contents Table of Contents Table of Exhibits...9 Approval...10 Current
Overview. Net Revenue
 2009 Quarterly State of the Market Report for PJM: January through June Section 3 Energy Market, Part 2 The Market Monitoring Unit (MMU) analyzed measures of PJM Energy Market structure, participant conduct
P E R S P E C T I V E S
 3 PERSPECTIVES Reliability Economy Environment > 81,000 MILES of transmission lines 15 -YEAR LONG-TERM HORIZON + Collaboration with over 960 members IMPACTS 61+ million people 13 STATES 2016 RTEP PROCESS
2007 State of the Market Report. Volume 1: INTRODUCTION
 2007 State of the Market Report Volume 1: NTRODUCTON Market Monitoring Unit March 11, 2008 2007 State of the Market Report Preface The Market Monitoring Unit of PJM nterconnection publishes an annual
Recent Development in Reliable Energy Market in the US and Singapore
 Recent Development in Reliable Energy Market in the US and Singapore 18-19 th June 2008 Electrical Engineering and Maintenance Forum World Engineering Congress, Bangkok, Thailand Dr. Panida Jirutitijaroen
What is a Capacity Market?
 What is a Capacity Market? Mechanism that ensures sufficient generation to meet reliability and peak load needs. Additional potential benefit of capacity markets is the incentive to build new generation.
Congestion and Marginal Losses
 Section 11 Congestion and Marginal Losses Congestion and Marginal Losses The locational marginal price (LMP) is the incremental price of energy at a bus. The LMP at a bus is the sum of three components:
FirstEnergy Solutions Energy Market Update AEE Meeting March 20, John Ogurchak PE/CEM Manager, Commercial/Industrial Energy Sales
 FirstEnergy Solutions Energy Market Update AEE Meeting John Ogurchak PE/CEM Manager, Commercial/Industrial Energy Sales FirstEnergy Solutions Corp. (FES) Retail subsidiary of FirstEnergy Corp. and headquartered
2013/2014 RPM Base Residual Auction Results
 Executive Summary The 2013/2014 Reliability Pricing Model (RPM) Base Residual Auction (BRA) cleared 152,743.3 MW of unforced capacity in the RTO at a Resource Clearing Price of $27.73/MW-day. This MW and
2013 RTEP Input. Data, Assumptions and Scope. June 18, 2013
 2013 RTEP Input Data, Assumptions and Scope June 18, 2013 Preface Preface This white paper is the first in a series that PJM intends to publish throughout the 2013 RTEP process as a vehicle to communicate
Re: PJM Interconnection, L.L.C. Docket Nos. ER , ER , ER Settlement Compliance Filing
 Sebrina M. Greene Rockland Electric Company 4 Irving Place, 1875-S, New York, NY 10003 Tel.: 212-460-3228 Email: greenes@coned.com SUBMITTED VIA ELECTRONIC FILING December 28, 2017 Hon. Kimberly D. Bose
SECTION 6 - ANCILLARY SERVICE MARKETS
 2010 Quarterly State of the Market Report for PJM: January through March ANCILLARY SERVICES 6 SECTION SECTION 6 - ANCILLARY SERVICE MARKETS The United States Federal Energy Regulatory Commission (FERC)
PJM Manual 18: PJM Capacity Market. Revision: 14 Effective Date: February 23, Prepared by PJM Capacity Market Operations PJM 2012
 PJM Manual 18: PJM Capacity Market Revision: 14 Effective Date: February 23, 2012 Prepared by PJM Capacity Market Operations PJM 2012 PJM 2012 i Table of Contents PJM Manual 18: PJM Capacity Market Table
APPENDIX C ENERGY MARKET
 C C ENERGY MARKET Frequency Distribution of LMP Figure C-1, Figure C-2, Figure C-3, Figure C-4, Figure C-5, Figure C-6, Figure C-7 and Figure C-8 provide frequency distributions of real-time locational
THE AEP INTERSTATE PROJECT FAQs
 THE AEP INTERSTATE PROJECT FAQs What is the AEP Interstate Project? The proposed AEP Interstate Project consists of a 765 kilovolt (kv) line connecting AEP s Amos 765 kv station to Allegheny Power s Doubs
Competitive Markets 1
 Competitive Markets 1 Why Regulation? Electric service has historically been considered a monopoly service The provision of electric service traditionally required huge investments in infrastructure Electricity
Key Issues and Consideration in Market Design, Operational and Oversight
 Key Issues and Consideration in Market Design, Operational and Oversight Patrick Donlon Amanda Gordon Kathryn Sophy Kenneth Villwock Public Utilities Commission of Ohio & Pennsylvania Public Utilities
Competitive Markets. Facilitated Dialogue: Market Restructuring & Renewable Energy. June 10-12, 2013 Mexico City, Mexico. Hisham Choueiki, Ph.D., P.E.
 Competitive Markets Facilitated Dialogue: Market Restructuring & Renewable Energy June 10-12, 2013 Mexico City, Mexico Hisham Choueiki, Ph.D., P.E. Department of Energy and Environment Public Utilities
Energy Markets - The Basics
 Disclaimer This training presentation is provided as a reference for preparing for the PJM Certification Exam. Note that the following information may not reflect current PJM rules and operating procedures.
Illinois State Institute for Regulatory Policy Studies Conference
 Illinois State Institute for Regulatory Policy Studies Conference Rob Berntsen 10/20/2011 Overview MISO RTOs What We Do FERC Order 1000 MISO s View of FERC Order 1000 MISO s Planning Process MVPs Benefits
PJM Manual 18: PJM Capacity Market. Revision: 287 Effective Date: January 22, Prepared by PJM Capacity Market Operations
 Style Definition: PJM_Normal PJM Manual 18: PJM Capacity Market Revision: 287 Effective Date: January 22, 2015 Prepared by PJM Capacity Market Operations PJM 2015 PJM 2015 i PJM Manual 18: PJM Capacity
The Year to Date in PJM: Operations and Markets
 The Year to Date in PJM: Operations and Markets Kerry Stroup Manager, State Government Policy PJM Interconnection OMA Energy Committee July 30, 2014 OMA Energy Committee Presentation Outline PJM s mission:
Ancillary Service Markets
 Section 9 Ancillary Services Ancillary Service Markets The United States Federal Energy Regulatory Commission (FERC) defined six ancillary services in Order No. 888: 1) scheduling, system control and dispatch;
Congestion and Marginal Losses
 Section 10 Congestion and Marginal Losses Congestion and Marginal Losses The Locational Marginal Price (LMP) is the incremental price of energy at a bus. The LMP at any bus is made up of three components:
PJM White Paper. Transource Independence Energy Connection Market Efficiency Project
 PJM White Paper PJM Interconnection November 15, 2018 This page is intentionally left blank. PJM 2018 www.pjm.com i P a g e Contents Highlights... 1 Executive Summary... 1 I. Introduction... 2 Reliability
PJM Overview: PJM Structure and Cross-Border Examples PJM 2010
 PJM Overview: PJM Structure and Cross-Border Examples 1 PJM as Part of the Eastern Interconnection 6,038 substations KEY STATISTICS PJM member companies 614 millions of people served 51 peak load in megawatts
Congestion and Marginal Losses
 Section 11 Congestion and Marginal Losses Congestion and Marginal Losses The locational marginal price (LMP) is the incremental price of energy at a bus. The LMP at a bus is made up of three components:
Market Monitoring Dr. Robert Sinclair Georgian Energy Policy Delegation
 Market Monitoring Presented by: Dr. Robert Sinclair Presented to: Georgian Energy Policy Delegation April 30, 2012 Kentucky Public Service Commission Potomac Economics Potomac Economics is a leading provider
2013 SERTP Study Scope Document --DRAFT-- 04/19/2013
 Purpose of Study The purpose of this study is to assess potential constraints on the transmission systems of the participating transmission owners for the five economic planning studies as identified by
Current Language Proposed Revisions Rationale
 1. RAA, Schedule 8.1, Paragraph H (Annexation of service territory by Public Power Entity) 2. In the event a Public Power Entity that is an FRR Entity annexes service territory to include load from a Party
INDEPENDENT SYSTEM OPERATORS (VI + Access Rules vs. ISO vs. ITSO)
") INDEPENDENT SYSTEM OPERATORS (VI + Access Rules vs. ISO vs. ITSO) Paul L. Joskow September 28, 2007 ALTERNATIVE SYSTEM OPERATOR MODELS System operator (SO) is vertically integrated utility (G+T) Functional
INDEPENDENT SYSTEM OPERATORS (VI + Access Rules vs. ISO vs. ITSO) Paul L. Joskow September 28, 2007 ALTERNATIVE SYSTEM OPERATOR MODELS System operator (SO) is vertically integrated utility (G+T) Functional
Demand Response. Overview. Recommendations
 Section 6 Demand Response Demand Response Markets require both a supply side and a demand side to function effectively. The demand side of wholesale electricity markets is underdeveloped. Wholesale power
The Evolution of the PJM Market in the United States: Looking Back to Look Forward
 The Evolution of the PJM Market in the United States: Looking Back to Look Forward Feasibility Study for ASEAN Multilateral Power Trade September 5-6, 2018 Jakarta, Indonesia Craig Glazer Vice President
PJM Wholesale Markets. Hisham Choueiki, Ph.D., P.E. Ohio PUC Staff October 20-24, 2014 Tbilisi, Georgia
 PJM Wholesale Markets Hisham Choueiki, Ph.D., P.E. Ohio PUC Staff October 20-24, 2014 Tbilisi, Georgia PJM RTO Functions Grid Operation Non-discriminatory treatment Monitoring transmission system Reliability
Energy Uplift (Operating Reserves)
") Section 4 Energy Uplift Energy Uplift (Operating Reserves) Energy uplift is paid to market participants under specified conditions in order to ensure that resources are not required to operate for the
Section 4 Energy Uplift Energy Uplift (Operating Reserves) Energy uplift is paid to market participants under specified conditions in order to ensure that resources are not required to operate for the
MARKET EFFICIENCY STUDY PROCESS AND PROJECT EVALUATION TRAINING
 MARKET EFFICIENCY STUDY PROCESS AND PROJECT EVALUATION TRAINING December 22, 2014 Training Objectives To Provide an Overview of: The Market Efficiency proposal window process The critical modeling inputs
Technical Assistance between ERERA, WAGPA, NARUC, and OPSI Activity No. 2; Abuja, Nigeria June Overview of OPSI
 Technical Assistance between ERERA, WAGPA, NARUC, and OPSI Activity No. 2; Abuja, Nigeria 21-23 June 2011 Overview of OPSI Dr. Rajnish Barua Executive Director OPSI Overview of Presentation 2 Description
SECTION 2 Energy Market, Part 1
 2009 Quarterly State of the Market Report for PJM: January through June SECTION 2 Energy Market, Part 1 The PJM Energy Market comprises all types of energy transactions, including the sale or purchase
SECTION 2 ENERGY MARKET, PART 1
 009 State of the Market Report for PJM ENERGY MARKET, PART 1 ENERGY MARKET, PART 1 The PJM Energy Market comprises all types of energy transactions, including the sale or purchase of energy in PJM s Day-Ahead
Section 5: Network Integration Transmission Service Accounting. 5.1 Network Integration Transmission Service Accounting Overview
 Section 5: Network Integration Transmission Service Accounting Welcome to the Network Integration Transmission Service Accounting section of the PJM Manual for Open Access Transmission Tariff Accounting.
Agenda. PJM Fuel Security Briefing. The National Press Club th St. NW, 13th Floor Washington, DC Nov. 1, 2018, 10:30 a.m.
 Agenda PJM Fuel Security Briefing The National Press Club 529 14th St. NW, 13th Floor Washington, DC 20045 Nov. 1, 2018, 10:30 a.m. Agenda and Speakers 1. Introduction, 10:30-10:35 a.m. Susan Buehler,
PJM Manual 29: Billing. Revision: 26 Effective Date: 11/20/2014. Prepared by Market Settlements Department
 PJM Manual 29: Billing Revision: 26 Effective Date: 11/20/2014 Prepared by Market Settlements Department PJM 2012 Table of Contents PJM Manual 29: Billing Table of Contents Table of Contents... ii Approval...
3.3.1 Cost of New Entry
 Section 3: Demand in Reliability Price Model 3.3.1 Cost of New Entry The value for Cost of New Entry (CONE) (in ICAP terms) is determined in accordance with Attachment DD of the Open Access Transmission
PJM Manual 18: PJM Capacity Market
 PJM Manual 18: PJM Capacity Market Revision: 23 Effective Date: June 1, 2014 Prepared by PJM Capacity Market Operations PJM 2014 PJM 2014 i PJM Manual 18: PJM Capacity Market Manual 18: PJM Capacity Market
Energy Uplift (Operating Reserves)
") Section 4 Energy Uplift Energy Uplift (Operating Reserves) Energy uplift is paid to market participants under specified conditions in order to ensure that resources are not required to operate for the
Section 4 Energy Uplift Energy Uplift (Operating Reserves) Energy uplift is paid to market participants under specified conditions in order to ensure that resources are not required to operate for the
Federal Energy Regulatory Commission/RTO Training Session
 Federal Energy Regulatory Commission/RTO Training Session Scott H. Strauss Jeffrey A. Schwarz Institute for Policy Integrity NYU Law School June 2011 Agenda FERC -- Who and what is it? History of FERC
PJM Manual 29: Billing. Revision: 23 Effective Date: January 1, Prepared by Strategic Market Services Department
 PJM Manual 29: Billing Revision: 23 Effective Date: January 1, 2012 Prepared by Strategic Market Services Department PJM 2012 Table of Contents PJM Manual 29: Billing Table of Contents Table of Contents...
Regional Transmission Organizations. D. William VanderLaan Illinois Commerce Commission January 30, 2014
 Regional Transmission Organizations D. William VanderLaan Illinois Commerce Commission January 30, 2014 History of Regional Transmission Organizations (RTOs) RTOs grew out of FERC Order Nos. 888/889 where
2010 RTO Metrics Report: NESCOE Data Summary
 New England States Committee on Electricity NESCOE Phone: 23-38-1477 E-Mail: AllisonSmith@nescoe.com Web: www.nescoe.com 21 RTO Metrics Report: NESCOE Data Summary Allison Smith ABSTRACT Summary of comparative
U. S. SPOT MARKET REGULATION
 U. S. SPOT MARKET REGULATION NARUC ENERGY REGULATORY PARTNERSHIP WITH GEORGIAN NATIONAL ENERGY AND WATER SUPPLY REGULATORY COMMISSION & MICHIGAN PUBLIC SERVICE COMMISSION TBILISI, GEORGIA November 30,
Wholesale Electricity Markets. New England Independent System Operator. Commissioner Mark Vannoy Maine Public Utilities Commission
 Wholesale Electricity Markets and New England Independent System Operator Commissioner Mark Vannoy Maine Public Utilities Commission March 26, 2014 Overview and Background 2 Wholesale Electricity Markets
Congestion and Marginal Losses
 Section 10 Congestion and Marginal Losses Congestion and Marginal Losses The Locational Marginal Price (LMP) is the incremental price of energy at a bus. The LMP at a bus is made up of three components:
Committed Offer: Offer on which a resource was scheduled by the Office of the Interconnection for a particular clock hour for the Operating Day.
 Proposed Tariff Revisions Attachment K-Appendix and Schedule 1 of the Operating Agreement Generator Offer Flexibility Senior Task Force Revisions Related To Make-Whole and Lost Opportunity Cost Payments
Energy Market. Highlights
 Section 2 Energy Market Energy Market The PJM Energy Market comprises all types of energy transactions, including the sale or purchase of energy in PJM s Day-Ahead and Real-Time Energy Markets, bilateral
New England Power Sector Overview
 USAID/NARUC East Africa Regional Regulatory Partnership Exchange: New England Power Sector Overview Andrew Greene Massachusetts Dept. of Public Utilities Energy Facilities Siting Board Dar es Salaam, Tanzania
2018 PJM RESERVE REQUIREMENT STUDY - DETERMINATION OF THE PJM INSTALLED RESERVE MARGIN AND FORECAST POOL REQUIREMENT FOR FUTURE DELIVERY YEARS
 2750 Monroe Blvd. Audubon, PA 19403 May 3, 2018 PLANNING COMMITTEE Dear Committee Members: 2018 PJM RESERVE REQUIREMENT STUDY - DETERMINATION OF THE PJM INSTALLED RESERVE MARGIN AND FORECAST POOL REQUIREMENT
PJM Manual 27: Open Access Transmission Tariff Accounting Revision: 88 Effective Date: November 16, 2017
 PJM Manual 27: Open Access Transmission Tariff Accounting Revision: 88 Effective Date: November 16, 2017 Prepared by Market Settlements Development Department PJM 2017 Table of Contents Table of Contents
Ohio Energy. Workshop O. PJM 201 A Deeper Dive Into the Regional Electricity Market Operated by PJM and How Electricity Prices Are Impacted
 Ohio Energy Workshop O PJM 201 A Deeper Dive Into the Regional Electricity Market Operated by PJM and How Electricity Prices Are Impacted Tuesday, February 21, 2017 3:15 p.m. to 4:30 p.m. Biographical
Overview of PJM: Looking Back to Look Forward Tokyo Power Market Summit
 Overview of PJM: Looking Back to Look Forward Tokyo Power Market Summit Craig Glazer Vice President, Federal Government Policy PJM Interconnection June, 2018 Topics 1. PJM Overview 2. Evolution of PJM
Section 3 Characteristics of Credits Types of units. Economic Noneconomic Generation.
 Section 3 Operating Reserve Operating Reserve Day-ahead and real-time operating reserve credits are paid to market participants under specified conditions in order to ensure that resources are not required
Ancillary Service Markets
 Section 9 Ancillary Services Ancillary Service Markets The United States Federal Energy Regulatory Commission (FERC) defined six ancillary services in Order No. 888: 1) scheduling, system control and dispatch;
Market Monitor Report
 Market Monitor Report MC Webinar February 19, 2019 Joe Bowring PJM Load 2019 www.monitoringanalytics.com 2 180,000 170,000 RT Monthly Average Hourly Load 2017 2018 160,000 150,000 140,000 Demand (MWh)
An Introduction to PJM: Focus on its Markets and Opportunities for Demand Resources OHA Annual Energy & Sustainability Conference
 An Introduction to PJM: Focus on its Markets and Opportunities for Demand Resources OHA Annual Energy & Sustainability Conference Andrew Ott Sr. Vice President, Markets March 5, 2013 26% of power generation
Overview of the IESO- Administered Markets. IESO Training
 Overview of the IESO- Administered Markets IESO Training July 2017 Overview of the IESO-Administered Markets AN IESO TRAINING PUBLICATION This guide has been prepared to assist in the IESO training of
PJM Manual 29: Billing Revision: 28 Effective Date: April 1, Prepared by Market Settlements Department
 PJM Manual 29: Billing Revision: 28 Effective Date: April 1, 2018 Prepared by Market Settlements Department PJM 2018 Table of Contents Table of Contents Approval...3 Current Revision...4 Introduction...
Electric Power Outlook for Pennsylvania
 Electric Power Outlook for Pennsylvania 2007 2012 August 2008 Published annually by the Pennsylvania Public Utility Commission P.O. Box 3265, Harrisburg, PA 17105-3265 www.puc.state.pa.us Prepared by:
ATTACHMENT DD. Reliability Pricing Model
 OF NEW SERVICE REQUESTS; R - OATT ATTACHMENT DD ATTACHMENT DD Reliability Pricing Model References to section numbers in this Attachment DD refer to sections of this Attachment DD, unless otherwise specified.
SPP at a Glance. Located in Little Rock. Approximately 600 employees
 SPP at a Glance Located in Little Rock Approximately 600 employees Primary jobs electrical engineering, operations, settlements, and IT 24 x 7 operation Full redundancy and backup site 2 Regulatory Environment
EPA s Clean Power Plan Proposal Review of PJM Analyses Preliminary Results
 EPA s Clean Power Plan Proposal Review of PJM Analyses Preliminary Results Paul Sotkiewicz Chief Economist Muhsin Abdur-Rahman Senior Engineer, Market Simulation Members Committee Webinar November 17,
2750 Monroe Blvd Audubon, PA
 2750 Monroe Blvd Audubon, PA 19403-2497 October 21, 2014 Mr. Jonathan Feipel Executive Director Illinois Commerce Commission 527 East Capitol Avenue Springfield, Illinois 62701 Dear Mr. Feipel: This report
Financial Transmission Rights
 PJM Manual 06 Financial Transmission Rights Revision: 12 Effective Date: July 1, 2009 Prepared by Market Simulation Department PJM 2009 PJM Revision 05, Effective Date: 12/30/03 iii Table of Contents PJM
PJM Analysis of the EPA Clean Power Plan
 PJM Analysis of the EPA Clean Power Plan PJM Interconnection October 6, 2016 PJM CPP Study Objectives Evaluate potential impacts to: Resource adequacy Transmission system operations PJM energy and capacity
PJM Manual 14A: New Services Request Process Revision: 20 Effective Date: October 1, Prepared by Interconnection Planning Department
 PJM Manual 14A: New Services Request Process Revision: 20 Effective Date: October 1, 2017 Prepared by Interconnection Planning Department PJM 2017 Table of Contents Table of Contents Table of Exhibits...7
Contents. DRAFT Capacity Deliverability Fact Finding Summary Report
 DRAFT Capacity Deliverability Fact Finding Summary Report Contents 1 Background... 3 2 Overview of findings... 5 2.1 Implement methods for setting limits that respect the physical topology of the system
Seminar on African Electrical Interconnection. Module 7 - Market Operational Structures
 Seminar on African Electrical Interconnection Module 7 - Market Operational Structures Module 7 - Market Operational Structures Contents 1) Power Market Principles 2) Major Operational Issues 3) Transmission
The New Jersey Clean Energy Conference September 26, PJM Overview. Kenneth W. Laughlin VP Markets Coordination PJM
 The New Jersey Clean Energy Conference September 26, 2005 PJM Overview Kenneth W. Laughlin VP Markets Coordination PJM 2005 2003 PJM PJM 1 PJM as Part of the Eastern Interconnection KEY STATISTICS PJM
Transmission Expansion Advisory Committee
 Transmission Expansion Advisory Committee April 14, 2010 2010 RTEP Sensitivity Analysis Assumptions Renewable Portfolio Standards RPS Methodology Renewable portfolio standards by state Typically a target
May 4, 2017 PLANNING COMMITTEE. Dear Committee Members:
 2750 Monroe Blvd. Audubon, PA 19403 May 4, 2017 PLANNING COMMITTEE Dear Committee Members: 2017 PJM RESERVE REQUIREMENT STUDY - DETERMINATION OF THE PJM INSTALLED RESERVE MARGIN, FORECAST POOL REQUIREMENT
Winter Peak Study. Wenzheng Qiu Transmission Planning PJM 2015
 Winter Peak Study Wenzheng Qiu Transmission Planning Winter Peak Study Drivers Winter Peak is higher Summer Peak for several zones in PJM Area / Year PN METED JCPL PL PECO PSEG BGE PEPCO AE DPL UGI RECO
Federal Energy Regulatory Commission Working Paper on Standardized Transmission Service and Wholesale Electric Market Design
 Federal Energy Regulatory Commission Working Paper on Standardized Transmission Service and Wholesale Electric Market Design To enhance competition in wholesale electric markets and broaden the benefits
Midwest ISO EIM Start-up and Exiting Issues Todd Ramey, Executive Director Market Administration. March 7-8, 2011
 Midwest ISO EIM Start-up and Exiting Issues Todd Ramey, Executive Director Market Administration March 7-8, 2011 Agenda Greetings and Introductions Introduction of the Midwest ISO Overview of the Midwest
UNITED STATES OF AMERICA BEFORE THE FEDERAL ENERGY REGULATORY COMMISSION. ) PJM Settlement, Inc. ) Docket No. ES )
 PJM Settlement, Inc. ) Docket No. ES )") UNITED STATES OF AMERICA BEFORE THE FEDERAL ENERGY REGULATORY COMMISSION ) PJM Settlement, Inc. ) Docket No. ES18- -000 ) APPLICATION OF PJM SETTLEMENT, INC. UNDER SECTION 204 OF THE FEDERAL POWER ACT
UNITED STATES OF AMERICA BEFORE THE FEDERAL ENERGY REGULATORY COMMISSION ) PJM Settlement, Inc. ) Docket No. ES18- -000 ) APPLICATION OF PJM SETTLEMENT, INC. UNDER SECTION 204 OF THE FEDERAL POWER ACT
Introduction to the PJM Markets
 Introduction to the PJM Markets PJM 2015 1 Objectives Students will be able to: Describe some of the basic functions of PJM PJM 2015 The History of PJM EKPC joins PJM 2013 PJM 2015 3 Our Responsibility
Avoided Energy Costs in Maryland. Assessment of the Costs Avoided through Energy Efficiency and Conservation Measures in Maryland.
 Avoided Energy Costs in Maryland Assessment of the Costs Avoided through Energy Efficiency and Conservation Measures in Maryland Final Report April 2014 Prepared for: Susan T. Gray Power Plant Research
Capacity Market. Overview RPM Capacity Market. Market Design
 Section 4 Capacity Capacity Market Each organization serving PJM load must meet its capacity obligations through the PJM Capacity Market, where load serving entities (LSEs) must pay the locational capacity
Pennsylvania Public Utility Commission En Banc Hearing. Testimony of Andrew Ott, Senior Vice President
 Pennsylvania Public Utility Commission En Banc Hearing Testimony of Andrew Ott, Senior Vice President PJM Interconnection October 23, 2008 Good Afternoon, Chairman Cawley, Vice Chairman Christy and Commissioners