Corrosion Characteristics And Mechanical Properties Of Aluminum Coatings Applied By The Cold Spray Process
|
|
|
- Anissa Holt
- 6 years ago
- Views:
Transcription

1 Bucknell University Bucknell Digital Commons Master s Theses Student Theses 2011 Corrosion Characteristics And Mechanical Properties Of Aluminum Coatings Applied By The Cold Spray Process Ben Bouffard Bucknell University Follow this and additional works at: Part of the Mechanical Engineering Commons Recommended Citation Bouffard, Ben, "Corrosion Characteristics And Mechanical Properties Of Aluminum Coatings Applied By The Cold Spray Process" (2011). Master s Theses This Masters Thesis is brought to you for free and open access by the Student Theses at Bucknell Digital Commons. It has been accepted for inclusion in Master s Theses by an authorized administrator of Bucknell Digital Commons. For more information, please contact dcadmin@bucknell.edu.
2 I, Ben Bouffard, do grant permission for my thesis to be copied.
3
4
5 ii Acknowledgements I first and foremost would like to thank my advisor, Dr Mala Sharma, for her invaluable assistance and support throughout the research process. Without her guidance, intellect, and willingness to help I would not have been able to complete this thesis. I would also like to thank my thesis committee members, Professors Constance Ziemian and Jie Lin, for their aid in this process. Their input was extremely valuable and very much appreciated. I thank Dan Johnson and Tim Baker of Bucknell University and Tim Eden and John Potter of The Pennsylvania State University for their help throughout my research. Without their skill, knowledge, and hard work this thesis would never have been completed. Thank you to Josh Steele and Travis Nissley, two undergraduate students who spent summers helping me complete experiments in a timely fashion. Their independence and work ethic was always appreciated. Thank you to the other graduate students, both Mechanical and Chemical, who have helped me stay sane throughout the setbacks always associated with research. Finally, thank you to my parents, Dave and Beth, and to my brother Tom and sister Melissa. Your love and support have and always will be critical to my success. Without you I would not be the man I am today.
6 iii TABLE OF CONTENTS ACKNOWLEDGEMENTS... II LIST OF TABLES... VI LIST OF FIGURES... VII ABSTRACT... X CHAPTER 1: INTRODUCTION... 1 References... 6 CHAPTER 2 : BACKGROUND Application of 2xxx and 7xxx Series Aluminum Alloys Corrosion of 2xxx and 7xxx Series Aluminum Alloys Methods to Apply Hard Coatings to Prevent or Inhibit Corrosion Methods to Evaluate Corrosion on Hard Coatings Types of Coatings Fatigue of 2xxx Aluminum alloys and Common Surface Preparations References CHAPTER 3 : DC CORROSION TESTING OF COLD SPRAY APPLIED CP-AL COATINGS ON AA2024-T3 AND AA7075-T6 SUBSTRATES Abstract Introduction Experimental Procedures Open Circuit Potential (OCP) Linear Polarization Testing Potentiodynamic Testing Galvanic Testing vs Graphite, Stainless Steel and Titanium Results and Discussion: Open Circuit Potential (OCP): AA Open Circuit Potential: AA Polarization Resistance: AA Polarization Resistance: AA Potentiodynamic Polarization Corrosion Rates: AA Potentiodynamic Polarization Corrosion Rates: AA Potentiodynamic Polarization Passivation Region: AA Potentiodynamic Polarization Passivation Region: AA Galvanic Corrosion-Graphite: AA Galvanic Corrosion-Stainless Steel: AA Galvanic Corrosion-Titanium: AA Galvanic Corrosion-Graphite: AA Galvanic Corrosion-Stainless Steel: AA Galvanic Corrosion-Titanium: AA Conclusions Appendix I: Raw Data of DC Tests References... 67
7 iv CHAPTER 4 : LONG TERM AND EXFOLIATION CORROSION TESTING OF COLD SPRAY APPLIED ALUMINUM COATINGS ON AA2024-T3 AND AA7075-T6 SUBSTRATES Abstract Introduction Experimental Procedures Sample Designation Electrochemical Impedance Spectroscopy (EIS) Exfoliation Corrosion Atmospheric Testing Accelerated Atmospheric Testing Long Term Immersion (LTI) Results and Discussion Long term constant immersion with EIS for CP-AL coatings on AA2024-T3 (.01 Hz) Long term constant immersion with EIS for CP-AL coatings on AA2024-T3 (.001 Hz) Long Term Immersion: Scanning Electron Microscopy B-117 Accelerated Cabinet Testing EIS for As-Sprayed CP-AL coatings on AA2024-T B-117 Accelerated Cabinet Testing - EIS for Sealed CP-AL coatings on AA2024-T B-117 Accelerated Cabinet Testing - EIS for As-Sprayed A7005 coatings on AA7075-T B-117 Accelerated Cabinet Testing - EIS for Sealed A7005 coatings on AA7075-T B-117 Accelerated Cabinet Testing EIS Curve Shape and Equivalent Circuit Analysis As Sprayed Samples Sealed Samples EIS Equivalent Circuit Analysis B-117 Accelerated Cabinet Testing Visual Observations As-sprayed CP-AL coatings on AA2024-T3: Sealed CP-AL coatings on AA2024-T3: As-Sprayed A7005 coatings on AA7075-T6: Sealed A7005 coatings on AA7075-T6: Atmospheric Exposure Testing: Visual Observations and EIS Observation and evaluation after 3-months of ocean front exposure Observation and evaluation after 6-months of ocean front exposure Observation and evaluation after 9-months of ocean front exposure Observation and evaluation after 12-months of ocean front exposure EIS after 12 months of ocean front exposure Exfoliation Corrosion Conclusions Appendix I: As-Sprayed AA2024 ASTM B117 Photos Appendix II: Sealed and AA7075 ASTM B117 Photos Appendix III: Photo Documentation of Select Atmospheric Exposure Samples References CHAPTER 5 : THE EFFECT OF SURFACE PREPARATION ON THE FATIGUE PERFORMANCE OF COLD SPRAY APPLIED COATINGS ONTO AA2024-T351 SUBSTRATES Abstract Introduction Experimental Procedures
8 v Results Statistical Analysis SEM Analysis Conclusions References CHAPTER 6 : CONCLUSIONS Conclusions: Corrosion CP-Al on AA2024-T3: As-Sprayed CP-Al on AA2024-T3: Sealed A7005 on AA 7075: As-Sprayed A7005 on AA 7075: Sealed Fatigue Appendix I. Corrosion Summary Tables CHAPTER 7 : RECOMMENDATIONS FOR FUTURE STUDY References
9 vi List of Tables TABLE 3-1. SAMPLE IDENTIFICATION OF AA2024-T3 AND AA7075-T6 TEST SPECIMENS TABLE 3-2. THE AVERAGE OF THREE REPLICATES OF OPEN CIRCUIT POTENTIAL MEASUREMENTS TABLE 3-3. THE AVERAGE OF THREE MEASUREMENTS OF CORROSION RATES OBTAINED FROM POLARIZATION RESISTANCE EXPERIMENTS TABLE 3-4. THE ICORR AND CORROSION RATE DATA OBTAINED FROM POTENTIODYNAMIC POLARIZATION TESTING TABLE 3-5. THE AVERAGE PASSIVATION REGIONS, OF SAMPLES RUN IN TRIPLICATE, OBTAINED FROM POTENTIODYNAMIC POLARIZATION GRAPHS TABLE 3-6. THE AVERAGE CURRENT, FROM SPECIMENS RUN IN TRIPLICATE, OF SAMPLES COUPLED WITH GRAPHITE, STAINLESS STEEL, OR TITANIUM TABLE 4-1. SAMPLE IDENTIFICATION OF AA2024-T3 AND AA7075-T6 TEST SPECIMENS TABLE 4-2. THE AVERAGE PIT SIZE AND DISTRIBUTION OF LTI SAMPLES TABLE 4-3. THE ASTM D 1654 RATING SCALE TABLE 4-4. THE ASTM D 610 RATING SCALE TABLE 4-5. THE ASTM D1654 RATING OF ALL B117 SPECIMENS TABLE 4-6. THE ASTM D610 RATING OF ALL B117 SPECIMENS TABLE 4-7. THE ASTM D714 RATING FOR ALL B117 SPECIMENS, WHICH DOES NOT EVALUATE THE SCRIBE TABLE 4-8. THE VISUAL OBSERVATIONS OF ATMOSPHERIC SPECIMENS AFTER 3 MONTHS EXPOSURE TABLE 4-9. THE VISUAL OBSERVATIONS OF ATMOSPHERIC SPECIMENS AFTER 6 MONTHS EXPOSURE TABLE EXFOLIATION SUMMARY OF ATMOSPHERIC SPECIMENS AFTER 6 MONTHS EXPOSURE TABLE THE VISUAL OBSERVATIONS OF ATMOSPHERIC SPECIMENS AFTER 9 MONTHS EXPOSURE TABLE EXFOLIATION SUMMARY OF ATMOSPHERIC SPECIMENS AFTER 9 MONTHS EXPOSURE TABLE THE VISUAL OBSERVATIONS OF ATMOSPHERIC SPECIMENS AFTER 12 MONTHS EXPOSURE TABLE EXFOLIATION SUMMARY OF ATMOSPHERIC SPECIMENS AFTER 12 MONTHS EXPOSURE TABLE THE CODES AND CLASSIFICATIONS USED TO REPORT THE EXFOLIATED SPECIMENS TABLE A SUMMARY OF THE G-34 TEST TABLE A CONVERSION OF SAMPLE DESIGNATION FROM THE ATMOSPHERIC PHOTOS TO THAT USED IN THIS REPORT TABLE 5-1. THE AVERAGE SURFACE ROUGHNESS OF SAMPLES AFTER EACH SURFACE PREPARATION TABLE 5-2. THE CYCLES TO FAILURE OF EACH SAMPLE TESTED AT BOTH THE 26 AND 30 KSI STRESS LEVELS TABLE 5-3. THE AVERAGE NUMBER OF CYCLES TO FAILURE THAT THE COATING PROCESS ADDS TO THE SURFACE PREPARATIONS TABLE 5-4. THE AVERAGE NUMBER OF CYCLES TO FAILURE THAT THE SURFACE PREPARATION AND COATING ADD TO THE BARE SAMPLES TABLE 6-1. SUMMARY TABLE COMPARISON WITH CP-AL COATINGS ON BARE, CHROMATE, AND AS-SPRAYED AA2024-T TABLE 6-2. SUMMARY TABLE COMPARISON OF SEALED AA2024-T3 SPECIMENS TABLE 6-3. SUMMARY TABLE OF ALL CP-AL COATINGS ON AA2024-T TABLE 6-4. SUMMARY TABLE COMPARISON OF BARE AA7075 AND A7005 COATINGS ON AA7075-T TABLE 6-5. SUMMARY TABLE COMPARISON OF SEALED AA7075-T6 SPECIMENS TABLE 6-6. SUMMARY TABLE COMPARISON OF ALL AA7075-T6 SPECIMENS
10 vii List of Figures FIGURE 2-1. PARTICLE VELOCITY VS. GAS TEMPERATURE FOR COLD AND THERMAL SPRAY PROCESSES [15] FIGURE 2-2. CONCEPTUAL DRAWING OF THE COLD SPRAY EQUIPMENT AND PROCESS [16] FIGURE 2-3. THE RESIDUAL STRESS DISTRIBUTION OF A SHOT PEENED SUBSTRATE [35] FIGURE 3-1. AN EXAMPLE OF AN ELECTROCHEMICAL CELL USED TO PERFORM DC TEST MEASUREMENTS FIGURE 3-2. OPEN CIRCUIT POTENTIAL MEASUREMENTS FOR AA2024-T3 SAMPLES FIGURE 3-3. OCP OF BARE, CHROMATE COATED, AND AS-SPRAYED AA2024 SPECIMENS FIGURE 3-4. OPEN CIRCUIT POTENTIAL FOR AA7075-T6 SAMPLES FIGURE 3-5. CORROSION RATE DATA FOR AA2024-T3 SPECIMEN FIGURE 3-6. LINEAR POLARIZATION CURVE AND CURVE FIT USED TO CALCULATE RP OF CHROMATE COATED SAMPLE FIGURE 3-7. LINEAR POLARIZATION CURVE AND CURVE FIT USED TO CALCULATE RP OF SAMPLE G4-H-C FIGURE 3-8. CORROSION RATES OBTAINED FROM POLARIZATION RESISTANCE TESTS OF AA7075-T6 SAMPLES FIGURE 3-9. LINEAR POLARIZATION CURVE AND SLOPE LINE USED TO CALCULATE RP OF BARE AA7075-T6 SAMPLE FIGURE CORROSION RATES OBTAINED FROM POTENTIODYNAMIC POLARIZATION TESTS FOR AA2024-T3 SAMPLES FIGURE POTENTIODYNAMIC POLARIZATION PLOT AND CORRESPONDING TAFEL SLOPE FIT OF SAMPLE G4-H FIGURE CORROSION RATES OBTAINED FROM POTENTIODYNAMIC POLARIZATION TESTS FOR AA7075-T6 SAMPLES FIGURE THE POTENTIODYNAMIC POLARIZATION REGION OF BARE AA2024, CHROMATE COATED, AND A REPRESENTATIVE AS SPRAYED SPECIMENS FIGURE POTENTIODYNAMIC POLARIZATION TESTS WHICH INDICATE THE PASSIVATION REGIONS FOR THE AA2024-T3 SAMPLES FIGURE POTENTIODYNAMIC POLARIZATION TESTS WHICH INDICATE THE PASSIVATION REGIONS FOR THE AA7075-T6 SAMPLES FIGURE GALVANIC CORROSION DATA SHOWING THE CURRENT OBTAINED FOR AA2024-T3 SAMPLES VS GRAPHITE FIGURE GALVANIC CORROSION DATA SHOWING THE CURRENT OBTAINED FOR AA2024-T3 SAMPLES VS STAINLESS STEEL FIGURE GALVANIC CORROSION DATA SHOWING THE CURRENT OBTAINED FOR AA2024-T3 SAMPLES VS TITANIUM FIGURE GALVANIC CORROSION DATA SHOWING THE CURRENT OBTAINED FOR AA7075 SAMPLES VS GRAPHITE FIGURE GALVANIC CORROSION DATA SHOWING THE CURRENT OBTAINED FOR AA7075 SAMPLES VS STAINLESS STEEL FIGURE GALVANIC CORROSION DATA SHOWING THE CURRENT OBTAINED FOR AA7075 SAMPLES VS TITANIUM FIGURE 4-1. THE SALT SPRAY CABINET (LEFT) AND SOLUTION CHAMBER (RIGHT) FIGURE 4-2. AN EXAMPLE OF AN ELECTROCHEMICAL CELL USED TO MEASURE CORROSION CHARACTERISTICS FIGURE 4-3. IMPEDANCE VALUES OF LONG TERM IMMERSION SPECIMEN MEASURED AT 0.01 HZ FIGURE 4-4. IMPEDANCE VALUES OF LONG TERM IMMERSION SAMPLES MEASURED AT 0.001HZ FIGURE 4-5. TYPICAL PIT ON AS-SPRAYED SAMPLE (A) AND G9-N SURFACE WITH LARGE PIT DISTRIBUTION (B) FIGURE 4-6. THE POROUS SURROUNDING SURFACE OF SAMPLE A-N (A) AND THE SEVERELY PITTED BARE SURFACE (B) FIGURE 4-7. PIT FOUND ON CHROMATE COATED SURFACE FIGURE 4-8. IMPEDANCE VALUES OF UNSCRIBED AS-SPRAYED AA2024-T3 SPECIMEN FIGURE 4-9. IMPEDANCE VALUES OF SCRIBED AS-SPRAYED AA2024-T3 SPECIMEN FIGURE MAXIMUM IMPEDANCE AT LOWEST FREQUENCY OF UNSCRIBED SEALED AA2024 SPECIMEN FIGURE MAXIMUM IMPEDANCE AT LOWEST FREQUENCY OF SCRIBED SEALED AA2024 SPECIMEN FIGURE MAXIMUM IMPEDANCE AT LOWEST FREQUENCY OF UNSCRIBED AS-SPRAYED AA7075 SPECIMEN FIGURE MAXIMUM IMPEDANCE AT LOWEST FREQUENCY OF SCRIBED AS-SPRAYED AA7075 SPECIMEN FIGURE MAXIMUM IMPEDANCE AT LOWEST FREQUENCY OF UNSCRIBED SEALED AA7075 SPECIMEN... 91
11 viii FIGURE MAXIMUM IMPEDANCE AT LOWEST FREQUENCY OF SCRIBED SEALED AA7075 SPECIMEN FIGURE THE BODE AND NYQUIST PLOTS FOR AS-SPRAYED PLATE G9-N FIGURE IMPEDANCE VALUES OF UNSCRIBED AS SPRAYED AA2024-T3 SPECIMEN WITH CHROMATE SAMPLE REMOVED.. 97 FIGURE THE BODE AND NYQUIST PLOTS FOR AS-SPRAYED UNSCRIBED PLATE G4-H FIGURE THE NYQUIST PLOTS OVER THREE MONTHS OF EXPOSURE FOR UNSCRIBED SPECIMEN A-N-NC FIGURE THE MAXIMUM IMPEDANCE AT LOWEST FREQUENCY DATA FOR UNSCRIBED, SEALED AA2024 SPECIMENS FIGURE THE NYQUIST PLOTS FOR THREE MONTHS OF EXPOSURE OF THE CHROMATE COATED SAMPLE FIGURE THE PROPOSED EQUIVALENT CIRCUIT TO MODEL COATED EIS DATA FIGURE AS-SPRAYED SAMPLE S-N MODELED WITH EQUIVALENT CIRCUIT AFTER 4 MONTHS OF EXPOSURE FIGURE SEALED UNSCRIBED SAMPLE A-N-NC MODELED AFTER ONE MONTH OF EXPOSURE WITH EQUIVALENT CIRCUIT FIGURE UNSCRIBED CHROMATE SAMPLE AFTER 2 MONTHS OF EXPOSURE MODELED WITH EQUIVALENT CIRCUIT FIGURE SCRIBED SEALED SAMPLE G4-H-NC-S MODELED AFTER THREE MONTHS OF EXPOSURE WITH EQUIVALENT CIRCUIT FIGURE AS-SPRAYED SCRIBED SAMPLE G4-H-S MODELED AFTER 2 MONTHS OF EXPOSURE WITH EQUIVALENT CIRCUIT. 108 FIGURE SAMPLE A-N-S (LEFT) AND S-N-S (RIGHT) THAT SHOWED SIGNIFICANT MATERIAL LOSS ALONG THE SCRIBE FIGURE A COMPARISON OF A BARE SPECIMEN WITH SIGNIFICANT CORROSION (LEFT) AND AN AS-SPRAYED SAMPLE WITH NO CORROSION DAMAGE (RIGHT) FIGURE AN EXAMPLE OF EXFOLIATION ON THE BACK OF AN AS-SPRAYED SAMPLE FIGURE AN EXAMPLE OF EXFOLIATION ON THE BACK OF A SEALED SAMPLE FIGURE EIS OF AS-SPRAYED SCRIBED SAMPLES AFTER 12 MONTHS OF EXPOSURE FIGURE EIS OF AS-SPRAYED SAMPLES (UN-SCRIBED) AFTER 12 MONTHS OF EXPOSURE FIGURE EIS OF NON-SCRIBED BARE AND CHROMATE COATED AA2024 SAMPLES AFTER 12 MONTHS OF EXPOSURE FIGURE EIS OF SEALED SAMPLES (SCRIBED) AFTER 12 MONTHS OF EXPOSURE FIGURE EIS OF SEALED NON-SCRIBED SAMPLES AFTER 12 MONTHS OF EXPOSURE FIGURE A BARE AA2024 SAMPLE WITH SIGNIFICANT PITTING (A) AND A TYPICAL AS-SPRAYED SPECIMEN WITH NO APPRECIABLE ATTACK (B) FIGURE A BARE AA7075 SAMPLE WITH EB RATED EXFOLIATION (A) AND A TYPICAL AS-SPRAYED AA7075 SAMPLE WITH NO APPRECIABLE ATTACK (B) FIGURE 5-1. THE SCHEMATIC USED TO MANUFACTURE RR MOORE FATIGUE SPECIMEN [16] FIGURE 5-2. A TYPICAL BARE RR MOORE ROTATING FATIGUE SAMPLE FIGURE 5-3. AN EXAMPLE OF THE COATING AND SUBSTRATE ON A FRACTURED GRIT BLAST AND COATED SPECIMEN FIGURE 5-4. THE INSTRON RR MOORE ROTATING FATIGUE TESTING APPARATUS USED IN THIS STUDY FIGURE 5-5. AN S-N CURVE OF THE RESULTING DATA FIGURE 5-6. A SCATTER PLOT OF THE CYCLES TO FAILURE OF SAMPLES TESTED AT A STRESS OF 30 KSI FIGURE 5-7. A SCATTER PLOT OF THE CYCLES TO FAILURE OF SAMPLES TESTED AT A STRESS OF 26 KSI FIGURE 5-8. THE CRACK INITIATION POINTS OF BARE SPECIMENS AT 26 KSI (LEFT) AND 30 KSI (RIGHT) FIGURE 5-9. THE CRACK INITIATION SITE FOR AN UNCOATED SHOT PEENED SAMPLE FIGURE THE TYPICAL CRACK INITIATION SITE FOR NON COATED GRIT BLAST SPECIMENS FIGURE PORES ON THE SUBSTRATE/COATING INTERFACE THAT LED TO THE FAILURE OF BOTH TYPES OF COATED SAMPLES AT 30 KSI FIGURE THE DIMPLE AND RESULTING CRACKS OF A GRIT BLAST AND COATED SAMPLE TESTED AT 26 KSI
12 ix FIGURE THE FAILURE INITIATION SITE OCCURRING ON THE SUBSTRATE/COATING INTERFACE OF A TYPICAL SHOT PEENED AND COATED SPECIMEN TESTED AT 26 KSI
13 x Abstract Aluminum coatings were applied to 2024-T3 and 7075-T6 aluminum alloys via the Cold Spray process as an alternative to the conventional toxic chromate conversion coatings currently used in the defense industry. The coatings were applied to substrates with various surface preparation and Cold Spray carrier gas combinations. Some samples were coated with an additional sealant with and without a chromate conversion layer. An exhaustive corrosion analysis was then performed which utilized a number of long term and accelerated tests in order to characterize the corrosion protection of the coatings. RR Moore rotating bend fatigue testing was also performed on commercially pure (CP-Al) coatings applied to AA2024-T351 substrates to study the effect of surface preparation on the coated sample s fatigue life. It was found that the pure aluminum coatings offered corrosion protection to the bare AA2024 substrate, and that sealed AA2024 specimens without a chromate conversion layer provided similar protection to those with a chromate conversion layer. Along with providing superior corrosion protection, it was also found that the factor combination of glass bead grit blast surface preparation with nitrogen carrier gas provided the best fatigue life of all samples tested in the rotating bend experiment. These samples experienced an increased average fatigue life, in comparison with bare AA2024 substrates, of 4,751,000 cycles at a stress level of 30 ksi; an increase of 511%. Applying a Cold Spray coating increased the fatigue life of the surface prepared specimen by 20% at a stress level of 26 ksi and 16% at a 30 ksi stress level.
14 1 Chapter 1: Introduction Aluminum is considered one of the most important and prominent structural materials used in the aerospace industry. This can be attributed to its high strength to weight ratio, low fracture toughness, and ease of formability relative to other materials. Unfortunately, aluminum is still prone to various mechanisms of failure. One important failure that needs to be addressed is corrosion. Corrosion is the degradation of a material as a result of a reaction with its environment, and according to a 2001 study costs the United States 276 billion dollars every year [1]. Specifically, this same study estimates the cost to the US defense industry to be $20 billion per year. As funding for the acquisition of new systems becomes less available, the maintenance and corrosion prevention of the current fleets become even more vital. Both the galvanic corrosion caused by the contact of aluminum with other materials and the pitting corrosion that can claim the life of some alloys in aggressive chloride environments need to be minimized in any current aircraft. It is therefore often necessary to apply a coating to these alloys in order to protect them from degradation. Several coating methods exist, the most common being organic coatings applied to the aluminum alloys. Currently a hexavalent chromate conversion coating is used in order to prevent the corrosion of these alloys without hindering their advantageous mechanical properties. Unfortunately, the chromate coatings currently utilized are a known carcinogen and can have detrimental effects on both the environment and those applying the coatings. The Occupational Safety and Health Administration (OSHA) has limited the amount of hexavalent chromium to which a
15 2 person may be exposed. Also, these coatings inherently chip away in the field and cannot be easily repaired, leaving sites for corrosion initiation and failure. Therefore, there has been an effort to find a more environmentally friendly means of protecting aluminum alloys from corrosion and the department of defense (DoD) has been trying to phase out the current chromate conversion coatings. Several different coatings have been proposed to improve corrosion resistance, with the majority being applied by a thermal spray method. Thermal spray processes, such as flame, arc, and plasma, use a high energy source to heat metal powders to a molten or semi-molten state for deposition. Although these methods require inexpensive materials and gases to operate, it is difficult to apply coatings that experience phase transformations, oxidation, or recrystallization [2]. Also, the high temperatures required for deposition, coupled with two different thermal coefficients of expansion existing for the coating and substrate, result in residual stresses between the coating and substrate that may reduce the fatigue characteristics of the material [2]. In an effort to resolve these problems, various hard aluminum coatings applied by the Cold Spray process have been proposed. The Cold Spray process is an emerging technology used mostly in the defense industry. This process uses pressurized gas and unique nozzle designs to accelerate the particles to a critical velocity to achieve a solid state deposition. Because the deposition temperatures are much lower than those of the thermal spray processes, problems associated with recrystallization in both the coating and substrate are eliminated and oxide contamination is reduced [2]. The Cold Spray process has also been shown to be safer and more economical than other thermal spray
16 3 techniques, and a portable system exists that can re-apply coatings that have been damaged in the field [2]. Pure aluminum coatings have been proposed due to their high corrosion resistance, non-toxicity, and relative ease of application. However, as the Cold Spray process is still in the developmental stage, there has been insufficient research conducted towards determining the corrosion characteristics of coatings applied by this method. Any coating application method is likely to change the surface of the substrate, and therefore affect its mechanical properties. The Cold Spray method would hold little value if it protects the aluminum alloys from corrosion yet diminishes their strength to weight ratios or fatigue characteristics. One of the most important material properties to consider when designing aircraft wings is the fatigue life of the material, and it is imperative that the coatings used are not a detriment to this property. The objective of this study is to compare the corrosion characteristics of coatings applied by the Cold Spray process to both bare and chromate coated AA2024 and AA7075 substrate materials, while also gaining insight into how the Cold Spray coatings affect the mechanical properties of these aluminum alloys. This analysis will demonstrate whether the application of aluminum coatings via the Cold Spray process is in fact a viable alternative to those presently used on aluminum alloys in aerospace applications. Obtaining statistically relevant data for corrosion characteristics is notoriously difficult, and as a result, several tasks were employed in order to fulfill the objective and to get a variety of data types which include qualitative and quantitative, real time and accelerated:
17 4 (1) Electrochemical Tests. Four direct current (DC) tests were used in order to compare the coating s tendency to corrode with the substrate, the tendency to corrode if coupled with other common aerospace materials, and corrosion rates were obtained and compared with the bare and chromate coated substrates. Also, an alternating current (AC) electrochemical test known as electrochemical impedance spectroscopy (EIS) was used in order to characterize coating degradation on tasks (3), (4), and (5). (2) Exfoliation. The samples were subject to ASTM standard G34, which test the resistance of the substrates to exfoliation corrosion. (3) Atmospheric Testing. Samples were exposed directly to a marine environment at the Kennedy Space Center corrosion site located in Kure Beach, NC for a period of one year. Quarterly, the samples underwent visual and electrochemical inspection. (4) Accelerated Atmospheric Testing. Utilizing a salt spray chamber, the samples underwent three months of accelerated atmospheric testing based on ASTM standard B117. Each month the samples were removed and inspected both visually and electrochemically. (5) Long Term Immersion. Samples were subjected to immersion in an artificial seawater electrolyte for a period of one year. Each month, the samples were tested electrochemically in order to determine the coating s resistance to corrosion.
18 5 (6) Scanning Electron Microscopy (SEM). SEM was employed on samples that underwent long term exposure and in long term immersion tests. This demonstrated on a microscopic level the pitting mechanisms that are common with aluminum and its alloys. (7) Fatigue Analysis. The ASTM E468 standard for cyclic fatigue testing was used on specified specimens in order to gain insight into the effect of Cold Spray applied coatings and substrate preparation on the fatigue characteristics and performance of the 2024 series aluminum alloy. The data collected throughout this study is organized into three chapters that will be the basis of three papers submitted to peer reviewed journals, following a literature review included as chapter 2. DC electrochemical test results will be included as chapter 3, and the results of tasks (2) through (6) will be included in Chapter 4. The results of the fatigue analysis will be included in Chapter 5. Chapter 6 of this thesis will include the overall conclusions of all work done, and finally chapter 7 will include suggestions for future work and analysis.
19 6 References [1] Gerhardus H. Koch, P.D., Michiel P.H. Brongers, Neil G. Thompson, P.D., 2001, "Corrosion Cost and Preventive Strategies in the United States," FHWA-RD ,. [2] Amateau, M. F., and Eden, T. J., 2000, "High-Velocity Particle Consolidation Technology," IMAST Quarterly, 2pp. 3-6.
20 7 Chapter 2 : Background 2.1 Application of 2xxx and 7xxx Series Aluminum Alloys Aluminum has long been known as one of the lightest structural materials, although in its pure form provides minimal strength. In the early 1900s it was found that by alloying aluminum with small amounts (<5%) of other elements, the strength could be drastically increased while keeping the material relatively light. Modern strength increases in aluminum are also obtained by work hardening and precipitation hardening, combined with mechanical and thermal treatments [1]. Several different aluminum alloy series have since been created, each providing unique characteristics useful to individual industries. The two highest strength series are the 2xxx and 7xxx, which have copper and zinc as their primary alloying elements, respectively. Due to this high strength to weight ratio in the 2xxx and 7xxx series aluminum alloys, they have many advantages in the aerospace industry which demands high performance materials. Typically, an aircraft s wing box structure consists of a 7xxx series alloy upper wing skin and a 2xxx alloy lower wing skin [1]. Specifically, two aluminum alloys of interest for these applications are the high strength 7075-T6 alloy and the medium strength, high fracture-resistant 2024-T3 alloy. These are two of the most common alloys used on aircraft structures in the aerospace industry today [1].
21 8 2.2 Corrosion of 2xxx and 7xxx Series Aluminum Alloys Pure aluminum forms an aluminum oxide layer on its surface that protects against corrosion. However, a chloride containing environment can reduce the performance of this oxide layer with the formation of aluminum chlorides [2]. This often leads to pitting corrosion, a common problem encountered in working with aluminum alloys. Pitting corrosion is considered one of the most detrimental classes of corrosion because large amounts of material can be removed from the inside of a body while the structure does not show detrimental signs on the outside. Also, the localized attack caused by pitting corrosion reduces the lifetime of a structure much more quickly than would uniform corrosion. The growth of stable pits occur above a certain potential termed the critical pitting potential. However, metastable pits, which grow for a short period of time and then repassivate, can occur at potentials below the critical pitting potential. It has been shown that the physical and chemical properties of the passive film strongly influence the formation of pits, but play a secondary role in pit growth [3]. Pit growth has also been shown to be under either ohmic or diffusion control [3]. Intergranular corrosion occurs in aluminum when precipitates form at the grain boundaries [4]. Specifically in the 2024 and 7075 alloys, the copper depleted zone adjacent to the grain boundary precipitates is attacked anodically [4]. Aluminum also suffers from exfoliation corrosion, a severe form of intergranular corrosion. In rolled aluminum, like that used in aircraft design, the grain boundaries are oriented parallel to the rolling surface. Corrosion product can form in these elongated grain boundaries,
22 9 which have greater volume than the aluminum [4]. These large precipitates split apart and force open the structural layers of the material [4], and thus can have detrimental effects on an aerospace structure [4]. When aluminum is used in aerospace applications it is often in contact with an electrochemically dissimilar metal, such as fasteners or an underlying material, and this can cause galvanic corrosion. Galvanic corrosion causes one of the metals to become anodic and corrode sacrificially while the other becomes cathodic and corrodes slower than it otherwise would alone. The galvanic series can be used to predict the activity of given galvanic couples. Tavakkolizadeh et al [5]. showed that when carbon fibers coated with epoxy are coupled with a steel substrate the corrosion rate of the steel increases by over 20 times that of the steel with no carbon fiber coupling. This behavior demonstrates how much effect a galvanic coupling can have on a substrate s corrosion rate. 2.3 Methods to Apply Hard Coatings to Prevent or Inhibit Corrosion Several methods exist to apply coatings that can protect aluminum alloys from corrosion. One of the most common methods used to apply coatings is the flame spray technique. This involves heating a material to a plastic or molten state and then using a compressed gas stream to accelerate the material onto an underlying substrate. As the droplets of material hit the underlying substrate, they build up to form a coating. If the material being deposited is a metal then the coating will often contain the oxides of this metal. The bond holding the coating to the underlying material can consist, either individually or in combination, of mechanical, chemical, or metallurgical bonding [6].
23 10 Coatings applied via thermal spray can be either anodic or cathodic to the underlying substrate. Corrosion occurs in the anode, and most coatings are designed to be anodic with the underlying substrate so that they sacrificially corrode instead of the underlying substrate [4]. Several studies have shown that thermal spray techniques can be used to protect materials from corrosion. Schmidt et al [7]. showed that zinc coatings deposited onto steel substrates by flame spray were more protective than those deposited by arc spray as determined from visual observations, open circuit potential measurements, and EIS impedance values. Another method to apply protective coatings to aluminum alloys is the hot dip method. This consists of dipping the aluminum substrate into a molten material. The material then cools and adheres to the aluminum, forming a protective coating. The hot dip method is normally associated with zinc coatings applied to steel as opposed to aluminum coatings. Panossian et al [8]. found that hot dipped aluminum coatings only offer cathodic corrosion protection to steel when in the presence of a very high chloride containing atmosphere. Electroplating, or electrodeposition, is another method used to apply coatings to aluminum substrates through the use of electrical current. This involves polarizing a given substrate in the presence of the ions of another metal, thereby attracting this other metal to the given substrate. The coated metal usually exists as positively charged ions in an electrolyte bath while the substrate to be coated is placed in this bath and acts as the negatively charged cathode. A power supply provides the current needed to carry out this
24 11 electrolytic process. Shah et al [9]. have shown that electroplating aluminum onto a 2024 substrate can reduce corrosion rates by an order of magnitude. Alternative coating techniques to electroplating involve vaporization deposition, specifically physical vapor deposition (PVD) or chemical vapor deposition (CVD). These two processes are inherently similar, except that in the case of PVD the material to be deposited starts in solid form while in CVD the material to be deposited starts in gaseous form. The process works by bombarding a material to be deposited with a high energy source to vaporize the atoms on the material. The atoms are then carried and deposited onto the underlying substrate. Studies have shown that various coatings, including pure aluminum, have helped to improve the corrosion characterizations of steel substrates [10-12]. Aluminum coatings deposited onto carbon steel were shown to lower corrosion current densities from 30 ua cm -2 to 0.7 ua cm -2 [11]. A fairly new technology that is quickly gaining popularity in the application of coatings is High Velocity Particle Consolidation (HVPC), also known as the Cold Spray process. HVPC can be classified as a thermal spray process, although it is unique in that it does not require particles to be applied to substrates in a molten state [13]. This process involves accelerating a coating material onto a substrate at extremely high speeds, but at relatively low temperatures. A comparison of the particle velocities and gas temperatures associated with the cold spray process with more conventional thermal spray processes is shown in Figure 2-1. Due to this low temperature problems usually associated with thermal spray processes, like coatings that experience phase
![12 transformations, oxidation, or recrystallization, are eliminated with the HVPC process [14]. Figure 2-1. Particle Velocity vs.](/docs-images/73/69139107/images/25-0.jpg "Gas Temperature for Cold and Thermal Spray Processes [15] Cold Spray consists of a metal powder with particle sizes ranging between five (5) and forty-five (45) μm that is inserted into a gas stream")
25 12 transformations, oxidation, or recrystallization, are eliminated with the HVPC process [14]. Figure 2-1. Particle Velocity vs. Gas Temperature for Cold and Thermal Spray Processes [15] Cold Spray consists of a metal powder with particle sizes ranging between five (5) and forty-five (45) μm that is inserted into a gas stream either at the subsonic or supersonic gas velocity point and is accelerated to a velocity range of m/s. The particles then exit the nozzle and impact the substrate in a solid state. Upon impact, the particle creates a mechanical bond in dissimilar metals or a mechanical/metallurgical bond in similar metals. The process temperatures in the Cold Spray process (23 o 500 o C) are such that the powder particles remain in the solid state and no melting of the substrate or formation of oxides occurs in the coating. A schematic of the cold spray process is shown in Figure 2-2. Another problem with thermal spray processes is that as the coating and substrate cool, they have different coefficients of thermal expansion that lead to residual stresses and distortions in the final coating [14]. These distortions cause a decrease in the
26 13 mechanical properties and corrosion resistance of the coating. HVPC, working with temperatures much lower than those of the thermal spray process, eliminates this issue [14]. There are no metal fumes in the cold spray process, and there is a reduction in noise levels in comparison with thermal spray processes [14]. Also, Cold Spray systems are less complex than thermal spray systems and therefore the start up costs are more desirable [14]. Figure 2-2. Conceptual drawing of the cold spray equipment and process [16] A significant benefit of the HVPC process, especially in respect to aerospace applications, is the emergence of portable application designs [17]. If a coating were to chip off in the field, it is possible to re-apply the coating on site which saves time, money, and resources. There is therefore much interest in the researching of coatings applied by the Cold Spray process. 2.4 Methods to Evaluate Corrosion on Hard Coatings A number of methods exist that can be employed to test corrosion effects on hard coatings. These tests can be organized into groups which include electrochemical, intergranular, exfoliation, atmospheric exposure and simulated atmospheric exposure.
27 14 Electrochemical tests can be further broken down into two categories, Direct Current (DC) and Alternating Current (AC). A number of direct current tests are discussed along with one alternating current test, Electrochemical Impedance Spectroscopy (EIS). The Open Circuit Potential test is a DC scan that measures the voltage of a substrate versus a reference electrode over time. This provides a representation of the summation of half cell reactions occurring between the given electrolyte and substrate, and offers insight into the activeness or passivity of a given coating. The test results are relative to the reference electrode used, but materials with higher open circuit potentials are less likely to corrode while materials with lower open circuit potentials are more likely to corrode. This test is performed for most corrosion studies [18][2], and is often the baseline used in corrosion rate obtaining DC tests. Open circuit potential scans have also been used to gather information about the condition of the coating/electrolyte interface and to show if a coating is providing adequate galvanic corrosion protection [19]. Merl et al [10] show that, by increasing the open circuit potential by 200 mv, Cr-N coatings provide corrosion protection to mild steel substrates. The linear polarization experiment is a DC test that can give insight into the corrosion rate of a coating and substrate. In the linear polarization experiment the open circuit potential is first measured, and then varied by a small percentage while the corresponding current is measured. A plot is then constructed with the voltage and log of the current, which produces a linear curve. The slope of this curve, referred to as the polarization resistance, can then be used to predict the corrosion rate of the material.
28 15 Another DC test that provides information on corrosion kinetics is the potentiodynamic experiment. In this test the open circuit potential is varied over a much wider potential range than that of the linear polarization experiment, and is again plotted with the log of the resulting current. The anodic portion of the curve in this case can show insight into the passive region of a given coating. Although potentiodynamic tests are considered destructive due to the large potential applied to the coating/substrate, they provide much more insight into corrosion mechanisms and are therefore widely used in published corrosion research. Potentiodynamic tests have been performed to document pitting potentials [20] [3], to obtain corrosion current densities from curve fits [18] [10], to understand differences in passive regions [2] [21], and to obtain corrosion rates from corrosion current densities [9]. For example, Guilemany et al [18]. used the potentiodynamic polarization experiment to show that nitinol coatings reduce the corrosion current densities and therefore offer protection to steel substrates, while Vasconcelos et al [21]. showed that sol-gel silica coatings reduce the corrosion rate, but also the passivation region, of stainless steel. A DC test can also be performed to gain insight into galvanic corrosion. This involves using a zero resistance ammeter and reference electrode to measure the current between two dissimilar metals. A greater current flowing between two metals demonstrates that galvanic corrosion is more likely to occur. Studies have used galvanic test techniques to study the corrosion characteristics of aluminum coupled with steel, and found that an aluminum-tin coating caused very large galvanic currents when in contact with mild steel cathodes [22].
29 16 Unfortunately, when evaluating coating performance DC tests can be limited due to irreproducible results, high potential drops across resistive films, and large polarizations induced by the coating-metal interface [23]. One of the most powerful electrochemical tests to perform on hard coatings is therefore an AC experiment known as electrochemical impedance spectroscopy (EIS). EIS involves applying only a small signal voltage over a large frequency range, and then measuring the resulting impedance values. Because the signal is kept small, the corrosion surface is not driven far from steady state and the corrosion properties are not disturbed [23]. There has been a significant amount of research into the best means of analyzing the bode and nyquist plots resulting from EIS measurements. Senna et al. used nyquist plots to demonstrate the corrosion protection of hard coatings deposited by PVD techniques [12]. One common parameter that has shown promise in predicting corrosion behavior is the maximum impedance at lowest frequency. The impedance of the coating can be thought of as the coating s resistance to penetration by the electrolyte [24]. This value, measured at the lowest frequency, has been shown to correlate well with actual coating degradation and has suggested that zinc sacrificial coatings with solvent based topcoats can show impedance values six times higher than the same sacrificial coating with no topcoat when applied onto steel substrates [19]. Calle et al. used both the maximum impedance value and the coating resistance value obtained from an equivalent circuit to evaluate the protection that molybdate conversion coatings offer aluminum alloys, and found the maximum impedance values to be 10 3 for the bare 2024 alloy while they varied from 10 3 to 10 5 for the coated substrates [25].
30 17 Testing for the exfoliation corrosion of aluminum involves a continuous immersion test set by ASTM standard G-34. The test consists of continuous immersion in an acidic bath for one to three days while visual inspections are carried out throughout the testing. A visual comparison is then made between the inspected samples and sample pictures provided in the ASTM standard. Each sample is rated based on these pictures. The ASTM G-34 standard has been used in conjunction with EIS measurements to predict the exfoliation corrosion of the 2024-T351 aluminum alloy [26]. Although time consuming, the most accurate testing for corrosion evaluation is field exposure testing. This involves placing the samples in a representative environment (i.e marine, industrial) and performing visual and electrochemical inspections throughout an extended exposure time frame. Studies have shown that extended atmosphere exposure coupled with periodic EIS measurements have predicted corrosion behavior [7]. Atmospheric tests have also shown unprotected 2024 and 7075 aluminum to experience severe exfoliation corrosion, and that marine atmospheres cause more corrosion than urban atmospheres [8]. In an attempt to emulate field exposure results in a shortened time frame, accelerated salt spray cabinet tests have become a popular means of imitating atmospheric testing. This test involves placing samples in a cabinet that is connected to a chamber containing artificial seawater. The seawater enters into the cabinet where it atomizes and is dispersed as a salt spray fog. This fog is dispensed at specific intervals throughout a 24 hour period. There are several variations on this test, such as fog dispersion intervals and salt water composition, and the ASTM standard B117 salt spray
31 18 test has been chosen for this study. Tests have shown that this standard may not be as accurate at predicting corrosion rates for aluminum as other salt spray tests, but it is very useful when a comparative study is of interest. Zhu et al [27]. demonstrated that a magnesium substrate showed pitting corrosion after two hours in a salt spray cabinet, while the same alloy with an aluminum-alloyed coating showed pitting after 72 hours and very little pitting even after 30 days in salt spray cabinet testing. 2.5 Types of Coatings There are several types of coatings that have been utilized in order to protect the 2xxx and 7xxx series aluminum alloys from corrosion. Coatings can be organic or inorganic, and can also consist of conversion coatings. A great deal of research into the protection of aluminum has focused on conversion coatings, which convert the surface of the aluminum into the coating. Perhaps the most accepted coating to protect against the corrosion of aluminum alloys, especially in the defense industry, is the use of a chromate conversion coating. Although the exact electrochemical mechanism is not known, chromate inhibits the pitting of aluminum and therefore decreases the rate of corrosion [3]. Chromate, however, is inherently toxic to both those applying the coatings and to the surrounding environment when the coating chips away. Therefore, a significant amount of research has gone into trying to find other suitable coatings to minimize or prevent corrosion on aluminum alloys. Another conversion coating that has shown to minimize corrosion in 2024-T3 aluminum is a vanadate conversion coating, which has been shown to increase the pitting
32 19 potential and decrease the oxygen reduction reaction rate on the 2024-T3 alloy [20]. Anodic polarization curves also show that vanadate conversion coatings can make the bare 2024-T3 substrate, which otherwise does not show a substantial passive region in 0.5M NaCl solution, spontaneously form passive regions when the coating is applied [20]. Molybdate conversion coatings have also been researched in order to decrease the corrosion rate of the 2024-T3 aluminum alloy. EIS experiments have suggested that, although future atmospheric tests are suggested, molybdate conversion coatings can show an improvement in corrosion resistance when compared to a bare 2024-T3 sample [25]. A process for applying a cerium oxide conversion coating has been developed for the 7075-T6 aluminum alloy that has been shown to decrease the corrosion rate of the alloy in B117 salt fog tests. Rivera et al[28]. showed that approximately 80% of panels prepared using this process passed a salt fog test after two weeks, compared with only 20% of previous processes. There has also been research into protecting the 2024 alloy from corrosion by the use of polyanilines, which have shown in multiple studies to reduce the corrosion rate of the alloy [2][9]. Both these studies showed a reduction in corrosion rate from the bare alloy of an order of magnitude, and Panossian et al [29]. suggested that the polymers remove the copper from the surface of the alloy and therefore inhibit its corrosion. Coating the AA2024 and AA7075 substrates with pure aluminum is another option in the corrosion protection of aluminum alloys. Pure aluminum is more active on the galvanic scale than the aluminum alloy, and therefore sacrificially corrodes if immersed in an electrolyte. Pure aluminum has excellent corrosion resistance because of an oxide
33 20 film that bonds to its surface. If damaged, this oxide film can quickly repassivate [13]. There are many studies that demonstrate the effectiveness of a pure aluminum coating on the reduction in corrosion rate of steel substrates [8][11], but few that study pure aluminum deposited onto an aluminum alloy. Research has shown that microcrystalline aluminum coatings deteriorate more than cast pure aluminum coatings in acidic Na 2 SO 4 solution, but microcrystalline coatings show higher pitting resistance in a NaCl acidic solution [30]. When applying pure aluminum coatings by ion beam assisted deposition, it has been shown that the parameters of the application process can vary the protection of the coating by more than two orders of magnitude [31]. This information shows how process parameters can play a vital role in the protection of a coating. Zinc coatings are often used to protect steel because it is anodic to steel and will therefore corrode preferentially instead of the steel. Aluminum coatings are less active than zinc, but are harder, have better adhesion, and form a protective oxide that prevents self corrosion [4]. Irissou [32] deposited aluminum onto an AA7075 substrate by both the arc spray and cold spray techniques. Arc spray required advanced surface preparations, including chemical deoxidation and laser ablation in order to make the coatings have the same coating properties as cold spray coatings without these advanced surface preparations. Surface preparations studied included polishing, grit blasting, and shot peening. There was no observed difference in bond strength between any of the surface preparations with the cold spray process. Also, no difference was observed on bond strength between air or nitrogen used as carrier gases for the cold spray process. Porosity of coatings was less than 0.5% for the cold spray process, but 3-8% for the arc spray process.
34 Fatigue of 2xxx Aluminum alloys and Common Surface Preparations. One of the benefits of the cold spray process over other thermal spray processes is that only minimal if any surface preparation is necessary for a substrate to be coated. However, surface preparations can often increase the advantage of the coating by increasing adhesion, cracking resistance, and even corrosion resistance in very thin coatings. The most common crack initiation points in high strength aluminum alloys are inclusions and grain boundaries, although surface facets have also been shown to be sites of crack initiation [33]. Fatigue failure tends to start at the surface of a substrate and in general a smoother specimen is thought to have a higher fatigue life than a roughened specimen, due to the stress raisers of a roughened surface. However, the application that roughens the surface can impart residual stresses in the surface of a substrate that can increase fatigue life. There is therefore contradicting data on any surface preparation and its effect on the fatigue life of a given substrate. Shot peening refers to a cold working process in which a substrate is impinged with spherical particles in order to plastically deform the surface. This creates residual compressive stresses in the surface of the substrate that have been determined to be the result of the superposition of residual stresses produced by the surrounding steel shots [34]. Figure 2-3 shows a typical stress distribution inside a shot peened material. There are four main features [35]: 1. SS: Surface stress
35 22 2. CSmax: The maximum compressive stress, usually found slightly below the surface (often taken to be 25% of the thickness) 3. d: The depth at which the residual stress becomes negative 4. TS: Maximum tensile stress The compressive residual stress has a magnitude that can very up to a maximum stress of one half the yield strength of the material [36]. Figure 2-3. The residual stress distribution of a shot peened substrate [35]. These residual stresses have been shown to increase the fatigue life of AISI 430 steel [37]. Shot peening has also been shown to delay crack initiation and slow the propagation of cracks in 316 stainless steel [35]. A shot peened surface may also contain many grain boundaries and lattice defects, like dislocations, that can enhance the low temperature solid state diffusion process [38]. When titanium coatings and shot peening were applied to AA7075-T6, they increased the fretting fatigue life of the uncoated
36 23 specimens significantly. Shot peening alone increased the fatigue life by 350%, while the combination with the aluminum coating significantly increased fatigue life [39]. Grit blasting refers to a type of abrasive blasting in which glass bead media are propelled onto the surface of a substrate. This can serve to roughen the surface of a smooth material and allow for better coating deposition. The increased surface roughness and inherent embedded grit that result from the process can reduce fatigue life, but the residual stress imparted on the surface from the process serves to increase fatigue life. Therefore contradicting data is often found in literature. Price et al [40]. showed that grit blasting a titanium alloy and applying a pure titanium cold spray coating significantly reduces the fatigue life of the original alloy in rotating bend tests. However, the grit blasting technique has also been shown to increase the fatigue life of the 2024-T3 aluminum alloy by close to 50 percent [41]. Brandt [42] demonstrated that, depending on the parameters of the grit blasting, the surface preparation may increase the fatigue life of aluminum specimens in rotating bend tests. Coatings can have either an advantageous or detrimental effect on the mechanical properties of the underlying substrate. Saini [43] found that WC/C coatings increase the endurance limit of steel by 7% while not negatively affecting the hardness or tensile properties. Mcgrann et al [44]. showed that the residual stresses caused by coating 6061 aluminum and steel substrates with WC-Co coatings could increase the fatigue life by a factor of ten. Fatigue failure can depend on the microstructure of the coatings themselves. When WC-Co coatings were applied to AISI 4340 steel by the HVOF process, it was found that the major contribution to increased fatigue life was the load carrying capacity
37 24 of the coatings [45]. It has also been shown that the porosity of an applied coating can have a large effect on the resulting fatigue strength of the coating and underlying substrate [46] [47]. Strong coating adhesion, usually a desirable characteristic, can be detrimental if the mechanical properties of the coating are less desirable than the covered substrate. It is possible for cracks to initiate in the coating, and then due to strong adhesion spread into the underlying substrate material and initiate failure [33]. Temperature and humidity can also affect the fatigue characteristics of a coating. Liu et al [48]. found a low carbon steel coating to have superior fatigue strength at 300 C than at room temperature while Voris et al[49]. found that, at low stress levels, increased humidity had a negative effect on the fatigue properties of AA2024-T351.
38 25 References [1] Dungore, P. A., A., 2008, "Special Heat Treatment Practices for Aerospace Aluminum Alloys," Heat Treating Progress Magazine, pp [2] Epstein, A., Smallfield, J., Guan, H., 1999, "Corrosion Protection of Aluminum and Aluminum Alloys by Polyanilines: A Potentiodynamic and Photoelectron Spectroscopy Study," Synthetic Metals, 102(1-3) pp [3] Szklarska-Smialowska, Z., 1999, "Pitting Corrosion of Aluminum," Corrosion Science, 41(9) pp [4] Denny, A. J., 1996, "Principles and Prevention of Corrosion,". [5] Tavakkolizadeh, M., and Saadatmanesh, H., 2001, "Galvanic Corrosion of Carbon and Steel in Aggressive Environments," Journal of Composites for Construction, 5pp [6] Pawlowski, L., 2008, "The science and engineering of thermal spray coatings," Wiley,. [7] Schmidt, D., Shaw, B., Sikora, E., 2006, "Corrosion Protection Assessment of Sacrificial Coating Systems as a Function of Exposure Time in a Marine Environment," Progress in Organic Coatings, 57(4) pp
39 26 [8] Sun, S., Zheng, Q., Li, D., 2009, "Long-Term Atmospheric Corrosion Behaviour of Aluminium Alloys 2024 and 7075 in Urban, Coastal and Industrial Environments," Corrosion Science, 51(4) pp [9] Shah, K., and Iroh, J., 2002, "Electrochemical Synthesis and Corrosion Behavior of Poly (N-Ethyl Aniline) Coatings on Al-2024 Alloy," Synthetic Metals, 132(1) pp [10] Merl, D. K., Panjan, P., Čekada, M., 2004, "The Corrosion Behavior of Cr-(C, N) PVD Hard Coatings Deposited on various Substrates," Electrochimica Acta, 49(9-10) pp [11] Charrier, C., Jacquot, P., Denisse, E., 1997, "Aluminium and Ti/Al Multilayer PVD Coatings for Enhanced Corrosion Resistance," Surface & Coatings Technology, 90(1-2) pp [12] Senna, L., Achete, C., Simão, R., 2001, "Comparative Study between the Electrochemical Behavior of TiN, TiCxNy and CrN Hard Coatings by using Microscopy and Electrochemical Techniques," Materials Research, 4pp [13] Shaw, B., Shaw, W., and Schmidt, D., 2006, "Corrosion of Metallic Coatings," ASM Handbook, 13Cpp. 61. [14] Amateau, M. F., and Eden, T. J., 2000, "High-Velocity Particle Consolidation Technology," IMAST Quarterly, 2pp. 3-6.
40 27 [15] K. Sakaki, 2004, "Cold Spray Process-Overview and Application Trends," Materials Science Forum, pp [16] A. P. Alkhimov, A. N. Papyrin, V. F. Kosarev, N. I. Nesterovich, M. M. Shushpanov, 1994, "Gas-Dynamic Spraying Method for Applying a Coating," (5,302,414) pp [17] Irissou, E., Legoux, J. G., Ryabinin, A. N., 2008, "Review on Cold Spray Process and Technology: Part I Intellectual Property," Journal of Thermal Spray Technology, 17(4) pp [18] Guilemany, J., Cinca, N., Dosta, S., 2009, "Corrosion Behaviour of Thermal Sprayed Nitinol Coatings," Corrosion Science, 51(1) pp [19] Schmidt, D., Shaw, B., Shaw, W., 2006, "Corrosion Protection Assessment of Barrier Properties of several Zinc-Containing Coating Systems on Steel in Artifi Cial Seawater," Corrosion, 62(04). [20] Guan, H., and Buchheit, R., 2004, "Corrosion Protection of Aluminum Alloy T3 by Vanadate Conversion Coatings," Corrosion, 60(03). [21] Vasconcelos, D., Carvalho, J., Mantel, M., 2000, Journal of Non-Crystalline Solids, 273(1-3) pp [22] Keir, D., Pryor, M., and Sperry, P., 1967, "Galvanic Corrosion Characteristics of Aluminum Alloyed with Group IV Metals," Journal of the Electrochemical Society, 114pp. 777.
41 28 [23] Shaw, B., Frankel, G., Murray, J., 2009, "Short Course on Corrosion: Fundamentals and Experimental Methods," Anonymous Penn State University Corrosion Center,. [24] Gray, L. G. S., Graham, R. G., Datta, V. J., 2003, "Using EIS to Better Understand Tank Lining Performance in Laboratory and Field Evaluation," CORROSION 2003,. [25] Calle, L., and MacDowell, L. G., 2001, "Evaluation of Molybdate Conversion Coatings for Aluminum Alloys by Electrochemical Impedance Spectroscopy," 5 th International Symposium on Electrochemical Impedance Spectroscopy, Anonymous. [26] Keddam, M., Kuntz, C., Takenouti, H., 1997, "Exfoliation Corrosion of Aluminium Alloys Examined by Electrode Impedance* 1," Electrochimica Acta, 42(1) pp [27] Zhu, L., and Song, G., 2006, "Improved Corrosion Resistance of AZ91D Magnesium Alloy by an Aluminium-Alloyed Coating," Surface & Coatings Technology, 200(8) pp [28] Rivera, B. F., Johnson, B. Y., O'Keefe, M. J., 2004, "Deposition and Characterization of Cerium Oxide Conversion Coatings on Aluminum Alloy 7075-T6," Surface & Coatings Technology, 176(3) pp [29] Panossian, Z., Mariaca, L., Morcillo, M., 2005, "Steel Cathodic Protection Afforded by Zinc, Aluminium and zinc/aluminium Alloy Coatings in the Atmosphere," Surface & Coatings Technology, 190(2-3) pp
42 29 [30] Zhang, B., Li, Y., and Wang, F., 2007, "Electrochemical Corrosion Behaviour of Microcrystalline Aluminium in Acidic Solutions," Corrosion Science, 49(5) pp [31] Enders, B., Krauss, S., and Wolf, G., 1994, "Corrosion Properties of Aluminum Based Alloys Deposited by Ion Beam Assisted Deposition," Surface & Coatings Technology, 65(1-3) pp [32] Irissou, E., and Arsenault, B., "Corrosion Study of Cold Sprayed Aluminum Coatings Onto Al 7075 Alloy Substrates," ITSC 2007,. [33] Lonyuk, B., Apachitei, I., and Duszczyk, J., 2007, "The Effect of Oxide Coatings on Fatigue Properties of 7475-T6 Aluminium Alloy," Surface and Coatings Technology, 201(21) pp [34] Kobayashi, M., Matsui, T., and Murakami, Y., 1998, "Mechanism of Creation of Compressive Residual Stress by Shot Peening," International Journal of Fatigue, 20(5) pp [35] De Los Rios, E., Walley, A., Milan, M., 1995, "Fatigue Crack Initiation and Propagation on Shot-Peened Surfaces in A316 Stainless Steel," International Journal of Fatigue, 17(7) pp [36] Hertzberg, R., 1995, John Wiley and Sons, New York, pp. 546.
43 30 [37] Torres, M., and Voorwald, H., 2002, "An Evaluation of Shot Peening, Residual Stress and Stress Relaxation on the Fatigue Life of AISI 4340 Steel," International Journal of Fatigue, 24(8) pp [38] Ghelichi, R., and Guagliano, M., 2009, "Coating by the Cold Spray Process: A State of the Art," Frattura Ed Integrità Strutturale, (8). [39] Majzoobi, G., Nemati, J., Novin Rooz, A., 2009, "Modification of Fretting Fatigue Behavior of AL7075-T6 Alloy by the Application of Titanium Coating using IBED Technique and Shot Peening," Tribology International, 42(1) pp [40] Price, T., Shipway, P., and McCartney, D., 2006, "Effect of Cold Spray Deposition of a Titanium Coating on Fatigue Behavior of a Titanium Alloy," Journal of Thermal Spray Technology, 15(4) pp [41] Ibrahim, A., and Berndt, C., 1998, "The Effect of High-Velocity Oxygen Fuel, Thermally Sprayed WC Co Coatings on the High-Cycle Fatigue of Aluminium Alloy and Steel," Journal of Materials Science, 33(12) pp [42] Brandt, O., 1995, "Mechanical Properties of HVOF Coatings," Journal of Thermal Spray Technology, 4(2) pp [43] Saini, B., and Gupta, V., 2010, "Effect of WC/C PVD Coating on Fatigue Behaviour of Case Carburized SAE8620 Steel," Surface and Coatings Technology,.
44 31 [44] McGrann, R., Greving, D., Shadley, J., 1998, "The Effect of Coating Residual Stress on the Fatigue Life of Thermal Spray-Coated Steel and Aluminum," Surface and Coatings Technology, 108(1-3) pp [45] Ibrahim, A., and Berndt, C. C., 2007, "Fatigue and Deformation of HVOF Sprayed WC-Co Coatings and Hard Chrome Plating," Materials Science and Engineering: A, 456(1-2) pp [46] Oh, J., Komotori, J., and Song, J., 2008, "Fatigue Strength and Fracture Mechanism of Different Post-Fused Thermal Spray-Coated Steels with a Co-Based Self-Fluxing Alloy Coating," International Journal of Fatigue, 30(8) pp [47] Akebono, H., Komotori, J., and Shimizu, M., 2008, "Effect of Coating Microstructure on the Fatigue Properties of Steel Thermally Sprayed with Ni-Based Self- Fluxing Alloy," International Journal of Fatigue, 30(5) pp [48] Liu, P. L., Shang, J. K., and Popoola, O. O., 2000, "Fatigue Behavior of a Thermally Sprayed Low Carbon Steel Coating," Materials Science and Engineering A, 277(1-2) pp [49] Voris, H. C., and Jahn, M. T., 1990, "Fatigue of Aluminium Alloy 2024-T351 in Humid and Dry Air," Journal of Materials Science, 25(11) pp
45 32 Chapter 3 : DC Corrosion Testing of Cold Spray Applied CP-Al Coatings on AA2024-T3 and AA7075-T6 Substrates Abstract Direct current (DC) experimentation was used to test the corrosion protection of commercially pure aluminum (CP-Al) and A7005 coatings that were applied to the T3 and 7075-T6 aluminum alloys, respectively, via the Cold Spray process. Four DC corrosion techniques were run to test the corrosion susceptibility of the samples: (1) Open Circuit Potential, (2) Linear Polarization, (3) Potentiodynamic Polarization, and (4) Galvanic Corrosion. These tests were employed on bare substrates without coatings along with four other specimen types, including the alloys covered with: (1) CP-Al coating, (2) conventional chromate conversion coating, (3) CP-Al coating and conventional sealant, and (4) CP-Al coating, chromate conversion coating, and conventional sealant. Various surface preparations and carrier gases were used in the Cold Spray process. The surface preparations included: (1) Al 2 O 3 grit blast at 45, (2) glass bead grit blast at 45, (3) glass bead grit blast at 90, (4) SiC grit blast at 45. The carrier gases included nitrogen and helium. The surface preparation and carrier gas combinations were studied to see if any offered superior corrosion protection to the aluminum alloys. Corrosion rates along with passivity tendencies obtained from the DC tests were analyzed. It was found that Cold Spray applied pure aluminum coatings offered increased corrosion protection over the bare AA2024-T3 substrate, while no significant difference in corrosion protection was observed between sealed specimens with or without the chromate conversion coating.
46 33 Introduction The 2024-T3 and 7075-T6 aluminum alloys are widely used in the aerospace industry due to their excellent strength to weight ratios. Unfortunately, these are the least resistant to corrosion of all aluminum alloys. Currently, chromate conversion coatings are used to prevent the corroding of the alloys while maintaining their desirable mechanical properties. Chromate coatings are inherently toxic, however, and the need arises for safer coatings that can offer similar protection. In some cases, proper heat treatment and aging can increase the corrosion protection of these aluminum alloys. However, instances occur when the heat treatment and aging processes are not possible. In these cases, several methods exist to apply coatings that can protect aluminum alloys from corrosion. One of the most common methods used to apply coatings is a thermal spray technique. This involves heating a material to a plastic or molten state and then using a compressed gas stream to accelerate the material onto an underlying substrate. As the droplets of material hit the underlying substrate, they build up to form a coating. If the material being deposited is a metal then the coating will often contain the oxides of this metal. The bond holding the coating to the underlying material can consist, either individually or in combination, of mechanical, chemical, or metallurgical bonding [1]. Coatings applied via thermal spray can be either anodic or cathodic to the underlying substrate. Corrosion occurs in the anode, and most coatings are designed to be anodic with the underlying substrate so that they sacrificially corrode instead of the underlying substrate [2]. Several studies have shown that thermal spray techniques can be used to protect materials from corrosion. Schmidt et al [3].
47 34 showed that zinc coatings deposited onto steel substrates by flame spray were more protective than those deposited by arc spray as determined from visual observations, open circuit potential measurements, and EIS impedance values. Anodizing, which consists of producing an oxide layer on aluminum that provides protection from corrosion, is commonly used for both the 2xxx and 7xxx series alloys. This process involves the use of chemicals that are hazardous to the environment and has special safety requirements. Large components must also be fully submerged for this process to be effective. Throughout the anodizing process, coating uniformity is difficult to maintain. Additionally, anodizing can reduce an aluminum alloys fatigue strength by 60% [4]. In addition to the above issues, it is difficult to repair anodized surfaces. Another method to apply protective coatings to aluminum alloys is the hot dip method. This consists of dipping the aluminum substrate into a molten material. The material then cools and adheres to the aluminum, forming a protective coating. The hot dip method is normally associated with zinc coatings applied to steel as opposed to aluminum coatings. Panossian et al [5]. found that hot dipped aluminum coatings only offer cathodic corrosion protection to steel when in the presence of a very high chloride containing atmosphere. Electroplating, or electrodeposition, is another method used to apply coatings to aluminum substrates through the use of electrical current. This involves polarizing a given substrate in the presence of the ions of another metal, thereby attracting this other metal to the given substrate. The coated metal usually exists as positively charged ions in an electrolyte bath while the substrate to be coated is placed in this bath and acts as the
48 35 negatively charged cathode. A power supply provides the current needed to carry out this electrolytic process. Shah et al [6]. showed that electroplating aluminum onto a 2024 substrate can reduce corrosion rates by an order of magnitude. Alternative coating techniques to electroplating involve vaporization deposition, specifically physical vapor deposition (PVD) or chemical vapor deposition (CVD). These two processes are inherently similar, except that in the case of PVD the material to be deposited starts in solid form while in CVD the material to be deposited starts in gaseous form. The process works by bombarding a material to be deposited with a high energy source to vaporize the atoms on the material. The atoms are then carried and deposited onto the underlying substrate. Studies have shown that various coatings, including pure aluminum, have helped to improve the corrosion characterizations of steel substrates [7-9]. Aluminum coatings deposited onto carbon steel in one study were shown to lower corrosion current densities from 30 ua cm -2 to 0.7 ua cm -2 [8]. A fairly new technology that is quickly gaining popularity in the application of coatings is High Velocity Particle Consolidation (HVPC), also known as the Cold Spray process. HVPC can be classified as a thermal spray process, although it is unique in that it does not require particles to be applied to substrates in a molten state [10]. This process involves accelerating a coating material onto a substrate at extremely high speeds, but at relatively low temperatures. Henceforth problems usually associated with thermal spray processes, like coatings that experience phase transformations, oxidation, or recrystallization, are eliminated with the HVPC process [11]. Another problem with thermal spray processes is that as the coating and substrate cool, they have different
49 36 coefficients of expansion that lead to residual stresses and distortions in the final coating [11]. These distortions cause a decrease in mechanical properties and corrosion resistance of the coating. HVPC, working with temperatures much lower than those of the thermal spray process, eliminates this issue [11]. There are no metal fumes in the Cold Spray process, and there is a reduction in noise levels in comparison with thermal spray processes [11]. Also, Cold Spray systems are less complex than thermal spray systems and therefore the start up costs are more desirable [11]. A significant benefit of the HVPC process, especially in respect to aerospace applications, is the emergence of portable application designs [12]. If a coating were to chip off in the field, it is possible to re-apply the coating on site which saves time, money, and resources. There is therefore much interest in the researching of coatings applied by the HVPC process. Experimental Procedures The samples tested were 2024-T3 and 7075-T6 aluminum alloys (AA2024-T3 and AA7075-T6) coated with commercially pure and A7005 aluminum, respectively, applied via the Cold Spray process. There were four surface preparations of the substrate: (1) glass bead grit blast at 45 degrees, (2) glass bead grit blast at 90 degrees, (3) alumina bead grit blast at 45 degrees, and (4) silicon carbide blast at 45 degrees. Two different carrier gases were used to apply the Cold Spray coatings, helium and nitrogen. Coatings were applied to a thickness of inches ± inches. An AA2024-T3 sample was
50 37 also coated with a chromate conversion coating only and tested in order to compare it with the Cold Spray applied coatings. A sealant was applied to some as-sprayed coatings. Two different sealing types were utilized; the first sealant type involved a chromate conversation coating to help with adhesion of the paint layer. The second type was identical to the first type, except without the chromate conversion coating. The chemical processing of the sealant, not including the chromate conversion, involved an aqueous alkaline degreaser, deoxidizer, alkaline etch, and a desmut bath (using Oakite LNC). The chromate conversion coating used was an Oakite Chromicoat L25. The painting operation used a primer following MIL-PRF (Type 1, Class C2) and a topcoat following MIL-PRF (Type 1). A chart correlating sample preparation and carrier gas to sample identification used in this thesis can be found in Table 3-1. Table 3-1. Sample Identification of AA2024-T3 and AA7075-T6 Test Specimens Sample Designation Surface Preparation Main Process Gas A-N Al 2 O 3 Grit Blast at 45 Nitrogen G4-H Glass Bead Applied 45 Helium G4-N Glass Bead Applied 45 Nitrogen G9-N Glass Bead Applied 90 Nitrogen S-N SiC Grit Blast at 45 Nitrogen X-X-S A sample described above that is scribed X-X-C X-X-NC A sample described above that is sealed and with chromate coating A sample described above that is sealed and without Chromate Coating All experiments were performed using a Gamry Reference600 potentiostat. A conventional three electrode cell was used, consisting of a saturated calomel electrode used as reference electrode, graphite rod used as counter electrode, and using the given
51 38 samples as the working electrodes. The salt solution used in cells conformed to ASTM D and consisted of a 3.5% NaCl solution. Approximately 40 milliliters of unstirred solution was used in each cell. A representative electrochemical cell is shown in Figure 3-1. Figure 3-1. An example of an electrochemical cell used to perform DC test measurements Open Circuit Potential (OCP) The open circuit potential measurement, also known as the corrosion potential, is a summation of the half-cell reaction potentials in the electrolyte of interest and is monitored by measuring the potential vs. a reference electrode using a high impedance voltmeter or electrometer. The potential vs. time response data was collected and stopped when the specimen had reached a steady-state potential with the 3.5% NaCl artificial seawater electrolyte. Steady-state normally occurred within one to three hours of immersion. The corrosion potential is the basis for the linear and potentiodynamic polarization experiments, and so abbreviated OCP measurements were also taken before these tests. The ASTM G-69 standard practice for testing OCP was followed.
52 39 Linear Polarization Testing The polarization resistance test is a non-destructive electrochemical technique in which the potential of a metal is scanned over a small range relative to the open circuit potential and the resulting current is measured. Over this small range, the current vs. voltage curve plotted on a linear graph is a straight line for many metals. Using the slope of the linear portion of the data, the polarization resistance value, Rp, can be obtained. The polarization resistance is used to calculate the corrosion current density, icorr, by the tafel slopes determined from polarization resistance tests and the Stearn-Geary equation presented as Equation (1). Equation (1) Where: icorr: The corrosion current (Amps) βa: The anodic tafel slope constant (Volts per decade) βc: The cathodic tafel slope constant (Volts per decade) Rp: The polarization Resistance value determined from the linear polarization experiment The corrosion current density can ultimately be used to determine the corrosion rate of the metal/coating using Equation (2). Equation (2) Where: CR: The corrosion rate in milli-inches per year (mpy) icorr: The corrosion current in amps k: A constant, 1.288x10 5 milliinches (amp-cm-year) EW: The equivalent weight in grams per equivalent D: The density of the sample in grams per cubic centimeter A: The sample area in square centimeters
53 40 All polarization experiments were performed at ambient room temperature on specimen which had stabilized in artificial seawater, open to air, for 3 hours. The potential was scanned at 0.2 mv/s over a sample area of 10 cm 2. Potentiodynamic Testing In the potentiodynamic polarization test the sample is scanned over a large range of voltages relative to the open circuit potential. Anodic and cathodic information along with passivity information can then be ascertained. The potentiodynamic scans were run at 5 mv/s from an initial voltage of -500 mv below OCP to a final voltage of 1500 mv above OCP. The ASTM G-5 and G-59 standard practices for making potentiodynamic polarization measurements were followed. After the graphs were generated, Gamry Echem Analyst software was used in order to generate corrosion rates for the samples. To do this, both an anodic and cathodic section of the resulting curve was chosen. The software then used a linear regression to fit the curve to the Butler-Volmer equation, shown in Equation 3, and to obtain the resulting tafel slopes and corrosion current. Where: I: The measured cell current (Amps) icorr: The corrosion current (Amps) E: The electrode potential (Volts) Eoc: The open circuit potential (Volts) βa: The anodic tafel slope constant (Volts per decade) βc: The cathodic tafel slope constant (Volts per decade) Equation (3)
54 41 These values were then used in conjunction with Equation (2) to obtain the corrosion rates presented in the polarization resistance section of this thesis. Galvanic Testing vs Graphite, Stainless Steel and Titanium When two dissimilar metals in electrical contact are exposed to a common electrolyte, one of the metals can undergo increased corrosion while the other can show decreased corrosion. This type of accelerated corrosion is referred to as galvanic corrosion. Each as-sprayed and sealed sample was coupled to graphite, stainless steel and titanium. The Reference600 potentiostat was then used as a zero resistance ammeter to measure the current flowing between the sample and other material. This galvanic current between the dissimilar materials was measured at a limiting current of 25 ma/cm 2, while both were immersed in artificial seawater. The ASTM standard G-71 was followed while running the galvanic tests. Results and Discussion: Open Circuit Potential (OCP): AA2024 Figure 3-2 shows the open circuit potential measurements, run in triplicate, for assprayed and sealed CP-Al coatings on AA2024-T3. All samples were more negative than the bare or chromate coated AA2024 substrate. The as-sprayed samples offer cathodic protection to the underlying aluminum alloys, and therefore the OCP s of the as-sprayed samples are significantly lower (more negative) than the bare AA2024 aluminum and chromate coated AA2024 substrate. A minimum of 200mV exists between the lowest OCP value obtained of the bare substrate and the highest OCP value of the as-sprayed substrate. All as-sprayed plates were more negative than the bare AA2024 substrate on
55 42 average by mv. All sealed plates were more negative than the bare AA2024 substrate on average by mv. Upon comparing all samples, the least negative OCP was obtained most consistently by the chromate coated AA2024 substrate which possessed an average OCP of -667mV. A comparison of the bare, chromate coated, and as-sprayed AA2024 specimens can be seen in Figure 3-3. This figure demonstrates the lower open circuit potentials exhibited by the as-sprayed specimens in comparison to the bare or chromate coated AA2024 samples, and therefore the cathodic protection offered to the 2024 aluminum alloy Open Circuit Potential AA2024 Samples Open Circuit Potential (mv) A-N-C G4-H-C G4-N-C G9-N-C S-N-C A-N-NC G4-H-NC G4-N-NC G9-N-NC S-N-NC A-N G4-H G4-N G9-N S-N Bare 2024 Chromate Plate Designation Figure 3-2. Open Circuit Potential Measurements for AA2024-T3 Samples
56 43 Figure 3-3. OCP of bare, chromate coated, and as-sprayed AA2024 specimens Open Circuit Potential: AA7075 Figure 3-4 shows the open circuit potential measurements, run in triplicate, for assprayed and sealed A7005 coatings on AA7075-T6; the results varied significantly per condition as well as per sample. The as-sprayed coatings displayed more negative OCPs on average than the bare AA7075 substrate, while the sealed specimens showed OCP ranges within that of the bare AA7075 substrate. As-sprayed plates were more negative than bare AA7075 substrates by on average 200mV (See Appendix I: Table 3-2). The as-sprayed samples which had substrates prepared with alumina grit blast were significantly more negative than bare AA7075 samples. As-sprayed samples with substrates prepared using the glass bead grit blast yielded a wide range of values, both more and less negative than bare AA7075. This could be due to a defect in the coating at one of the areas measured. A defect would cause the open circuit potential to change from that of the coating and to approach the OCP of the underlying substrate, in this case
57 44 the bare 7075 alloy. This would explain why some measurements were at the mv range, consistent with the other as-sprayed AA2024 samples, while one was at the -900 mv range that was more consistent with the bare AA7075 substrate. There didn t appear to be a significant difference between the sealed specimen, with or without chromate. The samples prepared with the alumina grit blast had a more negative OCP in the sealed with chromate condition than in the sealed without chromate coating. This means that, thermodynamically, the sample with the chromate coating has a higher tendency to corrode than the sample without the chromate coating Open Circuit Potential of AA7075 Samples A-N-C G4-N-C A-N-NC Open Circuit Potential (mv) G4-N-NC A-N G4-N Bare Plate Designation Figure 3-4. Open circuit potential for AA7075-T6 samples Polarization Resistance: AA2024 Figure 3-5 presents the corrosion rates calculated from polarization resistance experiments for as-sprayed and sealed CP-AL coatings on AA2024-T3. Corrosion rates were obtained by fitting the plot of the polarization resistance experiment and utilizing the Stern-Geary Equation. Examples of polarization resistance plots with the fits used to calculate the Rp values are shown in Figures 3-6 and 3-7. As-sprayed samples displayed
58 45 corrosion rates similar to the bare AA2024 substrate. One as-sprayed plate, that was surface prepared by glass bead grit blast at 45 and used nitrogen as the carrier gas (G4- N), consistently yielded a lower corrosion rate (0.3 mpy on average) than bare AA2024. The chromate coated AA2024 showed lower corrosion rates than the bare and as sprayed AA2024 coatings by almost an order of magnitude. All sealed AA2024 samples produced graphs much more erratic then those of the as-sprayed plates, but showed significantly lower corrosion rates than bare or chromate coated AA2024. A significant difference in corrosion rates between chromate and non-chromate sealed samples was not noted. Corrosion Rates of 2024 Samples Obtained from Polarization Resistance Tests Based On Rp Value 1e+1 1e+0 Corrosion Rate (mpy) 1e-1 1e-2 1e-3 1e-4 1e-5 1e-6 1e-7 A-N-C G4-H-C G4-N-C G9-N-C S-N-C A-N-NC G4-H-NC G4-N-NC G9-N-NC S-N-NC A-N Plate Designation G4-H G4-N G9-N S-N Bare 2024 Chromate Figure 3-5. Corrosion rate data for AA2024-T3 specimen.
59 46 Figure 3-6. Linear polarization curve and curve fit used to calculate Rp of chromate coated sample. Figure 3-7. Linear polarization curve and curve fit used to calculate Rp of sample G4-H-C. Polarization Resistance: AA7075 Figure 3-8 shows the corrosion rate data for as-sprayed and sealed A7005 coatings on AA7075-T6. The corrosion rates for the as-sprayed samples are an order of magnitude higher than the bare AA7075 sample. The sealed samples have corrosion rates four to five orders of magnitude lower than the bare substrate and five to six orders of
60 47 magnitude lower than the as-sprayed samples. There was no observed difference in corrosion rates between the chromate and non-chromate sealed samples. An example of a polarization resistance curve and fit is shown in Figure 3-9. The average corrosion rates obtained from all samples can be found in Appendix I: Table e+1 1e+0 Corrosion Rates of 7075 Bare and As-Sprayed Specimen Obtained from Polarization Resistance Tests 1e-1 A-N-C G4-N-C A-N-NC G4-N-NC A-N G4-N Bare 7075 Corrosion Rate (mpy) 1e-2 1e-3 1e-4 1e-5 1e-6 1e-7 1e-8 Plate Designation Figure 3-8. Corrosion Rates obtained from polarization resistance tests of AA7075-T6 samples. Figure 3-9. Linear polarization curve and slope line used to calculate Rp of Bare AA7075-T6 sample
61 48 Potentiodynamic Polarization Corrosion Rates: AA2024 Figure 3-10 shows the corrosion rates calculated for the CP-AL coatings on AA2024-T3. The bare AA2024 yielded corrosion rates which varied over a very wide range, from about 5 mpy to about 34 mpy. The as-sprayed samples, however, all resulted in consistent corrosion rates, obtained by Tafel slopes and Equation (2), of less than 5 mpy. The data shows that the as-sprayed samples performed much better in this test than the bare AA2024 substrate. The as-sprayed samples also had corrosion rates comparable to the chromate coated AA2024 sample. An example a potentiodynamic polarization curve for an as-sprayed sample and the corresponding fit used to find tafel slopes and the corrosion current is included as Figure Obtaining consistent data for sealed specimens from the potentiodynamic polarization experiment was extremely difficult as data yielded graphs that were erratic and difficult to analyze. The data that was accurate and consistent showed corrosion rates an order of magnitude lower than those of the assprayed samples. Appendix 1: Table 3-4 shows the corrosion rates obtained from the potentiodynamic polarization experiment on all samples.
62 49 1e+2 Corrosion Rate Obtained From Tafel Slopes For As-Sprayed AA2024 Samples 1e+1 1e+0 Corrosion Rate (mpy) 1e-1 1e-2 1e-3 1e-4 1e-5 1e-6 1e-7 A-N-C G4-H-C G4-N-C G9-N-C S-N-C A-N-NC G4-H-NC G4-N-NC G9-N-NC S-N-NC A-N Plate Designation G4-H G4-N G9-N S-N Bare 2024 Chromate Figure Corrosion Rates obtained from potentiodynamic polarization tests for AA2024-T3 samples. Figure Potentiodynamic polarization plot and corresponding tafel slope fit of sample G4-H. Potentiodynamic Polarization Corrosion Rates: AA7075 Figure 3-12 shows that the corrosion rates of as-sprayed A7005 coatings on AA7075-T6 varied an order of magnitude from 0.3 to 3 mpy, while the bare AA7075
63 50 substrate had a range of corrosion rates that varied from 0.05 to 0.3 mpy. The bare AA7075 therefore performed much better in this experiment than the as-sprayed coatings. The sealed samples had corrosion rates on the order of 10-6 mpy, six orders of magnitude lower than the as-sprayed samples and five orders of magnitude below the bare AA7075 sample. The non chromate sealed samples had slightly higher corrosion rates than the chromate sealed samples. Appendix 1: Table 3-4 provides the raw data obtained from each replicate. 1e+1 Corrosion Rate Obtained From Tafel Slopes For AA7075 Bare and As-Sprayed Samples 1e+0 Corrosion Rate (mpy) 1e-1 1e-2 1e-3 1e-4 1e-5 1e-6 1e-7 A-N-C G4-N-C A-N-NC G4-N-NC A-N Plate Designation G4-N Bare 7075 Figure Corrosion Rates obtained from potentiodynamic polarization tests for AA7075-T6 samples. Potentiodynamic Polarization Passivation Region: AA2024 The passivation region of a potentiodynamic polarization curve can show the corrosion protection offered by a coating. This region shows that as the applied voltage increases throughout the experiment, the corrosion current stays constant. These results indicate a potential range which is a protective region of voltages in which the material
64 51 will not corrode; a large passivation region is desirable. The as-sprayed samples provided data that was more consistent and reproducible than sealed samples. Figure 3-13 shows the potentiodynamic polarization curves for a representative bare, chromate coated, and as-sprayed AA2024 specimen. There is a negligible passivation region for the bare sample, a slightly larger region for the chromate coated sample, and a large passivation region on the representative as-sprayed sample. Figure 3-14 shows the size of the passivation region for each sample for the CP- AL coatings on AA2024-T3. Pitting potential ranges for most of the sealed specimens were in the positive range, while as-sprayed samples alone had pitting potentials that were negative. The bare AA2024 sample showed a negligible passivation region during these experiments. The chromate coated AA2024 sample provided, on average, a passivation region of around 240 mv. The as-sprayed samples yielded passivation regions anywhere from 400 to 780 mv, with the majority of data resulting in passivation regions above 550 mv. The sealed samples yielded data which varied significantly and was difficult to analyze with confidence. Some passivation potentials were lower than the as-sprayed samples, and some were as high as 1400 mv.
65 52 Figure The potentiodynamic polarization region of bare AA2024, chromate coated, and a representative as sprayed specimens Passivation Region of AA2024 Samples 1400 Passivation Region (mv) A-N-C G4-H-C G4-N-C G9-N-C S-N-C A-N-NC G4-H-NC G4-N-NC G9-N-NC S-N-NC A-N G4-H G4-N G9-N S-N Chromate 0 Plate Designation Figure Potentiodynamic polarization tests which indicate the passivation regions for the AA2024-T3 samples. Potentiodynamic Polarization Passivation Region: AA7075 Figure 3-15 shows the results of the potentiodynamic polarization tests which indicate the range of the passivation region for the A7005 coatings on AA7075-T6. As-
66 53 sprayed plates had slightly larger passivation ranges than bare AA7075 samples, which displayed passivation ranges from 130 to 250 mv. The G4-N sample resulted in passivation ranges that varied in value from 100 mv to 400 mv, while the A-N sample displayed a passivation region which ranged from 150 to 230 mv. The passivation ranges of the sealed AA7075 samples were extremely difficult to analyze due to the fact that the pitting potential was never reached in most tests. In general, the passivation ranges seem to be an order of magnitude higher than either the as-sprayed or bare samples. There is no difference in passivation regions between the chromate and non-chromate coated sealed samples. The average values from three replicates are presented in Table 3-5 of Appendix I Passivation Region of AA7075 Bare and As-Sprayed Samples 2000 Passivation Region (mv) A-N-C G4-N-C A-N-NC G4-N-NC A-N Plate Designation G4-N Bare 7075 Figure Potentiodynamic polarization tests which indicate the passivation regions for the AA7075-T6 samples.
67 54 Galvanic Corrosion-Graphite: AA2024 Figure 3-16 shows the galvanic corrosion currents obtained for CP-AL coatings on AA2024-T3 vs graphite. The galvanic current between the bare AA2024 substrate and graphite was the same order of magnitude as that of the chromate coated AA2024 and assprayed samples. The data obtained was consistent and very reproducible. The sealed samples had galvanic currents five to seven orders of magnitude lower than that of the bare and as-sprayed AA2024. This means that sealed specimens have a much lower tendency to corrode when coupled with graphite than bare or chromate coated AA2024 samples. Non-chromate sealed coatings yielded a wider range of currents, but all sealed samples acted similarly. The S-N-NC sample had currents an order of magnitude higher than all other sealed samples. Table 3-6 of Appendix I shows the average data for all samples.
68 55 Galvanic Current of AA2024 As-Sprayed Plates with Graphite 1e+10 1e+9 1e+8 1e+7 Current (pa) 1e+6 1e+5 1e+4 1e+3 1e+2 1e+1 1e+0 1e-1 A-N-C G4-H-C G4-N-C G9-N-C S-N-C A-N-NC G4-H-NC G4-N-NC G9-N-NC S-N-NC A-N G4-H G4-N G9-N S-N Bare 2024 Chromate Plate Designation Figure Galvanic corrosion data showing the current obtained for AA2024-T3 samples vs graphite. Galvanic Corrosion-Stainless Steel: AA2024 After examining data shown in Figure 3-17 from AA2024-T3 specimens that were coupled vs. stainless steel, the following was observed. The galvanic current between the bare AA2024 and stainless steel was the same order of magnitude as the assprayed samples. The chromate coated AA2024 sample displayed a galvanic current an order of magnitude lower than the as-sprayed samples. This indicates that as-sprayed coatings have a lower tendency to corrode than bare AA2024, but a higher tendency to corrode than chromate coated AA2024 when coupled to stainless steel. The sealed specimens had currents three to five orders of magnitude lower than bare or chromate coated substrates when coupled to stainless steel. There were no appreciable differences between the chromate and non-chromate coated sealed samples. Appendix I: Table 3-6 shows the average data for all samples.
69 56 1e+9 1e+8 1e+7 1e+6 Galvanic Current of AA2024 Samples with Stainless Steel Current (pa) 1e+5 1e+4 1e+3 1e+2 1e+1 1e+0 1e-1 A-N-C G4-H-C G4-N-C G9-N-C S-N-C A-N-NC G4-H-NC G4-N-NC G9-N-NC S-N-NC A-N G4-H G4-N G9-N S-N Bare 2024 Chromate Plate Designation Figure Galvanic corrosion data showing the current obtained for AA2024-T3 samples vs stainless steel. Galvanic Corrosion-Titanium: AA2024 Figure 3-18 shows the data obtained for the AA2024-T3 specimens coupled to titanium. The currents of as-sprayed samples are the same order of magnitude as bare AA2024 and one order of magnitude higher than the chromate coated substrate. The measured currents of sealed samples were four to five orders of magnitude below that of the bare substrate. There was no appreciable difference between the currents of the chromate and non-chromate coated sealed AA2024 substrates. Comparing sealed coatings, the two with the highest measured currents were both non-chromate sealed samples. Also noteworthy, the non-chromate coated sealed sample with alumina surface preparation and nitrogen carrier gas (A-N-NC) displayed currents that measured four to five orders of magnitude above all other sealed coatings. This appears to be due to a defect that formed in the coating of this sample, which would explain why the first measurement was comparable to other sealed samples while the final two measurements
70 57 were more comparable to those of the underlying AA2024 specimen. Table 3-6 of Appendix I shows the average data for all samples. 1e+8 Galvanic Current of AA2024 Samples with Titanium 1e+7 1e+6 Current (pa) 1e+5 1e+4 1e+3 1e+2 1e+1 1e+0 A-N-C G4-H-C G4-N-C G9-N-C S-N-C A-N-NC G4-H-NC G4-N-NC G9-N-NC S-N-NC A-N G4-H G4-N G9-N S-N Bare 2024 Chromate Plate Designation Figure Galvanic corrosion data showing the current obtained for AA2024-T3 samples vs titanium. Galvanic Corrosion-Graphite: AA7075 Figure 3-19 shows the galvanic current obtained for the A7005 coatings on AA7075-T6 vs. graphite. The galvanic current between the bare AA7075 sample and graphite was the same order of magnitude as the as-sprayed coatings. The sealed plates yielded currents eight orders of magnitude lower than the bare substrate. This means the sealed coatings have a much lower tendency to corrode than bare AA7075 when coupled with graphite. Table 3-6 of Appendix I shows the average data for all samples.
71 58 1e+10 Galvanic Current of AA7075 Samples with Graphite 1e+9 1e+8 A-N-C G4-N-C A-N-NC G4-N-NC A-N G4-N Bare 7075 Galvanic Current (pa) 1e+7 1e+6 1e+5 1e+4 1e+3 1e+2 1e+1 1e+0 1e-1 Plate Designation Figure Galvanic corrosion data showing the current obtained for AA7075 samples vs graphite. Galvanic Corrosion-Stainless Steel: AA7075 Figure 3-20 shows data from AA7075-T6 samples that were coupled with stainless steel. The currents of both as-sprayed samples were slightly higher, but still of the same order of magnitude, than the bare sample. The sealed specimens had currents seven to eight orders of magnitude lower than the bare substrate when coupled to stainless steel. One sample, G4-N-NC, had the most consistent data yet the highest average current. Both sealed samples prepared by alumina grit blast had the lower currents when coupled against stainless steel then the samples with glass bead grit blast. Table 3-6 of Appendix I shows the average data for all samples.
72 59 1e+10 1e+9 1e+8 1e+7 Galvanic Current of AA7075 Samples with Stainless Steel Current (pa) 1e+6 1e+5 1e+4 1e+3 1e+2 1e+1 1e+0 1e-1 A-N-C G4-N-C A-N-NC G4-N-NC A-N Plate Designation G4-N Bare 7075 Figure Galvanic corrosion data showing the current obtained for AA7075 samples vs stainless steel. Galvanic Corrosion-Titanium: AA7075 Figure 3-21 shows the galvanic currents obtained for the AA7075-T6 samples coupled to titanium. The bare substrate had currents consistently higher than those of the as-sprayed samples, although they were on the same order of magnitude. The as-sprayed sample prepared with glass bead grit blasting performed better than the sample with alumina grit blasting. The sealed samples displayed currents six to seven orders of magnitude lower than the bare substrate. There was not a significant difference between the chromate and non-chromate coated specimens. The glass bead sealed non-chromate sample (G4-N-NC) had the lowest galvanic current against titanium. Table 3-6 of Appendix I shows the average data for all samples.
73 60 1e+8 Galvanic Current of AA7075 Samples with Titanium 1e+7 1e+6 1e+5 Current (pa) 1e+4 1e+3 1e+2 1e+1 1e+0 1e-1 A-N-C G4-N-C A-N-NC G4-N-NC A-N Plate Designation G4-N Bare 7075 Figure Galvanic corrosion data showing the current obtained for AA7075 samples vs titanium
74 61 Conclusions As sprayed AA2024 specimens showed much lower open circuit potentials then bare substrates, meaning that they could offer cathodic protection to the underlying substrate. In corrosion rates obtained from the tafel slopes of potentiodynamic polarization graphs, the as sprayed AA2024 samples performed much better than the bare substrates but the bare AA7075 specimen outperformed the as sprayed samples. Non chromate and chromate coated sealed samples performed similarly. As sprayed and sealed AA2024 samples showed large passivation regions while the bare sample showed a negligible passivation region, showing that as sprayed samples offer superior corrosion protection. Bare and as sprayed AA7075 samples showed similar passivation regions. Sealed AA2024 and AA7075 specimens showed significant galvanic corrosion resistance compared to bare samples when coupled with graphite, stainless steel, or titanium. Chromate and non chromate sealed samples showed similar overall corrosion protection.
75 62 Appendix I: Raw Data of DC Tests Table 3-2. The average of three replicates of Open Circuit Potential measurements Open Circuit Plate Potential (mv) AA2024 SEALED A-N-C A -N-NC -934 G4-H-C -892 G4-H-NC -826 G4-N-C -853 G4-N-NC -878 G9-N-C -887 G9-N-NC -962 S-N-C -971 S-N-NC -982 As-Sprayed A-N G4-H G4-N G9-N S-N Bare Chromate -667 AA7075 Sealed A-N-C -859 A-N-NC -806 G4-N-C G4-N-NC -825 As-Sprayed A-N G4-N Bare
76 63 Table 3-3. The average of three measurements of corrosion rates obtained from polarization resistance experiments Plate AA2024 SEALED A-N-C A -N-NC G4-H-C G4-H-NC G4-N-C G4-N-NC G9-N-C G9-N-NC S-N-C S-N-NC Corrosion Rate (mpy) 6.82E E E E E E E E E E-06 As-Sprayed A-N 1.20 G4-H 1.18 G4-N 0.86 G9-N 1.71 S-N 1.60 Bare Chromate 0.18 AA7075 Sealed A-N-C A-N-NC G4-N-C G4-N-NC 1.02E E E E-07 As-Sprayed A-N 1.06 G4-N 0.44 Bare
77 64 Table 3-4. The Icorr and corrosion rate data obtained from potentiodynamic polarization testing. Plate Icorr (A/cm^2) Replicate 1 Replicate 2 Replicate 3 Corrosion Rate (mpy) Icorr (A/cm^2) Corrosion Rate (mpy) Icorr (A/cm^2) Corrosion Rate (mpy) AA2024 SEALED A-N-C 4.88E E E E-04 A -N-NC 5.57E E E E E E-05 G4-H-C 2.77E E E E E E-05 G4-H-NC 2.22E E-03 G4-N-C 2.36E E E E-03 G4-N-NC 5.05E E E E E E-04 G9-N-C G9-N-NC S-N-C 5.01E E-02 S-N-NC 2.50E E E E-04 As-Sprayed A-N 9.45E E E G4-H 7.75E E G4-N 3.44E E E G9-N 4.09E S-N 4.80E E Bare E E E Chromate 1.34E E E AA7075 Sealed A-N-C 3.87E E E E E E-06 A-N-NC 3.12E E E E E E-06 G4-N-C 3.56E E E E E E-06 G4-N-NC 1.62E E E E E E-06 As-Sprayed A-N 6.31E E E G4-N 5.71E E Bare E E E
78 65 Table 3-5. The average passivation regions, of samples run in triplicate, obtained from potentiodynamic polarization graphs Plate AA2024 SEALED A-N-C Passivation Region Range (mv) N/A A -N-NC 807 G4-H-C 1233 G4-H-NC N/A G4-N-C 467 G4-N-NC 960 G9-N-C 1019 G9-N-NC 510 S-N-C S-N-NC N/A N/A As-Sprayed A-N 741 G4-H 522 G4-N 603 G9-N 672 S-N 686 Bare 2024 N/A Chromate 240 AA7075 Sealed A-N-C 1688 A-N-NC 1328 G4-N-C 1339 G4-N-NC 1842 As-Sprayed A-N 197 G4-N 253 Bare *Average of 3
79 66 Table 3-6. The average current, from specimens run in triplicate, of samples coupled with graphite, stainless steel, or titanium Plate Average Current (pa) Graphite Stainless Steel Titanium AA2024 SEALED A-N-C A -N-NC G4-H-C G4-H-NC G4-N-C G4-N-NC G9-N-C G9-N-NC S-N-C S-N-NC As-Sprayed A-N 4.89E E E+07 G4-H 4.64E E E+07 G4-N 4.58E E E+07 G9-N 4.35E E E+07 S-N 4.44E E E+07 Bare E E E+07 Chromate 3.22E E E+06 AA7075 Sealed A-N-C A-N-NC G4-N-C G4-N-NC As-Sprayed A-N 4.80E E E+06 G4-N 4.48E E E+06 Bare E E E+07
80 67 References [1] Pawlowski, L., 2008, "The science and engineering of thermal spray coatings," Wiley,. [2] Denny, A. J., 1996, "Principles and Prevention of Corrosion,". [3] Schmidt, D., Shaw, B., Sikora, E., 2006, "Corrosion Protection Assessment of Sacrificial Coating Systems as a Function of Exposure Time in a Marine Environment," Progress in Organic Coatings, 57(4) pp [4] Rateick, R., Binkowski, T., and Boray, B., 1996, "Effect of Hard Anodize Thickness on the Fatigue of AA6061 and C355 Aluminium," Journal of Materials Science Letters, 15(15) pp [5] Sun, S., Zheng, Q., Li, D., 2009, "Long-Term Atmospheric Corrosion Behaviour of Aluminium Alloys 2024 and 7075 in Urban, Coastal and Industrial Environments," Corrosion Science, 51(4) pp [6] Shah, K., and Iroh, J., 2002, "Electrochemical Synthesis and Corrosion Behavior of Poly (N-Ethyl Aniline) Coatings on Al-2024 Alloy," Synthetic Metals, 132(1) pp [7] Merl, D. K., Panjan, P., Čekada, M., 2004, "The Corrosion Behavior of Cr-(C, N) PVD Hard Coatings Deposited on various Substrates," Electrochimica Acta, 49(9-10) pp
81 68 [8] Charrier, C., Jacquot, P., Denisse, E., 1997, "Aluminium and Ti/Al Multilayer PVD Coatings for Enhanced Corrosion Resistance," Surface & Coatings Technology, 90(1-2) pp [9] Senna, L., Achete, C., Simão, R., 2001, "Comparative Study between the Electrochemical Behavior of TiN, TiCxNy and CrN Hard Coatings by using Microscopy and Electrochemical Techniques," Materials Research, 4pp [10] Shaw, B., Shaw, W., and Schmidt, D., 2006, "Corrosion of Metallic Coatings," ASM Handbook, 13Cpp. 61. [11] Amateau, M. F., and Eden, T. J., 2000, "High-Velocity Particle Consolidation Technology," IMAST Quarterly, 2pp [12] Irissou, E., Legoux, J. G., Ryabinin, A. N., 2008, "Review on Cold Spray Process and Technology: Part I Intellectual Property," Journal of Thermal Spray Technology, 17(4) pp
82 69 Chapter 4 : Long Term and Exfoliation Corrosion Testing of Cold Spray Applied Aluminum Coatings on AA2024-T3 and AA7075-T6 Substrates Abstract Commercially pure aluminum (CP-Al) and A7005 coatings were applied to the 2024-T3 and 7075-T6 aluminum alloys, respectively, via the Cold Spray process. The samples were then evaluated by long term immersion, accelerated salt fog testing, long term atmospheric exposure testing, and exfoliation corrosion testing. Electrochemical impedance spectroscopy was used to characterize coating degradation in long term immersion, accelerated salt fog, and atmospheric exposure testing. Visual examinations and scanning electron microscopy was also utilized to characterize the corrosion behavior of the coatings. These tests were employed on bare substrates without coatings along with four other specimen types including the alloys covered with: (1) CP-Al coating, (2) conventional chromate conversion coating, (3) CP-Al coating and conventional sealant, and (4) CP-Al coating, chromate conversion coating, and conventional sealant. Various surface preparations and carrier gases were used in the Cold Spray process. The surface preparations included: (1) Al 2 O 3 grit blast at 45, (2) glass bead grit blast at 45, (3) glass bead grit blast at 90, (4) SiC grit blast at 45. The carrier gases included nitrogen and helium. The surface preparation and carrier gas combinations were studied to see if any offered superior corrosion protection. It was found that CP-Al coatings offered increased corrosion protection to the bare alloys studied, and in many cases offered similar protection to the AA2024-T3 substrate with chromate conversion coating. Sealed samples with CP-Al coatings outperformed similar samples with CP-Al and chromate conversion coatings in atmospheric exposure tests.
83 70 Introduction The first paper in this study provided an extensive direct current electrochemical test analysis on the coatings that were investigated. Unfortunately, when evaluating coating performance DC tests can be limited due to irreproducible results, high potential drops across resistive films, and large polarizations induced by the coating-metal interface [1]. One of the most powerful electrochemical tests to perform on hard coatings is therefore an alternating current experiment known as electrochemical impedance spectroscopy (EIS). EIS involves applying only a small signal voltage over a large frequency range, and then measuring the resulting impedance values. Because the signal is kept small, the corrosion surface is not driven far from steady state and the corrosion properties are not disturbed [1]. The advantage of using the EIS technique is that it can be used to focus on the degradation of a protective coating itself. This information is extremely beneficial if comparing coatings of various compositions, or if the ranking of various coating systems is desired. The resulting impendence spectra can show how the coating breaks down when exposed to a specific medium, and how many time constants exist in the coating s protective system. Time constants represent the capacitive/resistive reactions of a coating system. This information can then be used to determine if a coating has defects (induced from the application process or through degradation over time) by introducing additional time constants. A Nyquist diagram can be generated from the resulting EIS data in which the imaginary component of the impedance is plotted versus the real component. There has been much research into the best means of analyzing the bode and nyquist plots resulting from EIS measurements. Senna et al [2]. used nyquist plots to
84 71 demonstrate the corrosion protection of hard coatings deposited by PVD techniques. One common parameter that has shown promise in predicting corrosion behavior is the maximum impedance at lowest frequency. The impedance of the coating can be thought of as the coating s resistance to penetration by the electrolyte [3]. This value, measured at the lowest frequency, has been shown to correlate well with actual coating degradation and has suggested that zinc sacrificial coatings with solvent based topcoats can show impedance values six times higher than the same sacrificial coating with no topcoat when applied onto steel substrates [4]. Calle et al [5]. used both the maximum impedance value and the coating resistance value obtained from an equivalent circuit to evaluate the protection that molybdate conversion coatings offer aluminum alloys and found the maximum impedance values to be 10 3 for the bare 2024 alloy while they varied from 10 3 to 10 5 for the coated substrates. The maximum impedance at lowest frequency will be the main parameter assessed in EIS measurements in this study. Although time consuming, the most accurate testing for corrosion evaluation is field exposure testing. This involves placing the samples in a representative, in this case marine, environment and performing visual and electrochemical inspections throughout an extended exposure time frame. Studies have shown that extended atmosphere exposure coupled with periodic EIS measurements have shown predictive corrosion behavior [6]. Atmospheric tests have also shown unprotected 2024 and 7075 aluminum to experience severe exfoliation corrosion, and that marine atmospheres cause more corrosion than urban atmospheres [7].

85 72 In an attempt to emulate field exposure results in a shortened time frame, accelerated salt spray cabinet tests have become a popular means of imitating atmospheric testing. This test involves a cabinet, in which samples to be tested are placed, connected to a chamber containing artificial seawater. The salt spray cabinet and solution chamber is shown in Figure 4-1. Figure 4-1. The salt spray cabinet (left) and solution chamber (right). The seawater enters into the sample containing cabinet where it atomizes and is dispersed as a salt spray fog. This fog is dispensed at specific intervals throughout a 24 hour period. There are several variations on this test, such as fog dispersion intervals and salt water composition, and the ASTM standard B117 salt spray test has been chosen for this study. Tests have shown that this standard may not be as accurate at predicting corrosion rates for aluminum as other salt spray tests, but because this is a comparative study the actual corrosion rates are not of interest. Instead, the corrosion rates comparable to each plate will be the most useful aspect of this study, and the ASTM B117 provides a consistent template for testing. Zhu et al [8]. demonstrated that a magnesium substrate showed pitting corrosion after two hours in a salt spray cabinet, while the same alloy with
86 73 an aluminum-alloyed coating showed pitting after 72 hours and very little pitting even after 30 days in salt spray cabinet testing. Exfoliation is a localized form of corrosion that can occur on the surface of wrought aluminum alloys exposed to industrial and marine environments. This form of corrosion shows itself through the attack of elongated grain boundaries and results in damage that ranges from pitting to flaking of the layered structure of the metal. The corrosion is usually intergranular in nature due to the galvanic interaction between grain boundary age-hardening precipitates and the adjacent matrix. Since the hydrated aluminum oxide corrosion products that form have a greater volume than the aluminum alloy that generates them, large stresses within the layered structure of the alloy build up as the corrosion product is generated. This produces a wedging action which is the mechanism responsible for lifting off layers of metal and promoting further attack. The grain shape, size and heat treatment are all important factors in exfoliation corrosion. Elongated grains are important prerequisites for exfoliation; as a result, the method of applying the coating and the resulting grain size and shape will have an important impact on exfoliation. Although accelerated laboratory testing for exfoliation and intergranular corrosion susceptibility is necessary for alloy and process development, it should be noted that the lab testing for exfoliation/intergranular testing corrosion does not always agree with subsequent service performance. The most suitable accelerated laboratory test for the coatings in this study is the ASTM G34 test, which is widely used to predict exfoliation corrosion susceptibility. The susceptibility is determined by a visual
87 74 examination in which the surface profile is compared with a group of reference standard photographs. Experimental Procedures Sample Designation The samples tested were 2024-T3 and 7075-T6 aluminum alloys (AA2024-T3 and AA7075-T6) coated with commercially pure aluminum applied via the Cold Spray process. There were four surface preparations of the substrate: (1) glass bead grit blast at 45 degrees, (2) glass bead grit blast at 90 degrees, (3) alumina bead grit blast at 45 degrees, and (4) silicon carbide blast at 45 degrees. Two different carrier gases were used to apply the Cold Spray coatings, helium and nitrogen. Coatings were applied to a thickness of inches ± inches. An AA2024-T3 sample was also coated with a chromate conversion coating and tested in order to compare it with the Cold Spray applied coatings. A sealant was applied to some as-sprayed coatings. Two different sealing types were utilized; the first sealant type involved a chromate conversation coating to help with adhesion of the paint layer. The second type was identical to the first type, except without the chromate conversion coating. The chemical processing of the sealant, not including the chromate conversion, involved an aqueous alkaline degreaser, deoxidizer, alkaline etch, and a desmut bath (using Oakite LNC). The chromate conversion coating used was an Oakite Chromicoat L25. The painting operation used a primer following MIL-PRF (Type 1, Class C2) and a topcoat following MIL-PRF (Type 1). A chart
88 75 correlating sample preparation and carrier gas to sample identification used in this report can be found in Table 4-1. Table 4-1. Sample Identification of AA2024-T3 and AA7075-T6 Test Specimens Sample Designation Surface Preparation Main Process Gas Electrochemical Impedance Spectroscopy (EIS) Each EIS test was performed by creating an electrochemical cell with the substrate to be tested. This was accomplished by first masking an area of the test specimen, and then clamping an O-ring and glass cylinder over the masked area. This cylinder was then filled with 40 ml of electrolyte consisting of 3.5% NaCl artificial seawater conforming to ASTM standard D A rubber stopper containing a graphite rod counter electrode and saturated calomel reference electrode was then placed on top of the glass cylinder, with the counter and reference electrode resting in the electrolyte. An example of a test cell can be viewed in Figure 4-2. All electrochemical measurements were made using a Gamry Reference600 Potentiostat, with multiple EIS measurements being run through a Gamry Electrochemical Multiplexer. A-N Al 2 O 3 Grit Blast at 45 Nitrogen G4-H Glass Bead Applied 45 Helium G4-N Glass Bead Applied 45 Nitrogen G9-N Glass Bead Applied 90 Nitrogen S-N SiC Grit Blast at 45 Nitrogen X-X-S A sample described above that is scribed X-X-C X-X-NC A sample described above that is sealed and with chromate coating A sample described above that is sealed and without Chromate Coating

89 76 Figure 4-2. An example of an electrochemical cell used to measure corrosion characteristics The EIS test applied small voltages over a wide range of frequencies, while measuring the resulting impedance values. An equivalent circuit analysis was performed on the resulting data in which a proposed circuit model correlating with the corrosion mechanisms of the system is proposed. Exfoliation Corrosion For investigating the tendency of exfoliation corrosion, the samples were continually immersed in a solution containing 4M sodium chloride, 0.5M potassium nitrate, and 0.1M nitric acid at 25 C (77 F). Coatings on AA2024 substrates were immersed for 96 hours while coatings on AA7075 substrates were immersed for 48 hours. The coatings were removed from solution, cleaned by rinsing in water, inspected and rated according to the ASTM G34 standard. Atmospheric Testing The testing described in this section was conducted by employees of the Corrosion Technology Lab division at the Kennedy Space Center.
90 77 In order to assess the severity of the corrosion process as a function of exposure time, the combined use of periodic electrochemical testing and atmospheric exposure was used. Scribe marks were made on all coating/substrate combinations using a milling machine. Scribing samples is a common practice in atmospheric corrosion testing and allows for an evaluation of coating performance after damage has occurred to the coating [9].[9, 9] The specimens were exposed on racks, at a 30 angle from the vertical, at the NASA Kennedy Space Center Beach Corrosion Test Site (BCTS). At this site, key environmental factors were monitored and recorded daily which include temperature, relative humidity, dew point, solar energy, wind speed and direction, time of wetness, rain-fall and chloride concentration. Throughout the 12 month exposure period at this site, two replicates of each coating/substrate were analyzed quarterly (every three months) in detail. During these analyses, the specimens were removed from the racks, physical observations were made, digital picture documentation was executed, and electrochemical tests were run on specified areas. The specimens were returned to the racks the next day until the next detailed analysis cycle. Information gained from this portion of the investigation was quantified in order to compare and rank the coatings. The Navy Scribe and Bold Surface Inspection Practice was employed to quantify corrosion damage in the scribe area on the top of the coated/scribed specimen and was converted to a rating number. This technique involved dividing the scribe into eight segments, four on each side of the scribe, evaluating the scribe after exposure and converting to a rating number. The rating numbers were obtained three different ways. The first method was to measure the minimum and
91 78 maximum lateral creepage of corrosion (in mm) at each segment and then to add them together. This obtained value is known as the Segment Value Creep and is used to find the corresponding rating number. The second rating method was executed by measuring the minimum and maximum lateral creepage of corrosion over the entire scribe (in mm). Using these values, which are referred to as the Maximum and Minimum Creep, the rating number was identified. The final and third method of rating entailed the use of the ASTM D610 standard by estimating the percent of panel surface that exhibited corrosion blistering. These three ratings were averaged together and used separately to assess the coating s ability to provide protection to the substrate. According to the ASTM D1654 standard, a rating of 10 signified that no creepage was observed at the scribe and no corrosion was observed in the unscribed area. After all physical observations and scribe calculations were executed, electrochemical tests were run on each specimen. Electrochemical Impedance Spectroscopy was run at a scan rate of 7 points/decade from 10 5 Hz down to 10-2 Hz with a 10 mv amplitude vs. open circuit potential. The maximum impedance at lowest frequency was the desired parameter obtained at each removal cycle. Accelerated Atmospheric Testing The ASTM standard B117 Salt Spray (Fog) test is one of the most extensively used accelerated cabinet tests and was executed in this study. The B117 standard required a salt containing solution to be sprayed in the form of a very fine fog mist over specimen at a constant temperature within a contained chamber. Each coating/substrate system was exposed to the standard B117 salt spray test for a duration of approximately 2000 hours.
92 79 The extended number of cycles was required due to the expected superior corrosion resistance of the coatings. As a result, the tests needed to be sufficiently long to differentiate between the performances of the various coating/substrate combinations. After the cabinet testing was completed, subsequent analysis was required to quantify results. The edges of the test panels were not included in the area being evaluated. Measurements of the scribe creepage were repeated at 1-cm intervals along both sides of the scribe for each panel. The minimum, maximum and average scribe creepage in millimeters were recorded for each panel. The measurements were converted to ASTM D1654 ratings and an Overall Rating for each panel was calculated by averaging the Scribe Creepage Rating and the Unscribed Rating. EIS testing was also used to characterize the coating degradation monthly. Long Term Immersion (LTI) To fully characterize the long term corrosion performance of the coatings, the samples were immersed in artificial seawater conforming to ASTM standard D in order to simulate service conditions. The impedance spectrum was then periodically measured. EIS measurements were carried out each hour for the first 24 hours, then each day for one week, each week for one month, and then monthly for one year. The resulting maximum impedance at lowest frequencies obtained from these measurements were used to determine which coatings degrade the least over time. Samples were also examined using scanning electron microscopy (SEM).. The samples were then examined under high and low magnification. An accelerating voltage of 12 kv was used along with a working distance of 19mm, a spot size of 36, and a secondary electron imaging (SEI) signal.
93 80 Particular attention was paid to noting the size, shape, and overall distribution of pits that developed on the surface of the samples. Results and Discussion Long term constant immersion with EIS for CP-AL coatings on AA2024-T3 (.01 Hz) Figure 4-3 shows the impedance data collected over a 12 to 14 month period, measured at.01 hz. As-sprayed coatings were tested and compared to the bare and chromate coated The impedance values were fairly consistent for all as-sprayed coatings. Three as-sprayed coatings displayed increasing impedances after approximately 36 weeks of immersion: G9-N, S-N, and A-N. The bare AA2024 had the lowest impedance each month and stayed reasonably constant, increasing slightly over the 12 months. The chromate coated AA2024 sample had impedance values which started high and significantly decreased and then leveled out after approximately 5 months of immersion testing. Chromate coated AA2024 had the highest impedance after 12 months. The glass bead grit blast at 45 with the hydrogen carrier gas sample (G4-H) had the lowest impedance compared to other as-sprayed coatings, with impedances the same order of magnitude as bare AA2024. All other surface preparation/carrier gas combinations displayed impedances an order of magnitude above the bare AA2024. After approximately one-year of immersion, the chromate coated plate displayed impedances two orders of magnitude above the bare AA2024, one order of magnitude above the assprayed coatings. It can also be noted that the glass bead grit blast at 45 with nitrogen carrier gas sample (G4-N) performed an order of magnitude better than the same surface preparation with hydrogen used as the carrier gas. The low impedances of the G4-H
94 81 sample can likely be attributed to the low density of the helium carrier gas compared with nitrogen. The lower density, in general, allows for higher accelerating velocities. This has been shown to cause higher stresses in the helium sprayed particles, higher particle deformation, and therefore more sites for corrosion to occur [10]. These corrosion sites would lead to the lower impedances observed in these EIS measurements. Figure 4-3. Impedance values of long term immersion specimen measured at 0.01 hz. Long term constant immersion with EIS for CP-AL coatings on AA2024-T3 (.001 Hz) Figure 4-4 presents the data collected at hz that is much more erratic from month to month than data collected at 0.01 hz. Measuring data down to hz is often necessary in order to fully characterize the corrosion processes [1]. However, measurements at frequencies below 5-10 mhz are extremely difficult due to electrode instability [1]. This instability is the reason for the erratic results obtained in the highest impedance at low frequency measurements. During the months of testing the bare
95 82 and G4-H samples had the lowest impedance, as was seen at 0.01 hz. The as sprayed coating prepared with alumina grit blast at 45 with nitrogen carrier gas (A-N) performed the best out of all the as-sprayed coatings. The impedance was comparable to the chromate coated plate; this was also observed in the test run at 0.01hz frequency. All assprayed coatings and the chromate coated AA2024 plate ended 12 to 14 months of testing with measured impedances on the same order of magnitude. The impedances were one order of magnitude above the bare substrate. Figure 4-4. Impedance values of long term immersion samples measured at 0.001hz. Long Term Immersion: Scanning Electron Microscopy In general, the shape and size of the pitting in the as-sprayed samples was uniform throughout the different carrier gases and surface preparations. Each sample and an approximation of the corresponding pit distribution is included as Table 4-2.
96 83 Table 4-2. The average pit size and distribution of LTI samples Sample Average Number of Pits Average Pit Size per Square Inch (μm 2 ) A-N 20 5,000 G4-N 7 1,000 G4-H 25 5,000 G9-N 27 7,500 S-N 13 1,500 Bare AA ,000 Chromate Most pits displayed an overall oval like appearance with width on the order of 10 micrometers and length on the order of 10 2 micrometers, as seen in Figure 4-5(a). There were subtle variations within each sample, however. G4-N had the fewest pits and relatively smaller pits compared with other as-sprayed samples, while G9-N had both the greatest pit density and greatest range of pit sizes over its surface (Figure 4-5(b)). This is likely due to the fact that the 45º angle reduced the impact velocity of the glass bead media and therefore reduced the resulting embedded grit from the application process. A reduction in embedded grit would lead to fewer and smaller pits forming in the sample. Sample A-N had an extremely porous surface compared with other samples, shown in Figure 4-6(a). A surface of this nature is believed to be more likely to fail than the more dense coating observed in other as-sprayed samples because it provides sites for pitting. All as-sprayed samples performed superiorly to the bare AA2024 sample, which exhibited severe pitting as shown in Figure 4-6(b). Not only was the number of pits more abundant on this bare sample, but the pit geometries were angular and irregular. This is undesirable because angular pits cause stress concentrations that can lead to failure. The


97 84 chromate coated sample performed extremely well with few pits that occurred in relatively small sizes. An example of a pit on a chromate coated sample is shown in Figure 4-7. It should be noted though that the pits of the chromate coated samples appeared to be much deeper than the pits of the as-sprayed samples. This is undesirable because deep pits remove material from within a substrate and lead to a larger reduction in mechanical properties than shallow pits. (a) (b) Figure 4-5. Typical pit on as-sprayed sample (a) and G9-N surface with large pit distribution (b).


98 85 (a) (b) Figure 4-6. The porous surrounding surface of sample A-N (a) and the severely pitted bare surface (b). Figure 4-7. Pit found on chromate coated surface. B-117 Accelerated Cabinet Testing EIS for As-Sprayed CP-AL coatings on AA2024-T3 This results section deals with the maximum impedance at lowest frequency. Figure 4-8 and Figure 4-9 show the highest impedance at lowest frequency values as a function of time for the unscribed and scribed as-sprayed CP-AL on AA2024-T3. After three months, both the unscribed and scribed samples that were prepared with glass bead grit blast at 45º had higher impedances than all other as sprayed specimens. All as sprayed samples showed impedances on the same order of magnitude. Interestingly, in
99 86 the scribed test, the glass bead at 45º samples had impedances twice as high as the glass bead at 90º sample. This is likely due to the fact that the 45º angle reduced the impact velocity of the glass bead media and therefore reduced the resulting embedded grit from the application process. A reduction in embedded grit would lead to higher coating adhesion, greater corrosion protection, and the high impedance values that resulted from the EIS experiment. The chromate sample, which is not included in Figure 9 in order to show each as-sprayed condition more clearly, regularly showed impedances an order of magnitude higher than as-sprayed samples throughout these tests. Figure 4-8. Impedance values of unscribed as-sprayed AA2024-T3 specimen.
100 87 Figure 4-9. Impedance values of scribed as-sprayed AA2024-T3 specimen B-117 Accelerated Cabinet Testing - EIS for Sealed CP-AL coatings on AA2024-T3 Figures 4-10 and 4-11 show the impedance values as a function of time for unscribed and scribed sealed CP-Al on AA2024-T3, respectively. In the unscribed condition represented in Figure 4-10, all sealed non-chromate samples produced higher impedances after three months of exposure than sealed and chromate coated samples, except for one, alumina grit blast at 45 with nitrogen carrier gas (A-N-C). Overall, the sealed non-chromate samples performed better than sealed samples with a chromate coating. This could be due to the nature of the corrosion protection offered by chromate conversion coatings. As defects form in aluminum alloys, chromate ions migrate into the defects and protect the alloys from further corrosion [11]. However, the rate at which chromate migrates has been shown to decrease over time [11]. After three months, the migration of chromate ions could have decreased to an extent where the aluminum alloys
101 88 were no longer adequately protected, explaining why the sealed samples without the chromate conversion coating showed higher impedances. In the scribed condition shown in Figure 4-11, the A-N-NC and G4-N-NC samples performed better than the corresponding samples with a chromate coating. The A-N-NC plate produced impedances so much higher than any other sample, it was not included in the figure in order that data for the other samples could be discerned more clearly. Figure Maximum Impedance at lowest frequency of unscribed sealed AA2024 specimen
102 89 Figure Maximum impedance at lowest frequency of scribed sealed AA2024 specimen B-117 Accelerated Cabinet Testing - EIS for As-Sprayed A7005 coatings on AA7075-T6 Figure 4-12 and 4-13 show the impedance values as a function of time for unscribed and scribed as-sprayed A7005 coatings on AA7075-T6. As-sprayed A7005 coatings had higher impedances than bare AA7075 samples in both scribed and unscribed conditions. The measured impedances were up to an order of magnitude higher than the bare substrate. In the unscribed conditions both surface preparations were comparable in performance. However, in the scribed condition, G4-N performed significantly better after three months of testing.
103 90 Figure Maximum impedance at lowest frequency of unscribed as-sprayed AA7075 specimen Figure Maximum impedance at lowest frequency of scribed as-sprayed AA7075 specimen B-117 Accelerated Cabinet Testing - EIS for Sealed A7005 coatings on AA7075-T6 Figures 4-14 and 4-15 show the impedance values as a function of time for unscribed and scribed sealed A7005 coatings on AA7075-T6, respectively. In the unscribed condition, sealed non-chromate samples performed more consistently throughout the three months of testing, without large dips in impedances in the second
104 91 month. These dips indicate a reduction in the corrosion resistance offered by the coating. The sealed samples with chromate coatings displayed significant drops in impedances in the second month, but recovered in the third month. In the scribed condition, both sealed samples with chromate had higher impedances than the non-chromate sealed samples during all three months of testing. All samples performed consistently from month to month. Figure Maximum impedance at lowest frequency of unscribed sealed AA7075 specimen
105 92 Figure Maximum impedance at lowest frequency of scribed sealed AA7075 specimen B-117 Accelerated Cabinet Testing EIS Curve Shape and Equivalent Circuit Analysis As Sprayed Samples There is an extremely good correlation between the high impedance at low frequency data and the shape of the EIS impedance plots that were produced in this study. As an example, observe the change in bode and nyquist plots observed for unscribed as sprayed samples G9-N in Figure After one month of exposure, there is one time constant observable in the bode plot and a vertical line in the nyquist plot, showing good overall protection. At two and three months, however, several more time constants become apparent. More time constants often correlate with the degradation of the coating. It can therefore be concluded that the protection of the coating decreases sharply over the three months of exposure. Compare this to Figure 4-17, which is Figure 4-8 from page 86 with no chromate coating in order to see each as sprayed condition more clearly. The
106 93 highest impedance at lowest frequency starts extremely high at one month, then decreases sharply over the next two months. Conversely, observe the bode and nyquist plots for as sprayed sample G4-H in Figure There is a maximum of one time constant observable over all three months, and the plots are overall extremely consistent. This again correlates very well with the data shown in Figure 4-17 which shows that, although the maximum impedance at lowest frequency rises slightly from month two to three, it stays very consistent overall. Note that the bode and nyquist plots of other as-sprayed plates, both scribed and unscribed, showed similar behavior. This supports that the maximum impedance at lowest frequency is a relatively accurate, fast way of measuring coating degradation over time.
107 (a) 1 month 94
108 (b) 2 month 95
109 96 (c)3 month Figure The bode and nyquist plots for as-sprayed plate G9-N. One time constant is observed after one month of exposure, but several time constants are observed after 3 months. This correlates well with the maximum impedance at lowest frequency data.
110 Figure Impedance values of unscribed as sprayed AA2024-T3 specimen with chromate sample removed. 97
111 (a) One Month 98
112 (b) 2 Month 99
113 100 (c) 3 Month Figure The bode and nyquist plots for as-sprayed unscribed plate G4-H. The plots show a maximum of one time constant over all three months, correlating well with the maximum impedance at lowest frequency data.
114 101 Sealed Samples When studying the plot of maximum impedance at lowest frequency for the sealed specimen it can be observed that two trends emerge. The first trend shows an impedance that increases from one month to two and then either increases slightly or stays the same from two months to three. The second trend shows an impedance that decreases from one month to two and then increases from two months to three. The nyquist plots of these samples again correlate well with the two trends. As an example, observe the nyquist plots for the three months of exposure of sealed, unscribed sample A- N-NC in Figure In the first month, the sample shows an obvious two time constants and high corrosion rate. At month two, the two time constants are not nearly as obvious and it can be hypothesized that the degradation of the coating appears to have slowed. This could occur due to corrosion product depositing into defects in the coating that formed after one month. After three months of immersion the nyquist plot has a similar shape to that of the two month test, suggesting a similar impedance value. This conclusion is supported by the maximum impedance at lowest frequency data in Figure The impedance increases from month one to two, and then remains relatively constant from month two to three. Conversely, observe the nyquist plots for the chromate coated plate in Figure It should be noted that the chromate coated plate showed similar trends to certain sealed samples (refer to Figures 4-8 through 4-11) and that these graphs are included in this discussion due to their superior clarity. In the first month, the nyquist plot shows a relatively vertical line suggesting good coating protection. After two months of exposure, however, the nyquist plot seems to suggest coating degradation. After three months, and
115 102 again due possibly to corrosion product forming in any defects that had previously been induced in the coating, the chromate sample shows less corrosion occurring. After each month of exposure the samples show more than one time constant, but this observation is much more pronounced in month two than after one or three months. Again, this matches the high impedance at low frequency data reported in this chapter. (a) On Month (b) Two Months
116 103 (a) Three Months Figure The nyquist plots over three months of exposure for unscribed specimen A-N-NC Figure The maximum impedance at lowest frequency data for unscribed, sealed AA2024 specimens
117 104 (a) One Month (b) Two Months
118 105 (a) Three Months Figure The nyquist plots for three months of exposure of the chromate coated sample. EIS Equivalent Circuit Analysis An attempt was made to fit the generated EIS curves with an equivalent circuit in order to further analyze the data. The circuit proposed was a two time constant system consisting of a typical Gamry paint cell with two constant phase elements used instead of capacitors, as shown in Figure The Rsoln resistance corresponds to the resistance of the electrolyte, the pore resistance and coating capacitance are then in parallel, and the double layer capacitance (Cdl) is in parallel with the polarization resistance. This circuit is commonly used to model the EIS curves associated with coating degradation involving multiple time constants [12][13], and in general fit the as sprayed and sealed specimens well. Refer to Figures 4-23 through 4-27 for examples of the fits produced by this model.

119 106 Figure The proposed equivalent circuit to model coated EIS data. Figure As-sprayed sample S-N modeled with equivalent circuit after 4 months of exposure.
120 107 Figure Sealed unscribed sample A-N-NC modeled after one month of exposure with the equivalent circuit. Figure Unscribed chromate sample after 2 months of exposure modeled with equivalent circuit.
121 108 Figure Scribed sealed sample G4-H-NC-S modeled after three months of exposure with equivalent circuit. Figure As-sprayed scribed sample G4-H-S modeled after 2 months of exposure with equivalent circuit. B-117 Accelerated Cabinet Testing Visual Observations After 3 months of B-117 accelerated salt fog testing, physical evaluations were performed on as-sprayed and sealed coatings. The ASTM D 1654 was used to evaluate
122 109 the degree of corrosion extending from the scribe. In this technique each sample is examined to determine the extent of corrosion damage emanating from the scribe. The plate is then given a rating from one to ten, as described in Table 4-3. Table 4-3. The ASTM D 1654 Rating Scale Millimeters Inches (Approximate) Rating Number Over 0 to to 1/64" 9 Over 0.5 to 1.0 1/64" to 1/32" 8 Over 1.0 to 2.0 1/32" to 1/16" 7 Over 2.0 to 3.0 1/16" to 1/8" 6 Over 3.0 to 5.0 1/8" to 3/16" 5 Over 5.0 to 7.0 3/16" to 1/4" 4 Over 7.0 to /4" to 3/8" 3 Over 10.0 to /8" to 1/2" 2 Over 13.0 to /2" to 5/8" 1 Over 16.0 to more 5/8" to more 0 The evaluation of unscribed areas was determined using ASTM D 610 to evaluate the degree of corrosion under the coated aluminum surface and ASTM D714 to evaluate the degree of blistering. The ASTM D 610 rating can be found in Table 4-4. Table 4-4. The ASTM D 610 Rating Scale Description Rating No rusting or less than 0.01% of surface rusted. 10 Minute rusting, less than 0.03% of surface rusted. 9 Few isolated rust spots, less than 0.1% of surface rusted. 8 Less than 0.3% of surface rusted. 7 Extensive rust spots, but less than 1% of surface rusted. 6 Rusting to the extent of 3% of surface rusted. 5 Rusting to the extent of 10% of surface rusted. 4 Approximately 1/6 of the surface rusted. 3 Approximately 1/3 of the surface rusted. 2 Approximately 1/2 of surface rusted. 1 Approximately 100% of surface rusted. 0
123 110 A summary of the physical evaluations of each sample converted to rating values is included in Tables 4-5 through 4-7. Photos of as-sprayed and sealed B117 plates are included in Appendixes I and II, respectively. As-sprayed CP-AL coatings on AA2024-T3: In the as-sprayed condition, all coatings performed very well compared to the bare and chromate coated AA2024 substrates in the ASTM D610 and D714 ratings. There was no significant evidence of blistering, rust beneath the coating, or corrosion spots on the surface of the coating. All coatings were rated at a 10 or better and did not change over the 3 month period of testing. The bare AA2024 substrate showed significant signs of general rust which increased over the period of testing. The coatings manufactured with a surface preparation using glass bead grit blast at 45 and a carrier gas of nitrogen or helium (G4-N-S or G4-H-S) exhibited no signs of corrosion product in or transverse from the scribe over the duration of the three months of testing. These two coatings performed better than the bare substrate and equal to the chromate coated AA2024 substrate. Coatings utilizing a surface preparation of glass bead grit blast at 90 or SiC grit blast with nitrogen as a carrier gas (G9-N-S or S-N-S), displayed prevalence of corrosion in areas of the scribe. As a result, for these samples, ratings values decreased steadily over the period of testing. In this case, it is believed that the scribe allowed localized entry of the NaCl solution to the porous coating. The porosity acted as a transport conduit for the corrosive solution and delamination and bulk blistering of the coating occurred. The coatings prepared with alumina and nitrogen carrier gas (A-N-S) had the lowest rating and the most corrosion damage throughout the
124 111 period of testing. This low rating was due to material loss on either side of the scribe. Representative photos of the two samples that showed the most material loss along the scribe are included as Figure Figure Sample A-N-S (left) and S-N-S (right) that showed significant material loss along the scribe.
125 112 Table 4-5. The ASTM D1654 Rating of all B117 Specimens. ASTM D1654 Rating 1 Month 2 Month 3 Month Plate Rating Localized Rating Localized Rating Localized 2024 As-Sprayed Unscribed A-N N/A N/A N/A N/A N/A N/A G4-H N/A N/A N/A N/A N/A N/A G4-N N/A N/A N/A N/A N/A N/A G9-N N/A N/A N/A N/A N/A N/A S-N N/A N/A N/A N/A N/A N/A Scribed A-N-S 3 yes 3 yes 3 yes G4-H-S 10 N/A 10 N/A 10 N/A G4-N-S 10 N/A 10 N/A 10 N/A G9-N-S 10 N/A 7 yes 5 yes S-N-S 8 yes 5 no 5 no Bare AA yes 8 yes 8 yes Chromate 10 N/A 10 N/A 10 N/A Sealed A-N-C 7 no 7 no 7 no A-N-NC 10 N/A 10 N/A 10 N/A G4-H-C 7 yes 7 yes 7 yes G4-H-NC 8 yes 7 yes 7 yes G4-N-C 7 yes 7 yes 7 yes G4-N-NC 10 N/A 10 N/A 10 N/A G9-N-C 8 yes 8 yes 8 yes G9-N-NC 6 yes 6 yes 6 yes S-N-C 10 N/A 9 yes 9 yes S-N-NC 10 N/A 6 yes 6 yes 7075 As-Sprayed G4-N 10 N/A 10 N/A 10 N/A A-N 10 N/A 10 N/A 10 N/A Sealed Non-Chromate G4-N-NC 5 no 3 no 3 no A-N-NC 6 yes 5 no 4 no Chromate G4-N-C 5 yes 5 yes 5 yes A-N-C 8 yes 6 no 6 no Bare AA7075 N/A N/A N/A N/A N/A N/A
126 113 Table 4-6. The ASTM D610 rating of all B117 Specimens ASTM D610 Rating 1 Month 2 Month 3 Month Plate Rating Type Rating Type Rating Type 2024 As-Sprayed Unscribed A-N 10 N/A 10 N/A 10 N/A G4-H 10 N/A 10 N/A 10 N/A G4-N 10 N/A 10 N/A 10 N/A G9-N 10 N/A 10 N/A 10 N/A S-N 10 N/A 10 N/A 10 N/A Scribed A-N-S 10 N/A 10 N/A 10 N/A G4-H-S 10 N/A 10 N/A 10 N/A G4-N-S 10 N/A 10 N/A 10 N/A G9-N-S 10 N/A 10 N/A 10 N/A S-N-S 10 N/A 10 N/A 10 N/A Bare AA G 4 G 3 G Chromate 10 N/A 10 N/A 10 N/A Sealed A-N-C 10 N/A 10 N/A 9 G A-N-NC 10 N/A 10 N/A 9 G G4-H-C 10 N/A 10 N/A 9 G G4-H-NC 10 N/A 9 S 8 G G4-N-C 10 N/A 9 S 9 G G4-N-NC 9 S 9 G 8 G G9-N-C 10 N/A 10 N/A 9 G G9-N-NC 10 N/A 10 N/A 9 G S-N-C 9 S 9 G 9 G S-N-NC 9 S 9 G 8 G 7075 As-Sprayed G4-N 10 N/A 10 N/A 10 N/A A-N 10 N/A 10 N/A 10 N/A Sealed Non-Chromate G4-N-NC 10 N/A 9 G 9 G A-N-NC 10 N/A 10 N/A 10 N/A Chromate G4-N-C 10 N/A 10 N/A 8 G A-N-C 10 N/A 9 G 9 G Bare AA7075 N/A N/A N/A N/A N/A N/A
127 114 Table 4-7. The ASTM D714 Rating for all B117 specimens, which does not evaluate the scribe. ASTM D714 Rating (not counting scribe) 1 Month 2 Month 3 Month Plate Size Frequency Size Frequency Size Frequency 2024 As-Sprayed Unscribed A-N None N/A None N/A None N/A G4-H None N/A None N/A None N/A G4-N None N/A None N/A None N/A G9-N S-N None N/A None N/A None N/A Scribed A-N-S None N/A None N/A None N/A G4-H-S None N/A None N/A None N/A G4-N-S 4 few 4 few 3 few G9-N-S None N/A None N/A None N/A S-N-S None N/A None N/A None N/A Bare AA N/A 10 N/A 10 N/A Chromate 10 N/A 10 N/A 10 N/A Sealed A-N-C 10 N/A 10 N/A 10 N/A A-N-NC 10 N/A 10 N/A 10 N/A G4-H-C 10 N/A 10 N/A 10 N/A G4-H-NC 10 N/A 10 N/A 10 N/A G4-N-C 10 N/A 10 N/A 10 N/A G4-N-NC 10 N/A 10 N/A 10 N/A G9-N-C 10 N/A 10 N/A 10 N/A G9-N-NC 10 N/A 10 N/A 10 N/A S-N-C 10 N/A 10 N/A 10 N/A S-N-NC 10 N/A 10 N/A 10 N/A 7075 As-Sprayed G4-N 10 N/A 10 N/A 10 N/A A-N 10 N/A 10 N/A 10 N/A Sealed Non-Chromate G4-N-NC A-N-NC 4 moderate 4 moderate 4 moderate Chromate G4-N-C 10 N/A 10 N/A 10 N/A A-N-C 10 N/A 10 N/A 10 N/A Bare AA N/A 10 N/A 10 N/A
128 115 Sealed CP-AL coatings on AA2024-T3: In the scribed areas, the sealed coatings performed much differently than the assprayed. The ability of any pretreatment to retard corrosion at scratches and other holidays can drastically affect the performance of coating systems in the field. For most coatings, the corrosion damage stopped after one month, resulting in rating numbers which stayed consistent after month two of testing. All corrosive activity which emanated from the scribe was localized, except for the coating manufactured with alumina grit blast and nitrogen carrier gas (A-N-C-S), which had two areas of damage on the scribe. The coatings manufactured with glass bead at 45 or alumina grit blast using nitrogen as a carrier gas (G4-N-NC-S and A-N-NC-S) had no signs of corrosion damage at or near the scribe. Both of these sealed samples were manufactured without the chromate conversion coating. All sealed coatings performed well overall with little to no signs of rust or blistering. In the unscribed areas it is interesting to note that sealed samples without chromate showed slightly more signs of corrosion than those with the chromate conversion coating. This could simply be due to the chromate coated samples having more thickness than the non chromate samples due to the extra chromate layer. As-Sprayed A7005 coatings on AA7075-T6: There was no evidence of corrosion damage in the as-sprayed A7005 coatings on AA7075 samples. Overall there was corrosion occurring on the samples, but the damage occurred close to edges that were not coated. Both as-sprayed samples yielded ratings of 10. The bare AA7075 substrate had general and pitting corrosion damage, and yielded a corrosion rating of 7 in the D610 evaluation.
129 116 Sealed A7005 coatings on AA7075-T6: All sealed A7005 coatings on AA7075 showed significant corrosion damage in the scribe. Both samples sealed without the chromate conversion coating had corrosion damage which was not localized and increased in severity during increased time of testing. The sealed samples with the chromate conversion coatings did slightly better in the scribed condition with higher ratings numbers, but also displayed more areas with rust spots. The sealed samples without the chromate conversion coating had severe blistering, although most of it was within 0.5 inches of the unsealed edges. Atmospheric Exposure Testing: Visual Observations and EIS Observation and evaluation after 3-months of ocean front exposure After three months of exposure at the NASA Beach Corrosion Test Site, physical evaluations were performed on as-sprayed and sealed AA2024 substrates. Three replicates of each as-sprayed sample were tested, with the first of each surface preparation/carrier gas sample scribed. As previously described, ASTM D 1654 was used to evaluate the degree of corrosion extending from the scribe and ASTM D 610 was used to evaluate the degree of corrosion under the coated aluminum surface. A summary of the physical evaluations is shown in Table 4-8. All scribed samples exhibited corrosion products in the scribe, but none of the samples exhibited corrosion that traversed from the scribe. The as-sprayed CP-Al on AA2024-T3 samples did not give any indications of corrosion under the protective coating. In contrast, the unprotected bare AA2024 substrate showed significant signs of corrosion and pitting. A comparison of a bare and as-sprayed AA2024 sample is shown in Figure 4-29.
 and")
130 Figure A comparison of a bare specimen with significant corrosion (left) and an as-sprayed sample with no corrosion damage (right). 117
131 118 Table 4-8. The visual observations of atmospheric specimens after 3 months exposure Sample ASTM D 1654 ASTM D 610 Max Localized Rating Type As-Sprayed S-N-1-S 10 No 10 N/A S-N-2 N/A N/A 10 N/A S-N-3 N/A N/A 10 N/A A-N-1-S 10 No 10 N/A A-N-2 N/A N/A 10 N/A A-N-3 N/A N/A 10 N/A G4-H-1-S 10 No 10 N/A G4-H-2 N/A N/A 10 N/A G4-H-3 N/A N/A 10 N/A G4-N-1-S 10 No 10 N/A G4-N-2 N/A N/A 10 N/A G4-N-3 N/A N/A 10 N/A G9-N-1-S 10 No 10 N/A G9-N-2 N/A N/A 10 N/A G9-N-3 N/A N/A 10 N/A Chromate 2024 Al 10 No 10 N/A Bare 2024 Al N/A N/A N/A N/A Sealed A-N-C 10 No 9 S G4-H-C 10 No 9 S G4-N-C 10 No 9 S G9-N-C 10 No 10 N/A S- N-C 10 No 10 N/A A- N-NC 10 No 10 N/A G4 -H- NC 10 No 10 N/A G4- N- NC 10 No 10 N/A G9- N- NC 10 No 10 N/A S- N- NC 10 No 10 N/A Some sealed specimen with a chromate conversion coating showed signs of corrosion. Photographs of A-N-C, G4-H-C and G4-N-C in Appendix III show small holidays or imperfections in the coating. Interestingly, these did not occur in the corresponding sealed plates without a chromate conversion coating. It is believed that these anomalies may have resulted from iron impurities that were transferred to the surface during the Cold Spray or sealant application process since the discoloration was red.
132 119 Observation and evaluation after 6-months of ocean front exposure The physical corrosion evaluations for the samples after six months of exposure are shown in Table 4-9. Similar to the 3-month evaluations, no visible signs of corrosion extending from the scribed regions were evident for the as-sprayed specimens even though corrosion was apparent inside the scribe itself. Some discoloration was visible on the surfaces in the electrochemically evaluated area, though none appeared to be related to the corrosion of the underlying substrate. Documentation of this phenomenon is shown in Appendix I. The surface rust that occurred on the three sealed samples with chromate after three months did not grow worse and these samples again performed with a rating of 9.
133 120 Table 4-9. The visual observations of atmospheric specimens after 6 months exposure. ASTM D 1654 ASTM D 610 Max Localized Rating Type As-Sprayed S-N-1-S 10 No 10 N/A S-N-2 N/A N/A 10 N/A S-N-3 N/A N/A 10 N/A A-N-1-S 10 No 10 N/A A-N-2 N/A N/A 10 N/A A-N-3 N/A N/A 10 N/A G4-H-1-S 10 No 10 N/A G4-H-2 N/A N/A 10 N/A G4-H-3 N/A N/A 10 N/A G4-N-1-S 10 No 10 N/A G4-N-2 N/A N/A 10 N/A G4-N-3 N/A N/A 10 N/A G9-N-1-S 10 No 10 N/A G9-N-2 N/A N/A 10 N/A G9-N-3 N/A N/A 10 N/A Chromate 2024 Al 10 No 10 N/A Bare 2024 Al N/A N/A N/A N/A Sealed A-N-C 10 No 9 S G4-H-C 10 No 9 S G4-N-C 10 No 9 S G9-N-C 10 No 10 N/A S- N-C 10 No 10 N/A A- N-NC 10 No 10 N/A G4 -H- NC 10 No 10 N/A G4- N- NC 10 No 10 N/A G9- N- NC 10 No 10 N/A S- N- NC 10 No 10 N/A Upon analysis of the physical condition of the samples, it was observed that several as-sprayed coatings exhibited signs of exfoliation. Exfoliation was clearly visible on the edges and back of several samples, which were not coated. It is interesting then that these samples showed exfoliation when the bare AA2024 sample did not. This is most likely due to moisture and corrosion product getting trapped between the substrate and coatings that were applied. The bare sample did not show exfoliation because there was no coating in which to trap corrosion product. In reality this would not be an issue, because the entire substrate would be coated. A summary of exfoliation after six months of exposure is provided in Table 4-10.
134 121 Table Exfoliation summary of atmospheric specimens after 6 months exposure. As-Sprayed S-N-1-S S-N-2 S-N-3 A-N-1-S A-N-2 A-N-3 G4-H-1-S G4-H-2 G4-H-3 G4-N-1-S G4-N-2 G4-N-3 G9-N-1-S G9-N-2 G9-N-3 Chromate 2024 Al Bare 2024 Al Exfoliation Visible on Back Yes Yes Yes Yes Yes Yes Yes Yes Yes Yes Yes Yes Yes Yes No No No Sealed A-N-C No G4-H-C No G4-N-C No G9-N-C No S- N-C No A- N-NC No G4 -H- NC No G4- N- NC No G9- N- NC No S- N- NC No Photo-documented evidence of exfoliation is provided in Appendix III of this chapter. Exfoliation is typically initiated as corrosion products build along the grain boundaries of the metal. As insoluble corrosion products form in these areas, an expansive force is created which causes a lifting or leafing effect. These anomalies were
135 122 kept under evaluation throughout the rest of testing. No sign of exfoliation was visible on the sealed samples after six months of exposure at the NASA Beach Corrosion Test Site. Observation and evaluation after 9-months of ocean front exposure Table The visual observations of atmospheric specimens after 9 months exposure. ASTM D 1654 ASTM D 610 Max Localized Rating Type As-Sprayed S-N-1-S 10 No 10 N/A S-N-2 N/A N/A 10 N/A S-N-3 N/A N/A 10 N/A A-N-1-S 10 No 10 N/A A-N-2 N/A N/A 10 N/A A-N-3 N/A N/A 10 N/A G4-H-1-S 10 No 10 N/A G4-H-2 N/A N/A 10 N/A G4-H-3 N/A N/A 10 N/A G4-N-1-S 10 No 10 N/A G4-N-2 N/A N/A 10 N/A G4-N-3 N/A N/A 10 N/A G9-N-1-S 10 No 10 N/A G9-N-2 N/A N/A 10 N/A G9-N-3 N/A N/A 10 N/A Chromate 2024 Al 10 No 10 N/A Bare 2024 Al N/A N/A N/A N/A Sealed A-N-C 10 No 9 S G4-H-C 10 No 9 S G4-N-C 10 No 9 S G9-N-C 10 No 10 N/A S- N-C 10 No 10 N/A A- N-NC 10 No 10 N/A G4 -H- NC 10 No 10 N/A G4- N- NC 10 No 10 N/A G9- N- NC 10 No 10 N/A S- N- NC 10 No 10 N/A The physical evaluation of corrosion after 9 months of marine exposure is shown in Table Similar to the 6-month evaluations, no visible signs of corrosion extended from the scribed regions of as-sprayed specimens, even though corrosion was apparent in the scribe itself. Some discoloration was visible on as-sprayed surfaces only in the electrochemically evaluated area, although none appeared to be related to the corrosion of
136 123 the underlying substrate. Red corrosion products were visible on A-N-C, G4-H-C, and G4 -N-C as reported after three and six months of exposure. These samples were all sealed samples prepared with a chromate conversion coating. These anomalies may have resulted from iron impurities that were transferred to the surface during the Cold Spray or sealant application process since the discoloration was red. The exfoliation on the as-sprayed samples was clearly visible on the edges and backs of several samples. A summary of exfoliation by sample is shown in Table In contrast to the 6 month evaluations, the 9 month assessment showed signs of exfoliation on the edges of the bare 2024 aluminum alloy samples. After nine months of exposure, the sealed samples also showed signs of exfoliation on the back of the coupons. The affected samples included A-N-NC, G4-H-NC, G9-N-NC and S-N-NC. Photodocumented evidence of these anomalies is shown in Appendix III of this report. Representative as-sprayed and sealed exfoliation photos are included as Figures 4-30 and 4-31, respectively. Figure An example of exfoliation on the back of an as-sprayed sample

137 Figure An example of exfoliation on the back of a sealed sample 124
138 125 Table Exfoliation summary of atmospheric specimens after 9 months exposure. As-Sprayed S-N-1-S S-N-2 S-N-3 A-N-1-S A-N-2 A-N-3 G4-H-1-S G4-H-2 G4-H-3 G4-N-1-S G4-N-2 G4-N-3 G9-N-1-S G9-N-2 G9-N-3 Chromate 2024 Al Bare 2024 Al Exfoliation Visible on Back Yes Yes Yes Yes Yes Yes Yes Yes Yes Yes Yes Yes Yes Yes No No Yes Sealed A-N-C No G4-H-C No G4-N-C No G9-N-C No S- N-C No A- N-NC Yes G4 -H- NC Yes G4- N- NC No G9- N- NC Yes S- N- NC Yes Observation and evaluation after 12-months of ocean front exposure The physical evaluation of corrosion after twelve months of exposure at the NASA Beach Corrosion Test Site is shown in Table According to ASTM D 1654, no visible signs of corrosion extended from the scribed regions, even though corrosion from the underlying substrate was apparent inside the scribe itself. These observations are
139 126 similar to those made after six and nine months of exposure. As-sprayed samples showed signs of discoloration in the electrochemically analyzed section of the coupon. None of the discoloration appeared to have resulted due to corrosion of the underlying substrate. Table The visual observations of atmospheric specimens after 12 months exposure. ASTM D 1654 ASTM D 610 Max Localized Rating Type As-Sprayed S-N-1-S 10 No 10 N/A S-N-2 N/A N/A 10 N/A S-N-3 N/A N/A 10 N/A A-N-1-S 10 No 10 N/A A-N-2 N/A N/A 10 N/A A-N-3 N/A N/A 10 N/A G4-H-1-S 10 No 10 N/A G4-H-2 N/A N/A 10 N/A G4-H-3 N/A N/A 10 N/A G4-N-1-S 10 No 10 N/A G4-N-2 N/A N/A 10 N/A G4-N-3 N/A N/A 10 N/A G9-N-1-S 10 No 10 N/A G9-N-2 N/A N/A 10 N/A G9-N-3 N/A N/A 10 N/A Chromate 2024 Al 10 No 10 N/A Bare 2024 Al N/A N/A N/A N/A Sealed A-N-C 10 No 9 S G4-H-C 10 No 9 S G4-N-C 10 No 9 S G9-N-C 10 No 10 N/A S- N-C 10 No 10 N/A A- N-NC 10 No 10 N/A G4 -H- NC 10 No 10 N/A G4- N- NC 10 No 10 N/A G9- N- NC 10 No 10 N/A S- N- NC 10 No 10 N/A Three sealed samples showed insignificant red discoloration. This is evidenced by the ASTM D 610 ratings in Table This discoloration appears to have resulted from an impurity that originated in the coating during or prior to application. While the
140 127 discoloration appeared to bleed across the coated surface throughout the exposure, the anomaly itself appeared to remain localized with little if any progression. A summary of exfoliation on the back and sides of the samples after twelve months of exposure is shown in Table Several as-sprayed samples exhibited significant signs of exfoliation on the back and sides of the samples. In contrast, four sealed samples showed exfoliation on the back of the coupons that was much less pronounced. These observations are believed to be inconsequential, since the samples that exhibited exfoliation were uncoated on the reverse side of the panel. The samples that did not appear to show exfoliation or pitting utilized a pretreatment that also coated the back of the coupons.
141 128 Table Exfoliation summary of atmospheric specimens after 12 months exposure. As-Sprayed S-N-1-S S-N-2 S-N-3 A-N-1-S A-N-2 A-N-3 G4-H-1-S G4-H-2 G4-H-3 G4-N-1-S G4-N-2 G4-N-3 G9-N-1-S G9-N-2 G9-N-3 Chromate 2024 Al Bare 2024 Al Exfoliation Visible on Back Yes Yes Yes Yes Yes Yes Yes Yes Yes Yes Yes Yes Yes Yes No No Yes Sealed A-N-C No G4-H-C No G4-N-C No G9-N-C No S- N-C No A- N-NC Yes G4 -H- NC Yes G4- N- NC No G9- N- NC Yes S- N- NC Yes EIS after 12 months of ocean front exposure All EIS spectra for the scribed specimens from the as-sprayed set were similar in shape and magnitude. The impedance spectra for these samples are shown in Figure Note that in EIS plots associated with atmospheric exposure specimens the 2P and C3
, all impedance measurements were between 10.00 kohm")
142 129 in the sample labels can be disregarded, and the X-X-8 sample refers to the X-X-1-S sample previously referred to in this atmospheric exposure section. Figure EIS of as-sprayed scribed samples after 12 months of exposure At low frequency (10.0 mhz), all impedance measurements were between kohm and kohm. The impedance spectra for the non-scribed specimens, Figure 4-33, were also similar, and showed even less significant deviation at low frequency. Similar to the scribed specimens, all impedance measurements were between kohm and kohm at mhz.
143 130 Figure EIS of as-sprayed samples (un-scribed) after 12 months of exposure. Figure 4-34 shows the impedance spectra for the bare and chromate coated AA2024 samples. Low frequency impedance measurements for the non-scribed chromate coated sample showed a higher degree of impedance at low frequency, while the magnitude of impedance for the bare aluminum substrate was an order of magnitude lower.
144 131 Figure EIS of non-scribed bare and chromate coated AA2024 samples after 12 months of exposure. All sealed samples were scribed, and utilized an organic barrier coating on top of the cold spray aluminum. As Figure 4-35 shows, the magnitude of impedance at mhz indicates that the samples have a similar level of coating performance when compared to one another. The impedance at mhz for the sealed samples was significantly greater than all as-sprayed samples. Note the samples labeled with X-X-3 refer to sealed samples with a chromate conversion coating and X-X-5 samples refer to sealed specimens without a chromate conversion coating. Again, the 2P and C3 in the sample designation can be disregarded.

145 132 Figure EIS of sealed samples (scribed) after 12 months of exposure. EIS was run in a non-scribed location on two of the coupons from the sealed sample set. The EIS for these samples is shown in Figure As expected, the impedance for both spectra was an order of magnitude greater at mhz than the spectra for the samples that were scribed. Both unscribed samples displayed Bode plots and phase angle diagrams that were similar in shape. This suggests that the different methods of surface preparation had little influence on the corrosion resistant properties of samples. Again, the samples labeled with X-X-3 refer to sealed samples with a chromate conversion coating, X-X-5 samples refer to sealed specimens without a chromate conversion coating, and the 2P and C3 in the sample designation can be disregarded.

146 133 Figure EIS of sealed non-scribed samples after 12 months of exposure. Exfoliation Corrosion The codes and classifications of Table 4-15 were used when reporting the visual rating of corroded specimens: Table The codes and classifications used to report the exfoliated specimens Classification Code Rating Definition No appreciable attack N No appreciable attack: Surface may be discolored or etched, but no evidence of pitting or exfoliation. Pitting P Pitting: Discrete pits, sometimes with a tendency for undermining and slight lifting of metal at the pit edges. EA: Superficial. EB: Moderate-Notable layering and penetration into the metal. Exfoliation EA through ED EC: Severe-Penetration to a considerable depth into the metal. ED: Very Severe-Similar to EC except much greater penetration depth into metal. According to the G-34 standard, all three bare AA2024 samples receive a rating of P as all three samples experienced pitting (Figure 4-37(a)). Table 15 shows a summary of all
147 134 samples and their corresponding exfoliation ratings. The as-sprayed CP-Al coatings on AA2024 samples receive N ratings because there was no appreciable attack on these samples (Figure 4-37(b)). Table A summary of the G-34 test. Exfoliation of AA2024 and AA7075 Samples Plate Replicate G-34 Rating 2024 As-Sprayed 1 N G4-N 2 N 3 N 1 N G9-N 2 N 3 N 1 N S-N 2 N 3 N 1 N A-N 2 N 3 N 1 N G4-H 2 N 3 N 1 P Bare P 3 P 7075 As-Sprayed 1 N G4-N 2 N 3 N 1 N A-N 2 N 3 N 1 EB Bare EB 3 EB The bare AA7075 samples receive EB ratings that relate to moderate exfoliation, or notable layering and penetration into the metal. As shown in Figure 4-38(a), there is visible separation of the metal into layers both on the faces and at the edges of the

 and a typical as-sprayed specimen with no appreciable attack (b).")
148 135 specimen. Conversely, the as-sprayed A7005 coatings on AA7075 received ratings of N because there was no appreciable attack on these samples; This is documented in Figure 4-38(b). (a) (b) Figure A bare AA2024 sample with significant pitting (a) and a typical as-sprayed specimen with no appreciable attack (b). (a) (b) Figure A bare AA7075 sample with EB rated exfoliation (a) and a typical as-sprayed AA7075 sample with no appreciable attack (b).
149 136 Conclusions After 14 months of long term immersion testing, as sprayed AA2024 samples showed highest impedances at lowest frequency an order of magnitude above bare AA2024 samples Under SEM, LTI bare AA2024 samples showed a much more abundant pit distribution than as sprayed plates, along with pit geometries that were angular and irregular. Conversely, as sprayed plates showed pits that were oval in shape, therefore being less likely to lead to undesirable stress concentrations. Therefore, it can be said that the pits generated in the assprayed coatings are less likely to lead to premature failure than the pits generated in the bare specimen. A chromate coated sample showed smaller and fewer pits, but the pit depths appeared to be larger than assprayed samples. This could lead to a greater reduction in mechanical properties. After 3 months of ASTM B117 exposure, both as-sprayed AA2024 and AA7075 specimens showed impedances higher than their bare counterparts. Overall, after 3 months of ASTM B117 exposure sealed samples without chromate had higher impedances then sealed samples with chromate There is an extremely good correlation between the shape of the EIS plots from ASTM B117 testing and the highest impedance at lowest frequency resulting from these curves.
150 137 In visual examinations, as sprayed AA2024 and AA7075 coupons outperformed the bare samples, while chromate and non-chromate samples performed similarly In exfoliation testing, all as-sprayed samples had no appreciable attack while the bare AA2024 sample showed significant pitting and the bare AA7075 sample showed moderate exfoliation corrosion

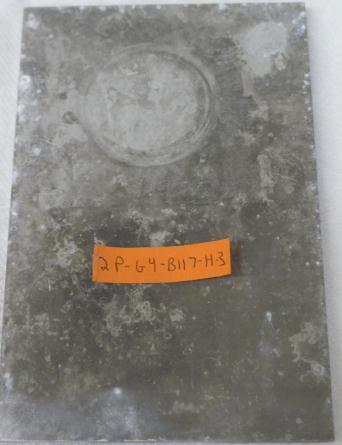
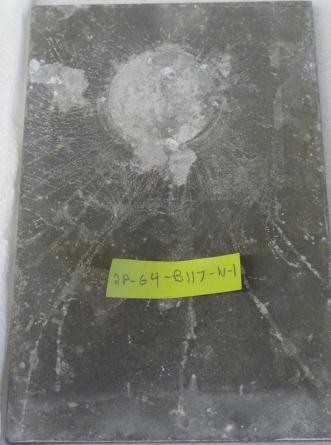
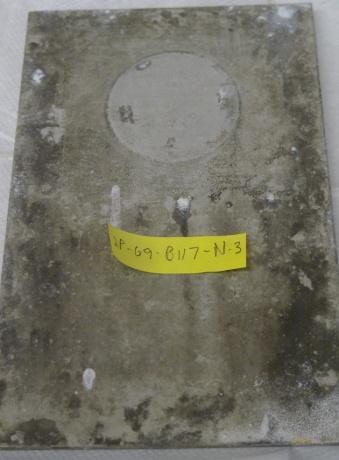
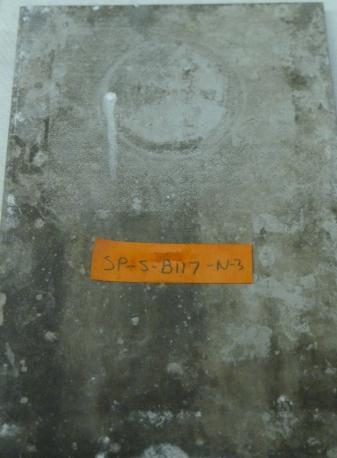
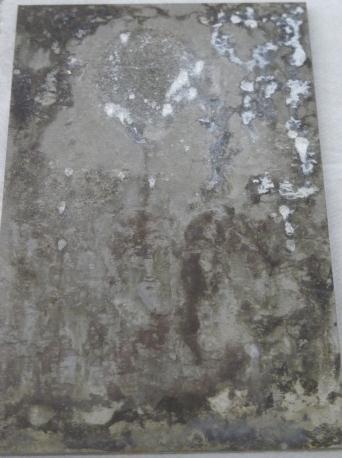
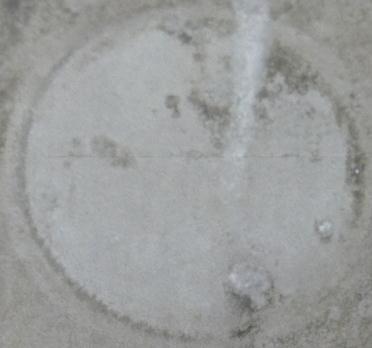
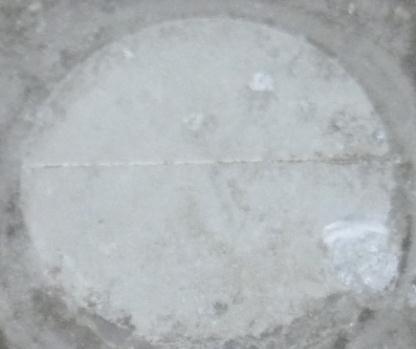
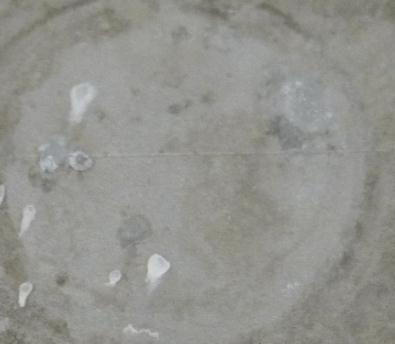
151 138 Appendix I: As-Sprayed AA2024 ASTM B117 Photos One Month A-N G4-H G4-N G9-N S-N Bare AA2024 A-N-S G4-H-S G4-N-S


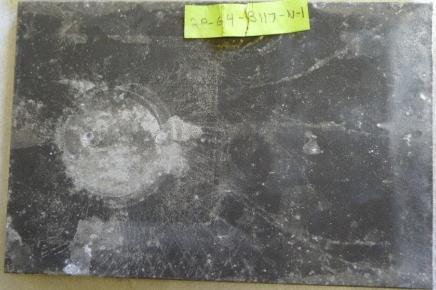
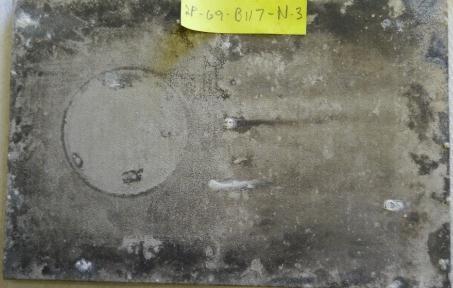
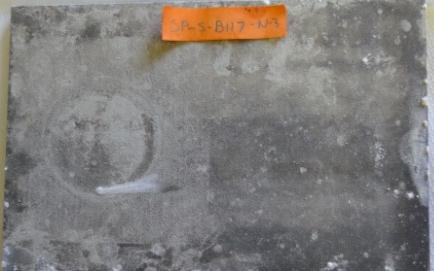
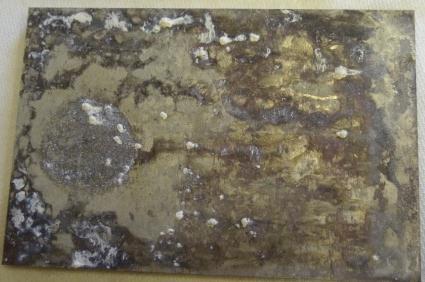
152 139 G9-N-S S-N-S 2 Month A-N G4-H G4-N G9-N S-N Bare AA2024


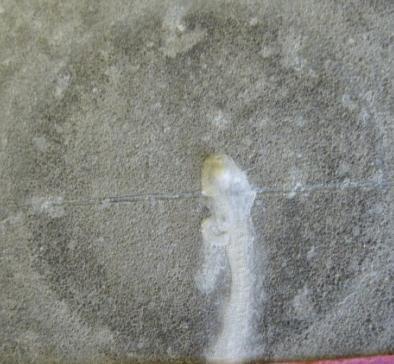
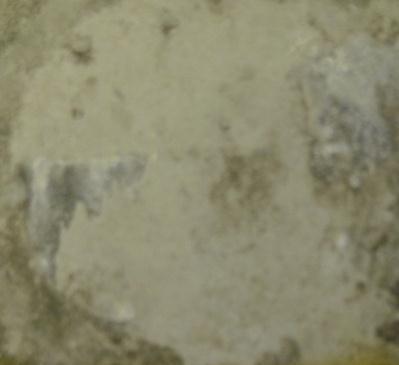
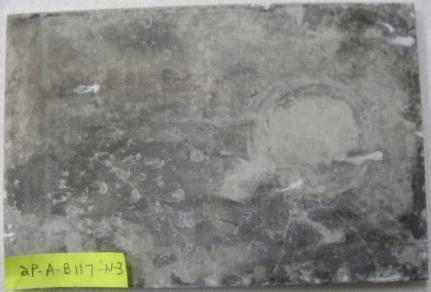
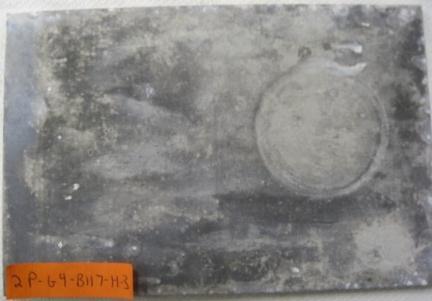
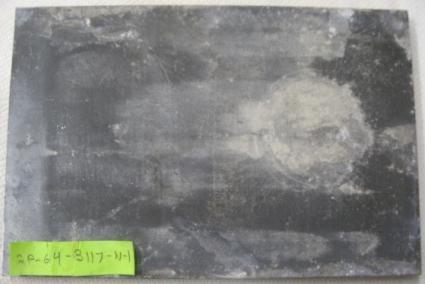
153 140 A-N-S G4-H-S G4-N-S G9-N-S S-N-S 3 Month A-N G4-H G4-N


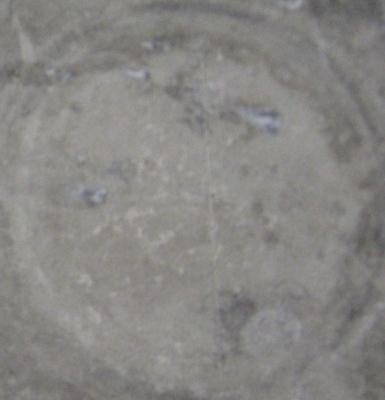
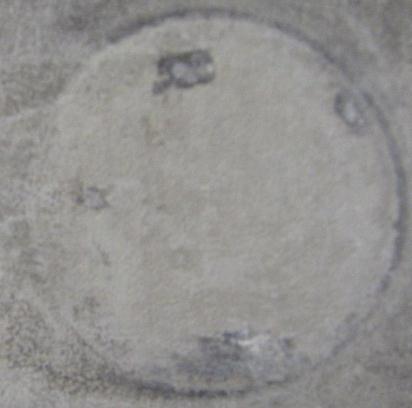
154 141 G9-N S-N Bare AA2024 A-N-S G4-H-S G4-N-S G9-N-S S-N-S


155 142 Appendix II: Sealed and AA7075 ASTM B117 Photos One Month A-N-C A-N-NC G4-H-C G4-H-NC G4-N-C G4-N-NC


156 143 G9-N-C G9-N-NC S-N-C S-N-NC Bare AA7075 A-N G4-N A-N-C A-N-NC


157 144 G4-N-C G4-N-NC Chromate AA2024 A-N-C A-N-NC G4-H-C G4-H-NC G4-N-C G4-N-NC


158 145 G9-N-C G9-N-NC S-N-C S-N-NC Bare AA7075 A-N G4-N A-N-C A-N-NC G4-N-C


159 146 G4-N-NC 2 Months Chromate AA2024 A-N-C A-N-NC G4-H-C G4-H-NC G4-N-C G4-N-NC


160 147 G9-N-C G9-N-NC S-N-C S-N-NC Bare 7075 A-N G4-N A-N-C A-N-NC


161 148 G4-N-C G4-N-NC Chromate AA2024 A-N-C A-N-NC G4-H-C G4-H-NC G4-N-C G4-N-NC


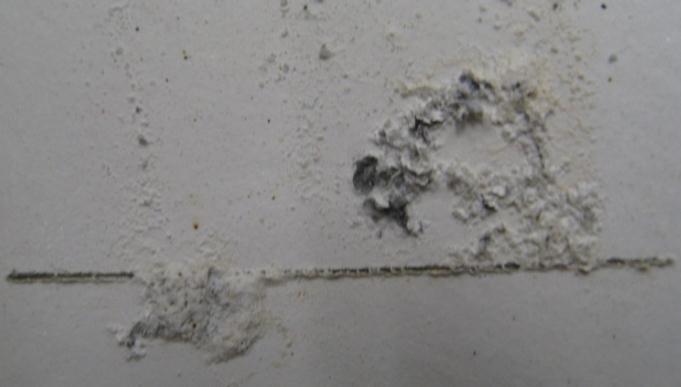
162 149 G9-N-C G9-N-NC S-N-C S-N-NC Bare 7075 A-N G4-N A-N-C A-N-NC G4-N-C


163 150 G4-N-NC Chromate AA Months A-N-C A-N-NC G4-H-C G4-H-NC G4-N-C G4-N-NC


164 151 G9-N-C G9-N-NC S-N-C S-N-NC Bare AA7075 A-N G4-N A-N-C A-N-NC


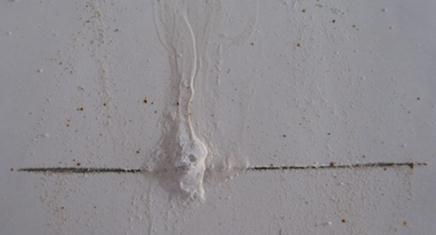
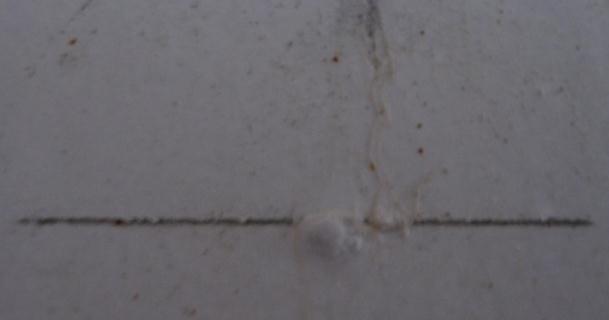
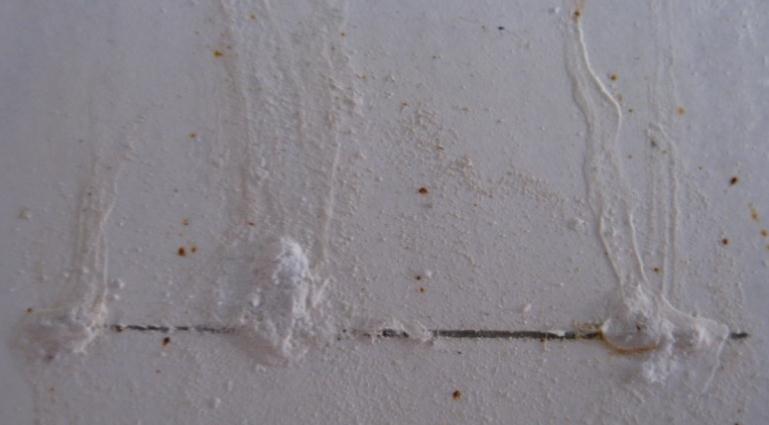
165 152 G4-N-C G4-N-NC Chromate AA2024 A-N-C A-N-NC G4-H-C G4-H-NC G4-N-C G4-N-NC


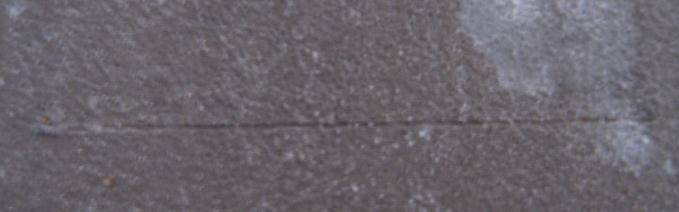
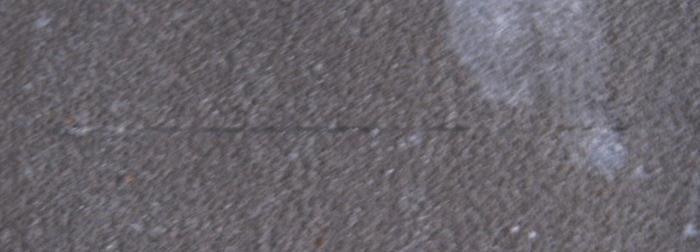
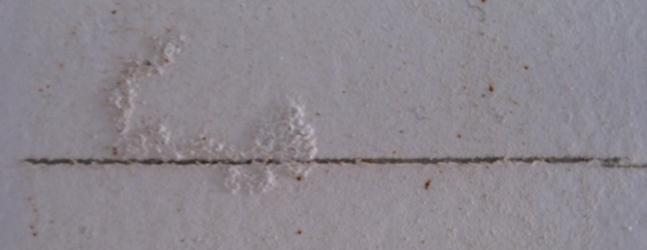
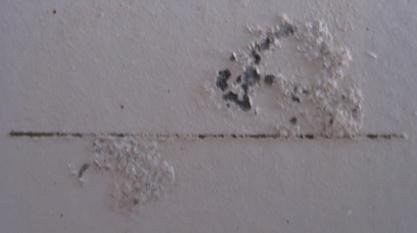
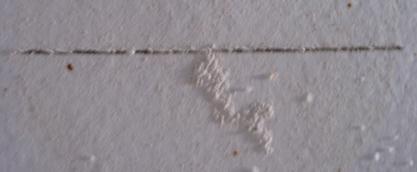
166 153 G9-N-C G9-N-NC S-N-C S-N-NC Bare 7075 A-N G4-N A-N-C A-N-NC G4-N-C


167 154 G4-N-NC Chromate AA2024
168 155 Appendix III: Photo Documentation of Select Atmospheric Exposure Samples Table 4-17 can be used to convert the sample designation used in the atmospheric exposure report to that used in this thesis. Table A conversion of sample designation from the atmospheric photos to that used in this report. Sample Designation 2P-A-C3-N-3 2P-A-C3-N-5 2P-G4-C3-H-3 2P-G4-C3-H-5 2P-G4-C3-N-3 2P-G4-C3-N-5 2P-G9-C3-N-3 2P-G9-C3-N-5 2P-S-C3-N-3 2P-S-C3-N-5 Corresponding Sample Designation A-N-C A-N-NC G4-H-C G4-H-NC G4-N-C G4-N-NC G9-N-C G9-N-NC S-N-C S-N-NC

169 Photographs of Sealed Specimens after 0 months exposure 156

170 157 Photographs of Sealed Specimen after 3 months exposure Exfoliation in an as-sprayed sample after 6 months of exposure

171 Exfoliation in an as-sprayed sample after 6 months of exposure 158

172 Exfoliation in sealed samples after 9 months of exposure 159

173 Exfoliation in sealed samples after 9 months of exposure 160

174 Exfoliation in sealed samples after 12 months of exposure 161
175 162 References [1] Shaw, B., Frankel, G., Murray, J., 2009, "Short Course on Corrosion: Fundamentals and Experimental Methods," Anonymous Penn State University Corrosion Center,. [2] Senna, L., Achete, C., Simão, R., 2001, "Comparative Study between the Electrochemical Behavior of TiN, TiCxNy and CrN Hard Coatings by using Microscopy and Electrochemical Techniques," Materials Research, 4pp [3] Gray, L. G. S., Graham, R. G., Datta, V. J., 2003, "Using EIS to Better Understand Tank Lining Performance in Laboratory and Field Evaluation," CORROSION 2003,. [4] Schmidt, D., Shaw, B., Shaw, W., 2006, "Corrosion Protection Assessment of Barrier Properties of several Zinc-Containing Coating Systems on Steel in Artifi Cial Seawater," Corrosion, 62(04). [5] Calle, L., and MacDowell, L. G., 2001, "Evaluation of Molybdate Conversion Coatings for Aluminum Alloys by Electrochemical Impedance Spectroscopy," 5 th International Symposium on Electrochemical Impedance Spectroscopy, Anonymous. [6] Schmidt, D., Shaw, B., Sikora, E., 2006, "Corrosion Protection Assessment of Sacrificial Coating Systems as a Function of Exposure Time in a Marine Environment," Progress in Organic Coatings, 57(4) pp
176 163 [7] Sun, S., Zheng, Q., Li, D., 2009, "Long-Term Atmospheric Corrosion Behaviour of Aluminium Alloys 2024 and 7075 in Urban, Coastal and Industrial Environments," Corrosion Science, 51(4) pp [8] Zhu, L., and Song, G., 2006, "Improved Corrosion Resistance of AZ91D Magnesium Alloy by an Aluminium-Alloyed Coating," Surface & Coatings Technology, 200(8) pp [9] Baboian, R., 2005, "Corrosion Tests and Standards: Application and Interpretation (2nd Edition)," ASTM International,. [10] Balani, K., Laha, T., Agarwal, A., 2005, "Effect of Carrier Gases on Microstructural and Electrochemical Behavior of Cold-Sprayed 1100 Aluminum Coating," Surface and Coatings Technology, 195(2-3) pp [11] Zhao, J., Xia, L., Sehgal, A., 2001, "Effects of Chromate and Chromate Conversion Coatings on Corrosion of Aluminum Alloy 2024-T3," Surface and Coatings Technology, 140(1) pp [12] Tait, W.S., 1994, "An Introduction to Electrochemical Corrosion Testing for Practicing Engineers and Scientists," PairODocs Publications,. [13] Hernández, M., Genescá, J., Uruchurtu, J., 2009, "Correlation between Electrochemical Impedance and Noise Measurements of Waterborne Coatings," Corrosion Science, 51(3) pp
177 164 Chapter 5 : The Effect of Surface Preparation on the Fatigue Performance of Cold Spray Applied Coatings onto AA2024-T351 Substrates Abstract RR Moore constant amplitude rotating bend fatigue tests were run on AA2024- T351 substrates with commercially pure aluminum coatings applied via the Cold Spray process. Five samples were tested and compared including those that were: (1) bare (uncoated), (2) shot peened, (3) glass bead grit blast, (4) shot peened and aluminum coated, and (5) glass bead grit blast and aluminum coated. Five replicates of each sample were tested at two different stress levels, 26 ksi and 30 ksi, and scanning electron microscopy analysis was conducted in order to identify the failure location and failure mechanisms of each sample. It was found that the Cold Spray applied coating increased the fatigue life of the surface prepared samples by 20% at 26 ksi and 16% at 30 ksi. The glass bead grit blast and coated samples experienced an improved fatigue life over the bare specimen by 511% at 30 ksi. Introduction A coating applied to a substrate to prevent corrosion must also enhance, or at least not harm, the material s inherent mechanical properties. Specifically, the fatigue life of a material is one of the most important considerations in aircraft design. RR Moore rotating bend testing was the chosen fatigue evaluation in this study because it is representative of the cyclic loading common on aircraft wings. The surface preparation technique is known to have an effect on the fatigue properties [1], and therefore that was the main focus of this project. It is well known that
178 165 shot peening can induce compressive residual stresses on a substrate, which can enhance the fatigue life of materials [2]. For example, shot peening has been shown to delay crack initiation and slow the propagation of cracks in 316 stainless steel [3]. A shot peened surface may also contain many grain boundaries and lattice defects, like dislocations, that can enhance the low temperature solid state diffusion process [4]. Grit blasting refers to a type of abrasive blasting in which glass bead media are propelled onto the surface of a substrate. This can serve to roughen the surface of a smooth material and allow for better coating deposition. The increased surface roughness and inherent embedded grit that result from the process can reduce fatigue life, but the residual stress imparted on the surface from the process serves to increase fatigue life [5][1]. This leads to contradicting data in literature about the effect of the grit blast process on the fatigue life of a material. Price et al [6]. showed that grit blasting a titanium alloy and applying a pure titanium cold spray coating significantly reduces the fatigue life of the original alloy in rotating bend tests. However, the grit blasting technique has also been shown to increase the fatigue life of the 2024-T3 aluminum alloy by close to 50 percent [7]. Brandt [8] found that, depending on the parameters of the grit blasting, the surface preparation may increase the fatigue life of aluminum specimen in rotating bend tests. Coatings can have either an enhanced or adverse effect on the mechanical properties of the underlying substrate. Saini [9] found that WC/C coatings increase the endurance limit of steel by 7% while not negatively affecting the hardness or tensile properties. Mcgrann et al [10]. showed that the residual stresses caused by coating 6061
179 166 aluminum and steel substrates with WC-Co coatings could increase the fatigue life by a factor of ten. Fatigue failure can depend on the microstructure of the coatings themselves. When WC-Co coatings were applied to AISI 4340 steel by the HVOF process, it was found that the major contribution to increased fatigue life was the load carrying capacity of the coatings [11]. It has also been shown that the porosity of an applied coating can have a large effect on the resulting fatigue strength of the coating and underlying substrate [12][13]. Strong coating adhesion, usually a desirable characteristic, can be detrimental if the mechanical properties of the coating are less desirable then the covered substrate. It is possible for cracks to initiate in the coating, and then due to strong adhesion spread into the underlying substrate material and initiate failure [14]. The nitrogen carrier gas yielded the best corrosion performance in terms of the laboratory and atmospheric testing, along with superior coating adhesion in phase I of the SBIR [15]. Therefore, nitrogen was chosen as the carrier gas for manufacturing the fatigue specimen. A test matrix was subsequently developed which utilized five different sample types: bare, shot peened, grit blast, shot peened and coated, and grit blast and coated. Ten specimens were created for each of these sample types, five to be tested at a stress of 30 ksi and five to be tested at a stress of 26 ksi. Experimental Procedures Cylindrical stock of AA2024-T351 was obtained and machined into specimens designed for testing in an Instron R.R. Moore high speed fatigue testing machine. A schematic of the specimen used is shown in Figure 5-1, along with a typical bare specimen in Figure 5-2.
![167 Figure 5-1. The schematic used to manufacture RR Moore fatigue specimen [16]. Figure 5-2. A typical bare RR Moore rotating fatigue sample.](/docs-images/73/69139107/images/180-1.jpg "Specimens designated for surface preparation and coating were sent to The Applied Research Laboratory at The Pennsylvania State University.")
180 167 Figure 5-1. The schematic used to manufacture RR Moore fatigue specimen [16]. Figure 5-2. A typical bare RR Moore rotating fatigue sample. Specimens designated for surface preparation and coating were sent to The Applied Research Laboratory at The Pennsylvania State University. Peened samples were shot to a surface coverage of fifty percent. The grit blasting was applied at a forty five degree angle, although it should be noted that this angle was defined by the operator and therefore was subject to operator error equivalent to 45 ± 15. The average surface roughness of samples with each surface preparation is shown in Table 5-1. Table 5-1. The average surface roughness of samples after each surface preparation. Surface Preparation Average Surface Roughness RA (μin) Bare Sample (No Surface Preparation) 30 Shot Peened Sample 75 Grit Blast Sample 130 Upon completion of each surface preparation, specimens designated for Cold Spray were cleaned ultrasonically in alcohol. Specimens were then taped on the ends to prevent deformation of the careful tolerances required for RR Moore testing. The samples


181 168 were then subjected to an HVPC applied CP-Al coating that was manufactured using powder from Valimet Inc. The powder had a mean particle size of 17 μm and was accelerated with a nitrogen carrier gas at a temperature of 400 C. The average applied coating thickness was 15 mils. An SEM photo of the coating/substrate interface is shown on a fractured specimen in Figure 5-3. Figure 5-3. An example of the coating and substrate on a fractured grit blast and coated specimen. The samples were then subjected to RR Moore rotating fatigue testing in an Instron machine, shown in Figure 5-4. Figure 5-4. The Instron RR Moore rotating fatigue testing apparatus used in this study.
182 169 The 30 ksi and 22 ksi stress levels were used in order to be consistent with other testing on AA2024-T351 substrates in literature [17]. In preliminary tests, however, bare samples were shown to run out (defined by 5e7 cycles) at 22 ksi. Therefore, samples were actually tested at stresses of 30 and 26 ksi in order to ensure fracture and avoid a run out scenario. The samples were rotated at speeds ranging from 7,000 to 8,500 rpm. Slight variations in rotational speeds were acceptable and have been shown not to affect the outcome of RR Moore tests [17]. Upon specimen failure, the sample was removed and the cycles to failure was recorded. After all samples were tested, they were machined for SEM analysis. The samples were then examined using a magnification that varied from 12x to 400x. An accelerating voltage of 12 kv was used along with a varying working distance, a spot size of 36, and a secondary electron imaging (SEI) signal. Results An S-N curve of the resulting data is included as Figure 5-5.
183 170 Figure 5-5. An S-N curve of the resulting data A table showing the cycles to failure of each specimen is included as Table 5-2. Figures 5-6 and 5-7 are also included in order to show more clearly the cycles to failure of each sample at the two stress levels. Figure 5-6 indicates that at 30 ksi the grit blast and coated samples clearly outperformed all other specimens. Specifically, their average cycles to failure of 5,680,000 was higher than any other samples. This is most likely due to the residual compressive stresses induced on the samples from the surface preparation and Cold Spray coating process. The bare specimens performed the worst, with the lowest average cycles to failure of 929,000. At 26 ksi there is a significant amount of scatter in the data and it was necessary to perform a statistical analysis in order to ascertain whether the surface preparations and coating had an effect on the cycles to failure of the specimen. It should be noted that due to cost restrictions and sample availability, only four samples of the shot peened and uncoated specimens were run at each stress.
184 171 Table 5-2. The cycles to failure of each sample tested at both the 26 and 30 ksi stress levels. Stress (ksi) Sample Cycles to Failure Average Cycles to Failure 30 Bare E Bare E Bare E E Bare E Bare E Bare E Bare E Bare E E Bare E Bare E GB NC Sample E GB NC Sample E GB NC Sample E E GB NC Sample E GB NC Sample E GB NC Sample E GB NC Sample E GB NC Sample E E GB NC Sample E GB NC Sample E GB C Sample E GB C Sample E GB C Sample E E GB C Sample E GB C Sample E GB C Sample E GB C Sample E GB C Sample E E GB C Sample E GB C Sample E Peened NC Sample E Peened NC Sample E Peened NC Sample E E Peened NC Sample E Peened NC Sample 5 26 Peened NC Sample E Peened NC Sample E Peened NC Sample E E Peened NC Sample E Peened NC Sample 5 30 Peened C Sample E Peened C Sample E Peened C Sample E E Peened C Sample E Peened C Sample E Peened C Sample E Peened C Sample E Peened C Sample E E Peened C Sample E Peened C Sample E+06
185 172 Scatter Plot of Fatigue Data: 30 ksi 8e+6 6e+6 Cycles to Failure 4e+6 2e+6 N.a.N. Bare Sample GB 45 No Coating GB 45 Coating Peened No Coating Peened Coating Specimen Designation Figure 5-6. A Scatter plot of the cycles to failure of samples tested at a stress of 30 ksi. Scatter Plot of Fatigue Data: 26 ksi 3.0e+7 2.5e+7 Cycles to Failure 2.0e+7 1.5e+7 1.0e+7 5.0e+6 Bare Sample GB 45 No Coating GB 45 Coating Peened No Coating Peened Coating 0.0 Specimen Designation Figure 5-7. A Scatter plot of the cycles to failure of samples tested at a stress of 26 ksi.
186 173 Statistical Analysis This study was a full factorial design with two factors at two levels. Factor A was coating, with the levels being coated and uncoated. Factor B was surface treatment, with the levels being shot peened and grit blast. The number of cycles to failure was the quantitative response variable. The significance of the Cold Spray applied coating was first studied. In order to do this, the main effect of factor A was analyzed by subtracting the average response of coated specimens from the average response of all specimens. This data is shown in Table 5-3. Table 5-3. The Average number of cycles to failure that the coating process adds to the surface preparations. Stress Surface Preparation Average Life of Coated Specimens Average Life of Uncoated Specimens Total Average Main Effect Shot Peened 8.17E E E Ksi Grit Blast 1.96E E E+06 Combined 1.39E+07 Shot Peened 3.23E E E Ksi Grit Blast 5.68E E E+05 Combined 4.46E+06 The data shows that at the 26 ksi stress, the coated samples lasted an average of 2,340,000 cycles longer to failure. At the 30 ksi stress, the coated samples lasted an average of 614,000 cycles longer to failure. Therefore, coating the samples significantly increased their fatigue life. This is most likely due to the Cold Spray process further imparting residual stresses onto the AA2024 samples, beyond those imparted by either surface preparation. The main effect of factor B, surface treatment, and coated samples compared to the bare samples was also analyzed, as shown in Table 5-4. The average life of the coated
187 174 specimens was determined, and then the total average or the average life of the coated specimens and bare substrate was found. The main effect was then the total average subtracted from the average life of the coated specimens. Table 5-4. The average number of cycles to failure that the surface preparation and coating add to the bare samples. Stress Specimen Average Life Average Life of Coated Specimen Total Average Main Effect Bare 1.44E+07 26Ksi Grit Blast Coated 1.96E E E E+05 Shot Peened Coated 8.17E+06 Bare 8.96E+05 30ksi Grit Blast Coated 5.68E E E E+06 Shot Peened Coated 3.23E+06 As Table 5-4 shows, at 30 ksi the surface prepared and coated specimens demonstrated an increased number of cycles to failure over the bare substrate by 1,190,000 cycles. However, at 26 ksi, surface prepared and coated samples decreased the expected lifetime of the bare alloys by 172,000 cycles. Observing Figure 5-7, it can be seen that the shot peened samples, both coated and uncoated, showed much fewer cycles to failure than the bare or grit blast samples. This could be due to stress raisers formed on the aluminum alloys caused by the shot peening process, or by the process resulting in embedded grit in the fatigue samples. The roughening of the surface due to the shot peening process could also be responsible for early nucleation or accelerating fatigue crack propagation, as this has been known to occur in aluminum alloys [18]. Table 5-2 shows that the average life of the grit blast and coated samples at 26 ksi is higher than that of the bare samples, likely due to the residual stresses imparted on the fatigue samples through the grit blast process. This shows how the grit blast surface preparation was superior to the shot peening operation in increasing the fatigue life of the AA2024-T351 material.


188 175 SEM Analysis An SEM analysis was performed on the broken specimens in order to characterize the mechanisms of failure. The bare samples showed fracture that initiated from flaws on the surface of the specimens at both stress levels, as shown in Figure 5-8. Figure 5-8. The crack initiation points of bare specimens at 26 ksi (left) and 30 ksi (right). Both the grit blast and shot peened non-coated samples showed similar failure features to the bare substrate, with crack initiation occurring on the surface of the samples. These initiation points were generally much more pronounced than on the bare samples, however, as shown in Figures 5-9 and This seems logical, with the roughening of the surface of the specimens from the surface preparations likely causing stress raisers where failure initiation could originate.


189 176 Figure 5-9. The crack initiation site for an uncoated shot peened sample. Figure The typical crack initiation site for non coated grit blast specimens. The shot peened and grit blast samples with coatings showed failure that initiated from a variety of sites, not just the surface of specimens like the bare or non coated surface prepared samples. Both the grit blast coated samples and the shot peened coated samples tested at 30 ksi showed failure that emanated from a pore in the substrate/coating interface, as shown in Figure 5-11.


190 177 Figure Pores on the substrate/coating interface that led to the failure of both types of coated samples at 30 ksi. A grit blast and coated sample tested at 26 ksi, however, showed failure that initiated from dimple fracture inside the sample itself. As seen in Figure 5-12, cracks stemming from the dimple are clearly visible. Crack Dimple Figure The dimple and resulting cracks of a grit blast and coated sample tested at 26 ksi. Similar to those tested at 30 ksi, the peened and coated specimens tested at 26 ksi also showed failure that initiated at the substrate/coating interface, as shown in Figure 5-13.

191 178 Figure The failure initiation site occurring on the substrate/coating interface of a typical shot peened and coated specimen tested at 26 ksi. Failure away from the surface on coated samples could be due the increase in residual stresses imparted by the Cold Spray process. The stresses are highest on the surface of the specimen, and decrease drastically towards the middle of the samples. It is therefore possible for failure to initiate away from the surface of the specimen in the areas of lower residual stresses imparted by the Cold Spray process. The SEM results indicate that the fatigue initiation sites correspond with a sample s cycles to failure. In general, crack initiation far from the surface correlated with more cycles to failure for a sample. The bare and non coated shot peened samples performed worse than other samples in this study, and most samples failed on the surface. The grit blast and shot peened coated samples showed most failure occurring at the substrate/coating interface. These samples endured more cycles to failure than the bare or non coated specimens. The grit blast and coated samples lasted the most average cycles
Galvanic corrosion evaluation of 6061 aluminum coupled to CVD coated stainless steel Elizabeth Sikora and Barbara Shaw 6/9/2016
 SHAW AND ASSOCIATES CONSULTING Galvanic corrosion evaluation of 6061 aluminum coupled to CVD coated stainless steel Elizabeth Sikora and Barbara Shaw 6/9/2016 Evaluation of galvanic corrosion of aluminum
METHODS OF COATING FABRICATION
 METHODS OF COATING FABRICATION Zbigniew Grzesik http://home.agh.edu.pl/~grzesik Department of Physical Chemistry and Modelling DEFINITION The coating is the thin outer layer of the object, which physiochemical
Institute for Diagnostic Imaging Research
 Institute for Diagnostic Imaging Research (Repair applications of the LPCS process) Roman Gr. Maev, Emil Strumban, Volf Leshchinskiy, and Dmitry Dzhurinskiy CSAT 2014, Worcester, MA Low Pressure Cold Spray
Kinetic Characteristics of Different Materials used for Bolting Applications
 Kinetic Characteristics of Different Materials used for Bolting Applications Report Kinetic Characteristics of Different Materials used for Bolting Applications Overview One of the most common problems
Real time mapping of corrosion activity under coatings
 Progress in Organic Coatings 41 (2001) 266 272 Real time mapping of corrosion activity under coatings M.Khobaib,1,A.Rensi 2,T.Matakis,M.S.Donley Air Force Research Laboratories, Materials and Manufacturing
Laboratory Experiments in Corrosion Engineering II
 Lecture - 40 Laboratory Experiments in Corrosion Engineering II Keywords: Polarization Experiments, Pitting Potentials, Microbial Corrosion. A. Electrochemical tests in a given environment Polarization
Corrosion Rate Measurement on C-Steel
 Measurements of corrosion rate on Carbon-steel using Electrochemical (potentiodynamic Polarization, EIS etc.) technique. Corrosion Rate Measurement on C-Steel Abdullah Al Ashraf 1. Introduction: The degradation
Corrosion. Lab. of Energy Conversion & Storage Materials. Produced by K. B. Kim
 Corrosion 대기환경에의한금속소재 (organic film coated steel) 의퇴화현상평가연구 Lab. of Energy Conversion & Storage Materials Produced by K. B. Kim Introduction AC Impedance Spectroscopy Application of AC Impedance to Corrosion
Tutorial Corrosion II. Electrochemical characterization with EC-Lab techniques
 Tutorial Corrosion II Electrochemical characterization with EC-Lab techniques 1 OUTLINE 1. Introduction 2. Types of corrosion a) Uniform corrosion b) Localized corrosion 3. Corrosion experiment 4. EC-Lab
Fine-Tune Your Knowledge On The Metallizing Process
 Fine-Tune Your Knowledge On The Metallizing Process 1. What is Metallizing? Metallizing is a common term used to describe thermal sprayed metal coatings. For corrosion protection of steel elements, it
Investigation of Fecraly Coating on Corrosion Behaviour of Mild Steel
 Investigation of Fecraly Coating on Corrosion Behaviour of Mild Steel Department of Mechanical Engineering, Federal University of Technology, Minna, Nigeria E-mail: joe_agboola@yahoo.com Abstract Steel
Hot Dip Galvanizing for Steel Corrosion Projection (fabricated steel items) By Mike Ainsley International Zinc Association (IZA)
 By Mike Ainsley International Zinc Association (IZA)") Hot Dip Galvanizing for Steel Corrosion Projection (fabricated steel items) By Mike Ainsley International Zinc Association (IZA) Steel is and will continue to be one of the most important materials for
Hot Dip Galvanizing for Steel Corrosion Projection (fabricated steel items) By Mike Ainsley International Zinc Association (IZA) Steel is and will continue to be one of the most important materials for
Development of Environmentally Friendly Silica-Based Conversion Coatings for Zn-Ni Alloys
 Development of Environmentally Friendly Silica-Based Conversion Coatings for Zn-Ni Alloys James F. O Keefe Vanderbilt University Advisor: Dr. Branko N. Popov, Dr. Prabhu Ganesan July 26 th, 2007 Corrosion
Chapter 16 Corrosion and Degradation of Materials
 Chapter 16 Corrosion and Degradation of Materials Concept Check 16.1 Question: Would you expect iron to corrode in water of high purity? Why or why not? Answer: Iron would not corrode in water of high
M.N.Singh, D.K.Basu, A.K.Bhattmishra and S. K.Narang CORROSION RESISTANT ELECRODEPOSITED ZINC COATING FROM ZINC DROSS
 ..:: CORCON 2UU2 ::.. SPEAKERS (Basic Corrosion) 04 TECHNICAL A SPEAKERS A ABOUT NA( M.N.Singh, D.K.Basu, A.K.Bhattmishra and S. K.Narang M. N. Singh, D. K. Basu, A. K. Bhattmishra and S. K. Narang National
CORROSION AND CORROSION CONTROL An Introduction to Corrosion Science and Engineering
 CORROSION AND CORROSION CONTROL An Introduction to Corrosion Science and Engineering FOURTH EDITION R. Winston Revie Senior Research Scientist CANMET Materials Technology Laboratory Natural Resources Canada
Rusting is an example of corrosion, which is a spontaneous redox reaction of materials with substances in their environment.
 CORROSION WHAT IS CORROSION? Corrosion is the deterioration of a metal as a result of chemical reactions between it and the surrounding environment. Rusting is an example of corrosion, which is a spontaneous
Advances in high velocity oxygen fuel spraying enhance long-term durability in Bosch Rexroth large hydraulic cylinder rods
 profile Drive & Control Technical Article Advances in high velocity oxygen fuel spraying enhance long-term durability in Bosch Rexroth large hydraulic cylinder rods Gas Temperature (10 3 ºF) 30 25 20 15
Prevention Strategies Design and Coatings
 Lecture 14 Prevention Strategies Design and Coatings Keywords: Corrosion Prevention, Designs, Protective Coatings. There are a number of methods to control corrosion. The choice of any one control technique
Mat E 272 Lecture 26: Oxidation and Corrosion
 Mat E 272 Lecture 26: Oxidation and Corrosion December 11, 2001 Introduction: Environmental degradation of materials is one of the most costly failure modes, accounting for over 5 percent of the total
DEVELOPMENT OF ELECTROLESS PROCESS FOR DEPOSITION OF ZN SILICATE COATINGS
 REPORT OF THE FINAL PROJECT ENTITLED: DEVELOPMENT OF ELECTROLESS PROCESS FOR DEPOSITION OF ZN SILICATE COATINGS by Veeraraghavan S Basker Department of Chemical Engineering University of South Carolina
Methods of Corrosion Control. Corrosion Control or Corrosion Management?
 Corrosion Control or Corrosion Management? Corrosion control is a process aimed at reducing the corrosion rate to a tolerable level (or predictable limits) Corrosion control focuses mainly on (i) materials
Accelerated Testing and Durability. Qualifying your Industrial Anticorrosive Coatings
 Accelerated Testing and Durability Qualifying your Industrial Anticorrosive Coatings Overview Static Test Methods Cyclic Test Methods Exterior Exposure Comparison of Accelerated Testing Evaluating a Coating
CONTENTS. Preface to the 3rd Edition Acknowledgments
 CONTENTS Preface to the 3rd Edition Acknowledgments vii ix CHAPTER 1 INTRODUCTION 1 1.1 Definition of materials degradation 1 1.2 Definition and significance of surface engineering 4 1.3 Classification
OVERVIEW OF CORROSION PROTECTION ALLOY MP-ACQ FASTENER COATING SYSTEM FOR USE IN ACQ-PRESSURE TREATED LUMBER
 OVERVIEW OF CORROSION PROTECTION ALLOY MP-ACQ FASTENER COATING SYSTEM FOR USE IN ACQ-PRESSURE TREATED LUMBER Arnold Satow, President Satow Global Technologies, LLC Corrosion is the electrochemical reaction
Iron is found in an oxidized state and is mined from the ground as an iron ore.
 Iron is found in an oxidized state and is mined from the ground as an iron ore. Energy is used to convert this iron oxide into steel. Ore is loaded into a blast furnace where heat energy removes the oxygen
Improvement of corrosion resistance of HVOF thermal sprayed coatings by gas shroud
 Improvement of corrosion resistance of HVOF thermal sprayed coatings by gas shroud Jin Kawakita, Takeshi Fukushima, Seiji Kuroda, and Toshiaki Kodama National Research Institute for Materials Science Abstract
Corrosion Control and Cathodic Protection Data Sheet
 Data Sheet CORROSION CONTROL Corrosion control is the application of engineering principles and procedures to minimise corrosion to an acceptable level by the most economical method. It is rarely practical
Steels suitable for galvanizing
 Steels suitable for galvanizing 2013-09-18 Most steels can be satisfactorily hot-dip galvanized. However, reactive elements in the steel, in particular, silicon (Si) and phosphorus (P), can affect hot-dip
MEASURING THE EFFECTIVENESS OF MIGRATING CORROSION INHIBITORS (MCIs) BY ELECTROCHEMICAL TECHNIQUES
 BY ELECTROCHEMICAL TECHNIQUES") MEASURING THE EFFECTIVENESS OF MIGRATING CORROSION INHIBITORS (MCIs) BY ELECTROCHEMICAL TECHNIQUES By Paul Vrkljan Alla Furman Christophe Chandler Cortec Corporation 4119 White Bear Parkway St. Paul, MN
MEASURING THE EFFECTIVENESS OF MIGRATING CORROSION INHIBITORS (MCIs) BY ELECTROCHEMICAL TECHNIQUES By Paul Vrkljan Alla Furman Christophe Chandler Cortec Corporation 4119 White Bear Parkway St. Paul, MN
Laser assisted Cold Spray
 2009-02-16 Laser assisted Cold Spray Andrew Cockburn, Matthew Bray, Rocco Lupoi Bill O Neill Innovative Manufacturing Research Centre (IMRC) Institute for Manufacturing, Department of Engineering, University
CHEMICAL SPECIFICATIONS OF ZINC AND ZINC ALUMINUM ALLOYS: TABLE 1 TABLE 1
 TECHNICAL BULLETIN CORROSION RESISTANCE OF ZINC And Zinc Alloys CHEMICAL SPECIFICATIONS OF ZINC AND ZINC ALUMINUM ALLOYS: TABLE 1 PROPERTIES OF ZINC ALLOYS The Mechanical and physical properties of the
Galvanic Corrosion Prevention Guide for Water Cooling Systems
 WATER COOLED DEVICES Galvanic Corrosion Prevention Guide for Water Cooling Systems November 2017 White Paper Created by Helen E. Kane, Advanced Energy Industries, Inc. Water Cooled Devices Abstract This
Introduction to Corrosion Science
 E. McCafferty Introduction to Corrosion Science Springer Contents 1 Societal Aspects of Corrosion 1 We Live in a Metals-Based Society 1 Why Study Corrosion? 1 Corrosion and Human Life and Safety 1 Economics
Corrosion. Cause of Corrosion: Electrochemical Mechanism of Corrosion (Rusting of Iron)
") Corrosion Any process of deterioration (or destruction) and consequent loss of a solid metallic material, through an unwanted (or unintentional) chemical or electrochemical attack by its environment, starting
Corrosion Any process of deterioration (or destruction) and consequent loss of a solid metallic material, through an unwanted (or unintentional) chemical or electrochemical attack by its environment, starting
Heat Transfer Simulation to Determine the Impact of Al-5Mg Arc Sprayed Coating onto 7075 T6 Al Alloy Fatigue Performance
 11 th International LS-DYNA Users Conference Simulation (5) Heat Transfer Simulation to Determine the Impact of Al-5Mg Arc Sprayed Coating onto 7075 T6 Al Alloy Fatigue Performance G. D Amours, B. Arsenault,
Available online at Fatigue Fatigue in AISI 4340 steel thermal spray coating by HVOF for aeronautic application
 Available online at www.sciencedirect.com Procedia Procedia Engineering Engineering 2 (2010) 00 (2009) 1617 1623 000 000 Procedia Engineering www.elsevier.com/locate/procedia Fatigue 2010 Fatigue in AISI
Metallization deposition and etching. Material mainly taken from Campbell, UCCS
 Metallization deposition and etching Material mainly taken from Campbell, UCCS Application Metallization is back-end processing Metals used are aluminum and copper Mainly involves deposition and etching,
Available online at ScienceDirect. Procedia Engineering 184 (2017 )
") Available online at www.sciencedirect.com ScienceDirect Procedia Engineering 184 (2017 ) 418 422 Advances in Material & Processing Technologies Conference Development of Al-Zn-Cu Alloy for Low Voltage
Available online at www.sciencedirect.com ScienceDirect Procedia Engineering 184 (2017 ) 418 422 Advances in Material & Processing Technologies Conference Development of Al-Zn-Cu Alloy for Low Voltage
Characterization of Oxide Film Formed on Ck45 Steel by Plasma Electrolytic Oxidation Method
 Journal of Mechanical Research and Application ISSN: 2251-7383, eissn: 2251-7391 Vol. 4, No. 2, 2012, 57-61 Characterization of Oxide Film Formed on Ck45 Steel by Plasma Electrolytic Oxidation Method JMRA
Thermal Durability and Abradability of Plasma Sprayed Al-Si-Polyimide Seal Coatings p. 85
 Trends in Automotive Applications of Thermal Spray Technology in Japan p. 1 Production Plasma in the Automotive Industry: A European Viewpoint p. 7 The Effect of Microstructure on the Wear Behavior of
family of stainless steels can be divided into five (5) categories:
 categories:") Welcome to the fifth issue of Tech Talk. This newsletter covers a range of topics on various welding products, applications, metallurgy, techniques, and economics. Previous issues are archived at www.unibraze.com.
Welcome to the fifth issue of Tech Talk. This newsletter covers a range of topics on various welding products, applications, metallurgy, techniques, and economics. Previous issues are archived at www.unibraze.com.
The below identified patent application is available for licensing. Requests for information should be addressed to:
 DEPARTMENT OF THE NAVY NAVAL UNDERSEA WARFARE CENTER DIVISION NEWPORT WOFFICE OF COUNSEL (PATENTS) BUILDING 11, CODE OOOC NEWPORT, RHODE ISLAND 02841-1708 PHONE: 401 832-4736 FAX: 401 832-1231 DSN: 432-4736
AIRCRAFT COLD SPRAY REPAIR COLD SPRAY REPAIR SERVICES
 AIRCRAFT COLD SPRAY REPAIR COLD SPRAY REPAIR SERVICES Moog Inc. is best known as a worldwide designer, manufacturer, and integrator of precision motion control products and systems. While very proud of
ACCELERATED CORROSION TESTING OF GALVANIC COUPLES. James F. Dante, Josh Averett, Fritz Friedersdorf, and Christy Vestal
 ACCELERATED CORROSION TESTING OF GALVANIC COUPLES James F. Dante, Josh Averett, Fritz Friedersdorf, and Christy Vestal Luna Innovations 706 Forest St. Suite A Charlottesville, VA 22903 dantej@lunainnovations.com
Electrochemical systems for corrosion measurements
 Electrochemical systems for corrosion measurements Corrosion impact 02 Corrosion is the term generally used to describe oxidative processes that result from the interaction of a metal with environmental
Materials of Engineering ENGR 151 CORROSION ELECTRICAL PROPERTIES
 Materials of Engineering ENGR 151 CORROSION ELECTRICAL PROPERTIES more anodic (active) more cathodic (inert) GALVANIC SERIES Ranking of the reactivity of metals/alloys in seawater Platinum Gold Graphite
2. Wet Corrosion: Characteristics, Prevention and Corrosion Rate
 2. Wet Corrosion: Characteristics, Prevention and Corrosion Rate Mighty ships upon the ocean suffer from severe corrosion. Even those that stay at dockside are rapidly becoming oxide Alas, that piling
POTENTIODYNAMIC EVALUATION OF CORROSION RESISTANT COATINGS
 POTENTIODYNAMIC EVALUATION OF CORROSION RESISTANT COATINGS Zdeněk ČESÁNEK a, Jan SCHUBERT b a University of West Bohemia, Univerzitní 8, 306 14 Plzeň, Czech Republic, zdenda13@kmm.zcu.cz Abstract b University
Remote Plasma Source Chamber Anodization
 Remote Plasma Source Chamber Anodization SUPERIOR ANODIC COATINGS IN THE XSTREAM RPS CHAMBER ENSURE RELIABLE, PARTICULATE-REE CHAMBER CLEANING Created by Advanced Energy Industries, Inc. Abstract Most
Index. Key to Abbreviations Used in Index T = table D = definition F = figure [ ] = see this subject under this listing
![Index. Key to Abbreviations Used in Index T = table D = definition F = figure [ ] = see this subject under this listing](/thumbs/89/100991076.jpg "Index. Key to Abbreviations Used in Index T = table D = definition F = figure [ ] = see this subject under this listing") STP610-EB/NOV. 1976 Index Key to Abbreviations Used in Index T = table D = definition F = figure [ ] = see this subject under this listing Activation energy, 157, 319 Aerospace alloys (steels), 250 Air
STP610-EB/NOV. 1976 Index Key to Abbreviations Used in Index T = table D = definition F = figure [ ] = see this subject under this listing Activation energy, 157, 319 Aerospace alloys (steels), 250 Air
Metropolitan Water Reclamation District of Greater Chicago 10/19/ Mark Joyce Senior Mechanical Engineer Engineering Department
 Metropolitan Water Reclamation District of Greater Chicago 10/19/201 2 Mark Joyce Senior Mechanical Engineer Engineering Department 1 Definition of Corrosion Corrosion is the deterioration of a substance
CORROSION & ITS CONTROL -Content. Introduction Classification Galvanic series Factors affecting Protection methods Summary
 CORROSION & ITS CONTROL -Content Introduction Classification Galvanic series Factors affecting Protection methods Summary 3 Learning Objectives At the end of the chapter the learner will be able to; 1.
Analysis of Bending Stresses On Coating Materials by Experimental and FE Method
 Analysis of Bending Stresses On Coating Materials by Experimental and FE Method Umesh G 1, Biradar Mallikarjun 2, Dr. C.S.Ramesh 3 1 Student, IV th Semester M.Tech.(Machine Design), 2 Associate Professor,
THERMAL SPRAY COATINGS
 THERMAL SPRAY COATINGS THERMAL SPRAY is a group of processes in which metals, alloys, ceramics, plastics and composite materials in the form of powder, wire, or rod are fed to a torch or gun with which
STP965-EB/Jan Subject Index
 STP965-EB/Jan. 1987 Subject Index A Accelerated atmospheric corrosion chamber, 374-84 Accelerated corrosion testing of bridge wires, 82-85, 89-91 for evaluation purposes, 305 in laboratory, 359 Acid rain,
THE RELATIONSHIP BETWEEN SURFACE TREATMENTS AND CORROSION RESISTANCE OF HOT-DIP GALVANIZED STEEL. Amirreza Bakhtiari
 Association of Metallurgical Engineers of Serbia AMES Scientific paper UDC: 620.197.2:669.141; 620.193 THE RELATIONSHIP BETWEEN SURFACE TREATMENTS AND CORROSION RESISTANCE OF HOT-DIP GALVANIZED STEEL Amirreza
Hot-Dip Galvanized Fabrication Considerations
 Hot-Dip Galvanized Fabrication Considerations TECHNICAL BULLETIN JANUARY 27, 2016 Forming Hot-dip galvanized sheet can be formed almost as readily as uncoated cold rolled sheet. It can be formed in a variety
Thermal Spray Coating
 Thermal Spray Coating for Corrosion Protection Presented by: John Crowe, PCS What You Need To Know PRESENTATION TOPICS Corrosion Basics Thermal Spray Coating-What It Is & What It Does Advantages & Disadvantages
CATHODIC PROTECTION FOR SOIL STEEL BRIDGES 1
 ARCHIWUM INSTYTUTU INŻYNIERII LĄDOWEJ Nr 23 ARCHIVES OF INSTITUTE OF CIVIL ENGINEERING 2017 CATHODIC PROTECTION FOR SOIL STEEL BRIDGES 1 Karol BZDAWKA PhD, Viacon sp. z o.o. Cathodic Protection (CP) was
Erosion corrosion of mild steel in hot caustic. Part II: The evect of acid cleaning
 Corrosion Science 48 (2006) 2660 2675 www.elsevier.com/locate/corsci Erosion corrosion of mild steel in hot caustic. Part II: The evect of acid cleaning Rihan Omar Rihan, Srdjan NeniT The Department of
Corrosion and batteries
 Corrosion and batteries Corrosion is a process of gradual destruction of metal from its surface due to its unwanted chemical or electrochemical interaction of metal. Ore of metal which is stable and is
IN SITU MONITORING OF REINFORCEMENT CORROSION BY MEANS OF ELECTROCHEMICAL METHODS
 ABSTRACT IN SITU MONITORING OF REINFORCEMENT CORROSION BY MEANS OF ELECTROCHEMICAL METHODS Oskar Klinghoffer, M.Sc. FORCE Institute, Park Allé 345, DK-2605 Brøndby, Denmark The well-known and usually adapted
and cost implications of corrosion, casting a spot light on the need for innovation in pipe coating materials and processes.
 A ccording to the Energy Information Administration s International Energy Outlook for 2006, world oil demand is expected to grow from 80 million barrels per day in 2003 to 98 million barrels per day in
Beechcraft Corporation Special Processes Index Special Processes that Require Approval to Perform
 Brazing Note: Part Number-specific approval is required for Suppliers who do not hold Nadcap Welding/Brazing certification. Silver brazing requires Part Number-specific approval in all cases. Contact:
Corrosion Resistance of Alternative Reinforcing Bars: An Accelerated Test
 Corrosion Resistance of Alternative Reinforcing Bars: An Accelerated Test Final Report 24 July 2006 WJE No. 2006.0773 Prepared for: CRSI Prepared by: Wiss, Janney, Elstner Associates, Inc. CORROSION RESISTANCE
Analysis of Surface Properties of Al 2 O 3 Coating over Mild Steel Using Plasma Spray Process
 Analysis of Surface Properties of Al 2 O 3 Coating over Mild Steel Using Plasma Spray Process I Arul raj 1, S Ramachandran 2 Research scholar, Faculty of Mechanical Engineering, Sathyabama University,
Lecture 16: Surface Processing
 MSE 440/540: Processing of Metallic Materials Instructors: Yuntian Zhu Office: 308 RBII Ph: 513-0559 ytzhu@ncsu.edu Lecture 16: Surface Processing Department of Materials Science and Engineering 1 Surface
Chapter Outline: Failure
 Chapter Outline: Failure How do Materials Break? Ductile vs. brittle fracture Principles of fracture mechanics Stress concentration Impact fracture testing Fatigue (cyclic stresses) Cyclic stresses, the
INFLUENCE OF FRICTION STIR WELDING ON CORROSION PROPERTIES OF AW-7020M ALLOY IN SEA WATER
 DOI: 10.1515/adms-2015-0002 K. Dudzik 1, W. Jurczak 2 1 Gdynia Maritime University, Faculty of Marine Engineering, Marine Maintenance Department, Gdynia, Poland 2 Polish Naval Academy, Mechanical Electrical
Why Does Rust Occur? 7.1 IN GENERAL
 Why Does Rust Occur? 7.1 IN GENERAL Rust damage on products costs large sums every year, and can also cause breakdowns through various kinds of corrosion weakening supporting structures. There are therefore
GREEN CORROSION INHIBITORS
 GREEN CORROSION INHIBITORS Theory and Practice V. S. SASTRI WILEY A John Wiley & Sons, Inc., Publication CONTENTS Preface 1 Introduction and Forms of Corrosion 1.1 Definition, 1 1.2 Developments in Corrosion
OFFSHORE CATHODIC PROTECTION 101: WHAT IS IT AND HOW DOES IT WORK? Dick Baxter & Jim Britton
 This PDF document contains Live Web Links Click them for more information from the web OFFSHORE CATHODIC PROTECTION 101: WHAT IS IT AND HOW DOES IT WORK? Dick Baxter & Jim Britton www.cathodicprotection101.com
Corrosion and Protection of Metal in the Seawater Desalination
 IOP Conference Series: Earth and Environmental Science PAPER OPEN ACCESS Corrosion and Protection of Metal in the Seawater Desalination To cite this article: Xiangyu Hou et al 018 IOP Conf. Ser.: Earth
Corrosion Resistance of Aluminum
 All Aluminum Technical Traits of Great Passion Corrosion Resistance of Aluminum An All Aluminum Technical Journal January 2008 Physical properties are defined by ASTM testing standards, The Aluminum Association
Material and Process. Specification
 s 146-67- 1 of 7 Document By: Title Name 1. Purpose 1.1 This document defines approved revision levels of Material and Process specifications used by Onboard Systems. This list is for supplier reference
Identification. Type Analysis
 Page 1 of 12 Unit Display: English Print Now Custom 455 Stainless E-Mail Datasheet Add to My Materials UNS Number S45500 Identification Type Analysis Carbon 0.05 % Manganese 0.50 % Phosphorus 0.040 % Sulfur
Thermal Spray Process Training
 1 of 8 Thermal Spray Process Training Sauer Engineering John P. Sauer jopsauer@fuse.net 513-290-3617 Thermal Spray Process Course 2 of 8 Course offerings would be a combination of days and topics below
A Basic Introduction to Thin-Film Coatings. From the Experts at VaporTech
 A Basic Introduction to Thin-Film Coatings From the Experts at VaporTech What are thin-film coatings? 2018 Vapor Technologies, Inc. All rights reserved. Thin-film coatings Physical or Chemical Vapor Deposition
Corrosion and Thermal Insulation in Hot areas A New Approach
 Corrosion and Thermal Insulation in Hot areas A New Approach Mike Mitchell International Protective Coatings Stoneygate Lane, Felling, Gateshead, Tyne & Wear, England Fax No: + 44 (0)191 438 1709 E-mail:
APPLICATION OF GALVANIC CORROSION MODELS. The University of Akron Akron, OH ABSTRACT
 2013 Virtual Department of Defense Corrosion Conference September 16-17, 2013 NACE International APPLICATION OF GALVANIC CORROSION MODELS J. H. Payer 1, R.S. Lillard 2, G.W. Young 3 1 Corrosion and Reliability
Thermal spraying Zinc, aluminium and their alloys. Part 1: Design considerations and quality requirements for corrosion protection systems
 Provläsningsexemplar / Preview INTERNATIONAL STANDARD ISO 2063-1 First edition 2017-09 Thermal spraying Zinc, aluminium and their alloys Part 1: Design considerations and quality requirements for corrosion
MEASUREMENT OF STEEL CORROSION IN CONCRETE
 Seminar in Hokkaido University MEASUREMENT OF STEEL CORROSION IN CONCRETE 2 March 2010 K.Y. Ann Concrete Materials, Mechanics and Engineering School of Civil and Environmental Engineering Yonsei Univ.,
U.S. General Services Administration Historic Preservation Technical Procedures. Galvanized Iron And Steel: Characteristics, Uses And Problems
 U.S. General Services Administration Historic Preservation Technical Procedures Galvanized Iron And Steel: Characteristics, Uses And Problems 05010-09 GALVANIZED IRON AND STEEL: CHARACTERISTICS, USES AND
Figure 1. Effect of cathode-to-anode (C/A) ratio on galvanic corrosion. GALVANIC CORROSION
 ratio on galvanic corrosion. GALVANIC CORROSION") Galvanic Corrosion by Dr. Stephen C. Dexter Professor of Applied Science and Marine Biology Galvanic corrosion, often misnamed "electrolysis," is one common form of corrosion in marine environments. It
Galvanic Corrosion by Dr. Stephen C. Dexter Professor of Applied Science and Marine Biology Galvanic corrosion, often misnamed "electrolysis," is one common form of corrosion in marine environments. It
Oxide coatings as corrosion inhibitors to improve the durability of adhesively bonded Al alloys
 AETOC 2017 25-28.04.2017, Billerbecker, Germany Oxide coatings as corrosion inhibitors to improve the durability of adhesively bonded Al alloys Forschungsfeld - Jianmin Shi, Helger Pries, Klaus Dilger
THE INFLUENCE OF ANODISING PARAMETERS ON THE CORROSION PERFORMANCE OF ANODISED COATINGS ON MAGNESIUM ALLOY AZ91D
 THE INFLUENCE OF ANODISING PARAMETERS ON THE CORROSION PERFORMANCE OF ANODISED COATINGS ON MAGNESIUM ALLOY AZ91D Zhiming Shi, Guangling Song, and Andrej Atrens (CRC for Cast Metals Manufacturing (CAST),
Anticorrosive Coatings
 Anticorrosive Coatings Joerg Sander 1 Introduction 1.1 Why corrosion-protective coatings 1.2 Literature 2 Corrosion protection coatings 2.1 Principles of function 2.1.1 Electrochemistry of corrosion inhibition
Transactions on Engineering Sciences vol 2, 1993 WIT Press, ISSN
 A study of thin-film continuous coating process by vapour deposition P. Gimondo," F. Arezzo,* B. Grifoni,* G. Jasch& "Centra Sviluppo Materiali SpA, Via di Castel & Von Ardenne Anlagentchnik GmbH, Plattleite
THE EFFECT OF ELECTROCHEMICAL MACHINING ON THE FATIGUE STRENGTH OF HEAT RESISTANCE ALLOYS
 Fatigue of Aircraft Structures Vol. 1 (2011) 57-63 10.2478/v10164-010-0038-2 THE EFFECT OF ELECTROCHEMICAL MACHINING ON THE FATIGUE STRENGTH OF HEAT RESISTANCE ALLOYS Jerzy Kozak Institute of Aviation,Warsaw,
Fundamentals of Metal Forming
 Fundamentals of Metal Forming Chapter 15 15.1 Introduction Deformation processes have been designed to exploit the plasticity of engineering materials Plasticity is the ability of a material to flow as
Chromate-free inhibitor and non-chrome fuel tank coatings
 Chromate-free inhibitor and non-chrome fuel tank coatings Dr. Jeannine E. Elliott Dr. Ron Cook 2009 ASETS Defense Sept 2, 2009 Research Research Inc. Inc. Wheat Wheat Ridge, Ridge, CO CO 80033 80033 www.tda.com
STP1421-EB/Aug Subject Index
 STP1421-EB/Aug. 2002 Subject Index A Airflow simulations, 19 Air temperature, 103 Alternating current impedance technique, 171 Aluminum, 3, 59 aluminum coating, 284 aluminum-zinc alloy-coated steel, 284
Corrosion Resistance Improvement of Galvanised Steel by Doped Silane Pre-Treatments
 2015 2 nd International Conference on Material Engineering and Application (ICMEA 2015) ISBN: 978-1-60595-323-6 Corrosion Resistance Improvement of Galvanised Steel by Doped Silane Pre-Treatments J.F.
Corrosion protection. Change of Metal or alloy. Change in Environment. Inhibitors. Change in Design. Cathodic or Anodic protection
 Corrosion protection Change of Metal or alloy Change in Environment Inhibitors Change in Design Cathodic or Anodic protection Application of coatings on Metal surface 1)Material selection Metals and alloys
Computational Methods in Science and Engineering
 The effect of shot peening on the stress corrosion cracking resistance of 304 AISI stainless steel immersed in NaCl solution PROF. NASIR ALKLOUB DR. MUSA AL-TAL PROF. OMAR.O.BADRAN Al-Balqa` Applied University,
Steels Processing, Structure, and Performance, Second Edition Copyright 2015 ASM International G. Krauss All rights reserved asminternational.
 Steels Processing, Structure, and Performance, Second Edition Copyright 2015 ASM International G. Krauss All rights reserved asminternational.org Contents Preface to the Second Edition of Steels: Processing,
Crack Initiation and Crack Propagation of Pre-corroded Ni-16Cr Alloy in 4.5%NaCl Aqueous Solution
 IOSR Journal of Engineering (IOSRJEN) e-issn: 2250-3021, p-issn: 2278-8719 Vol. 3, Issue 8 (August. 2013), V2 PP 11-15 Crack Initiation and Crack Propagation of Pre-corroded Ni-16Cr Alloy in 4.5%NaCl Aqueous
USNA Chemistry Department CORROSION LECTURE. USNA Chemistry Dept.
 USNA Chemistry Department CORROSION LECTURE Corrosion Why is Corrosion Important? Corrosion is the destructive attack of a metal due to an ELECTROCHEMICAL reaction. Attack of Elements on Structural Metals
Thermal Diffusion Galvanizing
 Engineering Test Report M-571 Thermal Diffusion Galvanizing For Pole Line Hardware Revision D 11.17.2017 Added further Corrosion Test results and Abrasion Test results Prepared by 1. Introduction to Thermal