Technical Report Documentation Page 2. Government 3. Recipient s Catalog No.
|
|
|
- Solomon Quinn
- 6 years ago
- Views:
Transcription
1 1. Report No. FHWA/TX-8/ Technical Report Documentation Page 2. Government 3. Recipient s Catalog No. Accession No. 4. Title and Subtitle Durability Evaluation of Post-Tensioned Concrete Beam Specimens after Long-Term Aggressive Exposure Testing 7. Author(s) G. P. Turco, R. M. Salas, A. J. Schokker, J. S. West, M. E. Kreger and J. E. Breen 9. Performing Organization Name and Address Center for Transportation Research The University of Texas at Austin 328 Red River, Suite 2 Austin, TX Sponsoring Agency Name and Address Texas Department of Transportation Research and Technology Implementation Office P.O. Box 58 Austin, TX Report Date November Performing Organization Code 8. Performing Organization Report No Work Unit No. (TRAIS) 11. Contract or Grant No Type of Report and Period Covered Technical Report (9/3-11/7) 14. Sponsoring Agency Code 15. Supplementary Notes Project performed in cooperation with the Texas Department of Transportation and the Federal Highway Administration. 16. Abstract This report focuses on the forensic analysis and evaluation of large-scale post-tensioned beam specimens after nearly 8 years of extremely aggressive exposure testing. The research was funded jointly by both FHWA and TxDOT. The relationship between durability performance and the following variables was evaluated in this study: level of applied load and initial cracking, level of prestress, duct type, strand type, grout type, grouting method, use of encapsulated system for anchorage protection, and galvanized duct splice type. In addition, the applicability of half-cell potentials and chloride penetration tests for evaluating the likelihood of corrosion was examined. Major findings were: 1) mixed reinforcement (also known as partial prestressing), performed poorly from a durability standpoint. Only fully prestressed beams offered better durability performance than those which were not prestressed at all. 2) Corrugated steel galvanized ducts performed very poorly. Large holes were found in the ducts, and in some cases several inches of the ducts completely corroded away. 3) Corrugated plastic ducts offer better performance as long as they are "robust." 4) Non-flowfilled epoxy coated strand and galvanized strand offered no significant improvement in long-term durability over conventional strand. 5) Installing plastic caps over anchorheads rather than just filling the anchorage pocket with nonshrink grout increases the long-term durability of the anchorage. 17. Key Words corrosion, grout, post-tensioned concrete tendons, post-tensioning ducts, mixed reinforcement, duct splice, concrete cracking, high performance concrete 19. Security Classif. (of report) Unclassified Unclassified 18. Distribution Statement No restrictions. This document is available to the public through the National Technical Information Service, Springfield, Virginia 22161; 2. Security Classif. (of this page) 21. No. of pages 174 Form DOT F 17.7 (8-72) Reproduction of completed page authorized 22. Price
2

3 Durability Evaluation of Post-Tensioned Concrete Beam Specimens after Long-Term Aggressive Exposure Testing G. P. Turco R. M. Salas A. J. Schokker J. S. West M. E. Kreger J. E. Breen CTR Technical Report: Report Date: November 27 Project: Project Title: Durability Design of Post-Tensioned Bridge Substructure Elements Sponsoring Agency: Texas Department of Transportation Performing Agency: Center for Transportation Research at The University of Texas at Austin Project performed in cooperation with the Texas Department of Transportation and the Federal Highway Administration.
4 Center for Transportation Research The University of Texas at Austin 328 Red River Austin, TX Copyright (c) 28 Center for Transportation Research The University of Texas at Austin All rights reserved Printed in the United States of America iv
5 Disclaimers Author's Disclaimer: The contents of this report reflect the views of the authors, who are responsible for the facts and the accuracy of the data presented herein. The contents do not necessarily reflect the official view or policies of the Federal Highway Administration or the Texas Department of Transportation (TxDOT). This report does not constitute a standard, specification, or regulation. Patent Disclaimer: There was no invention or discovery conceived or first actually reduced to practice in the course of or under this contract, including any art, method, process, machine manufacture, design or composition of matter, or any new useful improvement thereof, or any variety of plant, which is or may be patentable under the patent laws of the United States of America or any foreign country. Engineering Disclaimer NOT INTENDED FOR CONSTRUCTION, BIDDING, OR PERMIT PURPOSES. Project Engineer: J. E. Breen Professional Engineer License State and Number: Texas No P. E. Designation: J. E. Breen v
6 Acknowledgments We greatly appreciate the financial support from the Texas Department of Transportation and the Federal Highway Administration that made this project possible. We are grateful for the active support of the project director Brian Merrill (BRG) and of Dr. Paul Virmani (FHWA). vi
7 Table of Contents 1. Introduction Background Corrosion of Steel in Concrete Durability in Post-Tensioning Effect of Mixed Reinforcement Durability of Post-Tensioning Anchorages Current Research Test Specimens Specimen Test Concept Specimen Description Specimen Variables Specimen Materials Specimen Construction Details Specimen Loading Specimen Notation Experimental Procedure Long-Term Exposure Testing Setup Measurements Taken during Exposure Testing Long-Term Exposure Test Results and Analysis Half-Cell Potential Data Chloride Penetration Data Forensic Analysis Autopsy Procedure Results of Forensic Analysis Analysis of Results Overall Observations from Forensic Analysis Analysis of Phase I Variables Phase II Variables Comparison of Data Taken at the End of Exposure Testing with Results of Forensic Analysis Extent of Corrosion Damage and Length of Testing Phase I Beams versus Phase II Beams Test Specimens Design Recommendations Summary, Conclusions, and Recommendations for Future Testing Summary Conclusions Recommendations for Future Testing References vii
8 viii
9 List of Figures Figure 1.1: Typical Post-Tensioning Hardware Figure 1.2: Corroded Anchorage (Bearing Plate with Strand Tails) Figure 2.1: Test Specimen Elevation Figure 2.2: Test Specimen outside the Ferguson Structural Engineering Laboratory Figure 2.3: Specimen Reinforcement Configurations Figure 2.4: Duct Splice Types Figure 2.5: Splice Configurations Figure 2.6: VSL VSLAB+ System 21 (End Anchorage) Figure 2.7: Specimen Construction Figure 2.8: Post-Tensioning Equipment Setup Figure 2.9: Grouting Procedure Figure 2.1: Anchorage Pocket before Capping Figure 2.11: Specimen Loading Figure 3.1: Phase II Beams under Exposure Testing Figure 3.2: Anchorage Exposure System Figure 3.3: Crack Width Measurement System Figure 3.4: Beam 2.7-Side View (Left) and Top View (Right) Figure 3.5: Half-Cell Potential Sampling Stations Figure 3.6: Chloride Sample Locations for Typical Test Specimen Figure 3.7: Chloride Sample Locations for Specimens 1.1 and Figure 3.8: Chloride Sample Location for Anchorage Exposure Specimens Figure 3.9: Block Specimens Figure 4.1: Phase I Beams-Maximum Half-Cell Potentials for Each Day of Sampling... 3 Figure 4.2: Phase II Beams-Maximum Half-Cell Potentials for Each Day of Sampling... 3 Figure 4.3: Half-Cell Potential Contours at 3,17 Days for Phase I Beams Figure 4.4: Estimated Time of Initiation of Corrosion: Phase I Beams Figure 4.5: Half-Cell Potential Readings at 2,894 Days for Phase II Beams Figure 4.6: Estimated Time of Initiation of Corrosion: Phase II Beams Figure 4.7: Maximum Final Half-Cell Potential Readings for Phase I Beams Figure 4.8: Maximum Final Half-Cell Potential Readings for Phase II Beams, Including Phase I Beam Figure 4.9: Beam and Block Chloride Penetration for Phase I Beams Figure 4.1: Beam Chloride Penetration for 27-in. and 32-in. Offsets (Beams 1.1 and 3.1) Figure 4.11: Beam and Block Chloride Penetration for Phase II Beams ix
10 Figure 4.12: Chloride Penetration for Anchorages of Phase II Beams Subjected to End Anchorage Exposure... 4 Figure 4.13: Chloride Penetration at Reinforcing Bar Depth-Phase I Beams... 4 Figure 4.14: Chloride Penetration at Bar Depth-Phase II Beams Figure 5.1: Beam Cutting Pattern Figure 5.2: Cutting Pattern for Beams 1.1 and Figure 5.3: Post-Tensioning Ducts Before Removal From Center Block (Phase II Beam 2.12 Pictured) Figure 5.4: Removal of Post-Tensioning Anchorages (East End Anchorage of Beam 2.12 pictured) Figure 5.5: Mild Reinforcing Steel Rating Intervals Figure 5.6: Galvanized Duct Rating System Figure 5.7: Beam 1.1-Crack Patterns and Corrosion Rating Graphs Figure 5.8: Beam 1.1 Autopsy Elements-Longitudinal Bar (Left) and Stirrup (Right) Figure 5.9: Beam 1.2-Crack Patterns and Corrosion Rating Graphs Figure 5.1: Beam 1.2 Crack Widths Figure 5.11: West End of Autopsy Block-Beam Figure 5.12: Beam 1.2 Autopsy Elements-Longitudinal Bar (Left) and Stirrup (Right) Figure 5.13: Beam 1.4-Crack Patterns and Corrosion Rating Graphs Figure 5.14: Beam 2.1-Crack Patterns and Corrosion Rating Graphs Figure 5.15: Beam 2.1 Duct Splices-South Duct Industry Standard Splice (Left) and North Duct Heat Shrink Splice (Right)... 6 Figure 5.16: Beam 2.1 Autopsy Elements Figure 5.17: Beam 2.2- Crack Patterns and Corrosion Rating Graphs Figure 5.18: Beam 2.2 Autopsy Elements Figure 5.19: Beam Crack Patterns and Corrosion Rating Graphs Figure 5.2: Beam 2.4 Autopsy Elements Figure 5.21: Beam 2.4 Duct Splices-South Duct Industry Standard Splice (Left) and North Duct Heat Shrink Splice (Right)... 7 Figure 5.22: Beam 3.1-Crack Maps and Corrosion Rating Graphs Figure 5.23: Beam 3.1 Autopsy Elements Figure 5.24: Beam 3.4-Crack Patterns and Corrosion Rating Graphs Figure 5.25: Beam 3.4 Autopsy Elements Figure 5.26: Beam 3.5-Crack Patterns and Corrosion Rating Graphs Figure 5.27: Beam 3.5 Autopsy Elements... 8 Figure 5.28: Beam 4.1-Crack Patterns and Corrosion Rating Graphs Figure 5.29: Beam 4.1 Autopsy Elements Figure 5.3: Beam Crack Maps and Corrosion Rating Graphs Figure 5.31: Beam 2.7 Autopsy Elements (From Center Portion of Beam) x
11 Figure 5.32: Beam 2.7-Evidence of Abrasion of Epoxy Coating from Strand on Bottom of South Duct Figure 5.33: Beam 2.7-South Duct Strand with Coating (Left) and After Removal of Coating (Right)... 9 Figure 5.34: Beam 2.7-Example of Strand Coating Damage to North Duct Strand-Patched Strand (Bottom) and Unpatched Strand (Top)... 9 Figure 5.35: Beam 2.7- North Duct Strand Damage Ratings Figure 5.36: Beam 2.7 Anchorage Zones-East End (Left) with Dripper, and West End (Right) without Dripper Figure 5.37: Beam 2.7 West End Anchorages After Removal (Controls): North Duct Anchorage (Top, Left and Right), and South Duct Anchorage (Bottom, Left and Right) Figure 5.38: Beam 2.7-West End Anchorage Zone (Control) Autopsy Elements Figure 5.39: Beam 2.7 East End Anchorages (Dripped End): North Duct Anchorage (Top, Left and Right), and South Duct Anchorage (Bottom, Left and Right) Figure 5.4: Beam 2.7-East End Anchorage Zone (Dripped End) Autopsy Elements Figure 5.41: Beam 2.7-Corrosion Rating Graphs for Anchorages Figure 5.42: Beam 2.8-Crack Patterns and Corrosion Rating Graphs Figure 5.43: Beam 2.8 Autopsy Elements... 1 Figure 5.44: Beam 2.8 Duct Splices-South Duct Heat Shrink Splice (Left) and North Duct Industry Standard Splice (Right) Figure 5.45: Autopsied Galvanized Strand (Bottom) vs. New Galvanized Strand (Top) Figure 5.46: Beam 2.9-Crack Patterns and Corrosion Rating Graphs Figure 5.47: Beam 2.9 Autopsy Elements (From Center of Beam) Figure 5.48: Beam 2.9 Anchorage Zones-East End (Left) with Dripper, and West End (Right) Without Dripper Figure 5.49: Beam 2.9 West End Anchorages (Controls) After Removal-North Duct Anchorage (Top, Left and Right), and South Duct Anchorage (Bottom, Left and Right) Figure 5.5: Beam 2.9-West End Anchorage Zone (Control) Autopsy Elements Figure 5.51: Beam 2.9 East End Anchorages (Dripped End)-North Duct Anchorage (Top, Left and Right), and South Duct Anchorage (Bottom, Left and Right) Figure 5.52: Beam 2.9-East End Anchorage Zone (Dripped End) Autopsy Elements Figure 5.53: Beam 2.9-Corrosion Rating Graphs for Anchorages Figure 5.54: Beam 2.1-Crack Patterns and Corrosion Rating Graphs Figure 5.55: Beam 2.1 Autopsy Elements Figure 5.56: Beam 2.12-Crack Patterns and Corrosion Rating Graphs (Center Portion of Beam) Figure 5.57: Beam 2.12 Autopsy Elements (Center Portion of Beam) Figure 5.58: Beam 2.12 During Autopsy xi
12 Figure 5.59: Beam 2.12-Abrasion Damage to Interior of North Duct (Left) and Strand from Same Location (Right) Figure 5.6: Beam 2.12 Anchorage Zones: East End Anchorage With Dripper (Left) and West End Anchorage Without Dripper (Right) Figure 5.61: Beam 2.12 West End Anchorages (Control End)-South Duct Anchorage (Top, Left and Right) and North Duct Anchorage (Bottom, Left and Right) Figure 5.62: Beam 2.12 West End Anchorage (Control End) Autopsy Elements Figure 5.63: Beam 2.12-Corroded Stirrup in East End Anchorage Zone (Dripped End) Figure 5.64: Beam 2.12 East End Anchorages (Dripped End)-South Duct Anchorage (Top, Left and Right), and North Duct Anchorage (Bottom, Left and Right) Figure 5.65: Beam 2.12 East End Anchorage Zone (Dripped End) Autopsy Elements Figure 5.66: Beam 2.12-Strand Corrosion Ratings for Anchorages Figure 6.1: Phase I Beams- Crack Ratings Figure 6.2: Phase I Beams- Stirrup and Longitudinal Bar Generalized Ratings versus Crack Ratings Figure 6.3: Phase I Beams-Generalized Duct Ratings (Organized by Splice Type) Figure 6.4: Phase I Beams-Strand Generalized Ratings Figure 6.5: Phase I Beams-Maximum Grout Chloride Content in Each Duct Figure 6.6: Phase II Beams-Crack Ratings Figure 6.7: Phase II Beams-Bar and Stirrup Ratings Figure 6.8: Phase II Beams-Duct Generalized Ratings Figure 6.9: Phase II Beams-Strand Generalized Ratings Figure 6.1: Phase II Beams-Maximum Grout Chloride Content in Each Duct Figure 6.11: Phase I Beams-Stirrup and Bar Generalized Ratings versus Final Half-Cell Potential Readings Figure 6.12: Phase I Beams- Galvanized Duct Ratings versus Final Half-Cell Potential Readings Figure 6.13: Phase II Beam Stirrup and Bar Generalized Ratings versus Final Half-Cell Potential Readings Figure 6.14: Phase II Beams-Duct Ratings versus Final Half-Cell Potential Readings Figure 6.15: Phase I Beams-Stirrup and Bar Generalized Ratings versus Time to Initiation of Corrosion Figure 6.16: Phase I Beams-Duct Generalized Ratings versus Time to Initiation of Corrosion Figure 6.17: Phase II Beams-Stirrup and Bar Generalized Ratings versus Time to Initiation of Corrosion Figure 6.18: Phase I Beams-Maximum Chloride Content at Bar/Duct Level versus Bar and Stirrup Generalized Ratings Figure 6.19: Phase I Beams-Maximum Chloride Content at Bar/Duct Level versus Generalized Duct Ratings xii
13 Figure 6.2: Phase II Beams-Maximum Chloride Content at Bar/Duct Level versus Bar and Stirrup Ratings Figure 6.21: Phase II Beams-Maximum Chloride Content at Bar/Duct Level versus Duct Generalized Ratings Figure 6.22: Phase I Beams- 8-Year Crack Ratings versus 4-Year Crack Ratings Figure 6.23: Phase I Beams- 4-Year Duct Ratings versus 8-Year Duct Ratings Figure 6.24: Phase I Beams- 4-Year Strand Ratings versus 8-Year Strand Ratings Figure 6.25: Phase I and Phase II Beams-Generalized Bar and Stirrup Ratings Figure 6.26: Phase I and Phase II Beams-Generalized Duct Ratings Figure 6.27: Phase I and Phase II Beams-Generalized Strand Ratings xiii
14 xiv
15 List of Tables Table 2.1: Specimen Designations... 2 Table 3.1: Interpretation of Half-Cell Potentials for Mild Reinforcing Steel Table 4.1: Half-Cell Potential Contour Map Color Indications Table 5.1: Numerical Rating System For Mild Steel Bars and Stirrups Table 5.2: Numerical Rating System for Galvanized Duct/Galvanized Splice Table 5.3: Numerical Rating System for Prestressing Strand Table 5.4: Beam 1.1-Corrosion Rating Summary Table 5.5: Beam 1.2 Corrosion Rating Summary Table 5.6: Beam 1.4 Corrosion Rating Summary Table 5.8: Beam 2.2 Corrosion Rating Summary Table 5.9: Beam 2.4 Corrosion Rating Summary Table 5.1: Beam 3.1 Corrosion Rating Summary Table 5.11: Beam 3.4 Corrosion Rating Summary Table 5.12: Beam 3.5 Corrosion Rating Summary Table 5.13: Beam 4.1 Corrosion Rating Summary Table 5.14: Beam 2.7 Corrosion Rating Summary Table 5.15: Beam 2.7-Corrosion Rating Summary for Anchorages Table 5.17: Beam 2.9 Corrosion Rating Summary Table 5.18: Beam 2.9-Corrosion Rating Summary for Anchorages Table 5.2: Beam 2.12 Corrosion Rating Summary Table 5.21: Beam 2.12-Corrosion Rating Summary for Anchorages Table 6.1: Corrosion Ratings for Phase I and Phase II Beams (Center of Beams) Table 6.2: Corrosion Ratings for Anchorages of Anchorage Exposure Beams xv
16
17 1. Introduction 1.1 Background Post-tensioned concrete has been widely used for bridge construction since its introduction in the 195s. Post-tensioning allows for the attainment of longer span lengths with the use of smaller members and for better crack control than typical reinforced concrete. In addition, it allows for reduced congestion of reinforcement as well as better continuity of reinforcement. Bonded post-tensioning systems involve the use of tubes (known as ducts) cast within the concrete. Typically, these ducts have curvature along the length of the structure. Following the attainment of the specified concrete strength, the post-tensioning force is applied through seven-wire strands placed inside the duct. The strands are then anchored by tapered wedges within an anchorhead (a typical post-tensioning hardware configuration is shown in Figure 1.1). Following this, grout is pumped into the duct forming a multilayer system of protection for the strand and, with internal tendons, bonding the strands to the structure. However, in recent years durability issues have arisen with the use of such systems. 1.2 Corrosion of Steel in Concrete Figure 1.1: Typical Post-Tensioning Hardware 1 It has been estimated that corrosion of reinforced concrete structures is one of the most expensive corrosion problems in the United States, with an annual cost of $8.3 billion. 2 Because of its chemical nature, concrete is highly basic, or alkaline. In cured concrete, uncoated steel forms a protective layer known as a passive layer which basically consists of iron hydroxide. 2 Thus, any corrosion in the steel is prevented. However, if the concrete is in a marine environment or in the presence of de-icing salts, chlorides can find their way into the concrete either through high permeability (after a long period) or at a crack in the concrete. Once a threshold chloride concentration is reached (a typical value is.33 percent by weight of concrete 3 ) the passive layer begins to break down and corrosion initiates. 2 The location at which 1
18 the passive layer breaks down is called the anode, and the reaction that takes place there is the anodic reaction, given by Equation 1-1. Fe Fe e - Eq. 1-1 Another location on the steel surface becomes the cathode, since the two electrons in the previous equations must be consumed in order to maintain the charge balance. This cathodic reaction is given by Equation e - + H 2 O + ½O 2 2OH - Eq. 1-2 These are the first steps in the corrosion process. The remainder of the process is given by the following three equations: Fe OH - Fe(OH) 2 (Ferrous Hydroxide) Eq Fe(OH) 2 + O 2 + 2H 2 O 4Fe(OH) 3 (Ferric Hydroxide) Eq Fe(OH) 3 Fe 2 O 3 H 2 O (Rust) + 2H 2 O Eq. 1-5 These iron oxides occupy up to ten times as much volume as the steel. Thus, extremely large expansive stresses are placed on the concrete. Since concrete is weak in tension, cracking and spalling result. 2 In addition, when the iron in the steel begins to dissolve into solution, pits can form in the steel. Thus, the cross-sectional area of the bar or the strand is reduced. This is especially alarming in bonded post-tensioned concrete because the strand is under very high tensile stress. Thus, if the cross-sectional area of the strand wires is reduced, the stress in the strand can more easily reach the level of failure. 1.3 Durability in Post-Tensioning Typically in bridge construction, galvanized steel has been used almost universally for the ducts to provide protection for the strand. However, the duct is vulnerable for two reasons. The first is that galvanization is a type of sacrificial protection. In other words, the zinc coating will corrode instead of the steel. However, after all the zinc coating has reacted, the corrosion will begin to attack the steel in the duct directly, compromising its ability to protect the grout inside. The second reason for steel ducts behaving poorly is poor splice details that do not prevent chloride and moisture penetration into the duct. Typically, the splice method used in practice with galvanized steel ducts is an overlaid section of steel duct sealed at the ends with duct tape. If the duct or the splice fails to provide the proper protection, the chlorides can reach the grout within the duct. While the grout should provide some additional protection for the strand, it can be unable to do so for several reasons, including voids and cracks in the grout. One of the ways in which voids form in grout is from bleed water accumulation in certain areas which causes voids to form once the water has evaporated. In addition, if proper venting is not used during grouting, air pockets can form at high points in the ducts also resulting in the formation of voids. Grout, unlike the surrounding concrete, is not prestressed and will thus readily crack under service loads. Thus, if the duct is penetrated the chlorides can then attack the strands either through the grout voids or cracks. This can reduce their capacity due to cross-sectional area loss, having a detrimental effect on the structure as a whole. 2
19 Possible ways to reduce the possibility of corrosion in the strand are to use galvanized strand or epoxy coated strand, and several new coatings have appeared on the market in recent years. However, like the galvanization in the ducts, the galvanization of the strand is a form of sacrificial protection, which will no longer function once all the zinc has corroded. Severe damage to post-tensioning systems due to corrosion has been documented in Florida, where strands have actually failed due to corrosion. 4,5 Reasons for these failures included poor grouting procedures and leakage in anchorage systems. Grouting deficiencies have also been found in the Boston Central Artery Bridges. 6 In 21 the American Segmental Bridge Institute established guidelines for grouting, and the Post-Tensioning Institute established new grouting specifications in February 21. 6,7 In recent years, the Texas Department of Transportation (TxDOT) has actually banned the use of corrugated galvanized metal ducts in aggressive environments and requires robust corrugated plastic ducts Effect of Mixed Reinforcement One system allowed by AASHTO 9 and used in practice is the use of mixed reinforcement in members. This means the use of both prestressed and non-prestressed reinforcement to share the tensile force when resisting loads. This is sometimes referred to as partial prestressing. Advantages of mixed reinforcement include increased ductility compared to fully prestressed sections, and better creep and camber control. 1 However, there is a loss of crack control compared to fully prestressed members. 1.5 Durability of Post-Tensioning Anchorages One major area of concern in post-tensioning systems is the anchorage. During stressing of the strands, the post-tensioning force is held by hydraulic rams. Upon completion of stressing, tapered wedges are driven into the holes into the anchorhead typically using a power-seating system on the jack. Upon release of the force in the jack, the strand attempts to jump back into the duct but the metal teeth in the wedges bite into the strand and bear against the tapered holes in the anchorhead, maintaining the post-tensioning force. A detrimental effect from the wedges is a reduction in the cross sectional area of the strand wires, resulting in higher stresses than would be found along the length of the strand. Typically, post-tensioning anchorage areas are sealed with grout after stressing. However, if the chlorides penetrate the grout, either through cracks or because of high grout permeability, they can enter the rest of the post-tensioning system through the interstitial areas of the strand at the anchors. In addition, once the strands in the anchorage begin to corrode, the strand stress levels increase because of their smaller effective cross sectional area. Thus the strand can fail at the anchorage. Failures of this type have been observed in Florida. 11 A corroded anchorage is shown in Figure
 under a TxDOT contract with the Center for Transportation Research (CTR).")
20 1.6 Current Research Figure 1.2: Corroded Anchorage (Bearing Plate with Strand Tails) Research Background Research into post-tensioned durability issues has been an on-going effort at The University of Texas, jointly funded by both FHWA and TxDOT. The research has been performed at the Ferguson Structural Engineering Laboratory (FSEL) under a TxDOT contract with the Center for Transportation Research (CTR). The research effort began in 1997 under Project -145 and has continued under Project West 1 and Schokker 12 designed, constructed, and monitored beam specimens under long-term loading and exposure testing under highly aggressive conditions. Final autopsy and analysis of approximately half of these specimens was completed by Kotys 13 and Salas in 23. Salas and Kotys conducted these autopsies after approximately 4 years of aggressive exposure testing, examining issues such as splice type, the effects of mixed reinforcement, and grout type, as well as the effects of different loadings on durability. Documentation of the construction, monitoring, and early autopsies was published in a series of CTR reports available on the CTR website. Sustained loading and aggressive exposure testing continued on the remaining fifteen beam specimens for another 4 years until the autopsies were documented in this report. A complete detailed description of the autopsies is available in the thesis of the senior author. 19 The present report is a somewhat shortened version to improve readability. However the full thesis is available online at Report Objectives The objectives of this report are as follows: To evaluate the extent of corrosion found in all types of reinforcement in nonprestressed, fully prestressed and partially prestressed (mixed reinforcement) beam specimens after approximately 8 years of aggressive exposure testing, including drip exposure in the anchorage zone. 4
21 To evaluate the effect of mixed reinforcement on corrosion protection by a comparison of fully prestressed, mixed reinforcement, and non-prestressed specimens. To evaluate the relationship between corrosion protection performance and the following variables in post-tensioned girder specimens: - Level of loading, including unloaded specimens - Level of prestress and initial crack width - Duct type - Strand type - Grout type - Grouting method - Use of encapsulated systems for anchorage protection - Galvanized duct splice type To evaluate the applicability of using half-cell potential measurements taken during exposure testing and chloride penetration tests as indicators of corrosion. To use results obtained from long-term beam exposure testing and autopsy to develop durability design guidelines for bridge substructures Scope The scope of this report includes: Examination of selected data taken during accelerated exposure testing of the remaining fifteen large-scale beam specimens. Autopsy and analysis of selected data from the remaining fifteen large-scale beam specimens under accelerated exposure testing. Recommendations for post-tensioned concrete durability design based on the autopsy observations. 5
22

23 2. Test Specimens 2.1 Specimen Test Concept The specimen test concept and program was developed and implemented by West 1 and Schokker 12 in 1997 under TxDOT Project -145 with the purpose of determining which combinations of materials, construction and design practices result in the best corrosion resistance in a bonded post-tensioned system. The specimen design developed was a beam element which would undergo rigorous exposure testing outside the Ferguson Structural Engineering Laboratory (FSEL). 15 The exposure testing included alternating wet/dry cycles with a 3.5 percent NaCl solution. The test program was implemented in two phases: Phase I was implemented by West 1 and consisted of sixteen beam specimens. Six of these specimens were autopsied in 23 by Kotys and Salas. 17 In addition, two specimens were partially autopsied and then testing continued. Ten Phase I beams, including the two partial autopsies, remained and were transferred to Project to be autopsied in this study. Phase II was implemented by Schokker 12 and consisted of eleven beam specimens. Six Phase II specimens were autopsied by Kotys and Salas in Five remained and were transferred to Project to be autopsied in this study. Except for the experimental variables, the specimens of Phases I and II are basically identical in construction. 2.2 Specimen Description The full details of the specimen design process are outlined in References 1 and 12. An elevation of a typical test specimen is shown in Figure 2.1, and one of the actual test specimens is shown in Figure 2.2. Figure 2.1: Test Specimen Elevation 15 7

24 Figure 2.2: Test Specimen outside the Ferguson Structural Engineering Laboratory 2 In order to study the effect of different levels of prestressing, four different specimen reinforcement arrangements were considered, each with varying levels of prestress and nonprestressed reinforcement (See Section ). All the beam specimens are kept under sustained load at third points during exposure testing. Thus an essentially constant moment region exists in the center span of the beam. Details of beam loading are given in Section 2.6. Proper shear reinforcement was supplied, as well as confining spiral reinforcement in the anchorage zone. A non-prestressed reinforced concrete beam is placed beneath the specimen in order to provide the necessary reactions. 2.3 Specimen Variables The test program includes several variables, as well as control specimens representing industry standards in the mid 199s. The variables of Phase I include the level of prestress, level of loading, crack width, and duct splice type and condition. 1 The variables of Phase II consist of strand type and condition, the use of high performance, anti-bleed grout, grouting procedure, and the use of an encapsulated system for end anchorage protection Control Specimens Controls were used that represented TxDOT standard practices in 1997 the time of the implementation of the original test program. The control variables are as follows: 1 Concrete: TxDOT Class C for bridge substructures was used, which requires a maximum water-cement ratio of.533 with Type I cement. The slump was specified at 4 in. with a maximum coarse aggregate size of 3/4 in.. Additives 8
25 include Rheocrete 3-R retarder and air entraining admixtures. Concrete clear cover was specified at 2.in. Cement Grout: A water cement ratio of.44 was used with Type I cement. Inraplast-N expanding admixture was specified. Duct: 2 1/8 in. outside diameter rigid galvanized steel duct was used. Anchorage Protection: Type V epoxy bonding agent coated all hardware in the anchorage, and the anchorage pocket was filled with non-shrink grout patch (Euclid non-shrink grout) Phase I Variables The variables for Phase I included level of prestressing, level of applied loading, crack width, as well as splice type and condition Level of Prestress The effect of the level of prestress was one of the most critical variables of study in the test program. Overall, with higher levels of prestressing, the number and widths of cracks is typically reduced. In order to study the effect on durability, four different reinforcement arrangements were tested. The four reinforcement configurations shown in Figure 2.3 are as follows: Non-Prestressed (Non-PS) 2/3 or Partially Prestressed (2/3 PS) Fully Prestressed Designed by Ultimate Strength Method (1% U) Fully Prestressed Designed by Allowable Stress Design (1% S) 9

26 Figure 2.3: Specimen Reinforcement Configurations 1 The longitudinal bars in the 1 percent prestressed sections were installed in order to allow for reinforcing cage handling during construction. These bars were included when considering the section capacity. All sections were designed with the same maximum permissible service load moment of 275 kip-in Level of Applied Loading and Crack Width The effect of applied loading and crack width are directly related. Clearly if the level of prestress is held constant, crack width should increase with increased loading. Various levels of loading are applied for each reinforcement configuration: Non-PS Loading Cases For the non-prestressed specimens, three different levels of loading were tested: Unloaded (No applied load) Service Load 25 percent Overload The application of the overloading force was done at the beginning of exposure testing and then the specific specimen was lowered back down to service load. 2/3-PS Loading Cases For the partially prestressed specimens, three different loading scenarios are considered. Small crack width Service Load 1

27 25 percent Overload The overload and service load cases are similar to those for the Non-PS section. For the small crack width case, the specimen was loaded until the defined small crack width was reached and then the load was held at this level for the duration of exposure testing. West 1 determined that the appropriate small crack width for the 2/3-PS section was.2 in. 1% U Loading Cases In the case of the fully prestressed configuration (Ultimate Strength Design), it was originally intended to test the same loading cases as the Non-PS beams. However, for the specimen originally designated for service load (Beam Specimen 3.4), it was necessary to temporarily overload the specimen to produce cracking. 1 Thus the three loading cases are as follows: Unloaded (No applied load) 25 percent Overload 33 percent Overload (Specimen originally designated for service load) 1% S Loading Case For the fully prestressed section (Allowable Stress Design), only the service load case was tested Duct Splice Type & Condition The duct splice types tested are the industry standard (IS) splice and the heat shrink (HS) splice. The splices are shown in Figure 2.4. Figure 2.4: Duct Splice Types 1 The IS splice consists of a 12-in. long portion of oversized duct which wraps around the two duct sections being joined and is duct taped on the ends. The HS splice is an 8-in. piece of heat shrink tubing placed over the ends of the ducts being joined and then heated to the seal the joint area. 11

28 Five different splice configurations are used: Industry standard splice (IS) Heat shrink splice (HS) Damaged industry standard splice (ISD) Damaged heat shrink splice (HSD) No splice (NS) The damaged cases are meant to study the effect of accidental damage on each splice type. Damage to the IS splice consists of poor or incomplete duct taping at the splice ends, while for the HS splice a 1 in. long cut was made at the point where the two ducts meet. 1 For comparison, ducts with no splices were also included to compare to the IS splice. The arrangements for the five duct splice configurations are shown in Figure 2.5. Figure 2.5: Splice Configurations 1 The use of two splices per duct in the damaged condition is so that a baseline of an undamaged splice can be compared to the damaged splice in each duct Phase II Variables The variables for Phase II include duct type, strand type and condition, grout type, grouting procedure, and system protection. All of the beams from Phase II that were considered in this investigation were 2/3-PS beams kept at service load Duct Type Two different duct types were tested. The first duct type is the galvanized metal duct, while the second is a plastic duct. The plastic ducts are unspliced and are those associated with the VSL VSLAB+ System. Information on this system is given in Section
29 Strand Type & Condition Three different strand types were tested galvanized, epoxy coated, and conventional strand for comparison. All are 1/2 in. diameter and Grade 27 prestressing steel. Hot-Dipped Galvanized Strand The hot-dipped galvanized strand was donated by a commercial producer. 12 As with the galvanized duct, the galvanization is a type of sacrificial protection, so in a severely corrosive environment, the galvanized coating may not provide protection for the entire service life of the structure. However, since the coating is applied before the wires are assembled into the strand, the coating covers the entire surface area of the wires, including the interstices. Unlike an epoxy barrier system, the galvanized coating should provide protection even with small nicks. Non-Flowfilled Epoxy Coated Strand The epoxy-coated strand was also donated by a commercial producer. 12 The epoxy coated strand used in this test program only had coating covering the exposed portion of the wire. Thus the interstices of the strand were not protected, unlike galvanized strand. In order to investigate the effect of damage to the epoxy coating, intentional damage was done to one of the two tendons in the specimen with epoxy-coated strand, while the other tendon was left undamaged. The damage consisted of small squares of epoxy removed from the two strands in the tendon at five select locations; three of the locations coincided with the centerline crack and the cracks at 12 in. off the centerline. These crack locations were estimated based on the loadings of the Phase I 2/3-PS beams. The two other damaged locations coincided with the bends in the parabolic duct. Often epoxy patch repair kits are supplied to repair any epoxy coating damaged during handling and construction. Therefore, the repair kit provided by the manufacturer was used to repair the damage on one of the two strands in the damaged tendon, while the other strand was left damaged to determine the effectiveness of the patching system Grouting Procedure The effect of improper grouting procedures was investigated in the test program. Poor grouting procedures, such as not venting air properly, can result in the formation of voids in the grout, which can in turn reduce the corrosion protection abilities of the grout. The proper grouting procedure used in all of the other prestressed specimens was done according to PTI specifications at the time of construction (1997) and is given in Section The practices used for the poor grouting procedure included delays of up to 1 minutes during grouting, allowing air to enter the pump during grouting, and capping the grout vents at the first sign of grout at the exit vent Grout Type High performance, anti-bleed grout was selected for use in the test program to compare to the typical grout specified by TxDOT specifications at the time of construction. The choice of this grout mix was based on fresh property and accelerated corrosion tests done by Schokker. 12 This anti-bleed grout contained an anti-bleed chemical admixture with superplasticizer, with a low water-cement ratio of.33. During trials, this mix exhibited very high resistance to bleed and good corrosion resistance compared to the other grout types tested. 12 The grout was mixed in buckets with hand-held mixers. Commercial prepackaged grouts were not generally available at time of testing. 13

30 Anchorage Protection To compare to the standard TxDOT anchorage details described in Section 2.3.1, an encapsulated system was used. VSL Inc. manufactures plastic duct systems for use in highly aggressive exposure environments. Unfortunately, the smallest multi-strand unit available at the time of specimen construction was for twelve strands. 12 However, VSL manufactures a twostrand encapsulated system for slab construction known as VSLAB+, which has the same general properties of the larger-scale systems. 21 Thus this system was used in the test program and is shown in Figure 2.6. Figure 2.6: VSL VSLAB+ System 21 (End Anchorage) A plastic cap is placed over the ends of the strands for protection, and a seal is made with a gasket. The connection between the plastic duct and the bearing plate is made with a half shell/clip connection, instead of the duct tape used in the TxDOT specifications at the time of specimen construction. The system is basically air- and watertight. However, because there is metal to metal contact between the anchorhead and the bearing plate, the system cannot be considered electrically isolated, so the system is not protected from stray currents. 1 The use of this system allows for the study of both plastic ducts and anchorage protection Specimen Materials All specimens were cast with TxDOT class C concrete. All reinforcing steel was uncoated Grade 6 reinforcement. For the Phase I beams, steel bolster strips with plastic feet were used to elevate the reinforcing bar cage while in the formwork. For the Phase II beams, plastic chairs were used. 12 Grout for post-tensioning ducts was mixed in buckets with a handheld mixer and then poured into the pump reservoir. 12 The non-shrink grout for filling the posttensioning anchorages was mixed in 5-gallon buckets with handheld electric paddle mixers Specimen Construction Details The specimens were constructed in the Ferguson Structural Engineering Laboratory. All construction activities were performed by the previous researchers. 14

31 2.5.1 Beam Fabrication Before construction, all flexural reinforcement was cleaned with a wire brush wheel on an angle grinder in order to remove any pre-existing corrosion. 1 The post-tensioning hardware and the confining reinforcement in the anchorage were sandblasted for the same reason. 1 The specimens were cast upside down in a wooden formwork at FSEL. Concrete was delivered by ready-mix trucks and then placed into the formwork using a bucket lifted by an overhead crane. The concrete was then vibrated by hand-held vibrators. Specimen construction photographs are shown in Figure 2.7. Figure 2.7: Specimen Construction Post-Tensioning The beams were post-tensioned with equipment available at FSEL. The stressing was completed in accordance with TxDOT, PTI, and AASHTO LRFD specifications. 1 Staged stressing was used to compensate for elastic shortening losses. Power seating was used to seat the wedges in order to minimize seating loss. The stressing set-up is shown in Figure


32 Figure 2.8: Post-Tensioning Equipment Setup Grouting Procedure Grouting was completed within 3 days after post-tensioning. 1 The end pockets were formed with plywood and sealed with silicon after post-tensioning for moisture protection. Grouting was completed in accordance with PTI specifications of the time. The grout was mixed as described in section 2.4 and then immediately pumped into the ducts using an electric grout pump. The inlet/outlet setup for grouting is shown in Figure 2.9. Figure 2.9: Grouting Procedure 15 The inlet at A and the vent at C consisted of 3/4-in. grout tubes with cutoff valves. Point B was drilled into the top of the specimen using a rotary hammer drill. This drilling was done before the strand was installed, and then the duct was blown clean. 1 It is interesting to note that PTI specifications of the time did not require Vent B because of the low vertical rise, and under current specifications it would still not be required. 22 The researchers added vent B based on tube tests performed by Schokker, 12 which showed air accumulation could occur at the peak of the duct. The freshly mixed grout was transferred from the mixer using buckets, was continuously stirred in the reservoir to prevent segregation, 1 and was then pumped through the inlet at A. 16

33 Once continuous flow was observed at vent B, a dowel was inserted at vent B to stop the flow out of the vent. Pumping continued until venting occurred at C, at which time vent C was closed and the pump was stopped. Then the pump was restarted for a period of 2 to 3 seconds before closing the inlet valve at A. Grout bleed water was normally observed exiting from around the wedges immediately after the grouting operation was complete Anchorage Protection The anchorage protection provided was that required by TxDOT standards in The anchorage hardware was cleaned with a wire brush in order to eliminate any pre-existing corrosion, and the hardware was coated with an epoxy-based bonding agent. Then the non-shrink grout, prepared as described in Section 2.4, was gravity fed through a funnel into a tube that went through a hole in the piece of the plywood at the end pocket. 1 The commercially available grout contained silica sand and a non-shrink admixture. 1 Once the grout had cured, the plywood was removed and the entire end of the beam was rubbed with a mixture of cement, sand, and latex bonding agent to provide a uniform finish and fill any voids in the end pocket. 1 A typical anchorage before capping is shown in Figure Specimen Loading Figure 2.1: Anchorage Pocket before Capping 1 The specimens were loaded with a 6-ton (12 kip) ram at each end of the beam. This is shown in Figure

34 Figure 2.11: Specimen Loading 14 The final service load level desired at each end of the beam was 5 kips. 1 In the case of specimens loaded based on small crack widths, the load was held once the sufficient crack width was reached. Rams at each end reacted against the spreader beam and compressed the springs. Once the desired force level was reached, the nuts on the top of the hollow steel section were tightened to maintain the load. 1 The railroad springs are designed to maintain the load on the specimen during exposure testing. The specimens were reloaded as needed at intervals to compensate for creep. 2.7 Specimen Notation At the beginning of the autopsies summarized in this report, a total of fifteen beam specimens remained from Phase I and Phase II. The following notation scheme, adopted from Kotys, 13 describes the experimental variables for each specimen. The notation scheme uses a series of abbreviations to describe each specimen. Note that no variation of concrete type occurs in the specimen autopsied in this set but will be used in the notation for continuity with the previous autopsies. For simplicity, each specimen will typically be referred to by its two-digit number shown in Table 2.1 throughout this report. Also note that some specific variables from Phase II are not included in this notation scheme. Thus they are placed in the category Other Variable. The notation used for the specimen designations is as follows: 14 18
35 Phase: Splice Type: 1 = Phase 1 IS = Industry standard 2 = Phase 2 ISD = IS damaged HS = Heat shrink HSD = HS damaged XS = No splice Prestress Level: Grout Type: X = Non prestressed NG = Normal grout P = 2/3 prestressed AB = Anti-bleed grout U = 1% ultimate prestressed FA = 3% fly ash grout * S = 1% service prestressed Applied Load: Strand Type: XL = No load NS = Normal strand SL = Service load GS = Galvanized strand CL = Small crack load ES = Epoxy coated strand OL = Overload (124%) Concrete Type: Duct Number: C = TxDOT Class C D1 = Duct 1 F = 25 % fly ash D2 = Duct 2 H = High performance * Duct Type: SD = Galvanized steel duct PD = Plastic duct No variation in currently autopsied specimens, but included for clarity 19
36 Phase I Table 2.1: Specimen Designations Specimen Number Specimen Notation X-XL-C X-SL-C X-OL-C P - CL - C SD - HS - NG - NS - D1 1 - P - CL - C SD - IS - NG - NS - D P-SL-C-SD- XS - NG -NS- D1 1 - P-SL-C-SD- IS - NG -NS- D P - OL - C - SD - HS - NG - NS - D1 1 - P-OL-C-SD- IS - NG -NS- D U - XL - C - SD - HS - NG - NS - D1 1 - U-XL-C-SD - IS - NG -NS - D U-SL-C-SD - HS/HSD - NG -NS - D1 1 - U - SL - C - SD - IS/ISD - NG - NS - D U - OL - C - SD - HS - NG - NS - D1 1 - U-OL-C-SD - IS - NG -NS - D S-SL-C-SD- XS - NG -NS- D1 1 - S-SL-C-SD- IS - NG -NS- D2 Phase II Other Variable Specimen Number Specimen Notation P - SL - C - SD - IS - NG - ES - D1 Anchorage Exposure & Strand Coating Damage 2 - P - SL - C - SD - IS - NG - ES - D2 Anchorage Exposure P-SL-C-SD- HS - NG -GS- D1 2 - P-SL-C-SD- IS - NG -GS- D P - SL - C - SD - IS - NG - NS - D1 Poor Grouting Procedures & Anchorage Exposure 2 - P - SL - C - SD - IS - NG - NS - D2 Anchorage Exposure P-SL-C-SD- IS - AB -NS- D1 2 - P-SL-C-SD- IS - AB -NS- D P - SL - C - PD - XS - NG - NS - D1 Anchorage Exposure 2 - P - SL - C - PD - XS - NG - NS - D2 Anchorage Exposure 2

37 3. Experimental Procedure 3.1 Long-Term Exposure Testing Setup All Phase I and Phase II beams autopsied in the present study underwent approximately 8 years of aggressive exposure testing outside FSEL. Specimens were exposed to saltwater both at mid-span and in some cases at the anchorages. Non-destructive monitoring of the specimens took place during the testing period. The Phase II beams under exposure testing are shown in Figure Beam Exposure Cycles Figure 3.1: Phase II Beams under Exposure Testing The specimens were exposed to a 3.5 percent NaCl solution (saltwater). This solution was used per ASTM G19 at the time, resulting in the most aggressive exposure possible. This standard has since been changed to 3 percent 5, but 3.5 percent has been maintained throughout the 8 years of testing for continuity in the exposure cycles. The saltwater was ponded above the cracked center portion of each beam. The ponding enclosure consisted of plexiglass walls epoxied to the surface of the specimen. The enclosure was covered with plywood in order to prevent rainwater contamination of the solution as well as protect the solution from wind. To prevent saltwater leakage through the side face flexural cracks, the side face flexural cracks were sealed with epoxy. Each exposure cycle lasted approximately a month beginning with a 2-week wet cycle. At the end of the wet cycle, any remaining saltwater was removed. Then the specimens were kept dry for the remainder of the month. 21
 underwent exposure testing at their eastend anchorages using a dripper system, as shown in Figure 3.")
38 3.1.2 Beam Anchorage Exposure In order to test anchorage protection, specimens 2.7 (Epoxy coated strands), 2.9 (Poor Grouting Procedures), and 2.12 (Encapsulated System) underwent exposure testing at their eastend anchorages using a dripper system, as shown in Figure 3.2. Figure 3.2: Anchorage Exposure System The same NaCl solution used for the ponding portion of the beams was used. The saltwater was pumped from a container and collected in a plastic container and cycled back through the system. Due to leaks in the system, saltwater had to be periodically added during each cycle. The frequency of dripping during the first several years of the test program was 8 hours every 2 weeks, 12 but for logistical reasons this was reduced to 6 hours once a month in the final years of testing. 2 All three anchorage exposure specimens had the same exposure regimen. 3.2 Measurements Taken during Exposure Testing At various stages during exposure testing, the specimens were monitored by both nondestructive and destructive means Visual Inspection The specimens were periodically observed for the appearance of any new cracking, spalling, or staining during exposure testing Crack Patterns and Crack Widths Crack patterns and crack widths were taken at two stages during exposure testing. The first set of crack measurements was taken at the beginning of testing. 1 The second set of crack measurements was taken at the end of exposure testing. This was done since crack widths can increase due to creep and from stresses caused by the corrosion process. Also, the formation of longitudinal cracks aligned with the reinforcing bars is often a sign of severe corrosion, since 22

 were measured each time they crossed the reference lines.")
39 these cracks form from the expansive effect of the corrosion of the bar or other steel components. Crack widths on the top surface of the beam were measured with a crack comparator or crack microscope. The method for recording crack width measurement is adopted from West 1 and is shown in Figure 3.3. Crack Location Longitudinal Cracks Measured Every 6 in. Reference Line (Typical): 3 in. Spacing Center of Load Application Figure 3.3: Crack Width Measurement System 1 Flexural cracks (or any crack running perpendicular to the longitudinal axis of the beam) were measured each time they crossed the reference lines. Longitudinal cracks were measured every 6 in. from the point at which they appeared. For specimens with anchorage exposure, any cracks in the anchorage zones were noted, and the width was measured at its apparent widest point. This was done at both anchorages in order to have the control of a non-exposed anchorage for comparison. This is valid comparison since the live and dead ends of the specimen are identical in construction except for minor friction losses. Cracking on the specimens was generally widespread and often very wide. As shown in Figure 3.4, at the end of 8 years of aggressive exposure there were often very wide longitudinal cracks (numerous cracks were in the 1/8-in. range) running along the line of the post-tensioning ducts in addition to the original transverse flexural cracks. The surfaces of the beams were often heavily stained with corrosion products. The wide cracking was due to the splitting forces set up by the corroding ducts and reinforcement as the volume of the corrosion products is substantially greater than the original volume of the materials. Figure 3.4: Beam 2.7-Side View (Left) and Top View (Right) 23
40 3.2.3 Half-Cell Potential Measurements Half-cell potentials are a non-destructive method for determining the probability of corrosion as well as determining when corrosion has initiated. 1 Half-cell potential readings require a wire connection to the reinforcing system, a reference electrode, and a voltmeter. Two wires were installed in the specimens. One was clamped to the reinforcing cage before casting the concrete. A second wire was attached to the tail of the strands before backfilling of the anchorage occurred. 1 It was found by West 1 that the tendon system and reinforcing bar cage were electrically continuous, thus using either wire should produce the same results. Saturated calomel electrodes were used as the reference electrode in the testing program. The readings were done according to ASTM C immediately after the end of the 2-week wet cycle. Initially, readings were taken with the saltwater still inside the ponding area, and readings done outside the ponding area required a wetting solution. 1 It was later found that more accurate readings could be taken if the saltwater was removed and the wetting solution was used in both the ponded and non-ponded areas of the specimen. 14 The wetting solution used was soapy water. Initially, the locations of half-cell potential readings varied slightly with each beam type. However, later in the test program, half-cell potentials were taken at the same locations regardless of the specimen (except for specimens 1.1 and 3.1). The locations of the measurement stations are shown in Figure 3.5. Figure 3.5: Half-Cell Potential Sampling Stations For specimens 1.1 and 3.1, samples were only taken to one side of the centerline because of the partial autopsies performed on these specimens. The significance of the half-cell potential readings is shown in Table 3.1. Table 3.1: Interpretation of Half-Cell Potentials for Mild Reinforcing Steel 1 Measured Potential (vs. SCE) Probability of Corrosion More Positive than -13 mv Less than 1% Probability of Corrosion Between -13 mv and -28 mv Corrosion Activity Uncertain More negative than -28 mv Greater than 9% probability of corrosion 24

41 Note that the half-cell readings can only indicate the probability of corrosion, and that this system is for mild steel reinforcement only. Additionally, due to the presence of zinc in the galvanized post-tensioning ducts, these values may not be appropriate for post-tensioned systems. The reading may actually be indicating the potential of zinc, which is more negative than mild steel. 1 This may lead to erroneous interpretations of the results. For this reason regular half-cell potentials are not necessarily appropriate for epoxy coating, plastic ducts, or posttensioned systems in general. 1 However, the original researchers decided to use the regular halfcell potentials in this program since a sudden variation in voltage can indicate the onset of corrosion Chloride Penetration Chloride penetration measurements were taken from both the beam specimens and from companion unloaded block specimens at different times during exposure testing. All drilling was done with a hammer drill, and the powder was collected for analysis. Multiple depths are sampled in order to determine the extent of chloride penetration. All samples were analyzed for acid-soluble chloride content using a specific ion probe (CL 5 Test System by James Instruments), and all sampling and analysis was done per AASHTO T during the entire 8-year testing period Specimens The specimens were sampled for chloride content at the end of exposure testing. Samples were taken at depths of.5, 1, and 2 in. Two in. corresponds to the depth of the reinforcement. Any damage inflicted on the specimen due to the drilling was noted for consideration in the later forensic analysis. The locations sampled for each specimen, adopted from Salas, 14 are shown in Figure 3.6. Figure 3.6: Chloride Sample Locations for Typical Test Specimen 14 These two locations were used in the previous autopsies. Additional sample locations were done in the previous autopsies but it was decided that for the current autopsies these additional points were no longer necessary. However, Specimens 1.1 and 3.1, which underwent partial autopsies by Salas 14 and Kotys, 13 had the additional samples taken in order have comparable results with the previous autopsies. The sample locations are shown in Figure

42 Figure 3.7: Chloride Sample Locations for Specimens 1.1 and For the three specimens with anchorage end drips chloride samples were taken at both beam ends at the center of the anchorage pockets. This is shown in Figure 3.8. Figure 3.8: Chloride Sample Location for Anchorage Exposure Specimens Samples were taken at depth of.5, 1, and 2 in. The depth of 2 in. roughly corresponded to the depth of the tails of the strand. Samples were taken at the non-exposed end of the specimens in order to determine if any chloride ingress into the anchorages had occurred as a result of the ponding at the center portion of the beam Block Specimens During casting of the beam specimens, two 12 x12 x 6 blocks were cast with each batch of concrete. One was designated as a ponding block and the other as a control block. The block specimens are shown in Figure

43 Figure 3.9: Block Specimens 15 The ponding blocks had the same plexiglass enclosures installed as the beams. The blocks were subjected to the same exposure cycles at the specimens. The purpose of the ponding blocks was to measure chloride content due to the permeability of the concrete, and the sampling depths corresponded to those later used in the beam specimens. This was so drilling did not have to be done to the beam specimens during exposure testing. In addition, at the end of exposure testing, the ponding blocks allowed for chloride ingress solely due to concrete permeability to be measured, since the ponding blocks were not cracked. The control blocks did not have enclosures and were used to measure the inherent chloride content in the concrete. 1 27
44
45 4. Long-Term Exposure Test Results and Analysis Exposure testing of the Phase I beams reported herein began in December 1997 and ended in June 26 after 3,17 days (8.5 years) of testing. Exposure testing of the Phase II beams began in December 1998 and ended in November 26 after 2,894 days (approximately 8 years) of testing. During the testing period, half-cell potential data were collected each month and the specimens were continuously observed. The highest (most negative) monthly half-cell potential reading for each beam specimen over the entire 8-year testing period is given in Figures 4.1 and 4.2. Crack patterns and widths were taken at both the beginning and end of exposure testing. Crack data are given in Chapter 5 for selected beam specimens. 4.1 Half-Cell Potential Data In Figures 4.1 and 4.2 the maximum half-cell potentials for each beam at each monthly reading are plotted for the Phase I beams and the Phase II Beams, respectively. Despite the fact that both phases were tested for the same general time period, they are plotted separately since the testing of the Phase II beams began a year later than the Phase I beams. The probability of corrosion according to ASTM C is indicated. The crossing of the 9 percent probability threshold is assumed as the point at which corrosion initiated. In some cases there are gaps in the data due to beam maintenance or equipment issues. Note that while eleven of the fifteen specimens indicated corrosion quickly, all beams eventually crossed the 9 percent probability threshold. The probability of corrosion levels for half-cell potentials is based on studies with plain reinforcing steel in the absence of any prestressing. Factors such as galvanization in either the strand or the duct may produce misleading results. 29
46 Half-Cell Potential (-mv SCE ) : Service Load 1.4: Overload 2.1: Small Cracks 2.2: Service Load 2.4: Overload 3.4: Service Load 3.5: Overload 4.1: Service Load 1.1: Unloaded 3.1: Unloaded >9% Probability of Corrosion Corrosion Activity Uncertain 1 <1% Probability of Time (Days) Figure 4.1: Phase I Beams-Maximum Half-Cell Potentials for Each Day of Sampling 1 9 Half-Cell Potential (-mv SCE ) Service Load-Epoxy Coated Strands 2.8-Service Load-Galvanized Strands 2.9-Service Load-Poor Grouting Procedures 2.1-Service Load-High Performance Anti-Bleed Grout 2.12-Service Load-Encapsulated System >9% Probability of Corrosion Corrosion Activity Uncertain 1 <1% Probability of Time (days) Figure 4.2: Phase II Beams-Maximum Half-Cell Potentials for Each Day of Sampling 3
47 4.1.1 Phase I Half-Cell Readings In Figure 4.3 contour plots of the final half-cell readings for the Phase I beams are shown. The contour scheme is based on that of Salas 14 and Kotys 13 from the previous autopsies for consistency. The contour color scheme is explained in Table 4.1. Note that all readings are based on the saturated calomel electrode. The probability of corrosion is based on ASTM C (Non-PS)-Overload (cracked) 1.2 (Non-PS)-Service (cracked) Previous Autopsy Area 1.4 (Non-PS)-Overload (cracked) 2.1 (2/3-PS)-Very Small Cracks 2.2 (2/3-PS)-Service (cracked) 2.4 (2/3-PS)-Overload (cracked) 3. 1 (1%U)-Unloaded (uncracked) 3.4 (1%U)-Overload (cracked) Previous Autopsy Area 3.5 (1%U)-Overload (cracked) 4.1 (1%S)-Service (cracked) < -58 mv SCE -43 to -58 mv SCE -28 to -43 mv SCE -13 to -28 mv SCE +2 to -13 mv SCE Figure 4.3: Half-Cell Potential Contours at 3,17 Days for Phase I Beams 31
48 Table 4.1: Half-Cell Potential Contour Map Color Indications Potential Color Probability < -58 mv SCE Purple Extremely High -43 to -58 mv SCE Red Very High -28 to -43 mv SCE Orange High (At Least 9%) -13 to -28 mv SCE Yellow Uncertain +2 to -13 mv SCE Light Blue Low All Phase I specimens show high probabilities of corrosion. Only a small area of beam 3.1 falls in the uncertain range, while the rest of the beam shows a high probability of corrosion. Based on the -28 mv threshold for 9 percent probability of corrosion, the half cell data can also serve as a means to estimate the time of initiation of corrosion. This is done by examining the most negative monthly reading for each specimen. The estimated time to initiation of corrosion for the Phase I specimens is shown in Figure 4.4. Non-PS 2/3-PS 1%U 1%S 4.1-Service Load % Overload % Overload 3.1-Unloaded 2.4-Overload 2.2-Service Load 2.1-Small Cracks 1.4-Overload 1.2-Service Load 1.1-Unloaded Day of Testing Figure 4.4: Estimated Time of Initiation of Corrosion: Phase I Beams From Figure 4.4, the following is observed: All of the loaded specimens indicated corrosion within the first year of exposure testing, while the two unloaded specimens, 1.1 (Non-Prestressed) and 3.1 (1 percent Prestressed), showed a time to initiation of corrosion of 1.7 years and 5.1 years, respectively. The delay in corrosion was likely due to the absence of cracking in these specimens. Among specimens with identical loading, the time to corrosion increased when the specimen was fully prestressed (4.1). Both the partially prestressed (2/3-PS) specimens and the non-prestressed specimens at service load began corroding at the same time. 32
49 Among the partially prestressed and non-prestressed specimens, the overloaded and service load specimens began corroding at the same time. The partially prestressed specimen with small cracks (2.1) and the unloaded non-prestressed specimen (1.1) had a longer duration to initiation of corrosion Phase II Half-Cell Readings In Figure 4.5 the final half-cell contours for the Phase II beams are shown. All Phase II beams were partially prestressed, were cracked under service load, and had high probabilities of corrosion at the end of exposure testing. The time to initiation of corrosion for the Phase II beams is shown in Figure (2/3-PS)-Epoxy Coated Strands 2.8 (2/3-PS)-Galvanized Strands 2.9 (2/3-PS)- Poor Grouting Procedures 2.1 (2/3-PS)-Anti-Bleed Grout 2.12 (2/3-PS)-Anti-Bleed Grout < -58 mv SCE -43 to -58 mv SCE -28 to -43 mv SCE -13 to -28 mv SCE +2 to -13 mv SCE Figure 4.5: Half-Cell Potential Readings at 2,894 Days for Phase II Beams 33
50 Phase II Beams: 2/3 PS at Service Load 2.12-Encapsulated System 2.1-High Performance Anti-Bleed Grout 2.9-Poor Grouting Procedures 2.8-Galvanized Strands 2.7-Epoxy Coated Strands Day of Testing Figure 4.6: Estimated Time of Initiation of Corrosion: Phase II Beams All Phase II Beams began corroding after only 13 days of testing. Even though all Phase II specimens had different post-tensioning details (either strand type, duct type, or grout type), the presence of cracking likely initiated the corrosion of the reinforcing bars at the same time in all five specimens Analysis of Half-Cell Potential Data In Figure 4.7 the maximum final half-cell potential readings for all Phase I beams are shown. The symbols after the specimen number indicate the level of loading-nl indicates no load, CL indicates small crack load, SL is service load, and OL is overload. Half-Cell Potential (-mv vs. SCE) NL 1.2-SL 1.4-OL 2.1-CL 2.2-SL 2.4-OL 3.1-NL 3.4-OL 3.5-OL 4.1-SL Non-PS 2/3-PS 1%U 1%S Figure 4.7: Maximum Final Half-Cell Potential Readings for Phase I Beams 99 Probability of Corrosion: ASTM C876 : Extremely High Very High High (9%) Uncertain Low 34
51 When comparing specimens with the same levels of prestress, all specimens are at extremely high levels so that there is no overall trend between level of loading and the probability of corrosion after 8 years of testing. When comparing specimens with the same levels of loading, again all specimens are at extremely high levels so that there is no correlation between the level of prestress and the probability of corrosion after 8 years of testing. The maximum readings for the Phase II beams are given in Figure 4.8, along with the 2/3 PS service load beam from Phase I (Beam 2.2) for comparison. Half-Cell Potential (-mv vs. SCE) Epoxy Conventional Coated Strands Strand & Galvanized Duct Galvanized Strands Poor Grouting Procedures High Performance Anti-Bleed Grout Encapsulated System Probability of Corrosion: ASTM C876 : Extremely High Very High High (9%) Uncertain Low Figure 4.8: Maximum Final Half-Cell Potential Readings for Phase II Beams, Including Phase I Beam 2.2 Only the specimen with epoxy coated strands (2.7) had a probability of corrosion in the very high range. The remainder of the Phase II specimens were in the extremely high range. Beam 2.9 was essentially at the extremely high threshold (58 mv). It is interesting to note that according to the half-cell data, the use of the plastic duct (2.12) did not decrease the probability of corrosion in relation to the other specimens. However, it needs to be stressed that the half cell readings include the conventional bars and metal ducts, since all the steel elements in the beam form a circuit. Therefore, the relative performance of only the post-tensioning hardware (namely the strand) cannot be readily estimated from the half-cell potential data. In Chapter 6, the trends among the specimens indicated by the half-cell data are compared to the results of the forensic analyses of the specimens. Thus, it will be determined if the values of the half-cell readings can give an indication of the relative performance of the specimens. It will also be determined if the probabilities of corrosion suggested by the readings were correct. 4.2 Chloride Penetration Data Chloride samples were taken from the unponded control blocks, ponding blocks, and the beam specimens as stated in Chapter 3. All unponded control blocks showed negligible acid soluble chloride content at all depths Phase I Chloride Penetration Data The chloride content data for the Phase I beams is shown in Figure 4.9. The Cl - threshold for corrosion is the same used by Salas 14 which is.33 percent by weight of concrete. In Figure 35
52 4.1 the additional offsets outside the ponded region for unloaded beams 1.1 (Non-Prestressed) and 3.1 (1%U Prestressed) are shown. Acid Soluble Chloride Content (% by weight of concrete) PONDING BLOCKS-PHASE I BEAMS Depth (in.) ,2.1, , , Bar Level 2.5 Cl - Threshold for Corrosion Acid Soluble Chloride Content (% by weight of concrete) Depth (in.) PHASE I BEAMS-2" OFFSET Cl - Threshold for Corrosion Bar Level Depth (in.) Acid Soluble Chloride Content (% by weight of concrete) PHASE I BEAMS-18" OFFSET Cl - Threshold for Corrosion Bar Level Figure 4.9: Beam and Block Chloride Penetration for Phase I Beams 36
53 .5 Acid Soluble Chloride Content (% by weight of concrete) PHASE I BEAMS-27" OFFSET Depth (in.) Cl - Threshold for Corrosion Bar Level Acid Soluble Chloride Content (% by weight of concrete) PHASE I BEAMS-32" OFFSET Depth (in.) Cl - Threshold for Corrosion Bar Level Figure 4.1: Beam Chloride Penetration for 2-in. and 32-in. Offsets (Beams 1.1 and 3.1) For all Phase I ponding blocks, the chloride content decreased appreciably with depth. In the ponding blocks with the concrete used in beams 3.4, 3.5, and 4.1, the chloride contents are far above the corrosion threshold at the level of the bars. This is significant because it suggests that even without cracking, corrosion could occur in these specimens. In other words, the corrosion threshold could be reached just from the permeability of the concrete. Unlike the ponding block specimens, the chloride content did not always decrease with depth in the case of the beam specimens. The chloride content at 2 in. depth was larger than that near the surface, surely due to the large amount of cracking that was seen in the specimens (See Chapter 5). Also, the threshold for corrosion was reached at bar level for both offsets for all specimens, except the 18-in.offset for beam 3.1. The reason for this, as later stated in Chapter 5, is that beam 3.1 did 37
54 not have any cracking in the vicinity of the 18-in. offset. In addition, outside the ponded region all samples for beam 3.1 were below the threshold for corrosion Phase II Chloride Penetration Data The chloride penetrations from the Phase II beams are shown in Figure In the case of the Phase II ponding blocks, very similar behavior was seen among all five specimens. At the depth of the reinforcing bars, the ponding block chloride contents were far below the threshold for corrosion. In addition, the chloride content decreased appreciably with depth. In the case of the Phase II beam offsets, the values were substantially larger than the ponding blocks and did not always decrease with depth. At the depths of the bars, all samples were far above the threshold for corrosion. As later shown in Chapter 5, the large amount of cracking in the Phase II specimens likely caused the chloride content to be higher at the bar level than at the surface. In the case of the anchorages for beams 2.7 (Epoxy Coated Strand), 2.9 (Poor Grouting Procedure), and 2.12 (Encapsulated System), the end anchorages not subjected to the end drip exposure cycles showed negligible chloride content at all depths. The chloride content for the anchorages of beams which were subjected to the end exposure cycles are shown in Figure According to these data, the anchorage exposure cycles were rigorous enough to produce corrosion in the anchorages. For all three specimens, the chloride content at the level of the strand tails is far above the threshold for corrosion. The presence of any corrosion in the anchorages will be determined in the forensic analysis in Chapter 5. 38
55 Acid Soluble Chloride Content (% by weight of concrete) PONDING BLOCKS-PHASE II BEAMS 2.7, 2.8, 2.1 Depth (in.) Cl - Threshold for Corrosion Cl - Threshold for Corrosion Acid Soluble Chloride Content (% by weight of concrete) 2.9, Epoxy Coated Strands 2.8-Galvanized Strands 2.9-Poor Grouting Procedures 2.1-Anti-Bleed Grout 2.12-Encapsulated System Bar Level Bar Level PHASE II BEAMS-2" OFFSET Depth (in.) Cl - Threshold for Corrosion Bar Level.5 Acid Soluble Chloride Content (% by weight of concrete) PHASE II BEAMS-18" OFFSET Depth (in.) Cl - Threshold for Corrosion Bar Level Figure 4.11: Beam and Block Chloride Penetration for Phase II Beams 39
56 .5 Acid Soluble Chloride Content (% by weight of grout) PHASE II BEAMS- ANCHORAGES WITH DRIPPERS Depth (in.) Cl - Threshold for Corrosion Strand Level Figure 4.12: Chloride Penetration for Anchorages of Phase II Beams Subjected to End Anchorage Exposure Analysis of Chloride Penetration Data The chloride penetration data at the level of the reinforcing bars for the Phase I beams is shown in Figure Non-PS 2/3-PS 1%U 1%S 4.1-SL 3.5-OL 3.4-OL 3.1-NL 2.4-OL 2.2-SL 2.1-CL 1.4-OL 1.2-SL 1.1-NL Cl - Threshold for Corrosion 2" Offset 18" Offset Acid Soluble Chloride Content (% by weight of concrete) Figure 4.13: Chloride Penetration at Reinforcing Bar Depth-Phase I Beams 4
57 Except for the 18-in. offset in the unloaded fully prestressed specimen 3.1, all chloride levels exceeded the threshold for corrosion even the reinforced concrete unloaded specimen. While the contents at the 2-in.offsets were not always the same, in all loaded specimens the contents were far above the threshold, so the difference in values is irrelevant. The only trend observed when comparing specimens with the same level of prestress is with the fully prestressed beams: Beam 3.1 clearly demonstrated the effect of an uncracked section when compared to beams 3.4 and 3.5. The chloride penetration at bar depth for the Phase II beams is shown in Figure Specimen Cl - Threshold for Corrosion 2.7-Epoxy Coated Strands 2.8-Galvanized Strands 2.9-Poor Grouting Procedures 2.1-Anti-Bleed Grout 2.12-Encapsulated System 2" Offset 18" Offset Acid Soluble Chloride Content (% by weight of concrete) Figure 4.14: Chloride Penetration at Bar Depth-Phase II Beams All values are well above the threshold for corrosion. The fact that the threshold is exceeded is most likely due to corrosion of the steel reinforcing bars and galvanized ducts. Thus the difference in values among specimens does not reveal any information about the effects of different grouts, strand, or duct type. The values only indicate the potential for corrosion at the levels of the bars and ducts. The results from the chloride content data are compared to the forensic analysis data in Chapter 6 to determine if they give a correct indication of the relative performance of the specimens. 41
58
59 5. Forensic Analysis At the end of exposure testing, the remaining beam specimens from Phases I and II were unloaded and then autopsied. All reinforcing bars, stirrups and prestressing tendons were removed from the center region of the beams and analyzed. On three beams from Phase II the post-tensioning anchorages were removed for examination. Before autopsy, crack widths and concrete chloride content samples were taken as outlined in Chapter 3. A complete and highly detailed report of the autopsy results for all beams is given in Reference 19 available online at Autopsy Procedure Cutting of Beams A 72-in. long, 8-in. deep block was cut from each beam using a large water-cooled saw. The location of the cuts is shown in Figure 5.1. Phase II Beams 2.7, 2.9, 2.12 Only Phase II Beams 2.7, 2.9, 2.12 Only Ponded Region 24 Figure 5.1: Beam Cutting Pattern This is the same cutting pattern used by Salas 14 and Kotys 13 in the previous autopsies. The centerline of the removed block was 12 in. off the beam centerline. Therefore, an area outside the ponded region could be included for comparison with the area directly beneath the ponded region. Thus a total of 72 in. of each duct and longitudinal bar were inside the 72-in. long block, and the upper portions of six of the stirrups. For beams 1.1 and 3.1, which had been partially autopsied after 4 years of testing, 42 in. of material was removed extending from the centerline of the beams. The cutting pattern is shown in Figure
, 24 in. of the entire beam end were cut from both ends of the beams. Thus a comparison could be made between beam anchorages with saltwater drippers and those without saltwater drippers.")
60 Previous Autopsy Area 42 8 Ponded Region Figure 5.2: Cutting Pattern for Beams 1.1 and 3.1 As shown in Figure 5.1, for the Phase II beams which underwent end anchorage exposure with drippers (Beams 2.7, 2.9, 2.12), 24 in. of the entire beam end were cut from both ends of the beams. Thus a comparison could be made between beam anchorages with saltwater drippers and those without saltwater drippers Removal of Reinforcing Elements The reinforcing elements were removed from the center blocks using jackhammers and hammer drills. Since the blocks were upside down, the first elements removed were the grouted post-tensioning ducts, containing the strand. This is shown in Figure 5.3. Figure 5.3: Post-Tensioning Ducts Before Removal from Center Block (Phase II Beam 2.12 Pictured) The anchorages from the end blocks of the three Phase II beams with anchorage exposure were carefully removed. The items removed included the anchorhead, bearing plate, and 18 in. of 44

61 duct from both tendons. A total of 24 in. of strand was removed from each duct, since the strand extended out beyond the anchorhead. The removal of the anchorages is shown in Figure 5.4. Figure 5.4: Removal of Post-Tensioning Anchorages (East End Anchorage of Beam 2.12 pictured) Disassembly of Prestressing Tendons After each duct was removed from the beams, an air powered cutting tool was used to slice the ducts in half longitudinally in order to examine the grout. The grout was examined for bleed water voids, evidence of porosity, and cracking. In addition, transverse crack faces on the grout were examined for staining. Once this was complete, the grout was removed and grout chloride content samples were taken every 18 in. along the length of the duct for a total of five samples per duct. For the duct portions in the anchorages, samples were taken every 6 in. from the back of the bearing plate, for a total of four samples per duct. The grout sampled for all ducts was that directly in contact with the strand. Once the strand was removed from the duct, it was unwound in order to examine the interstices between the wires. In the case of the anchorages, the strand was cut directly behind the anchor head in order to remove it from the anchorhead with a hammer. Then, the wedges were removed from the strand Element Rating System In order to compare readily the corrosion damage among beams, a numerical rating system was used to rate the corrosion damage in the mild steel bars and stirrups, the galvanized ducts and splices, as well as the prestressing strand within the 72-in. long center block and the anchorages. This is the same rating system used by Salas 14 and Kotys. 13 Mild Reinforcing Steel Rating System In order to rate the damage in the longitudinal reinforcing bars, the top and bottom of each bar was divided into thirty-six 2-in. intervals. In the case of the stirrups, each 3- in. leg was taken as one interval. The remaining portion of the stirrup was divided into seven 2-in. intervals. The interval arrangement for the longitudinal bars and stirrups is shown in Figure

62 LONGITUDINAL BAR 36 2-in. Spacing STIRRUP Legs- Each One 3-in. Interval 7 2-in. Spacing Figure 5.5: Mild Reinforcing Steel Rating Intervals 14 The numerical rating system used to evaluate each interval of both the stirrups and longitudinal bars is shown in Table 5.1. Table 5.1: Numerical Rating System for Mild Steel Bars and Stirrups 14 Code Meaning Description Rating NC No Corrosion No evidence of corrosion. D Discoloration No evidence of corrosion, but 1 some discoloraiton from original color. L Light Surface corrosion on less than 2 one half of the interval, no pitting is present. Surface corrosion can be removed using cleaning pad. M Moderate Surface corrosion on more than 4 one half of the interval, no pitting. and/or Any corrosion that can not be completely removed using cleaning pad. P Pitting Pit visible to unaided eye. 8 AR Area Reduction Measurable reduction in bar cross- a 2 sectional area due to corrosion. a = Estimated bar cross-sectional area reduction in percent The cleaning pad used to discern between a rating of 2 or 4 was a 3M Scotchbrite pad. The pad was rubbed on the bar with the same pressure used for cleaning pots and pans. In order to determine any area loss in bars, the reduced diameter was measured with a micrometer and the 46
63 equivalent cross-sectional area loss was calculated. The highest possible rating in a single interval for a longitudinal bar or stirrup would be (1) 2 = 1,. This would indicate the total loss of cross sectional area anywhere in the interval. The rating for an entire longitudinal bar is given by Equation 5-1: 36 R Bar = ( RTop i + R i= 1 Bottom i ) The total rating for all longitudinal bars in a beam is given by Equation 5-2: Total Bar Corrosion Rating = m n= 1 R Bar n Eq. 5-1 Eq. 5-2 Where, R Top i = corrosion rating on top bar surface, interval i R Bottom i = corrosion rating on bottom bar surface, interval i. R Bar n = total bar corrosion rating, bar n i = interval, 1 to 36 n = bar number, 1 to m m = total number of longitudinal bars in beam (2 for 1%S and 1%U Beams, 8 for Non-PS and 2/3-PS Beams) In order to compare beams, as well as to account for the differences in the number of reinforcing bars among the beams, a generalized rating for the longitudinal bars is calculated for beam comparison, given by Equation 5-3: Total Bar Corrosion Rating Generalize d Bar Corrosion Rating = Eq. 5-3 m 6 This gives an average rating per foot of bar. The total rating for an individual stirrup is given by Equation 5-4: 9 R Stirrup = ( RTop i + R i= 1 Bottom i The total rating for all stirrups in a beam is given by Equation 5-5: ) Eq Total Stirrup Corrosion Rating = Eq. 5-5 n= 1 R Stirrup n Where, R Top i = corrosion rating on top stirrup surface, interval i R Bottom i = corrosion rating on top bar surface, interval i R Stirrur n = total stirrup corrosion rating, stirrup n i = interval, 1 to 9 n = stirrup number, 1 to 6 Even though there were an equal number of stirrups in each block, an average value for comparison was calculated using a generalized rating given by Equation 5-6: Total Stirrup Corrosion Rating Generalize d Stirrup Corrosion Rating = Eq Where 1.5 is the total length of all stirrups in the removed block (in feet). 47

64 Galvanized Duct/Galvanized Duct Splice Rating System Similarly to the longitudinal bars, the galvanized ducts were divided into thirty-six 2-in. intervals. The upper and lower halves of the duct were evaluated separately. In addition, the inner and outer surfaces of the duct halves were also evaluated separately. Thus a total of four surfaces were analyzed. The 12-in. long galvanized duct splices were examined in a similar fashion, with only six 2-in. intervals. The galvanized duct/galvanized splice interval system is shown in Figure in. Spacing 36 2-in. Spacing Figure 5.6: Galvanized Duct Rating System 4 The 18 in. of duct removed from the anchorages was also rated by this system, except with nine intervals. The galvanized duct/galvanized splice rating system is shown in Table 5.2. Table 5.2: Numerical Rating System for Galvanized Duct/Galvanized Splice 14 Code Meaning Description Rating NC No Corrosion No evidence of corrosion. D Discoloration No evidence of corrosion, but 1 some discoloraiton from original color. L Light Surface corrosion on less than 2 one half of the interval, no pitting is present. M Moderate Surface corrosion on more than 4 one half of the interval, no pitting. S Severe Corrosion completely covers the interval. 8 and/or Presence of Pitting H Hole Through Duct Hole corroded through duct A h Used in conjuction with ratings D, L, M, and S. A h =Area of holes in mm 2 The areas of the holes in the ducts were measured with a micrometer. The highest possible rating in mm 2 in one 2-in. interval for the 2 1/8 in. outside diameter galvanized duct 48
65 would be πdl = π(2.125)(25.4)(2)(25.4) = 8614, indicating that the top and bottom of the duct are completely corroded away. The rating for the entire duct is given by Equation 5-7: 36 Total Duct Corrosion Rating = RTopOuter, i + RBotOuter, i + RTopInner, i + RTopInnner, i + RBotInner, i Eq. 5-7 i= 1 Where, R TopOuter,i = top outer surface corrosion rating, interval i R BotOuter,i = bottom outer surface corrosion rating, interval i R TopInner,i = top inner surface corrosion rating, interval i R BotInner,i = bottom inner surface corrosion rating, interval i i = interval, 1 to 36 (1 to 6 for splice, 1 to 9 for anchorage duct). Since both ducts in a beam are regarded as separate specimens for analysis purposes, each individual duct is assigned a generalized rating. The generalized duct rating is given by Equation 5-8: Total Duct Corrosion Rating Generalize d Duct Corrosion Rating = Eq This gives an average rating per foot of duct. Prestressing Strand The strand was also divided into thirty-six 2-in. intervals. All six outer wires and the inner wire were evaluated separately in each interval. Before evaluation, the strand was unwound so the interstices could be examined. The strand removed from each anchorage was evaluated in a similar fashion, except it was divided into twelve 2-in. intervals. The strand numerical rating system is shown in Table
66 Table 5.3: Numerical Rating System for Prestressing Strand 14 Code Meaning Description Rating NC No Corrosion No evidence of corrosion. D Discoloration No evidence of corrosion, but 1 some discoloraiton from original color. L Light Surface corrosion on less than 2 one half of the interval, no pitting is present. Surface corrosion can be removed using cleaning pad. M Moderate Surface corrosion on more than 4 one half of the interval, no pitting. and/or Any corrosion that can not be completely removed using cleaning pad. P1 Mild Pitting Broad shallow pits with a maximum 8 pit depth not greater than.2 in. P2 Moderate Pitting Pitting where the maximum pit depth 16 ranged between.2 and.4 in. P3 Severe Pitting Pitting where the maximum pit depth 32 is greater than.4 in. The cleaning pad is the same used for the longitudinal bars and stirrups, and is applied in a similar fashion. The depths of the pits were measured with a depth gauge. The classification of pitting is based on tensile tests performed on corroded strand. 14 Level P1 indicates pitting which reduces strand strength to 97 percent GUTS (Guaranteed Ultimate Tensile Strength), Levels P2 and P3 corresponded to 9 percent and 77 percent GUTS, respectively. 14 The total strand corrosion rating is given by Equation 5-9: 36 Strand Corrosion Rating = ROuter, i ni + RCenter, i i= 1 Where, R outer,i = corrosion rating on outer wires, interval i n i = number of corroded outer wires in interval i R center,i = corrosion rating on center wire, interval i i = interval, 1 to 36 Eq. 5-9 Because beams with different reinforcement arrangements had varying numbers of strands in each duct, a generalized value is used to compare the strand ratings in the ducts for each beam: Strand Corrosion Rating m i= 1 Generalized Strand Corrosion Rating( Per Duct) = Eq. 5-1 m 6 Where, m = number of strands in each duct: 2 for 2/3-PS Beams, 3 for 1%U Beams, and 4 for 1%S Beams m 5
67 5.2 Results of Forensic Analysis Complete and highly detailed results of the forensic analysis for all fifteen Phase I and Phase II beams are given in Reference 18 and are available online. In this report full reports are given for only a few specimens and partial reports are given for the remainder, in which specific items of interest are noted. However, it is felt that this shortened summary of the autopsy results will give the reader an adequate appreciation of the results and support the findings and conclusions in Chapters 6 and 7. In the case of photographs showing longitudinal elements such as bars, strand, and ducts, the value on the measuring tape in the photographs coincide with the plots showing the corrosion damage. However, this is not applicable for beams 1.1 and 3.1 since they are partial autopsies. Tables summarizing corrosion ratings are given for each beam. The organization of the data for each individual forensic analysis, including the plots, are done in the same fashion as Salas 14 and Kotys 4 so that comparisons can be made easily between data from both sets of autopsies Phase I Beams Beam 1.1 (Non-PS, Unloaded): This beam was partially autopsied after 4 years of testing by Salas 14 and Kotys. 13 Approximately half of the ponded region was removed and autopsied. The cut surfaces were sealed with epoxy and exposure testing was resumed. After 8 years of exposure testing, 42 in. of material to one side of the centerline was removed, including 24 in. with the ponded region. Beam Appearance As shown in Figure 5.7, there was severe longitudinal cracking inside the ponded region as well as outside the north corner of the ponded region. On the north side of the ponded region a crack averaging.6 in. in width was found along the line of the bolster strips. A transverse crack of.2 in. in width was found in the center of the ponded region. On the north side of the beam was an apparent flexural crack with large amounts of staining around it. It is likely that small cracks formed when the beam was handled during the 4-year partial autopsy. Longitudinal Bars and Stirrups There was pitting and some cross-sectional area loss on all longitudinal bars and most of the stirrups. The stirrup, which was outside the ponded region, exhibited pitting on its top portion but only moderate corrosion on its legs. The stirrups and bars are shown in Figure 5.8. The ratings for the stirrups and bars, along with the beam crack maps are shown in Figure 5.7. In these plots the sum of the ratings for all longitudinal bars in each 2-in. interval is plotted. The total of the ratings for each stirrup along the length of the autopsy area is also shown. The corrosion ratings for the stirrups and bars are summarized in Table 5.4. In order to compare this beam with the other beams, additional stirrup and bar data were extrapolated in order to have a full 72 in. worth of data. This was done by mirroring the data from the section currently autopsied. 51
68 Side Face Epoxy Seal Beam Centerline W Top Surface Area Removed In Current Autopsy E Previous Autopsy Area Ponded Region Rating Extrapolated Data 8 = All 8 Bars Corroded Away In One Interval Rebar Rating Extrapolated Data = Stirrup Completely Corroded Away Stirrups 5 Figure 5.7: Beam 1.1-Crack Patterns and Corrosion Rating Graphs 52
: Beam Appearance As shown in Figure 5.")

69 Figure 5.8: Beam 1.1 Autopsy Elements-Longitudinal Bar (Left) and Stirrup (Right) Table 5.4: Beam 1.1-Corrosion Rating Summary Maximum Total Generalized Longitudinal Bars Stirrups Beam 1.2 (Non-PS, Service Load): Beam Appearance As shown in Figure 5.9, there was cracking both inside and outside the ponded region. There were large 1/8-in. cracks running from the west end of the salt bath through the entire remaining length of the autopsy area. Bolster strip corrosion was found in multiple locations in the ponded region. Some of the flexural cracks coincided with stirrup locations, while flexural cracks were found in other locations as well. Severe staining was found in the area of these flexural cracks. Also, there was longitudinal cracking on the side face of the beam. The combination of longitudinal cracking on the top and side of the beam would suggest severe bar corrosion, since the expansive effect of the corrosion products is essentially pushing the top corners of the beam off. The crack width data are given in Figure 5.1. After cutting of the beam, it was observed that the longitudinal 1/8-in. cracks actually formed a crack plane right through the level of the severely corroded bars. Thus, corrosion of the bars is responsible for the longitudinal cracking. As the bars corroded, the expansive effects of the corrosion products cracked the concrete. This is shown in Figure Note that the block is upside down compared with its position during exposure testing. 53
70 Side Face W Beam Centerline Top Surface Ponded Region E Rating = All 8 Bars Corroded Away In One Interval Rebar Rating = Stirrup Completely Corroded Away Stirrups 9628 Figure 5.9: Beam 1.2-Crack Patterns and Corrosion Rating Graphs 54

71 Crack Width, in Average of Peak Crack Widths Maximum Crack Width Figure 5.1: Beam 1.2 Crack Widths Figure 5.11: West End of Autopsy Block-Beam 1.2 Longitudinal Bars and Stirrups During autopsy, pitting and cross-sectional area loss was found throughout all the longitudinal bars and the stirrups. The most severe section loss in the bars was found in the area of the flexural cracks. The most corroded stirrup was that located 54 in. from the west end of the autopsy area. The corroded bars and stirrups are shown in Figure Bar and stirrup corrosion ratings are given in Figure 5.9, and the corrosion ratings are summarized in Table 5.5. Table 5.5: Beam 1.2 Corrosion Rating Summary Maximum Total Generalized Longitudinal Bars Stirrups


72 Figure 5.12: Beam 1.2 Autopsy Elements-Longitudinal Bar (Left) and Stirrup (Right) Beam 1.4 (Non-PS, Overload): Beam Appearance As shown in Figure 5.13, there was severe cracking throughout the ponded region. The longitudinal cracks typically measured.1 in. in width. In general, these cracks corresponded to the locations of the steel bolster strips. The maximum width of these longitudinal cracks was 1/8 in. Similar to beam 1.2, upon removal of the block from the center of the beam it was found that the longitudinal cracks formed a crack plane right through the bars. Longitudinal Bars and Stirrups Considerable cross-sectional area loss and pitting was found on all bars and most of the stirrups, with the most severe area loss in the bars corresponding to the locations of flexural cracks. The worst damage seen on the stirrup was essentially a reduction in diameter from 1/2 in. to approximately 3/8 in. Crack patterns and corrosion rating graphs are given in Figure 5.13 and corrosion ratings are summarized in Table
73 Side Face ` W Top Surface Top Surface Beam Centerline Ponded Region Ponded Region E Rating Rebar 8 = All 8 Bars Corroded Away In One Interval Rating Stirrups 9 = Stirrup Completely Corroded Away Figure 5.13: Beam 1.4-Crack Patterns and Corrosion Rating Graphs Table 5.6: Beam 1.4 Corrosion Rating Summary Maximum Total Generalized Longitudinal Bars Stirrups
74 Beam 2.1 (2/3-PS, Small Crack Load): Beam Appearance Table 5.7: Beam 2.1 Corrosion Rating Summary Maximum Total Generalized Longitudinal Bars Stirrups North Duct South Duct North Strand South Strand As shown in the crack maps in Figure 5.14, heavy cracking was observed in the ponded region. Inside the ponded region, longitudinal cracks following the bolster strips measured about.1 in. in width. Severe staining was seen in the area of these cracks. The flexural cracks also showed severe staining on the top of the beam. The largest crack width was from a longitudinal crack about 18 in. to the east of the beam centerline. This crack measured 1/8 in. in width. On the side faces of the beam, the flexural cracks had severe staining emanating from them, which was likely from the corrosion of stirrups because all flexural crack locations corresponded with stirrup locations. Longitudinal cracks with staining were also found on the side of the beam as well. The large number of longitudinal cracks suggest severe corrosion within the beam. Indeed, when the autopsy block was removed from the center of the beam, cracking through the bars was seen similar to that in the Non-PS beams. Longitudinal Bars and Stirrups Upon autopsy, it was found that all stirrups and bars suffered severe pitting and crosssectional area loss (See Figure 5.15). In the area of the flexural cracks, the smaller bars completely corroded away, some losing almost 2 in. in length. The stirrups also had severe pitting and area loss, with the worst stirrup 12 in. to the west of the beam centerline. The ratings along the length of the beam for the bars and stirrups, as well as the other elements of the beam, are given in Figure The corrosion ratings are summarized in Table 5.7. Tendons The south duct was fitted with an industry standard splice, while the north duct had a heat shrink splice. The industry standard splice suffered tremendous area loss to its top portion and pitting corrosion was found on the remains of the inside surface of the splice. The duct beneath had large holes and pitting. The heat-shrink splice on the south duct showed severe staining and corrosion deposits on the inside. The section of duct beneath the splice was found to be heavily pitted and holed. In this case the holes were smaller than those in the splice zone of the south duct. The splices are shown in Figure
75 Side Face W Top Surface Beam Centerline E Ponded Region Rating Rebar = All 8 Bars Corroded Away In One Interval Rating Rating Stirrups Location of Duct Splices North Duct South Duct = Stirrup Completely Corroded Away 8171= Entire Duct Corroded Away In One Interval Chloride Content (%) Rating North Grout South Grout North Strand South Strand 448= All 7 Wires in Both Strands Have Severe Pitting In One Interval %=Threshold for Corrosion Figure 5.14: Beam 2.1-Crack Patterns and Corrosion Rating Graphs 59
 and North Duct Heat Shrink Splice (Right) Both ducts were heavily pitted with large holes that caused large surface area loss.")

76 Figure 5.15: Beam 2.1 Duct Splices-South Duct Industry Standard Splice (Left) and North Duct Heat Shrink Splice (Right) Both ducts were heavily pitted with large holes that caused large surface area loss. The south duct suffered severe surface area loss throughout, with the entire top portion of the duct gone from 14 in. to 18 in. to the west of the beam centerline. The north duct showed similar large surface area loss; however, little corrosion was seen in the portion outside the ponded region. The surface area loss was not as large as that beneath the south duct splice. The ducts are shown in Figure The corrosion ratings for the ducts are plotted in Figure The ratings are summarized in Table 5.7. The south duct grout showed no large voids. However, there was some evidence of porosity in the form of bubbles at the top of the grout. The grout was found to be cracked in numerous locations, and staining was found on the crack faces. The maximum chloride content in the south duct grout was.237 percent by weight, far above the corrosion threshold of.33 percent. This maximum value occurred at the far east end of the duct. The north duct grout was similar. However, small surface voids were found on the north duct, and in some cases corrosion products were found inside the voids. The maximum chloride content in the north duct grout was.649 percent, which was found 6 in. to the west of the beam centerline. This is over 2 times larger than the threshold for corrosion. The grout from both ducts is shown in Figure The grout chloride contents are plotted in Figure The strands in both ducts were pitted. The two south duct strands showed mild pitting throughout, and moderate to severe pitting on a few wires within the ponded region. Mild pitting was also found on portions of the strands outside the ponded region. The north duct strands had much less pitting than the south duct strand, with only mild pitting found at the three flexural crack locations near the beam centerline. The strands are shown in Figure Corrosion ratings for the strand are plotted in Figure 5.14 and are summarized in Table 5.7. It is interesting to note from Figure 5.14 that the reinforcing bar ratings, duct and strand ratings all reach peak ratings at the same locations, which correspond with the location of cracks. Also, the strands from the south duct show more corrosion than the north duct strand. However, according to the chloride content data, the south duct had smaller grout chloride contents than the north duct. It is possible that the industry standard splice allowed more moisture in initially than the heat shrink splice, resulting in more strand corrosion. However, once the ducts corroded away more heavily, the splice type became irrelevant, as chlorides could then enter through the large holes in the ducts. 6

")


77 Longitudinal Bar Stirrup South Duct (Top Half) North Duct (Top Half) South Duct Grout North Duct Grout South Duct Strand North Duct Strand Figure 5.16: Beam 2.1 Autopsy Elements 61
78 Beam 2.2 (2/3-PS, Service Load): Beam Appearance As shown in Figure 5.17, severe cracking was observed inside the ponded region. Longitudinal cracks were observed running along the length of the beam. These cracks typically measured about.6-in. in width inside the ponded region. The maximum crack width found was located 1 in. inside the west end of the ponded region, where one of the longitudinal cracks measured 1/8 in. in width. The large longitudinal cracks and staining suggests severe corrosion within the beam. Longitudinal Bars and Stirrups Upon autopsy, it was found that the longitudinal bars and stirrups suffered severe pitting and area loss throughout the autopsy area (See Figure 5.18). Pitting was found even outside the ponded region. Approximately 6 to 8 in. of several of the #3 bars was completely corroded away in the vicinity of flexural cracks. In one location, a stirrup s diameter was reduced by half. This corresponded to one of the areas of severe staining seen on the exterior surface of the beam. The longitudinal bars and stirrups are shown in Figure The ratings for the stirrups and bars are shown in Figure 5.17 and are summarized in Table 5.8. Tendons The south duct had an industry standard splice, while the north duct had no splice. The industry standard splice suffered very severe area loss, both to its top and bottom portions. Pitting corrosion was found on the inside of the splice. The length of galvanized duct beneath the splice suffered severe pitting and the loss of nearly half of the top portion of the duct. As shown in Figure 5.18, both ducts were heavily holed and as a result had tremendous surface area loss. The last 2 feet of the top portion of the south duct was basically missing. Only fragments of the duct ribbing were recovered in this area. At 26 in. from the west end of autopsy area, the duct loss was so severe that the strand could be plainly seen and was severely pitted. The ducts are shown in Figure The duct corrosion ratings are plotted in Figure 5.17 and are summarized in Table 5.8. Corrosion products were found deposited on the grout throughout both ducts. The north duct grout was cracked at multiple locations, with severe staining on the crack faces. The most severe staining was at a crack 3 in. from the west end of the autopsy area. Small voids were found indicating either bleed water accumulation or air pockets. The maximum chloride content in the north grout was.29 percent, which was at a location 12 in. to the east of the beam centerline. This corresponds to a flexural crack location. The south duct grout was also cracked. A large bleed water void was found in the south duct in the vicinity of the beam centerline. The void was about 1.2 in. wide. This void continued through the entire length of the autopsy area. Staining was also found on the crack faces of the grout, corresponding to locations of severe loss in duct surface area. The maximum chloride content in the south duct was.329 percent, slightly higher than the north duct. The grout from both ducts is shown in Figure The grout chloride contents from both ducts are plotted in Figure The strands from both ducts varied in the severity of corrosion. The north duct strands showed moderate corrosion throughout, with mild pitting in the vicinity of the beam centerline. Severe pitting was found on some wires at 3 to 32 in. from the west end of the autopsy area. 62
79 One of the wires actually broke during unwinding of the strand. This is shown in Figure The south duct strand was much more heavily corroded than the north duct strand. Mild pitting was found throughout, with instances of moderate to severe pitting found in multiple locations. At 28 in. from the west end of the autopsy area, it was found that three wires on one of the strands had been reduced in diameter by about 33 percent. One of these wires is shown in Figure The corrosion ratings for the strand are plotted in Figure 5.17 and are summarized in Table 5.8. It is significant that the most severe duct damage observed in the south duct was where the large bleed water void occurred. The presence of the void allowed for moisture to reach the inside of the duct more easily. This is also where the maximum chloride content was observed for this duct. The more severe strand damage in the south duct is likely due to the presence of the bleed water void as well, since the duct corroded away and less grout cover was available to the strand. The presence of the industry standard splice likely allowed an initial entry of moisture, but as is clear from the chloride content data, in the end the presence of the splice became negligible as rest of the duct began to corrode away. 63
80 Side Face W Top Surface Beam Centerline Ponded Region E Rating Rating Rating Rebar Stirrups North Duct South Duct 8 = All 8 Bars Corroded Away In One Interval 9 = Stirrup Completely Corroded Away 8171= Entire Duct Corroded Away In One Interval Location of Duct Splice Chloride Content (%) Rating North Grout South Grout = All 7 Wires in Both Strands Have Severe Pitting In One Interval.33%=Threshold for Corrosion North Strand South Strand Figure 5.17: Beam 2.2- Crack Patterns and Corrosion Rating Graphs 64


81 Longitudinal Bar Stirrup South Duct Top of North Duct South Duct Grout North Duct Grout Single Wire from South Duct Strand North Duct Strand Figure 5.18: Beam 2.2 Autopsy Elements 65
82 Table 5.8: Beam 2.2 Corrosion Rating Summary Maximum Total Generalized Longitudinal Bars Stirrups North Duct South Duct North Strand South Strand Beam 2.4 (2/3-PS, Overload): Beam Appearance As expected, more flexural cracks were observed on this beam than in 2.1 and 2.2 because of the temporary overloading, which was done at the beginning of exposure testing. As is apparent in Figure 5.19, severe longitudinal cracking was observed inside the ponded region. The largest crack width observed for these longitudinal cracks was 1/8 in. This was at the extreme east end of the ponded region. These cracks continued even outside the ponded region. The cracks seemed to run parallel to the steel bolster strips. Longitudinal Bars and Stirrups Upon autopsy, all bars and stirrups were found to be heavily pitted and reduced in the cross-sectional area (See Figure 5.2). The most severe bar damage corresponds to 3 in. on the crack maps and rating graphs shown in Figure This coincides with the location of a flexural crack as well as severe patches of staining. The bar damage consisted of the total loss of approximately 4 in. of two of the #3 bars, and the loss of around half the cross-sectional area of one of the other nearby #3 bars. The two most heavily corroded stirrups were those located at 12 in. to the west and east of the beam centerline, which were reduced in diameter by nearly 25 percent in one interval. The stirrups and bars are shown in Figure 5.2. The bar and stirrup corrosion ratings along the length of the beam are shown in Figure 5.19 and are summarized in Table 5.9. Tendons Both ducts in the beam were spliced at the beam centerline. The south duct had an industry standard splice, while the north duct had a heat shrink splice. Most of the top half of the south duct splice corroded away, while the remainder was pitted. The inside surface had severe pitting adjacent to the holes. The bottom portion of the splice did not have any holes but was pitted on the exterior in a few locations. The duct portion directly beneath the splice showed large holes and pitting. The north duct heat shrink splice showed discoloration on its inside surface. The portion of duct beneath it had large holes and pitting. Therefore, in this instance both splices performed very poorly in keeping moisture out of the splice zone. The heavy duct corrosion in the splice zone suggests large moisture ingress. The splices are shown in Figure Both ducts were heavily holed and thus had large surface area loss. In the case of the south duct, severe surface area loss was seen 12 in. to the west and east of the beam centerline (corresponding to flexural crack locations). The last 2 feet of the top portion of the duct was nearly corroded away, and only fragments of the duct ribbing were recovered. The north duct 66
83 showed similar performance, except that the last 2 ft were more intact than the south duct, with large holes instead of complete duct loss. For both ducts, pitting was observed inside the duct in the vicinity of the holes. The ducts are shown in Figure 5.2. The duct corrosion ratings are plotted in Figure 5.19 and summarized in Table 5.9. The south duct grout had corrosion deposits throughout from the duct corrosion. Bubbles indicating porosity were evident. The grout was cracked and staining was found in some areas. At about 22 in. from the west end of the autopsy area, a large bleed water void was found. This void became deeper moving east; finally, the grout essentially terminated at about 27 in. from the east of the autopsy area, with only fragments found beyond that point. The highest chloride content measured in the south duct was.89 percent, and was found 6 in. to the west of the beam centerline. The threshold for corrosion is.33 percent. The north duct had a small bleed water void starting at about 7 in. from the east end of the autopsy area. Therefore, the north duct had better grouting than the south duct. The north duct grout had maximum chloride content of.455 percent, which was at location 12 in. to the east of the beam centerline. The grout from both ducts is shown in Figure 5.2, with the chloride contents plotted in Figure The strands in both ducts varied had varied amounts of corrosion. The north duct strands showed light to moderate corrosion in the area outside the ponded region. Inside the ponded region, moderate corrosion was observed on more wires. At 8 to 12 in. east from the centerline (corresponding to 54 in. on the corrosion rating graphs), mild pitting was observed on both the outer wires and on the center wires on one of the two strands. No pitting was seen on the second strand. This area of pitting corresponds to the location of a flexural crack and where very severe surface area loss was observed in the duct itself. The south duct strand was more severely corroded, with pitting first observed in the center wire at 18 in. to the west of the beam centerline. At 26 in. from the west end of the autopsy area, moderate pitting was seen on the center wire. Pitting was seen on the outer wires starting at the beam centerline, and mild strand pitting continued through to the end of the autopsy area. The strands are shown in Figure 5.2, with the corrosion ratings shown in Figure 5.19, and summarized in Table 5.9. It is very significant to note that the lack of grout at the end of the south duct resulted in more severe damage to the duct and to the strand (in comparison to the north duct) at the end of the duct. Table 5.9: Beam 2.4 Corrosion Rating Summary Maximum Total Generalized Longitudinal Bars Stirrups North Duct South Duct North Strand South Strand
84 Side Face Beam Centerline W Top Surface E Ponded Region Rating Rating Rebar 9 = Stirrup Completely Corroded Away 7244 Stirrups = All 8 Bars Corroded Away In One Interval 1591 Rating = Entire Duct Corroded Away In one Interval North Duct South Duct Location of Duct Splices Chloride Content (%) North Grout South Grout.33%=Threshold for Corrosion Rating North Strand South Strand 448= All 7 Wires in Both Strands Have Severe Pitting In One Interval Figure 5.19: Beam Crack Patterns and Corrosion Rating Graphs 68


85 Longitudinal Bar Stirrup Top of South Duct Top of North Duct South Duct Grout North Duct Grout South Duct Strands (Both Strands shown) North Duct Strand Figure 5.2: Beam 2.4 Autopsy Elements 69
 This beam is particularly interesting since as an unloaded fully prestressed beam, it would be expected to be in pristine condition after 8 years of aggressive exposure.")

86 Figure 5.21: Beam 2.4 Duct Splices-South Duct Industry Standard Splice (Left) and North Duct Heat Shrink Splice (Right) Beam 3.1 (1%U, Unloaded) This beam is particularly interesting since as an unloaded fully prestressed beam, it would be expected to be in pristine condition after 8 years of aggressive exposure. The only possibility for damage would be chloride penetration through the uncracked concrete. This beam was partially autopsied at 4 years of testing by Salas 14 and Kotys 13. Approximately half of the ponded region was removed and autopsied. The cut surfaces were sealed with epoxy and testing continued. After 8 years of exposure testing, 42 in. of material to one side of the centerline was removed, including 24 in. of the ponded region. Beam Appearance As shown in Figure 5.22, no actual cracking was seen on the specimen. Longitudinal Bars and Stirrups In general, except at the face of the cutting area from the previous autopsies, the longitudinal bars only showed slight discoloration. The stirrups were slightly discolored with only a few instances of light to moderate corrosion. The stirrups and bars are shown in Figure 5.23, with the corrosion ratings plotted in Figure 5.22 and summarized in Table 5.1. In order to have a full 72 in. worth of data for comparison to the other beams, additional data was extrapolated by mirroring the data about the beam centerline. Tendons Because the splices of the ducts were at the beam centerline, only half of the splice remained from each duct to be autopsied. The remaining half of each splice was removed during the previous autopsies. Away from the cut faces from the first autopsies the duct splices were intact. Both ducts were only slightly corroded. Except near the previous autopsy area, only a few instances of light corrosion were found on the inside and outside of the remainder of the ducts. The ducts are shown in Figure 5.23, with the ratings plotted in Figure 5.22 and summarized in Table
87 Side Face Epoxy Seal Beam Centerline W Top Surface Area Removed In Current Autopsy E Previous Autopsy Area Ponded Region Distance (in) Rating Extrapolated Data 2 = Both Bars Corroded Away In One Interval Rebar Rating Extrapolated Data = Stirrup Completely Corroded Away Stirrups Rating Extrapolated Data North Duct South Duct 8171= Either Top or Bottom of Duct Corroded Away In one Interval Location of Duct Splices Chloride Content (%) Rating Extrapolated Data Extrapolated Data Extrapolated Data North Grout South Grout Di t (i ).33%=Threshold for Corrosion North Strand North Strand South Strand South Strand 672= All 7 Wires in All Three Strands Have Severe Pitting In One Interval Figure 5.22: Beam 3.1-Crack Maps and Corrosion Rating Graphs 71
88 Table 5.1: Beam 3.1 Corrosion Rating Summary Maximum Total Generalized Longitudinal Bars Stirrups North Duct South Duct North Strand South Strand The south duct grout showed evidence of a shallow bleed water void on the west end, right at the previous autopsy cutting area. The void was only about 2 in. long and was stained on the inside. Smaller bleed water voids were also seen at the top of the grout, spaced about every 8 in. These voids terminated about 2 feet from the west end of the autopsy area. The grout also showed bubbles which indicate porosity. The north duct had several small, shallow bleed water voids. The largest was 2 in. long and about 1/4 in. deep. This void was located about 1 in. from the west end of the autopsy area. The grout is shown in Figure The maximum chloride content for the south duct grout was.243 percent, while for the north duct.257 percent. These two values were found at the far west of the autopsy area, near the cut face from the previous autopsies. The chloride content data is plotted in Figure The strands from both ducts showed light to moderate corrosion throughout. At the cutting area on the west end of the autopsy area, the exteriors of the strand had a large buildup of corrosion products. The light to moderate corrosion for the remainder of the autopsy was concentrated in the interstitial zones. The strand is shown in Figure 5.23, and the corrosion ratings are plotted in Figure 5.22 and summarized in Table 5.1. The corrosion damage to all of the autopsy elements was concentrated on the west end of the of autopsy area. This corresponds to 42 in. on the corrosion rating graphs in Figure The chloride content data clearly shows large chloride ingress at the cut face of the beam. Thus it would appear that the damage to the beam was due to chloride ingress at the cut face of the beam. The moderate strand corrosion in the interstitial areas suggests that moisture which entered at the west end of the autopsy area was transmitted down the entire length of the strand, causing moderate corrosion on the interstices of the wires. But other than near the previous autopsy area, the lack of serious corrosion on the bars, ducts, and stirrups clearly shows that corrosion is dramatically reduced if cracking is absent. 72


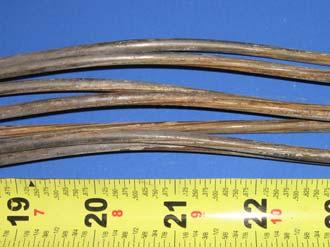
89 Longitudinal Bar Stirrup Top of South Duct Top of North Duct South Duct Grout North Duct Grout South Duct Strand North Duct Strand Figure 5.23: Beam 3.1 Autopsy Elements 73
90 Beam 3.4 (1%U, Overload): Beam Appearance This beam was originally intended to be at constant service load, but in order to crack the beam, the previous researchers were forced to overload it. As shown in Figure 5.24, severe cracking was found within the ponded region. Longitudinal cracks ran parallel with the bolster strips, and the maximum crack width was.6 in., which was measured from one of the longitudinal cracks. The cracks continued outside the ponded region. Longitudinal cracks were also observed on the side of the beam, in the vicinity of the flexural cracks as well. This suggests a large amount of corrosion within the beam. Longitudinal Bars and Stirrups Upon autopsy, it was found that within the ponded region, the bars were mostly pitted with area loss at flexural crack locations (See Figure 5.25). The stirrups were also heavily pitted with cross-sectional area loss. The most severe bar corrosion was at the flexural crack 12 in. to the west of the beam centerline, where one of the bars was reduced in diameter by over 2/3. The bar broke in half at this location upon removal from the beam during autopsy. The other bar had moderate area loss at this location. The bars and stirrups are shown in Figure 5.25, with the ratings plotted in Figure 5.24 and summarized in Table Tendons Unlike the other Phase I beams, beam 3.4 had two splices in each duct. The purpose of two splices was to test the effect of accidental damage to either the industry standard splice or the heat shrink splice. The south duct was used to test the industry standard splice, with the westmost splice damaged in the form of poor duct taping. The north duct was used to test the heat shrink splice, with the west splice damaged in the form of a 1-in. tear at the seam between the two duct portions. For both ducts, each splice was 18 in. either to the west or east of the beam centerline. Upon autopsy, the damaged industry standard splice on the south duct was found to be severely corroded. Half of the top portion of the splice was corroded away, with pitting and holes on the remaining portion. The bottom portion of the duct was also severely pitted in some areas, with one end corroded away directly beneath the splice. Pitting was also found on the insides of both the top and bottom halves of the splice. Pitting and holes were also found in the duct directly beneath the splice. The corrosion damage to the undamaged splice was similar, but no holes were found on the bottom portion. Holes and pitting were found in the duct portion directly beneath this splice. Both heat shrink splices on the north duct had corrosion deposits on their inside surfaces. The damaged splice had smaller deposits on it, while the duct beneath was pitted. The undamaged splice had more deposits, and pitting and holes were observed on the duct directly beneath it. 74
91 Side Face Top Surface Beam Centerline Ponded Region Rating Rebar 2 = Both Bars Corroded Away In One Interval Rating Rating Chloride Content (%) = Stirrup Completely Corroded Away North Duct South Duct Stirrups 8171= Duct Completely Corroded Away In one Interval Location of Damaged Duct Splices Location fo Undamaged Duct Splices %=Threshold for Corrosion Location of Damaged Duct Splices North Grout South Grout Location of Undamaged Duct Splices Rating = All 7 Wires in All Three Strands Have Severe Pitting In One Interval Location of Damaged Duct Splices North Strand South Strand Location of Undamaged Duct Splices Figure 5.24: Beam 3.4-Crack Patterns and Corrosion Rating Graphs 75
92 Both ducts were severely holed and pitted, thus they had large surface area loss. The south duct was severely pitted and holed within the ponded region. Discolorations to moderate corrosion with some pitting were observed in the duct portion outside the ponded region. Some of the worst damage duct was approximately 12 in. to the west of the beam centerlinecorresponding to the location of one of the flexural cracks. In this location the top portion of the duct was nearly corroded away in several intervals. The bottom portion was also heavily corroded with holes and pitting. Another area of major damage was the loss of 6 in. of the top portion of the duct at the end of the autopsy area (east end). The north duct was also holed and pitted, with some of the worst damage located, again, 12 in. to the west of the centerline. At this location the top part of the duct was almost completely corroded away in several intervals. The bottom portion had large holes. However, the worst damage to the south duct overall was the loss of 6 in. of length of the entire top of the duct at the east end of the autopsy area. The ducts are shown in Figure 5.25, with the corrosion ratings plotted in Figure 5.24 and summarized in Table The south duct grout had large deposits of corrosion products throughout. The grout was also cracked at numerous locations. Small bleed water voids were observed in many locations. Many of the voids had corrosion products inside. Most of the voids were around 1/2 in. in diameter and 1/4 in. deep. There was a large bleed water void at the extreme east end of the autopsy area. This void was wide and 3/8 in. deep maximum. The maximum chloride content in the south duct grout was.29 percent, measured at 18 in. to the west of the beam centerline. The north duct grout was similar, with corrosion products deposited on it throughout. Bleed water voids were seen, with similar sizes to the voids in the north duct. These also had corrosion products in them. The maximum chloride content measured in the north duct grout was.91 percent, found at l2 in. to the east of the beam centerline. The grout for each duct is shown in Figure The chloride contents for the grout in each duct are plotted in Figure The three south duct strands were moderately corroded with instances of pitting. Mild pitting was observed on wires just outside the ponded region, with pitting also found on the center wire (this location corresponds to 12 in. on the corrosion rating graphs.) The fact that there was pitting on the center wire suggests that the pitting in the ponded region is due to moisture traveling down the strands from the ponded region. Mild pitting with one instance of moderate pitting was found in the vicinity of the flexural crack 12 in. to the west of the beam centerline. Other instances of mild pitting were found near the centerline of the beam. The strands are shown in Figure 5.25 and the corrosion ratings are plotted in Figure 5.24 and summarized in Table From the plots in Figure 5.24, there is no overall trend between either strand damage or chloride content when comparing the data in the vicinities of the damaged or undamaged splices in both ducts. It is likely that the severe duct corrosion made the damage to the splices insignificant as the ducts began to corrode away. 76
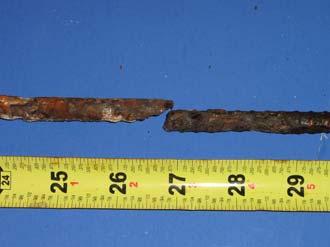
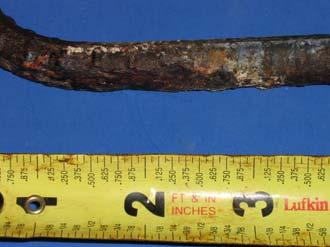
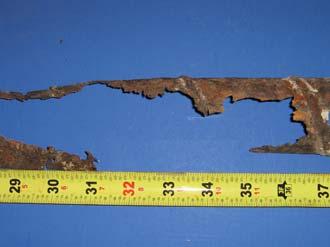
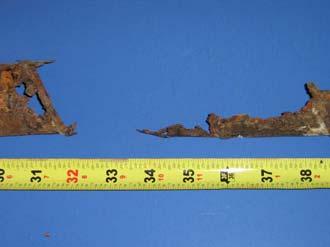


93 Longitudinal Bar Stirrup Top of South Duct Top of North Duct South Duct Grout North Duct Grout South Duct Strand North Duct Strand Figure 5.25: Beam 3.4 Autopsy Elements 77
94 Table 5.11: Beam 3.4 Corrosion Rating Summary Maximum Total Generalized Longitudinal Bars Stirrups North Duct South Duct North Strand South Strand Beam 3.5 (1%U, Overload) Beam Appearance As shown in Figure 5.26, the beam was heavily cracked. There were longitudinal cracks with a maximum width of.6 in. running parallel to the bolster strips. Staining was observed emanating from these cracks. Minor longitudinal cracking was also observed on the sides of the beam, in the vicinity of the flexural cracks. The large amounts of staining and cracking suggest large amounts of corrosion within the specimen. Longitudinal Bars and Stirrups Autopsy showed that both the stirrups and longitudinal bars were heavily corroded inside the ponded region (See Figure 5.27). The worst bar damage was about 2 in. to the west of the beam centerline, where one of the #3 bars was reduced to 1/4 in. in diameter. The other bar was also significantly reduced in area at this location. This location corresponded to the flexural crack in the vicinity of the centerline. Outside the ponded region, the bars were only discolored or lightly corroded. The three most heavily corroded stirrups were at the locations of flexural cracks. These bars had significant cross-sectional area loss with the bar diameter reduced by around 1/3. The stirrups, which were still within the ponded region but not beneath flexural cracks, were moderately corroded with only a few instances of some pitting. The bars and stirrups are shown in Figure 5.27, and the ratings are plotted in Figure 5.26 and summarized in Table Tendons Both ducts were spliced at the beam centerline. The south duct had an industry standard splice while the north duct had a heat shrink splice. The top portion of the south duct splice was nearly corroded away, with only large fragments remaining. The bottom portion was heavily pitted with some small holes. Pitting was found on the inside surfaces of both the top and bottom of the splices as well. Both ducts were heavily pitted and holed. The large number of holes produced large section loss in the ducts. The south duct was lightly corroded outside the ponded region. Inside the ponded region the duct was heavily pitted and heavily holed. The ducts are shown in Figure 5.27, with the ratings plotted in Figure 5.26 and summarized in Table
95 Side Face Beam Centerline Top Surface Ponded Region Rating Rebar 2 = Both Bars Corroded Away In One Interval Rating = Stirrup Completely Corroded Away Stirrups 3991 Rating North Duct South Duct 8171= Duct Completely Corroded Away In one Interval Location of Duct Splices Chloride Content (%) North Grout South Grout.33%=Threshold for Corrosion Rating North Strand South Strand 672= All 7 Wires in All Three Strands Have Severe Pitting In One Interval Figure 5.26: Beam 3.5-Crack Patterns and Corrosion Rating Graphs 79


96 Longitudinal Bar Stirrup Top of South Duct Top of North Duct South Duct Grout North Duct Grout South Duct Strand North Duct Strand Figure 5.27: Beam 3.5 Autopsy Elements 8
97 The south duct grout had small voids at the west end of the autopsy area. These voids were approximately 3/4 in. in diameter and a 1/4 in. deep. The most significant void was 12 in. from the end of the autopsy area. At approximately 23 in. to the west of the beam centerline, transverse cracks were observed with staining on their faces. When this grout was separated from the strand, corrosion could be seen on the strand directly beneath these cracks. A large bleed water void was found in the vicinity of the beam centerline. It was more than 16 in. long and about 3/8 in. deep. Corrosion products from the duct were found inside portions of the void. The maximum chloride content measured in the south duct grout was 18 in. from the west end of the autopsy area. The chloride content was.184 percent, far above the threshold for corrosion of.33 percent. The grout from both ducts is shown in Figure The grout chloride content along the length of the autopsy area is plotted in Figure The three strands in the south duct showed light to moderate corrosion overall, with some instances of mild pitting. The mild pitting was found on the center wire of one of the strands at 24 in. to the west of the beam centerline (18 in. on the corrosion rating graphs.) In addition, at approximately 4 in. to the west of the beam centerline, mild pitting was also found on a single wire from one of the strands. The three strands in the north duct showed light to moderate corrosion as well, but no pitting. Strands from both ducts are shown in Figure The corrosion ratings for the strand along the length of the autopsy area are shown in Figure 5.26, and are summarized in Table Table 5.12: Beam 3.5 Corrosion Rating Summary Maximum Total Generalized Longitudinal Bars Stirrups North Duct South Duct North Strand South Strand Beam 4.1 (1%S, Service Load): This beam is very interesting as it represents a fully prestressed beam designed to limit service load stresses. As such it represents the most conservative design in the series. However, in contrast to Beam 3.1, which was never loaded, Beam 4.1 was loaded to service live load levels producing some flexural cracking. Beam Appearance As shown in Figure 5.28, the beam was substantially cracked. Patches of staining were found in the ponded region. The staining was concentrated around longitudinal cracks, which seemed to follow the bolster strips/longitudinal bars. These cracks were typically between.2 and.9 in. in width, while the largest longitudinal crack width was.16 in. Longitudinal cracks were also found on the side of the beam, with staining emanating from one of these cracks just outside the west end of the autopsy area. This crack continued almost to the beam centerline. Flexural cracks were also found on the beam. This is significant for this beam because it was designed not to crack under long term loading at service load. Three flexural cracks were found, one at the beam centerline and two additional cracks, each 24 in. to the east and west of the 81
98 centerline. In general these flexural cracks were wider than the aforementioned longitudinal cracks. Staining was found emanating from the side of the flexural crack at the beam centerline. This crack continued almost to the beam centerline. The largest crack width measured was from the flexural crack just outside the east end of the ponded region. This crack was.4 in. in width. This was the only beam where the largest crack width was measured at an actual flexural crack. Longitudinal Bars and Stirrups When the beam was autopsied, both the longitudinal bars and stirrups were found to have considerable corrosion (See Figure 5.29). The longitudinal bars were found to be pitted and have cross-sectional area loss near the locations of the flexural cracks in the ponded region. Significant cross-sectional area loss was also found at the location of the flexural crack just outside the west end of the ponded region. Staining was seen at this crack previously. The worst longitudinal bar damage was at the centerline flexural crack, where one of the #3 bars was reduced to about a 1/4 in. in diameter. At this location the other bar had moderate uniform corrosion. Pitting was also found in areas where there were no flexural cracks, but where longitudinal cracks were located. The stirrups and bars are shown in Figure 5.29, and the corrosion ratings are plotted in Figure 5.28 and summarized in Table Tendon The south duct was fitted with an industry standard splice, while the north duct was not spliced. The top portion of the south duct splice was severely holed and pitted. The bottom portion of the splice was also pitted in some locations. Pitting was also found on the inside of both the top and bottom portions of the splice. Pitting and holes were found on the portion of the south duct directly beneath the splice, with pitting also found on the inside of the duct at this location. 82
99 Side Face Top Surface Beam Centerline Ponded Region Rating Rebar 2 = Both Bars Corroded Away In One Interval Rating = Stirrup Completely Corroded Away Stirrups 365 Rating Location of Duct Splice North Duct South Duct 8171= Duct Completely Corroded Away In one Interval Chloride Content (%) North Grout South Grout.33%=Threshold for Corrosion Rating North Strand South Strand 896= All 7 Wires in All Four Strands Have Severe Pitting In One Interval Figure 5.28: Beam 4.1-Crack Patterns and Corrosion Rating Graphs 83
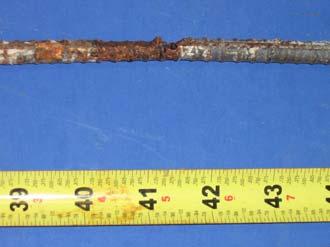

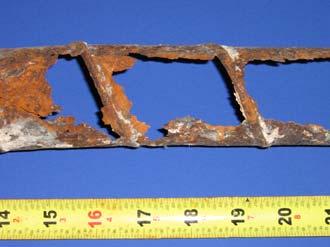

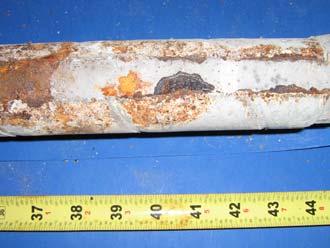
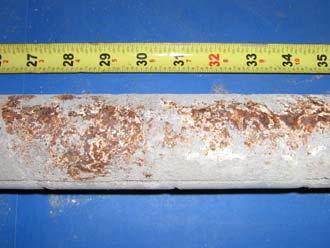

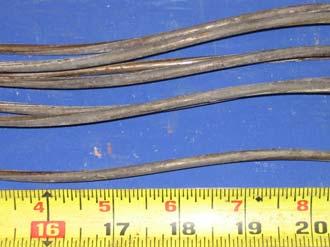
100 Longitudinal Bar Stirrup Top of South Duct Top of North Duct South Duct Grout North Duct Grout South Duct Strand North Duct Strand Figure 5.29: Beam 4.1 Autopsy Elements 84
101 Both ducts were pitted and holed, thus causing large amounts of surface area loss. In the case of the south duct, the surface area loss was concentrated in the area between the western most flexural crack and the centerline flexural crack. Pitting was also found on the inside of the duct in this area. The north duct was only pitted with some minor holes until about the beam centerline, where the top portion of the duct was almost completely corroded away across several inches. The ducts are shown in Figure 5.29, and the corrosion ratings are plotted in Figure 5.28 and summarized in Table Both the south and north grouts were cracked. The south duct grout had a large bleed water void from 3 in. to about 46 in. from the west end of the autopsy area. At its deepest, the void was.25 in. deep. The largest chloride content at strand level for the south duct grout was.4 percent, close to the corrosion threshold for.33 percent. This value was at 6 in. to the west of the beam centerline. The north duct grout had a large bleed water void from 12 to 28 in. (again, in reference to the west end of the autopsy area), and corrosion products were found inside the void. At approximately 12 in. from the east end of the autopsy area, staining was found on the face of one of the transverse cracks. Many small bubbles were found on the top of the grout as well. The highest chloride content measured in the north duct grout was.6 percent, also at 6 in. to the west of the beam centerline. This is far above the threshold of.33 percent. The grout from both beams is shown in Figure The chloride content along the length of the autopsy area for the grout from both ducts is shown in Figure The four strands in the south duct had light to moderate corrosion. The four strands in the north duct had light to moderate corrosion as well. The strand from both ducts is shown in Figure The strand ratings along the length of the beam are shown in Figure 5.28 and are summarized in Table Table 5.13: Beam 4.1 Corrosion Rating Summary Maximum Total Generalized Longitudinal Bars Stirrups North Duct South Duct North Strand South Strand Phase II Beams Beam 2.7 (2/3-PS, Service Load, Epoxy Coated Strands): This beam specimen is of great interest since it had non-flow filled epoxy coated strands expected at the time of construction to greatly improve corrosion resistance. In addition, it is one of the three specimens that had additional saltwater dripping over the anchorage zone. Beam Appearance As shown in Figures 3.4 and 5.29, staining and longitudinal cracking was found in the ponded region. One major area of staining was at the flexural crack at the beam centerline. The other was at the west end of the autopsy area. At this location the staining was concentrated around a flexural crack and where the hole had been drilled to create a grout vent during beam 85
102 construction. The hole had been sealed with epoxy after grouting. Staining was also seen on the flexural crack just to the west of the ponded region. Staining was also seen on the side of the beam corresponding with the location of the centerline flexural crack. The maximum crack width was from a longitudinal crack and measured.14 in. This value was measured near the beam centerline. Very little staining was observed from these longitudinal cracks. Longitudinal Bars and Stirrups Upon autopsy, pitting and large cross-sectional area loss was found on the longitudinal bars and stirrups throughout the ponded region (See Figure 5.31). The worst damage to an individual bar was at 12 in. to the east of the beam centerline. At this location one of the #3 bars was reduced in diameter to.19 in. The stirrups beneath the ponded region were also heavily pitted with large section loss. The stirrup and bar ratings in the autopsy area are plotted in Figure 5.3, and are summarized in Table Tendons Both the north duct and south duct had industry standard splices at the beam centerline. The south duct splice was severely corroded with very large area loss. The top section of the south duct directly beneath the splice was almost completely corroded away. Only fragments were found at the beam centerline. The north duct industry standard splice was also severely corroded. The top portion of the splice was almost completely corroded away, and only fragments were recovered. Both ducts were severely pitted and holed, resulting in large surface area loss, as shown in Figure Starting at approximately 19 in. from the west end of the autopsy area, several in. of the duct were completely corroded away. At approximately 12 in. from the east end of the autopsy area, several in. of duct were also corroded away. Upon inspection of the inside of the bottom of the duct, evidence of abrasion of the epoxy on the strand was found at 14 in. from the west end of the autopsy area. Corrosion deposits, which were likely from the strand, were found in this area. This is shown in Figure This may have occurred at other locations as well, but the severe duct corrosion further east of this location made any other abrasion evidence on the duct impossible to find. The duct damage along the length of the beam is shown in Figure 5.3 and is summarized in Table
103 Side Face Top Surface Beam Centerline Ponded Region Rating Rating Rebar = All 8 Bars Corroded Away In One Interval Stirrups = Stirrup Completely Corroded Away 228 Rating North Duct South Duct Location of Duct Splices 8171= Entire Duct Corroded Away In one Interval Chloride Content (%) North Grout South Grout.33%=Threshold for Corrosion Rating = All 7 Wires in Both Strands Have Severe Pitting In One Interval North Strand South Strand Figure 5.3: Beam Crack Maps and Corrosion Rating Graphs 87


104 Longitudinal Bar Stirrup Top of South Duct Top of North Duct South Duct Grout North Duct Grout South Duct Strand(Coating Removed) North Duct Strand (Coating Removed) Figure 5.31: Beam 2.7 Autopsy Elements (from Center Portion of Beam) 88
 44")
105 Table 5.14: Beam 2.7 Corrosion Rating Summary Maximum Total Generalized Longitudinal Bars Stirrups North Duct South Duct North Strand (Coating Damage) South Strand (Undamaged) The south duct grout had a 3-ft long bleed water void from the far west end of the autopsy area to about 6 in. short of the centerline. In this area, large corrosion deposits from the duct were found in the bleed water void. The grout was cracked at multiple locations, and at the grout crack 12 in. from the east end of the autopsy area, a large amount of staining was found on the crack face. The maximum chloride content found in the south duct was 6 in. west of the beam centerline, where the chloride content was.775 percent. This is very far above the corrosion threshold of.33 percent. The north duct grout had a shallow bleed water void from about 17 to 21 in. west of the end of the autopsy area. From 46 to 48 in., a shallow white-colored void was also observed. Transverse cracks were found at multiple locations, and staining was found at the cracks 25 and 27 in. west of the autopsy area. The grout also had many small bubbles indicating a large amount of porosity. The maximum chloride content was.415 percent, measured at 54 in. from the west end of the autopsy area. This is far above the threshold for corrosion. The grout is shown in Figure 5.31, and the chloride content data is plotted in Figure 5.3. A small amount of epoxy coating on the bottom of the south ducts strands was missing at about 14 in. from the west end of the autopsy area. This confirms the evidence of epoxy abrasion observed on the bottom of the duct. Starting at about 24 in. from the west end of the autopsy area, a large amount of corrosion products as well as damage to the bottom of the strand coating was observed. This is shown in Figure The coating on the strand was then chipped off and the strand examined. The coating seemed very brittle and easily cracked when pierced with a screwdriver. After removal of the coating, large amounts of light to moderate corrosion and mild pitting were found on the strands exterior throughout their length. Moderate pitting was found on one of the wires at 18 in. from the west end of the autopsy area. The strand after removal of the coating is shown in Figure When the strands were unwound, pitting was also found on the center wire of one of the strands. The unwound strand from the south duct is shown in Figure Figure 5.32: Beam 2.7-Evidence of Abrasion of Epoxy Coating from Strand on Bottom of South Duct 89
 and After Removal of Coating (Right) In contrast to the south duct strand, the coating of north duct strand was intentionally damaged by the previous")

106 Figure 5.33: Beam 2.7-South Duct Strand with Coating (Left) and After Removal of Coating (Right) In contrast to the south duct strand, the coating of north duct strand was intentionally damaged by the previous researchers in order to test the effectiveness of epoxy repair kits. As explained in Chapter 2, numerous small holes were made in the epoxy coating on the two strands at five locations: at the beam centerline and four holes at approximately 12 in. spacing to the right and left of the centerline. One of the strands had these holes repaired with a standard epoxy repair kit before installation in the beam. An example of one of the holes is shown in Figure Figure 5.34: Beam 2.7-Example of Strand Coating Damage to North Duct Strand-Patched Strand (Bottom) and Unpatched Strand (Top) Upon autopsy, corrosion deposits were found on the epoxy next to the unpatched holes. Abrasion damage to the epoxy was found 7 in. from the east end of the autopsy area, where the strand actually made contact with the bottom of the duct. Pitting was found on the exposed strand surface at this location. Upon removal of the coating, light corrosion was found adjacent to the hole locations. Mild pitting was found on the west end of the strands, with instances of pitting found on the center wires. Additional instances of mild pitting were found adjacent to the abrasion damage at the east end of the autopsy area. The strand that was patched also had mild pitting on the west and east ends, as well as light to moderate corrosion. Not as many instances of pitting were observed as in the unpatched strand. Abrasion damage was also found at the same location as the other strand. Light corrosion was found in the vicinity of one of the patched holes, but otherwise the exterior of the strand had little corrosion in the vicinity of the other patched holes. The corrosion ratings for the strand are plotted in Figure 5.3 and are summarized in Table 9


107 5.14. The unwound strands are shown in Figure In Figure 5.35, the ratings for the patched and unpatched strand from the north duct are plotted separately. Rating = All 7 Wires in Strand Have Severe Pitting In One Interval Total Rating for Unpatched Strand: 821 Total Rating for Patched Strand: 759 Intentional Coating Damage Locations North Duct Unpatched Strand North Duct Patched Strand Figure 5.35: Beam 2.7- North Duct Strand Damage Ratings As shown in Figure 5.35, the total rating for the unpatched strand was slightly larger than the patched strands. However, there is no significant difference between the ratings for the two strands in the vicinity of the holes. The visual inspection of the strand showed no significant corrosion in the vicinity of four of the five patches on the exterior of the strand. So the performance of the patches is fair. Overall, it would appear that the primary source of moisture ingress for the epoxy-coated strand is from abrasion damage caused by contact between the strand and the bottom of the duct during prestressing. Anchorages As shown in Figure 5.36, the east end anchorage zone, which had been subjected to exposure testing with a saltwater dripper, had a small patch of staining. There was a.5-in. crack found on the grout which formed the pocket. This was likely a shrinkage crack. The west end anchorage, which had not been subjected to a dripper, also had a.5-in. shrinkage crack. As previously stated in Chapter 4, chloride samples revealed no chlorides at the west end, while high chloride content was found at strand tail depth on the east (dripper) end. Approximately 2 ft of each tendon was removed from each end of the beam ends during autopsy. Figure 5.36: Beam 2.7 Anchorage Zones-East End (Left) with Dripper, and West End (Right) without Dripper 91
: North Duct Anchorage (Top, Left and Right), and South Duct Anchorage (Bottom, Left and Right) As shown in Figure 5.")


108 West End Anchorage Zone (No Dripper-Control End) The west end anchorages just after removal from the beam are shown in Figure Figure 5.37: Beam 2.7 West End Anchorages After Removal (Controls): North Duct Anchorage (Top, Left and Right), and South Duct Anchorage (Bottom, Left and Right) As shown in Figure 5.37, the front of the bearing plate and the anchorhead in both tendons were slightly corroded, while the back of the bearing plates showed no corrosion. The fronts of the wedges also showed some slight corrosion as well. The portion of the north duct in the anchorage zone had light corrosion directly underneath the duct tape seal between the duct and the back of the anchorhead. Light corrosion was also found on the inside of the duct surface in this area. Otherwise the rest of the duct showed no evidence of corrosion. The south duct was similar. The ducts are shown in Figure Note that the white substance on the south duct is zinc oxide, which is from the corrosion of the galvanized coating on the duct. The corrosion ratings for the ducts in the anchorage are given in Figure 5.41 and are summarized in Table The north duct grout showed bubbles indicating porosity, but otherwise nothing else significant was observed in the appearance of the grout. Chloride samples of the grout taken at strand depth revealed negligible chloride content from the back of the anchorhead (where the first sample was taken), all the way to end of the portion of the duct removed from the anchorage zone. The south duct grout showed evidence of bleed water accumulation for a length of 1 in. behind the anchorhead. Similar to the north duct grout, negligible chloride content was found at strand depth along the length of the duct at the anchorage. The grout from both ducts is shown in Figure


")


109 South Duct North Duct South Duct Grout North Duct Grout South Strand with Wedges North Strand with Wedges South Duct Strand (Coating Removed) North Duct Strand (Coating Removed) Figure 5.38: Beam 2.7-West End Anchorage Zone (Control) Autopsy Elements 93


 The east end anchorages just after removal from the beam are shown in Figure 5.39. Figure 5.39: Beam 2.")

110 Mostly light to moderate corrosion was found in all the strands from both ducts. However, in the vicinity of where the wedges bit into the epoxy-coated strand, full penetration of the coating was found in all the strands. In the north duct, pitting was found on a single strand on both the center wire as well as some of the outer wires in this vicinity. A single strand in the south duct showed similar mild pitting. The likely source of the corrosion is moisture from the center of the beam that found its way through the interstices into the anchorages. The autopsy elements removed from the anchorage are shown in Figure The strand ratings for the anchorage are given in Figure 5.41 and are summarized in Table East End Anchorage Zone (Dripped End) The east end anchorages just after removal from the beam are shown in Figure Figure 5.39: Beam 2.7 East End Anchorages (Dripped End): North Duct Anchorage (Top, Left and Right), and South Duct Anchorage (Bottom, Left and Right) As shown in Figure 5.39, both bearing plates and the anchorheads were slightly corroded. As shown in Figure 5.4, the ends of three of the four wedges were heavily corroded. One of the wedges in the south duct had pitting on its front surface. The north duct had pitting on its top inside and outside surfaces in the area right behind the bearing plate, with some light corrosion observed on the inside and outside surfaces of the bottom of the duct in this area. All other portions of the duct showed no evidence of corrosion. The south duct had light corrosion on both the top and bottom portions on the inside and outside surfaces. All other parts of the duct showed no evidence of corrosion. The ducts are shown in Figure 5.4. The duct ratings in the anchorage zones are plotted in Figure 5.41 are summarized in Table


 North")


")
111 South Duct North Duct South Duct Grout North Duct Grout South Duct Strand With Wedges North Duct Strand With Wedges South Duct Strand (Coating Removed) North Duct Strand (Coating Removed) Figure 5.4: Beam 2.7-East End Anchorage Zone (Dripped End) Autopsy Elements 95
112 The north duct grout was slightly stained from the pitting corrosion on the inside of the duct. There was evidence of bleed water accumulation directly behind the anchorhead. Further towards the interior of the beam there were very small voids indicating a small amount of bleed water accumulation. The chloride content samples taken at strand level showed negligible chlorides in the grout. The south duct grout showed shallow voids which may have been the result of segregation and/or bleed water accumulation during pumping of the grout. The possibility of segregation is mentioned because the voids did not appear similar to bleed water voids observed previously. A definite bleed water void was seen directly behind the anchorhead. Like the north duct, no chlorides were found at strand depth in the south duct. The grout from both ducts is shown in Figure 5.4. The north duct strand was lightly to moderately corroded throughout the anchorage, including the portion outside the anchorhead. The south duct strand was similar, except there was mild pitting at the tips of one of the strands outside the anchorhead. At this location, five of the six outer wires had moderate pitting, as well as the center wire. Beyond this point, only light to moderate corrosion was found on the center wire. In the case of both the north and south strands, moderate corrosion was observed directly beneath the locations where the wedges bit into the strand and punctured the epoxy coating. The strands are shown in Figure 5.4. The ratings for the strand in the anchorage are shown in Figure 5.41 and are summarized in Table Rating 112= All 7 Wires in Both Strands 1 Have Mild Pitting In One Interval North Strands-Dripped End North Strands-Control End South Strands-Dripped End South Strands-Control Distance From Beam End (in) Rating ` 32 = Corrosion Completely Covers All Duct Surfaces In One Interval North Duct-Dripped End North Duct-Control End South Duct-Dripped End South Duct-Control End Distance From Beam End (in) Figure 5.41: Beam 2.7-Corrosion Rating Graphs for Anchorages In Figure 5.41, the corrosion ratings for both the ducts and strand for the west end and east end anchorages are shown plotted together for comparison. Note that Distance from Beam End is the distance from the respective end of the beam for each respective anchorage. Because the corrosion from the center of the beam spread to both anchorages, in order to detect any corrosion caused by the end dripper, the data from the dripped end is compared to the control end 96
113 to see if there is any increase in corrosion between the two. Thus it is assumed that the corrosion from the center of the beam had an equal effect on both ends of the beam. In Table 5.15, the corrosion ratings for both anchorages are summarized. Table 5.15: Beam 2.7-Corrosion Rating Summary for Anchorages Dripped End Control End Maximum Total Maximum Total North Duct South Duct North Strand South Strand By comparing the data from each tendon in Figure 5.41 and Table 5.15, there is no overall trend between the total strand damage and whether the anchorage has a dripper or not. The corrosion on the strand in the south duct did increase dramatically at the very end of the beam. But since this was observed on both ends of the beam, it cannot be attributed to the dripper. It is likely that what occurred in both ducts is that the large chloride/moisture ingress from the severe corrosion at the center of the beam found its way to the anchorages by way of the strand interstices, since the anchorage is only 7 ft, 6 in. from the central area of the beam, where, as previously mentioned, very large chloride contents were observed. This is also supported by the fact that no chlorides were found in the grout in the tendons within the anchorage. Subsequently, the effect on the strand from the moisture/chloride ingress from the beam centerline made the chloride ingress caused by the dripper negligible. In contrast, both Figure 5.41 and Table 5.15 clearly demonstrate that the duct damage did increase with the presence of the dripper. All of the major corrosion observed in the ducts was in the vicinity of the duct tape seal or slightly closer to the anchorhead. This is also the location where the steel collar at the back of the anchorhead comes into contact with the galvanized duct. The corrosion was located right inside this area. Therefore, it is possible that a form of galvanic or two metal corrosion has taken place, which is when two dissimilar metals are placed together and one of them is corroded due to the difference in electrochemical potential between the two metals. 24 However, in order for this to occur, the two metals must already be in a corrosive environment. At the control end, bleed water accumulation from behind the anchorhead may have helped initiate this. Meanwhile, at the dripper end, the same occurred but in addition, small amounts of chloride ingress from the dripper may have helped accelerate the galvanic corrosion process, resulting in greater corrosion than the control end. These chlorides may have found their way through the anchorhead and on to the duct surface. However, the chlorides may not have reached the actual level of the strands within the grout. This would explain the lack of chlorides at the level of the strands at the dripped end Beam 2.8 (2/3-PS, Service Load, Galvanized Strand): This beam specimen is of great interest since it had galvanized strands expected at the time of construction to greatly improve corrosion resistance. Beam Appearance As shown in Figure 5.42, there was substantial longitudinal cracking. As observed in all the other loaded beams, the flexural cracks corresponded with stirrup locations. The maximum 97
114 crack width was from one of the longitudinal cracks in the ponded region, near the centerline. The crack measured nearly.115 in. in width. There was heavy staining at the beam centerline around one of the longitudinal cracks. Patches of staining were also seen outside the ponded region as well. Longitudinal Bars and Stirrups Once the beam was autopsied, pitting and cross-sectional area loss were found on the longitudinal bars and stirrups in the ponded region (See Figure 5.43). The worst reinforcing bar damage was 1 in. to the west of the beam centerline, where one of the #3 bars was completely corroded away in one interval. This corresponded to a flexural crack location. The most corroded stirrup was that at the beam centerline. Here the stirrup was heavily pitted, and at one location the stirrup bar diameter was reduced from 1/2 in. to 3/8-in. The stirrups and bars are shown in Figure 5.43, with the corrosion ratings shown in Figure 5.42 and summarized in Table Tendons The splice configuration in this beam was an industry standard splice on the north duct at the beam centerline, with a heat shrink splice on the south duct also located at the beam centerline. As shown in Figure 5.44, the south duct heat shrink splice had a large amount of corrosion deposits on both the inside and outside surfaces, with the duct portion beneath the splice heavily pitted. The top portion of the industry standard splice was essentially corroded away, with a pitted fragment recovered. In this case the heat shrink splice was certainly superior. Both ducts were heavily pitted and holed and thus had large surface area loss. The top portion of both north and south duct were nearly corroded away at places as shown in Figure The duct corrosion ratings along the length of the beam are shown in Figure 5.42 and are summarized in Table The south duct grout had multiple large bleed water voids. The largest was at 26 in. to the west of the beam centerline. The bleed water void at this location was nearly 3/4 in. wide. The grout was also transversely cracked, with staining found on several crack faces. The maximum chloride content measured in the north duct grout was.662 percent, far above the threshold for corrosion of.33 percent. This was measured 12 in. to the east of the beam centerline. The north duct grout had two large bleed water voids. The largest was 8 in. long and 1.25 in. wide and was just west of the beam centerline. Here duct corrosion products were found in the void. The north duct grout was transversely cracked in multiple locations with staining found on some crack surfaces. The largest chloride content found in the north duct grout was.25 percent, at 6 in. west of the beam centerline. This value is, again, far above the threshold for corrosion. The grout from both ducts is shown in Figure 5.43, and the chloride contents are plotted in Figure
115 Side Face 2.2 Beam Centerline W Top Surface Ponded Region E Rating Rating = All 8 Bars Corroded Away In One Interval 2246 Rebar 9 = Stirrup Completely Corroded Away Stirrups Rating North Duct South Duct 8171= Entire Duct Corroded Away In one Interval Location of Duct Splices Chloride Content (%) North Grout South Grout.33%=Threshold for Corrosion Rating = All 7 Wires in Both Strands Have Severe Pitting In One Interval North Strand South Strand Figure 5.42: Beam 2.8-Crack Patterns and Corrosion Rating Graphs 99


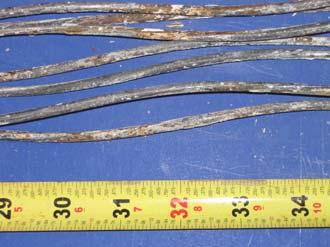
116 Longitudinal Bar Stirrup Top of South Duct Top of North Duct South Duct Grout North Duct Grout South Duct Galvanized Strand North Duct Galvanized Strand Figure 5.43: Beam 2.8 Autopsy Elements 1


117 Figure 5.44: Beam 2.8 Duct Splices-South Duct Heat Shrink Splice (Left) and North Duct Industry Standard Splice (Right) Table 5.16: Beam 2.8 Corrosion Rating Summary Maximum Total Generalized Longitudinal Bars Stirrups North Duct South Duct North Strand South Strand The two south duct galvanized strands had a wide range of corrosion. Both strands were discolored with instances of light to moderate corrosion. There were some instances of mild pitting on only a few wires. Whitish powder, likely zinc oxide, was found in the interstices between several of the wires. The amount of discoloration in the galvanized strand is shown in Figure Here, new galvanized strand, which was in environmentally controlled storage at FSEL, is shown with the galvanized strand removed from the beam. The north duct strand was similar but with many more instances of mild pitting in multiple locations. The strand from both ducts is shown in Figure 5.43, while the corrosion ratings along the length of the autopsy area are shown in Figure 5.42 and are summarized in Table Figure 5.45: Autopsied Galvanized Strand (Bottom) versus New Galvanized Strand (Top) 11
118 It is significant that pitting and other heavy corrosion was found on the galvanized strand. The overall discoloration of the strand as well as the presence of zinc oxide suggests that the zinc coating had almost corroded away on all the strands, and that the actual steel in the strand was under attack. This is similar to what occurred to the galvanized ducts, where the galvanization only delayed the onset of corrosion in the actual steel Beam 2.9 (2/3-PS, Service Load, Poor Grouting Procedures): Beam Appearance As shown in Figure 5.46, there was extensive longitudinal cracking in the ponded region. The largest crack width was recorded near the centerline of the beam, where one of the longitudinal cracks was.9 in. in width. Longitudinal Bars and Stirrups Upon autopsy of the center portion of the beam, large amounts of pitting and crosssectional area loss were found on all longitudinal bars and stirrups (See Figure 5.47). In some instances, the #3 longitudinal reinforcing bars were completely corroded away for several in. of length. This occurred over a broad area centered about 18 in. west of the beam centerline, where in one 2-in. interval two of the #3 bars were completely corroded away. Loss of bar lengths also occurred intermittently in an area about 18 in. long, which was just to the east of the beam centerline. Again, in this area two of the four #3 bars were completely corroded away for several 2-in. intervals. The worst stirrup damage was just outside the east end of the ponded region, corresponding to a location of heavy staining. The stirrup at this location suffered significant section loss in several 2-in. intervals and was also heavily pitted. The stirrups and bars are shown in Figure 5.47, while the corrosion ratings for the stirrups and bars within the autopsy area are plotted in Figure 5.46 and are summarized in Table Tendons Both ducts were spliced with industry standard splices at the beam centerline. Both splices suffered tremendous section loss to their top portions. Only a 3-in. long fragment remained of the top portion of the south duct splice. The bottom portion had very large holes in it. As shown in Figure 5.47, both ducts had large surface area loss. The tops of the ducts had virtually disappeared in some areas. The duct corrosion ratings along the length of the beam are shown in Figure 5.46, are summarized in Table
119 Side Face W Top Surface Beam Centerline E Ponded Region Rating = All 8 Bars Corroded Away In One Interval Rebar Rating Stirrups = Stirrup Completely Corroded Away North Duct South Duct 8171= Entire Duct Corroded Away In one Interval Location of Duct Splices Rating Chloride Content (%) North Grout South Grout.33%=Threshold for Corrosion Rating = All 7 Wires in Both Strands Have Severe Pitting In One Interval North Strand South Strand Figure 5.46: Beam 2.9-Crack Patterns and Corrosion Rating Graphs 13


 14")
120 Longitudinal Bar Stirrup Top of South Duct Top of North Duct South Duct Grout North Duct Grout South Duct Strand North Duct Strand Figure 5.47: Beam 2.9 Autopsy Elements (from Center of Beam) 14
121 Table 5.17: Beam 2.9 Corrosion Rating Summary Maximum Total Generalized Longitudinal Bars Stirrups North Duct South Duct North Strand South Strand As described in Chapter 2, this beam was intended to be used to evaluate the effect of poor grouting procedures. The poor procedures included delays of up to 1 minutes during pumping of the grout, letting air into the pump, and capping the grout vents at the first sign of grout at the vents. Upon autopsy of the tendons, the south duct grout was found to have larger surface bubbles than compared to the beams with the proper grouting procedures. Bleed water voids of various sizes were present, and some evidence of segregation of the grout mix was found when examining the faces of the transverse cracks in the grout. This may have been caused by the 1-minute delays in pumping. Many of these transverse crack faces were also heavily stained. An example of the segregation and staining is shown in Figure Note the small bleed water voids at the tops of the grout sections. The maximum chloride content measured in the north duct was.267 percent; this was at the extreme east end of the autopsy area. The north duct was similar, with a large bleed water void near the beam centerline, which was 1 in. wide and almost 1/2 in. deep. The maximum chloride content measured in the north duct was.245 percent and was located 12 in. to the east of the beam centerline. Thus the maximum chloride content for both ducts was far above the threshold for corrosion. The grout from both ducts is shown in Figure The chloride content in the grout along the length of the autopsy area is plotted in Figure The two south duct strands had instances of light to moderate corrosion throughout, with some instances of mild and moderate pitting found on one strand in a zone about 2 in. long at the east end of the autopsy area. Here mild pitting was found on some wires, with one case of moderate pitting on one wire at 16 in. to the east of the beam centerline. The other strand had only two instances of mild pitting. One was at the beam centerline and the other was about 18 in. to the west of the beam centerline, in the same general vicinity as was the moderate pitting found on the other strand in the duct. Both strands in the north duct had mild pitting in the same general areas as the south duct strands, but no instances of moderate pitting were found in either of the strands. The strand is shown in Figure 5.47, and the corrosion ratings for the strand in the autopsy area are given in Figure 5.46 and are summarized in Table When the study was initiated it was thought that the poor grouting practices in this specimen might result in dramatically worse corrosion. However, as will be shown in Chapter 6, the overall poor performance of the metal duct overshadowed many other factors leading to poor performance. Anchorages As shown in Figure 5.48, there were.5-in. wide shrinkage cracks on both ends of the beam, where the anchorage pockets had been backfilled. On the east (dripped) end anchorage, there was a large patch of staining right beneath where the saltwater exited from the dripper. 15
 with Dripper, and West End (Right) Without Dripper")

, and South Duct Anchorage (Bottom, Left and Right) As shown in Figure 5.")


122 Figure 5.48: Beam 2.9 Anchorage Zones-East End (Left) with Dripper, and West End (Right) Without Dripper West End Anchorage Zone (No Dripper-Control End) The west end anchorages after removal from the west end of the beam are shown in Figure Figure 5.49: Beam 2.9 West End Anchorages (Controls) After Removal-North Duct Anchorage (Top, Left and Right), and South Duct Anchorage (Bottom, Left and Right) As shown in Figure 5.49, the front of the bearing plate and anchorhead in both tendons were only slightly corroded. The fronts of the wedges also showed slight corrosion as well. The portion of the north duct in the anchorage zone had moderate corrosion on its outside surface inside the duct taped connection between the back of the bearing plate and the duct. Otherwise, no other evidence of corrosion was found on the north duct. The south duct had moderate corrosion in the same location as the north duct, and, some small instances of light corrosion were found on the inside of the duct as well, near where the duct met the bearing plate. The 16
123 corrosion ratings for the ducts in the anchorage are given in Figure 5.53 and are summarized in Table The ducts removed from this anchorage are shown in Figure 5.5. Note that in the latter figure the duct is shown next to the top half of the back of the bearing plate, which it was in contact with during the test. Notice that there are corrosion deposits on that component from the corrosion of the duct. The north duct grout showed evidence of bleed water accumulation just behind the anchorhead and deep, but small in diameter, bubbles in the top of the grout. Negligible chlorides were found at the level of the strand in the grout. The south duct had a transverse crack at about 18 in. from the back of the anchorhead. However, the south duct grout did not have the deep bubbles that the north duct grout had. No evidence of bleed water accumulation was found behind the anchorhead in this duct. Similar to the north duct grout, the south duct grout had negligible chlorides at the level of the strands. The grout from both ducts is shown in Figure 5.5. Light to moderate corrosion was found on the strands in the north and south ducts in the anchorage zone. Most of the moderate corrosion was concentrated in the interstices, but in the south duct strands, moderate corrosion was observed on the outside of the strand at the ends of both tendons outside the anchorhead. The likely source of this corrosion is that corrosion from the center of the beam spread through the interstices down to the anchorages. No corrosion was found where the wedges bit into the wires. The strands from both ducts in the west end anchorage are shown in Figure 5.5. The strand ratings in the anchorage are given in Figure 5.53 and are summarized in Table East End Anchorage Zone (Dripped End) The east end anchorages after removal from the beam are shown in Figure As is evident by comparison of Figure 5.51 with Figure 5.49, in the case of both tendons more corrosion was found on the face of the bearing plate and anchorhead at the dripped end of the beam than at the control end. However, there was no evidence of corrosion in the area behind the bearing plate. The outside of the top portion of the south duct had severe corrosion in the vicinity of the duct tape connection and instances of light corrosion on both the outside and inside of the bottom portion of the duct right at the end of the duct at the anchorhead. Light corrosion was also found underneath the duct tape at the duct/bearing plate interface. It is known from the aforementioned industry standard splices that duct tape does not act as an effective barrier for moisture ingress. But the absence of corrosion on the exposed portion of the duct behind this area suggests that failure of the duct tape was not the likely culprit for the corrosion on the duct behind the anchorhead. The outside of the north duct had light corrosion at the end of the duct behind the anchorhead, on the top surface. At the same end of the duct, light corrosion was found on the outside of the bottom surface of the north duct. The ducts from the anchorage are shown in Figure The corrosion ratings for the ducts in the anchorages are given in Figure 5.53 and are summarized in Table The south duct grout was cracked in a similar fashion to the grout at the center of the beam. No evidence of staining was found on the crack faces. The north duct grout was also cracked, but again, no evidence of staining was observed on the crack faces. In both ducts the grout chloride content at strand depth was negligible. The grout from both ducts in the anchorage is shown in Figure


124 Top of South Duct Top of North Duct South Duct Grout North Duct Grout South Duct Strand With Wedges North Duct Strand With Wedges South Duct Strand North Duct Strand Figure 5.5: Beam 2.9-West End Anchorage Zone (Control) Autopsy Elements 18
-North Duct Anchorage (Top, Left and Right), and South Duct Anchorage (Bottom, Left and Right) Moderate corrosion")


125 Figure 5.51: Beam 2.9 East End Anchorages (Dripped End)-North Duct Anchorage (Top, Left and Right), and South Duct Anchorage (Bottom, Left and Right) Moderate corrosion was found on all the strand wires in both ducts. Behind the anchorhead the moderate corrosion was generally found in the interstices. However, in front of the anchorhead, instances of moderate corrosion were found on the outside of the strands in both ducts. No evidence of corrosion was found inside the bite marks caused by the wedges in either duct. The strand from both ducts is shown in Figure The strand ratings for the anchorages are given in Figure 5.53 and are summarized in Table In Figure 5.53, the corrosion ratings for the ducts and strands in both the end anchorage zones are plotted. This data is also summarized in Table The data from both ends are plotted together so that a direct comparison can be made between the control end and the dripped end. The x axis value Distance From Beam End is the distance from the respective ends of the beam for each anchorage element. For this analysis it is assumed that the corrosion at the center of the beam had an equal effect on both end anchorages. 19


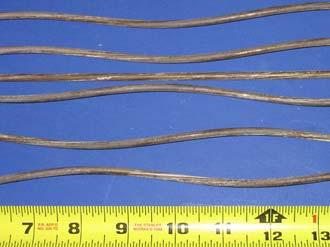

126 South Duct North Duct South Duct Grout North Duct Grout South Duct Strand North Duct Strand With Wedges South Duct Strand North Duct Strand Figure 5.52: Beam 2.9-East End Anchorage Zone (Dripped End) Autopsy Elements 11
127 Rating 112= All 7 Wires in Both Strands 1 Have Mild Pitting In One Interval North Strands-Dripped End North Strands-Control End South Strands-Dripped End South Strands-Control Distance From Beam End (in) Rating = Corrosion Completely Covers All Duct Surfaces In One Interval North Duct-Dripped End North Duct-Control End South Duct-Dripped End South Duct-Control End Distance From Beam End (in) Figure 5.53: Beam 2.9-Corrosion Rating Graphs for Anchorages In Figure 5.53 there is no increase in strand corrosion at the very ends of the beam (which is on the x axis) in either the dripped end of the beam or the control end of the beam. However, from the same plot and from Table 5.18, an increase in the total strand corrosion for both ducts between the dripped and the control end is apparent. In the case of the ducts the significant corrosion was found at the bearing plate/duct interface. As demonstrated in Beam 2.7 (Epoxy Coated Strand), the corrosion of the duct at its interface with the bearing plate is likely a form of galvanic corrosion. In Figure 5.53 and Table 5.18 it is clear that the corrosion in the ducts is greater in the end with the dripper. It is possible that chlorides entered through the strand holes in the anchorhead. While this did not penetrate the grout deep enough to produce significant chloride content at the level of the strand in the grout, it still may have found its way to the interface between the galvanized steel of the duct and the regular steel of the anchorhead. The presence of these chlorides would then accelerate the galvanic corrosion process between the galvanized duct and the steel bearing plate. Table 5.18: Beam 2.9-Corrosion Rating Summary for Anchorages Dripped End Control End Maximum Total Maximum Total North Duct South Duct North Strand South Strand
128 Beam 2.1 (2/3-PS, Service Load, Anti-Bleed Grout): Beam Appearance As shown in the crack maps in Figure 5.54, there was heavy longitudinal cracking in the ponded region. The largest crack width was.94 in. and was measured at one of the longitudinal cracks near the beam centerline. There were a few small patches of staining outside the ponded region, but no wide longitudinal cracking. Longitudinal Bars and Stirrups Upon autopsy of the beam, pitting and cross-sectional section loss was found on the stirrups and longitudinal bars (See Figure 5.55). The worst longitudinal bar corrosion was at 16 in. to the west of the beam centerline, where one of the #3 bars was reduced in diameter to.25 in. In the same location, the four #4 bars also had considerable area loss. The most highly corroded stirrup was also in this vicinity and had a reduction in diameter from.5 in. to.4 in. The stirrup and longitudinal bar corrosion ratings are given in Figure 5.54 and are summarized in Table Tendons Both ducts were spliced at the beam centerline. Both splices were industry standard splices, and were heavily corroded. The top portion of the south duct splice was almost completely corroded away. The top portion of the duct beneath it was nearly corroded away. As shown in Figure 5.55, both ducts were heavily pitted with large surface area loss. Corrosion rating graphs for the ducts are given in Figure 5.54 and are summarized in Table Both the south duct grout and north duct grout were an anti-bleed grout mix designed by Schokker. 2.The grout mix was described in Chapter 2. Upon autopsy of both tendons, a large degree of segregation was found in the grout in both ducts. This resulted in shallow voids that ran almost the entire length of the autopsied ducts. Therefore, it appears that the anti-bleed admixture did not fully engage. When viewing the cross section of the grout (see Figure 5.55), directly beneath the shallow void was a distinct layer of more whitish grout, then grout which was more normal in appearance. The grout at the level of the strands appeared to be better quality than that seen with the grout in the other autopsied beams. The segregation and thus the anti-bleed admixture not engaging may have been caused by the mixing method used, which was mixing the grout for a short period in a bucket with a hand mixer instead of using a dedicated grout mixer/pump assembly. In the south duct, the maximum chloride content at strand level was.162 percent, which was at 36 in. from the west end of the autopsy area. This is far above the threshold of.33 percent. The maximum chloride content in the north duct was.6 percent, which was at 18 in. from the west end of the autopsy area. The chloride contents in the grout in the autopsy area are plotted in Figure This determination was based on consultation with Dr. Andrea Schokker of Pennsylvania State University 112
129 Side Face 2.2 Beam Centerline W Top Surface Ponded Region E Rating Rating Rebar = All 8 Bars Corroded Away In One Interval 9 = Stirrup Completely Corroded Away Stirrups Rating North Duct South Duct 8171= Entire Duct Corroded Away In one Interval Location of Duct Splices Chloride Content (%) North Grout South Grout.33%=Threshold for Corrosion Rating = All 7 Wires in Both Strands Have Severe Pitting In One Interval North Strand South Strand Figure 5.54: Beam 2.1-Crack Patterns and Corrosion Rating Graphs 113
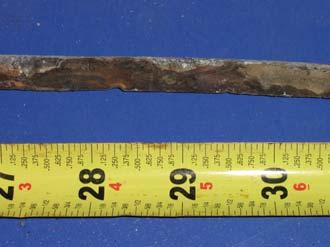
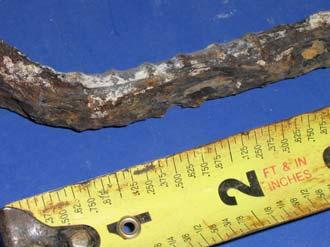

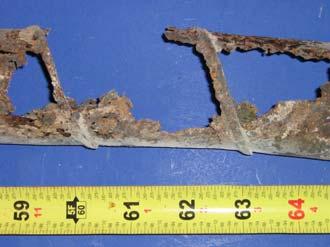
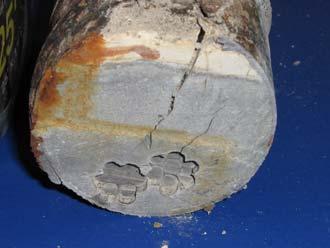


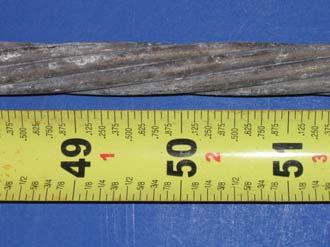
130 Longitudinal Bar Stirrup Top of South Duct Top of North Duct South Duct Grout North Duct Grout South Duct Strand North Duct Strand Figure 5.55: Beam 2.1 Autopsy Elements 114
131 Table 5.19: Beam 2.1 Corrosion Rating Summary Maximum Total Generalized Longitudinal Bars Stirrups North Duct South Duct North Strand South Strand The south duct strand had light to moderate corrosion, with a few instances of pitting at 14 and 26 in. from the west end of the autopsy area. The north duct strand also had light to moderate corrosion, but with no pitting. The strands from both ducts are shown in Figure 5.55, with the corrosion ratings plotted in Figure 5.54 and summarized in Table Beam 2.12 (2/3-PS, Service Load, Plastic Duct): This beam specimen is of great interest since it is the only one of the large beam exposure specimens from the original Project -145 that was cast with plastic ducts (quite an innovation at the time of casting this specimen in 1998, only a decade ago.) Because of the relatively small size of the specimen, the most feasible available system was one commercially available for deck post-tensioning use. This system is not as robust as present day systems used in post-tensioned girders. A large number of beam specimens with much more robust plastic ducts are currently undergoing exposure testing in a continuation of this project. 2 Table 5.2: Beam 2.12 Corrosion Rating Summary Maximum Total Generalized Longitudinal Bars Stirrups North Duct (Plastic Duct) N/A N/A N/A South Duct (Plastic Duct) N/A N/A N/A North Strand South Strand Beam Appearance As shown in the crack patterns in Figure 5.56, wide longitudinal cracks were seen on the top surface of the beam within the ponded region, with staining also emerging from the flexural cracks on the side of beam. The largest amount of staining on the top of the beam was centered around the intersection of the centerline flexural cracks and the pair of wide longitudinal cracks that ran the length of the ponded region. The largest overall crack width was at 14 in. east of the centerline, where one of the longitudinal cracks was.13 in. in width. 115
132 Side Face W Top Surface Beam Centerline E Ponded Region Rating 8 = All 8 Bars Corroded Away In One Interval Rebar Rating Stirrups = Stirrup Completely Corroded Away 3659 Chloride Content (%) North Grout South Grout.33%=Threshold for Corrosion Rating = All 7 Wires in Both Strands Have Severe Pitting In One Interval North Strand South Strand Location of Duct Damage Figure 5.56: Beam 2.12-Crack Patterns and Corrosion Rating Graphs (Center Portion of Beam) 116


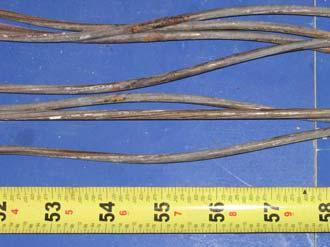
133 Longitudinal Bar Stirrup South Duct North Duct South Duct Grout North Duct Grout South Duct Strand North Duct Strand Figure 5.57: Beam 2.12 Autopsy Elements (Center Portion of Beam) 117

134 Longitudinal Bars and Stirrups All longitudinal bars and stirrups were pitted with large amounts of cross-section loss (See Figure 5.57). The worse longitudinal bar damage was in an area about 18 in. to the west of the beam centerline, where nearly 6 in. of two of the #3 bars were completely corroded away. The worst stirrup damage was at 12 in. to the east of the beam centerline, where the top portion of the stirrup had its diameter reduced from 1/2 in. to around.375 in. The longitudinal bars and stirrups are shown in Figure The corrosion ratings for the bars and stirrups are plotted in Figure 5.56 and are summarized in Table 5.2. Tendons The ribbed plastic ducts were continuous in both ducts, so no splices were present to be evaluated. During the breaking up of the block from the beam centerline, it was found that bracing bars had been placed across the bottoms of the stirrups during construction to hold the ducts up. The ducts had then been tied to these bars. This is shown in Figure Note that the block is upside down, so the surface on the bottom of the block, facing the ground, was where the saltwater was ponded upon during exposure testing. Figure 5.58: Beam 2.12 During Autopsy At multiple locations, including all the stirrup locations, heavy corrosion deposits were seen on the top of the plastic ducts along the length of the autopsy block. Once the ducts were opened, evidence of abrasion was found between the strand and the bottom of the ducts. The abrasion was in the form of deep gouges in the bottom of the duct (See Figure 5.59). The damage was similar to fretting. At a point 12 in. to the west of the beam centerline (54 in. on the corrosion rating graphs), a small hole was found on the bottom of the north duct inside one of these gouges, with corrosion products inside. This was directly over one of the bracing bars, which contributed to the damage. Corrosion products were found on the outside of the duct in this area. Severe pitting was found on the strand wire surface that had caused this gouge. Mild pitting was found on two other wires in this vicinity. The other strand in the north duct had mild to moderate pitting on three wires at the same location. Mild pitting was also found on the center wire of this strand, suggesting that the chlorides that had entered the duct had made their way into the interstices of the strand. While at first the remainder of the strand appeared unaffected on the outside, once the strand was unwound moderate corrosion was found on all wires in both strands for rest of the autopsy area. This damage to the north duct is shown in Figure
 and Strand from Same Location (Right) Very small cracking was found in one of the strand gouges on the bottom of the south duct in the exact same")

135 Figure 5.59: Beam 2.12-Abrasion Damage to Interior of North Duct (Left) and Strand from Same Location (Right) Very small cracking was found in one of the strand gouges on the bottom of the south duct in the exact same location along the length of the beam as the damage to the north duct. This resulted in basically the same situation as that in the north duct. Corrosion products were found in the gouge where the crack was located and mild to moderate pitting was found on three of the outer strand wires, with moderate pitting found on the center wire as well. The other strand had mild pitting on two of its wires in the same area. The strand from both ducts is shown in Figure 5.57, with the corrosion ratings for the strand shown in Figure 5.56 and summarized in Table 5.2. Corrosion ratings for the ducts are not plotted because the ducts are plastic. However, the location of the damage to the ducts is marked on the plot of strand rating. An explanation for this damage is as follows: when the strand was prestressed, it actually pushed down onto the duct, causing damage similar to fretting. Consequently, at a point 12 in. to the west of the beam centerline, the plastic ducts had been squeezed between the strand and the bracing bar, and as a result the ducts failed mechanically. This damage must have occurred right when the beams were prestressed, even before exposure testing began. As shown in Figure 5.56, once the beam was loaded a flexural crack formed at the point where the ducts were damaged, since a stirrup was located there. Chlorides in the salt bath found their way through the flexural crack and corroded the bracing bar that held the ducts up. The corrosion then spread through the holes in the duct into the strand. As seen in Figure 5.57, both ducts were well grouted. The bleed water accumulated on the peaks of the ribs along the length of the duct, preventing large bleed water voids from forming, as seen in the galvanized ducts. The evidence for bleed water accumulation at the peaks of the ducts was large bubbles on the tops of many of the ribs. Negligible chlorides were found in the grout right at the level of the strand. This is surprising considering the aforementioned damage to the duct. What likely happened was the chlorides entered the strands directly and did not absorb into the grout. This is also likely because obviously there was no grout between the damaged areas of the ducts and the strand, so unlike typical strand damage seen in the other autopsies, the chlorides did not have to pass through the grout to get to the strand. The chloride contents along the length of the ducts in the autopsy area are shown in Figure Anchorages As shown in Figure 5.6, there was staining on the dripped end of the beam where the saltwater had exited from the dripping system. There was no staining on the west end anchorage. No shrinkage cracks were seen on the grout pockets in either anchorage zone. 119
 and West End")

-South Duct Anchorage (Top, Left and Right)")


136 Figure 5.6: Beam 2.12 Anchorage Zones: East End Anchorage With Dripper (Left) and West End Anchorage Without Dripper (Right) West End Anchorage Zone (Control End) The west end anchorages just after removal from the beam are shown in Figure Figure 5.61: Beam 2.12 West End Anchorages (Control End)-South Duct Anchorage (Top, Left and Right) and North Duct Anchorage (Bottom, Left and Right) In Figure 5.61, the entire south duct anchorage is shown with the grout cap removed and the grout underneath revealed. The damage to the grout cap occurred during its removal from the anchorhead. The photograph to the right is the face of the anchorhead after the grout was removed. The corrosion seen on both anchorheads is just outside the perimeter of the seal of the rubber ring behind the grouting cap. This corrosion may have caused by bleed water trapped in this area. However, within the perimeter of the seal, the anchorhead had no corrosion and the 12
137 outside of the strands and wedges were nearly pristine in appearance. When the collars behind the anchorheads were opened, the area beneath them was found to be filled with grout and in good condition. The portion of the south duct and north ducts within the anchorage were in good condition. Some evidence of strand abrasion was found on both ducts, but no punctures or cracks were found in the ducts. The duct portions from the anchorage are shown in Figure Corrosion damage ratings for the ducts are not plotted because they are plastic. Both ducts were well grouted, and no evidence of bleed water accumulation was found. The grout completely filled the end caps in both ducts, and as previously mentioned, filled the area under the collar. Chloride content testing of the grout in both ducts showed negligible chlorides. Grout from the caps and the collars also showed negligible chlorides. The grout from both ducts is shown in Figure The exterior of the strands from both ducts were in excellent condition, but when the strands were unraveled, light to moderate corrosion was found in the interstices throughout the anchorage. What likely occurred was corrosion from the center of the beam spread down the length of the strand through the interstices. The wedges from both ducts had only some instances of slight discoloration inside the anchorhead. The strand from the anchorage is shown in Figure The strand corrosion ratings in the anchorage are plotted in Figure 5.66 and are summarized in Table

")


")

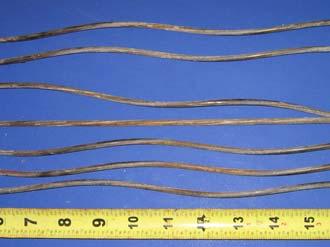
138 South Duct North Duct South Duct Grout Cap North Duct Grout (From Bottom) South Duct Strand with Wedges North Duct Strand with Wedges South Duct Strand North Duct Strand Figure 5.62: Beam 2.12 West End Anchorage (Control End) Autopsy Elements 122


-South Duct Anchorage (Top, Left and")
139 East End Anchorage (Dripped End) During autopsy of the end block containing the east end anchorages, moderate corrosion was found on the stirrups above the cracks in the anchorage as mentioned previously. The stirrup is shown in Figure Figure 5.63: Beam 2.12-Corroded Stirrup in East End Anchorage Zone (Dripped End) The stirrup was likely corroded by saltwater splash from the drip pan when the dripper system was run, since the crack was directly beneath the stirrup and above the drip pan for the saltwater. The east end anchorages are shown in Figure Figure 5.64: Beam 2.12 East End Anchorages (Dripped End)-South Duct Anchorage (Top, Left and Right), and North Duct Anchorage (Bottom, Left and Right) 123
140 As shown in Figure 5.64, the north duct anchorhead and bearing plate had some corrosion, while in the case of the south duct there was very little corrosion on the bearing plate or the anchorhead. The north duct anchorhead had corrosion around the o-ring seal, like the anchorages from the other end of the beam. However, the south duct anchorhead had no such corrosion. In the case of both ducts the strand and wedges appeared to be in pristine condition at the anchorhead. When the collars behind the bearing plates were removed, no significant corrosion was found on the bearing plates beneath the collars. Both the north and south duct portions in the anchorage zone were in good condition. Evidence of abrasion in the plastic duct was found where the strands were in contact with the ducts, but no cracks or holes were found in the ducts. The ducts from the anchorage are shown in Figure Both ducts were well grouted at the anchorage. Very small bleed water voids were seen at some of the peaks of the duct ribs, similar to what occurred in the center of the beam. Grout also completely filled the end cap and the area beneath the collar in the south duct. There was a small void at the top of the cap in the north duct cap. The area beneath the collar was completely filled with grout in the north duct. Chloride content testing of the grout from the cap and collar as well as the duct showed negligible chlorides in both the north and south tendons. The grout from both tendons is shown in Figure The strands in both ducts had light to moderate corrosion, with the corrosion essentially only in the interstices, similar to the strand from the control end of the beam. The wedges in both ducts only had some very light corrosion. The strands from the anchorage are shown in Figure The corrosion ratings for the strand in the anchorages are plotted in Figure 5.66 and are summarized in Table In Figure 5.66, the strand corrosion ratings are plotted. Data from both beam ends are plotted together so that a comparison can be made between the dripped end and control end of the beam. It is assumed that the influence of the corrosion of the strands at the center portion of the duct had the same influence on either beam end. The x value Distance From Beam End indicates the distance from the respective beam end. The corrosion ratings for the anchorages are summarized in Table


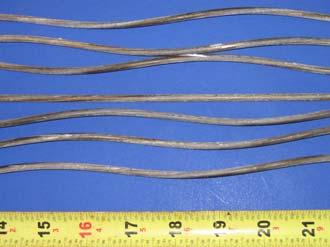
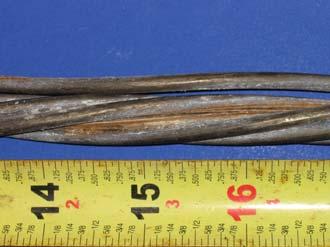
141 South Duct North Duct South Duct Grout North Duct Cap South Duct Strand with Wedges North Duct Strand with Wedges South Duct Strand North Duct Strands Figure 5.65: Beam 2.12 East End Anchorage Zone (Dripped End) Autopsy Elements 125
Copyright By Gregory Paul Turco 2007
 Copyright By Gregory Paul Turco 2007 Durability Evaluation of Post-Tensioned Concrete Beam Specimens After Long-Term Aggressive Exposure Testing by Gregory Paul Turco, B.S. Thesis Presented to the Faculty
R. M. Salas, J. S. West, A. J. Schokker, J. E. Breen, and M. E. Kreger Research Report
 Technical Report Documentation Page 1. Report No. 2. Government Accession No. 3. Recipient s Catalog No. FHWA/TX-4/-145-8 4. Title and Subtitle 5. Report Date Long-Term Post-Tensioned Column Exposure Test
TAB.3 13 Post Tensioning Terminology (PTT)
") TAB.3 13 Post Tensioning Terminology (PTT) PTI Technicical Advisory Board Page 0 of 34 The following Post-Tensioning Terminology (PTT) document contains the consensus definitions for terms relating to
TAB.3 13 Post Tensioning Terminology (PTT) PTI Technicical Advisory Board Page 0 of 34 The following Post-Tensioning Terminology (PTT) document contains the consensus definitions for terms relating to
Technical Report Documentation Page 2. Government 3. Recipient s Catalog No.
 1. Report No. FHWA/TX-08/0-5444-1 Technical Report Documentation Page 2. Government 3. Recipient s Catalog No. Accession No. 4. Title and Subtitle Interim Repair Guidelines for Longitudinal Cracking and
Concrete Prestressed Concrete Pretensioned Concrete Posttensioned Concrete Typical Tendon Layout
 Concrete 45 1.13.0 Prestressed Concrete Concrete in which internal stresses (forces) are induced by means of prestressing steel tendons such that tensile stresses resulting from loads are counteracted
1. CORROSION OF REINFORCEMENT
 MAB 1033 Structural Assessment and Repair 1. CORROSION OF REINFORCEMENT Professor Dr. Mohammad bin Ismail C09-313 Learning Outcome At the end of the course students should be able to understand Mechanism
EXECUTIVE SUMMARY POST-TENSIONING TENDON PROTECTION STRATEGIES FOR PRECAST ELEMENTS
 EXECUTIVE SUMMARY POST-TENSIONING TENDON PROTECTION STRATEGIES FOR PRECAST ELEMENTS Larry B. Krauser, General Technologies, Inc., Stafford, TX Post-tensioning tendon protection strategies for precast elements
***************************************************************************************************************
 03365 POST-TENSIONED CONCRETE *************************************************************************************************************** SPECIFIER: CSI MasterFormat 2004 number 03 38 00. ***************************************************************************************************************
Barrier Cable Systems, Inc.
 055220 BARRIER CABLE SYSTEMS PART 1- GENERAL 1.1 DESIGN The 2012 IBC compliant barrier systems must meet both following requirements: A. For automobile restraint: the systems shall be able to withstand
Section 708. PRESTRESSED CONCRETE
 708.02 Section 708. PRESTRESSED CONCRETE 708.01. Description. This work consists of manufacturing and erecting prestressed concrete. 708.02. Materials. Provide materials in accordance with the following:
SPECIAL SPECIFICATION 4401 Prestressed Ground Anchors
 2004 Specifications CSJ 0581-02-121 & 0200-11-100 SPECI SPECIFICATION 4401 Prestressed Ground Anchors 1. Description. Install post-tensioned permanent ground anchors in place, with grouting as required
Florida DOT efforts toward improving Post Tension Durability
 Florida DOT efforts toward improving Post Tension Durability By William Nickas 1 (C) COPYRIGHT POST-TENSIONING INSTITUTE, ALL RIGHTS RESERVED Page 1 of 73 Post-Tensioning Strategies Enhanced PT Systems
Technical Notes. Mandatory Barrier Cable Inspection Requirements
 Technical Notes From M-10: Unbonded Tendon Committee Issue 20 December 2015 Mandary Barrier Cable Inspection Requirements Inspection of barrier cable installation in accordance with the PTI M10.4-07, Specification
Section 708. PRESTRESSED CONCRETE BEAMS Description. Manufacture and erect prestressed concrete beams.
 708.0 Section 708. PRESTRESSED CONCRETE BEAMS 708.0 Description. Manufacture and erect prestressed concrete beams. 708.02 Materials. Use materials meeting the following. Mortar and Grout... 702 Cement...
ITEM 431 PNEUMATICALLY PLACED CONCRETE. All material shall conform to the pertinent requirements of the following items:
 ITEM 431 PNEUMATICALLY PLACED CONCRETE 431.1. Description. This Item shall govern for furnishing and placing of "Pneumatically Placed Concrete" for encasement of designated structural steel members, the
Requirements for Measuring and Pricing of Structural Concrete
 Requirements for Measuring and Pricing of Structural Concrete October 2016 TRANSPORT INFRASTRUCTURE IRELAND (TII) PUBLICATIONS About TII Transport Infrastructure Ireland (TII) is responsible for managing
1. Cast-in-place concrete is specified in Section
 SECTION 03 38 00 PART 1 - GENERAL 1.01 DESCRIPTION A. This Section describes the requirements for furnishing and installing post-tensioned slabs, jacks, jacking and anchors at Parking Structure, and record
Technical Report Documentation Page 2. Government 3. Recipient s Catalog No.
 1. Report No. FHWA/TX-07 / 0-1774-4 Technical Report Documentation Page 2. Government 3. Recipient s Catalog No. Accession No. 4. Title and Subtitle Performance of Fiber Composite Wrapped Columns and Beams
Special Provision No. 999S28 June 2010 CONSTRUCTION SPECIFICATION FOR PRECAST PANELS FOR USE AS STAY-IN-PLACE DECK FORMS
 PRECAST PANEL STAY-IN-PLACE DECK FORMS FABRICATION Item No. PRECAST PANEL STAY-IN-PLACE DECK FORMS DELIVERY Item No. PRECAST PANEL STAY-IN-PLACE DECK PANELS ERECTION Item No. Special Provision No. 999S28
The Hashemite University Department of Civil Engineering. Dr. Hazim Dwairi. Dr. Hazim Dwairi 1
 Department of Civil Engineering Lecture 2.1 Methods of Prestressing Advantages of Prestressing Section remains uncracked under service loads Reduction of steel corrosion (increase durability) Full section
Technical Report Documentation Page 2. Government 3. Recipient s Catalog No.
 1. Report No. FHWA/TX-08/0-5549-1 Technical Report Documentation Page 2. Government 3. Recipient s Catalog No. Accession No. 4. Title and Subtitle Horizontal Cracking in Portland Cement Concrete Pavements:
Critical Structures Construction Issues
 Critical Structures Construction Issues FLORIDA DEPARTMENT OF TRANSPORTATION STATE CONSTRUCTION OFFICE Specification 1-3: Definitions Contractor s Engineer of Record Specialty Engineer CLASS OF CONTRACTOR
SPECIAL SPECIFICATION 4492 Tie Back Anchors
 2004 Specifications CSJ 0504-02-022 SPECI SPECIFICATION 4492 Tie Back Anchors 1. Description. This Item shall govern for the installation of tie-back anchors in place, with grouting as required in accordance
2nd RESUBMITTAL. Texas Transportation Institute The Texas A&M University System College Station, Texas
 1. Report No. FHWA/TX-07/0-5457-1 2. Government Accession No. 3. Recipient's Catalog No. 4. Title and Subtitle PRELIMINARY RESULTS OF REPEATABILITY AND SENSITIVITY STUDY ON OVERLAY TESTER FOR CRACK SEALANTS
SECTION 1 INTRODUCTION TO POST-TENSIONED CONCRETE DEVELOPED BY THE PTI EDC-130 EDUCATION COMMITTEE
 SECTION 1 INTRODUCTION TO POST-TENSIONED CONCRETE DEVELOPED BY THE PTI EDC-130 EDUCATION COMMITTEE NOTE: MOMENT DIAGRAM CONVENTION In PT design, it is preferable to draw moment diagrams to the tensile
20. Security Classif. (of this page) Unclassified
 Unclassified") 1. Report No. FHWA/TX-13/0-4562-5F Technical Report Documentation Page 2. Government 3. Recipient s Catalog No. Accession No. 4. Title and Subtitle Corrosion Resistance Recommendations from Long-Term Exposure
1. Report No. FHWA/TX-13/0-4562-5F Technical Report Documentation Page 2. Government 3. Recipient s Catalog No. Accession No. 4. Title and Subtitle Corrosion Resistance Recommendations from Long-Term Exposure
715 - PRESTRESSED CONCRETE MEMBERS SECTION 715 PRESTRESSED CONCRETE MEMBERS
 SECTION 715 PRESTRESSED CONCRETE MEMBERS 715.1 DESCRIPTION Manufacture, cure, handle and install prestressed concrete bridge beams and panels to the dimensions specified on the Contract Documents. Manufacture
Texas Transportation Institute The Texas A&M University System College Station, Texas
 1. Report No. FHWA/TX-05/9-8132-3 4. Title and Subtitle TESTING AND EVALUATION OF THE FLORIDA F SHAPE RIDGE RAILWITH REDUCED DECK THICKNESS 2. Government Accession No. 3. Recipient's Catalog No. 5. Report
SECTION ARCHITECTURAL PRECAST CONCRETE. A. American Society for Testing and Materials (ASTM):
:") SECTION 03450 ARCHITECTURAL PRECAST CONCRETE PART 1 GENERAL 1.01 SUMMARY A. Related Sections: 1. 03100 - Concrete Formwork 2. 03200 - Concrete Reinforcement 3. 03300 - Cast-in-Place Concrete 4. 03600 -
SECTION 03450 ARCHITECTURAL PRECAST CONCRETE PART 1 GENERAL 1.01 SUMMARY A. Related Sections: 1. 03100 - Concrete Formwork 2. 03200 - Concrete Reinforcement 3. 03300 - Cast-in-Place Concrete 4. 03600 -
SPECIAL SPECIFICATION 4900 Sacrificial Cathodic Protection Pile Jacket
 1993 Specifications CSJ 0331-04-045 SPECIAL SPECIFICATION 4900 Sacrificial Cathodic Protection Pile Jacket 1. Description. This Item shall govern for the furnishing, installing and energizing a sacrificial
***************************************************************************************************************
 03450 ARCHITECTURAL PRECAST CONCRETE *************************************************************************************************************** SPECIFIER: CSI MasterFormat 2004 number 03 45 13 ***************************************************************************************************************
SPECIAL SPECIFICATION 4703 Repair Of Impact Damaged Prestressed Concrete Bridge Beams
 1993 Specifications CSJ 0162-01-080, etc. SPECIAL SPECIFICATION 4703 Repair Of Impact Damaged Prestressed Concrete Bridge Beams 1. Description. This Item shall govern for the repair of impact damaged prestressed
INSTITUTE OF CONCRETE TECHNOLOGY CONCRETE TECHNOLOGY & CONSTRUCTION Stage 2: GENERAL PRINCIPLES Learning objectives
 INSTITUTE OF CONCRETE TECHNOLOGY CONCRETE TECHNOLOGY & CONSTRUCTION Stage 2: GENERAL PRINCIPLES Learning objectives 2.00 Introduction to the course 2.00.01 Outline the aims, objectives and content of the
ACI MANUAL OF CONCRETE PRACTICE-2009
 ACI MANUAL OF CONCRETE PRACTICE-2009 The ACI Manual of Concrete Practice is a six-part compilation of current ACI standards and committee reports. -ACI117-06 to ACI224.3R-95(08) Part 2-ACI 225-99(05) to
Technical Report Documentation Page 2.Government 3. Recipient s Catalog No.
 1. Report No. FHWA/TX-05 / 0-4562-1 4. Title and Subtitle Factors Affecting Bond and Friction Losses in Multi-Strand Post- Tensioning Tendons Including the Effects of Emulsifiable Oils 7. Author(s) T.
INTERIM CONCLUSIONS, RECOMMENDATIONS,
 RESEARCH REPORT 1405-5 INTERIM CONCLUSIONS, RECOMMENDATIONS, AND DESIGN GUIDELINES FOR DURABILITY OF POST-TENSIONED BRIDGE SUBSTRUCTURES A. J. Schokker, J. S. West, J. E. Breen, and M. E. Kreger CENTER
Construction Measurement III SBQ3314. Precast Pre stressed Concrete Works. Dr. Sarajul Fikri Mohamed
 Construction Measurement III SBQ3314 Precast Pre stressed Concrete Works Dr. Sarajul Fikri Mohamed Table of Contents 1. Pre stressed concrete in bridgeworks: technological aspects 2. SMM2 measurement rules
SPECIAL SPECIFICATION 4584 Segmental Concrete Bridge Unit
 2004 Specifications CSJ: 0028-09-111 SPECIAL SPECIFICATION 4584 Segmental Concrete Bridge Unit 1. Description. Construct cast-in-place segmental concrete box girder superstructure according to the plans,
Fundamentals of Concrete
 Components Cement Water Fine Aggregate Coarse Aggregate Fundamentals of Range in Proportions Advantages of Reducing Water Content: Increased strength Lower permeability Fundamentals of Increased resistance
Lecture 13 CONCRETE WORKS
 Lecture 13 TSP-308 MPK Ferdinand Fassa CONCRETE WORKS Concrete works Concrete is a man-made (rock) construction material, which is a mixture of portland cement, water, aggregates, and in some cases, admixtures.
Concrete. Chapter 10 Properties of Fresh Concrete. Materials of Construction-Concrete 1. Wikipedia.org
 Wikipedia.org Concrete Chapter 10 Properties of Fresh Concrete Materials of Construction-Concrete 1 What is Concrete? Concrete is a composite material that consists of a cement paste within which various
Copyright. Bradley Allen Wood
 Copyright by Bradley Allen Wood 1997 Investigation of Design and Repair Methods for Cantilever Bridge Bents Volume II by Bradley Allen Wood, B.S., M.S. Dissertation Presented to the Faculty of the Graduate
Copyright. Bradley Allen Wood
 Copyright by Bradley Allen Wood 1997 Investigation of Design and Repair Methods for Cantilever Bridge Bents Volume II by Bradley Allen Wood, B.S., M.S. Dissertation Presented to the Faculty of the Graduate
6. Performing Organization Code 7. Author(s) 8. Performing Organization Report No.
 8. Performing Organization Report No.") 1. Report No. FHWA/TX--1776-2 4. Title and Subtitle Technical Report Documentation Page 2. Government Accession No. 3. Recipient s Catalog No. Increasing the Flexural Capacity of Typical Reinforced Concrete
1. Report No. FHWA/TX--1776-2 4. Title and Subtitle Technical Report Documentation Page 2. Government Accession No. 3. Recipient s Catalog No. Increasing the Flexural Capacity of Typical Reinforced Concrete
Concrete Framing Systems - Walls and Columns
 Concrete Framing Systems - Walls and Columns Casting a Concrete Wall Wall Footing Reinforcing Wall Forms Pouring Concrete Finishing the Concrete Controlling Cracking Insulating Concrete Forms (ICF) Tilt-Up
Corrosion Evaluation of Post-Tensioned Tendons on Mid-Bay Bridge
 Corrosion Evaluation of Post-Tensioned Tendons on Mid-Bay Bridge by Siva Venugopalan Principal SCS, Inc. siva007@verizon.net (610) 692-6551 6551 March 7, 2007 Count on Concrete for Performance Slide 1
Special Requirements for Precast Bent Cap Connections C General
 Attachment CS1. Proposed Article 8.13.8 Special Requirements for Precast Bent Cap Connections (AASHTO LRFD Bridge Construction Specifications, 2 nd Edition with 2006, 2007, 2008, and 2009 Interims) 8.13.8
716 - POST-TENSIONING (Haunched Slab Bridges) SECTION 716. POST-TENSIONING (Haunched Slab Bridges)
 SECTION 716. POST-TENSIONING (Haunched Slab Bridges)") SECTION 716 POST-TENSIONING (Haunched Slab Bridges) 716.1 DESCRIPTION Provide and install all post-tensioning system components as shown in the Contract Documents to construct a post-tensioned haunched
SECTION 716 POST-TENSIONING (Haunched Slab Bridges) 716.1 DESCRIPTION Provide and install all post-tensioning system components as shown in the Contract Documents to construct a post-tensioned haunched
JULY 2014 LRFD BRIDGE DESIGN 5-1
 JULY 014 LRFD BRIDGE DESIGN 5-1 5. CONCRETE STRUCTURES Reinforced and prestressed concrete are used extensively in bridge projects. In addition to general design guidance and information on detailing practices,
ITEM 426 PRESTRESSING Definitions. For this Item, the following definitions shall apply:
 ITEM 426 PRESTRESSING 426.1. Description. This Item shall govern for the furnishing, fabricating, storing and handling of prestressing materials, for the prestressing of precast members, and for the prestressing
Producer Solutions LOAD TESTS ON WALL PANEL CONNECTIONS USING TWO-INCH DIAMETER CORRUGATED PLASTIC SLEEVES
 LOAD TESTS ON WALL PANEL CONNECTIONS USING TWO-INCH DIAMETER CORRUGATED PLASTIC SLEEVES by Alex Aswad, Ph.D., P.E. and George G. Burnley, P.E. Contributor: Kathy Scholz Project Sponsored by High Concrete
20. Security Classif. (of this page) Unclassified
 Unclassified") 1. Report No. FHWA/TX-06/0-4176-1 Technical Report Documentation Page 2. Government 3. Recipient s Catalog No. Accession No. 4. Title and Subtitle Anchorage Requirements for Grouted Vertical-Duct Connectors
1. Report No. FHWA/TX-06/0-4176-1 Technical Report Documentation Page 2. Government 3. Recipient s Catalog No. Accession No. 4. Title and Subtitle Anchorage Requirements for Grouted Vertical-Duct Connectors
ABC-UTC. Research Progress Report (Feasibility Study) Title: Alternative ABC Connections Utilizing UHPC. March, 2017
 Title: Alternative ABC Connections Utilizing UHPC. March, 2017") ABC-UTC Research Progress Report (Feasibility Study) Title: Alternative ABC Connections Utilizing UHPC ABSTRACT March, 2017 Accelerated Bridge Construction (ABC) is a method of bridge construction designed
ABC-UTC Research Progress Report (Feasibility Study) Title: Alternative ABC Connections Utilizing UHPC ABSTRACT March, 2017 Accelerated Bridge Construction (ABC) is a method of bridge construction designed
Seismic Behavior of Low Strength RC Columns with Corroded Plain Reinforcing Bars
 Seismic Behavior of Low Strength RC Columns with Corroded Plain Reinforcing Bars C. Goksu 1, B. Demirtas 2, C. Demir 1, A. Ilki 3 and N. Kumbasar 4 1 PhD Candidate, Civil Engineering Faculty, Istanbul
Nelson Testing Laboratories
 in Elmhurst, Illinois, USA has demonstrated proficiency for the testing of construction materials and has conformed to the requirements established in AASHTO R 18 and the AASHTO Accreditation policies
Contents. 1.1 Introduction 1
 Contents PREFACE 1 ANCIENT MASONRY 1 1.1 Introduction 1 1.2 History of Masonry Materials 1 1.2.1 Stone 2 1.2.2 Clay Units 2 1.2.3 Calcium Silicate Units 4 1.2.4 Concrete Masonry Units 4 1.2.5 Mortars 5
NUTC R203 BEHAVIOR OF HIGH-PERFORMANCE CONCRETE IN STRUCTURAL APPLICATIONS. Jared Brewe
 BEHAVIOR OF HIGH-PERFORMANCE CONCRETE IN STRUCTURAL APPLICATIONS by Jared Brewe NUTC R203 A National University Transportation Center at Missouri University of Science & Technology Disclaimer The contents
MICHIGAN DEPARTMENT OF TRANSPORTATION SPECIAL PROVISION FOR LOW-TENSION CABLE BARRIER. OPR:CT 1 of 5 APPR:JAR:DBP: FHWA:APPR:
 MICHIGAN DEPARTMENT OF TRANSPORTATION SPECIAL PROVISION FOR LOW-TENSION CABLE BARRIER OPR:CT 1 of 5 APPR:JAR:DBP:09-07-11 FHWA:APPR:09-07-11 a. Description. This work consists of furnishing and installing
CONCRETE WORK CONCRETE WORK. Underground Electric Distribution Standards I. SCOPE APPLICABLE STANDARDS
 Underground Electric Distribution Standards I. SCOPE This section includes the standards for concrete, reinforcing steel, formwork, concrete placement, curing, and construction joints. Concrete work for
Chapter 2 Notation and Terminology
 Reorganized 318 Chapter Titles Chapter 1 General 1.1 Scope 1.2 Purpose 1.3 Interpretation 1.4 Drawings and Specifications 1.5 Testing and Inspection 1.6 Administatration and Enforcement 1.6.1 Retention
Rak Production Technology of Concrete Structures (2015) Concrete Reinforcement
 Concrete Reinforcement") Rak-82-2121 Production Technology of Concrete Structures (2015) Concrete Reinforcement 09.10.2015 1 Learning Outcomes To acquaint the student with concrete reinforcement 2 Reinforcement The of concrete
Rak-82-2121 Production Technology of Concrete Structures (2015) Concrete Reinforcement 09.10.2015 1 Learning Outcomes To acquaint the student with concrete reinforcement 2 Reinforcement The of concrete
FEBRUARY 2019 LRFD BRIDGE DESIGN 5-1
 FEBRUARY 2019 LRFD BRIDGE DESIGN 5-1 5. CONCRETE STRUCTURES Reinforced and prestressed concrete are used extensively in bridge projects. In addition to general design guidance and information on detailing
Doç. Dr. Halit YAZICI. D. E. U. Civil Engineering Department.
 Doç. Dr. Halit YAZICI D. E. U. Civil Engineering Department http://kisi.deu.edu.tr/halit.yazici Chemical Admixtures In Concrete What Are They? Ingredients other than: Cement Water Aggregates Added before
POST-TENSIONING VS. PRESTRESSING
 POST-TENSIONING VS. PRESTRESSING Miroslav F. VEJVODA, MBA, P.E. Managing Director Engineering & Professional Development PURPOSE STATEMENT This seminar is intended to develop an understanding for the differences
SPECIFICATIONS FOR ERECTION OF PRECAST PRESTRESSED CONCRETE GIRDERS
 SPECIFICATIONS FOR ERECTION OF PRECAST PRESTRESSED CONCRETE GIRDERS 1.0 DESCRIPTION The Work shall consist of:.1 Transportation, unloading, and erection of precast prestressed concrete girders;.2 Supply
SPECIFICATION FOR REINFORCED SOIL WALL
 SPECIFICATION FOR REINFORCED SOIL WALL 1.0 EXTENT OF WORK The work shall consist of Reinforced Soil walls built in accordance with this specification and in conformity with the lines, levels and details
SECTION HANGERS AND SUPPORTS FOR PLUMBING
 SECTION 22 05 29 HANGERS AND SUPPORTS FOR PLUMBING PART 1 - GENERAL 1.1 RELATED DOCUMENTS A. Drawings and general provisions of the Contract, including General and Supplementary Conditions and Division
Properties of Concrete. Properties of Concrete. Properties of Concrete. Properties of Concrete. Properties of Concrete. Properties of Concrete
 CIVL 1112 Contrete Introduction from CIVL 1101 1/10 Concrete is an artificial conglomerate stone made essentially of Portland cement, water, and aggregates. While cement in one form or another has been
CONCRETE REPAIR IN ACTION: USING THE MANUAL AS A GUIDE. Christen Longoria, P.E. San Antonio District Project Engineer
 CONCRETE REPAIR IN ACTION: USING THE MANUAL AS A GUIDE Christen Longoria, P.E. San Antonio District Project Engineer TxDOT CONCRETE REPAIR MANUAL Step-by-Step repair procedures for use on new and existing
Basic types of bridge decks
 Bridge Deck Slab 1 Introduction 2 Bridge deck provide the riding surface for traffic, support & transfer live loads to the main load carrying member such as girder on a bridge superstructure. Selection
PRESTRESSED CONCRETE STRUCTURES UNIT I INTRODUCTION THEORY AND BEHAVIOUR
 BASIC CONCEPTS: PRESTRESSED CONCRETE STRUCTURES UNIT I INTRODUCTION THEORY AND BEHAVIOUR A prestressed concrete structure is different from a conventional reinforced concrete structure due to the application
Design and Construction of the SH58 Ramp A Flyover Bridge over IH70. Gregg A. Reese, PE, CE, Summit Engineering Group, Inc.
 Design and Construction of the SH58 Ramp A Flyover Bridge over IH70 Gregg A. Reese, PE, CE, Summit Engineering Group, Inc., Littleton, CO ABSTRACT: The SH58 Ramp A bridge in Golden, CO is the latest on
1.7 Prestressing Steel
 1.7 Prestressing Steel This section covers the following topics. Forms of Prestressing Steel Types of Prestressing Steel Properties of Prestressing Steel Codal Provisions of Steel 1.7.1 Forms of Prestressing
50 lbs (23 kg) of + #8 (+2.36 mm) material plus 50 lbs (23 kg) of pile run material.
 of + #8 (+2.36 mm) material plus 50 lbs (23 kg) of pile run material.") 5.5 REQUIRED SAMPLE SIZES 1. SCOPE This section covers the size of samples to be submitted to the s and Research Center for testing. The sample sizes listed are minimums and in special cases the Engineer
5.5 REQUIRED SAMPLE SIZES 1. SCOPE This section covers the size of samples to be submitted to the s and Research Center for testing. The sample sizes listed are minimums and in special cases the Engineer
GUIDE SPECIFICATIONS For STRUCTURAL PRECAST HOLLOW CORE SLABS SECTION 03410
 GUIDE SPECIFICATIONS For STRUCTURAL PRECAST HOLLOW CORE SLABS SECTION 03410 Note to user: These guide specifications are provided by Mid- States Concrete Products as a service to you; they are NOT specific
Research Report R. E. Klingner
 1. Report No. FHWA/TX-04/1855-3 4. Title and Subtitle 2. Government Accession No. 3. Recipient s Catalog No. ANCHORAGE BEHAVIOR OF HEADED REINFORCEMENT Part A: Lap Splices Part B: Design Provisions and
Appendix M 2010 AASHTO Bridge Committee Agenda Item
 Appendix M 2010 AASHTO Bridge Committee Agenda Item 2010 AASHTO BRIDGE COMMITTEE AGENDA ITEM: SUBJECT: LRFD Bridge Design Specifications: Section 5, High-Strength Steel Reinforcement TECHNICAL COMMITTEE:
Appendix A Proposed LRFD Specifications and Commentary
 NCHRP Project 12-71 Design Specifications and Commentary for Horizontally Curved Concrete Box-Girder Highway Bridges Appendix A Proposed LRFD Specifications and Commentary A-1 A-2 4.2 DEFINITIONS (Additional)
STRUCTURAL PRECAST CONCRETE
 SECTION 03410 STRUCTURAL PRECAST CONCRETE PART 1 GENERAL 1.01 SUMMARY A. Provide labor, materials, necessary equipment, services and included, but not limited to, related work to complete the structural
Post-tensioned Structures Solutions for Repair and Protection
 Post-tensioned Structures Solutions for Repair and Protection Concrete Preservation Alliance Vector Construction, Vector Corrosion Technologies, and Vector Corrosion Services are working to advance the
Interior Hangers. Application
 Application Interior bridge deck hangers are typically fabricated using two heavy duty sheet metal end clips that have been electrically resistance welded to an appropriate sized wire or formed metal connecting
SPECIFICATION 1042 M SPECIFICATIONS FOR LATERAL STRESSING, PLACING OF ANCHOR RODS AND MISCELLANEOUS GROUTING
 MAY 1984 SPECIFICATION 1042 M SPECIFICATIONS FOR LATERAL STRESSING, PLACING OF ANCHOR RODS AND MISCELLANEOUS GROUTING 1042. 1. DESCRIPTION The work will consist of: The delivery and installation of cables
This section applies to the design and installation of cast-in-place concrete, shotcrete, precast concrete, and post-tensioned concrete.
 Basis of Design This section applies to the design and installation of cast-in-place concrete, shotcrete, precast concrete, and post-tensioned concrete. Design Criteria Use most recent version of the International
PRESTRESSED CONCRETE STRUCTURES. Amlan K. Sengupta, PhD PE Department of Civil Engineering Indian Institute of Technology Madras
 PRESTRESSED CONCRETE STRUCTURES Amlan K. Sengupta, PhD PE Department of Civil Engineering Indian Institute of Technology Madras Module 01: Introduction, Prestressing Systems and Material Properties Lecture
AC : STUDENT FEEDBACK AND LESSONS LEARNED FROM ADDING LABORATORY EXPERIENCES TO THE REINFORCED CONCRETE DESIGN COURSE
 AC 2007-2802: STUDENT FEEDBACK AND LESSONS LEARNED FROM ADDING LABORATORY EXPERIENCES TO THE REINFORCED CONCRETE DESIGN COURSE Micah Hale, University of Arkansas Seamus Freyne, Manhattan College Stephan
COMPARATIVE STUDY OF BEAMS BY USING DIFFERENT TYPES OF RETROFITING TECHNIQUES
 International Journal of Civil Engineering and Technology (IJCIET) Volume 10, Issue 04, April 2019, pp. 864 870, Article ID: IJCIET_10_04_091 Available online at http://www.iaeme.com/ijmet/issues.asp?jtype=ijciet&vtype=10&itype=4
Extending the Lifespan of Structural Concrete
 Extending the Lifespan of Structural Concrete Jeff West, Ph.D., P.E. Dept. of Civil and Environmental Engineering Two focus areas: Extending the Lifespan of Structural Concrete Strengthening of existing
SECTION STRUCTURAL PRECAST CONCRETE
 SECTION 03500 STRUCTURAL PRECAST CONCRETE PART 1 GENERAL 1.01 SUMMARY A. Section Includes. This section covers Prestressed or Precast concrete member construction, including product design not shown on
UNIFIED FACILITIES GUIDE SPECIFICATIONS
 USACE / NAVFAC / AFCEC / NASA UFGS-03 23 00 (May 2016) Change 1-08/18 ----------------------------- Preparing Activity: USACE Superseding UFGS-03 23 00 (November 2009) UNIFIED FACILITIES GUIDE SPECIFICATIONS
SUNSHINE SKYWAY BRIDGE
 SUNSHINE SKYWAY BRIDGE Retrofit of the Post-Tensioned Precast Transition Pier Columns on the Sunshine Skyway Bridge Presented by: Antonio Ledesma, P.E. May 7, 2012 SUNSHINE SKYWAY BRIDGE, FLORIDA Presentation
SECTION PRECAST CONCRETE COVER SYSTEM
 SECTION 13500 PRECAST CONCRETE COVER SYSTEM PART 1 GENERAL 1.1 SYSTEM DESCRIPTION A. Design Criteria: 1. Precast manufacturer shall be responsible for structural design of individual precast components,
TECHNICAL SPECIAL PROVISION FOR CONCRETE REPAIRS. Financial Project ID , &
 TECHNICAL SPECIAL PROVISION FOR CONCRETE REPAIRS Financial Project ID 429140-1-52-01, 429140-2-52-01 & 428267-1-52-01 The official record of this Technical Special Provision is the electronic file signed
REINFORCED CONCRETE MASONRY SECTION
 SECTION 04 22 02 - REINFORCED CONCRETE MASONRY PART 1 - GENERAL 1.1 RELATED DOCUMENTS A. Drawings and general provisions of Contract, including General and Supplementary Conditions and Division 01 Specification
STATE-OF-THE-ART REPORT ABOUT DURABILITY OF POST-TENSIONED BRIDGE SUBSTRUCTURES
 RESEARCH REPORT 1405-1 STATE-OF-THE-ART REPORT ABOUT DURABILITY OF POST-TENSIONED BRIDGE SUBSTRUCTURES J. S. West, C. J. Larosche, B. D. Koester, J. E. Breen, and M. E. Kreger CENTER FOR TRANSPORTATION
EVALUATION & REPAIR OF CORROSION DAMAGED ROOF LIFT SLAB WITH WIRE POST-TENSIONING SYSTEM (BUTTON HEADS)
") EVALUATION & REPAIR OF CORROSION DAMAGED ROOF LIFT SLAB WITH WIRE POST-TENSIONING SYSTEM (BUTTON HEADS) (C) COPYRIGHT POST-TENSIONING INSTITUTE, ALL RIGHT RESERVED 1 of 23 The following presentation discusses
EVALUATION & REPAIR OF CORROSION DAMAGED ROOF LIFT SLAB WITH WIRE POST-TENSIONING SYSTEM (BUTTON HEADS) (C) COPYRIGHT POST-TENSIONING INSTITUTE, ALL RIGHT RESERVED 1 of 23 The following presentation discusses
1 Exam Prep Placing Reinforcing Bars Tabs and Highlights
 1 Exam Prep Placing Reinforcing Bars Tabs and s These 1 Exam Prep Tabs are based on the CRSI Placing Reinforcing Bars Recommended Practices, 9 th Edition. Each 1 Exam Prep tabs sheet has five rows of tabs.
CHAPTER 10: GENERAL STRUCTURAL DETAILS
 CHAPTER 10: GENERAL STRUCTURAL DETAILS 10.1 GENERAL It shall be in accordance with JSCE Standard Specification (Design), 9.1, "steel" shall be taken to signify "steel or CFRM". 10.2 CONCRETE COVER (1)