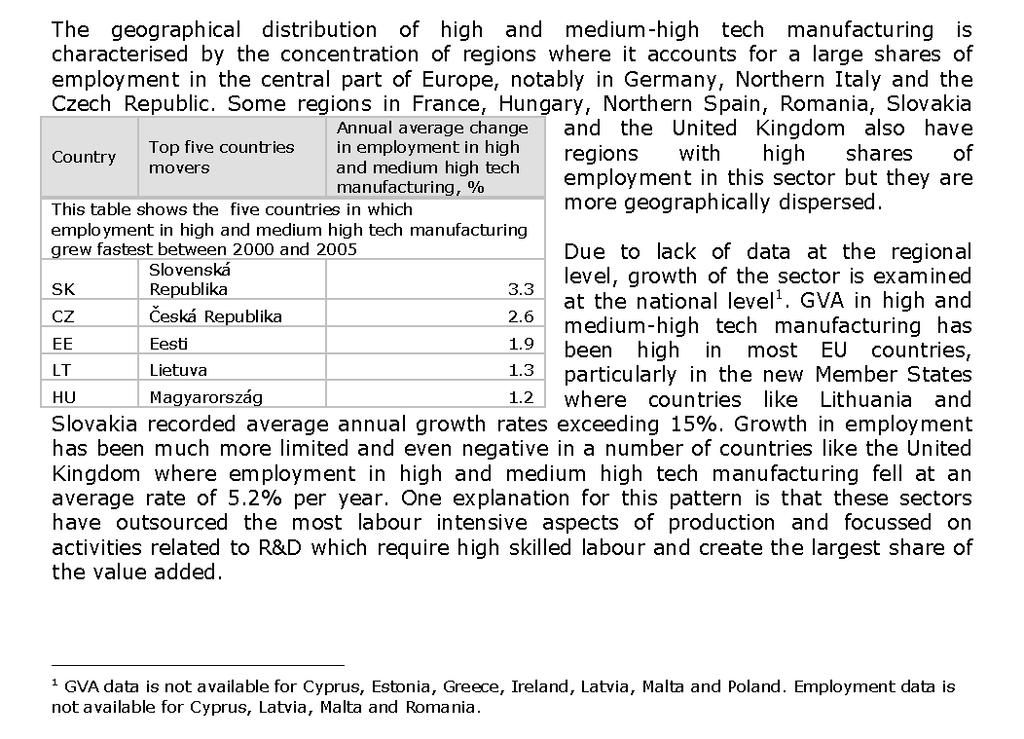
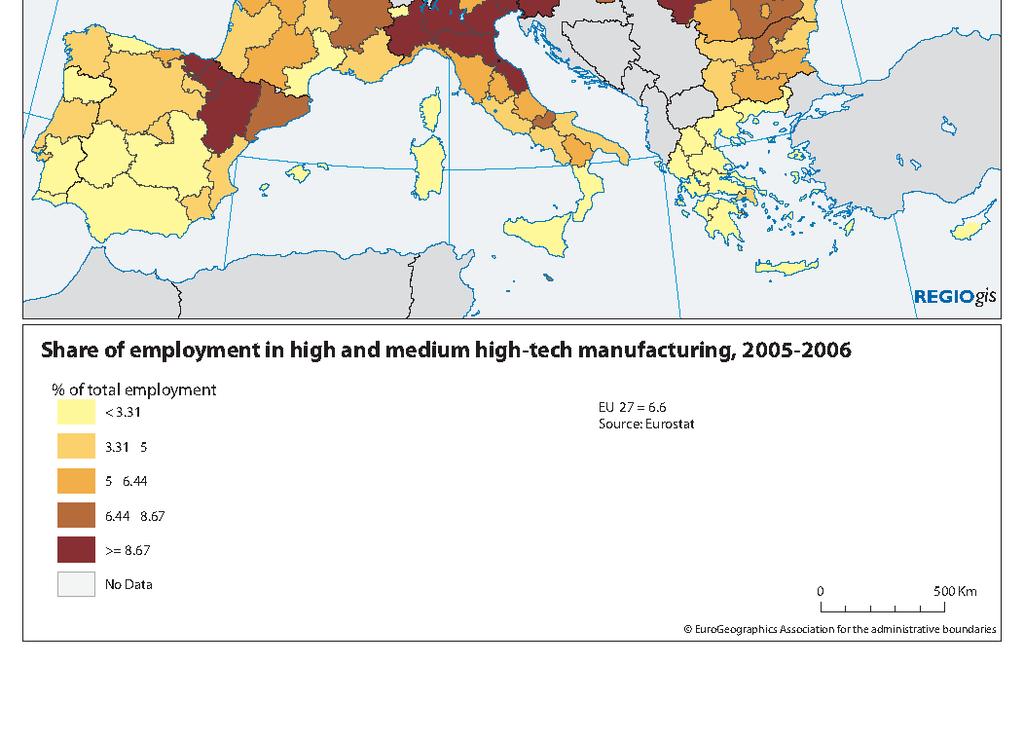
COMMISSION OF THE EUROPEAN COMMUNITIES COMMISSION STAFF WORKING DOCUMENT. Accompanying the
|
|
|
- Priscilla Newman
- 6 years ago
- Views:
Transcription
1 COMMISSION OF THE EUROPEAN COMMUNITIES Brussels, SEC (2008) 2047 COMMISSION STAFF WORKING DOCUMENT Accompanying the FIFTH PROGRESS REPORT ON ECONOMIC AND SOCIAL COHESION Growing Regions, growing Europe {COM(2008) 371final} EN EN
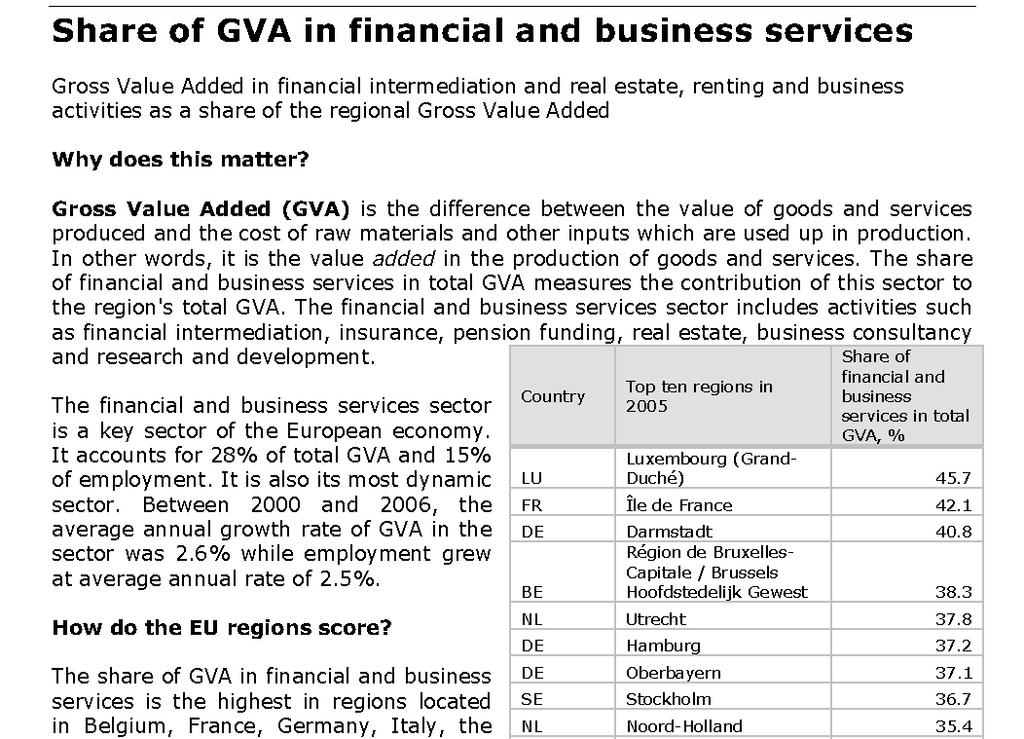
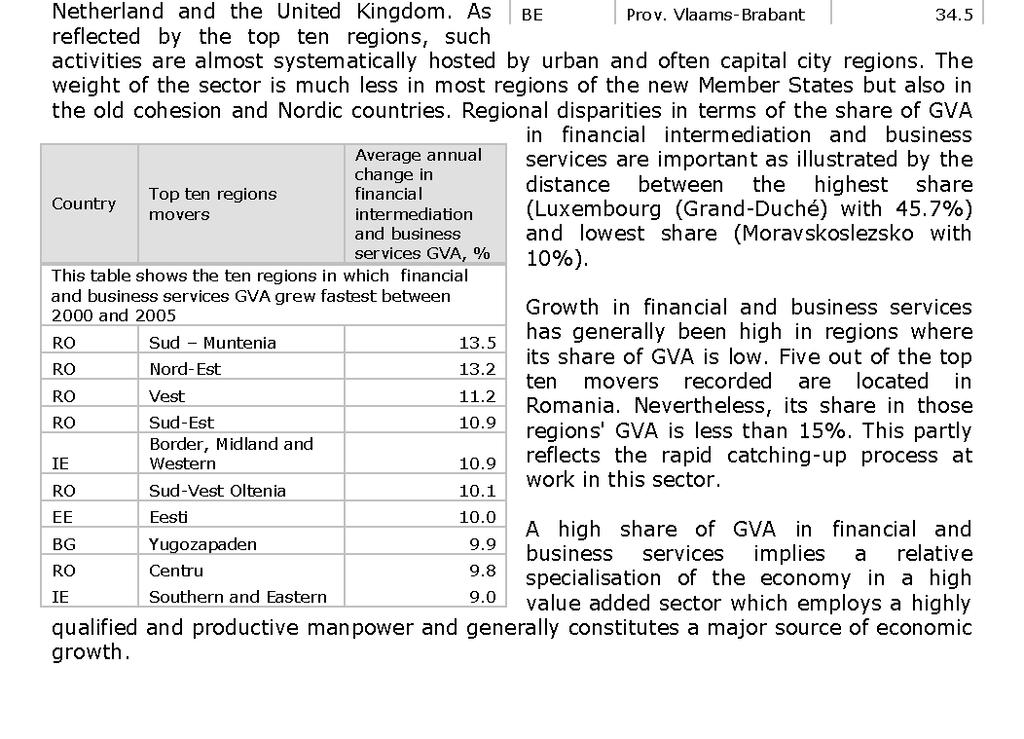
2 COMMISSION STAFF WORKING DOCUMENT accompanying the Fifth Progress Report on economic and social Cohesion Growing Regions, growing Europe 1. FIGURES AND TABLES Figure 1 Convergence of GDP per head, employment rates and unemployment rates, Figure 1 - Dispersion of regional (NUTS2) key indicators (%) (coefficient of variation) GDP/head Employment rate 80 Unemployment rate Source: Eurostat Table 1: Main characteristics for the Convergence, Transition and Regional Competitiveness and Employment regions Conv Transition RCE EU27 Population share in 2005 in % Average annual change in population in % *** Number of regions* Employment rate in 2006 in %** Change in employment rate in percentage points ** Unemployment rate in 2006 in %*** Change in unemployment rate in percentage points *** GDP per head in 2005, EU27=100 **** Change in GDP per head in index points EU27=100 **** R&D as % of GDP, 2004 or most recent year * DEE0 (Sachsen-Anhalt) taken into account as Convergence region ** based on NUTS breakdown valid 1/1/2007 *** Excluding two UK, PT, DE and one Finish region (no data) *** excl. UKM5 and UKM6 (no data) Source: Eurostat and DG REGIO calculations EN 2 EN
3 Table 2: Employment and GVA share and change in six sectors, Share in 2005 in % Employment GVA Conv Transition RCE EU27 Conv Transition RCE EU27 Agriculture, hunting and fishing Total industry, including energy Construction Trade, transport & communication Financial and business services Other services Total Share of EU Average Annual Change in % Employment GVA Conv Transition RCE EU27 Conv Transition RCE EU27 Agriculture, hunting and fishing Total industry, including energy Construction Trade, transport & communication Financial and business services Other services Total Note: Due to the lack of regional data in the UK, national data was used and all of UK was considered as RCE. Source: Eurostat and DG REGIO calculations Table 3: Productivity by sector in 2005 by type of region 2005 GVA per person employed EU27=100 Conv Transition RCE EU27 Agriculture, hunting and fishing Total industry, including energy Construction Trade, transport & communication Financial and business services Other services Total Note: Due to the lack of regional data in the UK, national data was used and all of UK was considered as RCE. Source: Eurostat and DG REGIO calculations Table 4: Share of knowledge workers and population with high educational level by type of region, 2006 Conv Transition RCE EU27 Share of knowledge workers (ISCO 1,2,3) as % of total employment Change in share of knowledge workers in percentage points Share of population with high educational level (% of total population 25-64) Change in share of population with high educational level in percentage points Share of Human Resources in Science and Technology (core) (% of active population) Change in share of Human Resources in Science and Technology (core) The breakdown by category does not include FR9, DE41, DE42, UKM6 and UKM5 Source: Eurostat and DG REGIO calculations EN 3 EN
4 2. IDENTIFYING EUROPEAN HIGH GROWTH SECTORS At the national and European level, total employment and GVA can be broken down into 30 1 NACE categories based on the national accounts data. Regional accounts also provides a breakdown of employment and GVA but only in a six sector breakdown for NUTS2 regions. Therefore, growth sectors are first identified at the EU27 level based on the 30 sector breakdown. In a second step, these growth sectors are then related to the six sector breakdown at the regional level. At the European level, several sectors experienced high growth in GVA and/or employment. Figure 2 shows four quadrants according to GVA growth (above and below average) and employment growth (above and below) average. The quadrant where both employment and GVA growth is above the EU average were selected. Two more quadrants were partially considered. In one quadrant, GVA growth was above average but employment growth was below. The sectors where GVA growth was sufficiently high to compensate for lower employment growth or in some cases even employment decline were selected. In the other quadrant employment growth was above average, but GVA growth was below. Again in this quadrant only the sectors where high employment growth compensated for low GVA growth were included as growth sectors. The line on figure 2 shows this distinction. The second step of the selection involved considering whether all these sectors are drivers of economic growth. Two sectors were considered to be more beneficiaries than drivers of economic growth: Activities of households and Health and social work. Activities of households were excluded because it is a very small sector, especially in terms of GVA. The Health and social work sector was excluded as expenditure in this area contributes to well-being, but is not a main driver of the economy. Nevertheless, due to the ageing of the EU population, the Health and Social work sector will continue to grow and cover an important and growing share of total employment. The Education sector, which was not retained as growth sector due to its low GVA growth, is also likely to continue to grow given the increasing importance of education for the competitiveness of the EU, as mentioned in the Communication. The education and the health and social work sector, however, both share the characteristic that their performance cannot be determined from GVA or employment shares or growth. The main goal of these sectors is to increase the health and the education level of the EU's population. Therefore, increases in expenditure and employment in these sectors have to be assessed in the light of these goals. As such an analysis was not feasible within the confines of this communication and they were not included in the analytical section. As a result, nine sectors were identified as EU growth sectors (See Figure 2): Two services sectors with high productivity levels: Business activities (K) and Financial services. (J) 1 One category "Q: Extra-territorial organizations and bodies" was empty both at national and regional levels and has thus been excluded from this analysis. So the breakdown is officially in 17 and 31 categories respectively. To avoid confusion, as the graphs only show 16 and 30 categories, the text refers to 16 and 30 categories. EN 4 EN
5 Three services sectors with either high employment or GVA growth and average productivity: Trade (G); Hotels and restaurants (H); and transport and communication (I) Construction which experienced strong employment growth combined with a fairly strong, but below average, GVA growth (F) Three manufacturing sectors which achieved high GVA growth despite a decline in employment: Chemicals and man-made fibres, Electrical and optical equipment and Transport equipment. These three sectors together constitute the so-called high and medium-high tech manufacturing sector. (DG, DL, DM) In order to fit the format of regional data, these sectors are aggregated under broader categories. The first group falls under the heading Financial and business services (J+K), the second under Trade, transport and communication (G+H+I), and Construction (F) remains (See Figure 1). The fourth group is not identifiable at the regional level. Regional data combines the three manufacturing sectors with all other manufacturing sectors, several of which are in decline (see Figure 2), as well as Mining and Electricity, gas and water supply under the heading Industry (C+D+E). As a result, this aggregate can not be considered as a pure growth sector (See Figure 1). EN 5 EN
6 Figure 1: Table linking the NACE 30 sector breakdown at EU level to the 6 sector breakdown at regional level, identifying growth sectors NACE Code Data at National and European Level Full Name of Sector Productivity (EU27=100) A Agriculture, hunting and forestry 29 B Fishing 66 C Mining and quarrying 216 D Manufacturing 101 DA Manufacture of food products, beverages and tobacco 90 DB Manufacture of textiles and textile products 54 Growth Sector? NACE Code A+B Data at the regional level Growth Full Name of Sector Sector? Agriculture, hunting and fishing No DC Manufacture of leather and leather products 58 DD Manufacture of wood and wood products 64 DE Manufacture of pulp, paper and paper products; publishing and printing 114 DF Manufacture of coke, refined petroleum products and nuclear fuel 415 DG Manufacture of chemicals, chemical products and man-made fibres 205 Y C+D+E Industry In part DH Manufacture of rubber and plastic products 94 DI Manufacture of other non-metallic mineral products 100 DJ Manufacture of basic metals and fabricated metal products 94 DK Manufacture of machinery and equipment n.e.c. 106 DL Manufacture of electrical and optical equipment 108 Y DM Manufacture of transport equipment 120 Y DN Manufacturing n.e.c. 63 E Electricity, gas and water supply 271 F Construction 85 Y F Construction Y G Wholesale and retail trade; repair of motor vehicles, motorcycles and personal and household goods 77 Y G+H+I Y H Hotels and restaurants 66 Y I Transport, storage and communication 122 Y J Financial intermediation 207 Y K Real estate, renting and business activities 189 Y L Public administration and defence; compulsory social security 95 M Education 74 N Health and social work 77 O Other community, social and personal service activities 88 P Activities of households 29 J+K L thru P Trade, transport & communication Financial and business services Other services Y No EN 6 EN

7 Figure 2: Change in GVA and employment by sector in EU27, Change in GVA and employment by sector in the EU27, % Annual Average Change in employment, % 3% 2% 1% 0% -1% -2% -3% -4% EU27 Average change in employment Fishing Manufacture of textiles Manufacture of leather This line shows distinguishes sectors with a combined above average growth on GVA and employment (above the line) from those sectors with a below average growth (below the line) Manufacture of coke, petroleum and nuclear fuel Mining and quarrying Manufacturing n.e.c. Manufacture of wood Manufacture of paper and publishing Agriculture Social and personal services Manufacture of basic metals Hotels and restaurants Education Public administration etc Activities of households Manufacture of food Construction Manufacture of other non-metallic Electricity, mineral products gas and water supply Business activities Health and social work Trade Financial services Manufacture of rubber & plastic products Manufacture of machinery n.e.c. Transport and communication Manufacture of ransport equipment Manufacture of chemicals & man-made fibres Manufacture of electrical and optical equipment -5% -5% -4% -3% -2% -1% 0% 1% 2% 3% 4% 5% Bubble size reflects average employment Annual Average Change in GVA, and GVA share in 2005/2006 EU27 Average change in GVA EU Growth sectors in Green High and medium-high tech manufacturing EN 7 EN
8 3. SOURCES OF DATA AND REFERENCE YEARS The data presented in the fifth Progress Report is derived mainly from three sources: National accounts, Regional accounts and the Labour Force Survey. Due to the different rhythms at which these data sources are updated, the report contains a mix of end years. Below follows an overview of the availability of data by source: (1) National accounts 30 sector breakdown of GVA and employment From this source GVA was available up until 2006, while employment was only available up until 2005 (2) Regional accounts Regional accounts provides data on employment and GVA by sector, population and GDP up until Population and GDP are almost complete with only two new NUTS regions in Northern Scotland missing GVA for the 6 sector breakdown is complete with the exception of the UK Employment for the 6 sector breakdown is complete with the exception of the UK (3) Labour Force Survey This source provides a wide range of data including employment rates, unemployment rates, education levels, knowledge workers and employment by sector. Data is available up until Due to changes in the NUTS boundaries, time series may not cover the entire period Unemployment rate is complete with the exception of two new NUTS regions in Northern Scotland Employment by sector is complete. However to ensure a sufficiently large sample, the average of was used for employment in Trade, Hotels and Restaurants, High and medium-high manufacturing and Knowledge intensive services. Change in employment by sector could not be calculated for the smaller sectors as the changes were almost always within the margin of error. Therefore, national employment data from national accounts was used instead. This is the case for Trade, Hotels and Restaurants and High and medium-high tech manufacturing. Share of Knowledge workers is complete. High Education level is complete 4. DEFINITIONS 4.1. Human Resources in Science and Technology Core The group is defined by the OECD publication: "Manual on the measurement of human resources devoted to S&T "Canberra Manual" 1995 This indicator covers people who have successfully completed education at the third level in an S&T field of study and are employed in an S&T occupation. It is measured as a share of the economically active population. EN 8 EN
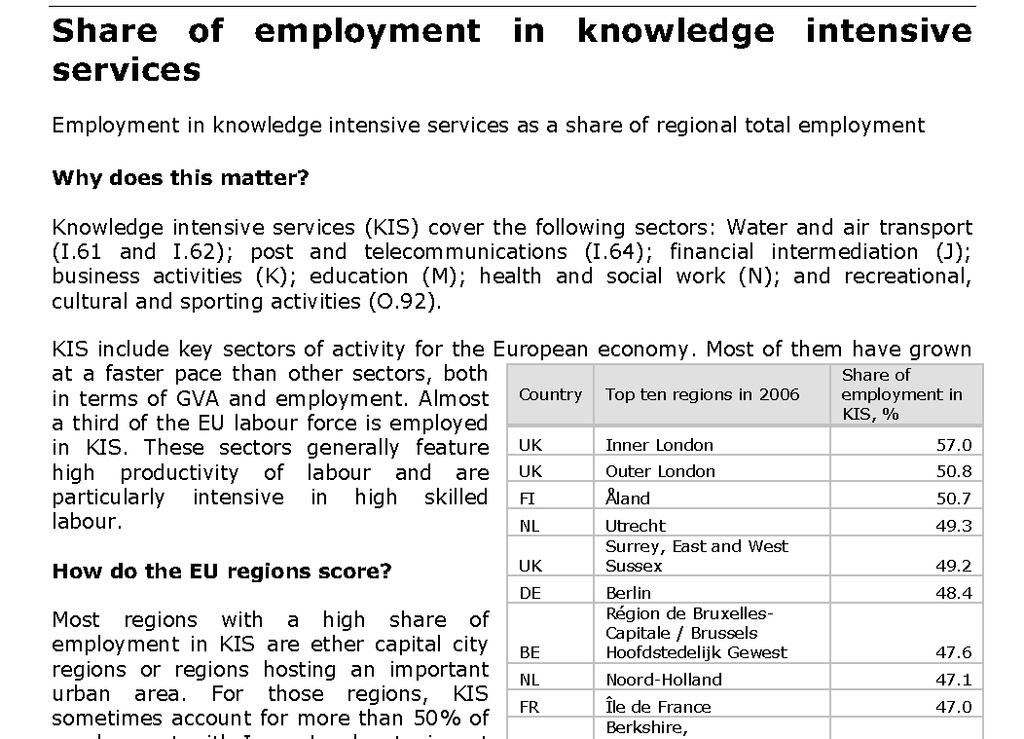
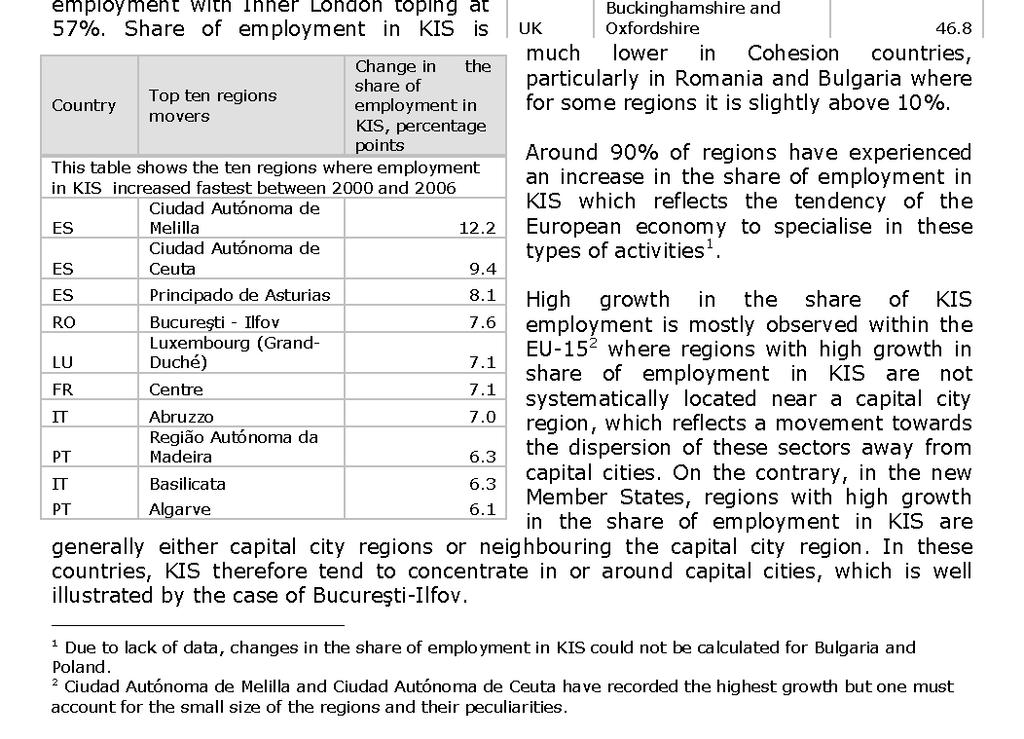
9 4.2. Knowledge Workers This defines employment by the type of occupation in all sectors. It covers the first three classes of the International Standard Classification of Occupations (ISCO) as defined by the International Labour Organisation classification: (1) legislators, senior officials and managers, (2) professionals and (3) technicians and associate professionals High and medium-high tech manufacturing Eurostat defines this group as the following NACE 2 digit codes: 24 Manufacture of chemicals and chemical product, 29 Manufacture of machinery and equipment n.e.c.; 30 Manufacture of office machinery and computers; 31 Manufacture of electrical machinery and apparatus n.e.c.; 32 Manufacture of radio, television and communication equipment and apparatus; 33 Manufacture of medical, precision and optical instruments, watches and clocks; 34 Manufacture of motor vehicles, trailers and semi-trailers; 35 Manufacture of other transport equipment, excluding 35.1 Building and repairing of ships and boats This group can be aggregated to the NACE codes DG, DL and DM with the only issue that it does not excluding 35.1 Building and repairing of ships and boats. This aggregation means that this sector can be identified in the 30 sector breakdown. This is also the definition that was used to measure employment Knowledge intensive services Eurostat defines knowledge intensive services as following: 61 Water transport; 62 Air transport; 64 Post and telecommunications; J: 65 to 67 Financial intermediation; K: 70 to 74 Real estate, renting and business activities; M: 80 Education; N: 85 Health and social work; 92 Recreational, cultural and sporting activities Due to the detailed breakdown of the NACE codes, only employment data based on the LFS is available. GVA can only be provided for a proxy which included 63 (Supporting and auxiliary transport activities; activities of travel agencies) and excludes 92 (Recreational, cultural and sporting activities), which was not used in this report. EN 9 EN
10 EN 10 EN
11 EN 11 EN
12 EN 12 EN
13 EN 13 EN
14 EN 14 EN
15 EN 15 EN
16 EN 16 EN
17 EN 17 EN
18 EN 18 EN
19 EN 19 EN
20 EN 20 EN
21 EN 21 EN
22 EN 22 EN
23 EN 23 EN
24 EN 24 EN
25 EN 25 EN
26 EN 26 EN
27 EN 27 EN
TVET REFORM PROJECT DISCUSSION PAPER INDUSTRY SKILLS COUNCILS. July 2010
 TVET REFORM PROJECT DISCUSSION PAPER INDUSTRY SKILLS COUNCILS July 2010 This paper sets out a rationale and proposal for the establishment of a network of Industry Skills Councils (ISC) in Bangladesh.
IAF Informative Document for QMS Scopes of Accreditation
 IAF ID 1:2010 International Accreditation Forum, Inc. IAF Informative Document IAF Informative Document for QMS Scopes of Accreditation (IAF ID 1:2010) IAF ID 1:2010 International Accreditation Forum,
GUIDANCE FOR THE ACCREDITATION OF HEALTH AND SAFETY MANAGEMENT SYSTEM CERTIFICATION BODIES
 GUIDANCE FOR THE ACCREDITATION OF HEALTH AND SAFETY MANAGEMENT SYSTEM CERTIFICATION BODIES ΕΣΥ GA-H&S/01/02/08-07-2010 1 ΕΣΥ GA-H&S Issue: 01 Revision: 02 Issue Date: 11-07-2003 Revision Date: 08-07-2010
LA VERSION ELECTRONIQUE FAIT FOI
 International Forum, Inc. IAF Informative Document IAF Informative Document For QMS and EMS Scopes of Issue 2 (IAF ID 1: 2014) International Forum, Inc. 2014 International Forum, Inc. Issue 2 IAF Informative
Policy on Witnessing Activities and Scope Management for Certification and Verification Bodies
 Policy on Witnessing Activities and Scope Management for Certification and Verification Bodies PS22 1) Purpose In order to conform with ISO/IEC 17011 clause 7.5.6, INAB shall: ensure that appropriate mechanisms
Explaining small firms TFP gap: An analysis with Italian, Spanish and French firm-level data
 Explaining small firms TFP gap: An analysis with Italian, Spanish and French firm-level data Cristina Fernández and Paloma Lopez-Garcia CompNet Workshop 20-21 September, Paris SERVICIO DE ESTUDIOS DEL
TOWARDS LATVIAN INFORUM MODEL INTRODUCTION AND BASE SCENARIO RESULTS
 TOWARDS LATVIAN INFORUM MODEL INTRODUCTION AND BASE SCENARIO RESULTS R.Počs, Dr.habil.oec., A.Auziņa, Mg.oec. V.Ozoliņa, Mg.oec. Riga Technical University Structure of presentation Current macroeconomic
Chapter 5 Flows, stocks and related concepts
 Draft annotated outline of Chapter 5 Chapter 5 Flows, stocks and related concepts Below is an annotated draft of Chapter 5. The text contains a number of issues which need to be discussed to guide further
Estimated Employment Multipliers for the City of Johannesburg
 Estimated Employment Multipliers for the City of Johannesburg Undertaken by Trade & Industrial Policy Strategies (TIPS) for The City of Johannesburg Metro 2015 Estimation of employment multipliers for
DEFINITIONS FOR SMALL AND MEDIUM ENTERPRISES IN MALAYSIA. (Approved for Adoption by National SME Development Council on 9 June 2005)
") DEFINITIONS FOR SMALL AND MEDIUM ENTERPRISES IN MALAYSIA (Approved for Adoption by National SME Development Council on 9 June 2005) Issued by: Secretariat to National SME Development Council Bank Negara
DEFINITIONS FOR SMALL AND MEDIUM ENTERPRISES IN MALAYSIA (Approved for Adoption by National SME Development Council on 9 June 2005) Issued by: Secretariat to National SME Development Council Bank Negara
Some thoughts on productivity and Greece
 Some thoughts on productivity and Greece Nikos Vettas Professor, Athens University of Economics and Business General Director, IOBE (vettas@iobe.gr, www.iobe.gr, http://www.aueb.gr/users/vettas) Bank of
Regional Competitiveness Indicators for Europe - Audit, Database Construction and Analysis
 Regional Studies Association International Conference Pisa, 12-15 April, 2003 Regional Competitiveness Indicators for Europe - Audit, Database Construction and Analysis Ben Gardiner Cambridge Econometrics
The Game of Trading Jobs for Emissions
 The Game of Trading Jobs for Emissions I. Arto, J. M. Rueda-Cantuche, E. Dietzenbacher, V. Andreoni, I. Mongelli, A. Genty and A. Villanueva Groningen, April 24-26, 2012 Joint Research Centre The European
Gross Domestic Product of Georgia in 2010
 Gross Domestic Product of Georgia in 2010 The real growth of Gross Domestic Product (GDP) of Georgia in 2010 amounted to 6.4 percent and deflator grew by 8.7 percent year-on-year. In the same period the
ENERGY USE OF PRIVATE HOUSEHOLDS BY PURPOSES OF FINAL CONSUMPTION
 STATISTICAL COMMISSION and ECONOMIC COMMISSION FOR EUROPE CONFERENCE OF EUROPEAN STATISTICIANS Joint ECE/Eurostat Work Session on Methodological Issues of Environment Statistics (Ma ale Hachamisha (15
in Korean Industries ( ): Estimates from KIP Database
: Estimates from KIP Database") RIETI/G-COE Hi-Stat International Workshop on Establishing Industrial Productivity Database for China, India, Japan and Korea October 22, 2010, Tokyo The Productivity Performance in Korean Industries (1990-2008):
RIETI/G-COE Hi-Stat International Workshop on Establishing Industrial Productivity Database for China, India, Japan and Korea October 22, 2010, Tokyo The Productivity Performance in Korean Industries (1990-2008):
GUIDELINES FOR DESCRIBING THE ACCREDITATION SCOPE OF CERTIFICATION BODIES CERTIFYING MANAGEMENT SYSTEMS
 GUIDELINES FOR DESCRIBING THE ACCREDITATION SCOPE OF CERTIFICATION BODIES CERTIFYING MANAGEMENT SYSTEMS Reviewed by: Natalija Jovičić Zarić MSc, Quality Manager (QM) Approved by: Dejan Krnjaić PhD, Director
THE ECONOMIC IMPACT OF INFORMATION TECHNOLOGIES AFTER THE FINANCIAL CRISIS
 THE ECONOMIC IMPACT OF INFORMATION TECHNOLOGIES AFTER THE FINANCIAL CRISIS Dale W. Jorgenson, Harvard University http://economics.harvard.edu/faculty/jorgenson/ Keynote Lecture to the Annual Conference
To all accredited and applicant Certification Bodies operating QMS, ISMS and ITSM certification.
 To all accredited and applicant Certification Bodies operating QMS, ISMS and ITSM certification. To all interested Bodies Our ref.: DC2017SSV324 Milan, 06/11/2017 Object: Technical circular N 22/2017 -
Measuring Global Value Chains with. (World Input-Output Database)
") This project is funded by the European Commission, Research Directorate General as part of the 7th Framework Programme, Theme 8: Socio-Economic Sciences and Humanities. Grant Agreement no: 225 281 Measuring
This project is funded by the European Commission, Research Directorate General as part of the 7th Framework Programme, Theme 8: Socio-Economic Sciences and Humanities. Grant Agreement no: 225 281 Measuring
Europe Direct is a service to help you find answers to your questions about the European Union New freephone number:
 2005 EDITION Europe Direct is a service to help you find answers to your questions about the European Union New freephone number: 00 800 6 7 8 9 10 11 A great deal of additional information on the European
MINISTRY OF PLANNING AND INVESTMENT LAO STATISTICS BUREAU
 Workshop on Energy Statistics for ASEAN Countries Kuala Lumpur, Malaysia 21-23 November 2016 Data Collection On Energy Statistics and Using Data to Establish The Supply and Use Table Sypaseut NAVONGSA
INDUSTRIAL PRODUCTION INDICES IN OCTOBER
 INDUSTRIAL PRODUCTION INDICES IN OCTOBER 2017 1 According to the preliminary data the Industrial Production Index 2, seasonally adjusted 3, decreased by 0.6% in October 2017 as compared to September 2017.
Industrial policy, Structural Change, and Pattern of Industrial Productivity Growth in Taiwan
 Industrial policy, Structural Change, and Pattern of Industrial Productivity Growth in Taiwan Tsu-tan Fu* Department of Economics & Center for Efficiency and Productivity Research Soochow University, Taiwan
INDUSTRIAL PRODUCTION INDICES IN JULY Figure 1. Industrial Production Indices (2010 = 100)
") INDUSTRIAL PRODUCTION INDICES IN JULY 2017 1 According to the preliminary data the Industrial Production Index 2, seasonally adjusted 3, increased by 0.2% in July 2017 as compared to June 2017. In July
INDUSTRIAL PRODUCTION INDICES IN JULY 2017 1 According to the preliminary data the Industrial Production Index 2, seasonally adjusted 3, increased by 0.2% in July 2017 as compared to June 2017. In July
Working Party on the Information Economy
 Unclassified DSTI/ICCP/IE(2004)10/FINAL DSTI/ICCP/IE(2004)10/FINAL Unclassified Organisation de Coopération et de Développement Economiques Organisation for Economic Co-operation and Development 22-Apr-2005
CENSUS OF INDUSTRIAL PRODUCTION
 CENSUS OF INDUSTRIAL PRODUCTION TANZANIA MAINLAND 2013 SUMMARY REPORT Vision To become a one stop centre for official statistics in Tanzania Mission To produce quality official statistics and service that
Mapping and identification of the regional potential of the Republic of Moldova
 The European Commission s science and knowledge service Joint Research Centre Mapping and identification of the regional potential of the Republic of Moldova Hugo Hollanders, Lina Stanionyte Launching
GOVERNMENT OF INDIA MINISTRY OF STATISTICS AND PROGRAMME IMPLEMENTATION CENTRAL STATISTICS OFFICE New Delhi Dated: January 12, 2017 PRESS RELEASE
 GOVERNMENT OF INDIA MINISTRY OF STATISTICS AND PROGRAMME IMPLEMENTATION CENTRAL STATISTICS OFFICE New Delhi Dated: January 12, 2017 PRESS RELEASE QUICK ESTIMATES OF INDEX OF INDUSTRIAL PRODUCTION AND USE-
Labour productivity growth and industry structure
 Johanna Sinkkonen Labour productivity growth and industry structure The impact of industry structure on productivity growth, export prices and labour compensation Bank of Finland Research Discussion Papers
Business-Facts: 3 Digit NAICS Summary 2015
 Business-Facts: 3 Digit Summary 215 Lake Anne 215 Polygon 1: LAKE ANNE 2, 11 Agriculture, Forestry, Fishing and Hunting 111 Crop Production 112 Animal Production and Aquaculture 113 Forestry and Logging
2008 Census of Industrial Production (NACE Rev 2)
") 30 November 2009 Census of Industrial Production (NACE Rev 2) Early Estimates Other 33% Chemicals 7% Computers 18% Food Products 19% Basic Pharmaceutical 23% Industrial Gross value Wages & Year added salaries
30 November 2009 Census of Industrial Production (NACE Rev 2) Early Estimates Other 33% Chemicals 7% Computers 18% Food Products 19% Basic Pharmaceutical 23% Industrial Gross value Wages & Year added salaries
Business-Facts: 3 Digit NAICS Summary 2015
 Business-Facts: 3 Digit NAICS Summary 25 McLean CRD 25 Polygon : MCLEAN, NAICS Code Business Description Establishment Employees Sales (in Millions) Agriculture, Forestry, Fishing and Hunting Crop Production
UN List of Industrial Products
 UN List of Industrial Products United Nations Statistics Division Workshop on Classifications, Montevideo, Uruguay, 14-18 March 2005 25/04/2005 1 History UN list of industrial products was developed in
Appendix A NAICS Codes and Titles
 Appendix A NAICS Codes and Titles The current analysis of the US economy uses a classification system that is based on the 6-digit North American Industry Classification System (NAICS) introduced in year
Holistic environmental accounting for businesses - Efficiently addressing the upstream value chains through life cycle based information
 Holistic environmental accounting for businesses - Efficiently addressing the upstream value chains through life cycle based information Christian Solli* a, Hogne N. Larsen, Camilla Haugsten b, Edvard
Greater Cambridge/Greater Peterborough LEP REPORT
 Greater Cambridge/Greater Peterborough LEP REPORT Contents 3...Foreword 4...Overview of our region s economy 5...High level overview of our region s industries and occupations 6...What are our top industries?
STATE OF HAWAI'I. No. of. Total Average Rep. Units Average Quarterly Quarterly Industry March Employment Wages Wages January February March
 STATE OF HAWAI'I TOTAL, including government 37,439 598,205 6,028,316,620 10,077 596,822 598,744 599,049 TOTAL GOVERNMENT 6 123,628 1,526,182,323 12,345 121,692 123,988 125,205 Federal 1 32,650 483,102,256
STATE OF HAWAI'I. No. of. Total Average Rep. Units Average Quarterly Quarterly Industry September Employment Wages Wages July August September
 STATE OF HAWAI'I TOTAL, including government 37,044 581,957 6,080,565,857 10,448 581,677 578,368 585,826 TOTAL GOVERNMENT 6 118,031 1,532,738,257 12,986 118,907 114,660 120,525 Federal 1 34,864 560,380,978
Concordance IPC V8 NACE REV.2
 Concordance IPC V8 NACE REV.2 Bart Van Looy 1,2 Caro Vereyen 1 Ulrich Schmoch 3,4 Research Division INCENTIM, Faculty of Economics & Business, KU Leuven 1 ECOOM (Centre for R&D Monitoring) 2 Universität
LITHUANIA-DENMARK BILATERAL TRADE review
 LITHUANIA-DENMARK BILATERAL TRADE review Published: 01.08.2017 SUMMARY Denmark is one of the most important trade partners for Lithuania. In 2016 the trade turnover in goods between the two countries slightly
Mapping Global Value Chains. Sébastien Miroudot Koen De Backer OECD
 Mapping Global Value Chains Sébastien Miroudot Koen De Backer OECD Why mapping GVCs is important. Trade policy. Trade and employment. National competitiveness and growth 4. Moving up the value chain and
Louisiana. NAICS code 1. Total recordable cases
 Table A-1. Percent relative standard errors for incidence rates of nonfatal occupational injuries and illnesses by industry and case types, 2012 recordable away from work, job transfer, or All industries
COUNCIL OF THE EUROPEAN UNION. Brussels, 10 September /09
 COUNCIL OF THE EUROPEAN UNION Brussels, 10 September 2009 12956/09 COVER NOTE from: COMPET 362 RECH 261 EDUC 127 ECOFIN 549 SOC 491 ENV 547 ENER 280 TELECOM 176 MI 315 IND 101 MAP 9 Secretary-General of
Regional Workshop on Measuring the Informal Sector and the Non-Observed Economy 4 7 October 2015 Tehran NON OBSERVED ECONOMY IN NATIONAL ACCOUNTS
 Regional Workshop on Measuring the Informal Sector and the Non-Observed Economy 4 7 October 2015 Tehran NON OBSERVED ECONOMY IN NATIONAL ACCOUNTS Bengi YOSUNKAYA (Annual Accounts Group) 1 Content Introduction
1. The Original Input-Output Table
 Turkey Mustafa Acar 1. The Original Input-Output Table The source table for Turkey s input-output (I-O) table is The Input-Output Structure of the Turkish Economy 1998, published by the State Institute
Statistics on Environmental Accounts: Water Use by Industries
 Statistics on Environmental Accounts: Water Use by Industries 2006 Final Report to EUROSTAT Agreement No. ESTAT 200471401002 incl. Amendment No 1. - Action 2 - Statistics Norway, 31. May 2006 Project Leader:
The role of physics in supporting economic growth and national productivity in Wales
 A report produced for the Institute of Physics by the Centre for Economics and Business Research April 2017 The role of physics in supporting economic growth and national productivity in Wales The Institute
I. MAIN ECONOMIC INDICATORS OF INDUSTRY
 I. MAIN ECONOMIC INDICATORS OF INDUSTRY MAIN INDICATORS OF INDUSTRY * 1995 Number of establishments 773 1050 1177 1234 1713 1816 2053 Output volume (at current prices), mln. drams 172048.2 261167.6 283484.8
Accelerate SSL Innovation for Europe
 JOB CREATION POTENTIAL OF HUMAN CENTRIC LIGHTING INDUSTRY IN EUROPE Accelerate SSL Innovation for Europe www.ssl-erate.eu FP7-ICT-2013-11-619249 ACCELERATE SSL INNOVATION FOR EUROPE AUTHORS: Luca Del Viva,
A new, comprehensive database for social LCA: PSILCA
 A new, comprehensive database for social LCA: PSILCA Andreas Ciroth, Franziska Eisfeldt GreenDelta GmbH New Delhi, ILCM 2015, September 2015 PSILCA database Agenda 1. Background and motivation 2. Approach
TREATMENTS APPLIED TO THE ROMANIAN INPUT/OUTPUT TABLE: A METHODOLOGICAL NOTE 1. David LABORDE and Csilla LAKATOS
 TREATMENTS APPLIED TO THE ROMANIAN INPUT/OUTPUT TABLE: A METHODOLOGICAL NOTE 1 by David LABORDE and Csilla LAKATOS 1. Introduction Among the 96 regions defined by GTAP 6 database, Romania constitutes a
Executive Summary Central region Number of establishments by division of industry manufacturing
 Executive Summary At present the structure of business trade, services and industrial activity, has changed dramatically. There are new kind of business in the economy, including the small scale industries
BUSINESS-FACTS: 2 DIGIT SIC SUMMARY
 Project : South Tulsa BUSINESS-FACTS: 2 DIGIT SUMMARY Prepared For You 1.00 Mile Radius TOT All Industries MAN All Manufacturing ( 20-39) RET All Retailing ( 52-59) 01 Agricultural Production - Crops 02
WIIW INDUSTRY STUDIES 2001/1
 WIIW INDUSTRY STUDIES 2001/1 Development and Prospects of the Leather and Leather Products Sector in the Central and Eastern European Countries WIIW INDUSTRY STUDIES In this series, The Vienna Institute
BUILDING A SYSTEM OF SYMMETRIC INPUT-OUTPUT TABLES APPLICATION TO PORTUGAL, Ana Maria Dias
 BUILDING A SYSTEM OF SYMMETRIC INPUT-OUTPUT TABLES APPLICATION TO PORTUGAL, 2005 Ana Maria Dias (anadias@dpp.pt) Department of Foresight and Planning and International Affairs (DPP) Ministry of Environment,
Cornwall and the Isles of Scilly LEP REPORT
 Cornwall and the Isles of Scilly LEP REPORT Contents 3...Foreword 4...Overview of our region s economy 5...High level overview of our region s industries and occupations 6...What are our top industries?
A Look Into 2017 Vertical Markets and SMBs: IDC European Vertical Markets Survey Methodology, 2016
 Industry Developments and Models A Look Into 2017 Vertical Markets and SMBs: IDC European Vertical Markets Survey Methodology, 2016 Giacomo Laurini IDC OPINION Between July and October 2016, the IDC European
Regional and Sectoral Economic Studies Vol (2016) C/Rector López Argüeta s/n, Granada, Spain.
 C/Rector López Argüeta s/n, Granada, Spain.") EMPLOYMENT GENERATED FROM THE MULTIPLIER EFFECT OF THE SPANISH PAPER INDUSTRY Soraya María RUIZ PEÑALVER * Abstract: The paper industry is really important in the production system because it is closely
EMPLOYMENT GENERATED FROM THE MULTIPLIER EFFECT OF THE SPANISH PAPER INDUSTRY Soraya María RUIZ PEÑALVER * Abstract: The paper industry is really important in the production system because it is closely
Schedule of Accreditation issued by United Kingdom Accreditation Service 2 Pine Trees, Chertsey Lane, Staines-upon-Thames, TW18 3HR, UK
 2 Pine Trees, Chertsey Lane, Staines-upon-Thames, TW18 3HR, UK provide quality management systems certification Sovereign House 29 Reddicap Hill Sutton Coldfield B75 7BQ Contact: Mr. Chris McMillan Tel:
Energy use in manufacturing 2015
 Energy 2016 Energy use in manufacturing 2015 Energy use in manufacturing diminished by 3 per cent in 2015 According to Statistics Finland, energy use in manufacturing decreased by three per cent from the
2. The Original Input-Output Table
 Azerbaijan Jesper Jensen and David Tarr 1 1. Introduction Azerbaijan is not represented individually in version 6 of the GTAP Data Base. The country is only represented indirectly via the composite region
Indian Manufacturing Sector: Growth and Productivity under the New Policy Regime
 International Review of Business Research Papers Vol. 4 No.2 March 2008 Pp.136-150 Indian Manufacturing Sector: Growth and Productivity under the New Policy Regime Manpreet Kaur* and Ravi Kiran** The present
Growth, skills and innovation in the Tasmanian industrial structure: key changes over time and potential for future growth
 Growth, skills and innovation in the Tasmanian industrial structure: key changes over time and potential for future growth AIRC Working Paper Series WP/0810 Growth, skills and innovation in the Tasmanian
Environmental Impacts of Household Consumption in Germany
 Paper for the Input-Output Meeting on the Managing the Environment at Sevilla 9 11 July 2008 Environmental Impacts of Household Consumption in Germany - 2005 Mayer, Helmut 1 1. Economic activities of private
Key Enabling technologies are technology domains that are knowledge intensive and associated with high R&D intensity, rapid innovation cycles, high ca
 Prof. Göran Roos Key Enabling technologies are technology domains that are knowledge intensive and associated with high R&D intensity, rapid innovation cycles, high capital expenditure, highly-skilled
UK PRINTING THE FACTS & FIGURES 600 MILLION 13.5 BILLION 122, MILLION 6.1 BILLION 8,600 WORLD S FIFTH P.A. CAPITAL INVESTMENT
 UK PRINTING THE FACTS & FIGURES 600 MILLION P.A. CAPITAL INVESTMENT WORLD S FIFTH LARGEST PRODUCER OF PRINTED PRODUCTS 13.5 BILLION TURNOVER 122,000 EMPLOYEES 750 MILLION POSITIVE TRADE BALANCE IN 2014
Business-Facts: 2 Digit SIC Summary 2010
 Business-Facts: Digit Summary Radius : 777 RICHMOND HWY, ALEXANDRIA, VA 6-8,. -. Miles, s + TOT All Industries 9 8,86,8. 6 MAN All Manufacturing ( -9).7 RET All Retailing ( -9) 8,9.7 9 ADM Public Administration
Utilization of Cedefop Forecast: PROJECT TRANSFERABILITY OF SKILLS. Jiri Branka
 Utilization of Cedefop Forecast: PROJECT TRANSFERABILITY OF SKILLS Jiri Branka branka@nvf.cz www.nvf.cz/observatory www.czechfutureskills.eu Project Description Transferability of skills across economic
ABN AMRO Group N.V. Overview total assets 2016
 ABN AMRO Group N.V. Overview total assets 06 This document provides an overview of ABN AMRO s balance sheet composition and loan portfolio in 06, as part of the bank s commitment to provide further transparency
ENERGY BALANCE COMPILATION
 ENERGY BALANCE COMPILATION Study tour on Energy statistics and Energy balances under INOGATE programme Sofia, 5-7 November 2013 Maria Georgieva OVERVIEW INTRODUCTION DATA SOURCES FOR ENERGY BALANCES STRUCTURE
Ireland s Revealed Comparative Advantage
 Ireland s Revealed Comparative Advantage by Diarmaid Addison-Smyth * ABSTRACT The growth in the Irish economy over the last decade has been attributed to many factors one of which has been the success
Economic Impacts. Refineries in Skagit County
 Economic Impacts of the Refineries in Skagit County February 13, 2015 Center for Economic and Business Research Prepared for the Economic Development Association of Skagit County Table of Contents Executive
The Forward and Backward Linkage Effects of the Energy Sector in Turkey
 The Forward and Backward Linkage Effects of the Energy Sector in Turkey Mehmet MERCAN mmercan48@hotmail.com Abdullah ÖZDEMIR abdullahozdemir@hotmail.com Introduction Abstract: Energy sector has a great
China. Li Shantong and He Janus Data Source. 2. Sector Classification
 China Li Shantong and He Janus 1 1. Data Source The source of the initial input-output (I-O) table for China is "Input-Output Table of China - 2002 from the Department of National Economy Accounting, State
Stoke-on-Trent and Staffordshire LEP REPORT
 Stoke-on-Trent and Staffordshire LEP REPORT Contents 3...Foreword 4...Overview of our region s economy 5...High level overview of our region s industries and occupations 6...What are our top industries?
Alberta Ministry of Labour 2015 Alberta Wage and Salary Survey
 Alberta Ministry of Labour 2015 Alberta Wage and Salary Survey The Alberta Wage and Salary Survey is undertaken by the Alberta Ministry of Labour to provide current wage rates and skill shortage information
Vertical Specialisation in Trade: the case of Malaysia*
 Preliminary Draft Vertical Specialisation in Trade: the case of Malaysia* Wai-Heng Loke Division of Economics University of Nottingham Ningbo China waiheng.loke@nottingham.edu.cn Abstract: The development
The Gross National Product (GNP) is GDP added by net foreign income. National Income is GNP deducted by indirect net taxes (net) and depreciation.
 is GDP added by net foreign income. National Income is GNP deducted by indirect net taxes (net) and depreciation.") M E T A D A T A BASIC INFORMATION 1 Data Category : Gross Domestic Product (GDP) 2 Statistics Disseminator : Statistics Department, Bank Indonesia 3 Address : Jl. M.H. Thamrin No. 2 Jakarta 4 Contact :
M E T A D A T A BASIC INFORMATION 1 Data Category : Gross Domestic Product (GDP) 2 Statistics Disseminator : Statistics Department, Bank Indonesia 3 Address : Jl. M.H. Thamrin No. 2 Jakarta 4 Contact :
27,000 sf Warehouse / Office ~ Two Buildings on 2 acres
 27,000 sf Warehouse / Office ~ Two Buildings on 2 acres 4106 Mariah Circle, Saint Lucie County, FL $595,000. Metzger Rd A B Mariah Circle Saint Lucie County Zoning: IL - Light Industrial 290 Frontage on
The annual variation of the Industrial Price Index stood at 2.8%, seven tenths below that registered in September
 24 November 2017 Industrial Price Index. Base 2010 October 2017. Provisional data The annual variation of the Industrial Price Index stood at 2.8%, seven tenths below that registered in September The monthly
The output of Environmental Goods and Services Sector in Poland
 Broniewicz E. (2016), The of Environmental Goods and Services Sector in Poland, Journal of International Studies, Vol. 9, No 3, pp. 53-61. DOI: 10.14254/2071-8330.2016/9-3/4 The of Environmental Goods
Table 1 shows the general form of China 2010 I-O Table:
 China Liu Yu 1 and Jie Chen The original 2010 Input-Output Table doesn t have multi-product sector. After some adjustments, the data tables are reclassified and re-balanced to provide the matrices required
Future skills needs in EU and skills transferability in 2020: sector meta-analysis
 Future skills needs in EU and skills transferability in 2020: sector meta-analysis Jiří BALCAR, RPIC-ViP s.r.o. i Abstract Employment and its changes caused by restructuring are topics, which European
Consultation on the regulatory fitness of chemicals legislation (excluding REACH)
") Consultation on the regulatory fitness of chemicals legislation (excluding REACH) Purpose and Context of the Consultation a) The Fitness Check of the most relevant chemicals legislation excluding REACH
Consultation on the regulatory fitness of chemicals legislation (excluding REACH) Purpose and Context of the Consultation a) The Fitness Check of the most relevant chemicals legislation excluding REACH
Environmental-Economic Accounting (EEA)
") Federal Statistical Office Germany Environmental-Economic Accounting (EEA) Environmental Impacts of Household Consumption in Germany 1995-2005 August 2008 Paper presented at the Input-Output Meeting on
Federal Statistical Office Germany Environmental-Economic Accounting (EEA) Environmental Impacts of Household Consumption in Germany 1995-2005 August 2008 Paper presented at the Input-Output Meeting on
Non-technical Innovations Definition, Measurement & Policy Implications. The new service economy: growth and implications for service innovation
 Karlsruhe, October 2008 Non-technical Innovations Definition, Measurement & Policy Implications The new service economy: growth and implications for service innovation Professor of Economic Policy, University
Gloucestershire LEP REPORT
 Gloucestershire LEP REPORT Contents 3...Foreword 4...Overview of our region s economy 5...High level overview of our region s industries and occupations 6...What are our top industries? 7...What are our
International Standard Industrial Classification of All Economic Activities (ISIC)
") ST/ESA/STAT/SER.M/4/Rev.3.1 DEPARTMENT OF ECONOMIC AND SOCIAL AFFAIRS STATISTICS DIVISION STATISTICAL PAPERS SERIES M NO. 4, REV.3.1 International Standard Industrial Classification of All Economic Activities
ST/ESA/STAT/SER.M/4/Rev.3.1 DEPARTMENT OF ECONOMIC AND SOCIAL AFFAIRS STATISTICS DIVISION STATISTICAL PAPERS SERIES M NO. 4, REV.3.1 International Standard Industrial Classification of All Economic Activities
Compilation of use tables at basic prices and split to domestic production and imports in Hungary
 22nd International Input-Output Conference Lisbon, Portugal, July 14 18, 2014 Compilation of use tables at basic prices and split to domestic production and imports in Hungary Mária Forgon and Éva Varga
Market Services sector turnover in 2009 is 1,013,479 million euros, 13.6% less than the previous year
 1 December 2010 Annual Services Survey 2009 (Results preview) Market Services sector turnover in 2009 is 1,013,479 million euros, 13.6% less than the previous year Employed personnel decreases 5.1% and
Intensity and Use of Energy in Indian Industries and the Contribution of Energy to Growth
 Fifth World KLEMS Conference, June 04-05 2018, Harvard University Intensity and Use of Energy in Indian Industries and the Contribution of Energy to Growth Bishwanath Goldar Suresh Chand Aggarwal Pilu
Census 2002 Industry Codes
 Census 2002 Industry Codes (PEIO1ICD, PEIO2ICD, TEIO1ICD) For more information on the Census 2002 industry and occupations codes, go to http://www.bls.gov/cps/cpsoccind.htm 0170-0290 Agriculture, forestry,
Job Reallocation and Labour Mobility among Heterogeneous Firms in Norway
 Job Reallocation and Labour Mobility among Heterogeneous Firms in Norway Dan Li Thesis for the Master of Philosophy in Environmental and Development Economics Department of Economics University of Oslo
Who Gained Market Share in Indonesian Manufacturing?
 Who Gained Market Share in Indonesian Manufacturing? Sadayuki Takii and Eric D. Ramstetter ICSEAD and Graduate School of Economics, Kyushu University Working Paper Series Vol. 2008-14 March 2008 The views
ACCREDITATION SCHEDULE
 ACCREDITATION SCHEDULE ORGANISATION BSCIC Certifications Private Limited CERTIFICATE NUMBER S3931107IF (QMS) M3931107IF (Management Systems) LOCATIONS AND COUNTRIES COVERED BY ACCREDITATION Refer to Attachment
List of CDP-ACS. The full list of classifications for CDP s Activity Classification System (CDP-ACS)
") List of CDP-ACS The full list of classifications for CDP s Activity Classification System (CDP-ACS) Contents Introduction to CDP-ACS... 3 List of CDP-ACS... 4 Page 2 of 10 CDP Worldwide 2018 @cdp www.cdp.net
List of CDP-ACS The full list of classifications for CDP s Activity Classification System (CDP-ACS) Contents Introduction to CDP-ACS... 3 List of CDP-ACS... 4 Page 2 of 10 CDP Worldwide 2018 @cdp www.cdp.net
Belarus. Irina Tochitskaya. 1. Source Data
 Belarus Irina Tochitskaya The Belarusian input-output (I-O) table in the GTAP 7 p4 Data Base was constructed from inputoutput tables and some supporting data supplied by the Ministry of Statistics and
INFORMALITY AND BEYOND WHAT WE REALLY KNOW THE FOURTH IMF STATISTICAL FORUM LIFTING THE SMALL BOATS: STATISTICS FOR INCLUSIVE GROWTH
 INFORMALITY AND BEYOND WHAT WE REALLY KNOW THE FOURTH IMF STATISTICAL FORUM LIFTING THE SMALL BOATS: STATISTICS FOR INCLUSIVE GROWTH Roberto Luis Olinto Ramos Diretor de Pesquisas Washington DC November
CITY OF CALERA BUSINESS LICENSE FEE CODE SCHEDULE **All licenses issued are required to pay a $10.00 issuance fee in addition to their license fee**
 CITY OF CALERA BUSINESS LICENSE FEE CODE SCHEDULE **All licenses issued are required to pay a $10.00 issuance fee in addition to their license fee** Code Description Schedule 111 Farming and Crop Production