Price Monitoring for Food Security in the Kyrgyz Republic
|
|
|
- Christal Hunt
- 5 years ago
- Views:
Transcription


1 Issue 21 August 2017 Price Monitoring for Food Security in the Kyrgyz Republic Monthly monitoring and outlook of basic food prices in the Kyrgyz Republic Highlights and outlook for the next few months Domestic wheat flour prices remain stable since May 2017 in all markets around the country. Export prices for wheat from Russian Federation (RF) decreased by 2 percent and export prices from Kazakhstan remain stable on a month-on-month basis in August Close monitoring of import dependent commodities is important throughout the president s elections in the country. In August 2017 prices for vegetables were decreasing: prices for potatoes, cabbages and carrots decreased by 12, 49 and 3 percent respectively on a month-on-month basis after significant increase since beginning of 2017 due to the harvest delay. The US dollar and Russian ruble stayed stable, while the Kazakh tenge depreciated by 3 percent against the national currency on a month-on-month basis in August Currency movements are among the main driving forces of the retail prices of imported basic food commodities including wheat, vegetable oil and sugar. In July 2017 the aggregate volume of remittances decreased by 6 percent on a month-on-month basis but still remain high by 17 percent higher compared to July The record high of the inflow of remittances was observed in June 2017 at all of the time and it reached USD 203 million. Share of remittances in GDP reached 32.7 % in GDP per capita reached Kyrgyz som (~477.6 USD) during January-June of 2017, which is by 5 percent higher compared to the same period of previous year. The minimum subsistence reached 5052 Kyrgyz som (~74 USD) during January - June of 2017, which is by 4 percent higher compared to the same period of The average salary in the country reached Kyrgyz som (~214 USD) during January June of 2017, which is by 6 percent higher compared to the same period of Trends of retail prices of the nine main food security commodities¹ (1 month, 3 months and 1 year) Agroclimatic context Jul 2017 May 2017 Aug 2016 Jul 2017 May 2017 Aug 2016 Wheat flour(1-st grade) 0% -2% -3% Vegetable (carrot) -3% 23% 52% Rice -1% -2% -8% Vegetable (potato) -12% -36% 35% Meat (beef) 2% 4% 7% Vegetable (cabbage) -49% -53% 12% Meat( mutton) -1% 1% 6% Fruit (apple) -8% 14% 1% Мilk 2% -2% 4% Sugar -1% 9% 4% Eggs -1% -6% 1% Vegetable oil 0% -2% -8% According to the IRI 2 flexible precipitation forecast for October-December 2017 it is expected that precipitation will stay normal in all the areas of the country, except southern-west part of Issiyk-Kul province, where is 60 percent probability for precipitation increase, in Talas district of Talas province and Toktogul district of Jalalabad province there is 40 percent probability of precipitation decrease (Map 1). Besides that, there is 60 percent of probability of temperature increase during September-November 2017 in central part of KR and 40 percent probability in western part of Issyk-Kul province and eastern part of Talas province. Map 1. IRI flexible precipitation forecast (October-December 2017) Map 2. Seasonal temperature forecast (September November 2017)


2 Price Monitoring for Food Security in the Kyrgyz Republic Wheat flour Global wheat production and prices Wheat is the main staple food in the KR. However, due to the low quality of domestically produced wheat, the Kyrgyz Republic imports wheat flour, which makes the country more vulnerable to international price volatility and therefore close monitoring of the wheat market in exporting countries is important. The key export countries are the Russian Federation (11 percent) and Kazakhstan (88 percent). Since 2015, the prices for wheat from both countries have been fluctuating without any significant changes 14. In August 2017, wheat export prices from the Russian Federation decreased by 2 percent on a month-on-month basis but increased by 3 percent over three months. The current export prices are 3 percent higher compared to the same month in 2016, and 47 percent lower than the record high reached in February Export prices of wheat from Kazakhstan 6 Fig 1.Retail price of wheat, Kazakhstan and Russian Federation (US dollar per Kazakhstan, Wheat (milling), Export ton) (USD/tonne), Average Russia, Wheat (milling), Export (USD/tonne), Average Issue 21 August 2017 remained stable on a month-on-month basis and over three months. Prices are 5 percent lower than the same month in 2016 and 52 percent lower than the record high reached in April National retail prices of wheat flour In August 2017, the domestic retail price of wheat flour was stable on a month-on-month basis at Kyrgyz som per kg. Domestic prices remained 3 percent lower than the same month in 2016 and 6 percent lower compared to average price of the last five years. The highest recorded prices for domestic wheat flour were observed in December 2014, but current prices are 17 percent lower. The highest prices in August 2017 were observed in Nookat town (43 Kyrgyz som per kg) and the lowest in Talas town (21 Kyrgyz som per kg). Fig 2. ALPS for price of wheat flour (first grade, kyrgyz som per kg, national average) Vegetable prices Vegetable prices (cabbages, carrots, potatoes) As a result of seasonal price changes and a protracted wet spring, which resulted in a delay for crop sowing, domestic prices for vegetables have been increasing since the beginning of ALPS 13 analysis for vegetable prices illustrates that potato, carrot and cabbage prices have experienced an alarmingly higher than normal seasonal trend between February and August 2017 as a result of the delayed new harvest. Prices for cabbages In August 2017 prices for cabbages decreased by 49 percent on a month-on-month basis and 53 percent over the last three months. However, prices are by 12 percent higher compared to August The highest prices were observed in Kara-Suu (47 Kyrgyz som per kg) town and the lowest in Karakol (11 Kyrgyz som per kg) town. Prices for carrots In August 2017 prices for carrots started to decrease; it decreased by 3 percent on a month-on-month basis. But still remain high by 23 percent over the last three months and by 52 percent compared to August The highest prices for carrots were observed in Bishkek (35 Kyrgyz som per kg) town and the lowest in Isfana and Batken (23 Kyrgyz som per kg) town. Prices for potatoes Potato are the second most consumed staple food in the Kyrgyz Republic, and according to physiological norms each person should consume 270 grams of potatoes per day. Since the beginning of 2017 potato prices have significantly 14 increased. But from July 2017, as expected with the new harvest, prices started to decrease. In August 2017 prices decreased by 12 percent on a month-onmonth basis and still remain high by 49 percent over the last three months. However, prices are 35 percent higher than in August 2016 and 18 percent higher than the average price over five years. The prices of potatoes are the highest in Jalal-Abad town (32 Kyrgyz som per kg) and the lowest in Pokrovka town (15 Kyrgyz som per kg). Fig.3 ALPS for national average of cabbages prices (Kyrgyz som per kg) Fig.4 ALPS for national average of carrots prices (Kyrgyz som per kg) Fig.5 ALPS for national average potato prices (Kyrgyz som per kg)

, which makes the country")

3 Price Monitoring for Food Security in the Kyrgyz Republic Issue 21 August 2017 Other basic food commodities International and domestic sugar prices Since the beginning of 2017 global sugar prices have been decreasing. However, in August 2017, global sugar 9 prices were stable on a month-on-month basis and decreased by 10 percent over three months. The prices are 27 percent lower than in August 2016, and 22 percent higher than the 5-year average. The Kyrgyz Republic imports sugar from Ukraine and Belarus, due to the low domestic production (in 2016 only half of required sugar for internal consumption was produced), which makes the country vulnerable to international price volatility. However, prices for sugar from both exporting countries increased in According to the National Statistics Committee of Belarus, the country produced 42.6 percent less compared to the same period from January to July The prices are also increasing in Ukraine due to the devaluation of the national currency (hryvnia) and lower than expected sugar yield (National Agrarian University). In August 2017, the domestic prices for sugar decreased by 1 percent on a month-on-month basis and increased by 9 percent over the last three months. However, in 2017 Fig 5. ALPS for national average sugar price (Kyrgyz som per kg) domestic sugar production could increase due to an increase in the sugar beet production area which, based on national data, has already increased by 49 percent in 2017 compared to 2016, and the modernization of domestic sugar processing factories in The highest domestic prices of sugar were observed in Kerben and Nookat (65 Kyrgyz som) town and the lowest in Bishkek (57 Kyrgyz som) town. ALPS 13 analysis illustrates that sugar prices are experiencing a higher than normal seasonal trend from June to August Vegetable oil Vegetable oil is also one of the key staple food, with requiremost of 30 grams to be consumed per person per day. Due to the low domestic production (only 11.5 thousand tons in 2016), Kyrgyz Republic depends on the import of vegetable oil. In August 2017, the national prices of vegetable oil were stable on a month-onmonth basis but lower by 2 percent over three months. The prices were 8 percent lower than the same month last year. The retail prices were the highest in Kara-Suu (105 Kyrgyz som) town and the lowest in Jalal-Abad town (90 Kyrgyz som). Fig 6. Average prices for vegetable oil by markets (kyrgyz som per liter) Meat (beef and mutton) Meat is also one of the key staple foods in the Kyrgyz Republic and according to physiological norms each person should consume 170 grams per day. Prices for beef and mutton have been stable since In August 2017 prices for mutton decreased by 1 percent on a month-on-month basis and increased by 1 percent over the last three months. The prices are 6 percent higher compared to August However, the prices of beef increased by 2 percent on a month-on-month basis and by 4 percent over the last three months. The prices were 7 percent higher than in August The prices of both beef (330 Kyrgyz som per kg) and mutton (350 Kyrgyz som per kg) were the highest in Batken town and the lowest in Pokrovka town (mutton 282 Kyrgyz som per kg, beef 258 Kyrgyz som per kg). Milk According to physiological norms each person should consume 560 grams of milk and dairy products per day. However, domestic prices for milk have been stable since the beginning of 2016 with some seasonal variations 14. In August 2017, the domestic price of milk increased by 2 percent on a month-onmonth basis and decreased by 2 percent over the last three months. The prices are 4 percent higher compared to August The retail prices of milk were the highest in Batken (40 Kyrgyz som per liter) and the lowest in Pokrovka (18 Kyrgyz som per liter) town. The highest recorded price of milk was reached in January 2015 and current prices are 12 percent lower. Fig 7. Retail price of meat (beef and mutton, kyrgyz som per kg) Fig 8. Average prices for milk by markets ( kyrgyz som per liter)


 Remittances According to the NSC the poverty rate reached 25.4 percent in 2016.")

4 Price Monitoring for Food Security in the Kyrgyz Republic Issue 21 August 2017 Apples Apples are the most consumed and available fruit in the country. In August 2017, prices for apples decreased by 8 percent on a month-on-month basis but still remain high by 14 percent over the last three months. As it was expected with new harvest, prices for apples started to decrease. The current prices are 32 percent lower than the record high reached in June 2015 and 11 percent higher than the 5-year average. The prices for apples are the highest in Tokmok (96 Kyrgyz som per kg) and the lowest in Isfana (25 Kyrgyz som per kg). Fig 9. ALPS for national average apple prices (Kyrgyz som per kg) Remittances According to the NSC the poverty rate reached 25.4 percent in However, poverty rate is much higher excluding the income from remittances and reaches 31.5 percent (specifically high in Batken province 53.6 percent). That shows country s vulnerability to the economy of RF from where most of the remittances originate. In July 2017 the aggregate volume of remittances decreased by 6 percent after significant increase and record high in June 2017 at all time. Fig 10. Aggregate amount of remittances by months (in mln.usd) Fuel prices (petrol and diesel) 15 Since the prices of diesel and petrol heavily impact on food prices, the stability of diesel and petrol prices are critical, especially for rural areas. In August 2017, prices for diesel decreased by 1 percent on a month-on-month basis and by 2 percent over the last three months. The prices are 13 percent higher compared to August Prices for petrol also decreased by 1 percent on a month-on-month basis and by 2 percent over the last three months. Current prices are 6 percent higher than in August Prices for diesel are the highest in Batken, Isfana, Kara-Suu and Chaek towns (37 Kyrgyz som) and the lowest in Naryn (34.2 Kyrgyz som). Prices for petrol are the highest in Batken and Kerben (40 Kyrgyz som) and the lowest in Naryn town (36 Kyrgyz som). Fig 11. Retail prices of petrol (92 octane) and diesel (Kyrgyz som / litre) Currency exchange rate (Kyrgyz som versus US dollar, Russian ruble, Kazakhstan tenge) In August 2017, the US dollar was stable against the national currency on a month-on-month basis (68.89 Kyrgyz som to 1 USD) and by 2 percent higher over the last three months. It remains stable compared to August The highest rate of the US dollar against the Kyrgyz som was observed in December 2015, and in comparison the current rate is 9 percent lower. Since the beginning of 2017, the Russian ruble has been appreciating, which is a sign of the economic recovery of the Russian Federation. In August 2017, the Russian ruble was stable against the Kyrgyz som on a month-on-month basis ( Kyrgyz som per 1 Russian ruble) and by 2.9 percent lower over the last three months. It appreciated by 9.3 percent compared to the same month in The Kazakh tenge depreciated by 3 percent on a month-on-month against the Kyrgyz som (0.21 Kyrgyz som per 1 Kazakh tenge) and by 4 percent over the last three months. It appreciated by 4 percent compared to August Currency movements are among the main driving forces of the retail prices of imported basic food commodities including wheat, vegetable oil and sugar. With this in mind, close monitoring of currency exchange rates are required. Official currency exchange (US Dollar/Kyrgyz Som) Official currency exchange (Russian Ruble/Kyrgyz Som) Official currency exchange (Kazakh Tenge/ Kyrgyz Som)

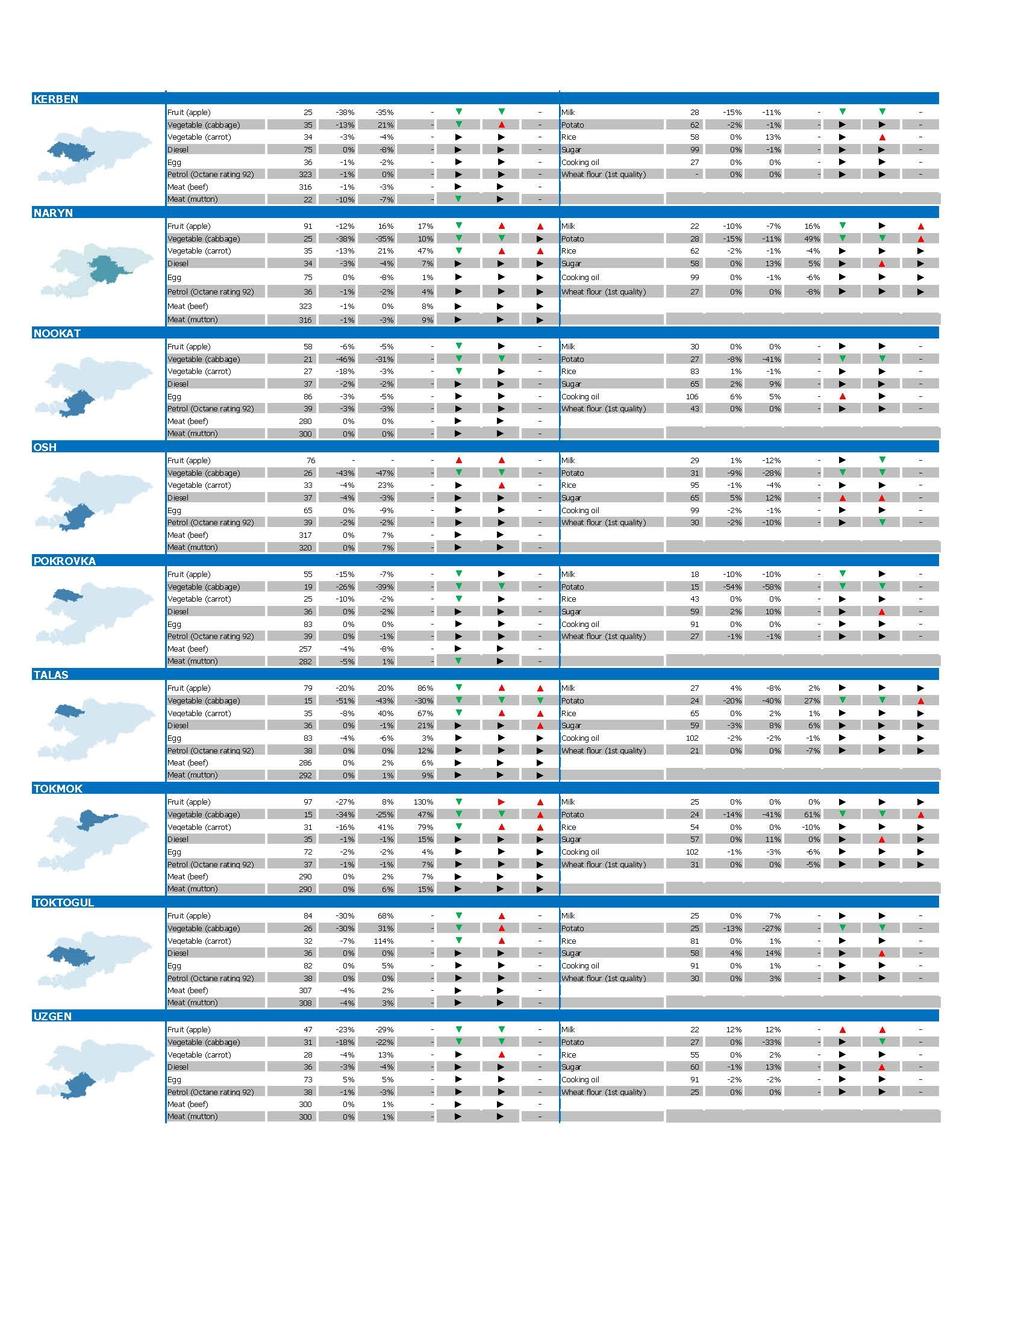
5 Annex: Prices of 9 food security commodities The latest retail prices are compared against prices in the previous month, three months ago, and one year ago.

6
.")
7 Data sources and methodologies 1 Data for retail prices of 9 food security commodities are collected by the National Statistics Committee of the Kyrgyz Republic on a daily basis from 10 markets across the country (Bishkek, Osh, Tokmok, Kara-balta, Talas, Karakol, Naryn, Kara-suu, Kyzyl-kiya and Batken). 2 International Research Institute (IRI), The mission of the IRI is to enhance society s capability to understand, anticipate and manage the impacts of climate in order to improve human welfare and the environment, especially in developing countries. The IRI conducts this mission through strategic and applied research, education, capacity building, and by providing forecasts and information products with an emphasis on practical and verifiable utility and partnership. 3 Sea Surface Temperature (SST) forecast model 4 El Niño - refers to the large-scale ocean-atmosphere climate phenomenon linked to a periodic warming in sea-surface temperatures across the central and east-central equatorial Pacific. Typical effects of El Nino include dry weather in Australasia and heavy rain in South America. La Niña- is characterized by unusually cold ocean temperatures in the Equatorial Pacific, compared to El Niño. La Niña and El Niño are the "cold" (La Niña) and "warm" (El Niño) phases of the El Nino-Southern Oscillation (ENSO). ENSO is series of linked weather- and oceanrelated phenomena. 5 Normalized Difference Vegetation Index (NDVI)-provides the alternative measures of the relative vegetation health. These indices can be used to monitor areas where vegetation may be stressed, as a proxy to detect potential drought. earthobservation/asis/index_2.jsp?lang=en 6 Data for export price of wheat in Kazakhstan is Free on Board [FOB] price for milled wheat at Aktau port. The FAO Global Information and Early Warning System (GIEWS) updates this data on a monthly basis. Methodological details are available online at NSC National Statistical Committee 8 Commodity Markets Outlook, April World Bank Quarterly Report. Agricultural Information Market System (AMIS) -is an interagency platform to enhance food market transparency and encourage coordination of policy action in response to market uncertainty. AMIS focuses on four crops that are particularly important in international food markets, namely wheat, maize, rice and soybeans. 9 nternational grain Council (IGC)-Intergovernmental organization promoting the international cooperation in grains trade Currency exchange rate used is the official daily exchange rate provided by the National Bank of Kyrgyz Republic. The monthly average rate was calculated for the bulletin. 11 International price of sugar refers to the International Sugar Agreement (ISA) daily price for raw sugar, obtained from the International Sugar Organization. The price data is widely used by global market monitoring publications such as the World Bank s Commodity Markets Outlook ( 12 The deviation of the observed prices and estimated seasonal prices are provided by WFP s Alert for Price Spikes (ALPS) in units of standard deviations. In July 2015, for example, the standard deviation of observed prices of wheat flour price and estimated seasonal prices was 0.74 in Osh, indicating that the market experienced unusually high price levels during this month. Seasonal prices were estimated using the price data for the last 10 years. Methodological guidance is available online at groups/public/documents/manual_guide_proced/wfp pdf 13 Alert for Price Spikes (ALPS) provides early warning of rising food prices by detecting abnormally high levels of local food prices. The ALPS calculates the difference between the latest observed price available and the corresponding seasonal price trend. Colour-shaded bar indicate the periods where the actual price (black line) was above the estimated trend (blue dotted line). The ALPS attributes colour codes according to the severity of the gap between the two lines. 14 Seasonality refers to periodic fluctuations that occur regularly based on a particular season. Price fluctuations is considered normal if change within 5% for 1 month, 10% for 3 months, 15% for 1 year. 15 Data for fuel prices are provided by the National Statistics Committee on a monthly basis for 95-octane petrol, 92-octane petrol, 80- octane petrol and diesel. This bulletin reports the prices of 92-octane petrol and diesel which are the most commonly used for food transportation and agricultural machinery. This bulletin is prepared by the Technical Working Group on Price Monitoring for Food Security (TWG-PMFS) which is chaired by the Ministry of Economy and attended by the Ministry of Agriculture, Food Industry and Melioration, the National Bank, the National Statistics Committee and the National Institute for Strategic Studies. Technical support is provided by the United Nations World Food Programme (WFP) and the Food and Agriculture Organization of the United Nations (FAO). The bulletin aims to provide timely information and analysis on the domestic prices of basic food and non-food items, complemented by analysis of international markets. It also provides early warning on high food prices. The August 2017 edition is the 21st issue of the bulletin. Should any recipient of this bulletin require information from this or any other previous bulletins, please contact office@nisi.kg or WFP.Bishkek@wfp.org. The bulletins are available at: (Ministry of Economy) (National Institute for Strategic Study) Technical Working Group on Price Monitoring for Food Security (TWG-PMFS)
Price Monitoring for Food Security in the Kyrgyz Republic
 Issue 20 July 2017 Price Monitoring for Food Security in the Kyrgyz Republic Monthly monitoring and outlook of basic food prices in the Kyrgyz Republic Highlights and outlook for the next few months The
Price Monitoring for Food Security in the Kyrgyz Republic
 Issue 18 May 2017 Price Monitoring for Food Security in the Kyrgyz Republic Monthly monitoring and outlook of basic food prices in the Kyrgyz Republic Highlights and outlook for the next few months Between
Price Monitoring for Food Security in the Kyrgyz Republic
 Issue 17 March-April 2017 Price Monitoring for Food Security in the Kyrgyz Republic Monthly monitoring and outlook of basic food prices in the Kyrgyz Republic Highlights and outlook for the next few months
Price Monitoring for Food Security in the Kyrgyz Republic
 Issue 16 January-February 2017 Price Monitoring for Food Security in the Kyrgyz Republic Monthly monitoring and outlook of basic food prices in the Kyrgyz Republic Highlights and outlook for the next few
Price Monitoring for Food Security in the Kyrgyz Republic
 Issue 23 October 2017 Price Monitoring for Food Security in the Kyrgyz Republic Monthly monitoring and outlook of basic food prices in the Kyrgyz Republic Highlights and outlook for the next few months
Issue 01 January March 2018 Price Monitoring for Food Security in the Kyrgyz Republic
 Issue 01 January March 2018 Price Monitoring for Food Security in the Kyrgyz Republic Quarterly monitoring and outlook of basic food prices in the Kyrgyz Republic Highlights In 2017, total production of
Price Monitoring for Food Security in the Kyrgyz Republic
 Issue 11 August-September 2016 Price Monitoring for Food Security in the Kyrgyz Republic Highlights Monthly monitoring and outlook of basic food prices in the Kyrgyz Republic In 2016 international wheat
Price Monitoring for Food Security in the Kyrgyz Republic
 Issue 1 September 2015 Price Monitoring for Food Security in the Kyrgyz Republic Highlights Monitoring of basic food prices and their prospects in the Kyrgyz Republic This bulletin is prepared by the Technical
Price Monitoring for Food Security in the Kyrgyz Republic
 Issue 9 May June 2016 Price Monitoring for Food Security in the Kyrgyz Republic Highlights Monthly monitoring and outlook of basic food prices in the Kyrgyz Republic The domestic price of wheat flour has
MONTHLY UPDATE ON FOOD SECURITY AND PRICES IN RURAL AND URBAN AREAS
 BULLETIN October 2014 ISSUE 27 Fighting Hunger Worldwide MONTHLY UPDATE ON FOOD SECURITY AND PRICES IN RURAL AND URBAN AREAS ISSUE #27, World Food Programme Monthly Update on Food Security and Prices is
World Food Programme. Fighting Hunger Worldwide. Monthly Price and Food Security Update Kyrgyz Republic, August 2012
 World Food Programme Monthly Price and Food Security Update Kyrgyz Republic, August 12 HIGHLIGHTS In August 12, the price of wheat flour increased by 10% in rural areas and 7% in urban areas on a month-on-month
Monthly Regional Food Price Update - July & August 2017
 e Monthly Regional Food Price Update - July & August 2017 h Highlights: Southern Africa Improved maize supplies drove national maize and maize meal prices further down in July in all the monitored countries
REGIONAL SUPPLY AND MARKET OUTLOOK Central Asia. October 7, 2016 KEY MESSAGES
 MT (thousand) REGIONAL SUPPLY AND MARKET OUTLOOK Central Asia October 7, 216 KEY MESSAGES Wheat production in Central Asia for the 216/217 marketing year is similar to 215/216 and slightly above the five-year
Southern Africa. Monthly Food Price Update. November Highlights:
 Southern Africa Monthly Food Price Update November 2016 Highlights: The National Crop Estimate Committee s data showed that RSA 2016/17 total maize plantings could increase by 27% from the previous season
Monthly Regional Food Price Update
 Monthly Regional Food Price Update Southern Africa September 2018 Highlights In the southern African region, maize prices are already beginning to show mixed trends. In South Africa and Tanzania, maize
Southern Africa. Monthly Food Price Update. October Highlights:
 Southern Africa Monthly Food Price Update October 2016 Highlights: The International Grains Council (IGC) maintained South Africa s 2016/17 maize production estimate of 12.9 million tons, which is 72%
Setting the Scene. Outlook for Commodities. Kevin Bellamy ASA Conference 11 September
 Setting the Scene Outlook for Commodities Kevin Bellamy ASA Conference 11 September Food and Agribusiness Research Rabobank s world leading research network Over 80 research professionals across 18 offices
Change of crop pattern in the search of comparative advantage: Case of rural small holder bean producers in Talas Province of Kyrgyzstan
 Change of crop pattern in the search of comparative advantage: Case of rural small holder bean producers in Talas Province of Kyrgyzstan Kanat Tilekeyev Institute of Public Policy and Administration University
REGIONAL WHEAT MARKET FUNDAMENTALS Central Asia. November 2016 WHEAT CONSUMPTION AND PRODUCTION IN CENTRAL ASIA
 kg/capita/year kg/capita/year REGIONAL WHEAT MARKET FUNDAMENTALS Central Asia November 2016 WHEAT CONSUMPTION AND PRODUCTION IN CENTRAL ASIA Wheat is by far the dominant staple in the Central Asia region
The weather models continue to paint an optimistic picture for the new season. The South African maize belt could
 22 September 2017 South African Agricultural Commodities Weekly Wrap The weaker domestic currency, coupled with higher Chicago grains and oilseed prices led to widespread gains in the South African agricultural
South Sudan MONTHLY MARKET PRICE MONITORING BULLETIN
 OCTOBER 208 HIGHLIGHTS Currency Exchange Rate: In September 208, the average exchange rate in the parallel market in Juba was SSP 25, compared to the highest ever of SSP 30 in June 208. The rate in the
Fuel to Food: Evidence of Price Pass-through in Kyrgyzstan. SAMARKAND Conference Samarkand, Uzbekistan 2-4 November, 2015
 Fuel to Food: Evidence of Price Pass-through in Kyrgyzstan SAMARKAND Conference Samarkand, Uzbekistan 2-4 November, 2015 Motivation International price shocks/food crises Effects of commodity prices on
As we set out in our note on 05 October 2017, South Africa s 2017/18 total maize supplies are at 17.1 million tonnes,
 06 October 2017 South African Agricultural Commodities Weekly Wrap The South African Supply and Demand Estimates Committee s latest data paints a mixed picture regarding the country s grain and oilseed
World Agricultural Supply and Demand Estimates
 World Agricultural Supply and Demand Estimates Report of Interagency Commodity Estimates Committee Forecasts World Agricultural Outlook Board, Chairing Agency Economic Research Service Foreign Agricultural
POLICY BRIEF. The Development of Organic Agriculture in the Kyrgyz Republic: Economic and Ecological Sustainability #50, OCTOBER 2018
 #50, OCTOBER 2018 POLICY BRIEF The Development of Organic Agriculture in the Kyrgyz Republic: Economic and Ecological Sustainability Maral Sagynalieva The Development of Organic Agriculture in the Kyrgyz
PAKISTAN MARKET MONITORING BULLETIN
 PAKISTAN MARKET MONITORING BULLETIN JAN- 2 0 1 2 H i g h l i g h t s General inflation, based on Consumer Price Index (CPI), increased from 9.7 percent in December to 10.10 in January 2012. I N S I D E
RSA Agricultural Commodities Weekly Wrap 23 September 2016
 AGBIZ RESEARCH AGRI-COMMODITIES WEEKLY WRAP RSA Agricultural Commodities Weekly Wrap 23 September 2016 This season South Africa is a net importer of grains and oilseeds. Therefore, the price movements
AFGHANISTAN MONTHLY MARKET PRICE MONITORING BULLETIN FEBRUARY 2009
 AFGHANISTAN MONTHLY MARKET PRICE MONITORING BULLETIN FEBRUARY 2009 World Food Programme Consumer price index (CPI): Price of Wheat in selected regions Price of Wheat across the Country International Monthly
Price Transmission on Wheat Flour Market in Georgia
 Price Transmission on Wheat Flour Market in Georgia Ia Katsia, Pati Mamardashvili Agricultural Transitions along the Silk Road Restructuring, Resources and Trade in the Central Asia Region 4-6 April 2016
The Democratic People s Republic of Korea. Outlook for Food Supply and Demand in 2014/15 (November/October)
") 3 February 2015 GIEWS Update The Democratic People s Republic of Korea Outlook for Food Supply and Demand in 2014/15 (November/October) This report has been prepared based on official production figures
3 February 2015 GIEWS Update The Democratic People s Republic of Korea Outlook for Food Supply and Demand in 2014/15 (November/October) This report has been prepared based on official production figures
Climate and Agriculture Key Challenges and Opportunities
 Climate and Agriculture Key Challenges and Opportunities Yahya Abawi, University of Southern Queensland, AUSTRALIA Regional Consultation on Climate Services for the Third Pole and other High Mountain Regions
MONTHLY FOOD SECURITY BULLETIN OF SOUTH AFRICA: FEBRUARY 2011
 MONTHLY FOOD SECURITY BULLETIN OF SOUTH AFRICA: FEBRUARY 2011 Issued: 7 March 2011 Directorate: Statistics and Economic Analysis Highlights: The weather conditions in the eastern parts of the country have
World Agricultural Outlook Board Interagency Commodity Estimates Committee Forecasts. Lockup Briefing April 9, 2014
 World Agricultural Outlook Board Interagency Commodity Estimates Committee Forecasts Lockup Briefing World Wheat Production Country or Region Million Tons World 656.5 712.5 8.5 United States 61.7 58.0-6.0
MARKET ASSESSMENT IN KYRGYZSTAN
 f MARKET ASSESSMENT IN KYRGYZSTAN Secondary Data Review April 2013 Report prepared by Oscar Maria Caccavale, Balthazar de Brouwer and Tobias Flämig WFP, Analysis & Nutrition Service Data collection: January
PART 6 MONITORING THE FOOD SECURITY SITUATION IN SADC
 PART 6 MONITORING THE FOOD SECURITY SITUATION IN SADC SADC food security situation 1. Introduction Point 6 of the terms of reference of the Food Price Monitoring Committee is To monitor the regional SADC
Russian Federation. Grain and Feed September Update
 THIS REPORT CONTAINS ASSESSMENTS OF COMMODITY AND TRADE ISSUES MADE BY USDA STAFF AND NOT NECESSARILY STATEMENTS OF OFFICIAL U.S. GOVERNMENT POLICY Voluntary - Public n Federation Post: Moscow Grain and
Food Markets Wheat & Maize Outlook 2018/19
 Food Markets Wheat & Maize Outlook THIRTEENTH SESSION OF THE AMIS GLOBAL FOOD MARKET INFORMATION GROUP FAO Headquarters, Rome 3-4 May 2018 Presentation Outline I. Macro conditions & food markets II. Market
South African Milk Processors Organisation
 South African Milk Processors Organisation The voluntary organisation of milk processors for the promotion of the development of the secondary dairy industry to the benefit of the dairy industry, the consumer
Food Price Outlook,
 Provided By: Food Price Outlook, 2017-18 This page provides the following information for August 2017: Consumer Price Index (CPI) for Food (not seasonally adjusted) Producer Price Index (PPI) for Food
Evolving agricultural markets: Recent and projected trends
 Evolving agricultural markets: Recent and projected trends Highlights from the OECD-FAO Agricultural Outlook 2018-2027 Jonathan Brooks, OECD 2018 ATPC OECD ICTSD FAO Workshop Policies, Challenges and Opportunities
RSA Agricultural Commodities Weekly Wrap 14 October 2016
 AGBIZ RESEARCH AGRI-COMMODITIES WEEKLY WRAP RSA Agricultural Commodities Weekly Wrap 14 October 2016 This week saw a significant weakening of the South African Rand against the US Dollar, owing to domestic
Agri Trends 25 January 2019
 Agri Trends 25 January 2019 The summer crop production areas drought, lead to a price decline in the beef industry. The suspension of beef exports and the poor outlook of summer crops which will subsequently
Grain and Cotton Economics. Mark Welch Extension Economist Grain Marketing (979)
") Grain and Cotton Economics Mark Welch Extension Economist Grain Marketing JMWelch@tamu.edu (979)845-8011 Marketing 2012, here we come! Tight supplies Grain Strong demand Yoked to outside markets 2012,
Grain and Cotton Economics Mark Welch Extension Economist Grain Marketing JMWelch@tamu.edu (979)845-8011 Marketing 2012, here we come! Tight supplies Grain Strong demand Yoked to outside markets 2012,
YEMEN MONTHLY MARKET WATCH JUNE 2012
 Highlights In May 2012, the country general inflation was 11.24% and food inflation stood at 10.53%, based on 12 months moving average. Between January and June 2012, the average wholesale price of 50
International Grain Price Prospects and Food Security
 USA Ukraine 123 North Post Oak Lane 4A Baseyna Street Suite 410 Mandarin Plaza, 8th floor Houston, Texas, 77024, USA Kyiv, 01004, Ukraine Tel: +1 (713) 621-3111 Tel: +380 (44) 284-1289 www.bleyzerfoundation.org
The OECD-FAO Agricultural Outlook Global Trends in Commodity Markets by Pavel Vavra
 The OECD-FAO Agricultural Outlook Global Trends in Commodity Markets by Pavel Vavra Power Point Presentation for the International Agricultural Trade Research Consortium Analytic Symposium Confronting
2012 Farm Outlook. Highlights
 2012 Farm Outlook Office of the Chief Economist USDA Highlights A promising spring planting was followed by historic drought. Record high commodity prices followed. Farm incomes are expected to be near
Agri Trends 05 March 2018
 Agri Trends 05 March 2018 Agriculture, South Africa s potential to economic growth! South African producers are rated among the best in the world. Ho wever, at the latest Hacking the Farm TEDx event the
In its final estimates for the 2017 summer crop production season, the Crop Estimates Committee (CEC) lifted maize
 lifted maize") 29 September 2017 South African Agricultural Commodities Weekly Wrap This was a data-packed week for grain and oilseed markets with releases that include production estimates update, producer deliveries
29 September 2017 South African Agricultural Commodities Weekly Wrap This was a data-packed week for grain and oilseed markets with releases that include production estimates update, producer deliveries
Executive summary. Butter prices at record levels
 June 2017 Executive summary Butter prices at record levels South African milk production growth disappointed in the first five months of 2017. Total production during this period is marginally lower than
April Input prices
 April 2014 This document gives insights into agricultural input (irrigation tariffs, fertiliser and fuel prices, electricity tariffs and minimum wages) and output prices (for selected grains, livestock
REGIONAL SUPPLY AND MARKET OUTLOOK Central America. January 31, 2018 KEY MESSAGES
 REGIONAL SUPPLY AND MARKET OUTLOOK Central America January 31, 2018 KEY MESSAGES This report summarizes the supply and market outlook for white maize grain, black and red dry beans, and milled 1 rice in
Current Market Situation and Outlook*
 Current Market Situation and Outlook* Abdolreza Abbassian, AMIS Secretary Trade and Markets Division Economic and Social Development Department Food and Agriculture Organization of the United Nations,
MONTHLY FOOD SECURITY BULLETIN OF SOUTH AFRICA: DECEMBER 2012
 MONTHLY FOOD SECURITY BULLETIN OF SOUTH AFRICA: DECEMBER 2012 Issued: 17 January 2013 Directorate: Statistics and Economic Analysis Highlights: During December 2012 significant rainfall events were recorded
United Nations Conference on Trade and Development
 United Nations Conference on Trade and Development 1th MULTI-YEAR EXPERT MEETING ON COMMODITIES AND DEVELOPMENT 25-26 April 218, Geneva Assessing the recent past and prospects for grains and oilseeds markets
World Agricultural Outlook Board Interagency Commodity Estimates Committee Forecasts. Lockup Briefing July 11, 2014
 World Agricultural Outlook Board Interagency Commodity Estimates Committee Forecasts Lockup Briefing World Wheat Production Country or Region estimate 2014/15 forecast June 11 Million Tons Percent Percent
AMIS. Agricultural Market Information System ENHANCING MARKET TRANSPARENCY
 Agricultural Market Information System ENHANCING MARKET TRANSPARENCY Review of changes in domestic cereal prices during the global price spikes AMIS aims at improving the collection of statistics on various
AGRI REVIEW APRIL 2018
 AGRI REVIEW APRIL 2018 SECTOR AT A GLANCE PLANT GROWING 2017 was a challenging year for Georgian agriculture. There is a decline in the level of sown areas, which decreased by 10.5% in 2017 compared to
The Republic of Armenia Food Balance Sheets Presentation
 The Republic of Armenia Food Balance Sheets Presentation Definition of the Food Balance Sheet FOOD BALANCE SHEETS present a comprehensive picture of the pattern of a country's food supply and utilisation,
John Deere. Committed to Those Linked to the Land. Market Fundamentals. Deere & Company August/September 2014
 John Deere Committed to Those Linked to the Land Market Fundamentals Deere & Company August/September 2014 Safe Harbor Statement & Disclosures This presentation includes forward-looking comments subject
Table 4.1. CropWatch agroclimatic and agronomic indicators for China, October 2016-January 2017, departure from 5YA and 15YA
 65 Chapter 4. China Chapter 4 presents a detailed analysis for China, focusing on the seven most productive agro-ecological regions of the east and south. After a brief overview of the agroclimatic and
Although it is still early to be certain about the potential size of South Africa s 2017/18 maize crop, international
 01 December 2017 South African Agricultural Commodities Weekly Wrap There were numerous data releases this week in the domestic grain and oilseeds market, with the most notable one being the National Crop
South Sudan MONTHLY MARKET PRICE MONITORING BULLETIN
 South Sudan MONTHLY MARKET PRICE MONITORING BULLETIN m HIGHLIGHTS November 207 Fuel Prices: According to The Sudan Tribune, South Sudan has removed fuel subsidies due to scarcity of hard currencies to
This week there were no major data releases in the South African grain and oilseed market. The weaker
 ZAR/ton USD/ton ZAR/USD 24 August 2018 South African Agricultural Commodities Weekly Wrap This week there were no major data releases in the South African grain and oilseed market. The weaker domestic
International Grains Council Conseil international des céréales Consejo Internacional de Cereales Международный совет по пшенице
 International Grains Council Conseil international des céréales Consejo Internacional de Cereales Международный совет по пшенице John Tjaardstra IGC S INFORMATION ROLE: MAIN GRAINS AND OILSEEDS WHEAT MAIZE
IMPACT OF DROUGHT ON CROP PRODUCTION AND THE FOOD VALUE CHAIN
 IMPACT OF DROUGHT ON CROP PRODUCTION AND THE FOOD VALUE CHAIN July 2016 BRANCH: POLICY, PLANNING AND MONITORING AND EVALUATION TABLE OF CONTENTS TOPIC Page 1. INTRODUCTION 1 2. MAIZE 1 3. WHEAT 7 4. OTHER
The maize harvest activity is slowly gaining momentum in many areas across the country. The progress made thus
 08 June 2018 South African Agricultural Commodities Weekly Wrap The weather is a key focus in the South African grain and oilseed market as it continues to influence the harvest activity of summer crops
Minimum Core Data Set
 Global Strategy IMPROVING AGRICULTURAL AND RURAL STATISTICS IN ASIA PACIFIC Minimum Core Data Set Regional Office for the Asia-Pacific Regional Action Plan to Improve Agricultural and Rural Statistics
SOUTHERN AFRICA Regional Supply and Market Outlook August 31, 2017
 SOUTHERN AFRICA Regional and Market Outlook August 31, 2017 KEY MESSAGES Figure 1. Regional maize supply estimates (000s MT) Maize supplies in Southern Africa are above, owing to high production levels
Global Agricultural Supply and Demand: Factors contributing to recent increases in food commodity prices
 Global Agricultural Supply and Demand: Factors contributing to recent increases in food commodity prices Ron Trostle Economic Research Service U.S. Department of Agriculture Agricultural Markets and Food
COMMITTEE ON WORLD FOOD SECURITY
 September 2012 CFS 2012/39/Inf.14 E COMMITTEE ON WORLD FOOD SECURITY Thirty-ninth Session Rome, Italy, 15-20 October 2012 UPDATE O THE AGRICULTURAL MARKET I FORMATIO SYSTEM (AMIS) This document is printed
RISING FOOD PRICE AND ITS CONSEQUENCES
 RISING FOOD PRICE AND ITS CONSEQUENCES Hem Raj Regmi (Msc) 19 ABSTRACT Agricultural prices have risen worldwide sharply in the last two years, which has been a dilemma especially to policy makers. Higher
ETHIOPIA MONTHLY MARKET WATCH
 - 214 Highlights The general year to year inflation which is based on comparison of current and last year similar month Consumer Price Index, stood at 6.2% for ember 214. The food part of the inflation
Figure 1. Regional Sorghum Production estimates (000s MT) Figure 2. Domestic Sorghum Balance (000s MT)
 Figure 2. Domestic Sorghum Balance (000s MT)") REGIONAL SUPPLY AND MARKET OUTLOOK East Africa: Sorghum March 8, 2019 KEY MESSAGES Wheat, maize, rice and, and sorghum are important staple foods in East Africa. Domestic sorghum production makes important
REGIONAL SUPPLY AND MARKET OUTLOOK East Africa: Sorghum March 8, 2019 KEY MESSAGES Wheat, maize, rice and, and sorghum are important staple foods in East Africa. Domestic sorghum production makes important
2015 CBH AUSTRALIAN BARLEY UPDATE. CBH Group, August 2015 GIWA Spring Forum
 2015 CBH AUSTRALIAN BARLEY UPDATE CBH Group, August 2015 GIWA Spring Forum AUSTRALIAN BULK GRAIN EXPORTS YTD 2014/2015 01/02 02/03 03/04 04/05 05/06 06/07 07/08 08/09 09/10 10/11 11/12 12/13 13/14 14/15
South Africa s 2017/18 maize production season started on a bad footing, with extreme dryness in the western
 23 February 2018 South African Agricultural Commodities Weekly Wrap The stronger domestic currency, coupled with prospects of rainfall across the summer crop growing areas, and large carryover stocks in
ETHIOPIA MONTHLY MARKET WATCH October ETHIOPIA MONTHLY MARKET WATCH October 2014
 ETHIOPIA MONTHLY MARKET WATCH ober 2014 Highlights The year-on- year general inflation based on comparison of current and last year similar months, increased by 5.4 per cent in ober 2014 compared to ober
MONTHLY FOOD SECURITY BULLETIN OF SOUTH AFRICA: MARCH 2011
 MONTHLY FOOD SECURITY BULLETIN OF SOUTH AFRICA: MARCH 2011 Issued: 8 April 2011 Directorate: Statistics and Economic Analysis Highlights: Vegetation conditions for March 2011 were normal to above-normal
THE SOUTH AFRICAN GRAIN MARKETS QUARTERLY EARLY WARNING REPORT NO. 02 OF 2013
 THE SOUTH AFRICAN GRAIN MARKETS QUARTERLY EARLY WARNING REPORT 1. SUMMARY NO. 02 OF 2013 The domestic closing stocks for maize in the current season are expected to decline by about 40.94% on the back
Integration processes in the CIS region and their implications for agricultural trade, March 2015, Kaliningrad, Russia
 Parviz KHAKIMOV Independent Researcher, Tajikistan Integration processes in the CIS region and their implications for agricultural trade, 26-27 March 2015, Kaliningrad, Russia 1. Rationale of the Study
Market Fundamentals. August October 2017
 Market Fundamentals August October 2017 1 Safe Harbor Statement & Disclosures This presentation includes forward-looking comments subject to important risks and uncertainties. It may also contain financial
World Agricultural Outlook, Risks, and Challenges for the Coming 10 years
 World Agricultural Outlook, Risks, and Challenges for the Coming 10 years Annelies DEUSS Trade and Agriculture Directorate, OECD PRIMAFF Open Seminar 11 December 2018, Tokyo, Japan Outline of the presentation
FAPRI Outlook: Prospects and Uncertainties for the Next Decade
 FAPRI Outlook: Prospects and Uncertainties for the Next Decade William H. Meyers Howard Cowden Professor of Agricultural and Applied Economics and Co-Director, FAPRI University of Missouri Project LINK
World Agricultural Outlook Board Interagency Commodity Estimates Committee Forecasts. May 9, 2014
 World Agricultural Outlook Board Interagency Commodity Estimates Committee Forecasts World Wheat Production Country or Region Million Tons 2014/15 World 714.0 697.0-2.4 United States 58.0 53.4-7.8 Foreign
Agri Trends 29 September 2017
 Agri Trends 29 September 2017 How South Africa compares with the USA you have reason to be a proud South African! Being biased towards South Africa we decided to compare South Africa with the USA based
SOUTH SUDAN MONTHLY MARKET PRICE MONITORING BULLETIN
 MARCH 1 2017 HIGHLIGHTS Inflation: According to the National Bureau of Statistics, the South Sudan inflation rate measured by the changes in consumer price indices stood at 371.8% while the inflation rates
REGIONAL SUPPLY AND MARKET OUTLOOK Central America. April 20, 2017
 REGIONAL SUPPLY AND MARKET OUTLOOK Central America April 20, 2017 KEY MESSAGES This report summarizes the supply and market outlook for white maize grain, dry beans, and rice in the Central American countries
Agricultural markets transparency the way forward
 Agricultural markets transparency the way forward Raluca Rusu Market Officer Unit C.5 - Arable crops, sugar, fibre plants, animal feed DG for Agriculture and Rural Development European Commission C Olof
Although the recent upward revision of South African maize and soybean production forecasts
 ZAR/ton USD/ton ZAR/USD 29 June 2018 South African Agricultural Commodities Weekly Wrap Although the recent upward revision of South African maize and soybean production forecasts underscored the view
Southern Africa Growing Season : Recovery After Two Years of Drought?
 Southern Africa Growing Season 2016-2017: Recovery After Two Years of Drought? HIGHLIGHTS Good performance of the current growing season (October 2016 - April 2017) is critical for Southern Africa after
Monitoring Agricultural Outlook for India: The Supply Side Challenges of Food Security
 Monitoring Agricultural Outlook for India: The Supply Side Challenges of Food Security Presentation By Shashanka Bhide, NCAER, New Delhi At UN ESCAP South Asia Policy Dialogue on Regional Cooperation for
Market Monitor Number 9 June 2013
 Market Monitor Number 9 June 2013 AMIS Crops: World Supply-Demand Outlook First forecasts for 2013/14 marketing seasons Early indications for world wheat, maize and rice production in 2013 point to record
John Deere. Committed to Those Linked to the Land. Market Fundamentals. Deere & Company June/July 2014
 John Deere Committed to Those Linked to the Land Market Fundamentals Deere & Company June/July 2014 Safe Harbor Statement & Disclosures This presentation includes forward-looking comments subject to important
40,000 35,000 30,000 25,000 20,000 15,000 10,000 5,000
 REGIONAL SUPPLY AND MARKET OUTLOOK Southern Africa August 7, 2015 ABOUT THIS REPORT The Famine Early Warning Systems Network (FEWS NET) monitors trends in staple food supply and price trends in countries
Better Research, Better Policy, Better Reform Azerbaijan Economy in 2011
 Better Research, Better Policy, Better Reform Azerbaijan Economy in 2011 Center for Economic and Social Development (CESD) Shirin Mirzeyev 76 "a"/33, Baku, Az1002, AZERBAIJAN Phone; (99412) 5970691 (99412)
Food Industry of the Republic of Kazakhstan
 JSC Rating Agency of the Regional Financial Center of Almaty 136 Dostyk ave., 9 th floor, office 904, 050051 Almaty, The Republic of Kazakhstan Food Industry of the Republic of Kazakhstan Analytical service
Agriculture insurance hotspot: Kazakhstan
 Agriculture insurance hotspot: is one of the largest grain producers and exporters in the world. However, drought frequently endangers large parts of the country and is the number one threat to farmers.
GIEWS Country Brief Malaysia
 Reference Date: 28-July-2017 FOOD SECURITY SNAPSHOT The 2017 rice production increased from last year s dry-weather affected output Cereal imports t forecast to increase in 2017/18 marketing year (July/June)
GEOGLAM: Crop Monitoring
 GEOGLAM: Crop Monitoring Inbal Becker-Reshef GEOGLAM: Group on Earth Observations Global Agricultural Monitoring Initiative Launched alongside AMIS, by G20 in 2011 under the French Presidency, within the
John Deere Committed to Those Linked to the Land Market Fundamentals
 John Deere Committed to Those Linked to the Land Market Fundamentals Deere & Company July 2013 Safe Harbor Statement & Disclosures This presentation includes forward-looking comments subject to important