World Agricultural Outlook Board Interagency Commodity Estimates Committee Forecasts. Lockup Briefing July 11, 2014
|
|
|
- Kevin Richardson
- 6 years ago
- Views:
Transcription
1 World Agricultural Outlook Board Interagency Commodity Estimates Committee Forecasts Lockup Briefing
2 World Wheat Production Country or Region estimate 2014/15 forecast June 11 Million Tons Percent Percent World United States Foreign Argentina Canada Australia European Union Russia Ukraine Kazakhstan China India


3 Wheat is grown across much of Europe, with the big hitters being France, U.K., Germany, and Poland. The EU collectively is the globe s largest wheat producer.


4 In Germany, mid- to late-may was critical for wheat yields, versus the more typical late May and early June. Critical Dev Stages


5 Ireland U.K. Neth. Poland Bel. Germany Czech Slovakia France Switz Austria Hungary Romania Italy Serbia Port. Spain Bulgaria Greece Virtually every major wheat area received near- to above-normal rainfall during May, improving wheat yield prospects. The early end to the Water Year was evident in Spain, as was the Serbian flooding.


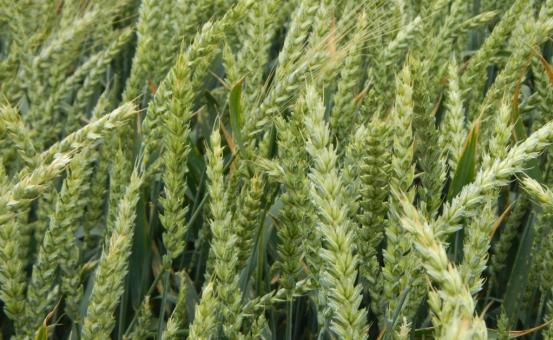
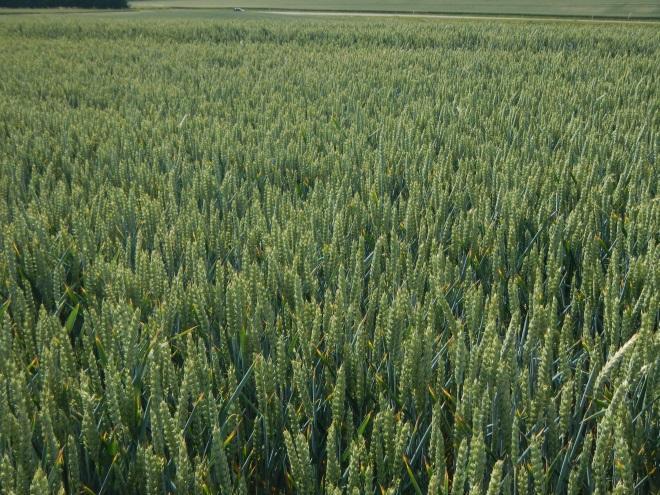
6 June Crop Travel in Germany Confirms a Large Wheat Crop 6

7 Wheat Production Changes July 2014
8 World Wheat Supply and Use estimate 2014/15 forecast June 11 Million Tons Percent Percent Beginning stocks Production Total Supply Feed use Total use Trade Ending Stocks
9 U.S. Wheat Supply and Demand estimate 2014/15 forecast June 11 Percent Percent Planted area (million acres) Harvested area (million acres) Yield (bushels per acre) Million bushels Beginning stocks Production 2,130 1, Imports Total supply 3,016 2, Food use Seed Feed and residual Domestic use 1,244 1, Exports 1, Total use 2,426 2, Ending stocks Percent Stocks to use ratio Dollars per bushel Average market price /
10 World Corn Production Country or Region estimate 2014/15 forecast June 11 Million Tons Percent Percent World United States Foreign Argentina Brazil Mexico Canada European Union FSU Ukraine Russia South Africa China India
11 Brazil Corn Production First-season compared to second-season First-season Corn Planting began in September Crop is harvested. Some damage from heat and drought. Corn production used by livestock industry. Second-season Corn Planting began in February High cost of production and low prices result in unprofitability. Rains in Parana, Mato Grosso do Sul, Goias, and Mato Grosso have increased yield potential. Corn production for export market.
12 2 nd Crop Corn Production Brazil Para Maranhao Piaui Rondonia Mato Grosso Tocantins Bahia 2 nd Corn: ~60% Goias Aw: Tropical wet and dry Cr: Subtropical Rain Mato Grosso do Sul Minas Gerais Corn Production *Average ( ) 2 nd Corn: ~40% Sao Paulo Minor Production Intensity Major Parana *Source: MINAG / IBGE Santa Catarina 2 nd Corn crop calendar for most of Center-South Brazil Rio Grande do Sul Plant Harvest JAN FEB MAR APR MAY JUN JUL AUG SEP OCT NOV DEC Agricultural Weather Assessments World Agricultural Outlook Board
13 Metric Tons Per Hectare (mt/ha) May 1 June 10 Mato Grosso *2nd Crop Corn Yields : Above-normal rainfall, then early end to season Source: IBGE/CONAB Observed Predicted Agricultural Weather Assessments World Agricultural Outlook Board
14 Metric Tons Per Hectare (mt/ha) May 1 June 10 Mato Grosso *2nd Crop Corn Yields : Above-normal rainfall, then scattered showers in May Source: IBGE/CONAB Observed Predicted Agricultural Weather Assessments World Agricultural Outlook Board
15 World Corn Supply and Use estimate 2014/15 forecast June 11 Million Tons Percent Percent Beginning stocks Production Total Supply 1, , Feed use Total use Trade Ending Stocks
16
17 U.S. Corn Supply and Demand estimate 2014/15 forecast June 11 Percent Percent Planted area (million acres) Harvested area (million acres) Yield (bushels per acre) Million bushels Beginning stocks 821 1, Production 13,925 13, Imports Total supply 14,781 15, Feed and residual 5,175 5, Food, seed, and industrial 6,460 6, Ethanol 5,075 5, Domestic use 11,635 11, Exports 1,900 1, Total use 13,535 13, Ending stocks 1,246 1, Percent Stocks to use ratio Dollars per bushel Average market price 4.35/ /
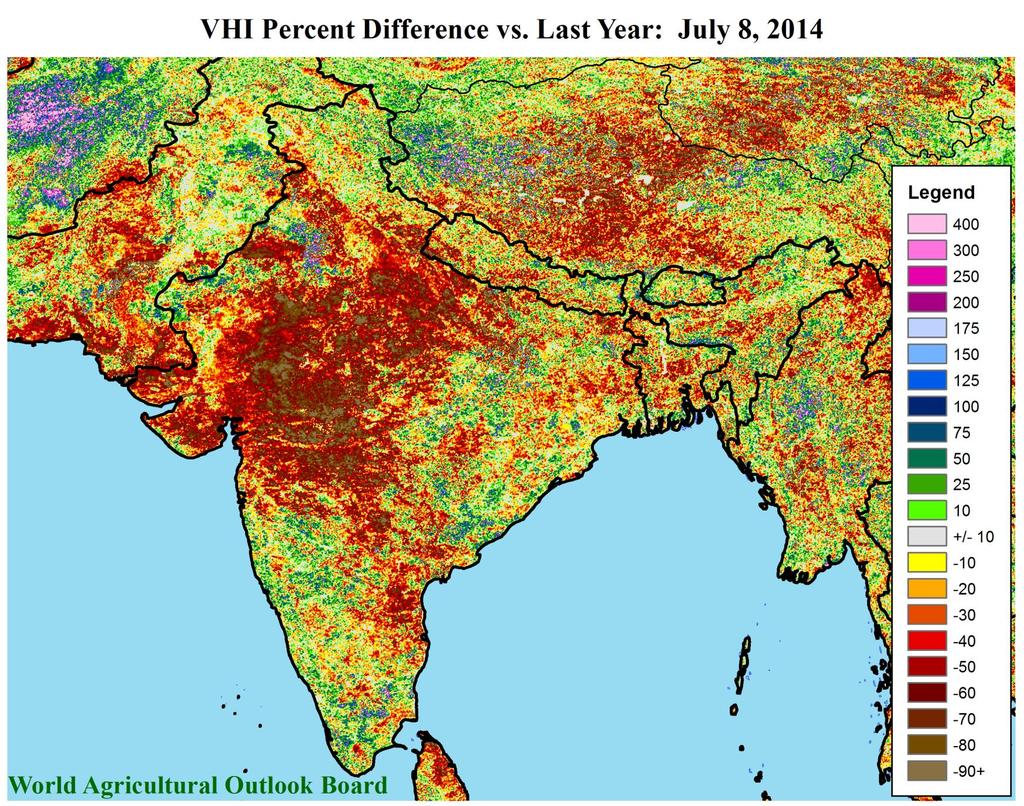
18 Crop Water Requirements Compared to Average Monsoon Rainfall (890 mm) (35 inches) and Drought: < 820 mm (10% below) <32 inches Crop Water Requirement(mm) Rice Wheat Sorghum Maize Sugarcane Groundnut Cotton Soybean Note: Drought classification>> Atmospheric, hydrologic, agricultural ** * *** *27 51 inches *18 28 inches
19
20

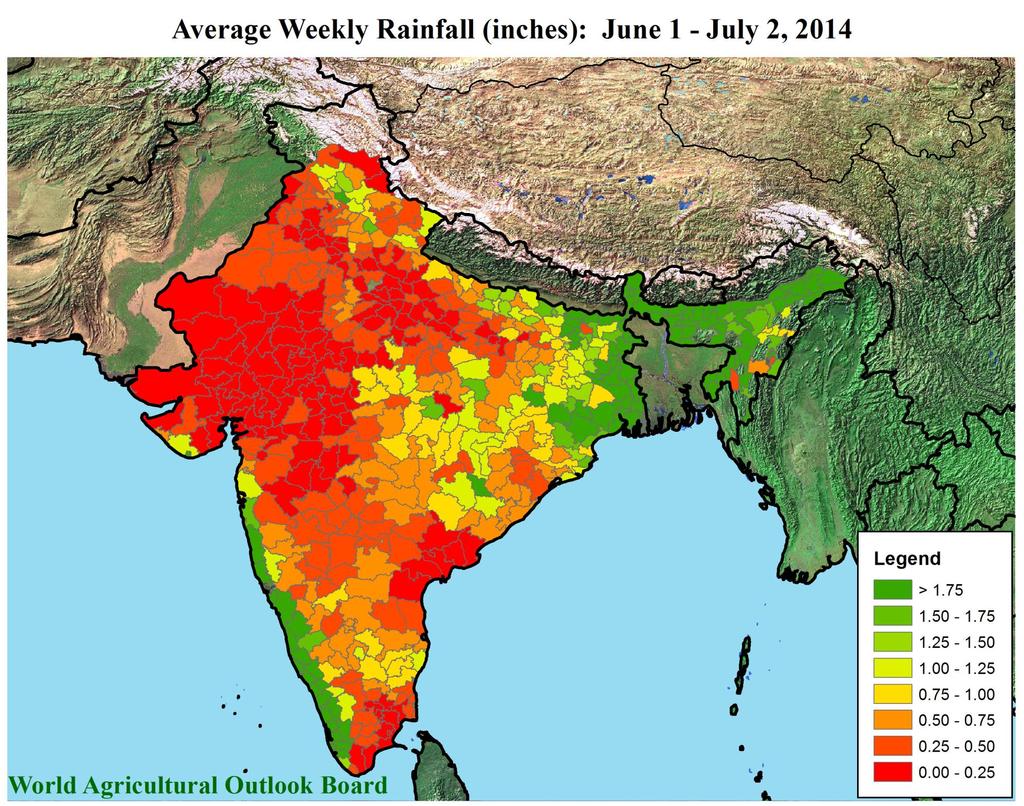
21 June represents about 20% of the normal rainfall that falls during the monsoon season which implies the poor performance of June rainfall is not as important as July and August rainfall Continued poor monsoon performance during July and August can prove devastating to many crops and water supply. In fact continued dry weather beyond mid-july usually results in production cuts for many crops, but especially oilseeds, corn and sorghum.
22
23 42% of rice crop is experiencing below normal rainfall (<=75%).
24 World Rice Production Country or Region estimate 2014/15 forecast June 11 Million Tons Percent Percent World United States Foreign Brazil Egypt Bangladesh Cambodia China India Indonesia Japan Sri Lanka Pakistan Philippines Thailand Vietnam
25 World Rice Supply and Use estimate 2014/15 forecast June 11 Million Tons, milled Percent Percent Beginning stocks Production Total Supply Total use Trade Ending Stocks
26 U.S. Rice Supply and Demand Rough Equivalent of Rough and Milled Rice estimate 2014/15 forecast June 11 Percent Percent Planted area (million acres) Harvested area (million acres) Yield (pounds per acre) 7,694 7, Million cwt Beginning stocks Production Imports Total supply Domestic use Exports Total use Ending stocks Percent Stocks to use ratio Dollars per cwt Average market price /
27 98% of soybean crop is experiencing below normal rainfall (<=75%)
28 World Soybean Production Country or Region estimate 2014/15 forecast June 11 Million Tons Percent Percent World United States Foreign Argentina Brazil Paraguay Ukraine India China
29 U.S. Soybean Supply and Demand 2014/15 estimate forecast June 11 Percent Percent Planted area (million acres) Harvested area (million acres) Yield (bushels per acre) Million bushels Beginning stocks Production 3,289 3, Imports Total supply 3,514 3, Crush 1,725 1, Seed and residual Domestic use 1,754 1, Exports 1,620 1, Total use 3,374 3, Ending stocks Percent Stocks to use ratio Dollars per bushel Average market price /

30 83% of cotton crop is experiencing below normal rainfall (<=75%).
31 World Cotton Production Country or Region estimate 2014/15 forecast June 11 Million Bales Percent Percent World United States Foreign Argentina Brazil Turkey Syria Australia China India Pakistan Uzbekistan African Franc Zone
32 World Cotton Supply and Use estimate 2014/15 forecast June 11 Million Bales Percent Percent Beginning stocks Production Total Supply Consumption Trade Ending Stocks Addendum: China Ending Stocks
33 U.S. Cotton Supply and Demand estimate 2014/15 forecast June 11 Percent Percent Planted area (million acres) Harvested area (million acres) Yield (pounds per acre) Million bales Beginning stocks Imports Production Total supply Mill use Exports Total use Unaccounted Ending stocks Percent Stocks/use Cents per pound Average market price /

34 Contiguous U.S. 45% D0 D4 34% D1 D4
35 Subsoil Moisture for Major Texas Cotton Districts as of July 6 - percent very short and short % Very short % Short N 1S 2N 2S (Amarillo) (Lubbock) (Childress) (Abilene)
36
37 Calculation of July 2014 U.S. Cotton Production Estimate Item Unit 2013 June July Planted mil. acres Harvested mil. acres Aband. Rates: % U.S. (Southwest) 27.6 (45.9) 21.2 (34.0) 14.7 (23.0) Yield/acre lbs Production mil. bales
38 Mexico Sugar Supply and Demand 2014/15 estimate forecast June 11 Thousand MT Percent Percent Beginning stocks 1, Production 6,025 6, Imports Total Supply 7,711 7, Domestic use 4,690 4, Exports 2,358 1, Total Use 7,048 6, Ending stocks
39 U.S. Sugar Supply and Demand estimate 2014/15 forecast June 11 1,000 short tons, raw value Percent Percent Beginning Stocks 2,158 1, Production 8,442 8, Beets 4,750 4, Cane 3,692 3, Imports 3,674 3, TRQ 1,458 1, Re-export Mexico 1,996 1, High-tier Total Supply 14,274 13, Exports Domestic deliveries 12,141 11, Total use 12,466 12, Ending stocks 1,808 1, Percent Stocks/use ratio
40 U.S. Meat Production and Prices 2014 estimate 2015 forecast June Production Billion pounds Percent Percent Beef Pork Broilers Turkey Total meat Prices Dollars/cwt Steers Hogs Cents/lb Broilers Turkey
41 U.S. Meat Trade Million Pounds 2014 estimate 2015 forecast June Exports Percent Percent Beef 2,518 2, Pork 5,005 5, Broilers 7,356 7, Turkey Mature Chickens Total meat 15,714 15, Imports Beef 2,521 2,
42 U.S. Milk Supply and Demand 2014 estimate 2015 forecast June Billion pounds Percent Percent Production Imports Commercial use Exports Average market price 1/ Dollars/cwt Class III Class IV All milk / Prices are mid-point of published forecasts; milk of average fat test.
43 U.S. Dairy Product Prices 2014 estimate 2015 forecast June Product prices Dollars/pound Percent Percent Cheese Butter Nonfat dry milk Dry whey Class prices Dollars/cwt Class III Class IV All milk
44 U.S. Production Summary 2014/15 estimate forecast June 11 Percent Percent Crops and Products Wheat (Million bu) 2,130 1, Rice (Million cwt) Corn (Million bu) 13,925 13, Sorghum (Million bu) Barley (Million bu) Oats (Million bu) Soybeans (Million bu) 3,289 3, Soybean oil (Million lbs) 20,215 20, Soybean meal (Thousand s.t.) 41,010 41, Cotton (Million bales) Sugar (Thousand s.t., raw value) 8,442 8, Milk (Billion lbs) Meat (Billion lbs) Beef Pork Broilers Turkey Total Meat
45 Domestic Demand Summary 2014/15 estimate forecast June 11 Percent Percent Crops and Products Wheat (Million bu) 1,244 1, Rice (Million cwt) Corn (Million bu) 11,635 11, Sorghum (Million bu) Barley (Million bu) Oats (Million bu) Soybeans (Million bu) 1,754 1, Soybean oil (Million lbs) 18,750 18, Soybean meal (Thousand s.t.) 29,600 30, Cotton (Million bales) Sugar (Thousand s.t., raw value) 12,141 11, Milk (Billion lbs) Meat (Billion lbs) Beef Pork Broilers Turkey Total meat
46 U.S. Export Summary 2014/15 estimate forecast June 11 Percent Percent Crops and products Wheat (Million bu) 1, Rice (Million cwt) Corn (Million bu) 1,900 1, Sorghum (Million bu) Barley (Million bu) Soybeans (Million bu) 1,620 1, Soybean oil (Million lbs) 1,700 2, Soybean meal (Thousand s.t.) 11,650 11, Cotton (Million bales) Meat (Million lbs) Beef 2,518 2, Pork 5,005 5, Broilers 7,356 7, Turkey Mature Chickens Total meat 15,714 15,
47 Price Summary 2014/15 estimate forecast June 11 Percent Percent Crops and products Wheat ($/bu) Rice ($/cwt) Corn ($/bu) Soybeans ($/bu) Soybean oil ( /lb) Soybean meal ($/s.t.) Cotton ( /lb) Livestock Steers ($/cwt) Hogs ($/cwt) Broilers ( /lb) Turkeys ( /lb) Dairy products Cheese Butter Nonfat dry milk Dry whey Milk classes Class III ($/cwt) Class IV ($/cwt) All milk ($/cwt)
World Agricultural Outlook Board Interagency Commodity Estimates Committee Forecasts. Lockup Briefing June 11, 2014
 World Agricultural Outlook Board Interagency Commodity Estimates Committee Forecasts Lockup Briefing World Wheat Production Country or Region 2014/15 Million Tons World 714.0 701.6 0.7-1.7 United States
World Agricultural Outlook Board Interagency Commodity Estimates Committee Forecasts. Lockup Briefing April 9, 2014
 World Agricultural Outlook Board Interagency Commodity Estimates Committee Forecasts Lockup Briefing World Wheat Production Country or Region Million Tons World 656.5 712.5 8.5 United States 61.7 58.0-6.0
World Agricultural Outlook Board Interagency Commodity Estimates Committee Forecasts. Lockup Briefing March 10, 2014
 World Agricultural Outlook Board Interagency Commodity Estimates Committee Forecasts Lockup Briefing World Wheat Production Country or Region 2013/14 Million Tons World 656.4 712.7 0.1 8.6 United States
World Agricultural Supply and Demand Estimates
 World Agricultural Supply and Demand Estimates Report of Interagency Commodity Estimates Committee Forecasts World Agricultural Outlook Board, Chairing Agency Economic Research Service Foreign Agricultural
World Agricultural Outlook Board Interagency Commodity Estimates Committee Forecasts. May 9, 2014
 World Agricultural Outlook Board Interagency Commodity Estimates Committee Forecasts World Wheat Production Country or Region Million Tons 2014/15 World 714.0 697.0-2.4 United States 58.0 53.4-7.8 Foreign
World Agricultural Supply and Demand Estimates
 World Agricultural Supply and Demand Estimates Report of Interagency Commodity Estimates Committee Forecasts World Agricultural Outlook Board, Chairing Agency Economic Research Service Foreign Agricultural
World Agricultural Supply and Demand Estimates
 World Agricultural Supply and Demand Estimates Report of Interagency Commodity Estimates Committee Forecasts World Agricultural Outlook Board, Chairing Agency Economic Research Service Foreign Agricultural
2012 Farm Outlook. Highlights
 2012 Farm Outlook Office of the Chief Economist USDA Highlights A promising spring planting was followed by historic drought. Record high commodity prices followed. Farm incomes are expected to be near
World Agricultural Supply And Demand Estimates
 World Agricultural Supply And Demand Estimates United States Department of Agriculture Office of the Chief Economist Agricultural Marketing Service Economic Research Service Farm Service Agency Foreign
World Agricultural Supply And Demand Estimates
 United States Department of Agriculture Office of the Chief Economist World Agricultural Supply And Demand Estimates Agricultural Marketing Service Economic Research Service Farm Service Agency Foreign
World Agricultural Supply And Demand Estimates
 United States Department of Agriculture Office of the Chief Economist World Agricultural Supply And Demand Estimates Agricultural Marketing Service Economic Research Service Farm Service Agency Foreign
World Agricultural Supply And Demand Estimates
 World Agricultural Supply And Demand Estimates United States Department of Agriculture Office of the Chief Economist Agricultural Marketing Service Economic Research Service Farm Service Agency Foreign
World Agricultural Supply And Demand Estimates
 United States Department of Agriculture Office of the Chief Economist World Agricultural Supply And Demand Estimates Agricultural Marketing Service Economic Research Service Farm Service Agency Foreign
WORLD AGRICULTURAL SUPPLY AND DEMAND ESTIMATES
 WORLD AGRICULTURAL SUPPLY AND DEMAND ESTIMATES United States Department of Agriculture Washington, D.C. Approved by the World Agricultural Outlook Board WASDE-339 - June 12, 1998 NOTE Because planting
World Agricultural Supply And Demand Estimates
 United States Department of Agriculture Office of the Chief Economist World Agricultural Supply And Demand Estimates Agricultural Marketing Service Economic Research Service Farm Service Agency Foreign
World Agricultural Supply And Demand Estimates
 United States Department of Agriculture Office of the Chief Economist World Agricultural Supply And Demand Estimates Agricultural Marketing Service Economic Research Service Farm Service Agency Foreign
World Agricultural Supply And Demand Estimates
 World Agricultural Supply And Demand Estimates United States Department of Agriculture Office of the Chief Economist Agricultural Marketing Service Economic Research Service Farm Service Agency Foreign
Factors Affecting Global Agricultural Markets. Fred Giles Director, Agricultural Trade Office USDA / SP
 Factors Affecting Global Agricultural Markets Fred Giles Director, Agricultural Trade Office USDA / SP Factors Impacting Global Agricultural Markets Commodity Prices Energy Prices Value of the U.S. Dollar
Wednesday July 11, 2012 World Ag Supply & Demand Report
 World Ag Supply & Demand Report U.S. 2011/12 Old Crop Corn is neutral Global Old Crop Corn is neutral USDA estimates the 2011/12 U.S. corn carryout at 903 million bushels, up from 851 million bushels from
Global Agricultural Supply and Demand: Factors contributing to recent increases in food commodity prices
 Global Agricultural Supply and Demand: Factors contributing to recent increases in food commodity prices Ron Trostle Economic Research Service U.S. Department of Agriculture Agricultural Markets and Food
Hog and Pork Situation and Outlook
 Hog and Pork Situation and Outlook September 3, 2013 Washington, Iowa Lee Schulz Department of Economics Iowa State University lschulz@iastate.edu (515) 294-3356 Feed Supply U.S. Corn Supply and Use 2009/10
June 9, USDA World Supply and Demand Estimates
 June 9, 2017 - USDA World Supply and Demand Estimates Corn Market Reaction: July 2017 corn futures closed up 2 cents at $3.87 ¾ with a trading range for the day of $3.80 ¾ to $3.89 ½. December 2017 corn
Grains Outlook for 2014 SAEA Crops Outlook Organized Symposium Dallas, TX February 4, 2014
 Grains Outlook for 2014 SAEA Crops Outlook Organized Symposium Dallas, TX February 4, 2014 Dr. Nathan B. Smith (UGA) and Dr. Mark Welch (TAMU) Corn Corn Situation Record production. Leveling off of corn-starch
August 10, USDA World Supply and Demand Estimates
 August 10, 2017 - USDA World Supply and Demand Estimates Corn Market Reaction: September 2017 corn futures closed down 15 cents at $3.57 ¼ with a trading range for the day of $3.56 ½ to $3.75 ½. December
Summary of WASDE and Production USDA
 Summary of WASDE and Production USDA The following information are summary and extracts from the latest, AUG 2016, WASDE and World Agricultural Production reports provided by the United States Department
Friday Aug 10, 2012 World Ag Supply & Demand Report
 Friday Aug 10, 2012 World Ag Supply & Demand Report U.S. 2011/12 Old Crop Corn is Supportive Global Old Crop Corn is Slightly Bearish USDA estimates the 2011/12 U.S. corn carryout at 1,021 million bushels,
June 12, USDA World Supply and Demand Estimates
 June 12, 2018 - USDA World Supply and Demand Estimates Corn Market Reaction: July 2018 corn futures closed up 10 ¼ cents at $3.77 ½ with a trading range for the day of $3.67 ¼ to $3.79 ½. December 2018
December 12, USDA World Supply and Demand Estimates
 December 12, 2017 - USDA World Supply and Demand Estimates Corn Market Reaction: March 2018 corn futures closed down 1 ¼ cents at $3.47 ¾ with a trading range for the day of $3.47 ½ to $3.53. December
September 12, USDA World Supply and Demand Estimates
 September 12, 2018 - USDA World Supply and Demand Estimates Corn Market Reaction: December 2018 corn futures closed down 14 ¼ cents at $3.52 ½ with a trading range for the day of $3.50 ¾ to $3.66 ¼. December
Teucrium s Summary of the World Agricultural Supply and Demand Estimates for Corn, Wheat, and Soybeans
 Teucrium s Summary of the World Agricultural Supply and Demand Estimates for Corn, Wheat, and Soybeans 2018 WASDE Release Dates: February 8, 2018 Jan 12, Feb 8, Mar 8, Apr 10, May 10, Jun 12, Jul 12, Aug
Teucrium s Summary of the World Agricultural Supply and Demand Estimates for Corn, Wheat, and Soybeans
 Teucrium s Summary of the World Agricultural Supply and Demand Estimates for Corn, Wheat, and Soybeans 2018 WASDE Release Dates: April 10, 2018 Jan 12, Feb 8, Mar 8, Apr 10, May 10, Jun 12, Jul 12, Aug
January 12, USDA World Supply and Demand Estimates
 January 12, 2017 - USDA World Supply and Demand Estimates Corn This month s U.S. corn outlook is for lower production, reduced feed and residual use, increased corn used to produce ethanol, and smaller
Teucrium s Summary of the World Agricultural Supply and Demand Estimates for Corn, Wheat, and Soybeans
 Teucrium s Summary of the World Agricultural Supply and Demand Estimates for Corn, Wheat, and Soybeans 2018 WASDE Release Dates: October 11, 2018 Jan 12, Feb 8, Mar 8, Apr 10, May 10, Jun 12, Jul 12, Aug
Teucrium s Summary of the World Agricultural Supply and Demand Estimates for Corn, Wheat, and Soybeans
 Teucrium s Summary of the World Agricultural Supply and Demand Estimates for Corn, Wheat, and Soybeans 2018 WASDE Release Dates: September 12, 2018 Jan 12, Feb 8, Mar 8, Apr 10, May 10, Jun 12, Jul 12,
Teucrium s Summary of the World Agricultural Supply and Demand Estimates for Corn, Wheat, and Soybeans
 Teucrium s Summary of the World Agricultural Supply and Demand Estimates for Corn, Wheat, and Soybeans 2018 WASDE Release Dates: July 12, 2018 Jan 12, Feb 8, Mar 8, Apr 10, May 10, Jun 12, Jul 12, Aug
Teucrium s Summary of the World Agricultural Supply and Demand Estimates for Corn, Wheat, and Soybeans
 Teucrium s Summary of the World Agricultural Supply and Demand Estimates for Corn, Wheat, and Soybeans 2018 WASDE Release Dates: June 12, 2018 Jan 12, Feb 8, Mar 8, Apr 10, May 10, Jun 12, Jul 12, Aug
Teucrium s Summary of the World Agricultural Supply and Demand Estimates for Corn, Wheat, and Soybeans
 Teucrium s Summary of the World Agricultural Supply and Demand Estimates for Corn, Wheat, and Soybeans 2019 WASDE Release Dates: February 8, 2019 Jan 11, Feb 8, Mar 8, April 9, May 10, Jun 11, Jul 11,
Teucrium s Summary of the World Agricultural Supply and Demand Estimates for Corn, Wheat, and Soybeans
 Teucrium s Summary of the World Agricultural Supply and Demand Estimates for Corn, Wheat, and Soybeans 2019 WASDE Release Dates: March 8, 2019 Jan 11, Feb 8, Mar 8, April 9, May 10, Jun 11, Jul 11, Aug
April 9, Dear Subscriber:
 April 9, 2014 Dear Subscriber: We will be adding material to this shell letter after the report is released on April 9, 2014 at 11:00 a.m CST. Be sure to click back on the link often for the latest information.
Market Outlook. David Reinbott.
 Market Outlook David Reinbott Agriculture Business Specialist P.O. Box 187 Benton, MO 63736 (573) 545-3516 http://extension.missouri.edu/scott/agriculture.aspx reinbottd@missouri.edu Trending Issues China,
NOVEMBER 2017 USDA SUPPLY/DEMAND ESTIMATES. Overview
 NOVEMBER 2017 USDA SUPPLY/DEMAND ESTIMATES Overview Corn: This month s 2017/18 U.S. corn outlook included larger production, increased feed use and exports, and higher ending stocks. Corn production is
USDA Agricultural Outlook
 USDA Agricultural Outlook December 216 World Agricultural Outlook Board Office of the Chief Economist U.S. Department of Agriculture Washington, D.C. The Office of the Chief Economist is Non Political
FACTORS CREATING RISK IN U.S. GRAIN MARKETS
 FACTORS CREATING RISK IN U.S. GRAIN MARKETS WAY TOO EARLY GRAIN MARKET OUTLOOK TO 2050 22 ND NATIONAL WORKSHOP FOR DAIRY ECONOMISTS & POLICY ANALYSTS APRIL 30, 2015 JOHN NEWTON UNIV. OF ILLINOIS JCNEWT@ILLINOIS.EDU
May 10, USDA World Supply and Demand Estimates
 May 10, 2018 - USDA World Supply and Demand Estimates Corn Market Reaction: July 2018 corn futures closed down ¾ cent at $4.02 with a trading range for the day of $4.00 to $4.07. December 2018 corn futures
World Agricultural Supply And Demand Estimates
 World Agricultural Supply And Demand Estimates United States Department of Agriculture Office of the Chief Economist Agricultural Marketing Service Economic Research Service Farm Service Agency Foreign
2/19/2014. Bunge North America. Highlights of the Past 12 Months. US Weather
 Bunge North America Flat Price Risk Virginia State Feed Association Conference And Nutritional Management Cow College February 2014 Foreign Currency Commercials/Funds (Boards of Trade) Freight Weather
Fundamental Shifts Impacting U.S. Agriculture
 Fundamental Shifts Impacting U.S. Agriculture Richard Brock California Grain & Feed Association San Diego, CA April 28, Game Changers 3 fundamental shifts Long term Impact $2 cotton in 2011 industry will
OUTLOOK FOR US AGRICULTURE
 Agricultural Outlook Forum 216 OUTLOOK FOR US AGRICULTURE Robert Johansson Chief Economist 25 February 216 Fig 2 Main themes for 216 1. The macroeconomy is weighing on trade, but there are reasons for
World Agricultural Supply And Demand Estimates
 World Agricultural Supply And Demand Estimates United States Department of Agriculture Office of the Chief Economist Agricultural Marketing Service Economic Research Service Farm Service Agency Foreign
Commodity Outlook: September 2017 West Central Illinois: July 2017
 Commodity Outlook: September 2017 West Central Illinois: July 2017 William George Senior Agriculture Economist U.S. Department of Agriculture Foreign Agriculture Service Office of Global Analysis Commodity
January 12, USDA World Supply and Demand Estimates
 January 12, 2018 - USDA World Supply and Demand Estimates Corn Market Reaction: March 2018 corn futures closed down 2 ½ cents at $3.46 ¼ with a trading range for the day of $3.45 ½ to $3.50. December 2018
Cotton: World Markets and Trade
 United States Department of Agriculture Foreign Agricultural Service Circular Series FOP - December Cotton: World Markets and Trade Unprecedented Daily Price Volatility Rules the Market Now Daily NY Nearby
World Agricultural Supply And Demand Estimates
 World Agricultural Supply And Demand Estimates United States Department of Agriculture Office of the Chief Economist Agricultural Marketing Service Economic Research Service Farm Service Agency Foreign
World Agricultural Supply and Demand Estimates United States Department of Agriculture
 ISSN: 1554-9089 Office of the Chief Economist World Agricultural Supply and Demand Estimates United States Department of Agriculture Agricultural Marketing Service Farm Service Agency Economic Research
December 2 nd in Lafayette Indiana and Monticello Illinois December 3 rd in Jacksonville, Illinois
 November 8, 2013 WE WILL BE UPDATING AND ADDING MATERIAL THROUGHOUT THE DAY ON NOVEMBER 8 TO THIS LETTER BEGINNING AT 11:00 AM CST. PLEASE CHECK BACK OFTEN FOR THE LATEST INFORMATION! This morning (Friday,
World Agricultural Supply and Demand Estimates United States Department of Agriculture
 ISSN1554-9089 (Corrected Copy) Office of the Chief Economist World Agricultural Supply and Demand Estimates United States Department of Agriculture Agricultural Marketing Service Farm Service Agency Economic
World Agricultural Supply And Demand Estimates
 World Agricultural Supply And Demand Estimates United States Department of Agriculture Office of the Chief Economist Agricultural Marketing Service Economic Research Service Farm Service Agency Foreign
February 10, Dear Subscriber: We will be adding material to this shell letter after todays reports are released at 11:00 a.m.
 February 10, 2015 Dear Subscriber: We will be adding material to this shell letter after todays reports are released at 11:00 a.m. Be sure to click back on the link often for the latest information. Before
World Agricultural Supply and Demand Estimates United States Department of Agriculture
 ISSN1554-9089 Office of the Chief Economist World Agricultural Supply and Demand Estimates United States Department of Agriculture Agricultural Marketing Service Farm Service Agency Economic Research Service
May 12, Dear Subscriber: We will be adding material to this shell letter after todays reports are released at 11:00 a.m.
 May 12, 2015 Dear Subscriber: We will be adding material to this shell letter after todays reports are released at 11:00 a.m. Be sure to click back on the link often for the latest information. Whle today
World Agricultural Supply and Demand Estimates United States Department of Agriculture
 ISSN: 1554-9089 Office of the Chief Economist World Agricultural Supply and Demand Estimates United States Department of Agriculture Agricultural Marketing Service Farm Service Agency Economic Research
World Agricultural Supply And Demand Estimates
 World Agricultural Supply And Demand Estimates United States Department of Agriculture Office of the Chief Economist Agricultural Marketing Service Economic Research Service Farm Service Agency Foreign
Crop Market Outlook: Where do we go from here?
 2012-13 Crop Market Outlook: Where do we go from here? Frayne Olson, PhD Crop Economist/Marketing Specialist NDSU Extension Service ND Agricultural Experiment Station Dept. of Agribusiness & Applied Economics
THIS REPORT CONTAINS ASSESSMENTS OF COMMODITY AND TRADE ISSUES MADE BY USDA STAFF AND NOT NECESSARILY STATEMENTS OF OFFICIAL U.S.
 THIS REPORT CONTAINS ASSESSMENTS OF COMMODITY AND TRADE ISSUES MADE BY USDA STAFF AND NOT NECESSARILY STATEMENTS OF OFFICIAL U.S. GOVERNMENT POLICY Required Report - public distribution Brazil Post: Brasilia
Agriculture Commodity Markets & Trends
 Agriculture Commodity Markets & Trends Agenda Short History of Agriculture Commodities US & World Supply and Demand Commodity Prices Continuous Charts What is Contango and Backwardation Barge, Truck and
April 9, Dear Subscriber: We will be adding material to this shell letter after todays reports are released at 11:00 a.m.
 April 9, 2015 Dear Subscriber: We will be adding material to this shell letter after todays reports are released at 11:00 a.m. Be sure to click back on the link often for the latest information. While
World Agricultural Supply and Demand Estimates United States Department of Agriculture
 ISSN: 1554-9089 Office of the Chief Economist World Agricultural Supply and Demand Estimates United States Department of Agriculture Agricultural Marketing Service Farm Service Agency Economic Research
World Agricultural Supply and Demand Estimates United States Department of Agriculture
 ISSN 1554-9089 Office of the Chief Economist World Agricultural Supply and Demand Estimates United States Department of Agriculture Agricultural Marketing Service Farm Service Agency Economic Research
World Agricultural Supply and Demand Estimates United States Department of Agriculture
 ISSN1554-9089 Office of the Chief Economist World Agricultural Supply and Demand Estimates United States Department of Agriculture Agricultural Marketing Service Farm Service Agency Economic Research Service
World Agricultural Supply and Demand Estimates United States Department of Agriculture
 ISSN 1554-9089 Office of the Chief Economist World Agricultural Supply and Demand Estimates United States Department of Agriculture Agricultural Marketing Service Farm Service Agency Economic Research
January 9, 2014 WE WILL BE UPDATING AND ADDING MATERIAL THROUGHOUT THE DAY ON JANUARY 10 TO THIS LETTER BEGINNING AT 11:00 AM CST.
 January 9, 2014 WE WILL BE UPDATING AND ADDING MATERIAL THROUGHOUT THE DAY ON JANUARY 10 TO THIS LETTER BEGINNING AT 11:00 AM CST. PLEASE CHECK BACK OFTEN THROUGHOUT THE DAY FOR THE LATEST INFORMATION!
World Agricultural Supply and Demand Estimates United States Department of Agriculture
 ISSN 1554-9089 Office of the Chief Economist World Agricultural Supply and Demand Estimates United States Department of Agriculture Agricultural Marketing Service Farm Service Agency Economic Research
Cotton Update. Hosted by United States Fashion Industry Association (USFIA) and Cotton Incorporated
 and Cotton Incorporated") Cotton Update Hosted by United States Fashion Industry Association (USFIA) and Cotton Incorporated September 27, 2018 2:00 P.M. Eastern/11:00 A.M. Pacific At any time during the presentation, you may enter
Cotton Update Hosted by United States Fashion Industry Association (USFIA) and Cotton Incorporated September 27, 2018 2:00 P.M. Eastern/11:00 A.M. Pacific At any time during the presentation, you may enter
World Agricultural Supply and Demand Estimates United States Department of Agriculture
 ISSN: 1554-9089 Office of the Chief Economist World Agricultural Supply and Demand Estimates United States Department of Agriculture Agricultural Marketing Service Farm Service Agency Economic Research
What are the risks? Crop Market Outlook
 What are the risks? 2012-13 Crop Market Outlook Frayne Olson, PhD Crop Economist/Marketing Specialist NDSU Extension Service ND Agricultural Experiment Station Dept. of Agribusiness & Applied Economics
World Agricultural Supply and Demand Estimates United States Department of Agriculture
 ISSN: 1554-9089 Office of the Chief Economist World Agricultural Supply and Demand Estimates United States Department of Agriculture Agricultural Marketing Service Farm Service Agency Economic Research
World Agricultural Supply and Demand Estimates United States Department of Agriculture
 ISSN 1554-9089 Office of the Chief Economist World Agricultural Supply and Demand Estimates United States Department of Agriculture Agricultural Marketing Service Farm Service Agency Economic Research
Market Outlook. David Reinbott.
 Market Outlook David Reinbott Agriculture Business Specialist P.O. Box 187 Benton, MO 63736 (573) 545-3516 http://extension.missouri.edu/scott/agriculture.aspx reinbottd@missouri.edu Trending Issues Pre-2007
February 10, Tickets are 30 dollars and include a continential breakfast, Beef House lunch, and 25th anniversery hat.
 February 10, 2014 WE WILL BE UPDATING AND ADDING MATERIAL THROUGHOUT THE DAY ON FEBRUARY 10 TO THIS LETTER BEGINNING AT 11:00 AM CST. PLEASE CHECK BACK OFTEN FOR THE LATEST INFORMATION! Tickets for the
World Agricultural Supply and Demand Estimates United States Department of Agriculture
 ISSN: 1554-9089 Office of the Chief Economist World Agricultural Supply and Demand Estimates United States Department of Agriculture Agricultural Marketing Service Farm Service Agency Economic Research
World Agricultural Supply and Demand Estimates United States Department of Agriculture
 ISSN 1554-9089 Office of the Chief Economist World Agricultural Supply and Demand Estimates United States Department of Agriculture Agricultural Marketing Service Farm Service Agency Economic Research
World Agricultural Supply and Demand Estimates United States Department of Agriculture
 ISSN: 1554-9089 Office of the Chief Economist World Agricultural Supply and Demand Estimates United States Department of Agriculture Agricultural Marketing Service Farm Service Agency Economic Research
World Agricultural Supply and Demand Estimates United States Department of Agriculture
 ISSN1554-9089 Office of the Chief Economist World Agricultural Supply and Demand Estimates United States Department of Agriculture Agricultural Marketing Service Farm Service Agency Economic Research Service
USDA lowered the 2010/11 wheat carry out by 49 million and decreased 2010/11 Yield by.2 bushels/acre.
 Friday October 8 th 2010 World Ag Supply & Demand Estimates Very Bullish for Corn Bullish for Soybeans Friendly U.S. Wheat USDA lowered the 2010/11 corn carry out by 214 million and decreased 2010/11 Yield
2019 Grain Market Outlook
 2019 Grain Market Outlook Ness City, Kansas January 7, 2019 DANIEL O BRIEN EXTENSION AGRICULTURAL ECONOMIST Topics to be discussed.. 1) Macroconomic forces at work in the U.S. & where they are taking U.S.
2018/19 Soybean Market Outlook & Strategies
 2018/19 Soybean Market Outlook & Strategies Frayne Olson, PhD Crop Economist/Marketing Specialist Director Burdick Center for Cooperatives frayne.olson@ndsu.edu 701-231-7377 (o) 701-715-3673 (c) NDSU Extension
Iowa Farm Outlook. December 15, 2004 Ames, Iowa Econ. Info. 1900
 Iowa Farm Outlook December 15, 24 Ames, Iowa Econ. Info. 19 Beef and Pork Price Relationships Historically, beef and pork prices have moved somewhat together. They are substitutes in the consumer s shopping
2017/18 Crop Market Outlook & Strategies
 2017/18 Crop Market Outlook & Strategies Frayne Olson, PhD Crop Economist/Marketing Specialist Director Burdick Center for Cooperatives frayne.olson@ndsu.edu 701-231-7377 (o) 701-715-3673 (c) NDSU Extension
U.S. Rice Market Faces Larger Supplies and Lower Prices in 2018/19; Global Trade Projected Another Record High
 U.S. Rice Market Faces Larger Supplies and Lower Prices in 218/19; Global Trade Projected Another Record High 218 Rice Outlook Conference December 5-7, 218 Nathan Childs Economic Research Service USDA
Agricultural Trade and the Implications for the U.S. Farm Sector May 16, 2018 Ames, IA
 Agricultural Trade and the Implications for the U.S. Farm Sector May 16, 2018 Ames, IA David Oppedahl Senior Business Economist Federal Reserve Bank of Chicago 312-322-6122 david.oppedahl@chi.frb.org www.chicagofed.org
World Agricultural Supply and Demand Estimates United States Department of Agriculture
 ISSN 1554-9089 Office of the Chief Economist World Agricultural Supply and Demand Estimates United States Department of Agriculture Agricultural Marketing Service Farm Service Agency Economic Research
World Agricultural Supply and Demand Estimates
 ISSN: 1554-9089 World Agricultural Supply and Demand Estimates Office of the Chief Economist Agricultural Marketing Service Farm Service Agency Economic Research Service Foreign Agricultural Service WASDE
World Agricultural Supply and Demand Estimates
 ISSN: 1554-9089 World Agricultural Supply and Demand Estimates Office of the Chief Economist Agricultural Marketing Service Farm Service Agency Economic Research Service Foreign Agricultural Service WASDE
World Agricultural Supply and Demand Estimates
 ISSN: 1554-9089 World Agricultural Supply and Demand Estimates Office of the Chief Economist Agricultural Marketing Service Farm Service Agency Economic Research Service Foreign Agricultural Service WASDE
World Agricultural Supply and Demand Estimates United States Department of Agriculture
 ISSN 1554-9089 Office of the Chief Economist World Agricultural Supply and Demand Estimates United States Department of Agriculture Agricultural Marketing Service Farm Service Agency Economic Research
Market Outlook. David Reinbott.
 Market Outlook David Reinbott Agriculture Business Specialist P.O. Box 187 Benton, MO 63736 (573) 545-3516 http://extension.missouri.edu/scott/agriculture.aspx reinbottd@missouri.edu Trending Issues Pre-2007
Cattle Market Situation and Outlook
 Cattle Market Situation and Outlook Rebuilding the Cow Herd Series March 28, 2007 Falls City, TX Coordinated by: Dennis Hale-Karnes CEA Ag & Charlie Pfluger-Wilson CEA Ag Prepared and presented by: Larry
Food Prices January February 2012 update Little movement in cereals spot & futures prices Maize stocks a concern
 Feb 29th 12 Food Prices January February 12 update Little movement in cereals spot & futures prices Maize stocks a concern KEY POINTS International spot prices of maize, rice, and wheat are little changed