Weekly Cotton Market Review
|
|
|
- Blaise Peters
- 5 years ago
- Views:
Transcription


1 Mp_cn812 Weekly Cotton Market Review Cotton and Tobacco Program Cotton Market News Division 3275 Appling Road Memphis, TN Vol. 100 No. 3 August 17, 2018 Inside this Issue Market Overview Price Support Average quotations were 492 points lower than the previous week, according to the USDA, Agricultural Marketing Service s Cotton and Tobacco Program. Quotations for the base quality of cotton (color 41, leaf 4, staple 34, mike 35-3 and 43-49, strength , and uniformity ) in the seven designated markets averaged cents per pound for the week ending Thursday, August 1, The weekly average was down from 84.2 last week, but up from 5.91 cents reported the corresponding period a year ago. Daily average quotations ranged from a high of cents Friday, August 10 to a season low of cents Wednesday, August 15. Spot transactions reported in the Daily Spot Cotton Quotations for the week ended August 1 totaled 2,999 bales. This compares to 4,113 reported last week and 4,904 spot transactions reported the corresponding week a year ago. Total spot transactions for the season were 7,30 bales compared to 10,555 bales the corresponding week a year ago. The ICE October settlement prices ended the week at cents, compared to 87.2 cents last week. Spot Quotations ICE Futures A Index Southeastern Textile Mill Report South Central Southwestern Western Cotton & Wool Pima Quotations Cotton Market Reports Subscribe to this report Subscribe to all Cotton Market reports Sources: USDA, AMS, Cotton and Tobacco Program, 1/ Cotlook
2 Southeastern Markets Regional Summary Danny Pino Macon, GA Spot cotton trading was inactive. Supplies and producer offerings were light. Demand was moderate. Average local spot prices were lower. Trading of CCC-loan equities was inactive. Fair to partly cloudy conditions were observed across the lower Southeast region during the period. Daytime high temperatures were in the upper 80s to low 90s throughout the week. Scattered thundershowers brought moisture to areas from the Gulf to Atlantic coasts. In south Alabama, south Georgia, and the Florida panhandle, day-to-day shower activity brought around one to one and one-half inches of weekly accumulated precipitation to localized areas. Producers welcomed the beneficial rainfall in areas of Alabama where dry conditions were observed. Insect pressure was generally light; some fields were treated where foliage feeders met threshold levels. In Georgia, target spot disease had spread in areas where damp conditions persisted. Adult whiteflies were also present in some fields. Similar weather conditions were observed across the upper Southeastern region throughout the period. Daytime high temperatures were observed in the mid-80s to low 90s. Widespread shower activity brought moisture to areas throughout North Carolina and portions of eastern South Carolina and Virginia. Weekly accumulated precipitation totals measured from one-half of an inch to two inches, with heavier accumulations observed in localized areas. Continued rainfall over the last couple of weeks has prevented producers from applying growth-regulators in some fields and there is concern that yields will be negatively impacted. Weed pressure has also increased in areas where herbicide applications have been delayed. Insect pressure was generally light. In areas where populations met threshold limits, producers treated fields where soils were firm enough to support equipment. Bolls were cracking open in the earliest-planted fields across the region. According to the National Agricultural Statistics Service s Crop Progress report released August 13, boll-setting had reached 89 percent in Alabama, 84 in Georgia, 78 in North Carolina, 75 percent in South Carolina and Virginia. Textile Mill Demand was good for color 41, leaf 4, and staple 34 for fourth quarter 2018 through first quarter 2019 delivery. No additional sales were reported. Demand of open-end and ring-spun yarn was moderate. Most mills operated five to seven days. Demand through export channels was moderate. Agents throughout the Far East inquired for any discounted styles of cotton. No sales were reported. Trading 2


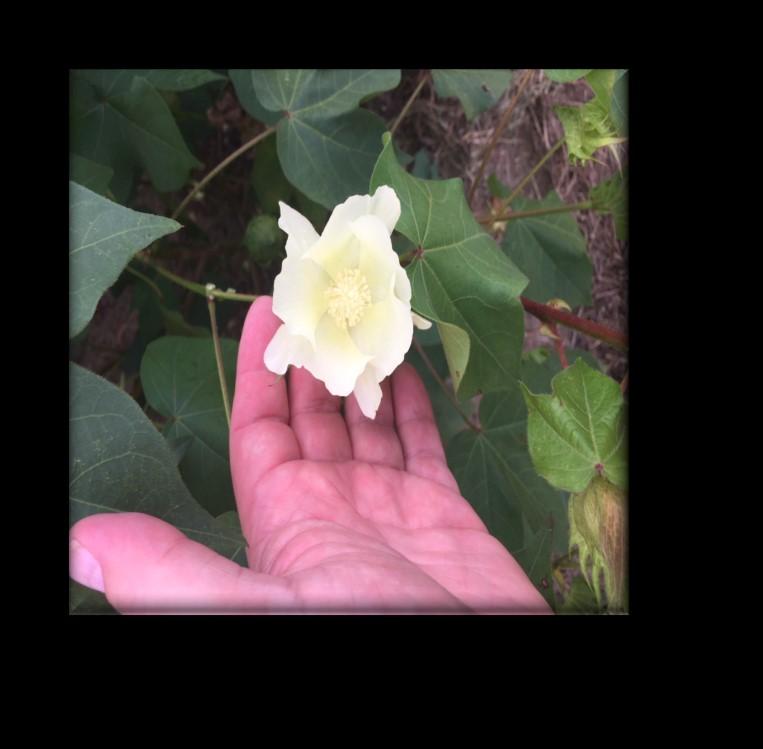

3 Southeastern Markets Regional Summary Danny Pino Macon, GA Photos courtesy of: Danny Pino, Southeast Reporter 3
4 South Central Markets Regional Summary Jeff Carnahan Memphis, TN North Delta Spot cotton trading was inactive. Supplies of available cotton were light. Demand was light. Average local spot prices were lower. Trading of CCC-loan equities was inactive. No forward contracting was reported. Hot and humid weather prevailed throughout the region during the week. Daytime high temperatures were in the upper 90s, with a reported heat index of 102. Overnight lows were in the upper 70s. A series of storms brought several inches of rain to northeastern Arkansas and the cotton-producing region of Missouri mid-to-late week. Locally heavy downpours resulted in up to 5 inches of rain in some places. Only trace amounts of precipitation were reported in Tennessee, which caused the condition of the cotton crop to decline somewhat compared to last week. Some boll shedding was reported in drier areas. Crop protection measures have been terminated on dryland cotton and early-planted fields under irrigation. Some late-planted fields continued to receive treatments as necessary, due to pressure from insect pests including plant bugs, bollworms, and spider mites. According to the National Agricultural Statistics Service s (NASS) Crop Progress report released August 13, the crop condition in Arkansas improved slightly to 84 percent good-to-excellent. Missouri also improved slightly to 79 percent fair-to-good, while Tennessee declined 8 points to 74 percent good-to-excellent. NASS also reported that open bolls were at 7 percent in Arkansas, 2 percent in Missouri, and 8 percent in Tennessee. Defoliation could begin within one to two weeks, staring with dryland fields. South Delta Spot cotton trading was inactive. Supplies of available cotton were light. Demand was light. Average local spot prices were lower. Trading of CCC-loan equities was inactive. No forward contracting was reported. Fair weather conditions allowed the crop to make normal progress during the week in most areas. Daytime high temperatures were in the mid-90s. Overnight lows were in the low 70s. Pop-up thunderstorms brought 1 to 2 inches of rain to widely scattered areas. Producers continued irrigating as necessary to maintain adequate soil moisture on late-planted fields. Boll shedding was reported in moisture-stressed fields. Insect pressure was light and fields were treated to control pests; many fields no longer required any crop protection measures. According to the National Agricultural Statistics Service s (NASS) Crop Progress report released August 13, the crop condition in Louisiana was rated at 92 percent fair-to-good and in Mississippi 73 percent fair-to-good; these figures were slightly lower than those reported the previous week. NASS also reported that open bolls had reached 12 percent in Mississippi and 29 percent in Louisiana; defoliation could begin within a week to ten days. Trading North Delta South Delta 4
5 Southwestern Markets Regional Summary Jane Byers-Angle Lubbock, TX East Texas Spot cotton trading was moderate. Supplies and producer offerings were light. Demand was light. Average local spot prices were lower. Producer interest in forward contracting was light. Trading of CCC-loan equities was inactive. Foreign inquiries were light. Defoliants were applied and harvesting progressed under good conditions in south Texas. More than half of the fields have been harvested in the Coastal Bend. Harvesting has been completed in some counties except on late-planted fields. Harvesting expanded in the Upper Coast. Ginning continued in the Rio Grande Valley. Untimely rainfall was received on some fields that were ready for harvest in the northern Blackland Prairies, where producers had already applied defoliants. Reports indicated that 7 to 12 inches of rainfall was received and field activity was hindered. Drier conditions prevailed in the southern Blackland Prairies, and defoliants and boll openers were applied. According to the National Agricultural Statistics Service s (NASS) Texas Production report released on August 10, production in the Blackland Prairies is forecasted at 10,000 bales, compared to 293,000 bales produced the previous year. Acres harvested are estimated at 215,000 acres, compared to 15,000 acres last season, and estimated yield is at 357 pounds per acre, compared to 85 pounds per acre in According to NASS s Crop Production report released on August 10, Kansas cotton production is forecasted at 250,000 bales, up 27 percent from the previous year. Acreage harvest is forecasted at 11,000 acres, up 2,000 acres from Yield is forecasted lower at 1,034 pounds per acre, down 17 pounds per acre. Bolls had begun to open. Moderate, timely rainfall helped the crop advance. Recent rainfall in Oklahoma helped the irrigated stands, and producers were encouraged. Some fields reached Dryland continued to struggle. cut-out. West Texas Spot cotton trading was inactive. Supplies and producer offerings were light. Demand was very light. Average local spot prices were lower. Producer interest in forward contracting was light. Trading of CCC-loan equities was slow. Foreign inquiries were light. Daytime temperatures were mostly in the mid-80s to low 90s. A series of timely thunderstorms early in the reporting period brought beneficial rainfall and cooler conditions, which gave heat-stressed plants a reprieve. The rainfall was received too late for many dryland acres that have already been submitted for coverage under the federal crop insurance program. Irrigated fields reached full-bloom, and some neared cut-out. Plants were loaded and fruit retention was good. Stands in the western panhandle and in New Mexico have enough well water and made good progress. Beneficial rainfall was received. Local experts continued to monitor fields for insect activity. Trading East Texas In Texas, a light volume of new-crop cotton color 21 and 31, leaf 3 and better, staple 3 and longer, mike 44-48, strength 28-30, and uniformity sold for around cents per pound, FOB warehouse (compression charges not paid). In Kansas, a mixed lot containing a moderate volume of 2017-crop cotton mostly color 33 and better, leaf 5 and better, staple 3 and longer, mike 35-47, strength 29-32, uniformity 80-83, and 25 percent extraneous matter sold for around 7.50 cents, FOB car/truck (compression charges not paid). A mixed lot containing a light volume of mostly color 85, leaf 7 and better, staple 32 and longer, mike 31-42, strength 25-31, uniformity 7-81, and 75 percent extraneous matter sold for around cents, same terms as above. West Texas A moderate volume of CCC-loan equities traded for 3.75 to 7.75 cents per pound. 5


6 Southwestern Markets Regional Summary Jane Byers-Angle Lubbock, TX Photos courtesy of: Dwight Jackson
7 Maria Townsend Western Markets Regional Summary Visalia, CA Desert Southwest (DSW) Spot cotton trading was inactive. Supplies and demand were light. Average local spot prices were lower. No forward contracting or domestic mill activity was reported. Foreign mill inquiries were light and mostly for new-crop price discovery. Temperatures were in the low 100s, with approximately one-half of an inch of rainfall received early in the period. Harvesting gained momentum in Yuma. Modules lined the fields and were transported to the gin. According to the National Agricultural Statistics Service (NASS) Crop Progress report for week ending August 12, boll-setting reached 91 percent and 25 percent of bolls were opened. The condition of the crop was rated mostly fair-to-good. Some central Arizona fields were treated to control lygus and whitefly. Evidence of Level 2 heat stress was present in some fields and a few young immature bolls were shed. Squaring advanced to 85 percent in New Mexico. Boll-setting was at 52 percent, compared to the five-year average of 4 percent, according to NASS. The condition of the crop was rated mostly fair-to-good. Monsoon moisture brought one-half of an inch to nearly one inch of much needed moisture early in the reporting period for New Mexico and El Paso, TX. Local sources reported that the crop made good progress. The organic crop in New Mexico made good progress. The crop has responded well to the heat. No insect pressure was reported. light. No inquiries for new-crop were reported. Sunny skies and hot temperatures ruled. Daytime high temperatures were in the high 90s to low 100s. Conditions improved as fire crews contained nearby wildfires. Fields were sprayed for aphid and lygus. The crop was in good condition and made good progress. The California State Department of Ag. Pink Bollworm program issued the final Upland cotton acreage mapped at 33,990 acres in the SJV. A statewide total of 47,925 Upland acres was reported. American Pima (AP) Spot cotton trading was inactive. Supplies and demand were light. Average local spot prices were steady. No domestic mill activity was reported. Foreign mill inquiries were light for 2018-crop cotton. Daytime temperatures were in the high 90s to low 100s for the Far West. The Far West crop continued to make good progress under hot, dry conditions. Harvesting gained momentum in Yuma, AZ. Ginning was set to begin after the Upland cotton ginning is completed. Blooming continued and boll-setting advanced throughout the region. Overall, the crop was in good condition. The California State Department of Ag. Pink Bollworm program issued the final cotton acreage mapped at 209,945 acres of AP cotton in the SJV. San Joaquin Valley (SJV) Spot cotton trading was inactive. Supplies and demand were light. Average local spot prices were lower. No forward contracting or domestic mill activity was reported. Foreign mill inquiries were Trading Desert Southwest San Joaquin Valley American Pima 7
 estimates indicate that total U.S. cotton textile and apparel trade grew during the first half of 2018, compared with the corresponding period of 2017. While U.S. cotton product imports totaled the equivalent of nearly 8.")

8 Cotton & Wool The following information was excerpted from the Cotton & Wool report, released on August 14, 2018 The latest U.S. Department of Agriculture (USDA) estimates indicate that total U.S. cotton textile and apparel trade grew during the first half of 2018, compared with the corresponding period of While U.S. cotton product imports totaled the equivalent of nearly 8.8 million 480-pound bales of raw cotton during January-June 2018 compared with approximately 8. million bales for the first months of 2017 cotton product exports decreased slightly to about 1.8 million bale-equivalents. Based on these volumes, the cotton textile and apparel trade deficit was 3 percent higher at 7.0 million bale-equivalents during the first half of The concentration of U.S. cotton product imports continues to be focused on several major suppliers, with the top five countries contributing more than two-thirds of total imports during the first half of Compared with the corresponding period of 2017, the first months of 2018 saw the share rise for four of the top five suppliers (fig. 1). China remains the leading supplier of U.S. cotton product imports, accounting for nearly 31 percent of the total during January-June of 2018; for India the second largest supplier the share reached 11.5 percent. In addition, the U.S. cotton product import shares increased for Pakistan, Vietnam, and Bangladesh in 2018, with each providing 8 percent of the mid-year total. For complete report click here. 8
9 World market prices for upland cotton, in cents per pound, in effect from 12:01 a.m., EDT, Friday through midnight, EDT, Thursday and July July July 27 Aug Aug Aug Aug Adjusted world price 1/ Course count adjustment Loan Deficiency Payment (LDP) Fine count adjustment Fine count adjustment / Color 41, leaf 4, staple 34, mike 35-3 & 43-49, strength readings of grams per tex, length uniformity of percent. Source: Farm Service Agency, USDA. Description Outstanding sales Exports Total export commitments Marketing Years Week Mkt. Year Week - 5,815, , , ,300 -,129,00 - New sales 192,00-82,400 - Buy-backs and cancellations 5,900-4,700 - Net sales Sales next marketing year 18,700-77,700, ,900 (11,700) Through August 10, 2017 Through August 9, 2018 Mkt. Year 8,039, ,400 8,322,800-1,31,300 Net sales of 77,700 RB for 2018/2019 were reported for Vietnam (24,00 RB), Pakistan (1,900 RB), Indonesia (7,000 RB, including 1,100 RB switched from Japan), Bangladesh (,100 RB), and Peru (4,00 RB). Reductions were reported for Japan (3,000 RB). For 2019/2020, net sales reductions of 11,700 RB resulted as increases for Mexico (3,500 RB), were more than offset by reductions for India (15,200 RB). Exports of 240,300 RB were primarily to Indonesia (42,700 RB), Vietnam (41,00 RB), China (34,400 RB), Bangladesh (24,700 RB), and Mexico (15,200 RB). Net sales of Pima totaling 2,800 RB for 2018/2019 reported for Vietnam (2,200 RB), India (400 RB, switched from Japan), and the United Kingdom (300 RB), were partially offset by reductions for Japan (300 RB). Exports of 4,00 RB were primarily to India (2,000 RB), Pakistan (1,400 RB), Indonesia (500 RB), and Thailand (300 RB). Optional Origin Sales: For 2018/2019, the current optional origin outstanding balance of,200 RB is for Indonesia (4,400 RB) and Vietnam (1,800 RB). Exports for Own Account: New exports for own account totaling,800 RB were to China. Decreases totaling,800 RB were reported for Vietnam (,300 RB) and Bangladesh (500 RB). The current outstanding balance is 13,000 RB, all China. Source: Export Sales Reporting Division, Foreign Agricultural Service, USDA. NOTE: Data may not add due to rounding. August 1, 2018 USDA ANNOUNCES SPECIAL IMPORT QUOTA #17 FOR UPLAND COTTON August 1, 2018 The Department of Agriculture's Commodity Credit Corporation announced a special import quota for upland cotton that permits importation of a quantity of upland cotton equal to one week s domestic mill use. The quota will be established on August 23, 2018, allowing importation of 13,543,5 kilograms (2,205 bales) of upland cotton. Quota number 17 will be established as of August 23, 2018, and will apply to upland cotton purchased not later than November 20, 2018, and entered into the U.S. not later than February The quota is equivalent to one week's consumption of cotton by domestic mills at the seasonally-adjusted average rate for the period April 2018 through June 2018, the most recent three months for which data are available. Future quotas, in addition to the quantity announced, will be established if price conditions warrant. 9
10 Number of Bales in Certificated Stocks Delivery Points Stocks as of Awaiting Review Non-Rain Grown Cotton Dallas/FT. Worth, TX 7, Galveston, TX Greenville, SC Houston, TX Memphis, TN 12, Total 20, Spot quotations are in cents per pound for cotton equal to the Official Standards, net weight, in mixed lots, compressed, FOB car/truck. SOUTHEAST NORTH DELTA SOUTH DELTA DESERT SOUTHWEST Staple EAST TEXAS-OKLAHOMA WEST TEXAS SAN JOAQUIN VALLEY Staple MIKE DIFFERENCES - POINTS PER POUND SOUTH- NORTH SOUTH E. TX WEST DESERT SJ EAST DELTA DELTA OK Mike Ranges TEXAS SW VALLEY AVG & Below Base Base & Above STRENGTH DIFFERENCES UNIFORMITY DIFFERENCES SOUTH- NORTH SOUTH E. TX Grams WEST DESERT SJ SOUTH- NORTH SOUTH E. TX Unit WEST DESERT SJ EAST DELTA DELTA OK per tex TEXAS SW VALLEY AVG. EAST DELTA DELTA OK TEXAS SW VALLEY AVG & below Diff Base Base & above & above August 1,
11 American Pima quotations are for cotton equal to the Official Standards, net weight, in mixed lots, UD Free, FOB warehouse. 1/ AMERICAN PIMA SPOT QUOTATIONS Color Leaf Staple The current Pima spot quotations represent prices from local sales, export sales, and offerings last reported on May 30, Type - Level Plastic - Level 2 Diff. Other - Level Plastic - Level / Pima spot quotations for color-leaf-staple combinations not quoted will be included as sales of those qualities which are reported. Range 2 & Below & Below & Above Extraneous Matter Prep - Level Prep - Level 2 Mike Strength & Above 0 Range (Grams per Tex) Diff Diff Other - Level August 1,
Weekly Cotton Market Review
 Mp_cn812 Weekly Cotton Market Review Cotton and Tobacco Program Cotton Market News Division 3275 Appling Road Memphis, TN 38133 901.384.301 Vol. 99 No. 17 November 24, 2017 Inside this Issue Market Overview
Weekly Cotton Market Review
 Mp_cn812 Weekly Cotton Market Review Cotton and Tobacco Program Cotton Market News Division 3275 Appling Road Memphis, TN 38133 901.384.301 ***No report will be published on December 28. Publication will
Weekly Cotton Market Review
 Mp_cn812 Weekly Cotton Market Review Cotton and Tobacco Program Cotton Market News Division 3275 Appling Road Memphis, TN 38133 901.384.301 Vol. 100 No. 27 February 8, 2019 Inside this Issue Market Overview
Weekly Cotton Market Review
 Mp_cn812 USDA, AMS, Cotton and Tobacco Program Cotton Market News Division 3275 Appling Road Memphis, Tennessee 38133 Vol. 98 No. 51 July 28, 2017 Inside this Issue Market Overview Price Support Southeastern
AGRICULTURAL MARKETING SERVICE COTTON DIVISION, MARKET NEWS BRANCH 4841 SUMMER AVENUE, MEMPHIS, TENNESSEE Telephone
 L J4 UNITED STATES DEPARTMENT OF AGRICULTURE IUS30AI AGRICULTURAL MARKETING SERVICE COTTON DIVISION, MARKET NEWS BRANCH 4841 SUMMER AVENUE, MEMPHIS, TENNESSEE 38122 I i Telephone 901-521-2931 Weekly Cotton
Cotton and Wool Outlook
 Economic Research Service Situation and Outlook Report CWS-18g July 16, 2018 Next release is August 14, 2018 Cotton and Wool Outlook Leslie A. Meyer Record Global Cotton Mill Use in 2018/19; Growth Varies
Quality of Cotton Classed by State
 Cotton and Tobacco Program 3275 Appling Road, Memphis, TN 38133 (901) 384-3016 Quality of Cotton Classed by State mp_cn811 Volume 20, No. 25 18-Jan-19 NUMBER SAMPLES CLASSED FOR PRODUCERS, BY STATE, State
Cotton and Wool Outlook
 Economic Research Service Situation and Outlook Report CWS-18j October 15, 2018 Next release is December 13, 2018 Cotton and Wool Outlook Leslie A. Meyer China Leads 2018/19 World Cotton Stocks Decline
TEXAS COTTON ASSOCIATION & CCI COTTON USA Special Trade Mission from Latin America June 13 & 14, 2012
 TEXAS COTTON ASSOCIATION & CCI COTTON USA Special Trade Mission from Latin America June 13 & 14, 2012 TEXAS COTTON ASSOCIATION & CCI COTTON USA Special Trade Mission from Latin America Welcome to Texas,
Cotton and Wool Outlook
 Economic Research Service Situation and Outlook Report CWS-18h August 14, 2018 Next release is September 14, 2018 Cotton and Wool Outlook Leslie A. Meyer U.S. Cotton Product Trade Rising in 2018 The latest
Cotton and Wool Outlook
 Economic Research Service Situation and Outlook Report CWS-18f June 14, 2018 Next release is July 16, 2018 Cotton and Wool Outlook Leslie A. Meyer World Cotton Ending Stocks in 2018/19 Projected Lowest
Cotton and Wool Outlook
 Economic Research Service Situation and Outlook CWS-17g Release Date July 14, 2017 Cotton and Wool Outlook Leslie Meyer lmeyer@ers.usda.gov Global Growth of Cotton Mill Use Varies by Country Cotton and
Prepared by Economic Services Volume 43 Number 10 November 2012
 Prepared by Economic Services Volume 43 Number 10 November 2012 CROP PROUCTION In its November crop report, US estimated a 2012-13 U.S. crop of 17.45 million bales (Exhibit 1). Upland production was estimated
Cotton and Wool Outlook
 Economic Research Service Situation and Outlook Report CWS-18c March 12, 2018 Next release is April 12, 2018 Cotton and Wool Outlook Leslie A. Meyer lmeyer@ers.usda.gov Record 2017 U.S. Net Textile and
U.S. COTTON BASIS AND QUALITY PREMIUMS DURING THE TRANSITION TO AN EXPORT ORIENTED MARKET YA WU. (Under the direction of Dr. Lewell F.
 U.S. COTTON BASIS AND QUALITY PREMIUMS DURING THE TRANSITION TO AN EXPORT ORIENTED MARKET by YA WU (Under the direction of Dr. Lewell F. Gunter) ABSTRACT The United States is a major cotton producer and
Cotton and Wool Outlook
 Economic Research Service Situation and Outlook CWS-17j Release Date October 16, 2017 Cotton and Wool Outlook Leslie Meyer lmeyer@ers.usda.gov Cotton Stocks Outside of China Rising in 2017/18 Cotton and
United States Department of Agriculture Cotton Outlook Friday, February 24,
 United States Department of Agriculture Cotton Outlook Friday, February 24, 2017 www.usda.gov/oce/forum Agricultural Outlook Forum 2017 Presented Friday, February 24, 2017 THE WORLD AND UNITED STATES COTTON
Structural Changes in U.S. Cotton Supply
 Structural Changes in U.S. Cotton Supply Dr. Donna Mitchell Department of Agricultural and Applied Economics Texas Tech University Box 42132 Lubbock, Texas 7949 donna.m.mitchell@ttu.edu Dr. John Robinson
AFPC ECONOMIC CONTRIBUTIONS OF THE US COTTON INDUSTRY TO THE US ECONOMY. Agricultural and Food Policy Center Texas A&M University.
 Agricultural and Food Policy Center Texas A&M University November 2013 ECONOMIC CONTRIBUTIONS OF THE US COTTON INDUSTRY TO THE US ECONOMY AFPC Department of Agricultural Economics Texas AgriLife Research
The Comparative Advantage of Upland Cotton Production in Texas
 The Texas Journal of Agriculture and Natural Resource 19:31-38 (2006) 31 The Comparative Advantage of Upland Cotton Production in Texas Xiaoling (Sherry) Yu Department of Management, Tarim University,
May 10, USDA World Supply and Demand Estimates
 May 10, 2018 - USDA World Supply and Demand Estimates Corn Market Reaction: July 2018 corn futures closed down ¾ cent at $4.02 with a trading range for the day of $4.00 to $4.07. December 2018 corn futures
August 10, USDA World Supply and Demand Estimates
 August 10, 2017 - USDA World Supply and Demand Estimates Corn Market Reaction: September 2017 corn futures closed down 15 cents at $3.57 ¼ with a trading range for the day of $3.56 ½ to $3.75 ½. December
Cotton and Wool Outlook
 Economic Research Service Situation and Outlook CWS-15f Release Date June 12, 2015 Cotton and Wool Outlook Leslie Meyer lmeyer@ers.usda.gov Stephen MacDonald stephenm@ers.usda.gov Global Cotton Ending
United States Department of Agriculture Cotton Outlook Friday, February 26, 2016
 United States Department of Agriculture Cotton Outlook Friday, February 26, 216 www.usda.gov/oce/forum Agricultural Outlook Forum 216 Presented Friday, February 26, 216 THE WORLD AND UNITED STATES COTTON
SOYBEANS: LARGE SUPPLIES CONFIRMED, BUT WHAT ABOUT 2005 PRODUCTION?
 SOYBEANS: LARGE SUPPLIES CONFIRMED, BUT WHAT ABOUT 2005 PRODUCTION? JANUARY 2005 Darrel Good 2005 NO. 2 Summary USDA s January reports confirmed a record large 2004 U.S. crop, prospects for large year-ending
Cotton and Wool Outlook
 CWS-07i Oct. 15, 2007 Cotton and Wool Outlook Leslie Meyer, Stephen MacDonald, and Robert Skinner Foreign Cotton Mill Use Rises Faster Than Production Contents Domestic Outlook Intl. Outlook Contacts &
Cotton and Wool Outlook
 Cotton and Wool Outlook CWS-12g Sept. 13, 2012 Leslie Meyer lmeyer@ers.usda.gov Stephen MacDonald stephenm@ers.usda.gov James Kiawu jkiawu@ers.usda.gov World Cotton Consumption To Rebound Slightly in 2012/13
June 9, USDA World Supply and Demand Estimates
 June 9, 2017 - USDA World Supply and Demand Estimates Corn Market Reaction: July 2017 corn futures closed up 2 cents at $3.87 ¾ with a trading range for the day of $3.80 ¾ to $3.89 ½. December 2017 corn
77TH PLENARY MEETING OF THE INTERNATIONAL COTTON ADVISORY COMMITTEE. ABIDJAN COTE d IVOIRE COUNTRY STATEMENT THE UNITED STATES OF AMERICA
 77TH PLENARY MEETING OF THE INTERNATIONAL COTTON ADVISORY COMMITTEE ABIDJAN COTE d IVOIRE COUNTRY STATEMENT THE UNITED STATES OF AMERICA UPLAND COTTON SITUATION AND OUTLOOK FOR MY 2016/17 3 UPLAND MARKET
January 12, USDA World Supply and Demand Estimates
 January 12, 2017 - USDA World Supply and Demand Estimates Corn This month s U.S. corn outlook is for lower production, reduced feed and residual use, increased corn used to produce ethanol, and smaller
Peanut Situation and Outlook 2004/2005. Nathan B. Smith 1
 Introduction and Overview Peanut Situation and Outlook 2004/2005 Nathan B. Smith 1 Peanut producers hope to follow 2003 with another record year for peanut yields in 2004. The US peanut yield averaged
June 12, USDA World Supply and Demand Estimates
 June 12, 2018 - USDA World Supply and Demand Estimates Corn Market Reaction: July 2018 corn futures closed up 10 ¼ cents at $3.77 ½ with a trading range for the day of $3.67 ¼ to $3.79 ½. December 2018
January 12, USDA World Supply and Demand Estimates
 January 12, 2018 - USDA World Supply and Demand Estimates Corn Market Reaction: March 2018 corn futures closed down 2 ½ cents at $3.46 ¼ with a trading range for the day of $3.45 ½ to $3.50. December 2018
The University of Georgia Cooperative Extension College of Agricultural and Environmental Sciences
 The University of Georgia Cooperative Extension College of Agricultural and Environmental Sciences July 3, 2012 www.ugacotton.com Irrigation Management for the 2012 Crop 1 US and Georgia 2012 Cotton Acreage
2012 and Preliminary 2013 U.S. Organic Cotton Production & Marketing Trends
 U.S. Organic Cotton Production & Marketing Trends January 2014 Executive Summary Background 2012 U.S. Organic Cotton Production Overview Acres Planted / Acres Harvested Pricing & Market Agriculture Farm
SOYBEANS: SMALLER STOCKS, MORE ACRES, AND EARLY WEATHER WORRIES
 SOYBEANS: SMALLER STOCKS, MORE ACRES, AND EARLY WEATHER WORRIES APRIL 2000 Darrel Good Summary March 1, 2000 stocks of soybeans were estimated at 1.397 billion bushels, 60 million less than on the same
U.S. Cotton Distribution Patterns,
 United States Agriculture Economic Research Service U.S. Cotton Distribution Patterns, Statistical Bulletin Number 769 1986/87 Edward H. Glade, Jr. Mae Dean Johnson SALES INFORMATION Additional copies
2010 and Preliminary 2011 U.S. Organic Cotton Production & Marketing Trends
 2010 and Preliminary 2011 U.S. Organic Cotton Production & Marketing Trends Produced by the Organic Trade Association January 2012 Background In December 2011, the Organic Trade Association (OTA) identified
Grain Price SOYBEANS: SMALLER U.S. CROP, WILL SOUTH AMERICA FILL THE GAP? OCTOBER 2002 Darrel Good 2002 NO. 8. Summary
 UNIVERSITY OF ILLINOIS EXTENSION Grain Price OUTLOOK A joint publication of the Department of Agricultural Economics, College of Agriculture, Purdue University, West Lafayette, Indiana, and the Department
The 1997 Production Year in Review
 Newsletter of the Cotton Physiology Education Program Volume 8, Number 4, 1997 The 1997 Production Year in Review Exciting changes are afoot in the cotton industry many spawned by the new Farm Bill, many
Cotton and Wool. Situation and Outlook Report JUN ,LBERT R. MANf\ LIBRARY THACA, N. Y World Cotton Prices Continue To Fall
 United States Department of Agriculture Economic Research Service CWS-52 June 1988 Cotton and Wool Situation and Outlook Report,LBERT R. MANf\ LIBRARY JUN 2 7 1988 THACA, N. Y. 14857 World Cotton Prices
SOYBEANS: FOCUS ON SOUTH AMERICAN AND U.S. SUPPLY AND CHINESE DEMAND
 SOYBEANS: FOCUS ON SOUTH AMERICAN AND U.S. SUPPLY AND CHINESE DEMAND APRIL 2002 Darrel Good 2002-NO.4 Summary Soybean prices during the first half of the 2001-02 marketing year were well below the prices
December 12, USDA World Supply and Demand Estimates
 December 12, 2017 - USDA World Supply and Demand Estimates Corn Market Reaction: March 2018 corn futures closed down 1 ¼ cents at $3.47 ¾ with a trading range for the day of $3.47 ½ to $3.53. December
SOYBEANS: WORLD PRODUCTION CONTINUES TO EXPAND
 SOYBEANS: WORLD PRODUCTION CONTINUES TO EXPAND OCTOBER 2001 Darrel Good 2001-No. 7 Summary The USDA s October Crop Production report forecast the 2001 U.S. soybean crop at 2.907 billion bushels. That forecast
CORN: MARKET TO REFLECT U.S. AND CHINESE CROP PROSPECTS
 CORN: MARKET TO REFLECT U.S. AND CHINESE CROP PROSPECTS JULY 2001 Darrel Good 2001 - No. 6 Summary The USDA s June Acreage and Grain Stocks reports provided some modest fundamental support for the corn
January 9, 2014 WE WILL BE UPDATING AND ADDING MATERIAL THROUGHOUT THE DAY ON JANUARY 10 TO THIS LETTER BEGINNING AT 11:00 AM CST.
 January 9, 2014 WE WILL BE UPDATING AND ADDING MATERIAL THROUGHOUT THE DAY ON JANUARY 10 TO THIS LETTER BEGINNING AT 11:00 AM CST. PLEASE CHECK BACK OFTEN THROUGHOUT THE DAY FOR THE LATEST INFORMATION!
Jeanne Reeves Cotton Incorporated June 4, 2013
 Jeanne Reeves Cotton Incorporated June 4, 2013 Cotton Incorporated s mission is to increase the demand for and profitability of cotton through research and promotion. Market Notes 2011, highest prices
February 28, Dear Subscriber:
 February 28, 2014 Dear Subscriber: This has been a week when the bears have gained control of the soybean market, unwinding bull spreads (selling May and buying back November 2014 soybeans). Our analysts
Cotton and Wool Outlook
 Cotton and Wool Outlook CWS-11i Dec. 12, 2011 Leslie Meyer lmeyer@ers.usda.gov Stephen MacDonald stephenm@ers.usda.gov James Kiawu jkiawu@ers.usda.gov Global Cotton Mill Use Reduced; Lowest in 3 Years
U.S. Rice Market Faces Tighter Supplies and Higher Prices in 2017/18
 U.S. Rice Market Faces Tighter Supplies and Higher Prices in 217/18 University of Arkansas Webinar Series October 26, 217 Nathan Childs Economic Research Service USDA Approved by the World Agricultural
Crop Production ISSN:
 Crop Production ISSN: 1936-3737 Released August 12, 2014, by the National Agricultural Statistics Service (NASS), Agricultural Statistics Board, United States Department of Agriculture (USDA). Corn Production
SOYBEANS: SURPLUS GROWS, ACREAGE TO DECLINE
 SOYBEANS: SURPLUS GROWS, ACREAGE TO DECLINE JANUARY 2007 Darrel Good 2007 NO. 2 Summary The 2006 U.S. soybean crop was a record 3.188 billion bushels, but was 16 million smaller than the November 2006
SOYBEANS: HIGHEST PRICES IN OVER SEVEN YEARS. January 2004 Darrel Good 2004 NO. 2
 SOYBEANS: HIGHEST PRICES IN OVER SEVEN YEARS January 2004 Darrel Good 2004 NO. 2 Summary At 2.418 billion bushels, the 2003 U.S. soybean crop was 34 million bushels smaller than the USDA s November forecast
SOYBEANS: LARGE U.S. CROP, WHAT ABOUT SOUTH AMERICA? October 2005 Darrel Good 2005 No. 8
 SOYBEANS: LARGE U.S. CROP, WHAT ABOUT SOUTH AMERICA? October 2005 Darrel Good 2005 No. 8 Summary USDA reports provided two fundamental surprises for the market over the past three weeks. First, the September
CROP REPORT. USDA National Agriculture Summary Corn & Soybeans ISSUE 2: JULY, 2016
 ISSUE 2: JULY, 2016 TM CROP REPORT USDA National Agriculture Summary Corn & Soybeans Corn: By June 26, silking was estimated at 6 percent complete, 3 percentage points ahead of last year and slightly ahead
September 12, USDA World Supply and Demand Estimates
 September 12, 2018 - USDA World Supply and Demand Estimates Corn Market Reaction: December 2018 corn futures closed down 14 ¼ cents at $3.52 ½ with a trading range for the day of $3.50 ¾ to $3.66 ¼. December
CORN: FIVE CONSECUTIVE LARGE CROPS?
 CORN: FIVE CONSECUTIVE LARGE CROPS? JULY 2000 Darrel Good Summary The USDA s June Acreage Report revealed that U.S. producers had planted nearly 79.6 million acres of corn in 2000, up from 77.4 million
Hay being cut last week was more of a clipping or hay that either needs to be taken off due to weeds or because. Ellensburg Division - PNW
 Vol. 7 No. 1-2014 May Spring Edition Ellensburg Division - PNW Hay being cut last week was more of a clipping or hay that either needs to be taken off due to weeds or because the field is planted to timothy.
Response to World Wildlife Fund Background Paper Transgenic Cotton: Are There Benefits for Conservation?
 Response to World Wildlife Fund Background Paper Transgenic Cotton: Are There Benefits for Conservation? By Janet Carpenter National Center for Food and Agricultural Policy 1616 P Street NW, First Floor
U.S. Rice Market Faces Larger Supplies and Lower Prices in 2018/19; Global Trade Projected Another Record High
 U.S. Rice Market Faces Larger Supplies and Lower Prices in 218/19; Global Trade Projected Another Record High 218 Rice Outlook Conference December 5-7, 218 Nathan Childs Economic Research Service USDA
Wednesday July 11, 2012 World Ag Supply & Demand Report
 World Ag Supply & Demand Report U.S. 2011/12 Old Crop Corn is neutral Global Old Crop Corn is neutral USDA estimates the 2011/12 U.S. corn carryout at 903 million bushels, up from 851 million bushels from
CORN: BETTER DEMAND, PRODUCTION CONCERNS
 CORN: BETTER DEMAND, PRODUCTION CONCERNS April 2000 Darrel Good Summary The USDA s March Grain Stocks report, released on March 31, confirmed a high rate of domestic corn use during the second quarter
August 1, 2016 July 31, 2017
 August 1, 2016 July 31, 2017 COTTON No.2 DELIVERER S & RECEIVER S GUIDE Page 1 of 27 TABLE OF CONTENTS Forward 3 Explanation Of Terms 4-11 Licensed Cotton No. 2 Warehouses and Tariffs (updated on August
Cotton and Wool Outlook
 Cotton and Wool Outlook CWS-12a Mar. 12, 2012 Leslie Meyer lmeyer@ers.usda.gov Stephen MacDonald stephenm@ers.usda.gov James Kiawu jkiawu@ers.usda.gov U.S. Net Textile and Apparel Imports Decline in 2011
Volume XXXVI Issue 12, June 14, 2013
 Pest Cast The Row Crops IPM Newsletter for the LRGV, a cooperative project of Texas AgriLife Extension Service and the Cotton & Grain Producers of the lower Rio Grande Valley Danielle Sekula IPM Extension
SOYBEANS: DECLINING EXPORTS, LARGE STOCKS
 SOYBEANS: DECLINING EXPORTS, LARGE STOCKS JANUARY 2006 Darrel Good 2006 NO. 2 Summary At 3.086 billion bushels, the 2005 U.S. soybean crop was 43 million larger than the November forecast and only 38 million
Cotton Pricing Guide. Julia Marsh and David Kenyon
 Cotton Pricing Guide Julia Marsh and David Kenyon Other 32% Texas 5% U.S. (Except Texas) 15% Brazil 4% Turkey 4% China 23% Pakistan 9% India 1% Former Sovet Union 7% Julia Marsh was Undergraduate Student
SOYBEANS: LOW PRICES TO PERSIST
 SOYBEANS: LOW PRICES TO PERSIST JANUARY 2002 Darrel Good 2002 - NO. 2 Summary Soybean prices received some support from the USDA s January 11 final U.S. production estimate for the 2001 crop. At 2.891
Grain Stocks. Corn Stocks Up 32 Percent from September 2016 Soybean Stocks Up 53 Percent All Wheat Stocks Down 11 Percent
 Grain Stocks ISSN: 949-095 Released September 9, 07, by the National Agricultural Statistics Service (NASS), Agricultural Statistics Board, United s Department of Agriculture (USDA). Corn Stocks Up 3 Percent
Morning Comments
 Position Management: The table shows how the Model Farm is positioned at this time. Individual recommendations may vary. 2010 Crop 2011 Crop 2012 Crop Corn 90% sold with basis set 50% sold HTA 30% sold
Daily Cotton Quality Summary For Cotton Classed on Friday, April 27, 2018
 Cotton and Tobacco Program 3275 Appling Road, Memphis, TN 38133 Daily Cotton Quality Summary For Cotton Classed on Friday, April 27, 2018 (901) 384-3016 Volume 13, No. 260 30-Apr-18 Upland Classing Office
Daily Cotton Quality Summary For Cotton Classed on Friday, April 20, 2018
 Cotton and Tobacco Program 3275 Appling Road, Memphis, TN 38133 Daily Cotton Quality Summary For Cotton Classed on Friday, April 20, 2018 (901) 384-3016 Volume 13, No. 255 23-Apr-18 Upland Classing Office
Trends in U.S. Tobacco Farming
 United States Department of Agriculture TBS-257-02 November 2004 Electronic Outlook Report from the Economic Research Service Trends in U.S. Tobacco Farming www.ers.usda.gov Tom Capehart Abstract Tobacco
Morning Comments
 Next USDA Reports: Tomorrow, Friday April 8, 2011 WASDE & Crop Production Position Management: The table shows how the Model Farm is positioned at this time. Individual recommendations may vary. 2010 Crop
U.S Department of Agriculture. Agricultural Outlook Forum February 22 & 23, 2001 NEW DEVELOPMENTS IN FOREIGN COTTON PRODUCTION AND CONSUMPTION
 U.S Department of Agriculture Agricultural Outlook Forum 2001 February 22 & 23, 2001 NEW DEVELOPMENTS IN FOREIGN COTTON PRODUCTION AND CONSUMPTION Terry Townsend Executive Director International Cotton
Agricultural Outlook Forum 2003 Presented: Friday, February 21, 2003 THE UNITED STATES AND WORLD COTTON OUTLOOK
 Agricultural Outlook Forum 23 Presented: Friday, February 21, 23 THE UNITED STATES AND WORLD COTTON OUTLOOK Stephen MacDonald, James Johnson, Leslie Meyer, and Carol Skelly U.S. Department of Agriculture
P l a i n s P e s t M a n a g e m e n t N e w s
 P l a i n s P e s t M a n a g e m e n t N e w s A u g u s t 3, 2 0 1 8 General Status Still desperately dry with more and more cotton fields reaching an early absolute cut-out daily. Some areas in the
Grain Stocks. Corn Stocks Up Slightly from September 2015 Soybean Stocks Up 3 Percent All Wheat Stocks Up 21 Percent
 Grain Stocks ISSN: 949-095 Released September 30, 06, by the National Agricultural Statistics Service (NASS), Agricultural Statistics Board, United s Department of Agriculture (USDA). Corn Stocks Up Slightly
Grain Stocks. Corn Stocks Down 7 Percent from September 2017 Soybean Stocks Up 45 Percent All Wheat Stocks Up 5 Percent
 Grain Stocks ISSN: 949-095 Released September 8, 08, by the National Agricultural Statistics Service (NASS), Agricultural Statistics Board, United s Department of Agriculture (USDA). Corn Stocks Down 7
U.S. Rice Growers Face Higher Prices and Tighter Supplies in 2017/18
 U.S. Rice Growers Face Higher Prices and Tighter Supplies in 217/18 217 Rice Outlook Conference December 12, 217 Nathan Childs Economic Research Service USDA Approved by the World Agricultural Outlook
World Cotton Yields Are Rising Slowly 1 By M. Rafiq Chaudhry, Head, Technical Information Section
 INTERNATIONAL COTTON ADVISORY COMMITTEE 1629 K STREET NW, SUITE 702, WASHINGTON, DC 20006 USA Telephone (20) 463-6660 Telex 408272789 Fax (202) 463-6950 Internet: Secretariat@ICAC.Org World Cotton Yields
Global and U.S. Rice Markets Face Tighter Supplies in 2015/16
 Global and U.S. Rice Markets Face Tighter Supplies in 2015/16 University of Arkansas Webinar Series November 19, 2015 Nathan Childs, Economic Research Service, USDA 11.20.15 PART 1 THE 2015/16 GLOBAL RICE
Evaluation of Cotton Yield, Quality, and Growth Response to Soil-Applied Potassium
 Evaluation of Cotton Yield, Quality, and Growth Response to Soil-Applied Potassium An Extension Cotton Specialist Project Katie L. Lewis G.D. Morgan, R. Boman, D. Delaney, D. Dodds, K. Edmisten, H. Frame,
Morning Comments
 Position Management: The table shows how the Model Farm is positioned at this time. Individual recommendations may vary. 2010 Crop 2011 Crop 2012 Crop Corn 100% sold with basis set 50% sold HTA 30% sold
In 2000 Proceedings Beltwide Cotton Conferences, January 4-8, San Antonio, Texas, pp
 In 2000 Proceedings Beltwide Cotton Conferences, January 4-8, San Antonio, Texas, pp. 76-79 VALUE OF BT AND HERBICIDE-RESISTANT COTTONS Janet E. Carpenter and Leonard P. Gianessi National Center for Food
CORN: PRODUCTION EXCEEDS EXPECTATIONS
 CORN: PRODUCTION EXCEEDS EXPECTATIONS OCTOBER 2001 Darrel Good 2001 NO. 7 Summary The USDA's October Crop Production report forecast the 2001 U.S. corn crop at 9.43 billion bushels. The crop is about 540
Acreage. Cr Pr 2-5 (6-03)
") Washington, D.C. Released June, 00, by the National Agricultural Statistics Service (NASS),, U.S. Department of Agriculture. For information on call (0) 0-, office hours :00 a.m. to 4: p.m. ET. Corn Planted
Washington, D.C. Released June, 00, by the National Agricultural Statistics Service (NASS),, U.S. Department of Agriculture. For information on call (0) 0-, office hours :00 a.m. to 4: p.m. ET. Corn Planted
Agricultural Outlook Forum 2013 Presented Friday, February 22, 2013 THE WORLD AND UNITED STATES COTTON OUTLOOK
 Agricultural Outlook Forum 2013 Presented Friday, February 22, 2013 THE WORLD AND UNITED STATES COTTON OUTLOOK James Johnson, James Kiawu, Stephen MacDonald, Leslie Meyer, and Carol Skelly U.S. Department
Agricultural Outlook Forum 99 For Release: Tuesday, February 23, 1999 USDA PERSPECTIVE ON THE OUTLOOK FOR COTTON
 Agricultural Outlook Forum 99 For Release: Tuesday, February 23, 1999 USDA PERSPECTIVE ON THE OUTLOOK FOR COTTON Pete Burr, Stephen MacDonald, Leslie Meyer, and Carol Skelly Agricultural Economists, USDA
Crop / Weather Update
 Crop / Weather Update Corn Crop Condition Percent of Acreage Rated Good or Excellent 85 80 75 70 65 60 55 50 45 The USDA s weekly Crop Progress report rated the U.S. corn crop as of September 30 as being
Cotton Division Mission. Organizational Structure. Overview of the USDA Cotton Classification Program. Mission & Function Areas of the Cotton Division
 Overview of the USDA Classification Program Division Mission To promote the efficient marketing of U.S. cotton, domestically and internationally, by providing unbiased classification, standardization,
Fresh Deciduous Fruit: World Markets and Trade (Apples, Grapes, & Pears)
") United States Department of Agriculture Foreign Agricultural Service June 2016 Fresh Deciduous Fruit: World Markets and Trade (Apples, Grapes, & Pears) FRESH APPLES World apple production in marketing
United States Department of Agriculture Foreign Agricultural Service June 2016 Fresh Deciduous Fruit: World Markets and Trade (Apples, Grapes, & Pears) FRESH APPLES World apple production in marketing
South Carolina Peanut Growers Meeting
 South Carolina Peanut Growers Meeting Santee, SC January 28, 2016 Nathan Smith, Ph.D. Extension Economist Row Crops Market Situation 2015 U.S. yields overall were strong and thus production out-pacing
EASTERN CORN BELT DELAYS CONTINUE, MORE FARM PROGRAM DETAILS
 May 31, 22 Ames, Iowa Econ. Info. 1839 EASTERN CORN BELT DELAYS CONTINUE, MORE FARM PROGRAM DETAILS Corn prices in the next two weeks will continue to be moderately sensitive to weather and planting progress
The World Cotton Situation * Terry Townsend, Executive Director Armelle Gruere, Statistician. Projections to 2020
 INTERNATIONAL COTTON ADVISORY COMMITTEE 1629 K Street NW, Suite 72, Washington, DC 26 USA Telephone (22) 463-666 Fax (22) 463-695 e-mail secretariat@icac.org The World Cotton Situation * Terry Townsend,
April 9, Dear Subscriber: We will be adding material to this shell letter after todays reports are released at 11:00 a.m.
 April 9, 2015 Dear Subscriber: We will be adding material to this shell letter after todays reports are released at 11:00 a.m. Be sure to click back on the link often for the latest information. While
Winter Wheat Seedings
 Winter Wheat Seedings ISSN: 1949-1980 Released January 11, 2013, by the National Agricultural Statistics Service (NASS), Agricultural Statistics Board, United States Department of Agriculture (USDA). Planted
WORLD COTTON OUTLOOK * Terry Townsend Statistician
 INTERNATIONAL COTTON ADVISORY COMMITTEE 1629 K Street NW, Suite 72, Washington, DC 26 USA Telephone (22) 463-666 Telex 48272789 Fax (22) 463-695 e-mail secretariat@icac.org WORLD COTTON OUTLOOK * Terry
Weekly Weather and Crop Bulletin
 Washington, D.C. Weekly Weather and Crop Bulletin Released August,, by the National Agricultural Statistics Service (NASS),, U.S. Department of Agriculture. For information on call Julie Schmidt at ()
Winter Wheat Seedings
 Washington, D.C. Winter Wheat Seedings Released January 12, 2007, by the National Agricultural Statistics Service (NASS),, U.S. Department of Agriculture. For information on Winter Wheat Seedings call