San Diego County Water Authority Final 2015 Urban Water Management Plan
|
|
|
- Theodora Stevenson
- 6 years ago
- Views:
Transcription
1 San Diego County Water Authority Final 2015 Urban Water Management Plan Prepared by: SAN DIEGO COUNTY WATER AUTHORITY Water Resources Department 4677 Overland Avenue San Diego, CA June 2016
2 Final 2015 Urban Water Management Plan Prepared by: San Diego County Water Authority Water Resources Department With assistance provided by the following departments: Colorado River Program Finance General Counsel General Manager s Office MWD Program Operations and Maintenance Public Outreach and Conservation June 2016 San Diego County Water Authority 4677 Overland Avenue San Diego, CA
3 TABLE OF CONTENTS Section Page Section 1 Introduction California Urban Water Management Planning Act Senate Bill 7 of the Seventh Extraordinary Session of Senate Bills 610 and Water Authority s 2015 Plan Preparation and Implementation History and Description of the Water Authority History Service Area Member Agencies Water Authority Physical Water Delivery System Aqueduct System Storage Facilities Water Treatment Capital Improvement Program Renewable Energy Resources Service Area Characteristics Regional Economy and Demographics Climate Climate Change Research Efforts and Greenhouse Gas Mitigation Population Section 2 Water Demands Municipal and Industrial Water Demand Residential Demand Commercial and Industrial Demand Agricultural Water Demand Total Current and Historic Water Use Projected Water Demands Projected Normal Water Demands Projected Future Conservation Savings Projected Dry-Year Water Demands Projected Climate Change Impact on Water Demands Member Agency Demand on the Water Authority Section 3 Demand Management Introduction Water-Use Efficiency Achievements Grant Funding Water Authority Staffing Regional WaterSmart Turf Replacement Program SoCal Water$mart Residential Program SoCal Water$mart Commercial, Industrial, and Institutional Program Public Agency Landscape Program Final 2015 Urban Water Management Plan i June 2016
4 San Diego County Water Authority Table of Contents Section Page Fitness Center Program Water Savings Incentive Program On-Site Recycled Water Conversions Audits and Surveys Water and Energy Efficiency Programs WaterSmart Customer Education and Workforce Training WaterSmart Tools and Resources Public Outreach Conclusion Section 4 San Diego County Water Authority Supplies Introduction Water Authority IID Water Conservation and Transfer Agreement Implementation Status Expected Supply Transportation Cost/Financing Written Contracts or Other Proof Existing and Future Supplies All-American Canal and Coachella Canal Lining Projects Implementation Status Expected Supply Transportation Cost/Financing Written Contracts or Other Proof Future Supplies Metropolitan Water District of Southern California Carlsbad Desalination Plant Transportation Cost/Financing Written Contracts or Other Proof Future Supplies Other Water Authority Seawater Desalination Efforts Potential MCB Camp Pendleton Seawater Desalination Project Rosarito Beach Binational Desalination Plant Feasibility Evaluation and Preliminary Design Water Authority Dry-Year Supplies Section 5 Member Agency Supplies Introduction Surface Water Description Issues Projected Surface Water Supplies Final 2015 Urban Water Management Plan ii June 2016
5 San Diego County Water Authority Table of Contents Section Page 5.3 Groundwater Description Issues Projected Groundwater Supply Yield Water Recycling Description Wastewater Generation, Collection, Treatment, and Disposal Encouraging Recycled Water Development Projected Recycled Water Use Potable Reuse Background and Description Water Authority Activities in Support of Potable Reuse Projected Supply through Potable Reuse Member Agency Seawater Desalination Carlsbad Desalination Plant Rosarito Beach Desalination Project, Otay Water District Section 6 Metropolitan Water District of Southern California Description Metropolitan Act Section 135 Preferential Right to Water Metropolitan s Water Supplies Colorado River State Water Project Storage Management Programs Section 7 Water Quality Background on Key Water Quality Constituents Salinity Nutrients Total Organic Carbon and Bromide Arsenic Uranium Chromium Perchlorate Constituents of Emerging Concern Iron and Manganese Colorado River Salinity Perchlorate Uranium Nutrients Arsenic Chromium State Water Project Total Organic Carbon and Bromide Final 2015 Urban Water Management Plan iii June 2016
6 San Diego County Water Authority Table of Contents Section Page Nutrients Salinity Arsenic Local Surface Water Reservoirs Groundwater Salinity and Nitrate Iron and Manganese Recycled Water Seawater Desalination Potable Reuse Section 8 Integrated Regional Water Management Planning Section 9 Water Supply Reliability Development of Projected Water Resources Mix Normal Water Year Assessment Dry Water Year Assessment Reliability of Supply Additional Planned Supply Projects Section 10 Scenario Planning Managing an Uncertain Future Traditional Scenario Planning Process Definition of the Focal Issue or Central Question Identify Projected Water Resource Mix Critical Uncertainties Associated with Implementation of Projected Resource Mix Scenario Analysis Future Potential Scenarios Based on Critical Uncertainties Strategies to Strengthen Implementation of Resource Mix and Manage Uncertainty Scenarios Key Tracking Metrics Track Progress on Implementation of Projected Resource Mix and Need for Adaptive Strategies Conclusion Primary Source Documents Section 11 Shortage Contingency Analysis Catastrophic Water Shortage Integrated Contingency Plan Water Authority s Emergency Storage Project Water Shortage and Drought Response Planning Water Shortage and Drought Response Plan Model Drought Response Conservation Ordinance Drought Response and Shortage Management Actions Final 2015 Urban Water Management Plan iv June 2016
7 San Diego County Water Authority Table of Contents Section Page Water Authority Dry-Year Supplies and Carryover Storage Penalties for Excessive Water Use Revenue Impacts Minimum Water Supply Available over Next Three Years Summary LIST OF APPENDICES A B C D E F G H I J K L California Water Code Changes and SBX7-7 Water Authority 2015 UWMP Implementation Documents DWR 2015 Urban Water Management Plan Checklist Regional Water Planning and Reporting (BMPs) Documentation of Water Authority Supplies Member Agency Local Supply Projections Water Shortage and Drought Response Plan & Implementing Resolution Model Drought Ordinance Water Authority Demands Provided by Metropolitan Distribution System Water Losses Water Authority s Energy Intensity Calculations DWR s Standardized Tables LIST OF FIGURES Figure Page Figure 1-1 Water Authority Service Area and Member Agencies Figure 1-2 Lindbergh Field Annual Rainfall Water Years Figure 1-3 Average Monthly Variables Average Monthly Rainfall, Temperature and Evapotranspiration (Lindbergh Field, CIMIS Station #184) Figure 2-1 Estimated Type of Water Use Fiscal Year Figure 2-2 Regional Historic and Projected Normal Water Demands (AF) Figure 2-3 Climate Change Modeling Results and Ideal Climate Scenarios Figure 5-1 Major San Diego County Reservoirs Figure 5-2 Alluvial Groundwater Basins Figure 5-3 Wastewater Treatment and Water Recycling Facilities Figure 6-1 Metropolitan Service Area Figure 6-2 Major Water Conveyance Facilities Serving San Diego County Figure 7-1 Recycled Water Facility Average TDS (mg/l) Figure 8-1 San Diego IRWM Planning Region Figure 8-2 San Diego IRWM Grant Projects Figure 8-3 Examples of IRWM Projects Final 2015 Urban Water Management Plan v June 2016
8 San Diego County Water Authority Table of Contents LIST OF FIGURES (Cont'd.) Figure Page Figure 10-1 Normal Year (2035) Figure 10-2 Scenario 1 Drought (2035) Figure 10-3 Scenario 2 Dought with Further limits on Metropolitan Supplies (2035) Figure 10-4 Scenario 3 Drought with Limited Metropolitan & Member Agency Local Supplies LIST OF TABLES Table Page Table 1-1. Water Authority Pipelines Table 1-2. Water Authority Pump Stations Table 1-3. In-Region Treatment Plant Capacity Table 1-4. Water Authority Service Area Population Forecast ( ) Table 2-1. Historic Water Demand within Water Authority Service Area ( ) Table 2-2. Total Regional Baseline Demand Forecast (Excludes Future Conservation) (AF) Table 2-3. Projected Future Conservation Savings (AF) Table 2-4. Normal Year Regional Water Demand Forecast Adjusted for Water Conservation (AF) Table 2-5. Member Agency Compliance with SBX7-7 Demand Targets (AF) Table 2-6. Single Dry-Year Regional Water Demand Forecast Adjusted for Water Conservation (AG) Table 2-7. Multiple Dry-Year Water Demand Forecast Including Future Conservation Savings (AF) Table 2-8. Member Agency Normal Year Demand on the Water Authority (AF) Table 3-1. Grant Funded Programs Table 3-2. Water-Efficient Devices Available through the SoCal Water$mart CII Program Table 3-3. Water Authority Sponsored Landmark Water-Use Efficiency Laws Table 4-1. Existing and Projected Water Authority IID Transfer Supplies (Normal Year AF/YR) Table 4-2. Projected Supply from Canal Lining Projects (Normal Year AF/YR) Table 4-3. Projected Supply from Carlsbad Desalination Plant (Normal Year AF/YR) Table 5-1. Major San Diego County Reservoirs Table 5-2. Projected Surface Water Supply (Normal Year AF/YR) Table 5-3. Projected Groundwater Supply (Normal Year AF/YR) Table 5-4. Programs to Encourage Recycled Water Use Table Recycled Water Grant Sources Final 2015 Urban Water Management Plan vi June 2016
9 San Diego County Water Authority Table of Contents Table 5-5. Projected Recycled Water Use (Normal Year AF/YR) Table 5-6. Projected Potable Reuse Water Use (Normal Year AF/YR) Table 8-1. San Diego IRWM Implementation Grants (as of April 2016) Table 9-1. Normal Water Year Supply and Demand Assessment (AF/YR) Table 9-2. Single Dry Water Year Supply and Demand Assessment Five Year Increments (AF/YR) Table 9-3. Multiple Dry Water Year Supply and Demand Assessment Five-Year Increments (AF/YR) Table 9-4. Multiple Dry Water Year Supply and Demand Assessment Five-Year Increments (AF/YR) Table 9-5. Multiple Dry Water Year Supply and Demand Assessment Five-Year Increments (AF/YR) Table 9-6. Multiple Dry Water Year Supply and Demand Assessment Five-Year Increments (AF/YR) Table 9-7. Multiple Dry Water Year Supply and Demand Assessment Five-Year Increments (AF/YR) Table 9-8. Supply Scenario with Additional Planned Projects (Normal Year AF/YR) Table Critical Uncertainties Associated with Implementation of Projected Resource Mix Table Future Potential Scenarios Based on Critical Uncertainties Table Potential Common Strategies to Strengthen Implementation of Projected Resource Mix and Manage Uncertainty Scenarios Table Potential Strategies to Manage Uncertainty Scenarios (2035) Table Tracking Progress on Implementation of Resource Mix Table Drought Response Matrix Firm Demands Table Correlation between WSDRP Stages and Model Drought Ordinance Levels Table State Water Project Table A Allocation Table Timeline of Important Drought and Shortage-Related Events Table Estimated Minimum Supplies without Utilization of Carryover Storage (AF) Final 2015 Urban Water Management Plan vii June 2016
10 San Diego County Water Authority Table of Contents LIST OF ACRONYMS AND ABBREVIATIONS µg/l micrograms per liter 2005 Plan Updated 2005 Urban Water Management Plan 2010 Plan Updated 2010 Urban Water Management Plan 2015 Plan 2015 Urban Water Management Plan AAC All-American Canal AB Assembly Bill Act Urban Water Management Planning Act AF acre-feet AF/YR acre-feet per year AWE Tool Alliance for Water Efficiency Water Conservation Tracking Tool AWE Alliance for Water Efficiency AWT Advanced Water Treatment AWWA American Water Works Association Banks Pumping Plant Harvey O. Banks Pumping Plant Basin Study San Diego Watershed Basin Study BCCA Bias-Corrected Constructed Analog BDCP Bay Delta Conservation Plan BiOp Biological Opinion BMP best management practices Board Board of Directors CAP Climate Action Plan Carlsbad Desalination Plant Claude Bud Lewis Carlsbad Desalination Plant CC Coachella Canals CDPH California Department of Public Health CEC constituents of emerging concern CEQA California Environmental Quality Act cfs cubic feet per second CII Commercial, Industrial, and Institutional CIMIS California Irrigation Management Information System CIP Capital Improvement Program CMIP5 Coupled Model Intercomparison Project phase 5 CRA Colorado River Aqueduct CSP Carryover Storage Project CUWCC California Urban Water Conservation Council CVP Central Valley Project CVWD Coachella Valley Water District CVWD Coachella Valley Water District D/DBP Disinfectant and Disinfection Byproducts DBP Disinfection byproduct DDW Division of Drinking Water DEH Department of Environmental Health Delta Plan Bay-Delta management plan Delta Reform Act Sacramento-San Joaquin Delta Reform Act Delta Sacramento San Joaquin River Delta DMM demand management measure Final 2015 Urban Water Management Plan viii June 2016
11 San Diego County Water Authority Table of Contents DOE DWA DWR EIR/EIS EPA ESA ESP FOA GCM GHG GPCD GSA GSP HCP ICP ID IID IRWM lb/day LWSD M&I MAIN MCB Camp Pendleton MCL MFRO mg/l MGD MOU MSCP MW MWD MWELO NCCP NDMA NSDCRRWP pci/l PHG PL Poseidon PPCP PUMA QSA QWEL RAC RCP Recycled Water Policy Resources Agency Department of Energy Desert Water Agency Department of Water Resources environmental impact report and environmental impact statement U.S. Environmental Protection Agency Endangered Species Act Emergency Storage Project Funding Opportunity Announcement General Circulation Model greenhouse gas gallons per capita per day Groundwater Sustainability Agency Groundwater Sustainability Plan Habitat Conservation Plan Integrated Contingency Plan Irrigation District Imperial Irrigation District Integrated Regional Water Management pounds per day Local Water Supply Development municipal and industrial Municipal and Industrial Needs Marine Corps Base Camp Pendleton maximum contaminant level microfiltration/reverse osmosis milligrams per liter million gallons per day Memorandum of Understanding Multi-Species Conservation Program megawatts Metropolitan Water District Model Water Efficient Landscape Ordinance Natural Community Conservation Plan nitrosodimethylamine North San Diego County Regional Recycled Water Project picocuries per liter public health goal Public Law Poseidon Water pharmaceuticals and personal care product Piloting Utility Modeling Applications Quantification Settlement Agreement Qualified Water Efficient Landscaper Regional Advisory Committee representative concentration pathway State Water Resources Control Board Recycled Water Policy California Natural Resources Agency Final 2015 Urban Water Management Plan ix June 2016
12 San Diego County Water Authority Table of Contents RF RSF RWMG San Diego Water Board SANDAG SB SCSC SDG&E SDWA SGMA SLRWRF SWA SWAT SWRCB TDS TOC Transfer Agreement TSAWR UCMR USFWS UWMP Water Authority Water Board WD WPDP WSAP WSDRP WTP WUCA radiative forcing Rate Stabilization Fund Regional Water Management Group San Diego Regional Water Quality Control Board San Diego Association of Governments Senate Bill Southern California Salinity Coalition San Diego Gas & Electric Safe Drinking Water Act Sustainable Groundwater Management Act San Luis Rey Water Reclamation Facility Source Water Assessment Smart Water Application Technologies State Water Resources Control Board total dissolved solids total organic carbon Water Authority IID Water Conservation and Transfer Agreement Transitional Special Agricultural Water Rate unregulated contaminant monitoring rule U.S. Fish and Wildlife Service Urban Water Management Plan San Diego County Water Authority Regional Water Quality Control Board Water District Water Purification Demonstration Project Water Supply Allocation Plan Water Shortage and Drought Response Plan Water Treatment Plant Water Utility Climate Alliance Final 2015 Urban Water Management Plan x June 2016
13 Section 1 Introduction The San Diego County Water Authority s (Water Authority) 2015 Urban Water Management Plan (2015 Plan) was prepared in accordance and compliance with the Urban Water Management Planning Act (Act) (Water Code Sections through 10656) and includes the conservation measures, programs and policies required by Water Code Section Urban water suppliers are required by the Act to update their Urban Water Management Plan (UWMP) and submit a complete version to the California Department of Water Resources (DWR) every five years. The plan serves as the Water Authority s long-term planning document to ensure a reliable water supply for the region. In accordance with its Administrative Code, the Water Authority prepares annual water supply reports to provide updated information on development of local and imported water supplies. New for the 2015 UWMP (also referred to in this document as 2015 Plan) are the following sections: Details on the unprecedented multi-year drought affecting California since 2012 and the state s Emergency Regulation, included in Section 11 Information on the Water Authority s distribution system water losses, included in Appendix J Voluntary reporting of energy intensity associated with the Water Authority s sources of water, included in Appendix K Standardized forms and tables (as specified by DWR) included in Appendix L The Water Authority s mission is to provide a safe and reliable supply of water to its member agencies serving the San Diego region. The 2015 Plan identifies a diverse mix of water resources projected to be developed over the next 25 years to ensure long-term water supply reliability for the region. Since adopting the Updated 2010 Urban Water Management Plan (2010 Plan), the Water Authority and its member agencies have made great strides in developing a more drought-resilient mix of water resources, thereby increasing the region s ability to manage and avoid shortage situations. In partnership with and support of its member agencies, the region has conserved an average of 72,710 acre-feet per year (AF/YR) of water over the last five years when compared to the benchmark year of demand in 1991, when the population was 27 percent less. Since the 2010 Plan, the Water Authority entered into a Water Purchase Agreement to purchase supplies from the 50 million gallons per day (MGD) Claude Bud Lewis Carlsbad Desalination Plant (Carlsbad Desalination Plant). This project is the largest seawater desalination facility in North America and came on-line in December The Carlsbad Desalination Plant provides a long-term droughtresilient water supply for the San Diego region. The San Vicente Dam raise was also completed in the last five years, providing both additional emergency storage and carryover storage for the region. The carryover storage capacity is critical to having a drought-resilient resource mix. It allows the region to store water in years when supplies are available and then utilize those supplies during times of shortage. Over the last five years, deliveries of conserved agricultural transfer water from the Imperial Valley increased by 30,000 AF/YR to 100,000 AF/YR in Deliveries of conserved transfer water will reach a maximum of 200,000 AF/YR by The Water Authority also Final 2015 Urban Water Management Plan 1-1 June 2016
14 San Diego County Water Authority Section 1. Introduction continued to take delivery of 77,700 AF/YR of conserved water from projects to line the All- American Canal and Coachella Canal (AAC and CC, respectively). In addition, the Water Authority s member agencies continue to evaluate, plan and implement local supply development, through recycled water, brackish groundwater recovery and potentially potable reuse. In the 2015 Plan, the next increment of supply to reduce reliance on imported sources and ensure drought-resilient supplies is expected to come from their efforts. 1.1 California Urban Water Management Planning Act The Act requires all urban water suppliers in the state to prepare UWMPs and update them every five years. The Water Authority utilized DWR s 2015 Urban Water Management Plans Guidebook for Urban Water Suppliers in preparation of this 2015 Plan. Major amendments made to the Act since preparation of the Water Authority s 2010 Plan include the following: Water Code Section (d) changed the deadline for water suppliers to submit their 2015 UWMPs, which are now due to DWR by July 1, Water Code Section 10631(e)(1)(J) adds distribution system water loss to the list of past, present, and projected future water uses that is to be quantified in the UWMP to the extent that records are available and over the same five-year increments described in Water Code Section 10631(a). For the 2015 UWMP, the distribution system water loss must be quantified for the most recent 12-month period available. Water Code Section 10631(e)(3)(a) requires that for all subsequent updates, the distribution system water loss must be quantified for each of the five years preceding the plan update. The distribution system water loss quantification must be reported in accordance with a worksheet approved or developed by DWR through a public process. Water Code Section 10631(e)(3)(b) requires that the water loss quantification worksheet shall be based on the water system balance methodology developed by the American Water Works Association (AWWA). Water Code Section 10631(e)(4)(a) deems that, if available and applicable to an urban water supplier, water-use projections may display and account for the water savings estimated to result from adopted codes, standards, ordinances, or transportation and land use plans identified by the urban water supplier, as applicable to the service area. Water Code Section 10631(e)(4)(b) states that, to the extent that an urban water supplier reports the information, an urban water supplier shall do both of the following: (1) provide citations of the various codes, standards, ordinances, or transportation and land use plans used in making the projections; and (2) indicate the extent that the water-use projections consider savings from codes, standards, ordinances, or transportation and land use plans. Water-use projections that do not account for these water savings shall note that fact. Water Code Section 10631(f)(1)(a) requires plans by retail water suppliers to include a narrative description that addresses the nature and extent of each water demand management measure (DMM) implemented over the past five years. The narrative must describe the water DMMs that the supplier plans to implement to achieve its water-use targets pursuant to Water Final 2015 Urban Water Management Plan 1-2 June 2016
15 San Diego County Water Authority Section 1. Introduction Code Section Water Code Section 10631(f)(1)(b) requires that the narrative must also include descriptions of the following water DMMs: water waste prevention ordinances, metering, conservation pricing, public education and outreach, programs to assess and manage distribution system real loss, water conservation program coordination and staffing support, and other DMMs that have a significant impact on water use as measured in gallons per capita per day (GPCD), including innovative measures, if implemented. Water Code Section 10631(f)(2) requires plans by wholesale water suppliers to include a narrative description of metering, public education and outreach, water conservation program coordination and staffing support, and other DMMs that have a significant impact on water use as measured in GPCD, including innovative measures, if implemented, as well as a narrative description of their distribution system asset management and wholesale supplier assistance programs. Water Code Section (a) adds the voluntary reporting in the UWMP of the estimated amount of energy used: (1) to extract or divert water supplies; (2) to convey water supplies to water treatment plants or distribution systems; (3) to treat water supplies; (4) to distribute water supplies through the distribution system; (5) for treated water supplies in comparison to the amount used for non-treated water supplies; and (6) to place water into or to withdraw water from storage; and (7) any other energy-related information the urban water supplier deems appropriate. DWR s 2015 UWMP Guidebook included a methodology for the voluntary calculation or estimation of the energy intensity of urban water systems (Water Code Section (b)). Water Code Section 10644(a)(2) requires urban water suppliers to submit plans, or amendments to plans, electronically and to include any standardized forms, tables, or displays specified by DWR. Water Code Section addresses conditions of eligibility for grants or loans from DWR. DWR will consider whether the urban water supplier has submitted an updated plan when determining eligibility for funds made available pursuant to any program administered by DWR. According to Water Code Section (2), [t]he conservation and efficient use of urban water supplies are of statewide concern; however, the planning for that use and the implementation of those plans can best be accomplished at the local level. Appendix A includes text changes made to the Act. 1.2 Senate Bill 7 of the Seventh Extraordinary Session of 2009 The California State Legislature passed Senate Bill 7 as part of the Seventh Extraordinary Session, referred to as SBX7-7, on November 10, 2009, which became effective February 3, This law was the water conservation component to the Sacramento-San Joaquin River Delta (Delta) legislation package, and seeks to achieve a 20 percent statewide reduction in urban per capita water use in California by December 31, The law requires each urban retail water supplier to develop urban water-use targets to help meet the 20 percent goal by 2020, and an interim water reduction target by Final 2015 Urban Water Management Plan 1-3 June 2016
16 San Diego County Water Authority Section 1. Introduction An urban retail water supplier may update its 2020 urban water-use target in its 2015 UWMP (Water Code Section ). Wholesale water suppliers must include in their 2015 Plans an assessment of their present and proposed future measures, programs and policies to help retail agencies achieve their water-use reduction targets (Water Code Section ). Appendix A also contains the text of SBX Senate Bills 610 and 221 Water Code Sections through and Government Code Sections , , and (commonly referred to as SB 610 and SB 221, respectively) amended state law to improve the link between information on water supply availability and certain land use decisions made by cities and counties. SB 610 requires that the water purveyor of the public water system prepare a water supply assessment to be included in the environmental documentation of certain large proposed projects. SB 221 requires affirmative written verification from the water purveyor of the public water system that sufficient water supplies are available for certain large residential subdivisions of property prior to approval of a tentative map. Section 4, San Diego County Water Authority Supplies, and Appendix E of the 2015 Plan contain documentation on the existing and planned water supplies being developed by the Water Authority. This documentation may be used by the Water Authority s member agencies in preparing the water supply assessments and written verifications required under state law. Specific documentation on member agency supplies and Metropolitan Water District (Metropolitan) supplies may be found in their respective plans. 1.4 Water Authority s 2015 Plan Preparation and Implementation To adequately demonstrate regional water supply reliability over the next 25 years, the 2015 Plan quantifies the regional mix of existing and projected local and imported supplies necessary to meet future retail demands within the Water Authority s service area. Although the 2015 Plan includes specific documentation regarding development of the Water Authority s supplies, the plans submitted by the member agencies and Metropolitan will provide details on their supplies that contribute to the diversification and reliability of supplies for the San Diego region. Reasonable consistency among the plans of Metropolitan, the Water Authority, and the Water Authority s member agencies is important to accurately identify the projected supplies available to meet regional demands. To facilitate coordination within the Water Authority s service area, the Water Authority formed an Urban Water Management Plan Working Group made up of staff from the Water Authority and its member agencies. This group provided a forum for exchanging demand and local supply information. In addition, Water Authority staff participated in Metropolitan s Regional Urban Water Management Plan member agency coordination meetings to discuss and share information pertaining to demands and supplies within their service areas. The Water Authority participated in a DWR hosted webinar on September 3, 2014, and a special workshop on November 19, 2015, to review the requirements of the Act. Final 2015 Urban Water Management Plan 1-4 June 2016
17 San Diego County Water Authority Section 1. Introduction An administrative draft of the 2015 Plan was distributed to the Water Authority s member agencies for technical review, and their comments were incorporated into the public review draft 2015 Plan prior to release. Providing member agencies with an administrative draft Plan, which included water supply projections, satisfies Water Code Section 10631(j). In accordance with the Act, the Water Authority notified the land use jurisdictions within its service area 60 days prior to a public hearing that it was preparing the 2015 Plan (Water Code Section 10635(b)). In addition, the Water Authority encouraged active involvement within its service area prior to and during preparation of the draft 2015 Plan (Water Code Section 10642). The public review draft of the 2015 Plan was distributed to the Water Authority Board of Directors and public for review and comment on April 29, The 2015 Plan was available during public review at the Water Authority s office and on the Water Authority s website at The deadline for receipt of comments on the draft 2015 Plan was June 6, A public hearing to receive comments on the draft 2015 Plan was held on May 26, Notice of the Public Hearing was published in two separate publications of the San Diego Union-Tribune, the newspaper designated by the Water Authority for publications of notices, as required by Government Code Section 6066 and Water Code Section The Water Authority reviewed all of the comments received and revised the plan accordingly. On June 23, 2016, the Board adopted the 2015 Plan. The Water Authority submitted an electronic copy of the adopted 2015 Plan to DWR by July 1, 2016 (Water Code Section 10621(d) and Water Code Section 10644(a)(2)). A copy of the adopted 2015 Plan was submitted to the California State Library, the County of San Diego, and the cities within the Water Authority s service area within 30 days of adoption (Water Code Section 10644(a)(1)). In addition, a copy of the adopted 2015 Plan is available for review at the Water Authority s office during normal business hours, and a copy of the adopted plan has been posted on the Water Authority s website at (Water Code Section 10645). A copy of the resolution adopting the 2015 Plan, along with copies of notifications, mailing lists, and other Water Authority 2015 Plan implementation documents, is provided in Appendix B. DWR prepared a checklist of items based on the Act that must be addressed in an agency s plan. This checklist allows an agency to identify where in its plan it has addressed each item. The Water Authority has completed the checklist, referencing the sections and appendices included in the 2015 Plan. The completed checklist is included in Appendix C. 1.5 History and Description of the Water Authority History The Water Authority was established pursuant to legislation adopted by the California State Legislature in 1943 to provide a supplemental supply of water as the San Diego region s civilian and military population expanded to meet wartime activities. Because of the strong military presence, the federal government arranged for supplemental supplies from the Colorado River in the 1940s. In 1947, water began to be imported from the Colorado River via a single pipeline that connected to Metropolitan s Colorado River Aqueduct (CRA) located in Riverside County. To meet the water demand for a growing population and economy, the Water Authority constructed four additional pipelines between the 1950s and early 1980s that are all connected to Metropolitan s distribution system and deliver water to San Diego County. The Water Authority is now the county s predominant source of water, supplying from 75 to 95 percent of the region s needs depending upon Final 2015 Urban Water Management Plan 1-5 June 2016

18 San Diego County Water Authority Section 1. Introduction weather conditions and yield/production from surface supplies, as well as recycled, groundwater, and desalination projects Service Area The Water Authority's boundaries extend from the border with Mexico in the south, to Orange and Riverside counties in the north, and from the Pacific Ocean to the foothills that terminate the coastal plain in the east. With a total of 951,000 acres (1,486 square miles), the Water Authority s service area encompasses the western third of San Diego County. Figure 1-1 shows the Water Authority s service area, its member agencies, and aqueducts (shown as blue lines). Figure 1-1 Water Authority Service Area and Member Agencies Member Agencies The Water Authority s 24 member agencies purchase water from the Water Authority for retail distribution within their service territories. A 36-member Board of Directors consisting of member agency representatives governs the Water Authority. The member agencies six cities, five water districts, eight municipal water districts, three irrigation districts, a public utility district, and a federal military reservation have diverse and varying water needs. In terms of land area, the City of San Diego is the largest member agency with 210,726 acres. The smallest is the City of Del Mar, with 1,159 acres. Some member agencies, such as the cities of National City and Del Mar, use water almost entirely for municipal and industrial purposes. Others, including Valley Center, Rainbow, and Yuima Municipal Water Districts (MWDs), deliver water that is used mostly for agricultural production. Final 2015 Urban Water Management Plan 1-6 June 2016
19 San Diego County Water Authority Section 1. Introduction 1.6 Water Authority Physical Water Delivery System The Water Authority was organized for the primary purpose of supplying imported water to San Diego County for wholesale distribution to its member agencies. These imported water supplies consist of water purchases from Metropolitan, core water transfers from Imperial Irrigation District (IID) and canal lining projects that are wheeled through Metropolitan s conveyance facilities, and spot water transfers that are pursued on an as-needed basis to offset reductions in supplies from Metropolitan. The largest single-year of imported water sales recorded by the Water Authority was 661,300 AF in fiscal year Since December 2015, the Water Authority has begun delivering regional supplies from the Carlsbad Desalination Plant (refer to Section 4.1). The Water Authority takes delivery of the desalinated water at the desalination plant. A 10-mile-long pipeline delivers water from the plant to the Water Authority s Second Aqueduct. The Second Aqueduct conveys desalinated water to the Water Authority s Twin Oaks Valley Water Treatment Plant (WTP), where it is mixed with existing drinking water supplies for regional distribution Aqueduct System Imported water supplies are delivered to the Water Authority member agencies through a system of large-diameter pipelines, pumping stations, and reservoirs. The pipelines that deliver supplies from Metropolitan are divided into two aqueduct alignments, both of which originate at Lake Skinner in southern Riverside County and run in a north to south direction through the Water Authority service area. Metropolitan s ownership of these pipelines extends to a delivery point six miles into San Diego County. From there, Pipelines 1 and 2 compose the First San Diego Aqueduct, which reaches from the delivery point to San Vicente Reservoir. These two pipelines share five common tunnels and operate as a single unit to provide 180 cubic feet per second (cfs) of conveyance capacity. Pipelines 3, 4, and 5 form the Second San Diego Aqueduct. These pipelines, which are located several miles to the west of the First San Diego Aqueduct, have delivery point capacities as follows: Pipeline 3 provides 280 cfs; Pipeline 4 provides 470 cfs; and Pipeline 5 provides 500 cfs. In addition to the above north south pipelines, there are several east west pipelines that extend service to multiple member agencies. A listing of the pipelines owned and operated by the Water Authority is provided in Table 1-1, with the pipeline locations shown in Figure 1-1. Final 2015 Urban Water Management Plan 1-7 June 2016
20 San Diego County Water Authority Section 1. Introduction Table 1-1. Water Authority Pipelines Pipelines Length (miles) Diameter (inches) First San Diego Aqueduct: La Mesa-Sweetwater Extension Pipeline 1 and Pipeline Moreno-Lakeside Pipeline Second San Diego Aqueduct: Tri-Agencies Branch Pipeline Ramona Pipeline Carlsbad Desal Conveyance Pipeline Crossover Pipeline Valley Center Pipeline Pipeline Pipeline North County Distribution Pipeline Olivenhain Pipeline Pipeline San Vicente Pipeline Olivenhain-Hodges Pipeline Although most of the water conveyed through the aqueduct system is by gravity flow, the Water Authority also maintains several pumping stations that enhance the operational flexibility of the pipeline system to meet daily, seasonal, and emergency needs. The Water Authority-owned pump stations are listed in Table 1-2. Table 1-2. Water Authority Pump Stations Pump Stations Capacity (cfs) Escondido Pump Station 20 Valley Center Pump Station 41 Miramar Pump Station 1 60 Olivenhain Pump Station 314 San Vicente Pump Station 444 Olivenhain-Hodges Pumped Storage Rehabilitating pump station to establish 60cfs capacity Three of the water pump stations are for untreated water and are sized to protect the region from potential disruptions of imported water supplies. If a supply disruption occurs, the untreated water pump stations will deliver emergency water supplies from newly expanded or existing local storage reservoirs. For more information on emergency facilities and a description of the Emergency Storage Project (ESP), refer to Section At other times, except for the Miramar Pump Station, all the Water Authority owned pumping stations can be used to move water supplies into and out of storage reservoirs to meet seasonal Final 2015 Urban Water Management Plan 1-8 June 2016
21 San Diego County Water Authority Section 1. Introduction delivery needs and to augment daily supplies to the member agencies. The Miramar Pump Station is mainly used to deliver treated water via the aqueduct system from the City of San Diego s Miramar WTP to municipal service connections south of the treatment plant Storage Facilities Storage facilities are used by the Water Authority to both manage daily operations and provide reserves for seasonal, drought, and emergency storage needs. System Regulatory Storage facilities, which consist of enclosed reinforced concrete storage tanks, are available to manage the daily balance of treated and untreated water deliveries. System Regulatory Storage within the aqueduct system currently totals 56 million gallons, with the bulk of this amount in storage tanks located in Twin Oaks Valley and Mission Trail Regional Park. Water Authority seasonal, drought, and emergency storage capacity currently includes 24,300 AF of in-region surface water storage at the Olivenhain Reservoir, 152,000 AF at the San Vicente Dam, and 70,000 AF of out-of-region leased groundwater storage in the San Joaquin Valley. The groundwater storage includes 30,000 AF of storage and capacity rights acquired in June 2008 in the Semitropic Water Bank, and 40,000 AF of storage provided by the Semitropic-Rosamond Water Bank Authority that was acquired in August Refer to Section for specific information on the ESP and Carryover Storage Project (CSP) Water Treatment The Water Authority owns the 100-MGD Twin Oaks Valley WTP and has agreements with the Helix Water District (WD) securing 36 MGD of treatment capacity from the R.M. Levy WTP. Water from the Levy plant supplements treated water service to eastern San Diego County. The balance of treated water supplies comes from water treatment plants owned and operated by member agencies. A list of all in-region water treatment plants is shown in Table 1-3. In 2012, the Water Authority entered into a formal Water Purchase Agreement with Poseidon Water detailing commercial and financial terms for the purchase of desalinated ocean water produced at the Carlsbad Desalination Plant and delivered to the Water Authority s regional aqueduct system. The Carlsbad Desalination Plant became operational in 2015 and provides, on average, about 50 MGD of high-quality drinking water Capital Improvement Program The Water Authority s Capital Improvement Program (CIP) can trace its beginnings to a report approved by the Board in 1989 entitled The Water Distribution Plan, a Capital Improvement Program through the Year The Water Distribution Plan included 10 projects designed to increase the capacity of the aqueduct system, increase the yield from existing water treatment plants, obtain additional supplies from Metropolitan, and increase the reliability and flexibility of the aqueduct system. Since that time, the Water Authority has made numerous additions to the list of projects included in its CIP as the region s infrastructure needs and water supply outlook have changed. Final 2015 Urban Water Management Plan 1-9 June 2016
22 San Diego County Water Authority Section 1. Introduction Table 1-3. In-Region Treatment Plant Capacity Member Agency Water Treatment Plant Capacity (MGD) Escondido, City of/vista ID Escondido/Vista 90 Helix WD Levy 106 Olivenhain MWD Olivenhain 34 Oceanside, City of Weese 25 Poway, City of Berglund 24 Ramona MWD Barger 5 San Diego, City of Alvarado 120 San Diego, City of Miramar 144 San Diego, City of Lower Otay 34 San Diego County Water Authority Twin Oaks Valley 100 San Dieguito WD/Santa Fe ID Badger 40 Sweetwater Authority Perdue 30 Total In-Region Treatment Plant Capacity 752 ID = Irrigation District; MWD = Municipal Water District; PUD = Public Utility District; WD = Water District The current list of projects included in the CIP is based on the results of planning studies, including the 2010 UWMP and the 2013 Regional Water Facilities Optimization and Master Plan Update. These CIP projects, which are most recently described in the Water Authority s Adopted Multi-Year Budget, Fiscal Years 2016 and 2017, include 39 projects valued at $2.75 billion. These 39 CIP projects are designed to meet projected water supply and delivery needs of the member agencies through The projects include a mix of new facilities that will add capacity to existing conveyance, storage, and treatment facilities, as well as repair and replace aging infrastructure, and can be grouped into the following categories: Asset Management The Water Authority s emphasis has transitioned from a large-scale capital intensive program to an operations-based organization with a focus on effective asset management. The primary components of asset management projects include relining and replacing existing pipelines and infrastructure rehabilitation. Mitigation Program The Mitigation Program was established by the Board in September 1992 to provide coordinated permitting and mitigation for environmental impacts resulting from the construction, operation, and maintenance of CIP projects. Approved Master Plan Update Projects Near-term projects identified in the Master Plan Update, and added to the CIP, address untreated water capacity constraints and operational flexibility, build-out of the final ESP phase (including the ESP North County Pump Station and upgrades at San Vicente Pump Station), add system isolation valves for more efficient operation of the aqueduct system, and provide for a structural assessment of existing infrastructure. North County Projects Improvements to both the First Aqueduct and Second Aqueduct in north San Diego County are required to complete delivery capabilities related to the ESP and maximize production of the Twin Oaks Valley WTP. The projects include the ESP North County Pump Station (planning phase) and Valley Center Pump Station expansion (on-line). Final 2015 Urban Water Management Plan 1-10 June 2016
23 San Diego County Water Authority Section 1. Introduction The CIP will be revised following completion of the 2015 Plan as part of the fiscal years 2018 and 2019 Water Authority budget setting process Renewable Energy Resources The Water Authority has long supported efforts to develop renewable energy resources that are compatible with water operations. This has included investments to improve operational effectiveness, reduce greenhouse gases (GHGs), and reduce Water Authority and member agency energy costs, in turn helping to stabilize the cost of water. The Water Authority has adopted an Energy Management Policy, which is intended to provide direction in the implementation and administration of energy efficiency projects and programs. In addition, the Energy Management Policy addresses the consideration of cost-effective energy generation at the Water Authority s existing and planned facilities. In 2014, the Water Authority became one of the first water agencies in California to voluntarily adopt a Climate Action Plan (CAP) to address carbon footprint and GHG. The goal of the CAP is to minimize Water Authority GHG emissions through the implementation of GHG reduction measures focused on energy efficiency and opportunities to develop renewable energy. Hydroelectric Facilities The Water Authority s in-line conduit hydroelectric facility at Rancho Peñasquitos is able to generate electricity from the available elevation gradient in the aqueduct system to produce an environmentally friendly, clean and sustainable energy supply. The Rancho Peñasquitos facility, with a rated output of 4.5 megawatts (MW), has been in continuous operation since 2006 and typically generates enough power to meet the needs of nearly 5,000 county households. The Water Authority s Lake Hodges facility provides the region with 40 MW of energy storage, making this power supply available to meet peak demands during high energy use periods. These facilities generate additional revenues that help offset the cost of imported water supplies. Solar Facilities Solar generating facilities were constructed in 2011 at three Water Authority facilities The Kearny Mesa Headquarters, Escondido satellite office, and Twins Oaks Valley WTP. Together, these locations produce approximately 2,900 megawatt hours of renewable energy annually. 1.7 Service Area Characteristics The Water Authority s service area characteristics have undergone significant changes over the last several decades. Driven by an average annual population increase of 50,000 people per year, large swaths of rural land were shifted to urban uses to accommodate the growth in population. This shift in land use has resulted in the region s prominent urban and suburban character. San Diego County also has a rich history of agriculture, beginning with the large cattle ranches established in the 18th century and continuing through the diverse range of crops and products grown today. Although the total number of agricultural acres under production has declined, the region maintains a significant number of high value crops, such as cut-flowers, ornamental trees and shrubs, nursery plants, avocados, and citrus. Based on the 2014 Crop Statistics and Annual Report published by the San Diego County Department of Agricultural Weights and Measures, the region has 5,732 farms more than any other county in the nation. San Diego County agriculture is a $1.85 billion per year Final 2015 Urban Water Management Plan 1-11 June 2016
24 San Diego County Water Authority Section 1. Introduction industry, ranking it as the 20th largest agricultural economy in the nation. It ranks among the top five counties, statewide, for production of nursery products, oranges, chickens, flowers and foliage, fresh-market tomatoes, lemons, avocados, eggs, mushrooms, and grapefruit Regional Economy and Demographics The San Diego region s economy, as shown by the indicators referenced below, has improved considerably the past few years as interest rates have remained low and the national economy continues to perform well. Coming out of the depths of a sharp national recession due to a housingfinance bubble and wars in Iraq and Afghanistan, San Diego has since experienced strong growth in health care, education, construction and retail over the past few years. Defense and education spending have contributed to a broad recovery. Housing prices have continued to recover as unemployment has dropped and economic output has increased. The University of San Diego Index of Leading Economic Indicators, the San Diego region s broadest measure of economic activity, continues to reflect strong economic conditions, up 30 to 35 percent at the beginning of 2015 compared with the last cyclical low point in early According to data from the U.S. Bureau of Labor Statistics, the San Diego region ranked eighth in the nation among the largest 342 U.S. counties for jobs growth in the year ended September 2015 (the federal government fiscal year), adding 38,700 jobs for a total of million. The San Diego-Carlsbad Metropolitan Statistical Area has seen regional personal income and per capita incomes increase 25 percent and 17 percent, respectively, to $168 billion and $51,460, in the five years ended in 2014, according to the U.S. Bureau of Economic Analysis. Over that time, the region added another 200,000 residents. As of January 2016, the Case-Shiller Index of Home Prices for the San Diego area, for changes in composite prices over the previous five years, has remained in positive territory since mid-2012, posting steady single-digit increases every month since mid The San Diego region s job market continues to tighten, with the unemployment rate decreasing to 4.7 percent in early 2016, lower than both the state and federal unemployment rates and almost a percentage-point better than the year before. Over the 12 months ended in February 2016, the region has posted strong gains in almost all sectors of the economy, most notably construction, business services, health care, hospitality, and manufacturing. San Diego s economy is, today, more diversified than ever. Key transportation links have been added to its urban transportation system, including expansion of its regional airport, Lindbergh Field. Three major campuses in the University of California and California State University system serve as a springboard for urban development and biotech sector jobs growth. Meanwhile, San Diego s linchpin industry, defense, has maintained a large presence in the region with fully operational bases at Marine Corps Air Station Miramar, Naval Air Station North Island, Naval Base San Diego, and Marine Corps Base Camp Pendleton (MCB Camp Pendleton) Climate Climatic conditions within the county area are characteristically Mediterranean along the coast, with mild temperatures year-round. Inland area weather patterns are more extreme, with summer temperatures often exceeding 90 degrees Fahrenheit and winter temperatures occasionally dipping Final 2015 Urban Water Management Plan 1-12 June 2016
25 San Diego County Water Authority Section 1. Introduction below freezing. Average annual rainfall is approximately 10 inches per year on the coast and in excess of 33 inches per year in the inland mountains. More than 80 percent of the region s rainfall occurs between December and March. Variations in weather patterns affect regional short-term water requirements, causing reductions in water use during wet cycles and demand spikes during hot, dry periods. However, since a regional drought began gripping the American Southwest in 2002, only five water years (year ending September 30) have experienced above-average rainfall locally: 2003, 2005, 2010, 2011 and 2015 (Figure 1-2). Temperatures have also been above average for the past few years, with new recordwarm years attained in 2014 and 2015 for the coastal region of Southern California, which includes the Water Authority service area, according to the California Climate Tracker. While water use typically has increased in accordance with the prevailing warmer, drier weather patterns, recent patterns show a divergence from the past, as drought restrictions statewide contributed to a yearover-year decrease in fiscal year 2015 and are likely to contribute to an expected decrease in use in the current fiscal year Figure 1-2 Lindbergh Field Annual Rainfall Water Years Rainfall (inches) Annual average over period: inches Source: Western Regional Climate Center. Water Year Average monthly rainfall, temperatures and evapotranspiration for Lindbergh Field, San Diego s municipal airport located on its harbor, is shown in Figure 1-3. The graph shows how precipitation diminishes to near-zero during the peak irrigation-demand summer months. Final 2015 Urban Water Management Plan 1-13 June 2016
26 San Diego County Water Authority Section 1. Introduction Figure 1-3 Average Monthly Variables Average Monthly Rainfall, Temperature and Evapotranspiration (Lindbergh Field, CIMIS Station #184) Monthly ET, Rainfall (Inches) Jan Feb Mar Apr May Jun Jul Aug Sep Oct Nov Dec Average Monthly Temperature (degrees Fahrenheit) Average Monthly ET (left scale) Average monthly temperature (right scale) Average monthly rainfall (left scale) Sources: California Irrigation Management Information System (CIMIS), Western Regional Climate Center Climate Change Research Efforts and Greenhouse Gas Mitigation This section provides an overview of the Water Authority s efforts regarding studies and research on climate change, as well as GHG mitigation measures. The Scenario Planning process outlined in Section 10 deals with adapting to potential supply and demand impacts due to climate change. Climate change is an increasingly important issue to water utilities and both state and federal legislators. Changes in weather patterns that deviate from historical cycles could significantly affect water supply planning. Irrespective of the debate associated with the sources and cause of increasing concentrations of GHGs, climate research has identified potential future risks to water resources. The Water Authority recognizes the importance of adapting to climate change and being a leader in sustainability and natural resource stewardship. Since 2008, the Water Authority s business plan has included a climate change and sustainability management strategy within the core Water Resources Planning Program business area. The key issues identified within this program include advocating for improvement in modeling to provide precipitation data on a local and regional scale, encouraging focused scientific research on climate change to identify the impacts on the region s water supply, and partnering with other water utilities to incorporate the impacts of Final 2015 Urban Water Management Plan 1-14 June 2016
27 San Diego County Water Authority Section 1. Introduction climate change on water supply planning and the development of decision support tools. The Water Authority recognizes the challenges that climate change poses to our region and is committed to proactively addressing the issue. San Diego County Water Authority s Activities Related to Climate Change Concerns Knowledge Sharing and Research Support The Water Authority is an active and founding member of the Water Utility Climate Alliance (WUCA). WUCA consists of 10 of the nation s largest water providers collaborating on climate change adaptation and GHG mitigation issues. As part of this effort, WUCA pursues a variety of activities on multiple fronts. WUCA monitors development of climate change-related research, technology, programs, and federal legislation. Activities to date include such things as: Letter of support for the California Nevada Applications Program branch of the Regional Integrated Science and Assessments team under the National Oceanic and Atmospheric Administration Comments provided on U.S. Global Change Research Program, National Global Change Research Plan Regular communication and consultations with federal agencies on the U.S. Environmental Protection Agency s Climate Ready Water Utility Working Group Participation in the International Water and Climate Forum, December 2015 In addition to supporting federal and regional efforts, WUCA released a white paper entitled Actionable Science in Practice: Co-producing Climate Change Information for Water Utility Vulnerability Assessments, Final Report of the Piloting Utility Modeling Applications (PUMA) Project in May The purpose of the PUMA project is to produce actionable science through close collaboration between climate experts and utility personnel to meet the needs of the four water utilities profiled in the report. WUCA utilities forged partnerships with scientific institutions to explore how to integrate climate considerations into their specific management context. A fundamental goal of this report was to draw lessons from these four distinct projects regarding best practices in the co-production of actionable science. To address water provider specific needs, WUCA focused on how best to incorporate knowledge gained from preparation of the above white paper into water planning, which was more thoroughly explored in a second white paper entitled Decision Support Planning Methods: Incorporating Climate Change Uncertainties into Water Planning. This paper assessed five known decision support tools for applicability in incorporating climate change uncertainty in water utility planning and identified additional research needs in the area of decision support methodologies. The Water Authority utilized and modified one of these decision support tools, Scenario Planning in its longrange planning process for the 2015 Plan, which was the basis of Section 10, Scenario Planning Managing an Uncertain Future. The Water Authority and the other member agencies of WUCA routinely share individual agency actions to mitigate GHG emissions to facilitate further implementation of these programs. At a December 2015 International Water and Climate Forum, WUCA members met with global climate Final 2015 Urban Water Management Plan 1-15 June 2016
28 San Diego County Water Authority Section 1. Introduction modelers, along with federal agencies, academic scientists, and climate researchers to discuss climate adaptation and mitigation strategies for water utilities, gather lessons learned, and advance proven best practices and stimulated thinking about future solutions. The Water Authority, through its membership with WUCA, continues to pursue these opportunities and partnerships with other water providers, climate scientists, state and federal agencies, research centers, academia, and key stakeholders. Ongoing Research The Water Authority has partnered on several research projects to better understand the uncertainties and impacts associated with climate change on water demand and local water resources in the San Diego region. Participating in a multi-agency project through the Water Research Foundation, the Water Authority collaborated on a study to evaluate potential demandside impacts of climate change by examining ways to model the effects of climate and weather on water use. A methodological framework was developed to prepare downscaled climate projections and identify specific climate scenarios. Through this effort, an ensemble of six case studies was developed to estimate a range of potential demand-side impacts. This methodology is described in Section and used to model regional demands under the influence of climate change. The Water Authority also partnered with the City of San Diego and U.S. Bureau of Reclamation on a San Diego Watershed Basin Study (Basin Study) to examine supply-side climate change impacts. The Basin Study is intended to examine the potential influence of climate change on local water resources in the San Diego region. Climate impacts on local surface water and groundwater were downscaled and the Variable Infiltration Capacity hydrologic model was used to obtain local streamflow values. Results from this analysis will be used in the next phase of the Basin Study to assess potential changes in structural responses and operational concepts due to potential changes in local streamflow. Implementation of Programs and Policies The Water Authority has made great strides in implementing GHG mitigation programs and policies for its facilities and operations. To date, these programs and policies have focused on the following: Adopting a CAP to address carbon footprint and GHG emissions Pursuing water supply/energy relationships and opportunities to increase efficiencies to lower GHG emissions, including the 40-MW Lake Hodges Pumped Storage project in operation and a potential 500-MW San Vicente Pumped Storage project Participating in the Climate Registry; the Water Authority developed its initial baseline GHG inventory from calendar year 2009 and refined its inventory calculation in an update conducted in Reducing the number of vehicles in the fleet and replacing vehicles with hybrids when possible Generating solar power at three Water Authority sites, including the Twin Oaks Valley WTP, the Escondido Operations Center, and the San Diego Headquarters, cumulatively generating an estimated 2.9 million kilowatt-hours each year Final 2015 Urban Water Management Plan 1-16 June 2016
29 San Diego County Water Authority Section 1. Introduction Population When the Water Authority was formed in 1944, the population within its service area was estimated at roughly 260,000 people. From approximately 3.2 million residents at the beginning of 2015, the population of San Diego County is projected to increase by an additional 698,000 by 2040, for a total county population of roughly 3.9 million. This change represents an average annual increase of about 27,900 people, or an average annual growth rate of less than one percent. Approximately 95 percent of the population of San Diego County is within the Water Authority s service area. The City of San Diego represents the largest population of all Water Authority member agencies, with about 1.3 million people in Of the Water Authority member agencies, Yuima MWD has the smallest population at approximately 1,900 people. (These regional growth projections are based on the San Diego Association of Governments [SANDAG] 2050 Regional Growth Forecast, accepted by its board for planning purposes on October 15, 2013.) Water Authority service area population projections are also based on SANDAG s 2050 Regional Growth Forecast and are presented in Table 1-4. These projections represent a subset of SANDAG s County-level population estimates, since the Water Authority s service area encompasses only the western one-third of San Diego County. Water Authority member agencies are projected to have varying future growth. Some, such as the Santa Fe Irrigation District (ID) and the City of Del Mar, are expected to experience relatively modest growth. Others, including the Otay WD and the City of San Diego, anticipate sizable increases in population. Table 1-4. Water Authority Service Area Population Forecast ( ) Year Population ,340, ,495, ,630, ,745, ,825,041 Average Annual Growth 24,222 Sources: SANDAG 2050 Regional Growth Forecast (Series 13); Fast Facts San Diego Region (SANDAG, October 2011); Demographics in the San Diego Region, (SANDAG, January 2016) Final 2015 Urban Water Management Plan 1-17 June 2016
30 San Diego County Water Authority Section 1. Introduction This page intentionally left blank. Final 2015 Urban Water Management Plan 1-18 June 2016
31 Section 2 Water Demands Demand for water in the Water Authority's service area falls into two classes of service: municipal and industrial (M&I), and agricultural demand. In fiscal year 2015, total water demand was 539,361 AF, of which 92 percent was for M&I use and 8 percent was for agricultural water use, primarily for irrigation of nurseries, groves, and crops. This section describes these use categories along with the total historic, current, and projected water demands. By 2040, total normal water demands are projected to reach 718,773 AF (including future conservation, demand associated with projected near-term annexations, and accelerated forecasted growth), which represents a 29 percent increase from the average 557,271 AF of demand that occurred over the period Municipal and Industrial Water Demand Total retail M&I demand encompasses a wide range of water uses that include residential demand (water used for human consumption in the home, domestic purposes, and outdoor residential landscaping) and water used for commercial, industrial, and institutional purposes Residential Demand Residential water consumption covers both indoor and outdoor uses. Indoor water uses include sanitation, bathing, laundry, cooking, and drinking. Most outdoor water use entails landscaping irrigation requirements. Other minor outdoor uses include car washing, surface cleaning, and similar activities. For single-family homes, outdoor demands may constitute up to 60 percent of total residential use. The estimated composition of San Diego s 2015 regional housing stock was approximately 60 percent single-family homes, 36 percent multi-family homes, and 4 percent mobile homes. Singlefamily residences generally contain larger landscaped areas and require more water for outdoor application in comparison to other types of housing. The general characteristics of multi-family and mobile homes limit outdoor landscaping and water use, although some condominium and apartment developments do contain green belt areas Commercial and Industrial Demand Commercial water demands generally consist of uses that are necessary for the operation of a business or institution, such as drinking, sanitation, and landscape irrigation. Major commercial water users include service industries, such as restaurants, car washes, laundries, hotels, and golf courses. Economic statistics developed by the San Diego Regional Chamber of Commerce indicate that almost half of San Diego's residents are employed in commercial (trade and service) industries. Industrial water consumption consists of a wide range of uses, including product processing and small-scale equipment cooling, sanitation, and air conditioning. Water-intensive industrial uses in the region, such as electronics manufacturing and aerospace manufacturing, typically require smaller amounts of water when compared to other water-intensive industries found elsewhere in Southern California, such as petroleum refineries, smelters, chemical processors, and canneries. Final 2015 Urban Water Management Plan 2-1 June 2016
32 San Diego County Water Authority Section 2. Water Demands The tourism industry in San Diego County affects water usage within the Water Authority's service area not only by the number of visitors, but also through expansion of service industries and attractions, which tend to be larger outdoor water users. Tourism is primarily concentrated in the summer months and affects seasonal demands and peaking. The SANDAG regional population forecasts do not specifically account for tourism, but tourism is reflected in the economic forecasts and affects per capita water use. 2.2 Agricultural Water Demand The moderate and virtually frost-free coastal and inland valley areas of the county are able to support a wide variety of subtropical crops, making the San Diego region a unique agricultural region. The introduction of relatively low-cost water supplies in the 1950s allowed significant growth to occur in this sector. Agricultural water use within the Water Authority's service area is now concentrated mainly in the north county, and includes member agencies such as the Rainbow MWD, Valley Center MWD, Ramona MWD, and Yuima MWD; the Fallbrook (PUD); and the City of Escondido. The primary crops grown for local, national, and international markets are avocados, citrus, cut flowers, and nursery products. Starting in calendar year 2008 through April 2011, member agency customers that were voluntarily receiving discounted agricultural water were required to implement a 30 percent cutback in agricultural demand from their fiscal year 2007 baseline. In response to supply cutbacks from Metropolitan, allocations for agricultural program participants were imposed for fiscal year 2016 at 15 percent. To comply with the mandatory supply allocations that resulted from drought conditions and judicial restrictions on State Water Project supply availability, growers implemented various actions that included tree stumping and plant stock reduction. As a result, agricultural demand dropped from 98,262 AF in fiscal year 2007 to 41,055 AF in fiscal year 2015, a 58 percent drop in program agricultural demand. 2.3 Total Current and Historic Water Use Water use in the San Diego region is closely linked to the local economy, population, and weather. Over the last several decades, a prosperous economy stimulated local development and population growth, which in turn produced a relatively steady increase in water demand. However, starting in the late-2000s, the combination of economic recession, Metropolitan supply allocations, implementation of member agency mandatory water-use restrictions, and, more recently, statemandated emergency water regulations culminated in a dramatic multi-year decrease in total water demand. In fiscal year 2007, water demand in the Water Authority s service area reached a record level of 741,893 AF, before dropping roughly 27 percent to 539,361 AF by fiscal year The 202,532 AF reduction in demand represents the largest volumetric decline over an eight-year period in the Water Authority s history. Despite record-breaking temperatures and below-average rainfall, this drop is attributable to a combination of factors, including mandatory water-use restrictions, a growing conservation ethic, greater consumer price response to the retail cost of water, the national recession, and state-mandated emergency water regulations. Table 2-1 shows the historic water demand within the Water Authority's service area. Final 2015 Urban Water Management Plan 2-2 June 2016
33 San Diego County Water Authority Section 2. Water Demands Table 2-1. Historic Water Demand within Water Authority Service Area ( ) Fiscal Year 1 Water Use (AF) , , , , , , , , , , , , , , , ,361 Source: Water Authority Annual Reports 1 The Water Authority s fiscal year begins July 1. Figure 2-1 shows the estimated relative percentages of various categories of water demand within the Water Authority s service area for fiscal year In this figure, residential demand includes single-family residential and multi-family residential. Figure 2-1 Estimated Type of Water Use Fiscal Year 2015 Agricultural 8% M&I 92% Residential 61% Commercial & Industrial 39% Final 2015 Urban Water Management Plan 2-3 June 2016
34 San Diego County Water Authority Section 2. Water Demands 2.4 Projected Water Demands Since the mid-1990s, the Water Authority has utilized an econometric model to develop its longrange M&I demand forecasts. This computer model is based on the U.S. Army Corps of Engineers Municipal and Industrial Needs (MAIN) model, which has over a quarter of a century of practical application and is used by many cities and water agencies throughout the United States. The Water Authority s version of the model, known as CWA-MAIN, was modified by a consultant to reflect the San Diego region s unique parameters. The CWA-MAIN model relates historic water demand patterns to variables, such as household income, consumer response to the price of water, and weather, to predict future M&I water demands. These datasets are compiled from various sources, including SANDAG, Water Authority member agencies, and the National Aeronautics and Space Administration. Under the terms of a 1992 Memorandum of Agreement (MOU) between the Water Authority and SANDAG, the Water Authority utilizes SANDAG s official forecast, which is based on the general plans and policies of local land use jurisdictions, to project consumptive water demands for the region. This coordination ensures linkage between local jurisdictions general plans and the Water Authority s projected water demands. In October 2013, SANDAG s Board approved the Series 13: 2050 Regional Growth Forecast for planning analysis purposes, also referred to as SANDAG Series 13 forecast. Two key refinements of the 2050 Regional Growth Forecast include integration of 2010 Census counts and an economic outlook that factors in the Great Recession. These refinements result in slower regional growth in the near term and lower water demands over the long-term planning horizon compared to SANDAG s previous forecast. Lower forecasted water demands are directly linked to SANDAG s smaller estimated growth in overall housing units with approximately 18,500 fewer units projected over the timeframe compared to the previous Series 12 forecast. Additionally, the mix of new housing units is more heavily weighted toward multi-family structures that traditionally use less water than single-family units. The demographic and economic projections contained in SANDAG s Series 13 forecast (that is, housing units, household density, household size, and employment counts) were incorporated into the CWA-MAIN model. It should be noted that SANDAG does not forecast land use on MCB Camp Pendleton. Therefore, demand projections for MCB Camp Pendleton were developed outside of the CWA-MAIN model and were based on projections provided by base staff. Agricultural demand projections were developed through a cooperative effort between Water Authority staff, Water Authority member agencies, SANDAG, County of San Diego Agricultural Weights and Measures, and the California Avocado Commission. Forecast driver variables include irrigated acreage within the Water Authority s service area, estimated crop type distribution, and calculated historic water-use factors. SANDAG s projection of agricultural land conversions to other land use categories provides the long-term trend in acreage used to forecast agricultural water use. The total agricultural forecast is then separated into two categories: (1) projected demands in the Water Authority s Transitional Special Agricultural Water Rate (TSAWR) program and (2) demands under the Water Authority M&I rate or agricultural demands met through local supplies. It should be emphasized that the delineation between these two categories is a rough estimate based on professional judgment and takes into account the potential future acreage in the TSAWR program. Final 2015 Urban Water Management Plan 2-4 June 2016
35 San Diego County Water Authority Section 2. Water Demands Projected Normal Water Demands Table 2-2 shows projected normal year total water demand for the Water Authority service area through Baseline regional demand projections exclude future additional conservation savings but reflect historic passive conservation. In addition, to fully quantify potential demands served by the Water Authority, a small increment of water use associated with known future potential annexations and accelerated forecasted growth was incorporated into the demand forecast. Beginning with the 2005 Plan, an increment of demand related to potential near-term annexations was added to the baseline M&I forecast and assumed to be fully on-line by Estimated demands for these parcels were provided to the Water Authority by the associated member agency. However, incorporation of these demands provides no assurance of annexation. Approval by the Water Authority Board is still required before water service may be provided to these lands. Table 2-2. Total Regional Baseline Demand Forecast (Excludes Future Conservation) (AF) Baseline M&I Demand 2,3 602, , , , ,433 Baseline Agricultural Demand 52,961 51,379 49,897 48,460 47,214 Near-Term Annexations 4 4,029 7,162 7,162 7,162 7,162 Accelerated Forecasted Growth 2,632 4,807 6,806 9,038 11,186 Total Baseline Demand Forecast 5 661, , , , ,995 1 Normal water year demands based on hydrology. 2 Includes approximately 11,000 AF of demand for MCB Camp Pendleton provided by base staff. 3 Reflects passive historic conservation savings. 4 Known near-term annexation demands include Safari Highlands (694 AF), Yerba Valley (5 AF), Otay Ranch Village 13 and parcels East of Village 13 (2,361 AF), Peaceful Valley Ranch (70 AF), Sycuan Reservation (392 AF), Stoddard Parcel (2 AF), San Ysidro Mt. Parcel Village 17 (148 AF), Viejas and Ewiaapaayp (2,307 AF), I-8 corridor near Viejas boundary (81 AF), Rincon (417 AF), Warner Ranch (519 AF), Shadow Run/Schoepe (15 AF), and Warner Ranch/Sycamore Ranch (151 AF). Including the demands for these parcels does not limit the Board s discretion to deny or approve these or other annexations not contemplated at this time. 5 Based on an assumed wholesale nominal (above inflation) rate increase of 2 percent per year between 2016 and 2020, 1 percent per year from 2021 to 2025, and a 3 percent rate of inflation post To provide for a more comprehensive planning analysis, the 2015 Plan includes water use associated with accelerated forecasted growth in residential housing development as part of the M&I sector demand projections. These forecasted housing units were identified by SANDAG in the course of producing its 2050 Regional Growth Forecast (Series 13) and are based on existing local jurisdictions general plans. The demand associated with accelerated forecasted growth is intended to account for a portion of SANDAG s estimated residential land use development currently projected to occur beyond the Water Authority's 2040 planning horizon, but has the potential to move forward on an accelerated schedule. SANDAG estimates that general plan amendments, allowing this accelerated residential development, could happen within the planning horizon of the 2015 Plan update. Demands associated with accelerated housing development are calculated based on efficient residential water use consistent with anticipated future levels of conservation savings described in Section Since this increment of projected demand is not broken out by member Final 2015 Urban Water Management Plan 2-5 June 2016
36 San Diego County Water Authority Section 2. Water Demands agency, the accelerated forecasted growth component is incorporated into the demand forecast at a regional level. Water Code Section states that UWMP demand projections shall include water-use estimates for low-income single-family and multi-family residential households. Regional water demand projections listed in Table 2-2 represent water-use estimates for all income levels included in SANDAG s 2050 Regional Growth Forecast. The Water Authority has implemented programs and procedures to proactively maintain its water distribution system and minimize system losses. For demand forecasting purposes, Water Authority system losses were set at 1 percent of annual baseline water demands. Using these factors, the Water Authority s system losses were estimated as follows: Year ,600 AF, Year ,400 AF, Year ,800 AF, Year ,000 AF, and Year ,500 AF Projected Future Conservation Savings With the regional baseline forecast established, the next step is to account for future water conservation savings. Conservation is an important resource strategy for ensuring a cost-effective reliable supply of water for the region. For the 2015 Plan, future water conservation savings were not fixed at the 20 percent per-capita urban use reduction targets established under the Water Conservation Act of 2009 and used in the 2010 Plan. Instead, estimates of water conservation savings were developed for each member agency using the Alliance for Water Efficiency Water Conservation Tracking Tool (AWE Tool), listed in DWR s 2015 UWMP Guidebook as an application to assist water purveyors in developing savings estimates. This industry standard planning tool provides granular estimates of existing and future passive or code-based water savings and active savings resulting from the implementation of demand management programs. Key water savings assumptions are derived based on historical program efficiencies, current regional water savings assumptions that serve as the basis for regional incentives, and efficiency estimates by activity type that are contained in the AWE Tool Library. Future active conservation savings are set at the 2015 level of conservation program activity moving forward, absent the recent large-scale turf replacement program and the current State Water Resources Control Board (SWRCB) statemandated water-use reductions. The passive conservation element includes estimated future savings from appliance standards and code changes, as well as savings from the 2015 Model Water Efficient Landscape Ordinance (MWELO). An 80 percent MWELO compliance level was assumed on new residential development and a majority of this savings was assumed to continue over the UWMP planning horizon. To capture anticipated market transformation on existing homes, the passive conservation total includes savings from landscape conversion on a portion of current single-family homes. Conservation savings projections assume a quarter of existing single-family homes will convert to efficient landscapes over the UWMP planning horizon (approximately 150,000 homes). Based on these assumptions, computed conservation savings for member agencies may surpass levels required under SBX7-7. These savings are deducted from the baseline demand forecast to generate the long-term water demand projection for the region. Table 2-3 contains total future regional conservation savings projections. Final 2015 Urban Water Management Plan 2-6 June 2016
37 San Diego County Water Authority Section 2. Water Demands Table 2-3. Projected Future Conservation Savings (AF) Active Conservation 34,653 28,184 25,474 25,063 25,620 Passive Conservation (Post-FY2013) 39,488 60,926 77,360 89, ,602 Total Additional Conservation Savings 74,141 89, , , ,222 These conservation savings projections are then subtracted from the projected baseline demands derived from the Water Authority s CWA-MAIN model to give the long-range demand forecast (see Table 2-4). Table 2-4. Normal Year Regional Water Demand Forecast Adjusted for Water Conservation (AF) Total Regional Baseline Demand 661, , , , ,995 Additional Conservation -74,141-89, , , ,222 Total Long-Range Demand Forecast with Conservation 587, , , , ,773 SBX7-7 was enacted to require retail urban water agencies within the state to achieve a 20 percent reduction in urban per capita water use by December 31, 2020 (Water Code Section ) and report progress in meeting water-use targets (Water Code Section ). The Water Authority is a wholesale agency not subject to these requirements. However, it is critical for planning purposes that retail compliance with SBX7-7 and corresponding demand reduction be reflected in the Water Authority s 2015 Plan. To assess retail compliance, agencies SBX7-7 AF potable demand targets were calculated based on gallons per capita per day (GPCD) targets provided by the agencies and SANDAG population projections (see Table 2-5). These target demands were compared to the longrange demand forecast, net of conservation, to confirm each agency is on track to meet or exceed their SBX7-7 demand target and to determine the regional demand. Additionally, because SBX7-7 compliance rests at the retail level, member agency demand projections exclude the increment of regional water use attributed to accelerated forecast growth. Table 2-5. Member Agency Compliance with SBX7-7 Demand Targets (AF) Total Long-Range Demand Forecast with Conservation 584, , , , ,587 SBX7-7 Potable Demand Target 619, , , , ,823 SBX7-7 Targets Exceeds Long-Range Demand Forecast with Conservation -34,374-6,681-3,213-7, Demands associated with accelerated forecasted growth were developed at a regional level; they are excluded from the Total Long Range Demand Forecast. Final 2015 Urban Water Management Plan 2-7 June 2016
38 San Diego County Water Authority Section 2. Water Demands Figure 2-2 illustrates the forecasted trend in projected water demands over the 2015 to 2040 time period. This figure combines historic water use and forecasted normal year demands reduced by future additional conservation savings. Figure 2-2 Regional Historic and Projected Normal Water Demands (AF) 900, , , Historic Demand Demand (Acre-Feet) 750, , , , , Projected Demand (with additional conservation savings) 500, , Year Projected Dry-Year Water Demands In addition to a baseline normal demand projection, the Act also requires single dry-year and multiple dry-year demand estimates to evaluate water service reliability during dry-year events. Based on observed historic demand impacts associated with each of these events, separate approaches were taken to forecast single and multiple dry-year conditions. To develop single dry-year projections, a demand response index formula was used to identify the historic high temperature and low rainfall weather parameters that resulted in the maximum impact. Using this index, a representative single dry-year was selected. For this forecast, the year 2015 was selected. The monthly weather patterns associated with 2015 were then substituted into the CWA-MAIN model to generate dry-year demand projections. By holding all non-weather-related predictive variables constant, the model produces an annual forecast of dry-year weather-driven demand. Projected single dry-year demands are shown in Table 2-6. Final 2015 Urban Water Management Plan 2-8 June 2016
39 San Diego County Water Authority Section 2. Water Demands Table 2-6. Single Dry-Year Regional Water Demand Forecast Adjusted for Water Conservation (AF) Single Dry-Year Demand 703, , , , ,987 Future Conservation Savings -74,141-89, , , ,222 Total Demands with Conservation 629, , , , ,765 In accordance with the Act, agencies are also required to prepare additional dry period scenarios spanning multiple consecutive years. Similar to the 2010 UWMP dry-year analysis, a series of threeyear periods were used to establish multiple dry-year scenarios. Water demands for the first year of each period were forecasted using the methodology described above for single dry-years. Demands for the next two consecutive years, over each period, were calculated based on a 1 percent annual increase in water use. This approach to multiple dry-year scenario development was used to account for assumed Water Authority and member agencies demand management measures implemented in the second and third years of drought-like conditions that would result in lower demand increases than those normally associated with hot/dry weather. Multiple dry-year demand projections net of future conservation savings are shown in Table 2-7. Table 2-7. Multiple Dry-Year Water Demand Forecast Including Future Conservation Savings (AF) Total Estimated Demands 640, , , Total Estimated Demands 699, , , Total Estimated Demands 728, , , Total Estimated Demands 749, , ,086 1 Weather for multiple dry water years based on years Projected Climate Change Impact on Water Demands Although not currently required by the Act, evaluation of potential climate change impacts on water demand represents a prudent water resources planning exercise. However, definitive projections on the timing and magnitude of climate change initiated variations to local temperature and precipitation patterns are still forthcoming. The body of work currently available from national and international research contains a wide spectrum of possible outcomes based on numerous climate forcing scenarios run through an assortment of General Circulation Models (GCMs). In the absence of research consensus, the Water Authority has adopted a qualitative evaluation approach that uses a manageable number of climate change scenarios to develop a range of potential demands. A number of advances in climate modeling have occurred since the release of the 2010 UWMP, including fine-scale precipitation and temperature projections based on GCM forecasts. These projections are based on Bias-Corrected Constructed Analog (BCCA) climate projections from the World Climate Research Program's Coupled Model Intercomparison Project phase 5 (CMIP5). The CMIP5 dataset consists of simulations of historical and future climate using 20 different GCMs. In Final 2015 Urban Water Management Plan 2-9 June 2016
40 San Diego County Water Authority Section 2. Water Demands CMIP5, GCMs are paired with four different climate forcing scenarios, or representative concentration pathways (RCPs). The RCPs, named RCP 2.6, RCP 4.5, RCP 6.0, and RCP 8.5, reflect new projected scenarios of future global GHG emissions. Each RCP is based on an assumed radiative forcing or RF. Radiative forcing is the change in net radiative flux (expressed in watts per square meter) at the upper atmosphere due to a change in an external driver, such as a change in the concentration of carbon dioxide. Thus, RF expresses the change in energy in the atmosphere due to GHG emissions. The following is a brief description of each RCP scenario: RCP 8.5 High emissions scenario is consistent with no policy changes to reduce emissions and rising radiative forcing pathway leading to 8.5 watts per square meter in It was developed by the International Institute for Applied System Analysis in Austria. RCP 6.0 Intermediate emissions scenario was developed by the National Institute for Environmental Studies in Japan and is consistent with the application of a range of technologies and strategies for reducing GHG emissions in which radiative forcing is stabilized to 6 watts per square meter shortly after year RCP 4.5 Intermediate emissions scenario was developed by the Pacific Northwest National Laboratory in the United States, and radiative forcing stabilized shortly after year 2100 at 4.5 watts per square meter. RCP 2.6 Low emissions scenario was developed by PBL Netherlands Environmental Assessment Agency and assumes RF reaches 3.1 watts per square meter before it returns to 2.6 watts per square meter by To reach such forcing levels, ambitious GHG emissions reductions would be required over time. A total of 134 BCCA downscaled climate projections are available from CMIP5 that represent various combinations of GCMs and RCP scenarios. The development of demand forecasts based on alternative climate scenarios for the Water Authority s service area began by selecting BCCA scenarios reflecting central tendencies and extremes of climate projections. For each scenario, an ideal pairing of temperature and precipitation projection values was identified from the distribution of results across all models. First, the temperature and precipitation dimensions are evaluated separately, ranking projected annual changes in temperature and average precipitation, from smallest to largest and identifying the 95th, and 5th and 50th percentile values for each variable. Next, each ideal scenario is defined by a pairing for instance, the warm/dry scenario might contain the 95th percentile value for temperature and the 5th percentile value for precipitation. The final step of the scenario selection process involves the identification of individual model projections that have temperature and precipitation projections that are closest in values to the ideal scenario description (for example, the model projection that has a pairing of temperature and precipitation that is nearest to the ideal 95th percentile temperature change and 5th percentile precipitation change). Model projections that are the closest to ideal conditions were chosen as the representative climate change scenarios. Figure 2-3 shows an example scatter plot of modeling results along with percentile bracketing and identification of ideal climate change scenarios. Final 2015 Urban Water Management Plan 2-10 June 2016
41 San Diego County Water Authority Section 2. Water Demands Figure 2-3 Climate Change Modeling Results and Ideal Climate Scenarios Example of selecting five climate change scenarios from 134 available climate projections by first identifying ideal extremes and then choosing individual model projections closest to those ideals. Five climate change scenarios were selected in this manner for the entire region using regionalaverage projections of changes in precipitation and temperature for two future climate projection periods (2040 to 2060 and 2080 to 2099). In general, all projections indicated increases in average temperatures in the future, while various projections indicated increases or decreases in average precipitation. These five scenarios are identified as: Relatively large increases in both average temperature and precipitation (Warm/Wet) Relatively large increases in average temperature and relatively large decreases in average precipitation (Warm/Dry) Relatively small increases in average temperature and relatively large increases in precipitation (Cool/Wet) Relatively small increases in average temperature and relatively large decreases in precipitation (Cool/Dry) Moderate increases in average temperature and moderate changes in precipitation (Moderate) No dramatic shifts in seasonal patterns of precipitation and average maximum daily temperature for the San Diego region were observed under any of the five scenarios. However, on average, annual amounts of precipitation tend to be more concentrated in the winter, with lesser proportions of total annual precipitation occurring in the spring and fall. Two of the climate scenarios resulted in average annual precipitation estimates lower than the historic average under both the and climate projection periods. As mentioned above, all selected scenarios indicate Final 2015 Urban Water Management Plan 2-11 June 2016
42 San Diego County Water Authority Section 2. Water Demands warming on average relative to historical climate conditions, and the interaction of temperature and precipitation projections dictate the estimated impact on the baseline demand forecasts. The range of climate change impacts on Water Authority demands was calculated by substituting the five climate scenarios into the CWA-MAIN model. Under the climate projection period, all scenarios resulted in higher estimates of total water use above the baseline normal weather demands. The average climate change impact ranged from negligible under the Cool/Wet scenario to about a 9 percent increase in the Warm/Dry scenario based on RCP 8.5. Using climate projections, average projected impacts range from a 2 percent decrease in demands relative to historical normal weather conditions to about a 16 percent increase under the Warm/Dry scenario. The results suggest that more significant water demand impacts associated with the forecasted trend toward warmer and drier climate conditions may occur on a time-step beyond the 2015 UWMP planning horizon Member Agency Demand on the Water Authority Table 2-8 shows the Water Authority s projected water demands (sales) by member agency. Water demands were calculated using SBX7-7-compliant baseline demands for each member agency, as forecasted in Section 2.4.2, minus verifiable local supply projections. Therefore, the projected imported demands are directly tied to the success of local supply development in Section 5, Member Agency Supplies, and compliance with SBX7-7 conservation savings requirements discussed in Section 3, Demand Management. Final 2015 Urban Water Management Plan 2-12 June 2016
43 San Diego County Water Authority Section 2. Water Demands Table 2-8. Member Agency Normal Year Demand on the Water Authority (AF) 1,2,3,4 Historical Projected Member Agency Carlsbad MWD 16,403 15,507 16,677 16,965 17,244 17,268 Del Mar, City of 961 1,008 1,014 1,020 1,036 1,040 Escondido, City of 21,062 13,340 14,109 13,900 14,505 15,210 Fallbrook PUD 11,729 10,834 12,384 12,863 13,047 13,148 Helix WD 30,852 27,886 29,066 29,158 29,550 29,928 Lakeside WD 2,858 3,410 3,885 4,023 4,071 4,169 Oceanside, City of 23,082 23,605 23,428 22,418 22,806 23,166 Olivenhain MWD 19,549 19,986 20,655 21,232 21,539 21,749 Otay WD 30,299 37,050 42,530 44,891 45,501 51,082 Padre Dam MWD 10,437 10,519 14,033 14,214 14,445 14,800 Pendleton, MCB Camp Poway, City of 10,660 12,459 13,081 13,594 13,618 14,037 Rainbow MWD 20,173 19,925 20,917 21,001 21,146 21,466 Ramona MWD 5,492 7,328 7,716 7,734 7,696 7,747 Rincon del Diablo MWD 5,744 7,120 7,825 8,271 8,709 9,591 San Diego, City of 5 184, , , , , ,652 San Dieguito WD 5,749 3,300 3,629 3,718 3,806 4,364 Santa Fe ID 9,865 7,210 7,560 7,620 7,726 8,259 Sweetwater Authority 13,954 4,554 6,147 7,800 9,450 10,503 Vallecitos WD 15,297 15,896 19,227 20,687 21,914 25,701 Valley Center MWD 25,598 24,957 25,987 25,987 26,176 26,354 Vista ID 16,216 14,682 16,258 17,567 18,255 19,085 Yuima MWD 4,470 3,804 3,771 3,861 3,995 4,030 Sub-Total 485, , , , , ,579 Accelerated Forecast Growth ,632 4,807 6,806 9,038 11,186 Total 485, , , , , ,765 1 Based on SANDAG 2050 Regional Growth Forecast. 2 Includes historic and projected water conservation. 3 Includes demands associated with member agency known near-term annexations. 4 Assumes member agency implementation of verifiable local supply projections. 5 Excludes City of San Diego s wholesale demands. 6 Demands associated with accelerated forecasted growth are not attributed to individual member agencies and are listed for regional planning purposes. ID = Irrigation District; MWD = Municipal Water District; PUD = Public Utility District; WD = Water District Final 2015 Urban Water Management Plan 2-13 June 2016
44 San Diego County Water Authority Section 2. Water Demands This page intentionally left blank. Final 2015 Urban Water Management Plan 2-14 June 2016
45 Section 3 Demand Management 3.1 Introduction Demand management, or water-use efficiency, is an important ongoing component of the Water Authority s long-term strategy to increase the reliability of the San Diego region s water supply through diversifying its water supply portfolio. Since 1991, in partnership with and support of its member agencies, the Water Authority s programs and initiatives cumulatively have conserved more than 1 million AF of water. In fact, per capita potable water use in the San Diego region has decreased 39 percent between fiscal year 1990 and fiscal year The savings were achieved through various measures, including incentives for water-efficient devices, legislative efforts, code changes, outreach campaigns and programs, and more recently through water-use restrictions due to drought. In 2012, the Water Authority Board of Directors adopted water-use efficiency policy principles. The policy principles are organized into five areas that address member agency support, funding and resources, program performance, outreach and education, and regulation and legislation. The policy principles provide long-term, strategic direction to Water Authority staff for the evaluation, prioritization, development and implementation of water-use efficiency projects, programs, and other efforts. SBX7-7 was enacted in 2009 to require retail urban water agencies within the state to achieve a 20 percent reduction in urban per capita water use by December 31, 2020 (Water Code Section ). The Water Authority is a wholesale agency not directly subject to these requirements. However, the law requires that the Water Authority, as the wholesale supplier, support its retail member agencies efforts to comply with SBX7-7 through a combination of regionally and locally administered active and passive water conservation measures, programs, and policies, as well as the use of recycled water (Water Code Section ). Examples of active measures and programs include residential and commercial water-use surveys and education programs. Active water-use efficiency management strategies cited in the Water Authority s Business Plan include participation in Metropolitan s regional programs and coordination of the programs on behalf of the member agencies, partnerships with San Diego Gas & Electric (SDG&E) on water and energy programs, and offering tools and resources that improve water users knowledge of how to effectively make sustainable reductions in outdoor water use. Passive water-use efficiency management strategies cited in the business plan include programs that encourage market transformation and long-term behavior changes that increase acceptance and use of water-efficient designs, products, and services; increase the landscape industry s basic knowledge regarding the interdependency between water efficiency design, irrigation design, and maintenance; and participation on statewide, national, and industrial committees to advance behavior-based conservation strategies. Additional passive programs and policies include outreach activities, code changes, legislation, and conservation-based rate structures. As one of the original signatories to the California Urban Water Conservation Council s (CUWCC) MOU, the Water Authority has been in full compliance with the Wholesaler Best Management Practices Reports since Most of the Water Authority s member agencies are signatories to the MOU and submit biennial best management practice (BMP) reports to show compliance with the Final 2015 Urban Water Management Plan 3-1 June 2016
46 San Diego County Water Authority Section 3. Demand Management appropriate retail water agency BMPs. Appendix D contains the Water Authority s 2013 and 2014 BMP coverage reports from the CUWCC that document the Water Authority s compliance for the 2013 and 2014 reporting period. The Water Authority has been represented on the CUWCC board, as well as the Utility Operations, Landscape, and Database Development committees. 3.2 Water-Use Efficiency Achievements The Water Authority is a leader in water-use efficiency. This section provides information on the Water Authority s achievements in water-use efficiency, including grant funding, partnerships, education and outreach programs, local and regional rebate and incentive programs, tools, and resources that exist to accelerate the acceptance of water-efficient technologies and practices. These programs and outreach activities provide a foundation for the existing and future measures, programs, and policies discussed in the sections below that support the member agencies efforts to comply with the requirements of SBX7-7 and any state-mandated drought restrictions. For more information on the programs, go to Grant Funding The Water Authority supplements funding of its water-use efficiency programs through the use of grant funding. The Water Authority was awarded federal, state, local, and private grants with a cumulative value of more than $7.7 million for the period of fiscal year 2012 through fiscal year Grant funding sources include the U.S. Bureau of Reclamation, DWR, SDG&E, and the Hans and Margaret Doe Charitable Trust. Examples of the types of programs awarded grant funding are shown in Table 3-1. Table 3-1. Grant Funded Programs WaterSmart Landscape Makeover Program Landscape Water Use Evaluations Drought Response Outreach and Communications WaterSmart Turf Replacement Program Sustainable Landscapes Program School Education Program Agricultural Irrigation Efficiency Program Detention Facility Retrofits Program Water Authority Staffing The Water Authority s Public Outreach and Conservation Department has full-time staff of 19. These staff members design, implement and manage regional water-use efficiency and public outreach programs; develop and support water-use efficiency policy; manage the Water Authority s Small Contractor Outreach and Opportunities Program; provide technical assistance to its 24 member agencies; implement regional programs to support member agency compliance with SBX7-7; and perform grant acquisition and administration duties Regional WaterSmart Turf Replacement Program The Water Authority implemented a regional, grant-funded turf replacement rebate program from December 2012 to January 2016 that provided financial incentives to participants who replaced existing turf with water-efficient landscaping. Final 2015 Urban Water Management Plan 3-2 June 2016
47 San Diego County Water Authority Section 3. Demand Management The WaterSmart Turf Replacement Program promoted outdoor water-use efficiency through financial incentives of $1.50 per square foot to participants who replaced existing water-intensive turf grass with WaterSmart landscapes that included climate-appropriate plants and water-efficient irrigation systems. Turf replacement projects had to be in front or side yards and visible to the public and had to inspire others to pursue landscape conversions. Eligible residential sites received up to $3,000 in incentives; eligible commercial, institutional, and industrial sites received up to $9,000. The program s rebates were funded with more than $1.7 million in grants from a combination of state and federal sources SoCal Water$mart Residential Program The SoCal Water$mart regional residential program offers rebates for turf removal, high-efficiency clothes washers and toilets, weather-based irrigation controllers, rotating nozzles, and rain barrels for stormwater capture. Since the Water Authority joined the program in 2008, more than 52,000 high-efficiency clothes washers and 29,000 high-efficiency toilets were installed in the region through the program. In addition, more than 6.6 million square feet of turf grass was removed. The estimated lifetime water savings for these measures exceeds 59,000 AF SoCal Water$mart Commercial, Industrial, and Institutional Program The SoCal Water$mart Commercial, Industrial, and Institutional (CII) program offers an incentive to eligible CII customers to remove existing water-intensive turf grass and replace it with waterefficient landscaping. Through this program, more than 6 million square feet of turf grass was replaced with water-efficient landscapes with a lifetime water savings of more than 8,000 AF. The SoCal Water$mart CII program offered rebates to replace select, older, inefficient devices with water-efficient devices, including enhanced rebates for fixtures for fitness centers and rebates for public agencies for landscape devices. Since 2012, more than 105,000 water-efficient devices were installed in the region through the program with a lifetime water savings of more than 10,000 AF. Examples of the types of efficient water-use devices are shown in Table 3-2. Table 3-2. Water-Efficient Devices Available through the SoCal Water$mart CII Program Plumbing Fixtures High-efficiency toilets Ultra low and zero water urinals Plumbing control valves Food Equipment Connectionless food steamers Air-cooled ice machines Medical and dental equipment Dry vacuum pumps HVAC = heating, ventilating, and air conditioning Landscape Equipment Irrigation controllers Rotating and large rotary nozzles In-stem flow regulators Soil moisture sensor systems HVAC Equipment Cooling tower conductivity controllers Cooling tower ph controllers Final 2015 Urban Water Management Plan 3-3 June 2016
48 San Diego County Water Authority Section 3. Demand Management Public Agency Landscape Program The Public Agency Landscape Program offers enhanced incentives for public agencies to install water-efficient landscape devices at their facilities. The program pays incentives up-front to encourage public agencies to install water-efficient landscape equipment. Examples of the types of devices eligible for an incentive include soil moisture sensors and rotary nozzles Fitness Center Program The Fitness Center Program offers businesses, whose primary function is fitness, enhanced incentives for replacing older toilets and urinals with new, high-efficiency models. Due to the high volume of use of these types of devices in fitness facilities, significant water savings potential exists Water Savings Incentive Program The Water Savings Incentive Program targets commercial, industrial, institutional and agricultural customers with high water use to improve water-use efficiency through financial incentives for customized water efficiency projects. Previous program projects included changing an industrial process water system to capture, treat and reuse process wastewater; installing new, water-efficient equipment in commercial kitchens and laundries; and contracting with a qualified water manager to improve landscape irrigation efficiency On-Site Recycled Water Conversions Program The On-Site Recycled Water Conversions Program provides financial incentives to property owners to convert sites irrigated with potable water or industrial water systems to recycled water service. Items eligible for incentives included project design, permitting, construction costs associated with the retrofit of potable to recycled water systems, connection fees, and recycled water signage Audits and Surveys WaterSmart Checkups The Water Authority and its member agencies offer WaterSmart Checkups to assist single- and multi-family customers and businesses to identify water-saving opportunities specific to their site. Certified landscape irrigation auditors evaluate a site s landscape and irrigation system and provide the customer with a list of recommendations to improve water efficiency, including plant alternatives and a proposed watering schedule. Residential sites also receive an indoor evaluation that identifies water-wasting fixtures and practices. The service is provided at no cost to the customer. Landscape Irrigation Surveys Landscape Irrigation Surveys provide no-cost, site-specific water-saving recommendations from certified irrigation professionals to CII sites with one or more acres of irrigated landscape. Eligible landscapes include commercial and industrial sites; homeowner association common areas; and institutional sites such as schools, parks, and government facilities. Final 2015 Urban Water Management Plan 3-4 June 2016
49 San Diego County Water Authority Section 3. Demand Management Agricultural Water Management Program The Water Authority s Agricultural Water Management Program has provided agricultural water management services since Over that period, more than 1,900 agricultural irrigation system evaluations on more than 32,000 acres of avocados, citrus, field flowers, and other fruits and ornamentals were performed. The program provides technical assistance to growers to enable them to irrigate crops as efficiently as possible to obtain the maximum economic benefit from limited water resources. The program provides additional assistance through visual observations of the irrigation system, an examination of soil and crop materials, pump testing, and answering questions. A written report summarizes the irrigation system s hydraulic characteristics and soil profiles, and provides recommendations to improve the overall system efficiency. Local weather data and crop water demand information are also provided. Potential improvements in crop yield and water savings realized from improvements in irrigation efficiency are explained to the grower. Follow-up service is provided to determine if system improvements were implemented, and if not, to encourage implementation of the recommendations. The program also includes an agricultural recycled water retrofit project and an electrical conductivity mapping and soil sensor installation program. The agricultural recycled water retrofit project supports conversions from potable water to recycled water for agricultural irrigation. The electrical conductivity mapping and soil sensor installation program allows growers to identify soil properties that can affect crop production. Both programs utilize DWR grant funding Water and Energy Efficiency Programs For more than 25 years, the Water Authority and SDG&E have partnered on a variety of programs and projects to generate significant water and embedded energy savings. Highlights from the Water Authority and SDG&E partnership include showerhead distributions, pre-rinse spray valve installations, high-efficiency clothes washer rebates, energy efficiency assessments for water agencies, home energy and water savings kit distributions, joint marketing strategies, and a waterenergy pilot program that evaluated embedded energy use in the water sector. Over the last five years, the focus on the relationship between water use and energy use in California increased and the California Public Utilities Commission directed energy utilities to form partnerships with water agencies to reduce embedded energy use through water efficiency programs. Moving forward, Water Authority and SDG&E partnership activities include a continuation of the joint rebate for residential high-efficiency clothes washers, collaboration with SDG&E on its residential Energy Savings Assistance Program, cross-marketing of water and energy efficiency programs, and an assessment of additional joint program opportunities. Information on existing and previous partnership programs is shown below. WaterSmart Landscape Efficiency Program The WaterSmart Landscape Efficiency Program targeted a 20 percent reduction in water use at sites with multiple acres of irrigated landscape. The program achieved a portion of the water savings through a pre-implementation audit of the site s irrigation system to identify and fix any malfunctioning and broken irrigation components, and a portion of the water savings through services provided by a water management service company that adjusted the site s irrigation Final 2015 Urban Water Management Plan 3-5 June 2016
50 San Diego County Water Authority Section 3. Demand Management schedule to match the site s irrigation demand. The program is being redesigned to address the reduction of stormwater runoff associated with dry weather flows and inefficient irrigation. Leak Loss Control Program The Leak Loss Control Program saved water and embedded energy through top-down water audits of retail water agency distribution systems. The water audits were available at no cost to the Water Authority s member agencies. The top-down water audits were performed by a third-party contractor and balanced the total volume of water entering a retail water system against authorized consumption and water losses. The program also identified opportunities for the Water Authority s member agencies to implement pressure management measures to reduce or eliminate water loss due to leaks. Detention Facility Retrofits Program The Detention Facility Retrofits Program at the Vista Detention Facility and Kearny Mesa Juvenile Detention Facility saved water and embedded energy through the installation of water-efficient devices, including electronic flush valves, low-flow showerheads, and aerators. The County of San Diego, the facility s owner and operator, provided financial and in-kind services to support the program WaterSmart Customer Education and Workforce Training Consistent with its focus to promote the long-term market transformation of conventional urban landscapes to more water-efficient and sustainable landscapes, the Water Authority offers a variety of education and training opportunities for customers and landscape industry professionals, respectively. Course content is designed to promote best practices for landscape water-use efficiency while empowering customers to take action and make informed purchasing decisions when upgrading their landscapes. The following are offered in partnership with the Water Authority s 24 member agencies. WaterSmart Landscape Makeover Series The series of four workshops provides homeowners an overview and the basic skills necessary for the successful conversion of a traditional turf grass yard into a WaterSmart landscape. Participants receive technical assistance that includes a professional site inspection and development of a base plan to scale, in addition to a professional design consultation. Upon completion of the course, participants have a landscape design with planting and irrigation plans that are ready for implementation. Recent program upgrades include providing stormwater retention plans based on first flush calculations. The average size of the turf replacement projects planned by participants is more than 1,000 square feet. WaterSmart Landscape Design for Homeowners Workshop To accommodate homeowners who prefer an abbreviated version of the WaterSmart Landscape Makeover Series of classes, the Water Authority developed a three-hour version of the classes. This short-format workshop accommodates higher numbers of participants per session, which helps to accelerate the number of homeowners who will be empowered to convert existing water-intensive Final 2015 Urban Water Management Plan 3-6 June 2016
51 San Diego County Water Authority Section 3. Demand Management yards into landscapes that can achieve significant water savings through climate-appropriate plant choices, irrigation efficiency upgrades and stormwater runoff prevention. WaterSmart Landscape Makeover Videos on Demand To help make the main content of the WaterSmart Landscape Makeover Series even more widely available and convenient for homeowners to access, the Water Authority transformed the program into a series of online videos. These videos, as well as links to a variety of resources, take the participant through the steps to achieve a WaterSmart landscape. The steps include identification of their landscape target, creation of a basic plot plan, an evaluation of their site, soil analysis, landscape design, irrigation retrofit and landscape maintenance. Future videos will address sustainable landscape concepts such as capturing rainwater to prevent urban stormwater runoff. California-Friendly Landscape Training The Water Authority and its member agencies partner with Metropolitan to offer free introductory training classes on WaterSmart landscaping. The classes introduce a holistic approach to landscape design and maintenance that emphasizes water-use efficiency. The three-hour classes are fast-paced and informative and offer solutions to common landscape problems. Participants learn to think about landscapes from the soil up. In addition, they learn how to design landscapes that are sustainable in the region s climate. Class topics include how to make the best use of the region s limited rainfall, irrigate efficiently, and choose the best plants for the site. Ad Hoc Training Events The Water Authority periodically sponsored training events as a technical outreach activity to target landscape industry professionals. The objective was to create new educational opportunities to help empower the regional workforce to follow best practices for sustainable landscape design, installation and maintenance. Events included Get Ahead or Get Parched: Six Ways to Survive the Drought, and When in Drought: Irrigation and Tree Care Workshop for Landscape Professionals. Qualified Water Efficient Landscaper (QWEL) Training The Water Authority introduced this robust training program to San Diego County as a workforce training opportunity to help landscape industry professionals learn the latest techniques for landscape water-use efficiency. Originally developed by the Sonoma-Marin Saving Water Partnership, QWEL is recognized by U.S. Environmental Protection Agency (EPA) as a WaterSenselabeled Professional Certification Program for Irrigation System Audits WaterSmart Tools and Resources Feedback from polls and focus groups indicates the public understands the need for water-use efficiency and wants to do the right thing, but is often overwhelmed by how to accomplish it. In response, tools and resources were developed to inspire, educate and empower residents and business to take a water-efficient action, then another, and so on. In addition, these tools and resources foster long-term behavioral change and market transformation by showcasing the beauty and value of WaterSmart landscapes, products and services. The tools and resources developed by the Water Authority are described below. Final 2015 Urban Water Management Plan 3-7 June 2016
52 San Diego County Water Authority Section 3. Demand Management WaterSmartSD Website In 2013, the Water Authority launched a comprehensive water conservation website as an online resource to inspire, educate, and empower the region s residents to make water-efficient lifestyle choices. The website, WaterSmartSD.org, features information about conservation incentives, tools and programs designed to make the most of the region s limited water supplies. The site is organized to provide content relevant to the residential and business sectors. The website also features news items and events, videos, a photo gallery highlighting successful WaterSmart landscaping projects, case studies and other information about indoor and outdoor water-use efficiency. It includes conservation tips and answers to frequently asked questions, along with links to helpful tools such as a residential water-use calculator, free garden design software and residential landscape design templates. The Water Authority updates WaterSmartSD.org regularly and visitors can sign up for automatic notifications relevant to their areas of interest. eguide to a WaterSmart Lifestyle The eguide to a WaterSmart Lifestyle is an online magazine that covers a wide array of topics, including landscape design, water-efficient plants, outdoor rooms, finding and fixing leaks, healthy soil, smart buys on plumbing fixtures, landscape maintenance and drought survival for gardens. It offers everything from design ideas for creating themed planting zones to strategies for using graywater at homes and irrigating efficiently. A Homeowner s Guide to a WaterSmart Landscape A Homeowner's Guide to a WaterSmart Landscape is the companion guide to the Water Authority s award-winning WaterSmart Landscape Makeover Series. This no-cost guide offers instructions for homeowners who want to make their landscapes more water-efficient. The guide reflects the state s Model Water-Efficient Landscape Ordinance standards and explains the principles of a WaterSmart landscape design and irrigation, climate-appropriate plants and BMPs. Residential Landscape Design Templates Professionally drawn, water-efficient landscape plans are available online to provide ideas and inspiration for single-family homeowners, particularly for do-it-yourselfers. San Diego landscape architects designed four templates that support the state s Model Water Efficient Landscape Ordinance. Plans are themed to fit common family audiences, including Empty Nesters, Entertainer Landscape, Pet Friendly Landscape, Children Friendly Landscape, and Native/Wildlife Friendly Landscape. Online Residential Water-Use Calculator The Water Authority launched its online Residential Water-Use Calculator (watersmartsd.org/water-calculator) in April 2013 in partnership with the Alliance for Water Efficiency. The objective of the residential water-use calculator is to assess and educate homeowners about their indoor and outdoor water use and inspire them to make changes in their behavior, fixtures or landscape that will make their home more water-efficient. Final 2015 Urban Water Management Plan 3-8 June 2016
53 San Diego County Water Authority Section 3. Demand Management Smart Water Application Technologies The Water Authority collaborated with industry for many years to promote the research and application of the best practices and technologies to save water. Under the auspices of the Irrigation Association, water utilities, irrigation product manufacturers and other landscape professionals collaborated in the Smart Water Application Technologies (SWAT) committee. SWAT s achievements include the development of a standardized testing protocol for weather-based irrigation controllers to help water utilities establish product eligibility standards for rebates. The standardized testing protocol was also a precursor to the establishment of EPA s ongoing WaterSense product labeling standards. Looking ahead, SWAT testing protocols under development include pressure-regulating spray heads, spray head sprinkler nozzles, pop-up sprinkler head check valves, rain sensors, weather-based irrigation controllers, and soil moisture based irrigation controllers. The test results will provide valuable information in the development of the next generation of water-efficient products. San Diego County Fair The San Diego County Fair is one of the most popular county fairs on the West Coast with more than 1 million attendees each year. The Water Authority uses the fair to reach residents from throughout the region and to partner with regional horticultural gardens to sponsor award-winning landscape exhibits. While following previous fair themes such as A Fair to Remember: Celebrate The World s Fairs & Balboa Park and The Fab Fair, the Water Authority s exhibits continue to demonstrate a beautiful, low-water-use display that can be integrated into a residential setting. In addition, each year, the Water Authority presents an award to the fair s garden show exhibit that best exemplified a WaterSmart landscape through eye-catching colors, textures, and designs. The award and its monetary prize encourage landscape exhibitors to install water-efficient gardens, thus increasing the public s exposure to the beauty and potential of a WaterSmart landscape. Judging criteria include design, plant choice, maintenance and use of water-efficient irrigation components. Water Conservation Garden The Water Conservation Garden opened in 1999 to educate the public about the steps they can take to conserve water in landscapes. It occupies nearly six acres adjacent to Cuyamaca College in the eastern part of the Water Authority s service area. The Garden showcases 16 different mini-gardens and exhibits and provides school-education programs and outreach, low-water-use classes and workshops, and community events. The Water Authority joined the Garden s Joint Powers Authority in 2001 and continues to support its efforts to promote water efficiency in the landscape sector. San Diego Botanic Garden The San Diego Botanic Garden is located in the north-coastal area of San Diego County. The Water Authority supports its vision through a corporate sponsorship. The mission of the Botanic Garden is to promote sustainable use of natural resources. Low-water-use plants and water-saving technologies and displays make up the majority of the Botanic Garden. In an effort to reduce outdoor water use in the region, the Botanic Garden also provides classes on water conservation and garden tours throughout the year in an effort to reduce outdoor water use in the region. Final 2015 Urban Water Management Plan 3-9 June 2016
54 San Diego County Water Authority Section 3. Demand Management San Diego County Garden Friendly Plant Fairs The region s residents who are interested in making their yards and gardens more attractive and water-efficient have a great opportunity to get information from gardening experts and receive significant discounts on varieties of low-water-use plants at San Diego County Garden Friendly Plant Fairs. The events are held annually in the spring and fall at select The Home Depot locations. Plant fairs feature discounts on more than 20 types of plants, preselected by a panel of experts as water-efficient for the San Diego region. Industry experts are available to provide customers with information on water-efficient irrigation supplies and how to select and plant low-water-use plants. The Home Depot-certified nursery consultants host informative how-to workshops and local retail water agencies provide customers with information on water conservation programs and services. Artificial Turf Discount Program In response to drought conditions in 2015, the Water Authority launched an artificial turf discount pilot program to reduce the cost to replace water-intensive grass with artificial turf. Under this public-private partnership, participating artificial turf companies provide customers with a 10 percent discount on products and services. The discount is available whether the installation was performed by the artificial turf company or by a do-it-yourself customer who purchased only materials. The program is available to residential, commercial and public sector customers. The discount is provided directly by the participating artificial turf company. WaterSmart Landscaping in San Diego County The WaterSmart Landscape web portal links viewers to an extensive plant database, inspirational gardens, tips and other landscape-related resources. 3.3 Public Outreach The Water Authority has consistently promotes water-use efficiency programs through its communications and outreach channels as part of its overall long-term strategy to improve the reliability of the region s water supplies by diversifying its water supply sources and advancing conservation. In addition, during times of shortage or drought, the Water Authority dedicates additional resources to public awareness campaigns that call upon the public to take more immediate actions to save water. 20-Gallon Challenge Campaign In response to worsening water supply conditions that began in 2007 and lasted until April 2011, the Water Authority conducted an aggressive outreach campaign branded as the 20-Gallon Challenge. The campaign s name reflected the initial call to cut urban water use voluntarily by 10 percent, or about 20 gallons per capita per day (GPCD). The outreach campaign was a multi-faceted approach to educate the community on short- and long-term water supply challenges, specific tips to save water, and resources available to assist customers. Tactics to help the region meet an 8 percent overall shortage allocation between July 2009 and April 2011 included traditional advertising, media relations, online communications, water agency relations, education curriculum and contests, government relations, and community outreach via presentations and events. The campaign, Final 2015 Urban Water Management Plan 3-10 June 2016
55 San Diego County Water Authority Section 3. Demand Management combined with the ongoing implementation of other Water Authority conservation programs and outreach efforts conducted by the Water Authority s member agencies, helped achieve water savings well above the allocation target. Total potable water use dropped from 211 gallons per person per day in fiscal year 2007 to 140 gallons per person per day in fiscal year Promoting WaterSmart Programs Since the end of shortage allocations in 2011, the Water Authority has been focusing outreach efforts on building awareness and public acceptance for water-use efficiency as a desirable lifestyle and permanent civic responsibility through promoting the Water Authority s WaterSmart-branded conservation programs and classes. Staff promotes these resources primarily through ongoing media relations, community relations activities (such as attending special events and making presentations to community groups), targeted advertising, promotional materials, videos, electronic newsletters, innovative public-private partnerships such as the water-efficient plant fairs with local The Home Depot stores, and through tools such as social media (primarily Facebook, Twitter and YouTube) and the WaterSmartSD.org website. When in Drought Campaign In early 2014, water supply conditions worsened to the point where it again became necessary to launch an urgent drought-response outreach campaign as called for under the Water Authority s Water Shortage and Drought Management Plan. Since April 2014, the Water Authority has executed an aggressive drought response outreach campaign themed When in Drought: Save Every Day, Every Way, to help achieve increased water conservation by the public, and to enhance public understanding of how ratepayers investments in projects and their commitment to water conservation have reduced the region s vulnerability to shortages from drought conditions. The campaign was partially supported in 2014 and 2015 by state Proposition 50 grant funds. In May 2015, the Board authorized an additional $1 million to support enhanced outreach and water conservation programs designed to help the Water Authority s member agencies comply with statemandated water-use reduction targets. In anticipation of continued drought conditions in 2016, the Water Authority was awarded $1.1 million in Proposition 84 Final Round grant funds to sustain enhanced drought response outreach efforts in 2016 and potentially beyond. The campaign employed a wide array of communications tactics, including paid advertising, ongoing media relations, website communications, electronic newsletters, social media posts, videos, a speakers bureau, school education programs, community partnerships and promotions, and government relations. Ads and messages were translated into Spanish, and advertising and community event schedules were constructed to ensure reach into a diverse set of audiences around the region. The Water Authority also launched a When in Drought smartphone app in August 2015 to make it more convenient for the region s residents to report potential incidents of water waste to local water districts. The Water Authority also used public opinion polls and other research opportunities to test messages and tactics and revise them as needed to increase effectiveness. As regulatory and water supply conditions improved in spring 2016, the Water Authority, in coordination with its member agencies, began transitioning to a new drought-awareness outreach effort that is designed to advocate water-use efficiency as a desirable and permanent way of life in the San Diego region. Overall goals of this ongoing effort include promoting greater public awareness and use of regionally available water-use efficiency programs, tools and other resources, Final 2015 Urban Water Management Plan 3-11 June 2016
56 San Diego County Water Authority Section 3. Demand Management and encouraging residents and businesses to continue to exhibit watersmart behaviors and avoid water-wasting practices prohibited statewide. Other Outreach Efforts In addition, the Water Authority consistently promotes conservation activities and programs through a range of activities, including the following: Conducting research on the public s knowledge of water issues and attitudes toward waterefficient landscaping Supporting water conservation and other supply management and development strategies Using social media, electronic newsletters, community events, and speaker s bureau presentations Supporting regional water-efficiency demonstration gardens, such as the Water Conservation Garden and the San Diego Botanic Garden Developing and providing school education materials, assemblies, and an exhibit at the Reuben H. Fleet Science Center in Balboa Park Administering a Citizens Water Academy that educates emerging leaders on regional water issues, including the importance of water-use efficiency and prudent investments in water supply reliability, through in-depth and engaging interactions with senior Water Authority staff and tours of key regional water facilities Sharing updates on local water issues, fact sheets, and information on Board meetings via a Water News smartphone app for Apple and Android devices Water-Use Efficiency Legislative Sponsorship The Water Authority has been a statewide leader in sponsoring legislation to improve water-use efficiency standards since Many bills sponsored by the Water Authority have set precedent and been instrumental in the development of new strategies in water resource management, including advancement of standards for high-efficiency toilets and residential clothes washers, and water-efficient landscapes. Most recently, the Water Authority sponsored Assembly Bill 349, which prohibits common interest developments from banning artificial turf. This landmark water conservation legislation was signed into law in 2015 and will enhance outdoor water conservation opportunities statewide. Water Authority-sponsored landmark water-use efficiency laws are shown in Table 3-3. Final 2015 Urban Water Management Plan 3-12 June 2016
57 San Diego County Water Authority Section 3. Demand Management Table 3-3. Water Authority Sponsored Landmark Water-Use Efficiency Laws Toilets and Clothes Washer Standards SB 1224 (Killea, 1991) AB 952 (Kelley, 2001) AB 1561 (Kelley, 2002) Statewide Landscape Irrigation Standards AB 2717 (Laird, 2004) AB 1881 (Laird, 2006) Artificial Turf in Home Owners Associations AB 349 (Gonzales, 2015) Statewide Requirement for Water Meters AB 514(Kehoe, 2003) AB 2572 (Kehoe, 2004) SB 1050 (NR&W, 2007) Statewide Conservation Best Management Practices SB 553 (Kelley, 2000) AB 1465 (Hill, 2009) Urban Water Management Plans AB 2067 (Weber, 2014) 3.4 Conclusion Water-use efficiency will continue to play a central role in the Water Authority s efforts to maximize the reliability of the region s water supply through diversification. The achievements in water conservation discussed in this section provide a foundation for the existing and future measures, programs, and policies. Moving forward, the Water Authority will support its member agencies efforts to comply with the GPCD reductions required under SBX7-7 and any future long-term state water-use efficiency framework in effect through various means, including a continued emphasis on behavioral change and market transformation. Final 2015 Urban Water Management Plan 3-13 June 2016
58 San Diego County Water Authority Section 3. Demand Management This page intentionally left blank. Final 2015 Urban Water Management Plan 3-14 June 2016
59 4.1 Introduction Section 4 San Diego County Water Authority Supplies Historically, the Water Authority has relied on imported water supplies purchased from Metropolitan to meet the needs of its member agencies. Metropolitan s supplies come from two primary sources, the State Water Project and the Colorado River. After experiencing severe shortages from Metropolitan during the drought, the Water Authority began aggressively pursuing actions to diversify the region s supply sources. Comprehensive supply and facility planning over the last 20-plus years provided the direction for implementation of these actions. This section provides specific documentation on the Water Authority s existing and projected supply sources. For purposes of analysis in the 2015 Plan, supplies are separated into one of three categories: verifiable, additional planned, or conceptual. Verifiable projects are those with substantial evidence and adequate documentation regarding implementation and supply utilization. They have been identified by the Water Authority or member agencies as having achieved a level of certainty in their planning and implementation. Verifiable supplies are included in water supply assessments and verifications prepared by retail water agencies and used by the cities and county in their land use decisions regarding available water supplies for growth under SB 221 and SB 610. These projects are used in the Water Authority s reliability assessment in Section 9, Water Supply Reliability. Additional planned projects are those that the Water Authority or member agencies are actively pursuing and currently funding, but do not rise to the level of verifiable for implementation. Agencies have completed the feasibility phase for these projects and continue to fund advanced planning efforts. Additional planned projects are utilized in Section 10, Scenario Planning Managing an Uncertain Future, as potential strategies to manage future supply uncertainty planning scenarios. Conceptual projects are those considered to be in the pre-planning and pre-feasibility analysis phase, where the projects have not progressed to a point where the project yield can be factored into reliability assessments or uncertainty planning for this 2015 Plan. A Water Resources Plan developed in 1993 and updated in 1997 emphasized the development of local supplies and core water transfers. Consistent with the direction provided in the 1997 plan, the Water Authority entered into a Water Conservation and Transfer Agreement with IID, an agricultural district in neighboring Imperial County, in Through the transfer agreement, the Water Authority received 100,000 AF in 2015, with the volume increasing until it reaches 200,000 AF/YR in The IID Water Conservation and Transfer Agreement supply source is considered a verifiable Water Authority supply. In 2003, as part of the execution of the Quantification Settlement Agreement (QSA) on the Colorado River, the Water Authority contracted for 77,700 AF/YR of conserved water from projects to line the AAC and CC. Deliveries of this conserved water from the CC reached the region in 2007, and deliveries from the AAC reached the region in Supplies from the canal lining projects are considered verifiable Water Authority supplies. To further diversify regional supplies, the Water Authority s 2005 Plan and 2010 Plan identified seawater desalination as a potential supply for meeting future demands. In keeping with the Final 2015 Urban Water Management Plan 4-1 June 2016
60 San Diego County Water Authority Section 4. San Diego County Water Authority Supplies objective of these plans, the Water Authority entered into a formal Water Purchase Agreement with Poseidon Water, a private investor-owned company, in November The Water Purchase Agreement details commercial and financial terms for the development and purchase of desalinated ocean water produced at the Carlsbad Desalination Plant. Construction began in 2012 and commercial operation began in December This facility is currently in commercial operation and is capable of producing up to 56,000 AF/YR. The Carlsbad Desalination Plant is a verifiable supply. 4.2 Water Authority IID Water Conservation and Transfer Agreement On April 29, 1998, the Water Authority signed a historic agreement with IID for the long-term transfer of conserved Colorado River water to San Diego County. The Water Authority IID Water Conservation and Transfer Agreement (Transfer Agreement) is the largest agriculture-to-urban water transfer in U.S. history. Colorado River water is conserved by Imperial Valley farmers who voluntarily participate in the program by fallowing and implementing on-farm conservation projects that conserve water, which is then transferred to the Water Authority for use in San Diego County. Additionally, the Imperial Irrigation District is developing distribution system efficiency improvements to conserve water, which are planned to increase over time as the transfer volume ramps up. Through this transfer agreement, the Water Authority is entitled to Priority 3(a) water, which is a higher priority water right than Metropolitan s Priority 4 apportionment Implementation Status On October 10, 2003, the Water Authority and IID executed an amendment to the original 1998 Transfer Agreement. This amendment modified certain aspects of the Transfer Agreement to be consistent with the terms and conditions of the QSA and related agreements. It also modified other aspects of the agreement to lessen the environmental impacts of the transfer of conserved water. The amendment was expressly contingent on the approval and implementation of the QSA, which was also executed on October 10, Section 6.2.1, Colorado River, contains details on the QSA. On November 5, 2003, IID filed a complaint in Imperial County Superior Court seeking validation of 13 contracts associated with the Transfer Agreement and the QSA. Imperial County and various private parties filed additional suits in Superior Court, alleging violations of the California Environmental Quality Act (CEQA), the California Water Code, and other laws related to the approval of the QSA, the water transfer, and related agreements. The lawsuits were coordinated for trial. The IID, Coachella Valley Water District (CVWD), Metropolitan, the Water Authority, and the state defended these suits that sought validation of the contracts. In January 2010, a California Superior Court judge ruled that the QSA and 11 related agreements were invalid because one of the agreements created an open-ended financial obligation for the state, in violation of California s constitution. The QSA parties appealed this decision, and a stay of the trial court judgment was issued during the appeal. In December 2011, California s Third District Court of Appeal reversed the lower court ruling that had invalidated the Transfer Agreement and QSA. The appeals court remanded several issues to the trial court, including questions about whether the QSA was properly processed under CEQA. In July 2013, a Sacramento Superior Court judge entered a final judgment validating the QSA and rejecting all of the remaining legal challenges. The judge affirmed all of the Final 2015 Urban Water Management Plan 4-2 June 2016
61 San Diego County Water Authority Section 4. San Diego County Water Authority Supplies contested actions, including the adequacy of the environmental documents prepared by IID. In May 2015, the state Court of Appeal issued a ruling that dismissed all remaining appeals Expected Supply Deliveries into San Diego County from the transfer began in 2003 with an initial transfer of 10,000 AF. The Water Authority receives transfer water each year according to a water delivery schedule contained in the transfer agreement. In 2015, the Water Authority received 100,000 AF. The quantities are scheduled to ramp up to 200,000 AF by 2021 and then remain fixed for the duration of the transfer agreement. The initial term of the transfer agreement is 45 years, with a provision that either agency may extend the agreement for an additional 30-year term. During dry years, when water availability is low, the conserved water will be transferred under IID s Colorado River rights, which are among the most senior in the Lower Colorado River Basin. Without the protection of these rights, the Water Authority would suffer greater delivery cutbacks when supplies are limited from Metropolitan Transportation The Water Authority entered into a water exchange agreement with Metropolitan on November 10, 1998, to transport the Water Authority IID transfer water from the Colorado River to San Diego County. The exchange agreement was amended and restated as part of the QSA on October 10, Under the exchange agreement, Metropolitan takes delivery of the transfer water through its Colorado River Aqueduct. In exchange, Metropolitan delivers to the Water Authority a like quantity and quality of water. The Water Authority agrees to pay Metropolitan s lawful wheeling rate for each acre-foot of exchange water delivered. Under the terms of the water exchange agreement, Metropolitan will make delivery of the transfer water for 35 years, unless the Water Authority elects to extend the agreement another 10 years, for a total of 45 years Cost/Financing The costs associated with the transfer are financed through the Water Authority s rates and charges. In the agreement between the Water Authority and IID, the price for the transfer water started at $258/AF and increased by a set amount for the first seven years. In December 2009, the Water Authority and IID executed a fifth amendment to the water transfer agreement that set the price per acre-foot for transfer water for calendar years 2010 through 2015, beginning at $405/AF in 2010 and increasing to $624/AF in For calendar years 2016 through 2034, the unit price will be adjusted using an agreed-upon index. The amendment also required the Water Authority to pay IID $6 million at the end of calendar year 2009 and another $50 million by October Beginning in 2035, either the Water Authority or IID can, if certain criteria are met, elect a market rate price through a formula described in the water transfer agreement. The Water Authority provided $10 million to help offset potential socioeconomic impacts associated with temporary land fallowing. IID will credit the Water Authority for these funds during years 16 through 45. In 2007, the Water Authority prepaid IID an additional $10 million for future deliveries of water. IID will credit the Water Authority for this up-front payment during years 16 through 30. Final 2015 Urban Water Management Plan 4-3 June 2016
62 San Diego County Water Authority Section 4. San Diego County Water Authority Supplies As part of implementation of the QSA and water transfer, the Water Authority also entered into an environmental cost-sharing agreement. Under this agreement, the Water Authority is contributing a total of $64 million to fund environmental mitigation projects and the Salton Sea Restoration Fund. The October 2003 Exchange Agreement between Metropolitan and the Water Authority provides for transportation of Colorado River water from the Canal Lining Projects and the IID water transfer through Metropolitan facilities. Under the Exchange Agreement, the initial price to transport the Colorado River water was set at $253/AF. Thereafter, the Water Authority agreed to pay Metropolitan s lawful wheeling rate for transportation of these water supplies at a price equal to the charge or charges set by Metropolitan s Board of Directors pursuant to applicable laws and regulation, and generally applicable to the conveyance of water by Metropolitan on behalf of its member agencies. Metropolitan s published transportation charge in 2015 was $424/AF. After the completion of its 2010 UWMP, the Water Authority took legal action challenging Metropolitan s rates for calendar years 2011 through On November 19, 2015, a final judgment was entered in San Francisco Superior Court invalidating Metropolitan s transportation rates for 2011 through The judgment also determined that Metropolitan has under-calculated the Water Authority s preferential right to Metropolitan water by tens of thousands of AF of water per year. Metropolitan has appealed the judgment and has not changed its cost allocation or rate setting to be consistent with the Court s ruling. The case challenging the rates set in 2014 for the 2015 and 2016 calendar years has been stayed pending appeal. A lawsuit challenging Metropolitan s 2017 and 2018 rates that were set in April 2016 was recently filed by the Water Authority Written Contracts or Other Proof Appendix E contains a list of the specific written contracts, agreements, and environmental permits associated with implementation of the Water Authority IID Transfer Existing and Future Supplies Based on the terms and conditions in the Transfer Agreement, Table 4-1 shows the anticipated delivery schedule of the conserved transfer water in five-year increments. There is adequate documentation to demonstrate the availability of this supply; therefore, the supply yields shown in Table 4-1 will be included in the reliability analysis found in Section 9, Water Supply Reliability. Table 4-1. Existing and Projected Water Authority IID Transfer Supplies (Normal Year AF/YR) , , , , , , All-American Canal and Coachella Canal Lining Projects As part of the QSA and related contracts, the Water Authority contracted for 77,700 AF/YR of conserved water from projects that lined portions of the AAC and CC. The projects reduced the loss of water that occurred through seepage, and the conserved water is delivered to the Water Final 2015 Urban Water Management Plan 4-4 June 2016
63 San Diego County Water Authority Section 4. San Diego County Water Authority Supplies Authority. This conserved water will provide the San Diego region with an additional 8.5 million AF over the 110-year life of the agreement Implementation Status The CC lining project began in November 2004 and was completed in Deliveries of conserved water to the Water Authority began in The project constructed a 37-mile parallel canal adjacent to the CC. The AAC lining project began in 2005 and was completed in The lining project constructed a concrete-lined canal parallel to 24 miles of the existing AAC from Pilot Knob to Drop Expected Supply The AAC lining project makes 67,700 AF of Colorado River water per year available for allocation to the Water Authority and San Luis Rey Indian water rights settlement parties. The CC lining project makes 26,000 AF of Colorado River water available each year for allocation. The 2003 Allocation Agreement provides for 16,000 AF/YR of conserved canal lining water to be allocated to the San Luis Rey Indian water rights settlement parties. The remaining amount, 77,700 AF/YR, is to be available to the Water Authority, with up to an additional 4,850 AF/YR available to the Water Authority, depending on environmental requirements from the CC lining project. For planning purposes, the Water Authority assumes that 2,500 AF of the 4,850 AF will be available each year for delivery, for a total of 80,200 AF/YR of that supply. According to the Allocation Agreement, IID has call rights to a portion (5,000 AF/YR) of the conserved water upon termination of the QSA for the remainder of the 110 years of the Allocation Agreement and upon satisfying certain conditions. The term of the QSA is for up to 75 years Transportation The October 2003 Exchange Agreement between the Water Authority and Metropolitan provides for the delivery of the conserved water from the canal lining projects. The Water Authority pays Metropolitan s applicable wheeling rate for each acre-foot of exchange water delivered. In the Agreement, Metropolitan will deliver the canal lining water for the term of the Allocation Agreement (110 years) Cost/Financing Under California Water Code Section et seq., the Water Authority received $200 million in state funds for construction of the canal lining projects. In addition, $20 million was made available from Proposition 50 and $36 million from Proposition 84. The Water Authority was responsible for additional expenses above the funds provided by the state. In accordance with the Allocation Agreement, the Water Authority is responsible for a portion of the net additional Operation, Maintenance, and Repair costs for the lined canals. Any costs associated with the lining projects are to be financed through the Water Authority s rates and charges Written Contracts or Other Proof Appendix E contains a list of the specific written contracts, agreements, and environmental permits associated with implementation of the canal lining projects. Final 2015 Urban Water Management Plan 4-5 June 2016
64 San Diego County Water Authority Section 4. San Diego County Water Authority Supplies Future Supplies Table 4-2 shows the anticipated delivery schedule of conserved supplies from the canal lining projects in five-year increments. Adequate documentation exists to demonstrate the availability of this supply; therefore, the reliability analysis found in Section 9, Water Supply Reliability, will show the supply yields presented in Table 4-2. Table 4-2. Projected Supply from Canal Lining Projects (Normal Year AF/YR) CC Lining Project 1 24,000 24,000 24,000 24,000 24,000 24,000 AAC Lining Project 2 56,200 56,200 56,200 56,200 56,200 56,200 Total: 80,200 80,200 80,200 80,200 80,200 80,200 1 The project was completed in 2006, and deliveries started in Includes 21,500 AF + 2,500 AF environmental water deliveries. 2 The project was completed and deliveries started in Metropolitan Water District of Southern California The Water Authority s imported water supply sources include purchases from Metropolitan. This is separate from and in addition to the Water Authority-IID Transfer supplies and CC and AAC Lining Projects supplies. Section 6 contains detailed information on Metropolitan s supplies, and information on Water Authority projected demands on Metropolitan, provided by Metropolitan, can be found in Appendix I. 4.5 Carlsbad Desalination Plant Development of seawater desalination in San Diego County assists the region in diversifying its water resources; reduces dependence on imported supplies; and provides a new drought-proof, locally treated water supply. The Carlsbad Desalination Plant is a fully operational seawater desalination plant and conveyance pipeline developed by Poseidon, a private investor owned company that develops water and wastewater infrastructure. The Carlsbad Desalination Plant, located at the Encina Power Station in Carlsbad, began commercial operation on December 23, 2015, and can provide a highly reliable local supply of up to 56,000 AF/YR for the region. Of the total Carlsbad Desalination Plant production, 6,000 AF is considered a member agency local supply, described further in Section As a result of the forthcoming Encina Power Station decommissioning and termination of the oncethrough cooling water system and seawater intake pumps, the Carlsbad Desalination Plant will require transitioning from co-located operations with the Encina Power Station to permanent stand-alone operations. This will necessitate changes to the existing intake and discharge operations that will likely include direct lagoon intake, construction of new 1 mm screens for seawater process water or brine dilution water, construction of new fish-friendly pumps, and process efficiency modifications. In addition, there is the potential to increase annual average production capacity of the Carlsbad Desalination Plant to 61,600 AF as an adaptive management Final 2015 Urban Water Management Plan 4-6 June 2016
65 San Diego County Water Authority Section 4. San Diego County Water Authority Supplies supply (subject to future supply conditions and future Board action). The potential 5,600 AF increment of additional seawater desalination supply from the Carlsbad Desalination Plant could be placed into service prior to Transportation A 54-inch-diameter pipeline was constructed to convey product water from the desalination plant 10.5 miles east to the Water Authority s Second Aqueduct. The water is then conveyed five miles north to the Water Authority s Twin Oaks Valley WTP facility, where it is blended with treated imported water and subsequently distributed into the Water Authority s existing aqueduct system Cost/Financing The Water Purchase Agreement between the Water Authority and Poseidon provides the terms whereby the Water Authority purchases the entire output from the Carlsbad Desalination Plant at a price based on the cost of production. The initial contract year unit cost is estimated to be $2,307 per AF. The Water Authority s water purchase costs are financed through Water Authority rates and charges Written Contracts or Other Proof Appendix E contains a list of the specific written contracts, agreements, and environmental permits associated with implementation of the Carlsbad Desalination Plant Future Supplies Table 4-3 shows the anticipated delivery schedule of supplies from the Carlsbad Desalination Plant in five-year increments. Adequate documentation exists to demonstrate the availability of this supply; therefore, the reliability analysis found in Section 9, Water Supply Reliability, will show the supply yields presented in Table 4-3. Table 4-3. Projected Supply from Carlsbad Desalination Plant (Normal Year AF/YR) ,000 50,000 50,000 50,000 50, Other Water Authority Seawater Desalination Efforts Potential MCB Camp Pendleton Seawater Desalination Project The feasibility of a potential seawater desalination facility located on MCB Camp Pendleton is being evaluated as a long-term resource strategy to manage future supply uncertainties. Moving forward with development of the project would take further actions by the Water Authority s Board of Final 2015 Urban Water Management Plan 4-7 June 2016
66 San Diego County Water Authority Section 4. San Diego County Water Authority Supplies Directors and the action would be considered in the context of member agency implementation of local supplies, such as potable reuse, as well as future changes to imported supply reliability. The MCB Camp Pendleton desalination project is not considered a verifiable supply and is therefore not included in the reliability assessment contained in Section 9. The project is categorized as an additional planned project based on level of project documentation, and is used in Section 10, Scenario Planning Managing an Uncertain Future, as a potential strategy to manage future uncertainty planning scenarios. As an adaptive management supply project, any future decisions regarding further development of a Camp Pendleton seawater desalination project will be based on water supply reliability factors including implementation of planned local supply projects, as well as future changes to imported supply reliability. In June 2009, the Water Authority, in collaboration with MCB Camp Pendleton, completed a feasibility study for a potential 50-MGD to 150-MGD seawater desalination project on MCB Camp Pendleton. The following year, an MOU between the Water Authority and MCB Camp Pendleton was executed to establish the framework for cooperation between the two parties during the performance of additional technical and environmental studies. The MOU did not commit either party to advance the project beyond the planning studies contemplated in the MOU. In October 2013, these additional planning-level studies and field investigations were finalized to further define project requirements, including the feasibility of subsurface and screened open ocean intake alternatives, brine discharge methods, treatment processes and plant configurations, power supply requirements, alternative conveyance alignments, the integration of new supplies into the regional aqueduct system, and impacts to MCB Camp Pendleton operations. The results further validated overall project feasibility, including the viability of both the screened open ocean and subsurface intakes, and the practicality of a diffuser type brine discharge system. The project was also considered in the 2013 Regional Water Facilities Optimization and Master Plan Update as a new supply alternative ( Supply from the West option) capable of addressing the region s long-term need for new supply development. As noted in the 2013 Master Plan Update, the need for new regional supply development will increase in the years beyond 2025 in correlation with projected population increases. The Master Plan Update recommended an adaptive management approach for a future MCB Camp Pendleton project whereby future major decisions affecting project implementation would need to consider, among other factors, the implementation of the City of San Diego s Pure Water Program, the progress of the Bay Delta Conservation Plan (BDCP), and other local reuse and desalination supplies currently in development, along with future changes to imported supply reliability. The 2013 Master Plan Update further noted that timely regulatory review and successful permitting may hinge on the viability of the open-ocean or subsurface intake options to provide feedwater for the reverse osmosis membranes, and that as an initial incremental development step, intake studies should be performed to physically demonstrate the two seawater intake technologies. In March 2015, the Board approved the intake studies and awarded a contract in September 2015 to execute the Intake Testing Program. This testing program was initiated in late 2015 and is anticipated to take approximately two years to complete. Final 2015 Urban Water Management Plan 4-8 June 2016
67 San Diego County Water Authority Section 4. San Diego County Water Authority Supplies Rosarito Beach Binational Desalination Plant Feasibility Evaluation and Preliminary Design Currently, the Rosarito Beach Binational Desalination Project is considered a conceptual-level project and is therefore not included in the reliability assessment in Section 9. The Water Authority is participating with U.S. and Mexican agencies in a binational review of potential water management and water supply programs that could benefit Colorado River water users of both countries. As part of this effort, a binational workgroup formed to study potential new water supplies and recommended the evaluation and preliminary design of an initial 25-MGD (expandable to 50 MGD) seawater desalination plant that would be located at Rosarito Beach in Baja California, Mexico. If built, product water from the plant would be available to both U.S. and Mexican water users. For U.S. water users, the water could be delivered either directly to the San Diego region, using a crossborder pipeline, or possibly by exchange, with Mexican users taking delivery of the product water and leaving an equivalent amount of Colorado River water available for U.S. users. A separate local seawater desalination project is being pursued by Otay WD at the same location and is described in Section Existing funding was sufficient to complete the first phase of the project, which provided a feasibility evaluation of the site, assessment of water demand, and a review of environmental permitting requirements. The first phase confirmed that the site and the existing infrastructure were adequate to support up to a 50-MGD seawater desalination facility. Subsequent phases of the project would confirm conceptual treatment process requirements, confirm plant size and physical layout, further assess permitting and regulatory issues, define full-scale plant costs, and operate a pilot plant for various test purposes. 4.7 Water Authority Dry-Year Supplies In addition to Water Authority supplies expected during a normal water year, the Water Authority also has also invested in carryover storage supplies to assist in achieving reliability in dry years and multiple dry years, as discussed in Section 9.3, Dry Water Year Assessment. The Water Authority s carryover storage supply program includes both in-region surface water storage and out-of-region groundwater storage in California s Central Valley. These verifiable dry-year storage supplies are described in detail in Section 11, Shortage Contingency Analysis, and a list of the specific written contracts, agreements, and environmental permits associated with implementation of the Carryover Storage Program is contained in Appendix E. Final 2015 Urban Water Management Plan 4-9 June 2016
68 San Diego County Water Authority Section 4. San Diego County Water Authority Supplies This page intentionally left blank. Final 2015 Urban Water Management Plan 4-10 June 2016
69 Section 5 Member Agency Supplies 5.1 Introduction Local resources developed and managed by the Water Authority s member agencies are critical to securing a diverse and reliable supply for the region. Local projects reduce demands for imported water and provide agencies with a drought-resilient supply. This section provides general information on the local resources being developed and managed by the member agencies. These supplies include surface water, groundwater, recycled water, potable reuse and desalinated seawater. The Water Authority, working closely with its member agencies, took the following steps to update the yields anticipated from the member agencies local supplies: 1. Provided the member agencies with the projected supply numbers included in the Water Authority s Updated 2010 Plan and requested they update the figures for their specific project(s) and separate the projects into three project categories: verifiable, additional planned, and conceptual. These categories are based on the stages of development, as defined in the introduction of Section 4, San Diego County Water Authority Supplies. 2. Prepared revised projections based on input from agencies. 3. Presented revised supply numbers to member agencies at several meetings and continued working with them to ensure the figures accurately reflected their project implementation efforts. 4. Distributed the administrative draft of the 2015 Plan to member agencies for their review, providing the agencies another opportunity to review and revise the updated local supply figures prior to Water Authority Board approval. Before 1947, the San Diego region relied on local surface water runoff in normal and wet weather years and on groundwater pumped from local aquifers during dry years when stream flows were reduced. As the economy and population grew, local resources became insufficient to meet the region s water supply needs. From the 1950s onward, the region became increasingly reliant on imported water supplies. Since 1980, a range of 5 to 36 percent of the water used within the Water Authority s service area has come from local sources, primarily from surface water reservoirs with yields that vary directly with annual rainfall. A small but growing share of local supply comes from recycled water and groundwater recovery projects, with additional local supply planned from potable reuse and seawater desalination. Yield from these projects is considered drought-resilient since the projects are primarily independent of precipitation. In fiscal year 2015, total local water sources provided 10 percent of the water used in the Water Authority s service area. Final 2015 Urban Water Management Plan 5-1 June 2016
70 San Diego County Water Authority Section 5. Member Agency Supplies 5.2 Surface Water Description The regional surface water yield is supported by 24 surface reservoirs with a combined capacity of 746,385 AF (see Table 5-1 and Figure 5-1). These reservoirs are located in seven of San Diego County s nine coastal watersheds. Runoff in these watersheds occurs at the crest of the county s Peninsular Range and drains into the Pacific Ocean. The oldest of these reservoirs, Cuyamaca, was constructed in Table 5-1 lists the 24 reservoirs, together with their operating agency and storage capacity. Olivenhain Reservoir, completed in 2003, is the region s newest reservoir. It is part of the Water Authority s ESP and has a storage capacity of 24,789 AF. The ESP adds 90,100 AF of additional storage capacity and is designed to protect the region from disruptions in the water delivery system. In addition, the 2002 Regional Water Facilities Master Plan identified an opportunity to augment the ESP with a carryover storage component at San Vicente. The Water Authority completed the ESP and CSP portion of the San Vicente Dam Raise in mid-2014, which provides an additional 152,000 AF of water storage capacity. Refer to Section and Section for additional information on the Water Authority s emergency and carryover storage Issues Management The Water Authority s member agencies manage most of the region s reservoirs. The San Vicente Dam Raise was completed in mid-2014 and CSP water began to be stored a year later. Together with the city of San Diego, the Water Authority coordinates San Vicente operations to optimize the use of their respective storage pools. The Water Authority also coordinates storage in Lake Hodges with the City of San Diego in order to manage its pumped storage project. The Lake Hodges Pumped Storage Project delivers water uphill to Olivenhain Reservoir in off-peak hours, generating electricity during peak demand periods through a coordinated release schedule. Also, in coordination with its member agencies, the Water Authority manages the imported conveyance system to achieve the optimal use of local and imported water resources, which include the local reservoirs. To reduce the need for imported water purchases, the reservoirs are operated to maximize the use of this local supply. Local surface water supplies can also offset dry-year shortfalls in imported water. Maximizing local yield reduces losses due to evaporation and spills, but it also results in increased demands for imported water during dry years when imported water is more likely in short supply. Most member agencies maintain some portion of their storage capacity for emergency storage. To optimize the use of local storage, the Water Authority works with its member agencies through periodic storage agreements and through its annual Aqueduct Operating Plan. Storage agreements allow for carryover storage to be placed in member agency reservoirs and to provide increased local storage capacity, which can be used during peaks on the aqueduct system. The aqueduct operating plans coordinate imported water deliveries and optimize reservoir fill opportunities. Local yield is maximized by the member agencies that operate the reservoirs. Final 2015 Urban Water Management Plan 5-2 June 2016
71 San Diego County Water Authority Section 5. Member Agency Supplies Table 5-1. Major San Diego County Reservoirs Agency (Owner) Reservoir Capacity (AF) Carlsbad MWD Maerkle 600 Escondido, City of Dixon 2,606 Escondido, City of Wohlford 6,506 Fallbrook PUD Red Mountain 1,335 Helix WD Cuyamaca 8,195 Helix WD Jennings 9,790 Poway, City of Poway 3,330 Rainbow MWD Morro Hill 465 Ramona MWD Ramona 12,000 San Diego, City of Barrett 34,806 San Diego, City of El Capitan 112,807 San Diego, City of Hodges 30,633 San Diego, City of Lower Otay 49,849 San Diego, City of Miramar 6,682 San Diego, City of Morena 50,694 San Diego, City of Murray 4,684 San Diego, City of San Vicente 1 249,358 San Diego, City of Sutherland 29,508 San Dieguito WD/Santa Fe ID San Dieguito 883 San Diego County Water Authority Olivenhain 24,789 Sweetwater Authority Loveland 25,400 Sweetwater Authority Sweetwater 28,079 Valley Center MWD Turner 1,612 Vista ID Henshaw 51,774 Total Capacity 746,385 = Connected to Water Authority aqueduct system. 1 The Water Authority has storage rights to 152,100 AF of capacity in San Vicente Reservoir (100,000 AF is designated as carryover storage; 52,100 AF is designated as emergency storage). ID = Irrigation District; MWD = Municipal Water District; PUD = Public Utility District; WD = Water District Final 2015 Urban Water Management Plan 5-3 June 2016

72 San Diego County Water Authority Section 5. Member Agency Supplies Figure 5-1 Major San Diego County Reservoirs Final 2015 Urban Water Management Plan 5-4 June 2016
73 San Diego County Water Authority Section 5. Member Agency Supplies Water Quality See Section 7, Water Quality, for a relevant discussion of water quality issues related to the region s water supply Projected Surface Water Supplies Surface water supplies can represent the largest single local resource in the Water Authority s service area. However, annual surface water yields can vary substantially due to fluctuating hydrologic cycles. Since 1990, annual surface water yields have ranged from a low of 4,100 AF in fiscal year 2015 to a high of 140,300 AF in fiscal year Water Authority member agencies project average annual surface water use to decrease slightly, from 51,580 AF in 2020 to 51,180 AF in A list of the individual reservoirs, expected yield, and basis for the supply figure can be found in Appendix F, Table F-1. Table 5-2 shows the projected average surface water supply within the Water Authority s service area, and the yields are utilized in the reliability analysis included in Section 9, Water Supply Reliability. Member agencies expect to include specific information on the projected yields from local reservoirs in 2015 plans. Table 5-2. Projected Surface Water Supply (Normal Year AF/YR) ,680 51, ,480 51,380 51,280 51,180 1 Post-2015 supply adjusted downward to account for increase in California American Water Company demands from City of San Diego. 5.3 Groundwater One of the elements identified in the Water Authority s resource mix is the use and optimization of groundwater supplies by member agencies. The Water Authority does not currently hold groundwater basin rights, nor does it own or operate groundwater facilities within San Diego County. Although opportunities are limited, groundwater is currently used to meet a portion of the municipal water demands throughout the Water Authority s service area from MCB Camp Pendleton in the north to National City in the south. This section provides a general description of municipal groundwater development within the Water Authority s service area, the issues associated with development of this supply, and projected agency yields. Inclusion of specific information required under the Act on groundwater basins and projects is expected in member agency 2015 plans Description Within the past five years, water supply agencies within the Water Authority s service area have produced an annual average of approximately 18,944 AF of potable water supplies from groundwater. This total represents production from both brackish groundwater desalination facilities and municipal wells producing groundwater not requiring desalination. It does not include production from privately owned water wells used for irrigation and domestic purposes, or several Final 2015 Urban Water Management Plan 5-5 June 2016
74 San Diego County Water Authority Section 5. Member Agency Supplies thousand AF of groundwater produced annually from the Warner Basin by the Vista ID. This groundwater is discharged into Lake Henshaw and reported as local surface water supply by the City of Escondido and Vista ID. In addition to providing a local supply to water agencies, groundwater is also a source of supply for numerous private well owners, who draw on groundwater to help meet their domestic and agriculture water needs. In the Ramona area alone, over 1,000 privately owned wells provide a supplementary source of water for Ramona Municipal Water District (MWD) customers. Similar domestic uses occur throughout the Water Authority s service area. These domestic supplies help to offset demand for imported water provided by the Water Authority and its member agencies. Although significant, the amount of groundwater pumped by private wells cannot be accurately quantified nor estimated within the Water Authority s entire service area. One agency, the Yuima MWD, did begin to report yield from its mutual water companies located within their service area in 2015, which totaled approximately 6,000 AF in normal year deliveries. Groundwater production in the Water Authority s service area is limited by a number of factors, including the limited geographic extent of the more productive sand and gravel (alluvial) aquifers; the relatively shallow nature of most of the alluvial aquifers; lack of rainfall and groundwater recharge; and degraded water quality resulting from human activities, such as septic tank use. Shallow and narrow river valleys filled with alluvial sand and gravel deposits are characteristic of the more productive groundwater basins in the San Diego region. Outside of these more productive aquifers, groundwater is developed from fractured crystalline bedrock and semi-consolidated sedimentary deposits that occur throughout the region. However, these aquifers have limited yield and storage and are best suited for meeting domestic water needs that do not require higher flow rates. Figure 5-2 shows the locations of the principal alluvial groundwater basins within the Water Authority s service area. Although groundwater supplies are less plentiful in the San Diego region than in some other areas of California, such as the Los Angeles Basin in Southern California and the Central Valley in Northern California, the Water Authority believes that sufficient undeveloped brackish groundwater supplies exist that could help meet a greater portion of the region s future water demand. Several agencies within the Water Authority s service area have identified potential projects that may provide several thousands of AF of additional groundwater production in the coming years. A general summary and description of these projects are presented below. Groundwater Extraction and Disinfection Projects Groundwater that can be extracted and used as a potable water supply, with little more than disinfection, generally occurs outside the influence of human activities and within the upper reaches of the east-west trending watersheds. Wells producing higher-quality water are operated by MCB Camp Pendleton (Santa Margarita River watershed) and the Sweetwater Water Authority (San Diego Formation aquifer). The Vista ID also operates numerous high-quality extraction wells in the Warner Basin, located in the upper San Luis Rey River watershed. The water from these wells is discharged to Lake Henshaw and eventually to the San Luis Rey River where it is then diverted farther downstream for use in Escondido and elsewhere. The unit cost of water produced from simple groundwater extraction and disinfection projects is low and generally well below the cost of Final 2015 Urban Water Management Plan 5-6 June 2016

75 San Diego County Water Authority Section 5. Member Agency Supplies Figure 5-2 Alluvial Groundwater Basins imported water. Although a substantial amount of the higher-quality groundwater within the Water Authority s service area is already utilized, the primary focus for future local groundwater development is brackish groundwater recovery and recharge projects. Final 2015 Urban Water Management Plan 5-7 June 2016
76 San Diego County Water Authority Section 5. Member Agency Supplies Brackish Groundwater Recovery Projects Groundwater high in salts and total dissolved solids (TDS) and other contaminants, that requires advanced treatment prior to potable use, is typically found in shallow basins in the downstream portions of watersheds. Brackish groundwater recovery projects use membrane technology, principally reverse osmosis, to treat extracted groundwater to potable water standards. The City of Oceanside s 6.37-MGD capacity Mission Basin Desalter and the Sweetwater Authority's existing 4.0- MGD Richard A. Reynolds Groundwater Desalination Facility are the only currently operating brackish groundwater recovery and treatment facilities within the Water Authority s service area. The Richard A. Reynolds Groundwater Desalination Facility is currently undergoing an expansion that will increase its capacity to 8,800 AF. The expansion is expected to be completed in 2017 and will provide potable water to the Sweetwater Authority and the City of San Diego. Several member agencies are also considering the feasibility of new groundwater recovery and treatment facilities. Unit costs for brackish groundwater recovery projects are considerably higher than those for simple groundwater extraction and disinfection projects due to the additional treatment requirements and the cost of concentrate (brine) disposal. However, where economical options exist for disposal of brine, this type of groundwater project has proven to be an economically sound water-supply option. Groundwater Recharge and Recovery Projects Artificial recharge and recovery projects, also referred to as conjunctive-use projects, can increase groundwater basin yields by supplementing the natural recharge process. Conjunctive-use projects divert water supplies to percolation basins or injection wells to supplement natural rainfall runoff recharge. Captured rainfall runoff, recycled water, imported water, or a combination thereof, can be used to recharge groundwater basins when water levels have been lowered sufficiently by pumping. Groundwater basins can be operated similar to surface water reservoirs to supply stored water to the region if imported deliveries are limited due to high demand, supply and facility constraints, or a combination thereof. The Fallbrook PUD and MCB Camp Pendleton are currently planning such a project Issues Local water agencies often need to consider a multitude of issues during the planning, permitting, design, construction and operation of a groundwater project. The issues can include dealing with hydrogeological uncertainties, high upfront study and subsurface investigation costs, higher unit costs association with brackish groundwater recovery and treatment, project funding considerations, water rights, regulatory and environmental concerns, and possible contamination of groundwater that might occur after the project is constructed and facilities are brought online. Although these issues in the past have discouraged decision makers and have limited groundwater development in San Diego County, state-wide drought conditions and water supply reliability concerns are prompting renewed consideration of the viability of local groundwater development and cleanup projects for this region. Hydrogeological and Environmental Impact Uncertainty In groundwater basins not recently used as a source of a municipal water supply by an agency, and where a general lack of information exists regarding issues such as the physical nature of the aquifer materials, existing wells and groundwater production, water quality, and potential impact of pumping to riparian habitat, significant resources must be expended prior to determining the Final 2015 Urban Water Management Plan 5-8 June 2016
77 San Diego County Water Authority Section 5. Member Agency Supplies feasibility of a project. Subsurface exploration and field investigations are costly and time consuming. In addition, data management and utilization generally require the development of costly large-scale numerical models. These issues, in conjunction with financial considerations, often dictate that groundwater projects be developed, and production increased incrementally, in a planned and managed fashion. Economic and Financial Considerations Because of the saline nature of the water and the presence of other contaminants in many of the groundwater basins in San Diego County, the cost of groundwater development often requires demineralization and brine disposal facilities, which can be costly to construct and operate. Institutional, Legal, and Regulatory Issues Institutional and legal issues can also impact project development. Because groundwater basins often involve multiple water agencies and/or numerous private wells and water-right holders, water rights and management authority should be addressed before a project progresses beyond the planning stage. Agencies are often reluctant to initiate groundwater development projects that go beyond the feasibility study stage unless jurisdiction and water rights issues are resolved beforehand. As challenging as those issues may be, recent drought conditions have prompted local agencies to attempt to resolve or overcome those barriers to groundwater development and proceed to groundwater project implementation. In September 2014, Gov. Jerry Brown signed a package of three bills known as the Sustainable Groundwater Management Act (SGMA), which sought to provide local agencies with a framework for managing groundwater basins in a manner that ensured basin resiliency, recognized that groundwater is most effectively managed at the local level, and empowered local agencies to achieve basin sustainability within 20 years. The SGMA further respected regional differences and provided for a tailored approach to planning. Other goals of the SGMA included: Established minimum standards for sustainable groundwater management Improved coordination between land use and groundwater planning Provided state technical assistance Created a mechanism for state intervention if, and only if, a local agency was not managing its groundwater sustainably Protected water rights DWR Bulletin 118 identified 515 alluvial groundwater basins in California. DWR conducted an initial prioritization of the identified 515 basins, and those basins deemed high- and medium-priority basins are required by SGMA to develop Groundwater Sustainability Plans (GSPs) via a designated Groundwater Sustainability Agency (GSA). A GSA can be a local agency, a combination of local agencies, or a county. It is the GSA s responsibility to develop and implement a GSP that considers all beneficial uses and users of groundwater in the basin. GSAs must be formed by June 30, In the San Diego region, four local basins were deemed medium priority: San Luis Rey Valley San Pasqual Valley Final 2015 Urban Water Management Plan 5-9 June 2016
78 San Diego County Water Authority Section 5. Member Agency Supplies Santa Margarita Valley San Diego River Valley Regional and local agencies impacted by this requirement are taking steps to ensure SGMA compliance within the allotted timeframe. Uncertainty over future regulatory requirements for drinking water supplies can also pose additional barriers to project development. When developing facilities and compliance plans for groundwater development and/or groundwater recharge projects, agencies must take into account proposed or potential regulatory changes related to water quality issues. Some of the regulations for which changes are expected over the next decade include state and federal drinking water standards and State Water Resources Control Board (SWRCB) Division of Drinking Water (DDW) groundwater recharge regulations. Environmental Regulatory Constraints Issues related to the environmental impacts that could potentially result from the fluctuation of groundwater levels when large quantities of groundwater are extracted are common to many of the groundwater projects proposed within the principal alluvial aquifers in the Water Authority s service area. These issues include potential impacts on endangered species habitat and groundwater-dependent vegetation. Impacts may occur if a project results in seasonal or long-term decreases in the depth of the groundwater. Although potential environmental impacts can generally be mitigated, mitigation costs can reduce the cost-effectiveness of a project. Water Quality Remediation of groundwater contamination presents a significant, ongoing operations and maintenance cost that presents barriers to project implementation. See Section 7.5, Groundwater, for additional information on water quality for groundwater supplies. Funding Grant funding for groundwater development has been steadily increasing. Title XVI of Public Law (PL) , the Reclamation Wastewater and Groundwater Study and Facilities Act, initially authorized the federal government to fund up to 25 percent of the capital cost of authorized recycling projects. PL , the Reclamation Recycling and Water Conservation Act of 1996, authorized two additional projects. One of those projects included funding for the City of Oceanside s Mission Basin Brackish Groundwater Desalting Demonstration Project (additional detailed Title XVI funding information can be found in Section 5.4.3). Since 1994, this project, along with the Sweetwater Authority s groundwater desalination facility, also benefitted from receiving Groundwater Recovery Program Funding from Metropolitan. To date, over $13.9 million has been received from this funding source for both the City of Oceanside s and Sweetwater Authority s groundwater brackish projects. Along with local and federal funding sources, in 2007, the San Diego Integrated Regional Water Management (IRWM) Program submitted a grant proposal to DWR for Proposition 50 funds. As a result of this grant award, the Santa Margarita Conjunctive Use Project was awarded grant funding to enhance groundwater basin recharge and recovery to provide water supplies for both MCB Camp Pendleton and Fallbrook PUD, which also resolved a long-standing water rights dispute. The project will provide approximately 3,100 AF/YR of new local supply from the Santa Margarita River by Final 2015 Urban Water Management Plan 5-10 June 2016
79 San Diego County Water Authority Section 5. Member Agency Supplies conjunctively managing the groundwater basin. Additionally, 1,380 acres of sensitive habitat will also be preserved along the river as a result of this project. In Southern California, wastewater, brackish water and urban runoff are high in TDS and other impurities that require advanced treatment to allow beneficial reuse. The North San Diego County Cooperative Demineralization Project funded under Proposition 84 - Round 1 Implementation Grant, focuses on developing new local water supplies and managing water quality issues by constructing an advanced water treatment facility (San Elijo Water Reclamation Facility) to mitigate high TDS sources, increase beneficial reuse, and study the feasibility of brackish to potable water desalination in north San Diego County. In 2014, also with Proposition 84 grant funding awarded through the San Diego IRWM, the Sweetwater Authority will be able to expand their production of potable water from desalinated brackish groundwater through expansion of the Richard A. Reynolds Groundwater Desalination Facility for an additional 5,200 AF/YR. The project involved drilling five new wells in the San Diego Formation, construction of an additional 20,000 linear feet of conveyance and potable pipelines, and facility modifications. The desalinated groundwater produced by the project will be added directly into the potable water supply, which will offset imported water purchases. Brine discharge from this project will also help to maintain the brackish quality in the Sweetwater River estuary, protecting against incursion by non-native freshwater species. The project was implemented by the Sweetwater Authority, in partnership with the City of San Diego. This multi-year project is expected to be completed in Projected Groundwater Supply Yield The Water Authority has worked closely with its member agencies to develop groundwater yield projections. The most reliable projections have been developed by considering only existing (verifiable) groundwater projects, which include planned expansions to existing projects. Table 5-3 shows the projected annual yield from verifiable groundwater projects in five-year increments, based on projections and implementation schedules or existing projects and planned expansions provided by the member agencies. These are included in the reliability analysis found in Section 9, Water Supply Reliability. Table F-2, Appendix F contains a list of the projects and the projected supplies. Table 5-3. Projected Groundwater Supply (Normal Year AF/YR) ,773 30,040 31,630 32,670 32,670 32,670 An overall projected increase in groundwater production from 2020 and beyond is due primarily from expansion of the brackish groundwater recovery and treatment project currently operated by the Sweetwater Authority. As previously described in Section 5.3.2, the Sweetwater Authority and the City of San Diego have joined together to expand the capacity of the Richard A. Reynolds Groundwater Desalination Facility (owned by the Sweetwater Authority), and share in the cost of the project and the total 8,800 AF of water produced. The Reynolds Desalination Facility treats a local groundwater supply that has previously been non-potable or unusable. The facility was initially designed and constructed to accommodate an expansion in the production capacity. Final 2015 Urban Water Management Plan 5-11 June 2016
80 San Diego County Water Authority Section 5. Member Agency Supplies Additional Planned Projects Groundwater Maximizing groundwater development is critical to diversifying the region s water supply portfolio. Beyond the projections of the more reliable and verifiable projects included in Table 5-3, member agencies have also identified two additional planned projects, with an estimated total of 3,600 AF/YR of additional yield in The Otay WD Rancho Del Rey Groundwater Well Development Project is expected to yield 500 AF/YR by Fallbrook PUD/MCB Camp Pendleton s Santa Margarita Conjunctive-Use Project is projected to yield an additional 3,100 AF/YR by These additional yields are considered additional planned supplies and are reflected in Section 10, Scenario Planning Managing an Uncertain Future, as potential strategies to manage future uncertainty planning scenarios. These additional planned projects, as well as the conceptual projects provided by the member agencies, are also included in Appendix F, Table F Water Recycling Another local supply identified in the Water Authority s resource mix is the optimization of recycled water use. Every gallon of recycled water used within the region reduces the need to import or develop other water supplies. This section provides a general description of recycled water development within the Water Authority s service area, the issues associated with developing this supply, and projected regional yield. Documentation on specific existing and future recycling projects is expected to be part of the 2015 plans for those agencies that include water recycling as a supply. The Water Authority coordinated the preparation of this section with its member agencies and those wastewater agencies that operate water recycling facilities within the Water Authority s service area Description Water may be recycled for non-potable or potable purposes. This section considers non-potable recycling. Non-potable water recycling is the treatment and disinfection of municipal wastewater to provide a water supply suitable for non-drinking uses. Non-potable water recycling in the San Diego Region started back in the 1960s when Padre Dam MWD began recycling water for use in Santee Lakes. Water recycling started to increase significantly in the 1990s. Today agencies in San Diego County use recycled water to fill lakes, ponds, and ornamental fountains; to irrigate parks, campgrounds, golf courses, freeway medians, community greenbelts, school athletic fields, food crops, and nursery stock; and to control dust at construction sites. Recycled water can also be used in certain industrial processes, in cooling towers, and for flushing toilets and urinals in nonresidential buildings. Recycled water is also used for street sweeping and firefighting purposes. Local agencies must consider a number of issues when developing recycled water projects, including economic and financial considerations; regulatory, institutional, and public acceptance issues; and water quality concerns related to unknown or perceived health and environmental risks. These issues, if unresolved, can limit the amount of recycled water use in San Diego County. The following sections discuss some of the specific challenges associated with recycled water development. With additional water treatment, recycled water can also be treated to drinking (potable) water standards. Additional information on this highly treated water source (termed potable reuse ) can be found in Section 5.5. Final 2015 Urban Water Management Plan 5-12 June 2016
81 San Diego County Water Authority Section 5. Member Agency Supplies Economic and Financial Considerations The capital-intensive cost of constructing recycled water projects and managing a dual distribution system has traditionally been a barrier to project implementation. The upfront capital costs for construction of treatment facilities and recycled water distribution systems can be high, while full market implementation is usually phased in over a number of years, resulting in very high initial unit costs that affect cash flow in the early project years. Some local agencies have been successful in expanding recycled water by requiring developers to install dual plumbed systems as new development infrastructure is built. Otay WD, Carlsbad MWD, and the City of San Diego have all been successful utilizing this approach. The high costs associated with converting existing water customers to non-potable recycled water use have also been challenging. This situation is compounded by the seasonal nature of recycled water demands, a lack of seasonal storage and the lack of large industrial water users in San Diego County that can use recycled water. Projects that serve a large portion of irrigation demands, like the majority of the projects in the Water Authority s service area, often use only half of their annual production capacity due to these seasonal demand patterns. The unit costs associated with these projects are generally higher than those of projects that serve year-round demands, since the project facilities must be sized to accommodate seasonal peaking. Projects that serve mostly irrigation demands also tend to have less stable revenue bases because irrigation demands are heavily influenced by hydrologic conditions. Recycled water is typically stored in storage tanks and ponds. Availability of seasonal and operational storage can help ensure a continuous demand and production of recycled water throughout the year, thus making projects more cost-effective. To be economically feasible, a project s benefits must offset or exceed its associated costs. Project benefits can take the form of (1) revenues from the sale of recycled water; (2) increased supply reliability; (3) increased control over the cost of future water supplies; and (4) avoided water and wastewater treatment, storage, and conveyance costs. Agencies developing recycled water projects must be able to quantify these benefits to determine the economic feasibility of a project. In addition, financial incentives and grant funding from federal and state agencies are critical to offsetting project costs and project implementation. Regulatory Two state agencies have primary responsibility for regulating the application and use of recycled water: the SWRCB DDW and the California Regional Water Quality Control Boards (Water Boards). As of July 1, 2014, the administration of the Drinking Water Program transferred from the California Department of Public Health (CDPH) to the SWRCB. That reorganization specifically created the new DDW. This transfer of responsibility aligned the state s drinking water and water quality programs in an integrated organizational structure that positioned the state to both protect water quality and the public health as related to water quality, while meeting current needs and future demands on water supplies. Planning and implementing water recycling projects entails numerous interactions with these regulatory agencies prior to project approval. DDW is responsible for establishing statewide criteria for recycled water uses in Title 22 of the California Administrative Code. Under Title 22, the standards are established for each general type of use based on the potential for human contact with recycled water. The highest degree of standards for recycled water is for unrestricted body contact. Final 2015 Urban Water Management Plan 5-13 June 2016
82 San Diego County Water Authority Section 5. Member Agency Supplies The San Diego Water Board is charged with issuing permits and enforcing requirements for the application and use of recycled water for each recycled operation, which ensures compliance with basin plan objectives and incorporates recommendations from DDW. As part of the permit application process, applicants must demonstrate that the proposed recycled water operation will meet the ground and surface water quality objectives in the basin management plan, and will comply with Title 22 requirements. With the consent of the recycled water supplier, the San Diego Water Board and DDW may delegate review of individual non-potable use sites to the County of San Diego Department of Environmental Health (DEH). Coordination between the regulatory agencies responsible for monitoring development of recycled water is important, along with the development of a reasonable and consistent application of regulations. Project proponents need to work closely and cooperatively with regulatory agencies in their efforts to satisfy the regulations and still be able to develop much needed, cost-effective water recycling projects. To address regulatory gaps, the Water Authority and its member agencies met with local regulators in 2012 to tackle some of these regulatory concerns. This resulted in the drafting and execution of Consent Agreements between the DEH (with consent from DDW) and the member agencies that helped to target and focus limited regulatory staff resources to new sites and higher risk, complicated recycled water sites. Ongoing oversight of recycled water sites deemed low risk is now handled internally by experienced, water agency staff. Cost savings and expedited recycled water hook-ups have resulted. More recently, Water Authority staff provided direct technical assistance to local agencies by coordinating ad-hoc committee meetings and drafting technical documents to assist agencies to expedite the approval and installation of hauled recycled water fill stations and use of hauled recycled water for the following recycled water uses: 1. Street sweeping and cleaning of sidewalks and outdoor work areas 2. Dust control, soil compaction, and construction 3. Sewer flushing 4. Pressure testing of newly constructed tertiary recycled water or sewer force main pipelines and gas pipelines 5. Use of recycled water for irrigation of commercial and residential landscapes, crops, and nursery stock 6. Fire protection Acting regionally has simplified and expedited local agencies efforts to offer their customers the option to use recycled water for these approved uses. This, in turn, has helped reduce demand on potable water systems. Institutional The primary institutional issue related to the development of water recycling in San Diego County is interagency coordination, such as when the wastewater agency that produces the recycled water is not the water purveyor within the reuse area. At those times, effective communication and cooperation between both agencies regarding the distribution of recycled water and providing service to the water customer are vital and should begin early in the planning process. Final 2015 Urban Water Management Plan 5-14 June 2016
83 San Diego County Water Authority Section 5. Member Agency Supplies These institutional arrangements require contracts and/or agreements between the parties and/or agencies involved, the terms of which must be established on a case-by-case basis. The agreements usually define the reporting and compliance responsibilities, the amount of recycled water deliveries, water pricing, and a financing plan that identifies which agency will receive the financial incentives. Many local entities in the San Diego region have responsibilities to provide both water and wastewater services. Where the water and wastewater agencies are not the same, close collaboration takes place for planning, permitting and operating recycled water facilities. These close relationships have helped to advance recycled water in the San Diego region. Public Acceptance Without public acceptance, siting, financing, constructing, and operating a water-recycling project becomes increasingly difficult. For many in the public, a general sense of water quality and safety concerns exists due to a lack of understanding regarding the water recycling treatment process. The most successful means to obtaining public acceptance is through education and involvement. Recent focus group findings indicate that the public is now more accepting of the safety and beneficial use of recycled water for non-potable uses, particularly during drought events Wastewater Generation, Collection, Treatment, and Disposal Approximately 200 MGD of wastewater is currently generated, collected, treated, and disposed of within the Water Authority s service area and provides significant potential for recycled water use. Most of the large wastewater treatment plants are located along the coast for easy and convenient access to an ocean outfall. These plants serve most of the San Diego region s highly urbanized areas. Figure 5-3 identifies the location of the wastewater treatment plants and the associated outfall systems. The coastal location of the plants is not always conducive to development of recycled water. Most of the market for recycled water is located at higher elevations, making distribution systems costly. However, recycled water costs could be offset by possible savings on wastewater treatment costs where those savings are available. Table F-3, Appendix F shows a detailed list of the wastewater treatment plants within the county, their capacities at various levels of treatment, and the type of disposal. In addition, according to the County of San Diego, approximately 10 to 15 MGD of wastewater within the Water Authority s service area is generated and disposed of through private systems, such as septic tanks. Final 2015 Urban Water Management Plan 5-15 June 2016

84 San Diego County Water Authority Section 5. Member Agency Supplies Figure 5-3 Wastewater Treatment and Water Recycling Facilities Final 2015 Urban Water Management Plan 5-16 June 2016
85 San Diego County Water Authority Section 5. Member Agency Supplies Encouraging Recycled Water Development The Act requires agencies to describe in their plan the actions, including financial incentives, that agencies may take to encourage the use of recycled water. Table 5-4 summarizes the existing funding programs used by the Water Authority s member agencies. Water and wastewater agencies develop some of the programs, while others are developed or funded by other water providers and agencies, such as the Water Authority, Metropolitan, and state and federal agencies. In addition to helping with funding, regional coordination on planning and regulatory issues can also reduce costs associated with development of recycled water. Table 5-4. Programs to Encourage Recycled Water Use Incentive Programs Local Water Supply Development (Water Authority existing executed agreements) Local Resources Program (Metropolitan existing executed agreements) On-site Retrofit Program provides financial incentives directly to public or private property owners to convert potable water irrigation or industrial water systems to recycled water service. (Metropolitan) Grants Title XVI Funding Program (U.S. Bureau of Reclamation) Recycled Water Retrofit Assistance Program provides grant funding assistance for site retrofits and construction costs to increase recycled water use. (administered by Water Authority, funded through Proposition 50 grant funding, State of California) Proposition 84 Planning Grants and Implementation (State of California) Low Interest Loans Clean Water State Revolving Fund Program (State of California) Long-Term Contracts to Ensure Price and Reliability Funding Assistance to State Water Resources Control Board to fund staff position(s) to expedite water recycling projects (Water Authority) Regional Planning and Regulatory Assistance Regional coordination with member agencies and regulatory agencies such as the San Diego Regional Board, Division of Drinking Water, and the San Diego County Department of Environmental Health on recycled water issues Initiate, review, and comment on statewide regulatory developments and legislation to support local projects Preparation of guidelines and Engineering reports in conjunction with member agencies, such as Recycled Water Fill Stations Funding Programs Another important component of a successful recycling project is securing diversified funding and establishing funding partnerships. The Water Authority has focused on providing and facilitating the acquisition of outside funding for water recycling projects. Financial assistance programs that have been utilized by San Diego County agencies include the Water Authority's Local Water Supply Development Program, Metropolitan s Local Resources Program, the U.S. Bureau of Reclamation Title XVI Grant Program, the SWRCB low-interest loan programs and the IRWM Plan Grant Program. Together, these programs offer funding assistance for all project phases, from initial planning and design, to construction and operation. Financial Final 2015 Urban Water Management Plan 5-17 June 2016
86 San Diego County Water Authority Section 5. Member Agency Supplies assistance programs administered by the Water Authority and Metropolitan have provided $7.7 million to San Diego County agencies during fiscal year Local Water Supply Development Program The Water Authority administers the Local Water Supply Development (LWSD) Program (formerly referred to as the Recycled Water Development Fund Program initially adopted by the Board in April 1991), which is designed to ensure the financial feasibility of local water recycling projects during their initial years of operation. To date, the Water Authority has entered into LWSD agreements with 11 water and wastewater agencies for a combined project yield of over 30,000 AF/YR. Over $40 million in Water Authority incentive funding has been awarded to program participants. In fiscal year 2015, the Water Authority provided local agencies with $3.7 million in LWSD incentives for agencies with existing executed agreements. The Reclamation Wastewater and Groundwater Study and Facilities Act Title XVI Since 1995, the Title XVI Grant Program has been a significant source of funding for San Diego area water recycling projects. Title XVI of PL , the Reclamation Wastewater and Groundwater Study and Facilities Act, authorized the federal government to fund up to 25 percent of the capital cost of authorized recycling projects, including the San Diego Area Water Reclamation Program, an inter-connected system of recycling projects serving the Metropolitan Sewage System service area. PL , the Reclamation Recycling and Water Conservation Act of 1996, authorized two additional projects in northern San Diego County: the North San Diego County Area Water Recycling Project and the Mission Basin Brackish Groundwater Desalting Demonstration Project. The North San Diego County project received its final federal funding in 2008 when it reached its maximum federal funding limit of $20 million. The City of Oceanside s Mission Basin project was also completed and received final funding totaling $3,484,000. To date, San Diego agencies have been authorized to receive more than $110.8 million under the Title XVI grant program. The funding mechanism for the San Diego area projects (and all other authorized Title XVI projects) was changed from direct appropriations to a competitive process that requires applications to be submitted in response to an annual Funding Opportunity Announcement (FOA). In June 2016, Sweetwater Authority was successful for the third time in obtaining Title XVI grant funding for their Richard A. Reynolds Groundwater Desalination Facility expansion project. Under the San Diego Area Water Reclamation Program, Sweetwater Authority was awarded $3.7 million in Title XVI grant funding for their expansion project; the City of San Diego was awarded $5 million for their Pure Water San Diego Program; and Padre Dam MWD was awarded $4.5 million for their Water Recycling Facilities Phase 1 Project Expansion. Clean Water State Revolving Fund/Water Recycling Grants The SWRCB, through the Division of Financial Assistance, offers low interest financing agreements for water quality projects and water reclamation facilities. For fiscal years 2014 and 2015, the SWRCB made 33 binding commitments totaling over $789 million in low cost financing to eligible projects. The Clean Water State Revolving Fund offers agencies a below-market interest rate that can result in substantial savings on debt service. Approximately $69 million was appropriated to the SWRCB in fiscal year 2016 for funding water recycling projects. An example of funding awarded to one of the Water Authority s member agencies is a $29.5 million funding commitment to the Carlsbad MWD for advanced treatment, storage, and recycled water distribution costs. Additional construction funding can be obtained through Water Recycling Grants that provide up to 35 percent of actual eligible construction costs incurred up to a maximum of $15 million, including construction Final 2015 Urban Water Management Plan 5-18 June 2016
87 San Diego County Water Authority Section 5. Member Agency Supplies allowances. Planning grants of up to $75,000 maximum are also provided for eligible facilities planning/feasibility study costs. Integrated Regional Water Management Plan Grant Funding: Propositions 50 and 84 In 2007, the San Diego IRWM program submitted a grant proposal to DWR for Proposition 50 grant funds and was awarded $25 million in grant funding. Section 8 describes the IRWM program in more detail. Operation of the Recycled Water Retrofit Assistance Program, managed and administered by Water Authority staff on behalf of its member agencies, continues to provide Proposition 50 grant funding to the Water Authority s member agencies and their customers. Project grant funding facilitated the retrofitting of user sites to receive recycled water and provided direct funding to water and wastewater agencies to make the required alterations and distribution system expansions to bring recycled water to their respective customer base. In 2011, the San Diego IRWM program was awarded $7.9 million in Proposition 84 Round 1 grant funds. One of the projects funded through this source was the Phase I North San Diego County Regional Recycled Water Project (NSDCRRWP). This project is an effort by North San Diego County water and wastewater agencies to regionalize recycled water systems by identifying new agency interconnections, seasonal storage opportunities, and indirect potable water use that would maximize supplies, reduce wastewater discharges to the ocean, reduce energy consumption due to diminished delivery of imported water, and allow recycled water to play an even more significant role in meeting the region s future water needs. This project involved the support of many partners, including the Olivenhain MWD, Carlsbad MWD, Vallecitos WD, Santa Fe ID, City of Oceanside, Leucadia WD, City of Vista/Buena Sanitation District, San Elijo Joint Powers Authority, City of Escondido, and Rincon del Diablo MWD. In 2013, the San Diego IRWM program was awarded approximately $10 million in grant funds made available through Proposition 84 Round 2. One of the selected projects helped to implement the 10 priority sub-projects identified in Phase I of the NSDCRRWP. The Phase II NSDCRRWP helped to increase connectivity between recycled water facilities in north San Diego County. This effort increased the use of recycled water by allowing it to be distributed across the North County region, and produced an estimated 6,790 AF/YR of recycled water. Project benefits included reducing imported water dependency, reducing discharge of recycled water to the ocean, reducing energy consumption from pumping imported water, and providing more recycled water for future water needs. The agencies involved with this effort were the Leucadia Wastewater District, Vallecitos WD, Vista ID, Rincon del Diablo MWD, Olivenhain MWD, Santa Fe ID, Carlsbad MWD, the City of Escondido, the City of Oceanside, and the San Elijo Joint Powers Authority. Grant funding totals are listed in Table Optimizing the Use of Recycled Water Regional Coordination In support of the SWRCB call for salinity and nutrient planning, the Water Authority, in cooperation with the Southern California Salinity Coalition (SCSC), worked in partnership with the San Diego Water Board staff to develop guidelines for the development of salt and nutrient management plans. The SWRCB Recycled Water Policy (Recycled Water Policy) encouraged a stakeholder-driven process for the development of plans for the management of salt and nutrients on a basin-wide basis, as opposed to an individual discharge permit level. The San Diego region was unique in that the planning process encompassed 17 fairly small groundwater basins with varying levels of use and variable water quality. Consistent with the Recycled Water Policy, the SCSC and the Water Authority Final 2015 Urban Water Management Plan 5-19 June 2016
88 San Diego County Water Authority Section 5. Member Agency Supplies worked with local stakeholders and San Diego Water Board staff to develop agreed-upon guidelines for development of salt and nutrient management plans within the region. Table Recycled Water Grant Sources Proposition 50 Ray Stoyer Water Recycling Facility Demo. Plant for AWT Recycled Water Retrofit Assistance Program Recycled Water Distribution System Expansion Proposition 84 Round 1 North San Diego County Regional Recycled Water Project North San Diego County Demineralization Project Proposition 84 Round 2 No. S. D. County Regional Recycled Water Project Phase II Failsafe Potable Reuse at the Advanced Water Purification Facility Proposition 84 Drought Round Fallbrook Plant Nurseries Recycled Water System Expansion Carlsbad Recycled Water Plant and Distribution System Proposition 84 Final Round Padre Dam AWT Phase I Expansion Safari Park Drought Response and Outreach Integrated Water Resource Solutions for the Carlsbad Watershed Escondido AWT for Agriculture UC San Diego Water Conservation and Watershed Protection Project Lead Agency Padre Dam MWD SDCWA City of San Diego Olivenhain MWD San Elijo JPA Olivenhain MWD WateReuse Research Foundation Fallbrook PUD Carlsbad MWD Padre Dam MWD Zoological Society of San Diego San Elijo JPA City of Escondido UC San Diego Grant Award $3,000,000 $800,000 $4,765,146 $1,455,000 $1,018,500 $3,452,000 $2,113,000 $772,000 $4,000,000 $6,000,000 $2,900,000 $2,500,000 $2,000,000 $1,435,000 TOTAL $36,210,646 AWT = advanced water treatment; ID = Irrigation District; JPA = Joint Powers Authority; MWD = Municipal Water District; PUD = Public Utility District The guidelines established priorities and recommended levels of effort for the plans depending on the size and importance of each basin within the region. Other key components of the guidelines were the recommended technical approaches for completing the salt and nutrient management plans and suggested strategies for managing salts. These guidelines were supported by both the stakeholders and the Water Board staff. The final guidelines were endorsed by the San Diego Water Board through a resolution adopted at their November 2010 board meeting. The agreement between the Water Board and local stakeholders provided regulatory certainty for stakeholders and helped expedite the development of these plans within the region. Also with support from the San Diego Water Board, IRWM grant funding was secured to help fund the development of five local salt and nutrient management plans. The following water agencies were awarded Proposition 84 grant funding and developed salt and nutrient management plans for the following basins: Final 2015 Urban Water Management Plan 5-20 June 2016
89 San Diego County Water Authority Section 5. Member Agency Supplies City of San Diego for the Hodges/San Pasqual Basin Padre Dam MWD for the Santee Basin Rincon del Diablo MWD for the Escondido Basin Fallbrook PUD for the Middle Santa Margarita Basin Ramona MWD for the San Vicente/Gower Basin Of the basins listed above, three fell under the higher-priority Tier A basin category as defined in the Salt and Nutrient Management Plan Guidelines. One fell under Tier B, and another was listed as a Tier C basin. The salt and nutrient management plans were completed and submitted to the State of California in October The implementation of these plans will improve overall water quality and use of groundwater resources within the San Diego region Projected Recycled Water Use The Water Authority worked closely with its member agencies to determine the projected yield from existing and planned recycled water projects. Table 5-5 shows the estimated annual yield from the projects in five-year increments based on the implementation schedules provided by the member agencies and the likelihood of development. These projected supply yields will be included in the reliability analysis found in Section 9, Water Supply Reliability. Table F-4, Appendix F contains a detailed list of the projects and projected supplies. Table 5-5. Projected Recycled Water Use (Normal Year AF/YR) ,095 40,459 43,674 45,758 46,118 46,858 The Water Authority s 2010 Plan projected a verifiable water yield of 38,660 AF/YR in the year As shown in Table 5-5 above, the projected normal year yield for 2015 is 29,095 AF/YR. The increase in projected recycled water use shown in Table 5-5 in 2020 and beyond is primarily from the expansion of existing facilities. For example, the City of Oceanside is in the process of expanding their current recycled water system with a tertiary treatment capacity expansion of 0.8 MGD at the San Luis Rey Water Reclamation Facility (SLRWRF) in addition to the construction of a 1.5-MGD tertiary treatment train, existing pump station upgrades, construction of a 1-million-gallon recycled water reservoir, and construction of over 4,500 linear feet of recycled water pipeline to serve approximately 3,500 AF/YR of recycled water demand. Another San Diego North County agency, the Carlsbad MWD, will be expanding its water recycling facility s capacity to 7 MGD from its current 4 MGD, a 75 percent capacity increase. The expansion project includes adding 18 miles of new pipe to the existing recycled water distribution system for irrigation and other non-drinking purposes, and building a new 1.5-million-gallon reservoir for recycled water storage. It is projected that, by 2020, one-third of the City of Carlsbad s total water supplies will be recycled water. Recycled water development helps relieve pressure on the region s potable water supplies by providing a drought-proof, locally controlled water supply source. Final 2015 Urban Water Management Plan 5-21 June 2016
90 San Diego County Water Authority Section 5. Member Agency Supplies Further, the City of Escondido s Advanced Water Treatment for Agriculture project, funded under Proposition 84, will construct a new microfiltration/reverse osmosis (MFRO) advanced treatment facility with a total production capacity of 2.0 MGD. Water treated at the MFRO facility will be blended with tertiary treated water from an existing recycled water plant and distributed to agricultural customers in the northern and eastern areas of Escondido. The City of Escondido has partnered with Escondido Growers for Agricultural Preservation, Vista ID, City of San Diego, and Rincon del Diablo MWD to implement this project. This project supports the San Diego region s goals of supply reliability and sustainability, and protects water quality while supporting local agriculture and the economy. Additional Planned Projects Recycled Water Maximizing recycled water development is critical to diversifying the region s water supply portfolio. Beyond the verifiable project yields included in Table 5-5 above, member agencies have also identified additional planned projects. Aside from the Carlsbad MWD and City of Escondido projects described above, Padre Dam MWD, MCB Camp Pendleton, and Santa Fe ID have identified additional planned projects that are projected to yield an additional 2,468 AF/YR by These yields are considered additional planned supplies and are utilized in Section 10, Scenario Planning Managing an Uncertain Future. These additional planned projects, as well as the conceptual projects provided by the member agencies, are also included in Table F-4, Appendix F. 5.5 Potable Reuse Background and Description Recycled water can be further treated for potable reuse through the use of multi-barrier advanced purification treatment processes, which may include technologies such as reverse osmosis and advanced oxidation. The advanced treated water may be passed through a natural barrier, such as a groundwater basin or surface water reservoir, and provided with additional treatment to render wastewater suitable for potable purposes. Projects that include a natural barrier are considered indirect potable reuse. Projects that deliver advanced treated water directly to a raw or treated water pipeline are considered direct potable reuse. Several Water Authority member agencies are completing studies pertaining to potable reuse in San Diego County through groundwater recharge or reservoir augmentation. Two agencies, the City of San Diego and the Padre Dam MWD, have implemented pilot projects to determine potable reuse project viability. Detailed member agency project information can be found in Section Currently, numerous drivers make potable reuse an attractive option not only for the San Diego region, but for the state of California as well. Climate change is creating unpredictable weather patterns, which may result in recurring droughts and cause scarcity of water supply. Potable reuse is a renewable resource, which can provide a cost-effective and sustainable, high-quality water supply. Being able to maximize the use of all recycled water can reduce the impacts and costs associated with discharging waste to the ocean. De facto or incidental reuse has taken place for many years as wastes are discharged to rivers and collected and treated for potable water supplies downstream. Clean Water Act standards placed on waste discharges and treatment requirements for water suppliers through the Safe Drinking Water Act have been designed to avoid waterborne disease Final 2015 Urban Water Management Plan 5-22 June 2016
91 San Diego County Water Authority Section 5. Member Agency Supplies outbreaks and to ensure a safe and reliable potable water supply for customers. These requirements protect the public from waterborne disease outbreaks and health impacts from chemical constituents and emerging compounds. The longest standing groundwater recharge project in California has been in existence since Recycled water may be percolated through into the groundwater, or highly treated water can be directly injected into the groundwater basin. Locally, potable reuse was first considered in the early and mid-1990s. The Water Authority and the City of San Diego proposed a potable reuse project that would deliver advanced treated water from the North City Water Reclamation Plant and convey it to San Vicente Reservoir where it would blend with imported and local surface water prior to being treated at a surface water treatment plant. The Water Authority created a citizens advisory group to advise the Water Authority on the suitability of potable reuse as a water supply for San Diego County. In 1994, the Repurified Water Review Committee recommended that potable reuse be pursued as part of a diversified mix of water supplies. The Water Authority sponsored the work of an Independent Advisory Panel of experts for indirect potable reuse and, along with the City of San Diego, conducted detailed studies that were submitted to state health authorities to determine regulatory guidelines for an indirect potable reuse project blending advanced treated recycled water in San Vicente Reservoir. The CDPH approved this concept of reservoir augmentation in 1996, but no reservoir augmentation project has been built in San Diego or other parts of California. In 1998, the Water Authority co-funded a report by the National Research Council on Issues in Potable Reuse: The Viability of Augmenting Drinking Water Supplies with Reclaimed Water, which concluded that planned indirect potable reuse was a viable option. In 2006, the City of San Diego again began planning for a potable reuse project and, in 2012, CDPH and the San Diego Water Board conceptually approved the City of San Diego s proposed indirect potable reuse project for surface water augmentation through San Vicente Reservoir. The SWRCB DDW, formerly CDPH, has the authority to permit direct potable reuse projects, but no projects have been proposed or approved in California. Two direct potable reuse projects have been approved in Texas in response to extreme drought conditions and were placed into operation. The many years of advanced research concerning potable reuse in California and elsewhere have proven that reliable technology is now available to allow agencies to consider direct potable reuse as a potentially viable and acceptable treatment option. A direct potable reuse treatment scheme, if approved by DDW, will permit water suppliers in San Diego to maximize the use of existing infrastructure and produce a new, safe, and viable potable water supply for the San Diego region. As water supplies become scarcer, particularly in the arid west, more such projects will likely be proposed. Economic and Financial Considerations Potable reuse projects are being considered when they are deemed more cost-effective and feasible than non-potable recycled water projects. Potable reuse projects have an advantage as they do not require construction of a dual distribution system, and once treatment and conveyance facilities have been constructed, the full amount of water produced can be immediately available to augment local water supplies. Costs for potable reuse are in range with other locally developed supplies. An added cost advantage may result as a potable reuse project may also contribute to meeting waste discharge requirements. Cost of conveyance to move advanced treated water to a local reservoir can be a significant component of a project cost. If the advanced treated water can be delivered to a reservoir closer to the point of production, it can significantly reduce project costs. Regulatory requirements on which reservoirs can be used, and whether direct potable reuse can be permitted by the regulatory agencies, will have a significant impact on overall project costs. Final 2015 Urban Water Management Plan 5-23 June 2016
92 San Diego County Water Authority Section 5. Member Agency Supplies Institutional The institutional arrangements between wastewater agencies and water suppliers for potable reuse projects in the region will be similar to those for recycled water, as described in Section An additional factor to consider will be the ongoing coordination between operators of advanced treatment facilities and the operators of local surface water treatment facilities for projects with a downstream surface water treatment plant. Increased coordination will be required to ensure a safe reliable drinking water supply. Public Acceptance Like recycled water, public acceptance for potable reuse projects is critical for the success of the project. Potable reuse projects are under a high level of public scrutiny to ensure the safety of the drinking water supply. While the technology for potable reuse projects has been proven, these projects must garner public acceptance. In the San Diego region, project proponents have done a significant level of public outreach for potable reuse projects. Tours of demonstration facilities, such as those constructed by the City of San Diego and Padre Dam MWD, have proven highly successful in educating the public on the safety of the product water. Polls in the San Diego region have demonstrated increasing public acceptance of potable reuse as a safe water supply. The Water Authority has worked with the member agencies through the Potable Reuse Coordination Committee to coordinate and develop common language and messaging to be used throughout the region. This ad-hoc committee, consisting of regional agencies interested in developing and promoting potable reuse projects, meets on an as needed basis to engage and keep the member agencies informed on the latest potable reuse regulatory, legislative, and stakeholder outreach efforts at the local and state levels. Legislative and Regulatory Legislative Requirements to Develop Potable Reuse Regulations Potable reuse projects require a high level of regulatory scrutiny and are currently approved on a case-by-case basis. Historically, an expert panel has been convened to look at project specifics and provide recommendations to the project proponent and DDW. While all projects will build on the knowledge and efforts obtained through past indirect potable reuse projects, local reservoir augmentation projects are anticipated as the first to be approved in California. The California Legislature passed SB 918 in 2010 and SB 322 in 2013, legislation sponsored and actively supported by the Water Authority, which expedited specific regulations for indirect potable reuse surface water augmentation. This legislation also sought acknowledgement by the State of California that direct potable reuse was a viable water supply option. Specifically, the bills directed the CDPH to: 1. Adopt regulations for indirect potable reuse through groundwater recharge by December 31, 2013 (later moved to July 1, 2014). 2. Form an expert panel to provide recommendations to DDW on the surface water augmentation regulations and feasibility of direct potable reuse. 3. Form a public advisory group representing diverse water supply, environmental, and business interests to provide input to the expert panel on issues related to direct potable reuse, with all of the public advisory group meetings to be open and transparent public meetings. 4. Adopt regulations for surface water (reservoir) augmentation by December 31, Final 2015 Urban Water Management Plan 5-24 June 2016
93 San Diego County Water Authority Section 5. Member Agency Supplies 5. Report to the legislature by December 31, 2016, on the ability to adopt regulations for direct potable reuse. Development of Potable Reuse Regulations In June 2014, CDPH adopted regulatory criteria for approval of groundwater recharge projects. SB 322 was critical in helping move the evaluation of direct potable reuse forward in a timely manner in California. In February 2014, CDPH formed the Public Advisory Group, which has met regularly. The City of San Diego and Padre Dam MWD are represented on the Public Advisory Group as well as other San Diego interests. In its first meeting, the Public Advisory Group provided recommendations to DDW on the formation of an Expert Panel to provide recommendations on technical issues related to surface water augmentation criteria and the feasibility of adopting regulations for potable reuse. The Expert Panel consists of 12 experts in the fields of toxicology, wastewater treatment, drinking water supplies treatment, drinking water standards, epidemiology, limnology, microbiology, and chemistry. The Public Advisory Group has weighed in on developing common terminology to describe potable reuse and the need and approach for having certified and qualified operators for advanced treatment facilities. The Advisory Group has also expressed interest in economic impacts and viability of implementing potable reuse as well as public health concerns, including emerging contaminants, and will raise issues of public interest that may need to be addressed by the Expert Panel. The Advisory Group has also discussed concerns on how DDW may delineate between surface water augmentation and direct potable reuse. As the State of California develops criteria for surface water augmentation, projects using multi-purpose and smaller reservoirs could be considered direct potable reuse. The Expert Panel has also been meeting regularly since The Expert Panel has considered the proposed research agenda of the WateReuse Research Foundation and provided recommendations to DDW regarding possible research gaps. DDW presented for consideration a proposed framework for surface water augmentation, the focus of which will be on multiple treatment barriers for removal of pathogens and chemical constituents and approaches for ensuring the reliable monitoring and operation of the treatment processes. To minimize the need for a case-by-case review of projects, the surface water augmentation criteria should provide for flexibility in the range of reservoir size and configuration that may be acceptable for surface water augmentation projects. The Expert Panel will also develop a white paper with a list of issues as it relates to direct potable reuse. Concepts regarding direct potable reuse are similar to the framework for surface water augmentation with an increased emphasis on reliability, including monitoring, operator qualifications, and response to treatment failures. Permitting of Potable Reuse Projects Potable reuse projects require close collaboration between the San Diego Water Board and DDW. Local groundwater recharge projects are permitted by the San Diego Water Board under reclamation criteria or waste discharge requirements. The Water Board will incorporate recommendations from DDW to ensure the protection of public health. Groundwater projects will conform to the groundwater recharge criteria. Local surface water augmentation projects will be permitted by the San Diego Water Board for the discharge into local reservoirs. For any discharge to waters of the United States, a discharge permit meeting federal Clean Water Act requirements is required. The new advanced treated supply will Final 2015 Urban Water Management Plan 5-25 June 2016
94 San Diego County Water Authority Section 5. Member Agency Supplies also be permitted by DDW as a drinking water supply under the Safe Drinking Water Act. While no direct potable reuse projects have been permitted in California, it is expected that these projects, if delivered directly to a piped system, would be permitted by DDW as a drinking water supply. Projects not falling within an existing set of regulations may be reviewed by DDW and the San Diego Water Board on a case-by-case basis. Projects determined protective of public health and the environment would be issued the appropriate permits. Importance of Science-Based Regulations The primary obligation of all drinking water suppliers is to protect public health. Regulations and transparency of information ensure that drinking water is safe and that information is available to the public to instill confidence that the public s health is protected. Any potable reuse project will be required to achieve the same high standard of public health protection as any other drinking water supply. Because of the high standard involved in protecting public health and the extensive use of treatment technology to meet drinking water standards for potable reuse, science-based research is essential to the regulatory development process and to instilling public confidence. The Water Authority has been active in promoting the importance of research in regulation development. In 2012, the WateReuse Association and the WateReuse Research Foundation launched a potable reuse initiative and raised over $6 million to fund the research necessary to overcome any regulatory, scientific, technical and public perception barriers to potable reuse. The San Diego region has been a strong supporter of the direct potable reuse initiative. The Water Authority and several member agencies have directly contributed to this effort. An additional $2.113 million through the San Diego IRWM Program and DWR will fund the WateReuse Research Foundation s Failsafe Potable Reuse at the Advanced Water Purification Facility project. The Water Authority supports this effort through its management of the San Diego IRWM grant program. WateReuse Research Foundation project research will be an important part of the State of California s development of indirect and potentially direct potable reuse regulations, and will provide objective, science-based information for the public to understand the levels of protection and safety that contribute to developing this important new water supply. Funding of Potable Reuse Projects The primary sources of outside funding available for potable reuse projects include Title XVI, Clean Water State Revolving Funds, and IRWM. These funding sources are described in more detail in Section Propositions 50 and 84 have already provided support for potable reuse through the San Diego IRWM by funding the City of San Diego s water purification demonstration project, Padre Dam MWD s potable reuse demonstration project, and the WateReuse Failsafe Potable Reuse Project. These projects provided the research necessary to move potable reuse forward in the San Diego region and in California. Proposition 84 will also provide funding for the Padre Dam Phase IA recycled water treatment plant expansion, which will increase supply available for potable reuse projects Water Authority Activities in Support of Potable Reuse The Water Authority has been a staunch supporter and an active participant in advancing the goal of implementing potable reuse in San Diego County for over 20 years. The more recent focus of the Water Authority s efforts to advance potable reuse has been through advocacy for legislation and regulations that move projects forward in the near term. Water Authority staff has been Final 2015 Urban Water Management Plan 5-26 June 2016
95 San Diego County Water Authority Section 5. Member Agency Supplies prominently involved through participation in the WateReuse Association Potable Reuse Task Force and the WateReuse Legislative and Regulatory Committee, and though other regulatory advocacy venues, including attending and providing comments at Expert Panel meetings by advocating and supporting member agency interests. The Water Authority has also been able to track trends in public acceptance of recycled water through its public opinion survey. This effort provides a foundation for member agency outreach and measures the effectiveness of those outreach efforts. In 2012, 71 percent of respondents believed that it was possible to further treat recycled water used for irrigation to make the water pure and safe for drinking. This was an increase over the 2011 survey findings where 66 percent of respondents felt that it is possible to further treat recycled water for drinking purposes. However, both the 2011 and 2012 survey results represent a substantial increase over the 2009 survey response where just 53 percent thought it was possible. Water Authority staff has been supporting member agencies in three key areas: public outreach and messaging, engaging with regulatory agencies and the Expert Panel, and helping secure funding for local projects. While member agencies will lead the development of their own specific projects, the need continues for regional coordination and collaboration on potable reuse issues. Water Authority staff will continue to engage with member agencies and DDW to ensure that the regulatory framework developed by DDW and reviewed by the Expert Panel considers the wide range of approaches expected as part of member agency projects. In addition, Water Authority staff has supported member agencies by actively engaging in public outreach in support of member agency projects. This support has included: 1. Coordinate with member agencies through the Joint Public Information Committee to develop common outreach messaging that will support potable reuse projects. 2. Coordinate with the member agencies through the Potable Reuse Coordination Committee. 3. Outreach to the general public to increase public acceptance of potable reuse through presentations, development of handout materials for public outreach events and use by the member agencies, and sharing of information through the Water Authority s website. 4. Communicate with regional, local, state, and federal elected officials on the importance of potable reuse for the San Diego region to gain support for potable reuse. 5. Communicate with SWRCB members and staff on the safety and importance of potable reuse. 6. Collaborate with other organizations that support potable reuse including WateReuse, the Water Reliability Coalition, and state and local environmental groups on common outreach to support potable reuse. 7. Advocate at the state and local level for reasonable regulations that will support the safe use of recycled water for local potable reuse projects Projected Supply through Potable Reuse The Water Authority worked closely with its member agencies to determine the projected yield from existing and planned potable water reuse projects. Table 5-6 shows the estimated verifiable annual yield from the projects in five-year increments based on the implementation schedules provided by the member agencies and the likelihood of development. These projected supply yields Final 2015 Urban Water Management Plan 5-27 June 2016
96 San Diego County Water Authority Section 5. Member Agency Supplies will be included in the reliability analysis found in Section 9, Water Supply Reliability. Appendix F Table F-5 contains a detailed list of the projects and projected supplies. Table 5-6. Projected Potable Reuse Water Use (Normal Year AF/YR) ,300 3,300 3,300 3,300 3,300 The increase in projected potable reuse shown in Table 5-6 in 2025 and beyond is primarily from new, proposed facilities. The City of Oceanside completed the investigative phase of their Indirect Potable Reuse Project to enhance water supply reliability. This will involve the recharging of the Mission Groundwater Basin using water treated at the SLRWRF. This project will utilize advanced treated recycled water for subsurface and surface replenishment supplied through the advanced water treatment facility. The Phase I Project includes the construction of a 3-MGD capacity AWT facility, three injection wells, and a separate conveyance pipeline to the injection wells, which will result in the production of 3,300 AF/YR to be used for groundwater injection. Phase II consists of adding 1,700 AF/YR of advanced treated water for surface spreading at two water basins. This will necessitate increasing the capacity of the AWT facility to accommodate this additional supply for a final capacity of 4.5 MGD, which will provide an ultimate yield of 3,300 AF/YR of groundwater recharge. Both Project Phases 1 and 2 will require the construction of monitoring wells. It is expected that the City of Oceanside s Indirect Potable Reuse Project will be operational in Additional Planned Potable Reuse Projects As part of the City of San Diego s effort to provide a local and sustainable water supply, the City of San Diego s Water Purification Demonstration Project (WPDP) examined the use of advanced water purification technology to provide a safe and reliable water supply, and determined if reservoir augmentation using this purified water was a feasible option for San Diego. The WPDP concluded in The information collected via various studies and the results of the WPDP determined that it was feasible for San Diego to use water purification technology. Pure Water San Diego, the City's phased, multi-year program to produce purified water to supplement San Diego's drinking water supply, is scheduled to be operational by The longterm goal, producing 83 million gallons of purified water per day (one-third of San Diego's future drinking water supply), is scheduled for All phases of the City s Pure Water San Diego program are considered additional planned projects. The East County Advanced Water Purification Program Planning Study was partially grant funded and addressed the elements of the Recycled Water Facilities Planning Report outline provided by the SWRCB. The study evaluated the potential for expanding Title 22 tertiary recycled water for irrigation and developing potable reuse within the study area that included the following four agencies: Padre Dam MWD, Helix WD, the County of San Diego, and the City of El Cajon. The objectives of the East County Regional Potable Reuse Program were as follows: 1. Increase the reliability of water supply by increasing the use of recycled water as a local water supply and decreasing reliance on imported water. Final 2015 Urban Water Management Plan 5-28 June 2016
97 San Diego County Water Authority Section 5. Member Agency Supplies 2. Minimize the financial impacts from the projected increase in wastewater treatment costs by Metropolitan. 3. Create a new, local, reliable and drought proof drinking water supply. 4. Produce 25 to 30 percent of East Count s drinking water supply. 5. Repurpose water treatment byproducts for beneficial use, including electricity generation and dust control. 6. Sustain East County s economy and quality of life. Phases 1 and 2 of the East County Advanced Water Purification Program are considered additional planned projects. Potable reuse will require full advanced treatment in addition to conventional wastewater treatment by microfiltration, reverse osmosis, ultraviolet disinfection, and advanced oxidation process, which is similar to treatment provided in Orange County. Further treatment using free chlorine to produce advanced water treatment water is also planned. The addition of free chlorine provides supplemental log removal to meet DDW requirements that allow a reduction in the environmental buffer, meaning reduced travel time requirements. In March 2015, Padre Dam opened the Advanced Water Purification Demonstration Facility, which uses a four-step water purification process to treat recycled water using state-of-the-art technologies. Since its opening, this pilot facility has produced approximately 100,000 gallons of purified water each day for testing purposes to ensure it meets the public health objectives to earn approval from the SWRCB s DDW. The water purified at the facility is not currently being distributed as drinking water. Conceptual Potable Reuse Projects The East County Advanced Water Purification Program Planning Study described above also evaluated the feasibility to treat all wastewater generated by Padre Dam MWD, the County, and El Cajon using full advanced treatment at the proposed East County Advanced Water Purification Facility before being injected into the Santee Groundwater Basin or used to augment surface water at Lake Jennings. For surface water augmentation at Lake Jennings, AWT water would be blended with a mixture of imported surface water and local runoff in Lake Jennings before it is treated at Helix WD s R. M. Levy Water Treatment Plant. Effluent will be split between Helix WD and Padre Dam MWD with percentages to be determined in the future, should Helix WD decide to participate in the project beyond the current study s planning. This Phase 3 project is considered a conceptual project. Additional conceptual projects include the City of Escondido, which is planning to expand its nonpotable water recycling program to include additional landscaping and agricultural irrigation, and incorporation of a future indirect potable reuse element. Escondido is pursuing this dual path for water supply reliability and to avoid the cost of a future ocean outfall expansion associated with its discharge of secondary treated wastewater. The Escondido City Council has approved exploring this project alternative and has incorporated this approach into their long-range financial planning. Final 2015 Urban Water Management Plan 5-29 June 2016
98 San Diego County Water Authority Section 5. Member Agency Supplies 5.6 Member Agency Seawater Desalination Carlsbad Desalination Plant In June 2011, the Water Authority Board of Directors adopted guiding principles for the Water Authority to make available to its member agencies up to 49 percent of the Minimum Annual Demand Commitment (48,000 AF) and provide the opportunity for member agencies to enter into uniform contracts to make firm commitments to individually purchase from the Water Authority treated water in designated amounts that represent a portion of the Minimum Annual Demand Commitment. Vallecitos WD and Carlsbad MWD both entered into contracts with the Water Authority to purchase desalinated water. Beginning in July 2016, Vallecitos WD and Carlsbad MWD will purchase 3,500 and 2,500 AF/YR, respectively, for a full contract year, representing a total of 6,000 AF of member agency seawater desalination water supply annually Rosarito Beach Desalination Project, Otay Water District The Otay Rosarito Beach Desalination Project is not considered a verifiable supply and is therefore not included in the reliability assessment in Section 9. The Otay WD project is considered an additional planned project and is presented in Section 10 as a potential strategy to manage future uncertainty planning scenarios. Plans are underway to develop a seawater desalination facility in Rosarito Beach by a private company, Consolidated Water Co. Ltd. This bi-national project would produce up to 100 MGD for potential distribution to the federal and/or state agencies serving the Rosarito and Tijuana areas, and to the Otay WD. The district has sought a presidential permit to build a cross-border pipeline to carry up to 50 MGD from Mexico into its service area, which is currently awaiting approval. Final 2015 Urban Water Management Plan 5-30 June 2016

99 Section 6 Metropolitan Water District of Southern California 6.1 Description The Water Authority s imported water sources include purchases from Metropolitan. Metropolitan was formed in 1928 to develop, store and distribute supplemental water in Southern California for domestic and municipal purposes. Metropolitan supplies water to approximately 19 million people in a service area that includes portions of Ventura, Los Angeles, Orange, San Bernardino, Riverside, and San Diego counties. The Metropolitan service area, shown in Figure 6-1, covers a 70-mile-wide strip of the Southern California coastal plain, extending from the city of Oxnard on the north to the Mexican border. Close to half of the water used in this 5,200-square-mile region is supplied by Metropolitan, and about 90 percent of its population receives at least some of its water from Metropolitan. The Water Authority, one of 26 Metropolitan member agencies, is historically the largest in terms of purchases, purchasing 360,018 AF, or about 21 percent, of all the water Metropolitan delivered in fiscal year The extent to which Metropolitan's member agencies rely upon Metropolitan supplies varies by the amount of local supplies available or each agency s own reliability goals. Water Authority demands on Metropolitan, provided by Metropolitan, can be found in Appendix I. Figure 6-1 Metropolitan Service Area Final 2015 Urban Water Management Plan 6-1 June 2016
100 San Diego County Water Authority Section 6. Metropolitan Water District of Southern California Metropolitan Act Section 135 Preferential Right to Water Under Section 135 of the Metropolitan Act, each member agency has a preferential right to Metropolitan purchases. The Metropolitan Act stipulates that member agencies preferential rights to Metropolitan water are proportional to their respective total payments to Metropolitan, excepting purchase of water. Metropolitan calculates the preferential rights by including each agency s total historical payments to Metropolitan from property taxes, readiness-to-serve and capacity charges, and other minor miscellaneous revenue. Revenue resulting from the purchase of Metropolitan water is excluded, even though more than 80 percent of Metropolitan s revenues come from water sales. Metropolitan member agencies respective abilities to exercise preferential rights were confirmed in a lawsuit filed by the Water Authority in The court decisions made clear the preferential right of each member agency, including the Water Authority, to Metropolitan water. The Water Authority filed lawsuits against Metropolitan, challenging its water rates set in 2010, 2012, 2014 and The Superior Court issued the final judgment in December 2015 confirming its prior favorable rulings for the Water Authority s 2010 and 2012 lawsuits. (The 2014 case was stayed pending the final outcome of the 2010 and 2012 cases, and the 2016 case has just recently been filed.) In the 2010 and 2012 cases, the Water Authority also challenged how Metropolitan calculates member agencies preferential rights, specifically Metropolitan s exclusion of certain payments the Water Authority made that were unrelated to the purchase of Metropolitan water. The Superior Court also ruled in favor of the Water Authority, finding Metropolitan under-calculated the Water Authority s preferential right to Metropolitan water. The 2010 and 2012 cases have been appealed. At the time of this writing, the impact of the judge s decision to the Water Authority s preferential rights is not available. While the cases are pending appeal, Metropolitan continues to calculate the preferential rights under its existing assumptions. Using these assumptions, the Water Authority had a preferential right to purchase percent of Metropolitan s water as of June 30, In contrast, the Water Authority purchased about 21 percent of Metropolitan s available supply in fiscal year In Metropolitan s now-final 2015 UWMP, Section 2.3, Metropolitan presents its supply capability at the regional level, rather than at the member agency level. The report stated that Metropolitan has supply capabilities that would be sufficient to meet expected demands under both the single driest year and the multiple dry-year hydrologies through The report lists Metropolitan s forecasted imported water supply capabilities under normal, single driest year and multiple dry-year hydrologies through 2040, which would provide the Water Authority with adequate supplemental imported supplies in normal years and a single dry year. In multiple dry years, under its projected preferential right formula, and assuming very conservative projections for Metropolitan dry-year supplies, the Water Authority could experience shortages as shown in Section Metropolitan s Water Supplies Metropolitan obtains its water from two sources: the CRA, which it owns and operates, and the State Water Project, with which Metropolitan has a water supply contract through the State of California. Figure 6-2 shows these imported water supply sources, and they are described below. To meet Final 2015 Urban Water Management Plan 6-2 June 2016

101 San Diego County Water Authority Section 6. Metropolitan Water District of Southern California emerging challenges from dry hydrologic conditions and regulatory restrictions that limit supplies from the State Water Project, Metropolitan s strategy also includes utilizing its storage programs to maximize available supplies in wet years for use in dry years. Figure 6-2 Major Water Conveyance Facilities Serving San Diego County Final 2015 Urban Water Management Plan 6-3 June 2016
102 San Diego County Water Authority Section 6. Metropolitan Water District of Southern California Colorado River Metropolitan was formed to import water from the Colorado River. During the 1930s, Metropolitan built the CRA to convey this water. Metropolitan s member agencies received the first deliveries in The aqueduct is more than 240 miles long, beginning at Lake Havasu on the Arizona/California border and ending at Lake Mathews in Riverside County. The aqueduct has the capacity to deliver up to 1.25 million AF/YR. Figure 6-2 shows the location of the aqueduct. Reliability Issues Before 1964, Metropolitan had a firm annual allocation of million AF of Colorado River water through contracts with the U.S. Department of the Interior, which was enough to keep Metropolitan's aqueduct full. However, as a result of the U.S. Supreme Court decision in Arizona vs. California, Metropolitan s firm supply fell to 550,000 AF, its basic annual apportionment. Due to growth in demand from the other states and drought conditions, since 2003, Metropolitan s deliveries have been limited to its basic annual apportionment plus water resulting from unused apportionment water by other California holders of priorities 1 through 3, and transfer programs resulting from conservation with other senior water right holders. Water availability from the Colorado River is governed by a system of priorities and water rights that has been established over many years. The Colorado River Lower Basin states (California, Arizona, and Nevada) have an annual apportionment of 7.5 million AF of water divided as follows: (1) California, 4.4 million AF; (2) Arizona, 2.8 million AF; and (3) Nevada, 300,000 AF. Under the 2007 Colorado River Interim Guidelines for Lower Basin Shortages and the Coordinated Operations for Lake Powell and Lake Mead, California has senior water rights and faces no reductions under the first, second, or third shortage triggers. (Arizona and Nevada supplies are curtailed under all triggers.) Shortages in the Lower Basin are triggered by Lake Mead s elevation dropping to certain elevations, with first, second, and third triggers occurring at elevations of 1,075 feet, 1,050 feet, and 1,025 feet, respectively. The 1931 Seven Party Agreement established California s priorities for water among the state s contractors to use Colorado River water made available to California. The first four priorities total 4.4 million AF/YR. Metropolitan has priorities 4, 5(a), and 5(b) water listed in the Seven Party Agreement, but only priorities 1 through 4 of the Seven Party Agreement are within California s basic annual apportionment. Metropolitan s fourth priority of 550,000 AF is junior to that of the first three priorities, 3.85 million AF to California agricultural agencies. Water used to satisfy Metropolitan s priorities 5(a) and 5 (b) must come from unused allocations within California, Arizona, or Nevada, or from surpluses declared by the Secretary of the Interior. Environmental Considerations Several fish species and other wildlife species either directly or indirectly have the potential to affect Colorado River operations, thus changing power operations and the amount of water deliveries to the CRA. A number of species that are on endangered or threatened lists under the federal and/or California Endangered Species Acts (ESAs) are present in the area of the Lower Colorado River. To address this issue, a broad-based state/federal/tribal/private regional partnership, which includes water, hydroelectric power, and wildlife management agencies in Arizona, California, and Nevada, developed a multi-species conservation plan for the main stem of the Lower Colorado River (the Lower Colorado River Multi-Species Conservation Program [MSCP]). Developed between 1996 and launched in early-2005, this 50-year plan allows Metropolitan to obtain federal and state permits for any incidental take of protected species resulting from current and future water and Final 2015 Urban Water Management Plan 6-4 June 2016
103 San Diego County Water Authority Section 6. Metropolitan Water District of Southern California power operations and diversions on the Colorado River. The MSCP also covers operations of federal dams and power plants on the Colorado River, and the change in point of diversion on the river for the Water Authority s conserved water transfer and canal lining projects. Water Quality Considerations Please see Section 7, Water Quality, for information. Current Supplies Per the Seven Party Agreement, Metropolitan s Colorado River supply is 550,000 AF from its fourth priority within California s basic apportionment of 4.4 million AF. With the 2003 QSA and related agreements among the IID, the CVWD, State of California, Department of Interior, Metropolitan, and the Water Authority, a plan was formalized on how California will implement water transfers and supply programs that allow California to live within the state s 4.4 million AF basic annual apportionment of Colorado River water. Because Metropolitan continues to face dry hydrologic challenges coupled with increasing demands, Metropolitan has relied on its land fallowing, storage, and exchange programs, on the river to increase its Colorado River supplies. These programs include Metropolitan s Intentionally Created Surplus account in Lake Mead, exchange program with the Southern Nevada Water Authority, Palo Verde Irrigation District Land Fallowing Program, and IID/Metropolitan Conservation Program. Quantification Settlement Agreement and Future Supplies The Water Authority, together with CVWD, IID, and Metropolitan, entered into the QSA in October The QSA, which is in effect for 45 years (and up to 75 years if existing agreements are extended), resolved longstanding disputes regarding Colorado River water use among the agencies, and established a baseline water use for IID, CVWD, and Metropolitan. This permitted the implementation of a variety of water conservation and transfer agreements, including the Water Authority s transfer agreement with IID. The QSA also provides that CVWD and Metropolitan will put aside, for the term of the agreement, a dispute over beneficial use of water by IID; and that Metropolitan would forbear consumptive use of water to permit the Secretary of Interior to satisfy the uses of the non-encompassed water delivered to holders of present perfected rights. See Section 4.2, Water Authority IID Water Conservation and Transfer Agreement, for more information on the QSA. Metropolitan's Tables 2-4, 2-5, and 2-6 in its recently adopted 2015 UWMP indicate that supply capabilities for current programs in Metropolitan s Colorado River Aqueduct under an average year (based on hydrologies) and single dry year (repeat of 1977 hydrology) or multiple dry year (based on hydrology) exceed 1.2 million AF. Metropolitan limits the Colorado River supply deliveries to 1.2 million AF to match its maximum Colorado River Aqueduct delivery capacity. These programs include water management programs and the Water Authority s IID transfers and conserved canal lining water conveyed by the aqueduct State Water Project The State Water Project is owned by the State of California and is operated by DWR. Metropolitan has a take-or-pay supply contract with the State of California and is entitled to take about 48 percent of available State Water Project water through its Long-Term SWP Water Supply Contract (referred Final 2015 Urban Water Management Plan 6-5 June 2016
104 San Diego County Water Authority Section 6. Metropolitan Water District of Southern California to as the Table A allocation). The project stretches for more than 600 miles, from Lake Oroville in the north to Lake Perris in the south. Water is stored at Lake Oroville and released when needed into the Feather River, which flows into the Sacramento River and to the Delta. The Delta is the largest estuary on the United States west coast and is used for multiple purposes, including agriculture, recreation, and fishing, and provides the means by which to deliver water from Northern California to the south. In the north Delta, water is pumped into the North Bay Aqueduct for delivery to Napa and Solano counties. In the south Delta, water is diverted into the State Water Project s Harvey O. Banks Pumping Plant (Banks Pumping Plant), where it is lifted into the 444-milelong California Aqueduct. Some of this water flows into the South Bay Aqueduct to serve areas in Alameda and Santa Clara counties. The remainder flows southward to cities and farms in Central and Southern California. In the winter, when demands are lower, water is stored at the San Luis Reservoir located south of the Delta. State Water Project facilities provide drinking water to 23 million Californians and 755,000 acres of irrigated farmland. Figure 6-2 shows the California Aqueduct. Reliability Issues The reliability of State Water Project supplies is limited by the level of State Water Project supply development, pumping restrictions due to state and federal environmental regulations, and hydrology. When approved by the voters in the 1960s, the State Water Project was planned to deliver 4.2 million AF to 32 contracting agencies. Subsequent contract amendments reduced total contracted deliveries to 4.13 million AF and the number of contracting agencies to 29. Metropolitan s contracted entitlement is currently at 1,911,500 AF. Metropolitan s original longterm water supply contract for 2,011,500 AF was amended as part of the 2003 QSA. Effective in 2005, the amendment resulted in an exchange agreement among CVWD, Desert Water Agency (DWA), and Metropolitan. The exchange agreement provides for the transfer of 88,100 AF of Metropolitan s Table A amounts to CVWD and 11,900 AF of Metropolitan s Table A amounts to DWA. When voters approved construction of the State Water Project in 1960, state planners did not expect the full amount of contracted water to be needed for at least the first 20 years of the project. As a result, the planners anticipated that the facilities needed to produce the full contracted amount would be constructed over time as demands on the system increased. However, decisions about these additional facilities were repeatedly deferred as public attitudes and environmental regulations changed and costs increased. New state and federal environmental laws put some potential water supply sources off limits to development. More stringent water quality standards adopted by the SWRCB to protect the San Francisco Bay/Sacramento San Joaquin River Delta (Bay- Delta) have reduced the amount of water available for diversion. Environmental challenges to the State Water Project operations also resulted in the issuance of new biological opinions (BiOps), which led to pumping restrictions that further reduced State Water Project exports. At the same time, California s population and water demand continued to grow. The Delta Vision process, established by then-governor Schwarzenegger in 2006, aimed to identify long-term solutions to resolve the conflicts in the Bay-Delta, including natural resource, infrastructure, land use, and governance issues. In an effort to meet the recommendation to restore habitat within the Delta in a way that reliably delivers water, the California Natural Resources Agency (Resources Agency) initiated the preparation of the BDCP. While the BDCP was managed by the Resources Agency, the development of the environmental impact report and environmental impact statement (EIR/EIS) was led by DWR as state lead agency, and U.S. Bureau of Reclamation, Final 2015 Urban Water Management Plan 6-6 June 2016
105 San Diego County Water Authority Section 6. Metropolitan Water District of Southern California the U.S. Fish and Wildlife Service (USFWS), and the National Marine Fishery Service as federal colead agencies. In 2009, the State of California passed SB X7-1, known as the Sacramento-San Joaquin Delta Reform Act (Delta Reform Act). The Water Authority, a strong advocate for a sustainable Bay-Delta solution, actively encouraged passage of the 2009 measure, among other bills that made up a comprehensive water package of legislation. The Delta Reform Act directed that the Bay-Delta be managed with dual goals of water supply reliability and ecosystem protection. The legislation also created the Delta Stewardship Council, charged with adopting and overseeing implementation of a comprehensive Bay-Delta management plan (Delta Plan). On December 13, 2013, DWR along with other lead and cooperating agencies released the BDCP document and draft EIR/EIS for public review. The BDCP, at that time, was planned as a joint Habitat Conservation Plan (HCP)/NCCP intended to meet the state-mandated co-equal goals of restoring and protecting ecosystem health, water supply and water quality within a stable regulatory framework. The BDCP was to obtain 50-year California and federal ESA permits for the operation of the State Water Project and Central Valley Project (CVP). After receiving more than 10,000 comment letters through the environmental review process, including concerns raised by the federal fishery agencies, DWR and the lead agencies decided to change the permitting approach. The new approach decouples BDCP s water conveyance and ecosystem restoration objectives into two distinct efforts California WaterFix and California Eco Restore. Rather than pursuing long-term 50-year permits to operate the proposed conveyance facilities, the California WaterFix is proposed to operate under Section 7 of the federal ESA and corresponding state regulations, similar to the current permit mechanism under which the State Water Project and CVP operate. In July 2015, the Partially Recirculated Draft EIR and Supplemental Draft EIS was released for a public review and comment period. The public review and comment period closed October 30, The Record of Decision for the California WaterFix is scheduled in DWR s State Water Project Delivery Capability Report 2015 updated DWR s estimate of the current (2015) State Water Project delivery capability. Historically, the Capability Report provided estimates of the current and future (20 years in the future) State Water Project delivery capability. The 2015 report showed that current deliveries continue to be impacted by significant restrictions due to operational requirements contained in federal BiOps. It projected that the primary component of the annual State Water Project deliveries will be slightly less, when compared to the preceding 2013 report. In developing its supply capabilities, Metropolitan assumed a new Delta conveyance as fully operational by 2030 and would produce 1.2 million AF of average annual State Water Project supplies. Metropolitan also assumed near-term actions that would provide average annual State Water Project water supplies of 980,000 AF. Environmental Considerations In recent years, actions taken to protect the ecosystem of the Bay-Delta have placed additional restrictions on State Water Project operations. The Bay-Delta is the largest estuary on the west coast and supports more than 750 plant and animal species. However, 150 years of human activity, dating back to 19th century gold mining, has taken its toll on the Bay-Delta ecosystem and the fish that live there. Final 2015 Urban Water Management Plan 6-7 June 2016
106 San Diego County Water Authority Section 6. Metropolitan Water District of Southern California Numerous factors contribute to the degradation of the Bay-Delta ecosystem and the decline of Delta fisheries, such as habitat loss, water diversions, non-point source pollution, over-fishing, and the introduction of non-native species. Regulatory protection efforts have nevertheless tended to focus on the operations of the State Water Project and the CVP. The restrictions began in 2007, when Federal Court Judge Oliver Wanger, acting in a case filed two years earlier, invalidated the BiOp for the Delta smelt and imposed an injunction that limited the time during which water could be pumped out of the Delta. The judge imposed restrictions on pumping to protect the Delta smelt, while new BiOps were being prepared. During the spring of 2008, Judge Wanger also invalidated the federal government s BiOps with respect to salmon and steelhead in the Sacramento River. In December 2008, the USFWS issued a new BiOp for the Delta smelt. This BiOp imposed operating restrictions that were even more severe than those imposed by the judge. Metropolitan and other State Water Contractors filed separate lawsuits in federal district court challenging the BiOp, which were consolidated under the caption Delta Smelt Consolidated Cases. On March 13, 2014, the Ninth Circuit held that the 2008 BiOp is valid and lawful. The impacts of the 2008 BiOp on Delta smelt to Metropolitan s deliveries from the State Water Project are variable based on hydrologic conditions. On June 4, 2009, the National Oceanic and Atmospheric Administration National Marine Fisheries Service issued a BiOp intended to protect spring- and winter-run Chinook salmon, Central Valley steelhead, green sturgeon, and Southern Resident killer whales. This action placed additional restrictions on State Water Project and CVP operations. Six lawsuits were filed challenging the BiOp and were consolidated under the caption Consolidated Salmon Cases. On December 22, 2014, the Ninth Circuit held that the 2009 BiOp is valid and lawful. DWR estimated a 10 percent average water loss under this BiOp. Water Quality Considerations Please see Section 7, Water Quality, for information. Current Supplies Metropolitan s State Water Project supplies are projected using DWR s 2015 State Water Project Delivery Capability Report. The capability report presents current DWR estimates of the amount of water deliveries for current (2015) conditions and conditions 20 years in the future. Under the reliability report, the delivery estimates for the State Water Project for 2020 conditions, with existing conveyance and low outflow, as a percentage of Table A amounts for Metropolitan, are 12 percent under a single dry-year (1977) condition, which is equivalent to 257,000 AF, and 51 percent under long-term average conditions, which is equivalent to 976,000 AF. In dry below-normal conditions caused by dry hydrologic conditions and regulatory restrictions, Metropolitan developed additional supplies from Central Valley storage and transfer programs. Future Supplies Metropolitan's 2015 UWMP indicates that its State Water Project target for the near term under average hydrology (based on hydrologies) is 984,000 AF. The long-term target for State Water Project supplies is 1.2 million AF under average hydrologies. These figures exclude Central Valley transfer and storage program supplies conveyed by the aqueduct. In Metropolitan s 2015 UWMP, the increased supply yield from a long-term Delta fix is contained in programs under development. The 2015 UWMP estimates that the State Water Project current programs, which Final 2015 Urban Water Management Plan 6-8 June 2016
107 San Diego County Water Authority Section 6. Metropolitan Water District of Southern California include transfers and storage withdrawals, will be capable of serving between 1.76 million to 1.90 million AF to Metropolitan from 2020 through 2040 in an average year Storage Management Programs At times, Metropolitan relies on water in storage to augment limited imported supplies. It manages its storage portfolio by storing water during wet years to meet the region's needs during critical droughts caused by varied hydrologic conditions and State Water Project pumping restrictions imposed to protect endangered or threatened fish species. The amount of water in Metropolitan's storage resources influences the likelihood that Metropolitan will have adequate supplies to meet projected demands without implementing the Water Supply Allocation Plan (WSAP). The principles that guide the management of supply and storage are based on the framework established in the Water Surplus and Drought Management Plan. Currently, Metropolitan has about 30 storage programs in operation that provide flexibility to meet delivery requirements. The storage accounts include groundwater and surface storage programs and facilities, within and outside of Metropolitan's service area. Metropolitan's dry-year storage portfolio has the potential to store more than 5 million AF. Metropolitan s dry-year storage was at its highest, at 2.7 million AF, at the end of calendar year Although Metropolitan currently employs its WSAP to allocate its supplies, the imposition of the WSAP does not supersede a member agency s preferential right to Metropolitan water. A member agency can always choose to exercise its preferential right to Metropolitan water, rather than following the WSAP allocation. Metropolitan's 2015 UWMP indicates that the in-region supplies and programs target for current programs in a single dry year (based on 1977 hydrology) is 693,000 AF in 2020, 774,000 AF in 2025, and 852,000 AF in The 2015 UWMP also estimates that in the period, Metropolitan's annual supply range from the in-region supplies and programs will be 956,000 AF and 992,000 AF, respectively, in a single dry year. The 2015 UWMP estimates that the in-region supplies and programs will be capable of serving between 693,000 AF and 992,000 AF to Metropolitan from 2020 through 2040 under average hydrology. Metropolitan s ability to utilize its water storage reserves depends on the actual amount of water in storage and take or exchange limits of various storage/exchange programs. During the most recent dry period, Metropolitan s take capacity from its storage accounts was limited. Access to storage on the State Water Project system was restricted due to low State Water Project allocations and pumping limitations for Metropolitan s Central Valley groundwater storage programs. On the Colorado River, Metropolitan s access to its Intentionally Created Surplus stored in Lake Mead may be limited by available capacity in its CRA, or if a shortage on the River is declared. Additionally, during the current drought, limited water is available for transfers, constraining Metropolitan s ability to secure additional supplies. Final 2015 Urban Water Management Plan 6-9 June 2016
108 San Diego County Water Authority Section 6. Metropolitan Water District of Southern California This page intentionally left blank. Final 2015 Urban Water Management Plan 6-10 June 2016
109 Section 7 Water Quality The Act requires that the 2015 Plan include information, to the extent practicable, on the quality of existing supply sources and the manner in which water quality affects water supply reliability. A significant task for the Water Authority is to protect the water quality of the water passing through its delivery system and communicating water quality changes to its member agencies. This section summarizes water quality issues associated with supplies serving the San Diego region. Information on Colorado River and State Water Project supplies came in part from Metropolitan s final 2015 UWMP. Water agencies treat all water to meet stringent state and federal drinking water standards before delivering it to customers. However, source water of poor quality will make it increasingly expensive and difficult to meet those standards. Updated drinking water standards also result in additional costs to water suppliers. 7.1 Background on Key Water Quality Constituents EPA establishes federal primary and secondary maximum contaminant levels (MCLs) for the nation. The SWRCB DDW, establishes primary and secondary MCLs for California, which must be at least as stringent as the federal MCLs. A secondary MCL is an enforceable standard based on the aesthetic quality of water. A primary MCL is an enforceable standard set based on health effects. All MCLs take into consideration health effects, occurrence and cost of treatment. The State Office of Environmental Health Hazard assessment establishes public health goals (PHGs), which set a goal for contaminants based strictly on health effects. For constituents that have no MCLs, EPA can set monitoring requirements through the unregulated contaminant monitoring rule (UCMR). Where no MCLs are adopted, EPA can also set unenforceable health advisory levels and DDW can set notification levels, which are also health-based advisory levels Salinity The recommended secondary MCL for salinity is 500 milligrams per liter (mg/l) of TDS with an upper limit of 1,000 mg/l. High levels of salinity can have economic impacts on various water uses, such as reduced lifespan of household appliances, reduced crop yields, and increased water use for irrigation to flush salts through the soil. When treatment is required to reduce TDS concentrations, this can increase the costs of water supply. High TDS has an even greater impact on recycled water supplies that have TDS concentrations approximately 200 to 300 mg/l higher than the source water supplies. Metropolitan has set a goal of delivering water to its customers that contains less than 500 mg/l TDS by blending water from State Water Project with Colorado River Water. Metropolitan has typically been able to operate to meet the 500 mg/l TDS goal. However, during drought periods, when State Water Project supplies are limited, and TDS is increasing within the Colorado River, this goal has not been met. Development of new sources of supply with lower TDS concentrations, such as seawater desalination and potable reuse, can result in multiple economic benefits from the reduced TDS. At the same time, extremely low TDS supplies can be corrosive and should be managed to avoid unintended consequences. Final 2015 Urban Water Management Plan 7-1 June 2016
110 San Diego County Water Authority Section 7. Water Quality Nutrients Elevated levels of nutrients (phosphorus and nitrogen compounds) can stimulate nuisance algal (cyanobacteria) and aquatic weed growth that affects water system operations and consumer acceptability, including the production of noxious taste and odor compounds and algal toxins. Additionally, algae growth can shorten filter run times, increase solids production at drinking water plants, and add to organic carbon loading. Nutrients also provide an additional food source that can lead to proliferation of quagga and zebra mussels and other invasive species. The issue of algae toxins has become a growing concern nationally as a result of increasing occurrence. In August 2014, an algae bloom producing microcystins in Lake Erie resulted in a do not drink order for the city of Toledo, Ohio. This triggered federal legislation requiring EPA to develop health advisories and strategic plans for managing algae toxins. In June 2015, EPA issued health advisories for two cyanobacterial toxins, recommending exposure levels over a 10-day period at or below 0.3 micrograms per liter (µg/l) for microcystins and 0.7 µg/l for cylindrospermopsin in drinking water for children pre-school age and younger (less than six years old). For school-age children through adults, the recommended health advisory levels for drinking water are at or below 1.6 µg/l for microcystins and 3.0 µg/l for cylindrospermopsin. The health advisories serve as recommended precautionary levels and are not enforceable federal water quality standards. Additional work is being done to improve laboratory methods for monitoring of algae species and any associated algae toxins, including microcystins, anatoxin-a, and cylindrospermopsin. Monitoring for algae toxins may be required through the UCMR regulations, which could require monitoring to begin in The Water Research Foundation has conducted research and provided recommendations for controlling algae growth in reservoirs and treatment approaches that can help to avoid delivery of unacceptable levels of algae toxins in treated water supplies Total Organic Carbon and Bromide Disinfection byproducts (DBPs) form when source water containing high levels of total organic carbon and bromide is treated with disinfectants such as chlorine or ozone. Source water quality and surface water treatment processes play an important role in DBP formation. Studies show a link between DBP exposure and certain cancers. EPA rules on DBPs attempt to balance the reduction in risk of waterborne disease outbreak through use of disinfectants, against the cancer risk of DBP formed during the treatment processes. In 2002, EPA s Stage 1 Disinfectant and Disinfection Byproducts (D/DBP) Rules established new MCLs and a treatment technique requirement. In 2006, the Stage 2 D/DBP Rule added a requirement for systems to comply with the MCL based on locational running averages. The MCL applies to suppliers with permitted water treatment facilities and consecutive systems receiving treated water from a wholesale provider Arsenic Arsenic is a naturally occurring element found in rocks, soil, water, and air. It is also used in wood preservatives, alloying agents, agricultural application, semi-conductors, paints, dyes and soaps. Long-term exposure to high levels of arsenic drinking water has been linked to certain cancers, skin pigmentation changes and hyperkeratosis (skin thickening). Effective in January 2006, the federal MCL for arsenic was lowered to 10 µg/l. In California, naturally occurring arsenic is commonly found in drinking water sources. Arsenic can be removed from drinking water through coagulation and filtration processes. Final 2015 Urban Water Management Plan 7-2 June 2016
111 San Diego County Water Authority Section 7. Water Quality Uranium Uranium is a naturally occurring radioactive element commonly found in groundwater supplies developed in granitic formations. Concentrated uranium can also be found in tailings from mining operations and the downstream water supplies. Uranium has been shown to cause certain cancers. The California MCL for uranium is 20 picocuries per liter (pci/l) or 30 µg/l Chromium-6 Chromium is a naturally occurring element found in rocks, soils, plants and animals. Chromium-6 is used in electroplating, stainless steel production, leather tanning, textiles manufacturing, dyes and pigments, and wood preservation. Chromium can be found in the form of chromium-3 or chromium- 6. Chromium-6 has been shown to cause certain cancers. Effective July 1, 2014, DDW adopted an MCL of 10 µg/l for chromium. The federal MCL of 100 µg/l is being reevaluated Perchlorate Perchlorate compounds are used as a main component in solid rocket propellant and are also found in munitions and fireworks. Perchlorate dissolves easily and is highly mobile in groundwater. The primary health concern of perchlorate is that it causes hypothyroidism. This is especially critical in pregnant women and for development of infants and small children. In 2007, DDW adopted an MCL of 6 µg/l for perchlorate. In 2015, the PHG for perchlorate was set at 1 µg/l, prompting DDW to initiate a review of the MCL based on the current PHG. A federal MCL is being developed Constituents of Emerging Concern Two significant categories of constituents of emerging concerns (CECs) are nitrosamines, and pharmaceuticals and personal care products (PPCPs). CECs include emerging contaminants that have no state or federal MCL adopted where health effects information or the ability to monitor the contaminant may be limited. The most abundantly detected nitrosamine is nitrosodimethylamine (NDMA). NDMA is a DBP of chloramines and organic matter. Chloramines are a common secondary disinfectant at surface water treatment plants. Contributing factors may include organic matter in wastewater discharges or surface water supplies, and certain coagulant aid polymers. EPA considers NDMA to be a probable human carcinogen and put it on the monitoring list for the UCMR. The notification level for NDMA and two other nitrosamines is 0.01 µg/l. The PHG for NDMA is µg/l. Studies have reported the occurrence of PPCPs in treated wastewater and surface water supplies. PPCPs have been detected in extremely low concentrations in raw surface water supplies downstream of waste discharges including the following: carbamazepine, sulfamethoxazole, caffeine, primidone and gemfibrozil. Additional research is needed on monitoring methods, health effects, or fate and transport of these constituents and the efficacy of treatment processes to remove the constituents Iron and Manganese Iron and manganese are commonly occurring groundwater contaminants. Manganese is also commonly occurring in the anoxic zone of surface water reservoirs and is found in wastewater Final 2015 Urban Water Management Plan 7-3 June 2016
112 San Diego County Water Authority Section 7. Water Quality discharges. The secondary MCL for iron is 0.3 mg/l. The secondary MCL for manganese is 0.05 mg/l. High iron and manganese in source waters can result in added treatment removal costs. 7.2 Colorado River The Colorado River is the primary source of the Water Authority s imported water supply. High salinity levels, uranium, and perchlorate contamination represent the primary areas of concern with the quality of Colorado River supplies. Managing the watershed of the Colorado River has been the most effective method for controlling these elements of concern Salinity The salts in the Colorado River system are indigenous and pervasive, mostly resulting from saline sediments in the basin that were deposited in prehistoric marine environments. They are easily eroded, dissolved, and transported into the river system. Agricultural development and water diversions over the past 50 years increase the already high, naturally occurring levels of TDS. Water imported via the CRA has a TDS averaging around 650 mg/l during normal water years. During the high water flows of , salinity levels in the CRA dropped to a historic low of 525 mg/l. However, during the drought, higher salinity levels returned. During an extreme drought, CRA supplies could exceed 900 mg/l. High TDS in water supplies leads to high TDS in wastewater, which lowers the usefulness of the water and increases the cost of recycled water. (Refer to Section 7.6 for details on salinity impacts on water recycling.) In addition to the link between water supply and water quality, high levels of TDS in water supplies can damage water delivery systems and home appliances. During 2010 through 2014, the TDS levels in Lake Havasu and Lake Mathews ranged from 570 to 640 mg/l. These lakes contain 100 percent Colorado River water. To reduce the effects of high TDS levels on water supply reliability, Metropolitan approved the Salinity Management Policy in April One of the policy goals is to blend Colorado River supplies with lower-salinity water from the State Water Project to achieve delivered water salinity levels of less than 500 mg/l TDS. Since 1976, the TDS levels in Metropolitan s Colorado River supply have had an average concentration of 630 mg/l. In addition, to foster interstate cooperation on this issue, the seven basin states formed the Colorado River Basin Salinity Control Forum. To lower TDS levels in Colorado River supplies, the forum develops programs designed to prevent a portion of the abundant salt supply from moving into the river system. The Colorado River Basin Salinity Control Program targets the interception and control of non-point sources, such as surface runoff, as well as wastewater and saline hot springs Perchlorate Perchlorate was first detected in Colorado River water in June 1997 and was traced to the Las Vegas Wash. The source of contamination was found to be emanating from a chemical manufacturing facility in Henderson, Nevada. Because of growing concerns over perchlorate levels in drinking water, in 2002, Metropolitan adopted a Perchlorate Action Plan. Objectives include expanded monitoring and reporting programs and continued tracking of remediation efforts in the Las Vegas Wash. Metropolitan has been conducting monthly monitoring of Colorado River supplies. The Nevada Department of Environmental Protection manages a comprehensive groundwater Final 2015 Urban Water Management Plan 7-4 June 2016
113 San Diego County Water Authority Section 7. Water Quality remediation program in the Henderson area. As of December 2004, the amount of perchlorate entering the Colorado River system from Henderson has been reduced from approximately 1,000 pounds per day (lb/day) to less than 90 lb/day. As a result of the aggressive cleanup efforts, perchlorate levels in the Colorado River water have decreased significantly from a peak of 9 µg/l in May 1998 and have remained less than 2 µg/l since June From 2010 through 2014, the perchlorate levels in Colorado River water ranged from not detected to 1.6 µg/l, with no detections since Uranium Naturally occurring uranium has always been present in Colorado River water and has always been under the California MCL of 20 pci/l. The risks to water quality have primarily come from upstream mining in Moab, Utah, and other potential mining sites in the west. Currently, the U.S. Department of Energy (DOE) is working to remove and dispose of mine tailings and improve groundwater quality on the Colorado River watershed near Moab. The expected completion of this cleanup is between 2019 and Current levels at Metropolitan s intake have ranged from 1 to 6 pci/l and are well below the MCL Nutrients The Colorado River system has historically been low in nutrients, but with population growth in the watershed, nutrients are still a concern. Metropolitan is involved with upstream entities along the lower Colorado River to enhance wastewater management to control nutrient loading, especially phosphorus. The Colorado River s low nutrient level has been important for blending with State Water Project water to reduce the nutrient level delivered to retail agencies Arsenic Arsenic is another naturally occurring element monitored by drinking water agencies. Between 2001 and 2014, arsenic levels in Colorado River water have ranged from not detected to 3.5 µg/l, which is well below the MCL for arsenic. Increasing coagulant doses at water treatment plants can reduce arsenic levels for retail deliveries Chromium-6 Metropolitan has actively monitored the Colorado River water for chromium-6. All monitoring results have been below the detection limit for reporting. Pacific Gas and Electric Company used chromium-6 as an anticorrosion agent for cooling towers at a gas compressor station located along the Colorado River near Topock, Arizona. This is a toxic cleanup site. Results of chromium-6 monitoring from the Colorado River upstream and downstream of this site have been below the detection limit for reporting. 7.3 State Water Project The quality of State Water Project water as a drinking water source is affected by a number of factors, most notably seawater intrusion and agricultural drainage from peat soil islands in the Delta. State Water Project water contains relatively high levels of bromide and total organic carbon, Final 2015 Urban Water Management Plan 7-5 June 2016
114 San Diego County Water Authority Section 7. Water Quality two elements of particular concern to drinking water agencies. Bromide and total organic carbon combine with chemicals used in the water treatment process to form DBPs that are regulated under the federal Safe Drinking Water Act (SDWA). Wastewater discharges from cities and towns surrounding the Delta also add salts and pathogens to Delta water, and they influence its suitability for drinking and recycling. The 2000 Record of Decision adopted by CALFED states that CALFED will either achieve water quality targets at Clifton Court Forebay and drinking water intakes in the south and central Delta, or it will achieve an equivalent level of public health protection using a cost-effective combination of alternative source waters, source control, and treatment technologies. Actions to protect Delta fisheries have exacerbated existing water quality problems by forcing the State Water Project to shift its diversions from the springtime to the fall, when salinity and bromide levels are higher. Closure of the Delta Cross-Channel gates to protect migrating fish has also degraded State Water Project water quality by reducing the flow of higher-quality Sacramento River water to the State Water Project pumps at critical times. This can result in increased concentrations of salinity and bromide in the water delivered to Southern California. DWR is proposing construction of a new intake system as part of the California WaterFix. By moving the intakes upstream, this would improve the water quality in the Delta and could allow for increased deliveries in wet years. The California WaterFix (Alternative 4A) includes three new intakes along the Sacramento River and dual-bore tunnels to convey water to the existing state and federal pumping facilities, and habitat restoration measures and environmental commitments necessary to mitigate impacts in compliance with state and federal environmental laws. The environmental document for the California WaterFix was released for review and comments were closed on October 20, This project will require broad support and funding commitments to implement Total Organic Carbon and Bromide Total organic carbon (TOC) and bromide are naturally occurring but are elevated due to agricultural drainage and seawater intrusion as water moves through the Delta. The concern with TOC and bromide is that they form DBPs when treated with disinfectants such as chlorine. Some DBPs have been identified and are regulated under SDWA; others are not yet identified. Existing levels of bromide and TOC in Delta water supplies present challenges for water utilities to comply with the regulations. Levels of these constituents increase due to agricultural drainage and seawater intrusion into the Delta. No regulatory water quality objectives are available for bromide in the Delta. However, the CALFED Bay-Delta Program 2000 set a goal of 0.05 mg/l for bromide and 3 mg/l for TOC to minimize formation of DBPs through the treatment process and enable water suppliers to meet the MCLs. More recent information states that concentrations ranging from 0.1 to 0.3 mg/l should be adequate to meet the DBP standards. During drought periods, existing Delta water quality regularly exceeds 2 mg/l for TOC. Several treatment plants serving the San Diego region have upgraded to ozone as a primary disinfectant to allow treatment of challenging water sources, such as State Water Project, and continue to meet the DBP standards. Some local treatment plants use chlorine dioxide as a primary disinfectant to reduce DBP formation. Blending of the State Water Project source with Colorado River water also reduces precursors and DBP formation. Final 2015 Urban Water Management Plan 7-6 June 2016
115 San Diego County Water Authority Section 7. Water Quality Nutrients State Water Project supplies have significantly higher nutrient levels than the Colorado River supplies. Elevated levels of nutrients can increase nuisance algal and aquatic weed growth; in turn, this affects taste and odor in product water and can reduce filter run times at water treatment plants. Nutrient-rich soils in the Delta, agricultural drainage, urban runoff and wastewater discharges are primary sources of nutrient loading to the State Water Project. Water agencies receiving Delta water have been engaged in efforts to minimize the effects of nutrient loading from Delta wastewater plants. Sacramento Regional County Sanitation District, the primary discharger to the Sacramento River, launched treatment plant upgrades in 2015 to comply with its 2010 discharge requirements for ammonia and nitrate removal. Completion of upgrades is expected in In 2014, the City of Stockton Wastewater Treatment Plant, a significant discharger to the San Joaquin River, was issued waste discharge requirements with more stringent nitrogen limits. This will likely result in upgrades to that plant as well. Low flows, increased temperatures and increased nutrient concentrations during drought have increased the algae blooms, which produce algal toxins. Of particular concern is microcystis, a harmful species of cyanobacteria. DWR increases its application of copper compounds to control algae and aquatic weed growth during the drought. Taste and odor complaints due to Delta nutrients depend on the blend of imported water delivered through Metropolitan. Metropolitan developed a comprehensive program to monitor and manage algae in its source water reservoirs and to provide early warning of algae-related problems, taste, and odor events. This is an area where increased monitoring, response and oversight, and proactive management of reservoir water quality will ensure a safe water supply Salinity Water supplies from the State Water Project have significantly lower TDS levels than the Colorado River, averaging 250 mg/l in water supplied through the East Branch and 325 mg/l through the West Branch. Because of this lower salinity, Metropolitan blends State Water Project water with high salinity CRA water to reduce the salinity levels of delivered water. However, both the supply and the TDS levels of State Water Project water can vary significantly in response to hydrologic conditions in the Sacramento San Joaquin watersheds. The TDS levels of State Water Project water can also vary widely over short periods of time. These variations reflect seasonal and tidal flow patterns, and they pose an additional problem to blending as a management tool to lower the higher TDS levels from the CRA supply. For example, in the 1977 drought, the salinity of State Water Project water reaching Metropolitan increased to 430 mg/l, and supplies became limited. During this same event, salinity at the Banks Pumping Plant exceeded 700 mg/l. Under similar circumstances, Metropolitan s 500 mg/l salinity objectives could only be achieved by reducing imported water from the CRA. Thus, it may not be possible to maintain both salinity standards and water supply reliability unless salinity levels of source supplies can be reduced Arsenic Between 2001 and 2008, arsenic levels in SWP water have ranged from not detected to 4.0 µg/l. Increasing coagulant doses at water treatment plants can reduce arsenic levels for retail deliveries. Groundwater storage programs in the SWP appear to provide the greatest risk of arsenic Final 2015 Urban Water Management Plan 7-7 June 2016
116 San Diego County Water Authority Section 7. Water Quality contamination; therefore, a pilot arsenic treatment facility is being tested by one of the groundwater partners. Non-project deliveries of groundwater to the California Aqueduct increase during drought periods. Although the groundwater being pumped into the aqueduct contains arsenic in concentrations above the MCL, the arsenic in the blended water remains below the MCL. The intent is to manage inflows so the arsenic concentrations do not increase by more than 2 µg/l. 7.4 Local Surface Water Reservoirs Local surface water supply reservoirs are used to store imported water from the SWP and Colorado River and capture local runoff from the watershed. The region s water quality is influenced by a variety of factors depending on its source. As stated above, waters from the Colorado River and from Northern California are vulnerable to a number of contributors to water quality degradation. Regional surface and groundwater quality are vulnerable to increasing urbanization in the watershed, agriculture, recreational uses, invasive species, and fires. Historically, regional surface water quality has been considered good to excellent. Water quality can vary with imported water inflows and surface water contamination. While many of the local surface water supplies remain of good quality, some of the local supplies could be described as having poor quality, which results in costs and challenges to downstream utilities to reliably treat the water to meet drinking water standards. Downstream treatment plants are designed with a focus to remove and inactivate pathogens through filtration and disinfection. Source water protection is considered a key element in regional water quality. The Water Authority and its member agencies are working together to improve watershed awareness and management. Currently, the most significant water quality issue that affects the public is algae blooms, which can create taste and odor problems or algal toxins. Algae blooms are typically caused by runoff containing nutrients and build-up of those nutrients in local reservoirs. The water suppliers in the region are actively developing monitoring and response plans to maintain assurances that water delivered to the public is safe for human consumption. In San Diego County, the SWRCB DDW has primacy over the implementation of the SDWA. The SDWA regulates source water protection to ensure public health through the multiple barrier approach to source protection and treatment, an approach that anticipates that the public will participate in source water protection. Member agencies in the Water Authority s service area that have surface water have a good, long-standing working relationship with DDW. A similar requirement from EPA calls for utilities to complete a Source Water Assessment (SWA). Information collected in SWAs is used to evaluate changes in potential sources of contamination and to help determine if more protection measures are needed. EPA requires utilities to complete an SWA that uses information collected in the sanitary surveys. The SWA is also used to evaluate the vulnerability of water sources to contamination and also helps determine whether more protective measures are needed. Source water protection is fundamentally important to all of California. DDW requires large utilities delivering surface water to complete a Watershed Sanitary Survey every five years to examine possible sources of drinking water contamination. The survey includes suggestions for how to protect water quality at the source. The monitoring of key constituents in source waters is critical in helping to identify constituents that should be controlled at the source and to determine the best ways to operate the water system Final 2015 Urban Water Management Plan 7-8 June 2016
117 San Diego County Water Authority Section 7. Water Quality to improve the quality of water delivered to the consumer. The effect of urban and agricultural runoff on receiving water quality is a recognized problem. The San Diego Water Board has the responsibility to protect local water supplies from impacts caused by pollutants in runoff. The San Diego Water Board has not historically established protection of drinking water supplies or nutrients as its highest priority. This will likely become a higher priority in the future. In its 2013 Practical Vision, the San Diego Water Board stated that achieving a sustainable local water supply is a priority. To address the issues associated with surface water quality and watershed management, the Water Authority, the City of San Diego, and the County of San Diego have formed a Regional Water Management Group to coordinate development of an IRWM for the San Diego region. An important element in the IRWM is to protect and enhance the region s local surface water quality. As part of this process, watershed-based and reservoir projects were identified and are being implemented to assist in watershed protection and improvement of surface water quality. One key objective of the IRWM is to reduce sources of pollutants and environmental stressors. This objective targets water management strategies that directly address pollution management and include agricultural land stewardship, pollution prevention, urban land use planning, urban runoff management, and watershed management and planning. The IRWM stresses the need to attain the region s water quality standards by managing runoff from all sources within the region through the watershed management framework. (Refer to Section 8, Integrated Regional Water Management Planning, for more information.) DWR has provided funding for projects through the San Diego IRWM program to improve water quality in several of the watersheds having local water supply reservoirs. IRWM grants have funded several projects in the San Dieguito watershed for the improvement of water quality in Hodges Reservoir. This reservoir is impacted by urban and agricultural runoff. The IRWM projects completed assessed water quality in the reservoir and impacts from urban and agricultural runoff and developed projects to help solve the water quality challenges. In subsequent phases, IRWM grants are funding a hypolimnetic aeration system in Hodges Reservoir and constructed wetlands that will capture and treat urban runoff. 7.5 Groundwater Water quality parameters that can affect reliability of groundwater resources in San Diego County are high salinity levels, nitrate, iron and manganese, and methyl tertiary butyl ether Salinity and Nitrate Increased TDS in groundwater basins occurs when basins near the ocean are over-drafted, leading to seawater intrusion, or when agricultural and urban return flows add salts to the basins. Much of the water used for agricultural or urban irrigation infiltrates into the aquifer, so where high TDS irrigation water is used or where the water transports salts from overlying soil, the infiltrating water will increase the salinity of the aquifer. Using this resource requires demineralization through reverse osmosis. When compared to other supplies, desalinated groundwater has been proven a cost-effective and reliable supply. (Refer to Section 5.3, Groundwater, for discussion on groundwater recovery projects.) Increased nitrate concentrations can occur due to runoff and recharge from agriculture and from on-site waste treatment systems. High nitrate concentrations can be managed through treatment or blending with other lower nitrate sources. Final 2015 Urban Water Management Plan 7-9 June 2016
118 San Diego County Water Authority Section 7. Water Quality To protect the quality of these basins, the San Diego Water Board often places restrictions on the salinity and nitrate levels of water used for basin recharge or for irrigation of lands overlying the aquifers. Where these restrictions are in place, water reuse and aquifer recharge may be restricted, or expensive mitigation measures may be required. The San Diego Water Board also includes criteria in their basin plan for permitting on-site waste treatment systems and regulates agricultural discharges Iron and Manganese Some local groundwater supplies are naturally high in iron and manganese. While not a public health concern, groundwater supplies exceeding the secondary standard for iron and manganese are treated to remove these constituents. 7.6 Recycled Water Water quality, as it pertains to high salinity supplies, is a significant implementation issue for recycled water projects. High TDS source water poses a special problem for water recycling facilities because conventional treatment processes are designed to remove suspended particles, but not dissolved particles. TDS removal, or demineralization, requires an advanced treatment process, which can increase project costs significantly. Residential use of water typically adds 200 to 300 mg/l of TDS to the wastewater stream. Selfregenerating water softeners can add another pound of salt per day per unit. Infiltration of brackish groundwater into sewer lines can also cause an increase in TDS. If an area receives a water supply with TDS of more than 700 mg/l, and residents add 300 mg/l or more through normal use, the recycling facility will produce recycled water with a TDS concentration of 1,000 mg/l or higher. Figure 7-1 shows the average TDS at several existing water recycling facilities. In general, TDS concentrations over 1,000 mg/l become problematic for irrigation and industrial reuse customers. This problem greatly limits the potential uses and marketability of recycled water, particularly for agricultural purposes, because certain crops and nursery stock are sensitive to irrigation water with TDS levels exceeding 1,000 mg/l. In May 2009, the SWRCB adopted a Recycled Water Policy to help streamline the recycled water permitting process as it relates to meeting basin plan objectives for TDS and nutrients. The policy encourages the development of basin-specific salt and nutrient management plans that identify sources of salt and nutrient loading to the basin, so the focus can be on the greatest sources of salt and nutrients. This can provide greater flexibility for recycled water projects to meet TDS and nitrate limitations. Several salt and nutrient management plans were developed for key groundwater basins. These are described in more detail in Section Development of low TDS supplies such as brackish groundwater desalination, seawater desalination and potable reuse will further reduce salt loadings to the groundwater basins. The lower TDS source water will also reduce the salt concentration in the recycled water and the need for desalination of recycled water. Final 2015 Urban Water Management Plan 7-10 June 2016
119 San Diego County Water Authority Section 7. Water Quality Figure 7-1 Recycled Water Facility Average TDS (mg/l) 1,200 1,064 1,052 1, TDS (MG/L) Carlsbad WRF Hale Avenue WRF Meadowlark WRP North City WRP South Bay WRP San Elijo WRP Ray Stoyer WRF San Vicente WRP Recycled Water Facility 7.7 Seawater Desalination The feedwater source for the regional seawater desalination plant at the Encina Power Station in Carlsbad is the Pacific Ocean. The salinity of the Pacific Ocean in San Diego County is fairly stable, with a TDS concentration around 34,000 mg/l. To address TDS concentrations at this level, the desalination facility uses an RO membrane treatment process to reduce the TDS to less than 350 mg/l, resulting in approximately 99 percent removal of TDS and a supply that meets drinking water standards. Prior to distribution, the desalinated water is post-treated for stabilization and corrosion control. The desalinated water is blended with other Water Authority treated water supplies at the Twin Oaks Valley WTP. The concentration of TDS in the blend water will vary seasonally depending on system demands. Agencies upstream of Twin Oaks will not normally receive the lower TDS water from the Seawater Desalination Plant. Two member agencies, Carlsbad MWD and Vallecitos WD, have, or will have, connections directly to the pipeline delivering desalinated seawater. Prior to the RO process, the feedwater is pretreated to remove suspended solids, including organic material. The RO process then removes the dissolved solids. Next, the product water is post-treated to prevent corrosion in the distribution system and improve the aesthetic quality of the water. This process generally involves adding alkalinity to the treated water. The final step, a disinfection process, provides a disinfection residual in the treated water. Final 2015 Urban Water Management Plan 7-11 June 2016
120 San Diego County Water Authority Section 7. Water Quality A single-pass RO process of seawater generally results in about 50 percent recovery of treated water. The remaining 50 percent is discharged as concentrate, with about twice the salinity of the original feedwater. The concentrate is diluted to avoid negative impacts to the marine environment from the elevated salinity levels prior to discharge. 7.8 Potable Reuse Several member agencies are considering potable reuse projects through groundwater recharge, augmenting local reservoir supplies or augmenting raw water supplies upstream of a surface water treatment plant. Because the raw water comes from wastewater treatment plants, a high level of treatment is required to ensure the safety of the water supply. Wastewater contains pathogens; known chemical contaminants, which have an adopted MCL; and constituents of emerging concern. It also contains TOC, which could lead to the formation of disinfection byproducts if not properly managed. To ensure public health protection, potable reuse projects will rely on source control programs, multiple treatment barriers, and monitoring to ensure reliable removal of pathogens and chemical constituents from the water supply. RO and advanced oxidation are common advanced treatment processes used for potable reuse projects. The advanced treatment provides a significant barrier to pathogens and constituents of emerging concern that are likely present in the wastewater. The advanced treated water could also be further treated at a downstream surface water treatment plant, which also provides a significant pathogen barrier. The advanced treated water will be very different in quality from the raw water currently supplied to local surface water treatment plants from the Colorado River, SWP and local supplies. Local surface water treatment plant operations will need to adapt to the change in water quality. The advanced treatment will result in delivery of a water supply to the customers much lower in TDS than existing water supplies. SB 918 and SB 322 required the SWRCB to adopt groundwater recharge criteria by December 31, 2014, and surface water augmentation criteria by December 31, The legislation also required the formation of an expert panel. The panel must review the surface water augmentation criteria and determine the feasibility of adopting regulations for direct potable reuse by December 31, The nature and content of the adopted criteria will impact the ability to implement potable projects in the San Diego region and the cost of those projects. Final 2015 Urban Water Management Plan 7-12 June 2016
121 Section 8 Integrated Regional Water Management Planning IRWM planning involves the coordination and integration of water planning activities occurring within a defined region to improve and maintain the reliability and quality of the region s water supply. IRWM planning recognizes that water supplies, water quality and natural resources are connected and, as such, focuses on projects that produce multiple benefits in those areas. It typically involves both governmental and non-governmental stakeholders. IRWM planning also is a mechanism through which a region becomes eligible for state grant funding for projects that help to achieve goals established through the planning efforts. Through voterapproved bond measures Proposition 50 in 2002 and Proposition 84 in 2006 DWR has awarded approximately $1.5 billion to support IRWM planning and implementation in the 48 recognized IRWM regions in California. Proposition 1, approved by the voters in 2014, makes available another $510 million to support IRWM. IRWM has been a featured element of the last three State Water Plan Updates. As the 2013 Update states, This integrated approach delivers higher value for investments by considering all interests, providing multiple benefits and working across jurisdictional boundaries at the appropriate geographic scale. The Water Authority, the City of San Diego, and the County of San Diego joined together in 2005 to form the Regional Water Management Group (RWMG) and define the San Diego IRWM planning region as the watersheds of San Diego County that are tributary to coastal waters (Figure 8-1). The RWMG in turn organized the Regional Advisory Committee (RAC) to assist in completion of San Diego's first IRWM Plan, published in 2007, and to otherwise advise the RWMG on important matters such as selection of projects for funding applications. The RWMG and the RAC worked together in to update the 2007 Plan. The RAC provides diverse representation to the IRWM Program from various functional areas related to water management, including water supply, water quality, wastewater, natural resources, watersheds, disadvantaged communities, flood management, business, agriculture, tribes and land use planning. Both the original 2007 IRWM Plan and the 2013 update were adopted by the Water Authority Board of Directors, San Diego City Council and San Diego County Board of Supervisors. The San Diego IRWM Plan forms the foundation of long-term IRWM planning in the region. It also is required for the San Diego planning region to apply for state funding. For detailed information on the San Diego IRWM Plan, visit the Plan s website: Since 2008, DWR has awarded five IRWM implementation grants totaling $89.6 million to the San Diego IRWM Planning Region (Table 8-1). The funds have come from the Proposition 84 and Proposition 50 grant programs. Final 2015 Urban Water Management Plan 8-1 June 2016

122 San Diego County Water Authority Section 8. Integrated Regional Water Management Planning Figure 8-1 San Diego IRWM Planning Region Combined, the grants have supported 56 multi-benefit projects developed by public agencies and non-profit organizations (Figure 8-2). Some $57.7 million of the funding is directed to eight projects sponsored by the Water Authority and 23 sponsored by Water Authority member agencies. The San Diego region also received a $1 million Proposition 84 planning grant that the RWMG used to support the update of the 2007 IRWM Plan so it would comply with new state guidelines and requirements. The San Diego region expects to receive approximately $39 million when DWR awards Proposition 1 grants. Final 2015 Urban Water Management Plan 8-2 June 2016
 Funding Source Proposition 50 Proposition 84, Round 1 Proposition 84, Round 2 Proposition 84, Drought Solicitation Proposition 84, Final* Date")
123 San Diego County Water Authority Section 8. Integrated Regional Water Management Planning Table 8-1. San Diego IRWM Implementation Grants (as of April 2016) Funding Source Proposition 50 Proposition 84, Round 1 Proposition 84, Round 2 Proposition 84, Drought Solicitation Proposition 84, Final* Date Awarded # of Projects Funded Grant Award $250.0 million $7.9 million $10.5 million $15.1 million Costs Billed to Date $23.1 million $4.7 million $4 million $1.2 million Projects Completed Projects at Least 80% Completed $31.1M $ Total 56 $89.6 million $33.0 million 16 8 *The Water Authority expects to execute the Proposition 84 Final grant agreement with DWR by July Figure 8-2 San Diego IRWM Grant Projects Proposition 50 Proposition 84 4 Rounds $25 million $64.6 million San Diego Region also received $1 million Proposition 84 planning grant to support 2013 IRWM Plan Update. Final 2015 Urban Water Management Plan 8-3 June 2016


124 San Diego County Water Authority Section 8. Integrated Regional Water Management Planning The San Diego IRWM Program supports the UWMP by promoting regional planning and funding projects that aim to increase water supply reliability and improve surface water and groundwater quality. IRWM planning and funding help to make possible water supply projects in the areas of seawater desalination, recycled water, local surface water and groundwater, all of which are identified in this 2015 UWMP as part of the region s projected mix of water resources. The IRWM Program also supports water conservation, another key element of this 2015 UWMP. Figure 8-3 depicts three projects funded through the IRWM Program. Figure 8-3 Examples of IRWM Projects Multiple turf replacement programs have been selected for IRWM grant funding in the San Diego region. The San Vicente Reservoir Source Water Protection, sponsored by the Water Authority with funding from the San Diego IRWM Program, helps to maintain water quality in the expanded San Vicente Reservoir. Final 2015 Urban Water Management Plan 8-4 June 2016

125 San Diego County Water Authority Section 8. Integrated Regional Water Management Planning An aerial view of Hodges Reservoir as it nears capacity. The San Diego IRWM Program is funding multiple projects that aim to solve water quality problems in Hodges Reservoir. The Water Authority has an additional role in the San Diego IRWM Program. The MOU that established the San Diego RWMG designates the Water Authority as the lead agency for purposes of applying for grants, signing grant agreements, administering grant funding and representing the RWMG to funding agencies. The Water Authority administers the grant funds for all of the individual projects with respect to reporting progress and submitting invoices to DWR and distributing funding to the project sponsors. This responsibility requires the Water Authority to contract directly with all of the project sponsors, except those projects sponsored by the Water Authority itself. To defray these administrative costs, the Water Authority receives 3 percent of all IRWM grant funds awarded to the region. Final 2015 Urban Water Management Plan 8-5 June 2016
126 San Diego County Water Authority Section 8. Integrated Regional Water Management Planning This page intentionally left blank. Final 2015 Urban Water Management Plan 8-6 June 2016
127 Section 9 Water Supply Reliability Under the Act, every UWMP must include an assessment of water supply reliability. The assessment must compare the total projected water supply and demands over the next 20 years in five-year increments under normal, single dry year, and multiple dry water years. The assessment contained in the 2015 Plan evaluates reliability through the next 25 years. Verifiable supplies are included in water supply assessments and verifications prepared by retail water agencies and are used by the cities and county in their land-use decisions regarding available water supplies for growth under SB 221 and SB 610. Those projects with adequate documentation regarding implementation and supply utilization, or existing projects already planned for expansion, are included in the assessments discussed in Sections 9.2 and 9.3. In addition to the verifiable mix of resources utilized in the reliability assessment, additional planned resources by the Water Authority and its member agencies have also been identified. Additional planned projects can further reduce the region s reliance on sources of supply from Metropolitan, such as the Bay-Delta. This section presents a summary of the water demands and supplies within the Water Authority s service area, along with the reliability assessment and discussion on additional planned projects. Results from the reliability assessment demonstrate that, even with very conservative assumptions regarding the availability of dry year supplies from Metropolitan, the region s existing and projected water resource mix is increasingly drought-resilient, but shortages still occur during a single dry-year by 2035, and more significant shortages during a multiple dry water year event beginning in These shortages can be mitigated through extraordinary water conservation actions and if necessary, dry-year transfers. 9.1 Development of Projected Water Resources Mix In summary, development of the projected mix of resources to meet future demands is based on the following factors: I. Member agency information on projected water recycling, potable reuse, groundwater, desalination, and surface water (discussed in Section 5) II. Attaining the additional regional water use efficiency targets (Section 2) III. Board approvals taken in regard to Water Authority supplies (Sections 4 and 11): a. Agreement between IID and the Water Authority for Transfer of Conserved Water, and other related agreements (Section 4.2); b. Agreements related to the ACC and CC Lining Projects, and other related agreements (Section 4.3); c. Claude Bud Lewis Carlsbad Desalination Plant Water Purchase Agreement between the Water Authority and Poseidon Water (Section 4.5); d. Acceptance of San Vicente Dam Raise Project (emergency and carryover storage) as complete (Section ); e. Approval of 2013 Regional Water Facilities Optimization and Master Plan Update (Section 1.6.4); and Final 2015 Urban Water Management Plan 9-1 June 2016
128 San Diego County Water Authority Section 9. Water Supply Reliability f. Agreements and actions related to out-of-region groundwater banking program (Section ). 9.2 Normal Water Year Assessment Table 9-1 shows the normal year assessment, summarizing the total water demands within the Water Authority s service area through the year 2040 along with the supplies necessary to meet demands under normal conditions. Section 2 contains a discussion of the normal year water demands in the Water Authority's service area. If Metropolitan, the Water Authority and member agency supplies are maintained and developed as planned, along with achievement of the additional water conservation, no shortages are anticipated within the Water Authority s service area in a normal year through In the reliability assessment, the projected supplies from Metropolitan are considered supplemental and are calculated as the increment of supply necessary to meet demands after taking into account member agency and Water Authority supplies. Metropolitan staff provided the Water Authority with estimated demands on Metropolitan that will be used in their 2015 Plan. The estimated demands are shown to be adequate to cover the supplemental need identified in Table 9-1. The data provided by Metropolitan is included in Appendix I. Table 9-1. Normal Water Year Supply and Demand Assessment (AF/YR) Water Authority Supplies IID Water Transfer 190, , , , ,000 ACC and CC Lining Projects 80,200 80,200 80,200 80,200 80,200 Lewis Carlsbad Desalination Plant 50,000 50,000 50,000 50,000 50,000 Sub-Total 320, , , , ,200 Member Agency Supplies (Verifiable Supplies) Surface Water 51,580 51,480 51,380 51,280 51,180 Water Recycling 40,459 43,674 45,758 46,118 46,858 Seawater Desalination 6,000 6,000 6,000 6,000 6,000 Potable Reuse 3,300 3,300 3,300 3,300 3,300 Brackish GW Recovery 12,100 12,500 12,500 12,500 12,500 Groundwater 17,940 19,130 20,170 20,170 20,170 Sub-Total 131, , , , ,008 Metropolitan Water District Supplies 136, , , , ,565 Total Projected Supplies 587, , , , ,773 Total Demands w/ Water Efficiency Savings 587, , , , ,773 1 Normal water year demands based on hydrology. Final 2015 Urban Water Management Plan 9-2 June 2016
129 San Diego County Water Authority Section 9. Water Supply Reliability 9.3 Dry Water Year Assessment In addition to a normal water year assessment, the Act requires an assessment to compare supply and demands under a single dry year and multiple dry water years over the next 20 years, in fiveyear increments. Section 2 describes the derivation of the dry water year demands. Table 9-2 shows the single dry-year assessment. The dry-year demands reflect long-term water use efficiency, but do not incorporate potential savings due to extraordinary conservation occurring during droughts. This approach allows for more comprehensive shortage analyses and drought response planning. Table 9-2. Single Dry Water Year Supply and Demand Assessment Five Year Increments (AF/YR) Water Authority Supplies IID Water Transfer 190, , , , ,000 ACC and CC Lining Projects 80,200 80,200 80,200 80,200 80,200 Regional Seawater Desalination 50,000 50,000 50,000 50,000 50,000 Sub-Total 320, , , , ,200 Member Agency Supplies 1 Surface Water 6,004 6,004 6,004 6,004 6,004 Water Recycling 40,459 43,674 45,758 46,118 46,858 Seawater Desalination 6,000 6,000 6,000 6,000 6,000 Potable Reuse 3,300 3,300 3,300 3,300 3,300 Brackish GW Recovery 12,100 12,500 12,500 12,500 12,500 Groundwater 15,281 15,281 15,281 15,281 15,281 Sub-Total 83,144 86,759 88,843 89,203 89,943 Metropolitan Water District Supplies 263, , , , ,720 Total Projected Supplies w/o Storage Takes 666, , , , ,863 Total Demands w/ Water Efficiency Savings 629, , , , ,765 Potential Supply (Shortage) or Surplus 37,486 (12,448) (42,623) (63,907) (91,902) Utilization of Carryover Supplies 0 12,448 42,623 40,000 40,000 Total Projected Core Supplies w/ Utilization of Carryover Storage 666, , , , ,863 Supplies Remaining Potential Surplus Supply, or (Shortage) that will be handled through Management Actions 37, (23,907) (51,902) 1 Member agency local supplies include verifiable recycling and brackish groundwater, as well as dryyear estimates for surface water and groundwater. The projected groundwater and surface water yields shown in the table are based on 2015 dry-year supplies during the present drought beginning in The verifiable supplies available from member agency projected recycling, potable reuse, and groundwater recovery projects are assumed to experience little, if any, reduction in a dry year. The Water Authority s existing and planned conserved supplies from the IID transfer, canal lining projects, and Carlsbad Desalination Plant are Final 2015 Urban Water Management Plan 9-3 June 2016
130 San Diego County Water Authority Section 9. Water Supply Reliability also considered drought-resilient supplies as discussed in Section 4. For this single dry-year assessment, it was assumed that Metropolitan is limited to 1.4 MAF of supplies due to dry conditions and increased reductions in deliveries from State Water Project (no Delta improvements) and/or reduction in Colorado River deliveries; and the Water Authority receives its preferential right based on Metropolitan s current method of calculating such rights. With a very conservative assumption regarding limited Metropolitan supplies during a single dry water year, and assuming Water Authority and member agency supplies are maintained and developed as planned, along with achievement of the additional conservation target, no shortages are anticipated within the Water Authority s service area in a single dry year until These shortages would be eliminated should Metropolitan supplies approach the supply levels projected in Metropolitan s 2015 UWMP Single Dry Year Supply Capability. As discussed in Section , the Water Authority has invested in carryover storage supply capacity, which can be utilized in dry years to improve reliability. The carryover storage investment includes both surface water storage in San Vicente Reservoir and out-of-region groundwater storage in California s Central Valley, for a total of 170,000 AF of carryover storage capacity available. As described in Section , there are a number of factors to consider when determining the utilization of carryover supplies to reduce or eliminate shortages. The storage take amount should be handled on a case-by-case basis, considering such items as, current demand trends, core supply availability, hydrologic conditions, and storage supply available for withdrawal. These factors will vary depending upon the situation. For the analysis in the 2015 Plan, it was assumed the available carryover storage would be 120,000 AF going into the dry-year period. In determining the amount to utilize, the analysis uses general guidelines, consistent with previous Water Authority planning documents, that approximately one third of the carryover supplies available in storage will be utilized in one year. Utilizing a portion of available storage supplies avoids depletion of storage reserves, thereby making water available for potential ongoing or future shortages. The supplies taken from carryover storage will be considered a Water Authority regional supply to be combined with the Water Authority s core supplies and any potential dry-year transfers. Under the Water Authority s current Transitional Special Agricultural Water Rate (TSAWR) program requirements, customers in the TSAWR class of service receive no water from the Carryover Storage Program during Stage 2 or 3 of the Water Shortage Drought Response Plan. During shortages, TSAWR deliveries are also cut back at the same level as Metropolitan s cutback to the Water Authority. Extension of the TSAWR program was approved by the Water Authority Board in March 2014 and will be revisited by the Board again in For planning purposes only, the assessments in Tables 9-3 through 9-7 do not factor in the exclusion from the Carryover Storage Program due to the uncertainties associated with the future of the program beyond This also provides a more conservative planning analysis. In years where shortages may still occur after utilization of carryover storage, additional regional shortage management measures, consistent with the Water Authority s Water Shortage and Drought Response Plan (described in Section ), will be taken to fill the supply shortfall. These measures could include extraordinary conservation, achieved through voluntary or mandatory water-use restrictions. A description of the savings achieved during the shortage period is included in Section As discussed in the following section, the amount of savings achieved through extraordinary conservation measures could be limited due to demand hardening. In addition, the Water Authority could evaluate the option of securing dry-year transfers, which the Water Authority successfully acquired and utilized during the shortage management Final 2015 Urban Water Management Plan 9-4 June 2016
131 San Diego County Water Authority Section 9. Water Supply Reliability period. (A description of the Water Authority s dry-year transfer program is included in Section ). Table 9-3. Multiple Dry Water Year Supply and Demand Assessment Five-Year Increments (AF/YR) Member Agency Supplies 1 71,950 74,034 71,267 Water Authority Supplies 230, , ,200 Metropolitan Allocation (Preferential Right) 223, , ,120 Total Estimated Core Supplies w/o Storage Takes 525, , ,587 Total Demands w/ Water Efficiency Savings 491, , ,869 Potential Supply (Shortage) or Surplus 34,710 62,724 85,718 (Difference between Supplies and Demands) Utilization of Carryover Supplies Total Projected Core Supplies w/ Utilization of Carryover Storage Supplies Remaining Potential Surplus Supply, or (Shortage) that will be handled through Management Actions 525, , ,587 34,710 62,724 85,718 1 Member agency local supplies include verifiable recycling and brackish groundwater, as well as dryyear estimates for surface water and groundwater. Table 9-4. Multiple Dry Water Year Supply and Demand Assessment Five-Year Increments (AF/YR) Member Agency Supplies 1 124, ,885 85,073 Water Authority Supplies 330, , ,200 Metropolitan Allocation (Preferential Right) 263, , ,680 Total Estimated Core Supplies w/o Storage Takes 718, , ,953 Total Demands w/ Water Efficiency Savings 640, , ,815 Potential Supply (Shortage) or Surplus 77,720 30,053 (11,862) (Difference between Supplies and Demands) Utilization of Carryover Supplies ,862 Total Projected Core Supplies w/ Utilization of Carryover Storage Supplies Remaining Potential Surplus Supply, or (Shortage) that will be handled through Management Actions 718, , ,815 77,720 30, Member agency local supplies include verifiable recycling and brackish groundwater, as well as dryyear estimates for surface water and groundwater. Final 2015 Urban Water Management Plan 9-5 June 2016
132 San Diego County Water Authority Section 9. Water Supply Reliability Table 9-5. Multiple Dry Water Year Supply and Demand Assessment Five-Year Increments (AF/YR) Member Agency Supplies 1 127, ,048 88,009 Water Authority Supplies 330, , ,200 Metropolitan Allocation (Preferential Right) 264, , ,440 Total Estimated Core Supplies w/o Storage Takes 722, , ,649 Total Demands w/ Water Efficiency Savings 699, , ,963 Potential Supply (Shortage) or Surplus 22,846 (26,076) (69,314) (Difference between Supplies and Demands) Utilization of Carryover Supplies 0 26,076 40,000 Total Projected Core Supplies w/ Utilization of Carryover Storage Supplies Remaining Potential Surplus Supply, or (Shortage) that will be handled through Management Actions 722, , ,649 22,846 0 (29,314) 1 Member agency local supplies include verifiable recycling and brackish groundwater, as well as dryyear estimates for surface water and groundwater. Table 9-6. Multiple Dry Water Year Supply and Demand Assessment Five-Year Increments (AF/YR) Member Agency Supplies 1 129, ,442 89,059 Water Authority Supplies 330, , ,200 Metropolitan Allocation (Preferential Right) 262, , ,280 Total Estimated Core Supplies w/o Storage Takes 722, , ,539 Total Demands w/ Water Efficiency Savings 728, , ,969 Potential Supply (Shortage) or Surplus (5,670) (55,481) (99,430) (Difference between Supplies and Demands) Utilization of Carryover Supplies 5,670 40,000 40,000 Total Projected Core Supplies w/ Utilization of Carryover Storage Supplies 728, , ,539 Remaining Potential Surplus Supply, or (Shortage) that will be handled through Management Actions 0 (15,481) (59,430) 1 Member agency local supplies include verifiable recycling and brackish groundwater, as well as dryyear estimates for surface water and groundwater. Final 2015 Urban Water Management Plan 9-6 June 2016
133 San Diego County Water Authority Section 9. Water Supply Reliability Table 9-7. Multiple Dry Water Year Supply and Demand Assessment Five-Year Increments (AF/YR) Member Agency Supplies 1 130, ,954 89,647 Water Authority Supplies 330, , ,200 Metropolitan Allocation (Preferential Right) 260, , ,480 Total Estimated Core Supplies w/o Storage Takes 720, , ,327 Total Demands w/ Water Efficiency Savings 749, , ,086 Potential Supply (Shortage) or Surplus (28,454) (77,957) (121,759) (Difference between Supplies and Demands) Utilization Carryover Supplies 28,454 40,000 40,000 Total Projected Core Supplies w/ Utilization of Carryover Storage Supplies Remaining Potential Surplus Supply, or (Shortage) that will be handled through Management Actions 749, , ,327 0 (37,957) (81,759) 1 Member agency local supplies include verifiable recycling and brackish groundwater, as well as dryyear estimates for surface water and groundwater. In accordance with the Act, Tables 9-3, 9-4, 9-5, 9-6, and 9-7 show the multiple dry water year assessments in five-year increments. Similar to the single dry-year assessment, the member agencies surface and groundwater yields shown in these tables are reflective of supplies available during the present drought, beginning in 2012, for years 2013, 2014 and However, due to recent supply conditions, the analysis for the 2017 to 2019 period was based on a different assumption. For this period, it was assumed water supplies are based on current levels for the first year and reduced down to actual 2015 levels over the three-year cycle ending with While surface and groundwater yields are based on historic estimates, recycled and brackish groundwater yields are based on projected growth in these member agency supplies. For the multiple dry-year reliability analysis, the conservative planning assumption is that Metropolitan will be allocating supplies to its member agencies. By assuming allocations in this reliability assessment, it allows the Water Authority to analyze how storage supplies could potentially be utilized and the likelihood of shortages. Currently, Metropolitan allocates supplies through its WSAP. Because it is uncertain in the future how Metropolitan will allocate supplies to its member agencies, the analysis in the tables assumes supplies are allocated based on preferential right to Metropolitan supplies. As discussed above in Section 6.1.1, Section 135, Preferential Right to Purchase Water, is included in the Metropolitan Act and allows a Metropolitan member agency to acquire, for use within the agency, supplies based on preferential right at any time. The Water Authority s annual preferential right percentage of Metropolitan supplies, used in Tables 9-3 through 9-7, is estimated through 2040 and is based on Metropolitan s current method of calculating preferential rights. In 2015, a Superior Court ruled Metropolitan under-calculated the Water Authority s preferential right to Metropolitan water. That ruling is being appealed. The analysis assumes the total Metropolitan dry-year supplies available for allocation to be 1.2 MAF for the period of 2017 to 2019 due to temporal proximity to current dry conditions and depleted storage levels; and a decreasing amount of 1.4 MAF, 1.3 MAF, and 1.2 MAF for the first, second, and Final 2015 Urban Water Management Plan 9-7 June 2016
134 San Diego County Water Authority Section 9. Water Supply Reliability third year respectively for the remaining multi-year dry periods. A conservative methodology was employed due to the numerous uncertainties associated with identifying Metropolitan s future available supplies and storage. In Section 10, there are scenarios presented that modify the dryyear supplies available for allocation. This total supply assumes reduced deliveries from the State Water Project and Colorado River Aqueduct along with limited storage supplies. This conservative approach is based on Water Authority s experience with the current 5-year drought and its adverse impacts on imported water supplies. Based on recent available information, the demands for the period of 2017 to 2019 were adjusted to align with current demands that were dampened due to the statewide Emergency Conservation Regulation. Specifically, the 2017 demands were adjusted to match demands from the Water Authority s Calendar Year 2017 Rates and Charges forecast to yield more accurate demand projections. Years 2018 and 2019 demands were then increased one percent from the previous year to account for minimal growth. As a result of this adjustment to the demands, there is a step-up in demand between Tables 9-3 and 9-4 that provides for a return to, and alignment with, the un-dampened dry year demand projections developed for the 2015 Plan. The rest of the multi dry-year periods have the first year based on the multi dry-year demand forecast with the next two years being increased one percent from the previous year to account for growth. This method for the multi dry-year events was used in order to account for the lower than normal demand increases being experienced by the Water Authority and its member agencies as they respond to the current drought and conservation efforts. Under specific parameters assumed in the multi dry-year analysis, shortages are experienced, as shown in Tables 9-5 thru 9-7. The significant shortages are due to increasing water demands due to economic growth within the region and the approach of applying restricted supply from Metropolitan. As with the Single Dry Water Year Supply and Demand Assessment, these shortages could be eliminated should Metropolitan supplies approach the supply levels projected in Metropolitan s 2015 UWMP Multiple Dry Year Supply Capability. As stated in the single dry-year analysis, carryover storage would be utilized in order to lessen the impacts of a supply shortfall. It should be emphasized that the amount of extraordinary conservation savings expected to be achieved through mandatory measures, such as water-use restrictions, could be less than that experienced in the previous shortage periods due to demand hardening. Responsiveness to drought pricing and general price increases will diminish because remaining essential uses are less responsive to price. Shortage management measures such as water-use restrictions may not be as effective in the future in achieving necessary savings to help reduce the supply gap. This will reduce customer discretionary demands and create less flexibility in the managing of demand during shortages, which will increase the importance of acquiring supplemental dry-year supplies to eliminate or reduce potential supply shortages. Section discusses the Water Authority s potential dry-year supplies. Long-term permanent conservation savings is critical to ensuring water is used most efficiently and will help avoid or minimize drought situations. 9.4 Reliability of Supply The above sections identify the diverse mix of resources planned to meet future demands in both a normal and dry year. Implementation of this regional resource mix will require maintaining and Final 2015 Urban Water Management Plan 9-8 June 2016
135 San Diego County Water Authority Section 9. Water Supply Reliability developing projects and programs by the Water Authority, its member agencies, and Metropolitan. The Water Authority coordinated with its member agencies during preparation of the 2015 Plan on the future demands and supplies projected for the region. The steps being taken by the member agencies and Metropolitan to develop supplies are addressed in their respective UWMPs. Section 4 contains the steps taken and remaining actions necessary to develop and maintain the Water Authority supplies. The Act requires agencies to describe reliability of the water supply and vulnerability to seasonal and climatic shortage. Section 9.2 and Section 9.3 describe the results of the water supply reliability assessment for the region, during normal water years, single dry years, and multiple dry years. The Act also requires the 2015 Plan to contain historic data on supplies available for the three water year types. The following are the historic total supplies, both local and imported, that were utilized during the periods identified: Normal/average based on a 30-year average between 1986 and 2015, single dry year based on 2015, and multiple dry water years based on years Supplies utilized in a non-allocation dry period could exceed the supplies utilized in a normal year, due to the ability to purchase additional imported supplies from Metropolitan. It should also be noted that in the reliability assessment, contained in Section 9.2, the average local supply yields are not based on historic yields, but projected numbers provided by member agencies. These figures more accurately reflect the expected yield based on current local agency policies and procedures on operations and management of the supply. Key to long-term reliability will be the monitoring of supplies and demands in order to make necessary modifications to the core and dry-year resources identified in the normal and dry-year resource mixes. The Water Authority Board will monitor reliability of existing supplies and development of identified future supplies through the Annual Supply Report and five-year updates to the UWMP. The Act requires that, for any water source that may not be available at a consistent level of use, given specific legal, environmental, water quality, or climatic factors, the agency describe, to the extent practicable, plans to replace that source with alternative sources or water demand management measures. As stated throughout the 2015 Plan, the Water Authority and its member agencies are planning to develop a diverse supply of resources. The unavailability of any one supply source will be buffered because of the diversity of the supplies: the region is not reliant on a single source. To replace or supplement an existing supply, the Water Authority could take steps to further long-term efficient water use and work with member agencies to further maximize development of recycled water, potable reuse, groundwater, and seawater desalination. To adequately plan for potential supply uncertainties and identify alternative sources, the 2015 Plan contains a scenario planning process described in Section Additional Planned Supply Projects The mix of current and future supplies is developed jointly between the Water Authority and its member agencies. The mix of supplies is being represented in two ways. Verifiable supplies are those supplies identified by the Water Authority or member agencies as having achieved a level of certainty in their planning and implementation, such as where CEQA has been satisfied, permits are in hand, or contracts have been executed. As part of this general definition, these projects also have the political support of the governing body to move forward and be implemented at this time. Verifiable supplies are included in water supply assessments and verifications prepared by retail Final 2015 Urban Water Management Plan 9-9 June 2016
136 San Diego County Water Authority Section 9. Water Supply Reliability water agencies and used by the cities and county in their land use decisions regarding available water supplies for growth under SB 221 and SB 610. Those projects with adequate documentation regarding implementation and supply utilization, or existing projects already planned for expansion, are included in the assessments discussed in Sections 9.2 and 9.3. Additional planned supplies are those that have not yet achieved the same level of certainty as the verifiable supplies, but have progressed to a point where the Water Authority or a member agency has taken significant financial actions to pursue the project. Additional planned supplies are not included in supply verifications for SB 221 and SB 610. These additional planned supplies are important to the region for a number of reasons. The Water Authority and member agencies must continue to strive to develop cost-effective local resources that can further diversify the region s supplies and reduce demands for imported water from Metropolitan. In particular, member agency additional planned supplies, if implemented, would also reduce or potentially eliminate the later dry year shortages shown in Section 9.3. They provide objectives for the region to work toward by resolving any funding, regulatory, and other constraints associated with implementation. As part of conducting comprehensive supply planning, both the verifiable and additional planned projects are evaluated in regard to meeting future demands and the need for supplemental supplies from Metropolitan. Table 9-8 includes the evaluation of verifiable and additional planned projects compared with projected water demands in a normal year. It is important to emphasize that this evaluation is presented as a potential supply scenario and not the region s reliability analysis for purposes of compliance with state laws governing approval of land use projects (SB 610 and SB 221). The specific member agency local recycled water, potable reuse and brackish groundwater projects included in the figures are listed in Tables F-2 and F-4, respectively, in Appendix F. Also included in Appendix F are conceptual projects identified by the member agencies. Final 2015 Urban Water Management Plan 9-10 June 2016
137 San Diego County Water Authority Section 9. Water Supply Reliability Table 9-8. Supply Scenario with Additional Planned Projects (Normal Year AF/YR) Water Authority Supplies IID Water Transfer 190, , , , ,000 ACC and CC Lining Projects 80,200 80,200 80,200 80,200 80,200 Regional Seawater Desalination 50,000 50,000 50,000 50,000 50,000 Water Authority Additional Planned (Desal) Sub-Total 320, , , , , ,600 5,600 61,600 61,600 Water Authority Total 320, , , , ,800 Member Agency Supplies Verifiable Total 131, , , , ,008 Additional Planned Surface Water Water Recycling 2,840 9,926 10,926 10,926 10,926 Seawater Desalination 0 15,100 15,600 16,100 16,800 Potable Reuse 4,470 29,086 46, , ,099 Brackish GW Recovery Groundwater 3,100 3,100 3,600 3,600 3,600 Member Agency Total 141, , , , ,433 Total Projected Local Supplies 461, , , , ,233 Metropolitan Water District Supplies Total Demands w/ Water Efficiency Savings 125, , ,001 26,538 49,540 Total Supplies 587, , , , ,773 1 Normal water year demands based on hydrology. 587, , , , ,773 Final 2015 Urban Water Management Plan 9-11 June 2016
138 San Diego County Water Authority Section 9. Water Supply Reliability This page intentionally left blank. Final 2015 Urban Water Management Plan 9-12 June 2016
139 Section 10 Scenario Planning Managing an Uncertain Future The Water Authority s water supply reliability assessment can be found in Section 9. The Act also requires that, for any water source that may not be available at a consistent level of use, given specific legal, environmental, water quality, or climatic factors, the agency describe to the extent practicable, plans to replace that source with alternative sources or water demand management measures. To adequately assess the reliability of the region s future resource mix and plan for potential uncertainties of the water supply sources, the 2015 Plan update incorporates a traditional scenario planning process. The process assesses potential risks associated with implementation of the projected resource mix and identifies management strategies to help deal with the uncertainties. A procedure to track development of supply sources to determine when and if potential adaptive management strategies may be needed is also included. A list of the primary source documents used to prepare this section is included in Section One of the foundational documents used as a resource in selecting the traditional scenario planning process is the 2010 Water Utility Climate Alliance Decision Support Planning Methods: Incorporating Climate Change Uncertainties into Water Planning (2010 WUCA Report) Traditional Scenario Planning Process Various decision support planning methods are available to planners that incorporate uncertainty and risk assessment into water planning. Traditional scenario planning was selected for the 2015 Plan based primarily on the following factors: Used for uncertainty analysis specific to water resources/water utility planning Develops a small but wide ranging set of future scenarios to test and make planning decisions more robust Highly transparent, easily implemented with medium level of development by internal staff, outside expertise not required Does not require extensive computer power, can accommodate changes in assumptions, inputs and objectives Uses concepts familiar to stakeholders, improves understanding and communicability, and avoids the black box issue The basic steps for the 2015 Plan scenario planning process are summarized below: 1. Define the focal issue or central question for the process that will be assessed and ultimately answered through the process; 2. Identify the projected water resource supply mix; 3. Identify critical uncertainties that could influence implementation of the mix; Final 2015 Urban Water Management Plan 10-1 June 2016
140 San Diego County Water Authority Section 10. Scenario Planning Managing an Uncertain Future 4. Formulate potential scenarios based on the critical uncertainties; 5. Identify common strategies to manage the scenarios; and 6. Establish key tracking metrics that evaluate the status of supply sources in the projected resource mix and whether adaptive management strategies are required to ensure continued reliability. Each of the steps taken is described in the remainder of this section Definition of the Focal Issue or Central Question The focal issue or central question to be assessed and ultimately answered through the scenario planning process is: In this climate of supply uncertainty and scarcity, how will the Water Authority and its member agencies adaptively provide a water supply that is reliable and drought-resilient over the next 25 years? Identify Projected Water Resource Mix As discussed in Section 9, in coordination with the member agencies, a projected resource mix to meet future demands was generated in five-year increments. For the scenario planning process, the projected mix in 2035 was selected for evaluation in order to capture long-term supply planning. The normal weather resource mix in 2035 is based on the following factors: Member agency implementation of projected verifiable water recycling, and brackish groundwater recovery projects Member agency long-term water efficiency savings Average yield from surface and groundwater supplies Water Authority s QSA supplies delivered in accordance with agreements Deliveries from the Carlsbad Desalination Plant in accordance with the Water Purchase Agreement To determine Metropolitan s supply to the Water Authority, its preferential rights allocation methodology was used. In 2035, the Water Authority s right is estimated to be approximately percent with Metropolitan at 1.5 million AF of supply available. 1 (Refer to Section for details on preferential rights.) Under normal weather, Metropolitan is able to meet the supplemental needs. Figure 10-1 below includes the projected water resource mix for 2035 under normal weather conditions. The scenarios illustrated in the process include member agency long-term water 1 Forecasted number using Metropolitan s current methodology to calculating the preferential rights for the Water Authority; a Superior Court in 2015 ruled Metropolitan under-calculated the Water Authority s preferential rights, a decision that is being appealed by Metropolitan. Final 2015 Urban Water Management Plan 10-2 June 2016
 As shown in Figure 10-1, if the projected Metropolitan, Water Authority, and member agency supplies are maintained and developed as planned, no shortages are")
141 San Diego County Water Authority Section 10. Scenario Planning Managing an Uncertain Future efficiency savings to highlight the expected volume and importance in evaluating supply uncertainties. Figure 10-1 Normal Year (2035) As shown in Figure 10-1, if the projected Metropolitan, Water Authority, and member agency supplies are maintained and developed as planned, no shortages are anticipated within the Water Authority s service area in 2035 in a normal year. Consistent with the Act, it is important that a risk assessment be conducted on the projected resource mix to ensure long-term reliable and sustainable water supplies to meet demands. This is accomplished through the scenario planning process, with the next step being to identify the critical uncertainties Critical Uncertainties Associated with Implementation of Projected Resource Mix Following identification of the projected resource mix, the next step in the analysis is to identify critical uncertainties surrounding implementation of the mix. Table 10-1 provides a list of the critical uncertainties based on source documents, such as the DWR 2013 California Water Plan Update. The list does not include all the uncertainties water planners face, but focuses on critical uncertainties associated with supply planning reliability. For example, managing uncertainties associated with physical system reliability, such as a potential pipeline failure, is handled through the Water Authority s Integrated Contingency Plan: Emergency Operations Plan. The critical Final 2015 Urban Water Management Plan 10-3 June 2016
142 San Diego County Water Authority Section 10. Scenario Planning Managing an Uncertain Future uncertainties form the basis for developing potential future scenarios. To aid in the process of formulating the potential scenarios, the uncertainties are categorized into whether the source of change is gradual over the long term or more sudden. Table Critical Uncertainties Associated with Implementation of Projected Resource Mix Sources of Gradual Change and Uncertainty Demographic Growth deviates from SANDAG Forecast Climate Change Impacts from long-term changes in temperature and precipitation Snowpack Hydrologic Pattern Rainfall Seal Level Rise State Water Project Reliability Willingness to pay for Delta Fix Sources of Sudden or Short-term Change and Uncertainty Droughts Severity, timing, and frequency Changing Policies/Regulations/Laws/Social Attitudes Regulatory restrictions are put in place that further limit supply availability Emerging Contaminants Endangered Species Plumbing Codes Delta Levee Failure Delta levees fail due to earthquake or flooding and supplies are curtailed from State Water Project Local Supplies not Developed as Planned Notes: Format adopted from DWR California Water Plan Update 2013, Volume 1, Chapter Scenario Analysis Future Potential Scenarios Based on Critical Uncertainties Traditional scenario planning, also known as traditional scenario analysis is a methodology that relies on developing future scenarios that consider a variety of potential future situations. (WUCA, 2010) The scenarios are plausible, but not predictions or forecasts of the future. They incorporate the water supply uncertainties urban water planners face and can be qualitative, quantitative or both. Important to traditional scenario planning is to select just a few scenarios that focus on critical uncertainties and avoid having too many scenarios. When working with numerous scenarios they will begin to blur and lose their meaningful distinctions as decision tools. From the scenario analysis, common strategies are developed to manage the uncertainties. The five potential scenarios developed based on the uncertainties are listed in Table 10-2, followed by a detailed description. Table Future Potential Scenarios Based on Critical Uncertainties Future Potential Scenarios Identified for Planning Purposes 1 Drought 2 Drought with Further Limitations on Metropolitan Supplies 3 Drought with Limited Metropolitan Supplies and Member Agency Local Supplies 4 Demographic Shift 5 Climate Change Final 2015 Urban Water Management Plan 10-4 June 2016
.")
143 San Diego County Water Authority Section 10. Scenario Planning Managing an Uncertain Future The five scenarios and potential supply gap are described below. Scenario 1: Drought Scenario 1 is a dry-year situation developed based on the following factors: Single dry-year demands derived from CWA-MAIN modeling effort (refer to Section 2). Metropolitan is allocating supplies due to dry conditions. It is unknown how Metropolitan will allocate supplies in the long term. For this reason and for conservative planning purposes, the Water Authority s allocation is based on its preferential right to purchase supplies from Metropolitan. In 2035, that right is estimated to be approximately percent with 1.4 million AF of supply available (refer to Section for details on preferential rights). Surface and groundwater supply yields reduced based on 2015 dry-year supplies. Supplies utilized from carryover storage reserves. Verifiable member agency projected water recycling and brackish groundwater supplies. Water Authority s QSA supplies are being delivered in accordance with agreements. Deliveries from the Carlsbad Desalination Plant are made in accordance with the Water Purchase Agreement. The projected mix of supplies and potential gap are shown in Figure Figure 10-2 Scenario 1 Drought (2035) Final 2015 Urban Water Management Plan 10-5 June 2016

144 San Diego County Water Authority Section 10. Scenario Planning Managing an Uncertain Future Scenario 2: Drought with Further Limitations on Metropolitan Supplies Scenario 2 was developed utilizing the same variables identified in Scenario 1, with the following modification: Metropolitan supplies are further limited and being allocated to the member agencies due to a prolonged multi-year drought: Metropolitan limited to 1.2 million acre-feet of supplies due to dry conditions and increased reductions in deliveries from State Water Project (no Delta improvements) and/or reduction in Colorado River deliveries, and Water Authority receives estimated preferential right allocation of percent. The projected mix of supplies and potential gap are shown in Figure Figure 10-3 Scenario 2 Drought with Further Limits on Metropolitan Supplies (2035) Final 2015 Urban Water Management Plan 10-6 June 2016

145 San Diego County Water Authority Section 10. Scenario Planning Managing an Uncertain Future Scenario 3: Drought with Limited Metropolitan Supplies and Member Agency Local Supplies Scenario 3 was developed utilizing the same variables identified in Scenario 2, except that the verifiable recycled, potable reuse and brackish groundwater supplies are not developed as planned and remain at 2015 levels. The projected mix of supplies and potential gap are shown in Figure Figure 10-4 Scenario 3 Drought with Limited Metropolitan & Member Agency Local Supplies (2035) Scenario 4: Demographic Shift As discussed in Section 2, the Water Authority s demand projections are driven by SANDAG s most recent regional growth forecast. In turn, the regional growth forecast is based on the cities and county general plans. Under this scenario, land use development approval would differ from that identified in the cities and county general plans. Depending upon the variation in housing type, demands could be higher or lower. Single-family homes with larger lots (lower density and potentially more irrigated landscape) will generally use more water than multi-family units (higher density). One potential scenario that would cause demands to be higher than projected is if the multi-family units included in the growth forecast are approved as single-family units. The magnitude of a potential housing shift is difficult to quantify. The effect on water demands due to a shift in demographics would be a gradual change that would be captured in each five-year update to the UWMP. Projected demands in the UWMP updates would be based on SANDAG s most recent growth forecast, which would reflect changes to land use plans occurring between plan updates. In part to deal with this uncertainty associated with land use approvals occurring during the 2015 Plan planning horizon, an additional demand increment, termed Accelerated Forecasted Growth, has been included in the regional total demand forecast, as discussed in Section 2. Final 2015 Urban Water Management Plan 10-7 June 2016
146 San Diego County Water Authority Section 10. Scenario Planning Managing an Uncertain Future Scenario 5: Climate Change Scenario 5 considers the potential influence climate change may have on the projected resource mix. Because there are still too many uncertainties regarding the impact of climate change on supplies and demands, a qualitative risk assessment is conducted. The assessment is based primarily on the DWR October 2008 Report entitled Managing an Uncertain Future; Climate Change Adaptation Strategies for California s Water. When evaluating the effects of climate change on long-term water supply planning, a distinction should be made between climate and weather. Weather consists of the short-term (minutes to months) changes in the atmosphere. Climate is how the atmosphere behaves over relatively long periods of time. Climate change refers to changes in long-term averages of daily weather. Changes to climate will be gradual, providing water supply agencies the ability to adapt planning strategies to manage for the supply uncertainties. The effect on supply would be gradual and captured in each five-year update to the UWMP. Researchers have concluded that increasing atmospheric concentrations of GHGs, such as carbon dioxide, are causing Earth s air temperature to rise. While uncertainties remain regarding the exact timing, magnitude, and regional impacts of the temperature and potential precipitation changes due to climate change, researchers have identified several areas of concern that could influence longterm water supply reliability. These potential areas are listed below. Loss of Natural Snowpack Storage. Rising temperatures reduce snowpack in the Sierra Nevada because more precipitation falls as rain, and snowmelt occurs sooner. Snowpack in the Sierra Nevada is the primary source of supply for the State Water Project. Snowpack is often considered a large surface reservoir, where water is slowly released between April and July each year. Much of the state s water infrastructure was designed to capture the slow spring runoff and deliver it during the drier summer and fall months. DWR projects that the Sierra Nevada snowpack will experience a 25 to 40 percent reduction from its historic average by Sea Level Rise. Rising sea levels could increase the risk of damage to water and water recycling facilities from storms, high-tide events, and erosion of levees. A potential catastrophic levee failure in the Delta could interrupt supplies from the State Water Project, potentially reducing supply deliveries to the San Diego region from Metropolitan. In addition, rising sea levels could cause saltwater intrusion into the Delta, degrading drinking water quality. More freshwater releases from upstream reservoirs would be required to repel the sea to maintain salinity levels for municipal, industrial, and agricultural uses. Changes in Average Precipitation and Runoff Volume. The effect of climate change on overall precipitation and runoff volumes is still unclear and highly uncertain. For example, a number of studies conclude that the flow of the Colorado River may be reduced by climate change, but a wide disparity exists on the predicted volume. The yield from local surface water resources could potentially be reduced, if annual runoff volumes are reduced due to a decline in precipitation or an increase occurs in evapotranspiration in reservoirs. It must be highlighted that research is still highly unclear on how precipitation levels may be impacted by climate change. Change in Frequency and Intensity of Droughts. Warming temperatures, combined with potential changes in rainfall and runoff patterns, could exacerbate the frequency and intensity of droughts. Final 2015 Urban Water Management Plan 10-8 June 2016
147 San Diego County Water Authority Section 10. Scenario Planning Managing an Uncertain Future Demands Levels. Climate change could also gradually affect water demands out in the future. Warmer temperatures increase evapotranspiration rates and the growing season, which are likely to increase outdoor consumptive water use for landscaping. As part of the water demand forecasting effort for the 2015 Plan, the long-term influence of climate change on demands in the San Diego region was evaluated. Results from the analysis are included in Section 2. All five of the areas discussed above focus on the potential effect climate change could have on future supply reliability. The potential long-term effect is a possible decrease in the availability of imported supplies from Metropolitan and local supplies causing a potential gap between supply and demands. With so many unknowns regarding the actual impact, the previous uncertainty scenarios could be seen as capturing any potential shortfalls in supply due to climate change. In addition, the supply and demand impacts from climate change will start to be experienced within the 2015 Plan 25-year planning horizon and should be considered in establishing no regret strategies that provide water supply benefits within the planning horizon, while increasing the ability to manage potential climate change impacts in the future Strategies to Strengthen Implementation of Resource Mix and Manage Uncertainty Scenarios For each projected scenario, including the projected resource mix, management strategies are identified to both strengthen likelihood of development of identified resources and fill potential gaps in supply. The strategies are generally common to all the scenarios, meaning that such projects and programs will be useful under a wide range of possible outcomes. As a result, the strategies are more likely to be viable as the future unfolds. The strategies include individual elements that can consist of policies and programs, as well as, various potential construction projects. The management strategies included in the 2015 Plan scenario planning process are derived based on previous Water Authority Board actions on policies and programs surrounding supply reliability and development. Table 10-3 contains strategies that the Water Authority can employ to aid in the implementation of the supplies identified in the projected resource mix and manage uncertainty scenarios. The strategies focus on programs, many of which are already being implemented consistent with Water Authority Board policy. Final 2015 Urban Water Management Plan 10-9 June 2016
148 San Diego County Water Authority Section 10. Scenario Planning Managing an Uncertain Future Table Potential Common Strategies to Strengthen Implementation of Projected Resource Mix and Manage Uncertainty Scenarios Foundational Strategy Potential Water Authority Policies/Programs Reduce reliance on Metropolitan supply sources to ensure the existing and projected water resource mix is reliable and drought-resilient. Member Agency Local Projects Provide technical assistance to member agencies in the planning, design, and construction of local projects. Advocate at local, state, and federal levels for minimizing regulatory constraints and enacting acceptable and practicable regulatory standards that allow member agencies to maximize local supply project development. Advocate for state and federal funding for local projects and work with agencies to ensure projects qualify for funding. Water Conservation Offer programs that encourage long-term behavioral change toward measureable reductions in outdoor water use. Climate Change Encourage focused scientific research on climate change to identify the impacts on the San Diego region s imported and local water supplies. In addition to the policies and programs identified in Table 10-3, Table 10-4 provides a list of the potential management strategies that the Water Authority and member agencies can take in regard to managing the uncertainty scenarios and filling potential gaps. As discussed in Section 9.5, development of additional planned projects is critical to continue reducing the region s reliance on Metropolitan supply sources and increasing the region s self-reliance. In addition, member agency projects, such as potable reuse, not only provide the agency a supply reliability benefit, but can also provide other benefits, such as reducing wastewater flows to a downstream treatment plant and ultimately the ocean. Final 2015 Urban Water Management Plan June 2016
149 San Diego County Water Authority Section 10. Scenario Planning Managing an Uncertain Future Table Potential Strategies to Manage Uncertainty Scenarios (2035) Potential Strategy Member Agency Potential Additional Planned Local Projects 1 Estimated Yield (AF) Potable Reuse 106,099 Additional Planned Recycled Water and Brackish Groundwater 10,926 Fallbrook PUD/MCB Camp Pendleton Groundwater Recharge and Recovery Project 3,100 Otay WD Rosarito Beach Desalination Project 16,100 Total Additional Planned Local Projects (Member Agencies): 136,225 Water Authority Potential Strategies Carlsbad Desalination Plant Additional Capacity 5,600 Potential Regional Seawater Desalination Facility (MCB Camp Pendleton Phase I) 2 : Regional Shortage Management Actions (Dry-year transfers and potential extraordinary conservation savings) 56,000 Total Minimum Estimated Yield from Potential Strategies: 197,825 1 The estimated yields from the additional planned local supply projects are from the member agencies, and the development and implementation of these supplies rest with the member agencies. 2 Ultimate decision to move forward on construction of the proposed MCB Camp Pendleton desalination project would be considered in context of the development of member agency local supplies, such as potable reuse, changes in imported supply reliability, and regional water demand levels. 3 Availability of dry-year supplies is described in Section In regard to Scenario 6: Climate Change, the strategies outlined in Tables 10-3 and 10-4 can also be used to manage the supply uncertainties associated with a changing climate. For example, the foundational strategy to diversify the region s resource mix through development of local projects, such as recycled water and seawater desalination, reduces reliance on imported and local surface supplies, whose yields could potentially decrease as a result of climate change. The strategies identified in this section provide supply reliability benefits within the planning horizon, while increasing the ability to manage potential climate change impacts in the future. A number of factors influence the decision to develop a new supply project, such as reliability, political will, community support, cost and financing. A key factor often considered when evaluating potential supply strategies is the project costs. As listed in Table 10-4, extraordinary conservation is identified as a potential shortage management action to assist in managing uncertainties. It should be noted that the amount of extraordinary savings expected to be achieved through mandatory measures, such as water-use restrictions, could be less than that experienced in the current and previous shortage periods. This is due to the concept known as demand hardening, which is described in the dry-year reliability assessment (Section 9.3). Final 2015 Urban Water Management Plan June 2016
150 San Diego County Water Authority Section 10. Scenario Planning Managing an Uncertain Future Key Tracking Metrics Track Progress on Implementation of Projected Resource Mix and Need for Adaptive Strategies Through the scenario analysis, the projected resource mix plus the five uncertainty scenarios have been identified. Potential strategies to strengthen implementation of the resource mix and manage the uncertainty scenarios have been identified. The critical final step, which links these two components, is to establish a few key tracking metrics that evaluate the status of supply sources in the projected resource mix and whether the adaptive management strategies are required to ensure continued reliability. The primary vehicle for reporting to the Board on the metrics would be through the Water Authority s Annual Water Supply Report. Water Authority Administrative Code Section outlines preparation of an annual water supply report that would provide information on the reliability of existing supplies and implementation of plans and programs to meet the future water supply requirements. The annual report serves as an excellent vehicle to monitor the key tracking metrics. A complete evaluation and update of the resource mix would occur every five years with update of the UWMP. Table 10-5 highlights the timing upon which the Water Authority Board would track progress on implementation of the projected resource mix. If necessary, reporting to the Board on issues related to implementation of the resource mix could occur more frequently. Table Tracking Progress on Implementation of Resource Mix Time Period Vehicle Purpose Annually (except UWMP years) At Least Every five years Annual Supply Report to Board (Consistent with Administrative Code Section ) Urban Water Management Plan Update Utilizing key indicators, conduct evaluation and track progress on implementation of UWMP projected water resource mix Conduct evaluation of supply and demand conditions and update projected resource mix As Needed Reports to Board Update the Board on issues impacting resource mix implementation With the many unknown factors and outside influences affecting development of supply sources in the projected mix, the key metrics for tracking implementation will be included in the next update of the annual supply report. The metrics could be reset with each annual supply report update. Examples of metrics include evaluating the status of the following items: State and federal efforts to fix the Bay-Delta Supply conditions on the Colorado River and likelihood of the Secretary of Interior declaring shortages Regional storage programs Member agency development of local supplies consistent with the targets identified in the 2015 Plan The analysis included in the annual supply report will include a discussion on the status of meeting the metrics and overall implementation of the projected resources mix. Highlighting this list of Final 2015 Urban Water Management Plan June 2016
151 San Diego County Water Authority Section 10. Scenario Planning Managing an Uncertain Future metric, does not preclude other metrics from being evaluated in the supply report. Key to the reporting will also be an update on the potential strategies; whether they remain a viable option taking into account specific project studies and political decisions made over the reporting period Conclusion As identified at the beginning of the scenario planning process, the focal question that ultimately needed to be answered as a result of this process is: In this climate of supply uncertainty and scarcity, how will the Water Authority and its member agencies adaptively provide a water supply that is reliable and drought-resilient over the next 20 years? Based on the results of the scenario planning process, the Water Authority and its member agencies can help ensure a long-term reliable water supply for the region through the following four basic measures: 1. Implementation of the diverse resource mix identified in the 2015 Plan, including the long-term water-use efficiency targets; 2. Continue to implement additional planned local projects, with a priority on member agency projects, that would strengthen implementation of the projected resource mix, continue to reduce reliance on Metropolitan supply sources, and manage potential shortfalls in development of supplies identified in the resource mix; and 3. Conduct annual tracking and reporting on implementation of the mix that will allow the Water Authority and its member agencies to adjust based on actual supply availability and conditions and take appropriate action if necessary, if supplies in the resource mix are not developed as planned Primary Source Documents California Department of Water Resources. California Water Plan Update 2009 and Chapter 5: Managing an Uncertain Future. California Department of Water Resources, Managing an Uncertain Future; Climate Change Adaptation strategies for California s Water. Hanak, Ellen and Lund, Jay, Adapting California s Water Management to Climate Change, Public Policy Institute of California. Howe, Charles W., and Goemans, Christopher, The Simple Analytics of Demand Hardening. Journal AWWA. Metropolitan Water District 2010 Urban Water Management Plan Schartz, Peter, The Art of the Long View: Planning for the Future in an Uncertain World. U.S. Geological Survey Circular 1331, Climate Change and water resources management A Federal Perspective Water Utility Climate Alliance (WUCA), Decision Support Planning Methods: Incorporating Climate Change Uncertainties into Water Planning Final 2015 Urban Water Management Plan June 2016
152 San Diego County Water Authority Section 10. Scenario Planning Managing an Uncertain Future This page intentionally left blank. Final 2015 Urban Water Management Plan June 2016
153 Section 11 Shortage Contingency Analysis The Act requires that urban water agencies conduct a water shortage contingency analysis as part of their 2015 plans. This section includes the Water Authority s analysis and plans to address supply shortages due to a catastrophe, drought, or other situations. An estimate of the minimum supplies available during each of the next three years, required under the Act, is also contained in this section Catastrophic Water Shortage A catastrophic water shortage occurs when a disaster, such as an earthquake, results in insufficient available water to meet the region s needs or eliminates access to imported water supplies. The following section describes the Water Authority s Integrated Contingency Plan (ICP) and ESP, both of which were developed to protect public health and safety and to prevent or limit economic damage that could occur from a severe shortage of water supplies. The Water Authority s ICP and ESP provide actions to be taken in the event of an earthquake or power outage. The ESP provides actions that the Water Authority will take to operate ESP facilities to address up to a six-month supply interruption, which could result from earthquakes (see Section below for ESP actions). As discussed in the ICP, the Water Authority has prepared for potential power outages by operating and testing standby and mobile generators that can provide power for essential or critical activities for at least one hour. Power outages may occur as a result of natural events such as an earthquake and flooding, or man-made events such as a terrorist act Integrated Contingency Plan The Water Authority s ICP provides staff with the information necessary to respond to an emergency that causes severe damage to the Water Authority s water distribution system, or impedes the Water Authority s ability to provide reliable water service to its member agencies. The ICP describes the situations and incidents that will trigger the activation of the Water Authority s ICP and Emergency Operations Center. It also provides direction and strategies for responding to a crisis. The Water Authority s ICP includes: Authorities, policies, and procedures associated with emergency response activities Emergency Operations Center activities, including activation and deactivation guidelines Multi-agency and multi-jurisdictional coordination, particularly between the Water Authority, its member agencies, and Metropolitan in accordance with Standardized Emergency Management System and National Incident Management System guidelines Incident Command System management and organization and emergency staffing required to assist in mitigating any significant emergency or disaster Mutual Aid Agreements and covenants that outline the terms and conditions under which mutual aid assistance will be provided Final 2015 Urban Water Management Plan 11-1 June 2016
154 San Diego County Water Authority Section 11. Shortage Contingency Analysis Hazard specific action plans and Incident Command System position checklists In addition, the Water Authority s ICP uses a step-by-step approach to emergency response planning by providing tools such as resource and information lists, personnel rosters, pertinent policies and procedures, and reference materials. The Water Authority provides input to the Unified San Diego County Emergency Services Organization s Operational Area Emergency Plan, which, in turn, supports the Water Authority s ICP Water Authority s Emergency Storage Project The ESP is a system of reservoirs, pipelines, pump stations, and other conveyance facilities intended to improve San Diego s regional water storage capacity and allow stored emergency water to be delivered to the Water Authority s member agencies within San Diego County during a prolonged regional interruption. The ESP facilities can be used to help deliver emergency water supply to member agencies during two- and six-month emergency events in which San Diego County is unable to receive regular imported water deliveries from Metropolitan due to a disaster that renders their transmission system inoperable. A regional emergency event is a catastrophic interruption of imported water supplies, or any other emergency situation in which the Water Authority has insufficient water available to supply at least 75 percent of the total demand of its service area, or any portion thereof. The Water Authority Board may also authorize that water stored for emergency use under the ESP be used in a prolonged drought or other water shortage situation where imported and local supplies do not meet 75 percent level of service to the member agencies. The regional emergency water supply reservoirs (with their ESP capacity) are Olivenhain (18,000 AF), Lake Hodges (20,000 AF), and San Vicente (52,100 AF). The actual amount of ESP water to be delivered to a particular member agency during an emergency event will depend on many factors, including member agency demands, local supplies, parts of the ESP infrastructure and other Water Authority infrastructure in place, availability of supplies from Metropolitan, and the actual duration of the emergency. Overall, the ESP was designed to create a regional storage capacity of 90,100 AF of water to meet emergency needs through at least The ESP storage and conveyance facilities that are completed include Olivenhain Reservoir, Olivenhain Pipeline and Pump Station, Lake Hodges Pipeline and Pump Station, San Vicente Reservoir Dam Raise, and San Vicente Pipeline and Pump Station. These ESP facilities will allow untreated water to be delivered to member agency treatment plants as well as the Water Authority s treatment plant, which in turn will provide treated water to all member agency customers during an emergency event. The final ESP components to be built will be a north San Diego County ESP pump station and associated conveyance facilities that will be capable of delivering treated water from the Water Authority s treatment plant to the most northern member agencies. The estimated completion date for these facilities is late In sizing the ESP, the Water Authority calculated necessary storage capacities required to provide member agencies with a 75 percent level of service during a two- or six-month emergency event, after taking into account other supplies available to its member agencies. The level of service is the ratio of all supplies available to a member agency to the net demand of the member agency. The two- and six-month emergency events formed the basis for planning, design, construction, and operation of ESP facilities. Completion of the Water Authority s Twin Oaks Valley WTP in 2008 has increased the ability to treat emergency water supplies delivered from Olivenhain and Lake Hodges Reservoirs. Prior to Final 2015 Urban Water Management Plan 11-2 June 2016
155 San Diego County Water Authority Section 11. Shortage Contingency Analysis construction of the Twin Oaks Valley WTP, many member agencies that normally receive treated water from the Water Authority would have to be delivered untreated water in a two-month emergency event. In addition, untreated water would have to be conveyed in several treated water pipelines, resulting in the need for decontamination of the treated water pipelines prior to switching back to treated water deliveries. The construction of the Twin Oaks Valley WTP now allows the Water Authority to deliver treated water to its treated water customers in a two-month emergency event, and eliminates the need to convey untreated water in treated water pipelines. Additionally, the completion of the Carlsbad Desalination Plant now allows the Water Authority to deliver additional treated water supply to member agencies during the emergency events. This results in a commensurate decrease in emergency storage that will need to be maintained in ESP reservoirs, and decreases the burden on the Twin Oaks Valley WTP, especially in a two-month emergency event. The following general procedure from the January 2013 Emergency Water Delivery Plans shows the methodology for calculating the allocation of ESP supplies to member agencies in a prolonged outage situation without imported supplies: 1. Define the water storage and conveyance facility infrastructure that would be in place at the time of the emergency event in order to estimate duration of emergency (that is, time needed to repair damaged pipelines and/or infrastructure). 2. Determine the total demand of each member agency during the emergency, considering both M&I and agricultural demands. 3. Determine the net demand of each member agency, considering the availability of recycled water supplies. 4. Determine the local supplies available to each member agency from groundwater and surface water storage. 5. Determine the amount of local water that could be transferred within City of San Diego service areas, and between member agencies. 6. Determine the amount of Carlsbad Desalination Plant supplies that could be delivered to member agencies. 7. Determine the amount of imported water supplies from Metropolitan available to deliver to member agencies. 8. Allocate ESP supplies in Olivenhain, Lake Hodges, and San Vicente Reservoirs to each member agency to achieve an initial level of service of 75 percent, considering other supplies available to each member agency as described above and taking into account limitations of delivery facilities. 9. Determine reductions in member agency deliveries due to the influence of the Water Authority s TSAWR program. The cutback rate for TSAWR customers is twice the rate imposed on Water Authority M&I customers, up to a 90 percent cutback. Reductions in deliveries that arise from such a cutback would be reallocated to commercial and industrial customers. 10. Determine increases in member agency deliveries due to redistribution of the emergency water not delivered to member agencies as a result of the TSAWR program. Final 2015 Urban Water Management Plan 11-3 June 2016
156 San Diego County Water Authority Section 11. Shortage Contingency Analysis 11. Determine net Water Authority deliveries to member agencies from all water supply sources available to the Water Authority, consisting of Carlsbad Desalination Plant supplies, imported water supplies from Metropolitan, and ESP reservoir supplies Water Shortage and Drought Response Planning This section discusses the actions the Water Authority, in coordination with its member agencies, could take to effectively plan for potential shortages. The Water Authority s Water Shortage and Drought Response Plan (WSDRP), which serves as the region s guiding shortage management document, is discussed below. The section also highlights the actions taken over the past decade to manage drought and supply shortfalls, and contains information on the Water Authority s carryover storage and dry-year supplies Water Shortage and Drought Response Plan Following the major drought in California of , which led to severe water supply shortages throughout the state, the Water Authority and its member agencies aggressively developed plans to minimize the impact of potential shortages. In 2006, the Water Authority Board adopted the WSDRP, to serve as a comprehensive plan in the event that the region faced supply shortages due to drought or other water shortage conditions. The WSDRP was developed by the Water Authority in coordination with its member agencies to provide a balanced, flexible, systematic approach to identifying regional actions necessary to reduce the impacts from shortages. It includes all aspects of drought planning, from steps to avoid rationing, to drought response stages, allocation methodology, pricing, tracking actual reductions in water use, and a communication strategy. Multiple actions are identified to manage shortage situations, including both supply augmentation measures and demand reductions of up to 50 percent in water supply. Extraordinary conservation savings is an essential component of meeting the need for water in a time when available supplies are limited. The WSDRP is organized into three stages: voluntary supply management, supply enhancement, and mandatory cutbacks including a supply allocation methodology. These stages are summarized in the Drought Response Matrix in Table A copy of the WSDRP is included in Appendix G. Drought Response Matrix The WSDRP includes a drought response matrix that serves as guidance to the Water Authority and member agencies in selecting potential regional actions to lessen the severity of shortage conditions. As shown in Table 11-1, the matrix identifies the three drought stages and potential actions available to the Water Authority at each stage. Final 2015 Urban Water Management Plan 11-4 June 2016
157 San Diego County Water Authority Section 11. Shortage Contingency Analysis Table Drought Response Matrix Firm Demands Potential SDCWA Drought Actions Voluntary Stages Supply Enhancement Mandatory Cutbacks Ongoing BMP implementation X X X Communication strategy X X X Monitoring supply conditions and storage levels X X X Call for voluntary conservation X X X Draw from SDCWA carryover storage X X X Secure transfer option contracts X X X Buy phase 1 spot transfers (cost at or below Tier 2 rate) X X Call transfer options X X Buy phase 2 spot transfers (cost at or above Tier 2 rate) X X Implement allocation methodology Utilize ESP Supplies SDCWA = San Diego County Water Authority Water Authority Supply Allocation Methodology In the event of mandatory supply cutbacks from Metropolitan, the WSDRP includes an M&I allocation methodology to determine how the Water Authority s available supplies will be equitably allocated to its member agencies. Based on lessons learned from implementation of the allocation methodology during the drought management period, the Water Authority and member agencies worked together to identify specific elements of the methodology that could be modified to improve its future use. These modifications were approved by the Water Authority Board in April 2012 and are incorporated into the WSDRP. The M&I allocation methodology applies to those customers paying the M&I rate, including residential, commercial, and industrial customers. During an allocation, the actual reduction in member agency deliveries is determined through monthly meter reads, which are compared to the allocation targets for each member agency. This tracking information is then provided in monthly progress reports to the board of directors. The Water Authority administers the M&I allocation methodology following the procedures and policies contained in the Water Authority s Resolution Establishing Procedures and Policies for Administration of the Drought Management Plan Water Supply Allocation Methodology. A copy of the resolution is included in Appendix G. The resolution includes a requirement for the Water Authority staff to report monthly to the Board and member agency managers on how agency deliveries are tracking compared to their allocation target. A separate process is used to allocate deliveries under the TSAWR program, where the supply allocations are based on Metropolitan s cutback level to the Water Authority and Water Authority regional supplies are not available to mitigate the cutback. Under this process, TSAWR demands are met through the supplies allocated from Metropolitan and not supplemented with the Water Authority s regional supplies: Colorado River Transfers; Carlsbad Desalination Plant water; any carry-over storage water; and potential dry-year supplies. X X Final 2015 Urban Water Management Plan 11-5 June 2016
158 San Diego County Water Authority Section 11. Shortage Contingency Analysis Model Drought Response Conservation Ordinance In March 2008, the Water Authority Board of Directors approved for release a Model Drought Response Conservation Program Ordinance (Model Drought Ordinance) for use by member agencies in updating their existing ordinances. The Model Drought Ordinance was developed with input from the member agencies to provide regional consistency during periods of shortages. It identifies four drought response levels that contain water-use restrictions to help achieve demand reduction during temporary shortages. The restrictions become more stringent at each successive level to obtain necessary savings and delay economic impact until higher levels. The Model Drought Ordinance is included in Appendix H. Table 11-2 shows the correlation between the WSDRP stages and the Model Drought Ordinance. Table Correlation between WSDRP Stages and Model Drought Ordinance Levels WSDRP Stage Drought Response Level Use Restrictions Conservation Target Voluntary (Stage I) 1 Drought Watch Voluntary Up to 10% Supply Enhancement 1 Drought Watch Voluntary Up to 10% (Stage II) 2 Drought Alert Mandatory Up to 20% Mandatory Supply Cutback (Stage III) 2 - Drought Alert Mandatory Up to 20% 3 - Drought Critical Mandatory Up to 40% 4 - Drought Emergency Mandatory Above 40%+ The Water Authority s member agencies, not the Water Authority, have the direct customer service relationship with water users, and responsibility to address mandatory use prohibitions or restrictions during water shortages. The Model Drought Ordinance served as a model to the member agencies in updating their individual ordinances to help promote regional consistency. Member agencies independently adopt retail-level actions to manage potential shortages. Since its approval, all of the member agencies have updated their existing ordinances, based on the Model Drought Ordinance but also tailoring their individual ordinances to their unique service area, characteristics and conservation requirements. Similar to the Water Authority s Model Drought Ordinance, the member agencies ordinances provide specific mandatory restrictions on water use during a water shortage or drought event depending on its severity Drought Response and Shortage Management Actions Over the past decade, California s water supplies have been limited due to a combination of increased restrictions on State Water Project operations coupled with ongoing drought conditions. Beginning in 2007, DWR voluntarily shut down the State Water Project pumps for the first time ever to protect fish species in the Delta listed under the federal or California ESAs. Additional environmental restrictions on pumping from the State Water Project and Central Valley Project went into place in 2008 and 2009 to protect aquatic species, including the Delta smelt and salmon. The impact of these restrictions is a reduction in available supplies from the State Water Project compared to historic allocations, even in wetter years. Metropolitan estimates that the combined reduction in State Water Project deliveries ranges from 0.3 million AF during critically dry years to 1.3 million AF in above normal water years. Under average hydrology, the impact is estimated to be Final 2015 Urban Water Management Plan 11-6 June 2016
159 San Diego County Water Authority Section 11. Shortage Contingency Analysis 1.0 million AF, effectively reducing State Water Project deliveries from approximately 3.3 million AF to 2.3 million AF for the year (see Section for more discussion). California has also been in two significant droughts since 2007, compounding the reductions in supply availability due to State Water Project pumping restrictions. Statewide runoff to surface water reservoirs has been below average every water year from 2007 through 2015, with the exception of Water year 2011 was a very wet year that brought relief from the drought, with above average precipitation and snowpack that filled key surface water reservoirs across California. The Colorado River has also been in the midst of a prolonged multi-year drought that began in 2000, affecting supply availability to Metropolitan (see Section for more discussion). Table 11-3 shows the annual percent of State Water Project Table A allocations by DWR to the State Water Contractors, which includes Metropolitan, and reflects the influence of drought and the environmental restrictions on State Water Project operations that went into effect first in Table State Water Project Table A Allocation Calendar Year Initial Allocation Final Allocation % 90% % 100% % 60% % 35% % 40% % 50% % 80% % 65% % 35% % 5% % 20% % 60% 1 Additional restrictions on State Water Project operations were imposed in calendar year Calendar year 2016 Table A allocation reflects DWR s April 21, 2016 update and may not be the final calendar year allocation. During the drought management period, the Water Authority first implemented its WSDRP, following its progressive phased approach, beginning with Stage 1, Voluntary Supply Management in 2007 and progressing in 2009 to Stage III, Mandatory Supply Cutback. During this period, Metropolitan allocated supplies to its member agencies, including the Water Authority, under its WSAP. The WSAP was approved by Metropolitan s board in 2008, and is intended to manage Metropolitan s member agencies demands and to help keep sufficient water in storage for immediate future years, if supply deficiencies continue. Metropolitan s actual cutback level to its member agencies was 13 percent, which was reduced to a regional cutback level of 8 percent due to the supply reliability investments made by the Water Authority and member agencies. As supply conditions improved into spring 2011 and storage levels began to rise, Metropolitan terminated Final 2015 Urban Water Management Plan 11-7 June 2016
160 San Diego County Water Authority Section 11. Shortage Contingency Analysis water allocations to its member agencies. Subsequently, the Water Authority discontinued allocations to its member agencies and deactivated the WSDRP on April 28, Emergency Regulations and Drought Response California is in the midst of an unprecedented multi-year drought following record-breaking dry and warm weather across the state since Due to severe drought conditions, on January 17, 2014, Gov. Edmund G. Brown Jr. proclaimed a state of emergency throughout California, calling for increased conservation across the state. In response to the governor s drought declaration and call for conservation, the Water Authority activated its WSDRP for the second time since its adoption in 2006, declaring in February 2014, a regional drought response Stage I, Voluntary Supply Management, and notifying the member agencies of a voluntary Drought Watch condition under the Model Drought Ordinance. The Water Authority recognized that voluntary measures to reduce water use would be instrumental in helping preserve critical water reserves, should dry conditions continue. As drought conditions intensified across the state, with smaller communities in the Central Valley at risk of significant water supply shortages, in April 2014, the governor directed the SWRCB to adopt emergency regulations to prevent the waste and unreasonable use of water, calling for a voluntary 20 percent reduction in urban water use statewide. In July 2014, the SWRCB adopted an emergency regulation for urban water conservation aimed at reducing outdoor water use, which established prohibitions on water waste and identified actions local water agencies should take to reduce water demand in their service areas. Consistent with the governor s call for statewide conservation, in July 2014, the Water Authority increased the regional drought response to Stage II, Supply Enhancement, and Drought Alert under the regional Model Drought Ordinance, which includes mandatory wateruse restrictions with a regional savings target of up to 20 percent. Dry conditions continued to worsen into a fourth year in the spring of 2015, as reflected by a record low level of snow water content in the northern Sierra Nevada of 5 percent of average for April 1, the date that usually marks the maximum accumulation of snowpack before it begins to melt. On April 1, 2015, the governor directed the SWRCB to impose restrictions on urban suppliers to achieve a statewide reduction in potable urban use of 25 percent. Following this direction, in May 2015, the SWRCB amended and readopted its emergency regulation to require a 25 percent reduction statewide in overall potable water use effective June 1, 2015, through February The regulation included water conservation standards for retail urban water suppliers based on a reduction in water use that varied between 4 and 36 percent depending on residential GPCD, compared with 2013 water-use levels. This marked the first time in California s history that conservation measures were mandated statewide to respond to drought conditions. In April 2015, Metropolitan s Board announced that it would implement its WSAP, calling for a 15 percent cutback in fiscal year 2016 deliveries in its service area. In response to these cutbacks and the SWRCB emergency regulation, in May 2015, the Water Authority declared the Mandatory Supply Cutback stage under its WSDRP and approved member agency M&I and TSAWR supply allocations for fiscal year The Water Authority member agencies also were required to limit outdoor irrigation of ornamental landscapes and turf with potable water to no more than two days per week. An important element to drought response planning is determining the regional shortage level based on available supplies and projected demands. This analysis was conducted in 2015 for fiscal year 2016, based on the supply allocation from Metropolitan. The Metropolitan supply allocation was combined with member agency dry-year local supplies, supplies from the Water Authority s Final 2015 Urban Water Management Plan 11-8 June 2016
161 San Diego County Water Authority Section 11. Shortage Contingency Analysis Colorado River transfers of conserved water, and deliveries from the Carlsbad Desalination Plant. The total supplies available were calculated as 521,000 AF. Normal water demands were calculated for fiscal year 2016 based on fiscal year 2014 demands. The analysis showed a shortage of less than one percent for the region, which demonstrated that the planning and actions taken by the Water Authority and its member agencies are effective in managing severe multi-year droughts. Unfortunately, the SWRCB emergency regulation did not take into account the supplies water agencies had available during the drought and the required agency reduction levels did not reflect the supply reliability investments agencies had taken to avoid or mitigate shortage due to drought. Under the SWRCB s May 2015 emergency regulation, the Water Authority member agencies were required to reduce their monthly water use on a cumulative basis starting June 1, 2015, through February 2016, by 12 to 36 percent compared to 2013 water-use levels, for a total aggregate regionwide reduction in water use of 20 percent. The San Diego region effectively reduced its potable water use by 21 percent from June 2015 through February 2016, outperforming the state s aggregate regional target of 20 percent during the initial phase of unprecedented state water-use mandates. In November 2015 the governor issued Executive Order B-36-15, extending the regulation until October 2016 and directing the SWRCB to consider modifications to the regulation. The Water Authority advocated for revisions to the regulation that take into account investments in drought resilient supplies. In February 2016, the SWRCB amended the emergency regulation to allow for adjustments to the conservation standards, including for new local drought-resilient supplies developed after In March 2016, the SWRCB certified supply from the Carlsbad Desalination Plant as drought-resilient, which lowered the range of member agencies conservation standards to between 8 percent and 28 percent, with the regional aggregate water conservation goal reduced from 20 percent to about 13 percent. Under the regulations, a water supplier s conservation standard required at least an eight percent reduction in water use, regardless of supply availability. The State s supply conditions improved somewhat during the winter of water year 2016, with an El Niño weather pattern bringing rain and snow to parched California. In March 2016, the Water Authority Board revised its regional drought management actions, rescinding its declaration of a regional Level 2 Drought Alert condition under the Model Drought Response Ordinance, recognizing that the SWRCB individual water supplies conservation standards are driving member agencyspecific, rather than regional, water-use restrictions. In May 2016, due to the improved supply conditions and sufficient supply availability, Metropolitan terminated its member agency allocations. The Water Authority then ended allocations to its member agencies, consistent with the WSDRP. Although California s supply conditions improved during water year 2016, the improvement was not enough to emerge from the current multi-year statewide drought and the accompanying statewide emergency regulation. On May 18, 2016, the SWRCB amended the emergency regulation to change from a mandated conservation standard to a self-certification approach to recognize the unique supply conditions of each region, with the changes in effect from June 1, 2016, to the end of January Through establishment of a drought awareness effort, the Water Authority will continue its messaging and outreach to residents and businesses to ensure an ongoing community focus on drought and a commitment to water-use efficiency across the region. Final 2015 Urban Water Management Plan 11-9 June 2016
162 San Diego County Water Authority Section 11. Shortage Contingency Analysis Timeline of Important Drought and Shortage Related Events To assist in the potential activation of the WSDRP in the future, Table 11-4 contains a timeline of key events during the statewide drought emergency declared by the Governor in January The Water Authority responded to the drought with actions consistent with its WSDRP. With the SWRCB adoption of the May 2015 emergency regulation however, the SWRCB individual member agencyspecific water conservation standards superseded the Water Authority s regional approach to drought response measures. Table Timeline of Significant Drought and Shortage-Related Events Gov. Brown declares a state of emergency throughout California due to severe drought, January 2014 calling for increased voluntary conservation to reduce water use by 20 percent. Water Authority notifies member agencies of a Level 1, Drought Watch condition, under the February regional Model Drought Ordinance, and declares implementation of Stage I, Voluntary 2014 Supply Management, under WSDRP. Gov. Brown issues proclamation that the drought emergency continues in California, calling April 2014 for increased statewide conservation. July 2014 SWRCB adopts emergency regulation for statewide urban conservation. Water Authority notifies member agencies of a Level 2, Drought Alert condition, under the July 2014 regional Model Drought Ordinance, and declares implementation of Stage II, Supply Enhancement, under WSDRP. Gov. Brown issues Executive Order B instituting emergency actions and mandatory April 2015 water-use restrictions for California. April 2015 Metropolitan imposes Level 3 under its WSAP to be effective July 1, 2015, reducing Metropolitan supplies by 15 percent. SWRCB issues additional requirements to its emergency regulation, including mandatory May 2015 water-use reductions that ranged from 12 to 36 percent for Water Authority member agencies with an aggregate water conservation target of 20 percent. Water Authority declares implementation of Stage III, Mandatory Supply Cutback, under WSDRP, adopts Ordinance No allocating M&I and TSAWR supplies to its member May 2015 agencies, and requires member agencies to restrict irrigation of ornamental landscapes and turf with potable water to no more than two days a week. Gov. Brown issues Executive Order B calling for extensions of urban water use November restriction until October 31, 2016, should drought conditions persist through January 2016, 2015 and directs SWRCB to consider modifying restrictions. SWRCB extends the emergency regulation through October 2016, and provides for February adjustments to conservation standard for significant investment in new, local, droughtresilient sources of potable supply, climate differences and growth SWRCB certifies supplies from the Carlsbad Desalination Plant are drought-resilient, March 2016 reducing member agency conservation standards to a range of 8 to 28 percent with a regional aggregate water conservation target of 13 percent. Water Authority modifies its shortage management actions, adopting Ordinance No and rescinding Ordinance No Actions include continuing to allocate supplies to March 2016 its member agencies in FY 2016 under its WSRP Stage III, Mandatory Supply Cutback, but rescinding the July 2014 notification of a regional Level 2, Drought Alert condition. May 2016 Metropolitan rescinds its member agency allocations effective May 10, Water Authority modifies its shortage management actions, rescinding Ordinance No May to end member agency allocations effective May 26, 2016, and establishes a drought awareness effort. SWRCB modifies its emergency regulation from a mandated conservation standard to a selfcertification approach, effective June 1, 2016, through January May Final 2015 Urban Water Management Plan June 2016
163 San Diego County Water Authority Section 11. Shortage Contingency Analysis Water Authority Dry-Year Supplies and Carryover Storage The Water Authority s dry-year supplies and carryover storage are important components of managing potential shortages within the region and for increasing supply reliability. The dry-year supplies assist in minimizing or reducing potential supply shortages from Metropolitan. The Water Authority has developed a Carryover Storage Program to more effectively manage supplies, which includes in-region surface storage at San Vicente Reservoir, secured as part of the San Vicente Dam project, which was completed in The Water Authority also has an out-of-region groundwater banking program in the California Central Valley. Through these efforts, the Water Authority can store water available during wet periods for use during times of shortage. The Water Authority s carryover storage and dry-year transfer programs are discussed below. Water Authority Carryover Storage Program The Carryover Storage Program provides water for the region in the case of a supply shortage, such as during a drought. The Water Authority has identified three main needs for carryover storage: 1. Enhance reliability of the water supply: During dry weather periods, increased regional demand for water may exceed available supplies, resulting in potential water shortages. Carryover storage provides a reliable and readily available source of water during periods of shortage, such as during dry years. 2. Increase system efficiency: Carryover storage provides operational flexibility to serve above normal demands, such as those occurring during peak summer months or extended droughts, from locally stored water rather than by the over-sizing of the Water Authority s imported water transmission facilities. 3. Better management of water supplies: Carryover storage allows the Water Authority to accept additional deliveries from its existing State Water Project- and Colorado River-derived sources during periods of greater availability, such as during wet years, to increase water availability locally during periods of shortage, such as during dry years. San Vicente Dam Raise Carryover Storage Project The Water Authority s Water Facilities Master Plan (December 2002) identified a need for approximately 100,000 AF of carryover storage to assist in maintaining a secure and reliable supply for the region. The San Vicente Dam Raise CSP meets this need by providing approximately 100,000 AF of local storage capacity, facilitating the reliable and efficient delivery of water to residents of the Water Authority service area. It is located in the San Vicente Reservoir above the reservoir expansion for the ESP (see previous Section ), increasing water storage reliability for the region. Construction was completed in 2014, and in June 2016 the carryover pool of 100,000 AF was full. Water Authority s Out-Of-Region Groundwater Program In 2008, the Water Authority acquired a total of 70,000 AF of permanent storage allocation in the Semitropic-Rosamond Water Bank Authority and the Semitropic Water Bank (40,000 AF and 30,000 AF, respectively) located in Kern County. Due to its location near the California Aqueduct, the Kern River and the Friant-Kern Canal, the location was ideally suited for groundwater banking. The Water Authority s assigned rights included a total Program Delivery Capacity of 12,715 AF per year and Final 2015 Urban Water Management Plan June 2016
164 San Diego County Water Authority Section 11. Shortage Contingency Analysis 10,865 AF per year of Program Pumpback Capacity. Due to continuing statewide dry conditions, in 2008, the Water Authority acquired approximately 16,117 AF of water, which continues to be stored in the Water Authority s out-of-region banking program. Utilization of Carryover Storage Supplies In accordance with the Water Authority s WSDRP, potential utilization of carryover storage supplies could occur in Stage II, Supply Enhancement, or Stage III, Mandatory Cutbacks. The amount of water taken from carryover storage reserves, to manage potential shortages, is influenced by a number of factors and should generally be handled on a case-by-case basis. Many of the factors influencing the storage take will vary depending upon conditions present. These factors include, but are not limited to: Current water demand trends Core water supply availability from imported and local sources Existing and projected hydrologic conditions Storage supply available for withdrawal Take capacity from the groundwater banking program Need to avoid depletion of storage reserves For planning purposes in the 2015 Plan, general guidelines, consistent with previous Water Authority planning documents, established that approximately one-third of the carryover supplies available in storage will be utilized in one year. Utilizing only a portion of available storage supplies avoids depletion of storage reserves, thereby making water available for potential ongoing or future shortages. It should be emphasized that the carryover storage takes shown in the dry water year assessments contained in Section 9.3 are used for planning purposes only and should not dictate future carryover storage takes. The supplies taken from carryover storage will be considered a Water Authority regional supply to be combined with the Water Authority s core supplies and any potential dry-year transfers. Another factor that will be considered when utilizing carryover supplies is participation in the Water Authority s TSAWR program. Customers in the program are exempt from paying the Water Authority s storage charge and in turn receive no water from the Carryover Storage Program. In March 2015, the Water Authority Board extended the TSAWR program through December Water Authority s Dry-Year Transfer Program To ensure adequate water supplies during drought conditions and periods of regulatory constraints, the Water Authority may consider securing water transfers as part of its WSDRP. Considerations on whether to pursue transfers are based on a range of factors, such as source location, federal and state agency approvals, price, call period, and capacity in the State Water Project system. To lessen the impact of shortages during the drought, in 2009, the Water Authority acquired in 20,000 AF of water under a one-year transfer agreement with Placer County Water Agency in Northern California to lessen the impact of water supply reductions on the San Diego region. The transfer eased the region s transition from voluntary conservation to mandatory wateruse restrictions by keeping the regional water savings target for the year at a manageable level. Final 2015 Urban Water Management Plan June 2016
165 San Diego County Water Authority Section 11. Shortage Contingency Analysis The Water Authority has not pursued transfers during the drought for a number of reasons, including limited availability of transfers, high cost, and the ability of the Water Authority and the member agencies to manage the drought with the current available supplies. In addition, securing dry-year transfers with the SWRCB May 2015 emergency regulation in place would not have alleviated the state-mandated cutback levels. Supply availability was not taken into account when the state established the reduction mandates Penalties for Excessive Water Use Penalty rates may be used by the Water Authority to encourage conservation and reduce demand during a drought or other water supply shortage. If Metropolitan allocates imported water supplies to the Water Authority, Metropolitan can impose surcharges (penalty pricing) on water consumption in excess of the Water Authority s allocation. The Water Authority s Implementing Resolution provides for a pass through to the Water Authority s member agencies of any penalties levied by Metropolitan on the Water Authority for exceeding its annual allocation. Penalties are assessed at the end of the fiscal year, on a pro rata basis to the member agencies that exceed their allocations. The Water Authority is subject to significant financial penalties if it exceeds its Metropolitan allocation. Rates may also be adjusted based on any other allocation program implemented by the Water Authority as determined necessary by the Board. The Water Authority may also reduce the amount of water it allocates to a member agency if the member agency fails to adopt or implement wateruse restrictions Revenue Impacts The Water Authority has taken significant steps to reduce potential revenue impacts resulting from fluctuating water sales. In fiscal year 1990, the Water Authority created a Rate Stabilization Fund (RSF) to provide funds that would mitigate the need for rate increases in the event of an unexpected decline in water sales. In 2006, the Board adopted new policies governing the RSF. Under the newly adopted policy, the RSF has a target balance that is the equivalent of the estimated financial impact 2.5 years of wet weather (reduced sales). The new policy also established a maximum RSF balance equal to the financial impact of 3.5 years of wet weather. The policy matches the level of RSF funding with the risk (water sales volatility) that the fund is designed to mitigate. The RSF provides an important tool to mitigate water sales volatility and the impact that has on water rates. On January 1, 2003, the Water Authority implemented a rate structure that substantially increased the percentage of water revenues generated from fixed charges. This increase replaced the previous variable postage stamp rate, which historically generated as much as 80 percent or more of total annual revenues, with two fixed charges, and one variable rate. The new fixed charges, Customer Service and Storage combined with the Infrastructure Access Charge, provide the Water Authority with enhanced revenue stability. Additionally, in March 2015, the Board adopted the new fixed Supply Reliability Charge. The Supply Reliability Charge recovers a portion of the Carlsbad Desalination Plant water purchase and IID water transfer supply costs. The fixed charges combined help to mitigate revenue volatility due to changes in either water demand or supply availability and support smooth and predictable rates and charges. Although the Water Authority maintains financial reserves, it is possible that additional costs associated with demand reduction and supply enhancement could negatively affect the Water Final 2015 Urban Water Management Plan June 2016
166 San Diego County Water Authority Section 11. Shortage Contingency Analysis Authority s short-term financial situation. The Water Authority may compensate for increased costs or reduced water sales by adjusting water rates in succeeding years Minimum Water Supply Available over Next Three Years In accordance with the Act, agencies are required to estimate the minimum water supply available during each of the next three years, based on the driest three-year historic sequence, compared with a normal water year. To determine the minimum supplies potentially available to the region, the same assumptions contained in the multi dry-year analysis in Section 9.3 were used. Table 11-5 contains the minimum estimated supplies. The minimum supplies are included in accordance with the Act. It should be noted that, based on current supply and storage conditions statewide, the Water Authority is not currently forecasting this supply scenario. Table Estimated Minimum Supplies without Utilization of Carryover Storage (AF) Supplies Average Year 2017 Single Dry Year 2017 Multiple Dry-Year Water Supply Member Agency Local Supplies 1 116,345 64,235 71,950 74,034 71,267 Carlsbad Desalination 50,000 50,000 50,000 50,000 50,000 Water Authority QSA 180, , , , ,200 Metropolitan Supplies 2 222, , , , ,120 Total 568, , , , ,587 1 Member agency local supplies include 6,000 AF of Carlsbad Desalination Plant supplies. 2 Metropolitan supplies in single and multiple dry years are conservatively based on the Water Authority s estimated preferential rights using Metropolitan s current calculation, which the trial court invalidated, and Metropolitan has appealed. The trial court ruled Metropolitan s method undercalculates the Water Authority s preferential rights Summary The shortage contingency analysis included in this section demonstrates that the Water Authority and its member agencies, through the ICP and ESP, are taking actions to prepare for and appropriately handle a catastrophic interruption of water supplies. The analysis also describes the Water Authority s plans, procedures, and WSDRP for the San Diego region. The WSDRP identifies the actions to be taken by the Water Authority to minimize the impacts of a supply shortage due to a drought or other water supply shortage, including a methodology for allocating M&I supplies to the member agencies during a water shortage. These components address the requirements of the Act that are applicable to the Water Authority. Final 2015 Urban Water Management Plan June 2016
167 San Diego County Water Authority Appendices Appendix A California Urban Water Management Planning Act and SBX7-7 Final 2015 Urban Water Management Plan June 2016

168

169

170

171

172

173

174

175

176

177

178

179

180

181

182

183

184

185

186

187

188

189

190

191

192

193

194

195

196

197

198


199

200


201


202


203
204 SAN DIEGO COUNTY WATER AUTHORITY 2015 UWMP 60-DAY NOTICE TO LAND USE AGENCIES WITHIN SERVICE AREA MAILING LIST Jurisdiction/Agency Name Address City of Carlsbad Don Neu City of Carlsbad Planning Department 1635 Faraday Drive Carlsbad, CA David De Cordova City of Carlsbad Planning Department 1635 Faraday Drive Carlsbad, CA City of Chula Vista Kelly Broughton City of Chula Vista Development Services Development Services Director 276 Fourth Avenue, Bldg B Chula Vista, CA Ed Batchelder Advance Planning Manager City of Chula Vista Development Services 276 Fourth Avenue Chula Vista, CA City of Coronado Rachel Hurst Director of Community Development, Redevelopment Services and Housing City of Coronado Department of Community Development 1825 Strand Way Coronado, CA City of Del Mar Kathy Garcia City of Del Mar Planning and Comm. Dev. Planning and Community 1050 Camino Del Mar Development Director Del Mar, CA City of El Cajon Melissa Ayres City of El Cajon Community Director of Community Development Department Development 200 Civic Center Way, 3rd Floor El Cajon, CA City of Encinitas Diane Langager Principal Planner City of Encinitas Dept of Planning and Building 505 S. Vulcan Avenue Encinitas, CA City of Escondido Jay Petrek City of Escondido Community Dev. Director of Community 201 N. Broadway Escondido, CA City of Imperial Beach Steve Dush Director of Community Development City of Imperial Beach Community Development Department 825 Imperial Beach Boulevard Imperial Beach, CA Jim Nakagawa Planner City of Imperial Beach Community Development Department 825 Imperial Beach Boulevard Imperial Beach, CA City of La Mesa Carol Dick City of La Mesa Community Development Director of Community Development Department 8130 Allison Avenue La Mesa, CA 91942
205 Jurisdiction/Agency Name Address City of Lemon Grove David DeVries Acting Development Services Director City of Lemon Grove Development Services Department 3232 Main Street Lemon Grove, CA City of National City Ray Pe City of National City Planning Department Principal Planner 1243 National City Boulevard National City, CA City of Oceanside Jeff Hunt City of Oceanside Planning Department City Planner 300 N. Coast Highway Oceanside, CA City of Poway Robert (Bob) Manis Director of Development Services Department City of Poway Department of Development Services Civic Center Drive, 1st Floor Poway, CA City of San Diego Jeff Murphy City of San Diego Planning Department Director of Planning 1222 First Ave MS 413 San Diego, CA County of San Diego Mark Wardlaw Director, Depatment of Planning and Development Services County Department of Planning and Development Services 5510 Overland Avenue San Diego, CA Darren Gretler Assistant Director, Department of Planning and Development Services County Department of Planning and Development Services 5510 Overland Avenue San Diego, CA City of San Marcos Jerry Backoff City of San Marcos Planning Department Planning Director 1 Civic Center Drive San Marcos, CA Karen Brindley Planning Division Manager City of San Marcos Planning Department 1 Civic Center Drive San Marcos, CA City of Santee Melanie Kush City of Santee Development Services Director of Development Services Magnolia Avenue Santee, CA City of Solana Beach Bill Chopyk Solana Beach Community Development Director of Community Department Development 635 S. Highway 101 Solana Beach, CA
206 Jurisdiction/Agency Name Address City of Vista John Conley Vista Community Development Director of Community Development and Engineering Department 200 Civic Center Drive Vista, CA Patsy Chow City Planner Vista Community Development Department 200 Civic Center Drive Vista, CA San Diego County Dana Friehauf San Diego County Water Authority Water Authority Water Resources Manager 4677 Overland Avenue San Diego, CA San Diego Charles "Muggs" Stoll SANDAG Association of Director of Land Use and 401 B Street, Suite 800 Governments Development San Diego, CA (or Mail Station 980) San Diego LAFCO Ingrid Hansen 9335 Hazard Way, Suite 200 Chief, Governmental Services San Diego, CA 92123
207
208 RESOLUTION NO A RESOLUTION OF THE BOARD OF DIRECTORS OF THE SAN DIEGO COUNTY WATER AUTHORITY APPROVING THE 2015 URBAN WATER MANAGEMENT PLAN WHEREAS, California Water Code Section et seq., known as the Urban Water Management Planning Act (Act), requires urban water suppliers to prepare and adopt an Urban Water Management Plan every five years on or before December 31, in years ending in five and zero; and WHEREAS, due to recent changes in the Act, State law has extended the deadline for adoption of the 2015 Urban Water Management Plans (2015 Plan) to July 1, 2016; and WHEREAS, the Act specifies the requirements and procedures for adopting such Urban Water Management Plans; and WHEREAS, pursuant to the Act, the Water Authority prepared a draft 2015 Plan in consultation with the Water Authority s member agencies in the areas of water demand forecasting and identification of local and imported supplies; and WHEREAS, the draft 2015 Plan was made available for public review commencing April 29, 2016, and ending on June 6, 2016, notices of the availability of the draft 2015 Plan and of the public hearing to receive comments on the draft 2015 Plan on May 26, 2016, were published in accordance with applicable law; and WHEREAS, copies of the draft 2015 Plan were distributed to Water Authority member agencies, interested parties who submitted requests for copies, as well as to each of the cities within the Water Authority s service area and the County of San Diego; and WHEREAS, the final 2015 Plan, incorporating changes to the draft Plan as a result of certain comments, were distributed to the Water Authority Board of Directors prior to the June 23, 2016, Board meeting; and WHEREAS, the Water Authority Board of Directors, upon recommendation of the General Manager, and the information presented to it at a Board meeting on May 26, 2016, has determined that the final 2015 Plan, dated June 23, 2016, and on file with the Clerk of the Board is consistent with the Act and is an accurate representation of the water resources plan for the Water Authority; NOW THEREFORE, the Board of Directors of the San Diego County Water Authority resolves as follows: 1. The foregoing recitals are true and correct and constitute the findings and determinations of the Board.
209 2. The final 2015 Plan, dated June 23, 2016, on file with the Clerk of the Board, is approved and adopted. 3. The General Manager is hereby directed to: Submit the 2015 Plan to the California Department of Water Resources not later than July 1, 2016; Submit a copy of the 2015 Plan to the California State Library, each Water Authority member agency, the County of San Diego and each city within the territory of the Water Authority not later than 30 days after adoption; Make the 2015 Plan available for public review through the Water Authority s Internet web site; Make the 2015 Plan available for public review at the Water Authority headquarters during the Water Authority s normal business hours; Implement the 2015 Plan consistent with the Water Authority s Administrative Code, adopted Operations and Capital Improvement Plan Budgets, adopted Water Facilities Master Plan and other formal action of the Board. 4. The General Manager is further directed to periodically review the 2015 Plan in accordance with applicable law and recommend to the Board amendments to the plan as may be appropriate as a result of such review. ATTEST: 5. This resolution is effective upon adoption. PASSED, APPROVED AND ADOPTED this 23rd day of June 2016, by the following vote: AYES: NOES: ABSTAIN: ABSENT: Jim Madaffer, Secretary Board of Directors Mark Weston, Chairman Board of Directors 2
210 I, Melinda Cogle, Clerk of the Board of the San Diego County Water Authority, certify that the vote shown above is correct and this Resolution No was duly adopted at the meeting of the Board of Directors on the date stated above. Melinda Cogle, Clerk of the Board 3
211 San Diego County Water Authority Appendices Appendix C DWR 2015 Urban Water Management Plan Checklist Final 2015 Urban Water Management Plan June 2016
212 Appendix C DWR 2015 UWMP Checklist Checklist Arranged by Water Code Section CWC Section UWMP Requirement (b) Retail suppliers shall adopt a 2020 water use target using one of four methods (e) Retail suppliers shall provide baseline daily per capita water use, urban water use target, interim urban water use target, and compliance daily per capita water use, along with the bases for determining those estimates, including references to supporting data Retail suppliers per capita daily water use reduction shall be no less than 5 percent of base daily per capita water use of the 5 year baseline. This does not apply if the suppliers base GPCD is at or below (a) Retail suppliers shall meet their interim target by December 31, (d)(2) If the retail supplier adjusts its compliance GPCD using weather normalization, economic adjustment, or extraordinary events, it shall provide the basis for, and data supporting the adjustment (a) Retail suppliers shall conduct a public hearing to discuss adoption, implementation, and economic impact of water use targets Wholesale suppliers shall include an assessment of present and proposed future measures, programs, and policies to help their retail water suppliers achieve targeted water use reductions Retail suppliers shall report on their progress in meeting their water use targets. The data shall be reported using a standardized form (b) Every person that becomes an urban water supplier shall adopt an urban water management plan within one year after it has become an urban water supplier (d)(2) Coordinate the preparation of its plan with other appropriate agencies in the area, including other water suppliers that share a common source, water management agencies, and relevant public agencies, to the extent practicable (f) Describe water management tools and options to maximize resources and minimize the need to import water from other regions. Subject Baselines and Targets Baselines and Targets Baselines and Targets Baselines and Targets Baselines and Targets Plan Adoption, Submittal, and Implementation Baselines and Targets Baselines and Targets Plan Preparation Plan Preparation Water Supply Reliability Assessment UWMP Location n/a n/a n/a n/a n/a n/a Section 3 n/a n/a Section 1.4; Appendix B Sections 3; 5; 9 C - 1
213 Appendix C DWR 2015 UWMP Checklist 10621(b) 10621(d) Notify, at least 60 days prior to the public hearing, any city or county within which the supplier provides water that the urban water supplier will be reviewing the plan and considering amendments or changes to the plan. Each urban water supplier shall update and submit its 2015 plan to the department by July 1, Plan Adoption, Submittal, and Implementation Plan Adoption, Submittal, and Implementation 10631(a) Describe the water supplier service area. System Description 10631(a) 10631(a) Describe the climate of the service area of the supplier. Indicate the current population of the service area (a) Provide population projections for 2020, 2025, 2030, and (a) 10631(b) 10631(b) 10631(b)(1) Describe other demographic factors affecting the supplier s water management planning. Identify and quantify the existing and planned sources of water available for 2015, 2020, 2025, 2030, and Indicate whether groundwater is an existing or planned source of water available to the supplier. Indicate whether a groundwater management plan has been adopted by the water supplier or if there is any other specific authorization for groundwater management. Include a copy of the plan or authorization. System Description System Description and Baselines and Targets System Description Section 1.4, Appendix B Section 1.4 Section Section Section Section 1.7.4, Table 1-4 System Section Description System Supplies Sections 4, 5, 6, 9.5, Tables 9-1 to 9-7 System Supplies n/a System Supplies 10631(b)(2) Describe the groundwater basin. System Supplies n/a 10631(b)(2) Indicate if the basin has been adjudicated and System Supplies include a copy of the court order or decree and a description of the amount of water the supplier n/a has the legal right to pump (b)(2) For unadjudicated basins, indicate whether or not System Supplies the department has identified the basin as overdrafted, or projected to become overdrafted. n/a Describe efforts by the supplier to eliminate the long-term overdraft condition (b)(3) Provide a detailed description and analysis of the System Supplies location, amount, and sufficiency of groundwater pumped by the urban water supplier for the past five years n/a 10631(b)(4) Provide a detailed description and analysis of the System Supplies Apendix F, amount and location of groundwater that is Table F-2 projected to be pumped. n/a C - 2
214 Appendix C DWR 2015 UWMP Checklist 10631(c)(1) 10631(c)(1) Describe the reliability of the water supply and vulnerability to seasonal or climatic shortage. Provide data for an average water year, a single dry water year, and multiple dry water years 10631(c)(2) For any water source that may not be available at a consistent level of use, describe plans to supplement or replace that source (d) Describe the opportunities for exchanges or transfers of water on a short-term or long-term basis (e)(1) Quantify past, current, and projected water use, identifying the uses among water use sectors (e)(3)(A) Report the distribution system water loss for the most recent 12-month period available (f)(1) Retail suppliers shall provide a description of the nature and extent of each demand management measure implemented over the past five years. The description will address specific measures listed in code (f)(2) Wholesale suppliers shall describe a) specific demand management measures listed in code, b) their distribution system asset management program, and c) supplier assistance program (g) Describe the expected future water supply projects and programs that may be undertaken by the water supplier to address water supply reliability in average, single-dry, and multiple-dry years (h) Describe desalinated water project opportunities for long-term supply (i) CUWCC members may submit their CUWCC BMP annual reports in lieu of, or in addition to, describing the DMM implementation in their UWMPs. This option is only allowable if the supplier has been found to be in full compliance with the CUWCC MOU (j) Retail suppliers will include documentation that they have provided their wholesale supplier(s) if any - with water use projections from that source (j) Wholesale suppliers will include documentation that they have provided their urban water suppliers with identification and quantification of the existing and planned sources of water available from the wholesale to the urban supplier during various water year types. Water Supply Reliability Assessment Water Supply Reliability Assessment Water Supply Reliability Assessment System Supplies System Water Use System Water Use Demand Management Measures Demand Management Measures System Supplies System Supplies Demand Management Measures System Supplies System Supplies Sections 9.2, 9.3, 9.4 Sections 9.2, 9.3 Section 10 Sections 4.2, 4.3, Section 2.3, Figure 2-1 Appendix J n/a a) Section 3 b) Section c) Section 3 Sections 4, 5, 6, 9 Section 4.5 Appendix D n/a Section 1.4 C - 3
215 Appendix C DWR 2015 UWMP Checklist (a) 10632(a) and 10632(a)(1) 10632(a)(2) 10632(a)(3) 10632(a)(4) 10632(a)(5) 10632(a)(6) 10632(a)(7) 10632(a)(8) Include projected water use needed for lower income housing projected in the service area of the supplier. Provide an urban water shortage contingency analysis that specifies stages of action and an outline of specific water supply conditions at each stage. Provide an estimate of the minimum water supply available during each of the next three water years based on the driest three-year historic sequence for the agency. Identify actions to be undertaken by the urban water supplier in case of a catastrophic interruption of water supplies. Identify mandatory prohibitions against specific water use practices during water shortages. Specify consumption reduction methods in the most restrictive stages. Indicated penalties or charges for excessive use, where applicable. Provide an analysis of the impacts of each of the actions and conditions in the water shortage contingency analysis on the revenues and expenditures of the urban water supplier, and proposed measures to overcome those impacts. Provide a draft water shortage contingency resolution or ordinance (a)(9) Indicate a mechanism for determining actual reductions in water use pursuant to the water shortage contingency analysis For wastewater and recycled water, coordinate with local water, wastewater, groundwater, and planning agencies that operate within the supplier's service area (a) Describe the wastewater collection and treatment systems in the supplier's service area. Include quantification of the amount of wastewater collected and treated and the methods of wastewater disposal (b) Describe the quantity of treated wastewater that meets recycled water standards, is being discharged, and is otherwise available for use in a recycled water project (c) Describe the recycled water currently being used in the supplier's service area. System Water Use Water Shortage Contingency Planning Water Shortage Contingency Planning Water Shortage Contingency Planning Water Shortage Contingency Planning Water Shortage Contingency Planning Water Shortage Contingency Planning n/a Section 11.2 Section , Table 11-5 Section 11.1 Sections , Section 11.2 Section Water Shortage Contingency Planning Section Water Shortage Contingency Appendix H Planning Water Shortage Contingency Section Planning System Supplies (Recycled Water) Section 5.4, Appendix F System Supplies (Recycled Water) System Supplies (Recycled Water) System Supplies (Recycled Water) Section 5.4.2, Appendix F Appendix F Section 5.4 C - 4
216 Appendix C DWR 2015 UWMP Checklist 10633(d) Describe and quantify the potential uses of recycled water and provide a determination of the technical and economic feasibility of those uses (e) Describe the projected use of recycled water within the supplier's service area at the end of 5, 10, 15, and 20 years, and a description of the actual use of recycled water in comparison to uses previously projected (f) Describe the actions which may be taken to encourage the use of recycled water and the projected results of these actions in terms of acre-feet of recycled water used per year (g) Provide a plan for optimizing the use of recycled water in the supplier's service area Provide information on the quality of existing sources of water available to the supplier and the manner in which water quality affects water management strategies and supply reliability 10635(a) Assess the water supply reliability during normal, dry, and multiple dry water years by comparing the total water supply sources available to the water supplier with the total projected water use over the next 20 years (b) Provide supporting documentation that Water Shortage Contingency Plan has been, or will be, provided to any city or county within which it provides water, no later than 60 days after the submission of the plan to DWR Provide supporting documentation that the water supplier has encouraged active involvement of diverse social, cultural, and economic elements of the population within the service area prior to and during the preparation of the plan Provide supporting documentation that the urban water supplier made the plan available for public inspection, published notice of the public hearing, and held a public hearing about the plan The water supplier is to provide the time and place of the hearing to any city or county within which the supplier provides water Provide supporting documentation that the plan has been adopted as prepared or modified (a) Provide supporting documentation that the urban water supplier has submitted this UWMP to the California State Library. System Supplies (Recycled Water) System Supplies (Recycled Water) System Supplies (Recycled Water) System Supplies (Recycled Water) Water Supply Reliability Assessment Section Section Section Section Section 7 Water Supply Reliability Assessment Section 9 Plan Adoption, Submittal, and Implementation Plan Preparation Plan Adoption, Submittal, and Implementation Plan Adoption, Submittal, and Implementation Plan Adoption, Submittal, and Implementation Plan Adoption, Submittal, and Implementation Section 1.4, Appendix B Section 1.4, Appendix B Section 1.4 Section 1.4 Appendix B Section 1.4 C - 5
217 Appendix C DWR 2015 UWMP Checklist 10644(a)(1) 10644(a)(2) Provide supporting documentation that the urban water supplier has submitted this UWMP to any city or county within which the supplier provides water no later than 30 days after adoption. The plan, or amendments to the plan, submitted to the department shall be submitted electronically Provide supporting documentation that, not later than 30 days after filing a copy of its plan with the department, the supplier has or will make the plan available for public review during normal business hours. Plan Adoption, Submittal, and Implementation Section 1.4 Plan Adoption, Submittal, and Section 1.4 Implementation Plan Adoption, Submittal, and Implementation Section 1.4 C - 6

218


219
220


221


222


223

224

225

226

227

228


229


230

231

232
233

234

235


236

237

238


239

240

241

242


243

244
245
246 APPENDIX F Table F-1 Member Agency Surface Water Projections Member Agency Reservoir Annual Member Agency Planned Local Use (AF) Basis for Yield (information provided by member agencies) Escondido, City of Henshaw / Wohlford 7, year average. Helix WD San Diego, City of a Cuyamaca / El Capitan Barrett El Capitan Hodges Lower Otay Morena San Vicente Sutherland Total 3,258 23,000 Based on historical median runoff of 3,644 AFY, reduced by historical evaporation rate of 10.6% (386 AFY). Median yield based on Reservoir Management Plan - post-2015 supply adjusted downward to account for increase in Cal-Am Water Co. demands. San Dieguito WD / Santa Fe ID San Dieguito / Hodges 5,700 Fractional interest: 42.67% / 57.33% (SDWD / SFID). Sweetwater Authority Loveland / Sweetwater 7,400 Average annual production from Sweetwater River since Vista I.D. Henshaw 5,062 Median for the years Total 51,680 a Surface water use projections: 23,000 AFY (2015); 22,900 AFY (2020); 22,800 AFY (2025); 22,700 AFY (2030); 22,600 AFY (2035); 22,500 AFY (2040).
247 APPENDIX F Table F-2 Member Agency Groundwater Projections EXISTING GROUNDWATER [YIELD] PROJECTS AND PROPOSED EXPANSIONS (VERIFIABLE) Member Agency Project or Facility Name Project Type Groundwater Basin or Location Existing (AF/YR)1 Based on Period Projected Yield Verifiable Projects (AF/YR) Helix WD Groundwater Production Well 101 Pump & Blend (with raw imported water) El Monte Basin Lakeside WD Vine Street Groundwater Production Facility Pump & Treat (blend with imported water) Santee Basin (San Diego River Basin) Oceanside, City of Mission Basin Desalter Facility - 1st & 2nd Phase of Desal Expansion & IPR Brackish Groundwater Recovery & Treatment Mission Basin (Lower San Luis Rey River Valley) 3,300 3,300 3,300 3,700 3,700 3,700 3,700 MCB Camp Pendleton Groundwater Production Wells Pump & Conventional Treatment Lower Santa Margarita, Las Flores, San Mateo, and San Onofre Basins 6,480 7,510 8,700 9,740 9, San Diego, City of Sweetwater Authority Yuima MWD San Vicente GW Production Well Richard A. Reynolds Desalination Facility Richard A. Reynolds Desalination Facility National City Well Field Mutual Water Company wells within district Pump & Blend Santee/El Monte Brackish Groundwater Recovery Brackish Groundwater Recovery Pump & Conventional Treatment Groundwater Extraction San Diego Formation 2,600 2,600 2,600 2,600 2,600 San Diego Formation 3,600 6,200 6,200 6,200 6,200 6,200 San Diego Formation [National City Well Field] Pauma Basin (Upper San Luis Rey River Valley) 2,100 2,100 2,100 2,100 2,100 2,100 1,073 7,000 7,000 7,000 7,000 7,000 7,000 Total Verifiable 23,773 30,040 31,630 32,670 32,670 32,670 ADDITIONAL PLANNED PROJECTS Groundwater Additional Planned (AF/YR) Member Agency Project or Study Name Project Type Groundwater Basin or Location Study / Project Status Fallbrook PUD/ Camp Pendleton (Conjunctive-Use Project) Santa Margarita Conjunctive-Use Project Local Surface Water Recharge and Expansion of Camp Pendleton GW Recovery Program Lower Santa Margarita River Basin (Upper Ysidora and Chappo Sub-basins). Progress continues; Feasibility Study Completed & CEQA ,100 3,100 3,100 3,100 3,100 Otay WD Rancho del Rey Groundwater Well Development (Capacity) Groundwater Recovery Unknown Feasibility Study & CEQA complete Additional Planned Yields - 3,100 3,100 3,600 3,600 3,600
248 APPENDIX F PROJECT CONCEPTS AND ONGOING FEASIBILITY STUDIES Groundwater Conceptual (AF/YR) Member Agency Project or Study Name Project Type Groundwater Basin or Location Study / Project Status Olivenhain MWD San Dieguito River Basin Brackish GW Recovery and Treatment Brackish Groundwater Recovery San Dieguito River Groundwater Basin Project Concept/ Feasibility Study Otay WD Otay Mesa Lot 7 Groundwater Well System (Capacity) Groundwater Recovery Unknown Feasibility Study Otay WD Middle Sweetwater River Basin Groundwater Well System (Capacity) Groundwater Recovery Middle Sweetwater River Basin Advanced Planning Stage ,000 1,000 1,000 Rainbow MWD San Luis Rey Groundwater Study Brackish Groundwater Recovery San Luis Rey Basin Feasibility Study 0 4,000 4,000 4,000 4,000 4,000 San Diego, City of San Pasqual Brackish Groundwater Recovery Project Brackish Groundwater Recovery and Treatment San Pasqual Basin Feasibility Report Complete/ CEQA ,235 1,427 1,539 1,619 San Diego, City of San Diego, City of Mission Valley Brackish Groundwater Recovery Project San Diego Formation - Southeastern San Diego, including Mt. Hope Brackish Groundwater Recovery and Treatment Groundwater Recovery Mission Valley Basin (Alluvial Aquifer / San Diego River) San Diego Formation Pilot Production Well Study 2012 Hydro-geologic Studies (2012) ,680 1,680 1, ,600 1,600 1,600 Sweetwater Authority / Otay WD Otay River Valley GW Aquifer Studies & Field Investigations Brackish Groundwater Recovery San Diego Formation (Otay River Basin) Hydro-geologic Studies ongoing (2012) 0 0 3,900 3,900 3,900 3,900 Project Concepts Yields - 4,560 11,335 14,567 14,679 14, year average
249 APPENDIX F Carlsbad, City of Carlsbad WRF ,000 Irrigation Encina Wastewater Authority Escondido, City of Fairbanks Ranch Comm. Ser. D Table F-3 Member Agency Wastewater Treatment San Diego Wastewater Treatment and Water Recycling Facilities Plant Capacity (Million Gallons/Day) Planned Treatment Capacity Effluent Operating Agency Treatment Facility Name Quality for Disposal Method P S T P S T TDS (mg/l) Encina WPCF ,031 Outfall-Reuse Hale Avenue Resource Recovery Facility (HARRF) ,000 Reuse-Outfall Fairbanks Ranch WPCF ,100 Percolation Fallbrook PUD Fallbrook Plant #1 WRF Reuse-Outfall Leucadia CWD Forest R. Gafner WRP ,000 Reuse-Outfall Oceanside, City of La Salina WWTP Outfall Oceanside, City of San Luis Rey WWTP Reuse-Outfall Olivenhain MWD 4-S Ranch WWTP ,000 Reuse Otay WD Ralph W Chapman WRF Reuse- Outfall Padre Dam MWD Ray Stoyer WRF Phase I Reuse- Outfall Padre Dam MWD Ray Stoyer WRF Phase Reuse- Outfall Padre Dam MWD Ray Stoyer WRF Phase Reuse- Outfall Camp Pendleton Marine Corps Base Camp Pendleton Marine Corps Base Southern Region TTP Irrigation/Outfall Northern Region TTP Irrigation/Percolation Ramona MWD Santa Maria WRP Reuse-Stream Ramona MWD San Vicente WRP Reuse-Stream Rancho Santa Fe Com. Service District Rancho Santa Fe Com. Service District Rincon del Diablo MWD Rincon del Diablo MWD Santa Fe Valley WRF ,000 Irrigation Rancho Santa Fe WRF ,100 Percolation Harmony Grove Village ,000 Reuse - Irrigation Harmony Grove Village - South ,000 Reuse - Irrigation San Diego, City of North City WRP ,000 Reuse San Diego, City of Point Loma WWTP Outfall San Diego, City of Harbor Drive WRP ,000 Reuse San Diego, City of South Bay WRP ,000 Reuse-Outfall San Diego, City of Harbor Drive WRP ,000 Reuse San Diego, City of South Bay WRP ,000 Reuse-Outfall San Elijo Joint Powers San Elijo WRF Reuse-Outfall Authority Vallecitos WD Meadowlark WRF ,000 Reuse Valley Center MWD Lower Moosa Canyon WRF ,000 Irrigation Valley Center MWD Welk WRF ,000 Irrigation (Golf Course) Valley Center MWD Lilac Hills Ranch WRF ,000 Irrigation Valley Center MWD Woods Valley Ranch WRF ,000 Irrigation (Golf Course) Valley Center MWD North Village WRF (WVR Ph. 4) ,000 Irrigation Valley Center MWD Meadowood WRF ,000 Irrigation Whispering Palms CSD CSD - Community Services District MWD - Municipal Water District RRF - Resource Recovery Facility TTP - Tertiary Treatment Plant WPCF - Water Pollution Control Facility WRF - Water Reclamation/Recycling Facility WRP - Water Reclamation Plant WWTP - Wastewater Treatment Plant Whispering Palms WPCF Pasture-Percolation * P - Primary Treatment S - Secondary Treatment T - Tertiary Treatment 1. Scenario 1, HDWRP has 49 MGD treatment capacity and SBWRP has 36 MGD treatment capacity 2. Scenario 2, HDWRP has 68 MGD treatment capacity and SBWRP has 15 MGD treatment capacity * Totals include only Scenario 1 for City of San Diego's Harbor Drive WRP and South Bay WRP
250 APPENDIX F Table F-4 Member Agency Recycled Water Projections EXISTING RECYCLED PROJECTS AND PROPOSED EXPANSIONS (VERIFIABLE) Treatment Purveyor Supply Source Treatment Plant/Agency Type of Reuse 1 Level Projected Verifiable Reuse (AF/YR) Carlsbad WRF/Carlsbad MWD Tertiary Landscape, Agriculture 1,903 2,831 2,831 2,831 2,831 2,831 Carlsbad MWD Gafner WRF/Leucadia CWD Tertiary Landscape, Agriculture Meadowlark WRF (via Mahr Reservoir) /Vallecitos WD Tertiary Landscape, Agriculture 2,000 2,000 2,000 2,000 2,000 2,000 Sub-total 4,150 5,078 5,078 5,078 5,078 5,078 Del Mar, City of San Elijo WRF/San Elijo JPA Tertiary Landscape Escondido, City of Hale Avenue RRF/WRF/City of Escondido Tertiary Landscape, Agriculture, Industrial/PR 600 3,000 3,650 4,400 4,400 4,400 Fallbrook PUD Fallbrook Plant #1/Fallbrook PUD Tertiary Landscape, Agriculture 600 1,200 1,200 1,200 1,200 1,200 Oceanside, City of San Luis Rey WWTP/City of Oceanside - Phase 1 Expansion Tertiary Landscape ,700 2,900 3,060 3,500 4S Ranch WRF/Olivenhain MWD Tertiary Landscape Olivenhain MWD Connection #1-North City Water Reclamation Plant/City of San Diego Connection #2-North City Water Reclamation Plant/City of San Diego Santa Fe Valley WRF/Rancho Santa Fe CSD Northwest Quadrant /Meadowlark WRF/Vallecitos WD Tertiary Golf Course Irrigation/HOAs (includes farms at 272 AF/YR) Tertiary Golf Course Irrigation/HOAs Tertiary Landscape, Golf Course Irrigation Tertiary Landscape SEJPA1-Quail Gardens Tertiary Landscape SEJPA2-Village Park, Manchester Phase I Tertiary Landscape Sub-total 1,928 2,443 2,443 2,443 2,443 2,443 R. W. Chapman WRF/Otay WD Tertiary Landscape 1,100 1,100 1,100 1,100 1,100 1,100 Otay WD South Bay WRP/City of SD Tertiary Landscape 3,300 4,570 4,800 4,900 5,100 5,400 Sub-total 4,400 5,670 5,900 6,000 6,200 6,500 Padre Dam MWD Ray Stoyer WRF (Existing)/Padre Dam MWD Ray Stoyer WRF (Existing)/Padre Dam MWD Tertiary Replenishment of Santee Lakes 1,120 1,120 1,120 1,120 1,120 1,120 Tertiary Landscape (Existing Distribution System) Sub-total 2,016 2,016 2,016 2,016 2,016 2,016 Camp Pendleton Marine Corps Base South WWTPs/USMC Sewage Treatment Plants # 11 & #12/USMC North WWTPs/USMC Tertiary Secondary Tertiary Landscape, Golf Course, Agriculture Percolation/Seawater Intrusion Barrier Landscape/Seawater Intrusion Barrier Sub-total 1, Poway, City of North City WRP/City of San Diego Tertiary Landscape, Agriculture Ramona MWD Santa Maria WRP/Ramona MWD San Vicente WRP/Ramona MWD Tertiary Tertiary Landscape, Recreational Impound, Development Landscape (Golf Course), Agriculture (Orchard) Sub-total Rincon Del Diablo MWD Hale Avenue RRF/WRF/City of Escondido Tertiary Landscape, Industrial 3,300 3,100 4,000 4,000 4,000 4,000 North City WRP/City of San Diego Tertiary Landscape, Industrial 7,029 12,500 12,500 12,500 12,500 12,500 San Diego, City of South Bay WRP/City of San Diego Tertiary Landscape, Industrial 1,166 1,150 1,150 1,150 1,150 1,150 Sub-total 8,195 13,650 13,650 13,650 13,650 13,650 San Dieguito WD San Elijo WRF/San Elijo JPA Tertiary Landscape Santa Fe ID San Elijo WRF/San Elijo JPA Tertiary Landscape Valley Center MWD Woods Valley Ranch WRF/VCMWD Woods Valley Ranch WRF (Phase 2) Tertiary Tertiary Landscape Irrigation/Golf Course Irrigation Landscape Irrigation/Golf Course Irrigation Sub-total Total 29,095 40,459 43,674 45,758 46,118 46,858
251 APPENDIX F ADDITIONAL PLANNED PROJECTS Purveyor Supply Source Treatment Plant/Agency Treatment Level Type of Reuse Project Phase Carlsbad MWD Carlsbad WRF/Carlsbad MWD Tertiary Landscape, Agriculture Design/Planning Escondido, City of Hale Avenue Resource Recovery Facility (HARRF) Tertiary Landscape, Agriculture, Industrial, PR - 1,380 7,130 8,130 8,130 8,130 FS Padre Dam MWD Ray Stoyer WRF/Padre Dam MWD Tertiary Landscape, Irrigation, Dust Control - - 1,008 1,008 1,008 1,008 FS South WWTPs/USMC Tertiary Injection - Las Flores Basin Design Camp Pendleton Marine Corps Base South WWTPs/USMC Tertiary Injection - Santa Margarita Basin Design North WWTPs/USMC Tertiary Landscape Design Sub-total - 1,410 1,410 1,410 1,410 1,410 Santa Fe ID Evaluating Multiple Options/TBD Tertiary Landscape FS Total 50 2,840 9,926 10,926 10,926 10,926 PROJECT CONCEPTS Purveyor Supply Source Treatment Plant/Agency Treatment Level Type of Reuse Project Phase Carlsbad MWD Carlsbad WRF/Carlsbad MWD Tertiary Landscape, Agriculture EIR Meadowlark WRF/Vallecitos WD Tertiary Landscape, Agriculture EIR Sub-total Olivenhain MWD Village Park Recycled Water Expansion Project Tertiary Turf and Landscape Concept Extension 153 Phase I Tertiary Landscape Concept Joint RW Transmission Project with SFID and OMWD/TBD Tertiary Landscape, Golf Course Irrigation Concept Extension 153 Phase II Tertiary Landscape Concept Rancho Cielo Tertiary Landscape Concept Sub-total ,116 1,116 1,116 Otay WD North District Recycled System/R.W. Chapman WRF/Otay WD Tertiary Landscape ,400 4,400 4,400 Concept Camp Pendleton Marine Corps Base South WWTPs/USMC Tertiary Indirect Potable Recharge - 2,060 2,060 2,060 2,060 2,060 Concept Poway, City of North City WRP/City of San Diego Tertiary Landscape, Agriculture Concept North City WRP/City of San Diego Tertiary Landscape, Agriculture Concept Sub-total Rainbow MWD WRP/Recycled Water Distribution System Tertiary Landscape, Agriculture, Irrigation ,000 1,600 1,600 Design Review Ramona MWD Santa Maria WRP/Ramona MWD Tertiary Landscape, Recreational Impound, Development 3,000 3,000 3,000 3,000 3,000 Concept Valley Center MWD Lower Moosa Canyon WRF Tertiary Landscape Irrigation FS Welk WRF/VCMWD Tertiary Landscape/Golf Course Irrigation FS Lilac Hills Ranch WRF/VCMWD Tertiary Landscape Irrigation FS Meadowood WRF/VCMWD Tertiary Landscape Irrigation FS Woods Valley Ranch WRF (Phase 3)/VCMWD Tertiary Landscape Irrigation FS North Village WRF (Phase 4)/VCMWD Tertiary Landscape Irrigation FS Sub-total ,280 1,550 Vista Irrigation District Shadowridge WRP Tertiary Landscape Irrigation - - 1,800 1,800 1,800 3,000 Concept Total - 5,960 9,096 14,439 16,209 17, Does not include recycled water used for environmental enhancement. Projected verifiable projects are included in the Water Authority's 2015 UWMP reliability analysis.
252 APPENDIX F Table F-5 Member Agency Potable Reuse Projections EXISTING POTABLE REUSE PROJECTS AND PROPOSED EXPANSIONS (VERIFIABLE) Lead Agency Project Name Source Water Purveyor (if different from lead agency) Source Water Facility Project Type (i.e. direct, indirect) Projected Verifiable Use (AF/YR) Oceanside, City of San Luis Rey WRF - Short/Long-Term Expansion Oceanside, City of San Luis Rey WRF Indirect and/or Direct - 3,300 3,300 3,300 3,300 3,300 Total - 3,300 3,300 3,300 3,300 3,300 ADDITIONAL PLANNED PROJECTS Lead Agency Project Name Source Water Purveyor (if different from lead agency) Supply Source Treatment Plant/Agency Project Type (i.e. direct, indirect) Projected Additional Planned (AF/YR) Padre Dam MWD East County Advanced Water Purification Program Phase 1* East County Advanced Water Purification Program Phase 2* Padre Dam MWD/SD County San. District Padre Dam MWD/SD County San. District/ City of El Cajon East County Advanced Water Purification Facility / Padre Dam MWD East County Advanced Water Purification Facility / Padre Dam MWD Indirect - 3,920 3,920 3,920 3,920 3,920 Indirect - - 7,616 7,616 7,616 7,616 Sub-total - 3,920 11,536 11,536 11,536 11,536 Rincon del Diablo MWD New Local Supply ** Hale Avenue RRF/ City of Escondido/WRFs Indirect/ Direct ,000 1,000 1,000 Phase 1 North City / City of San Diego Indirect ,800 33,600 33,600 33,600 San Diego, City of PURE Water San Diego, City of Phase 2 Central Area / City of San Diego Indirect ,598 42,598 Phase 3 South Bay / City of San Diego Indirect ,815 16,815 Sub-total ,800 33,600 93,013 93,013 Santa Fe ID SFID/SDWD/SEJPA Potable Reuse Project San Elijo Joint Powers Authority San Elijo Water Reclamation Facility (Advanced Treatment) / San Elijo JPA Indirect or Direct Total - 4,470 29,086 46, , ,099 PROJECT CONCEPTS Lead Agency Project Name Source Water Purveyor (if different from lead agency) Supply Source Treatment Plant/Agency Project Type (i.e. direct, indirect) Conceptual (AF/YR) Escondido, City of Potable Reuse Escondido, City of Hale Avenue Resource Recovery Facility (HARRF) / City of Escondido TBD ,000 5,000 5,000 Olivenhain MWD San Elijo Valley/San Dieguito River Basin Brackish GW Recovery & Treatment San Elijo JPA/Leucadia Wastewater District San Elijo JPA/Leucadia Wastewater District Indirect Padre Dam MWD East County Advanced Water Purification Program Phase 3* Padre Dam MWD/SD County San. District/ City of El Cajon East County Advanced Water Purification Facility / Padre Dam MWD Indirect ,824 Total ,560 5,560 11,384 * Effluent will be split between Helix WD & Padre Dam with percentages to TBD in the future, should Helix decide to participate in the Project beyond the current planning. ** Based on HARRF/Harmony Grove Village WRFs and potential scalping plant.
253 APPENDIX F Table F-6 Member Agency Desalination Projections EXISTING DESALINATION PROJECTS AND PROPOSED EXPANSIONS (VERIFIABLE) Projected Verifiable Use (AF/YR) Lead Agency Project Name Supplies to be purchased by Carlsbad MWD Supplies to be purchased by Vallecitos WD Claude "Bud" Lewis Carlsbad Desalination Plant Claude "Bud" Lewis Carlsbad Desalination Plant - 2,500 2,500 2,500 2,500 2,500-3,500 3,500 3,500 3,500 3,500 Total - 6,000 6,000 6,000 6,000 6,000 ADDITIONAL PLANNED PROJECTS Projected Additional Planned (AF/YR) Lead Agency Project Name Otay WD Otay WD/ Rosarito Beach ,100 15,600 16,100 16,800 Total ,100 15,600 16,100 16,800 PROJECT CONCEPTS Conceptual (AF/YR) Lead Agency Project Name Total

254


255

256

257

258

259


260


261
262


263
264


265
266

267

268

269
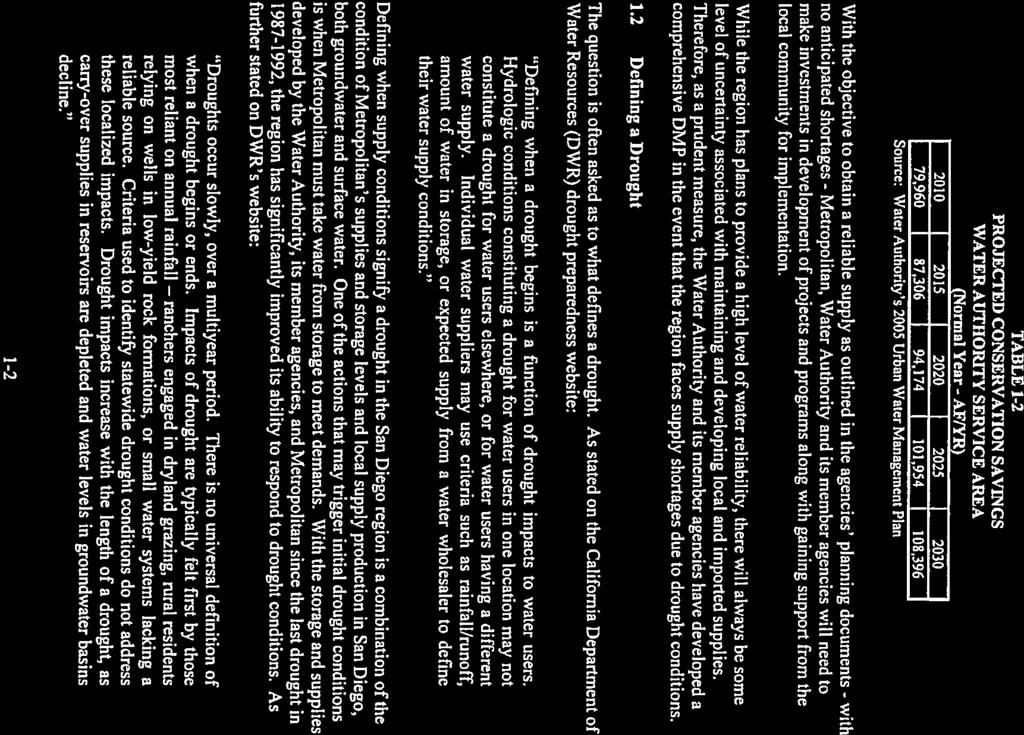
270

271
272

273

274

275

276


277

278

279


280

281

282

283
284


285

286

287

288

289


290

291

292

293


294


295

296
297

298
299


300

301

302

303


304

305

306

307

308

309

310

311

312

313

314


315

316

317
318 APPENDICES The Appendices for the Water Shortage and Drought Response Plan can be viewed online via the Water Authority s website at:
319

320

321

322

323

324
325

326

327

328

329

330

331

332
333

334

335

336

337


338


339
340

341


342


343
URBAN WATER Management Plan
 2010 URBAN WATER Management Plan Prepared by San Diego County Water Authority Water Resources Department >> 2010 Urban Water Management Plan Prepared by: San Diego County Water Authority Water Resources
Notice of Public Hearing. Notice of Public Hearing
 2015 URBAN WATER MANAGEMENT PLAN Table 8-2: Notification to Cities and Counties Retail: Notification to Cities and Counties City Name 60 Day Notice Notice of Public Hearing Dana Point Mission Viejo County
WESTCAS June 21, Maureen Stapleton, General Manager San Diego County Water Authority
 WESTCAS June 21, 2017 Maureen Stapleton, General Manager San Diego County Water Authority San Diego County Water Authority Wholesale water agency and regional water planner created by state Legislature
Section 5 - Supply Allocation Methodology (Updated April 2012)
") Section 5 - Supply Allocation Methodology (Updated April 2012) 5.1 Introduction As outlined in the Drought Response Matrix discussed in Section 4, after the Water Authority s Board of Directors has exhausted
Section 5 - Supply Allocation Methodology (Updated April 2012) 5.1 Introduction As outlined in the Drought Response Matrix discussed in Section 4, after the Water Authority s Board of Directors has exhausted
2015 Urban Water Management Plan
 2015 Urban Water Management Plan FINAL June 2016 Prepared by Page intentionally left blank. 2015 Urban Water Management Plan Final Prepared By: June 27, 2016 Sweetwater Authority 2015 Urban Water Management
URBAN WATER MANAGEMENT PLAN JUNE Prepared By
 2015 URBAN WATER MANAGEMENT PLAN F I N A L JUNE 2016 Prepared By This page intentionally left blank. Final Prepared by: June 2016 This page intentionally left blank. Page ii Table of Contents Executive
Vallecitos Water District 2015 Urban Water Management Plan Page 6-1
 Section 6: S System Supplies Ince its formation in 1955, the (VWD) has received 100 percent of its water supply from the San Diego County Authority (SDCWA), of which it is one of 24 member agencies. The
SPECIAL WATER PLANNING COMMITTEE WORKSHOP. Board Room. February 10, :30 p.m. Hershell Price Vice Chair
 SPECIAL WATER PLANNING COMMITTEE WORKSHOP Board Room February 10, 2011 1:30 p.m. Mitch Dion Chair Hershell Price Vice Chair Javier Saunders Vice Chair Brian Boyle Betty Ferguson Lynne Heidel Michael Hogan
Welcome to the Breakfast at the BMC Lecture Series
 Welcome to the Breakfast at the BMC Lecture Series Is California s state of emergency restrictions on water usage affecting the San Diego economy and real estate industry? A special thanks to our sponsors:
WATER RELIABILIT Y TO SAN DIEGO S ECONOMY
 T H E I M P O R TA N C E O F WATER RELIABILIT Y TO SAN DIEGO S ECONOMY RELIABLE WATER INFRASTRUCTURE IS AN INVESTMENT IN THE REGIONAL ECONOMY Clean, reliable water supplies provide numerous economic benefits
UWMP Checklist Arranged by Subject
 Checklist Arranged by CWC 10620(b) 10620(d)(2) Requirement Every person that becomes an urban water supplier shall adopt an urban water management plan within one year after it has become an urban water
This page intentionally left blank
 This page intentionally left blank Water Shortage Contingency Plan San Diego County Water Authority Maureen A. Stapleton, General Manager Sandra L. Kerl, Deputy General Manager Dennis A. Cushman, Assistant
City of Escondido 2010 Urban Water Management Plan. July 2011
 City of Escondido 2010 Urban Water Management Plan July 2011 City of Escondido 2010 Urban Water Management Plan July 2011 Project No. 139583 9665 Chesapeake Drive, Suite 201 San Diego, California 92123
UWMP Standardized Tables. Livermore District Urban Water Management Plan Appendix H
 UWMP Standardized Tables Livermore District 2015 Urban Water Management Plan Appendix H Table 2-1 Retail Only: Public Water Systems Public Water System Number Public Water System Name Number of Municipal
San Diego County Water Authority Special Water Planning Committee Meeting October 10, 2012
 Public Workshop on issues related to the Carlsbad Desalination Project San Diego County Water Authority Special Water Planning Committee Meeting 1 October 10, 2012 Wholesale water agency created by State
ADOPT A RESOLUTION OF THE CITY COUNCIL IN SUPPORT OF THE CALIFORNIA WATERFIX AND CALIFORNIA ECO RESTORE
 ADOPT A RESOLUTION OF THE CITY COUNCIL IN SUPPORT OF THE CALIFORNIA WATERFIX AND CALIFORNIA ECO RESTORE Presented by Gary Takara City Council September 18, 2017 Agenda Item 12 Recommendations Find that
UWMP Standardized Tables. Dominguez District Urban Water Management Plan Appendix H
 UWMP Standardized Tables Dominguez District 2015 Urban Water Management Plan Appendix H Table 2-1 Retail Only: Public Water Systems Public Water System Number Public Water System Name Number of Municipal
UWMP Standardized Tables. King City District Urban Water Management Plan Appendix H
 UWMP Standardized Tables King City District 2015 Urban Water Management Plan Appendix H Table 2-1 Retail Only: Public Water Systems Public Water System Number Public Water System Name Number of Municipal
FINAL JUNE 2016 CITY OF WOODLAND Urban Water Management Plan
 FINAL JUNE 2016 CITY OF WOODLAND 2015 Urban Water Management Plan (THIS PAGE LEFT BLANK INTENTIONALLY) 2015 Urban Water Management Plan Prepared for City of Woodland June 2016 204-12-15-53 Project Manager
UWMP Standardized Tables. Salinas District Urban Water Management Plan Appendix H
 UWMP Standardized Tables Salinas District 2015 Urban Water Management Plan Appendix H Table 2-1 Retail Only: Public Water Systems Public Water System Number Public Water System Name Number of Municipal
APPENDIX A. Legislative Requirements. Urban Water Management Planning Act SBx7-7 Water Conservation Act of 2009 SB1478
 APPENDIX A Legislative Requirements Urban Water Management Planning Act SBx7-7 Water Conservation Act of 2009 SB1478 Section K: California Water Code, Division 6, Part 2.6: Urban Water Management Planning
Section 5: Water Quality
 T Section 5: Water Quality he California Urban Water Management Planning Act (Act) requires that the 2010 Urban Water Management Plan (UWMP) include information, to the extent practicable, on the quality
Committee on Water. Desalination as a Water Source
 Committee on Water Committee on Water Desalination as a Water Source Water Supply Reliability for San Diego County NARUC Summer Policy Summit July 17, 2017 Bob Yamada Director of Water Resources San Diego
UWMP Standardized Tables. City of Hawthorne District Urban Water Management Plan Appendix H
 UWMP Standardized Tables City of Hawthorne District 2015 Urban Water Management Plan Appendix H Table 2-1 Retail Only: Public Water Systems Public Water System Number Public Water System Name Number of
Amortized annual capital cost ($) + Annual Operating Cost ($) = Unit Cost ($/acre-foot) Annual beneficially used water production in acre-feet (AF)
 + Annual Operating Cost ($) = Unit Cost ($/acre-foot) Annual beneficially used water production in acre-feet (AF)") Attention: Water Planning Committee Unit Cost of New Local Water Supply Alternatives (Information) Purpose This report discusses current unit costs for new local water supply alternatives including water
Attention: Water Planning Committee Unit Cost of New Local Water Supply Alternatives (Information) Purpose This report discusses current unit costs for new local water supply alternatives including water
This board letter outlines the state and federal 2015/16 legislative priorities recommended by staff for the Board's consideration and adoption.
 Board of Directors Communications and Legislation Committee 12/9/2014 Board Meeting Subject Adopt Legislative Priorities for 2015/16 Executive Summary This board letter outlines the state and federal 2015/16
FINAL - MAY 2016 CITY OF ROSEVILLE Urban Water Management Plan
 FINAL - MAY 2016 CITY OF ROSEVILLE 2015 Urban Water Management Plan (THIS PAGE LEFT BLANK INTENTIONALLY) Final 2015 Urban Water Management Plan Prepared for The City of Roseville May 2016 415-12-15-26
UWMP Standardized Tables. Los Altos Suburban District Urban Water Management Plan Appendix H
 UWMP Standardized Tables Los Altos Suburban District 2015 Urban Water Management Plan Appendix H Table 2-1 Retail Only: Public Water Systems Public Water System Number Public Water System Name Number of
Eastern Municipal Water District 2015 Urban Water Management Plan
 FINAL Prepared by June 2016 Table of Contents EXECUTIVE SUMMARY ES-1 PLAN PURPOSE AND OVERVIEW... XI ES-2 SERVICE AREA AND WATER SUPPLIES... XII ES-3 WATER DEMANDS... XIII ES-4 WATER SUPPLY FORECAST...
UWMP Standardized Tables. Palos Verdes District Urban Water Management Plan Appendix H
 UWMP Standardized Tables Palos Verdes District 2015 Urban Water Management Plan Appendix H Table 2-1 Retail Only: Public Water Systems Public Water System Number Public Water System Name Number of Municipal
The City and MID adopted this 2010 UWMP in Copies of the adoption resolutions are included in Appendix B. ES-1
 ES.1 INTRODUCTION This (UWMP) has been prepared for the City of Modesto (City) and the Modesto Irrigation District (MID) by West Yost Associates (West Yost) as a joint UWMP. This 2010 UWMP for the City
20. UTILITIES AND SERVICE SYSTEMS
 June 28, 2018 Page 20-1 20. UTILITIES AND SERVICE SYSTEMS This EIR chapter describes existing conditions for and distribution, collection and, and solid waste disposal and recycling in the planning area.
4.16 WATER SUPPLY EXISTING CONDITIONS WATER SUPPLY AGENCIES. Metropolitan Water District Water Supply
 4.16 WATER SUPPLY This section evaluates the water supply impacts of the proposed Plan. The information presented was compiled from multiple sources, including the San Diego County Water Authority (SDCWA),
SB 606 (Hertzberg) Summary As Chaptered on 5/31/18
 Summary As Chaptered on 5/31/18") SB 606 (Hertzberg) Summary As Chaptered on 5/31/18 Urban Water Use Objectives and Water Use Reporting Requirements: SB 606 requires the State Water Resources Control Board (State Water Board) and the Department
SB 606 (Hertzberg) Summary As Chaptered on 5/31/18 Urban Water Use Objectives and Water Use Reporting Requirements: SB 606 requires the State Water Resources Control Board (State Water Board) and the Department
City of San Diego Pure Water Project October 2014
 City of San Diego Pure Water Project October 2014 SDCTA Position: SUPPORT Rationale for Position: Substantial study has demonstrated a potable reuse project within the City of San Diego would be safe,
Adopt the Long-Term Conservation Plan and revised policy principles on water conservation
 Board of Directors Water Planning and Stewardship Committee 8/16/2011 Board Meeting Subject Adopt the Long-Term Conservation Plan and revised policy principles on water conservation Description In February,
Wholesale water agency created by State Legislature in Mission is to provide safe and reliable water supply to member agencies Service area
 Wholesale water agency created by State Legislature in 1944 24 member agencies 36-member board of directors 3 million people $188 billion economy Mission is to provide safe and reliable water supply to
Prepared by: Fallbrook Public Utility District staff
 Fallbrook Public Utility District 2015 Urban Water Management Plan Prepared by: Fallbrook Public Utility District staff Table of Contents 1. Introduction and Overview... 1 1.1 California Urban Water Management
8-2. Communications and Legislation Committee. Board of Directors. 12/11/2018 Board Meeting. Subject. Executive Summary. Details
 Board of Directors Communications and Legislation Committee 12/11/2018 Board Meeting Subject Adopt Federal Legislative Priorities and Principles for 2019; the General Manager has determined that the proposed
Metropolitan Water District. July 25, 2013
 Metropolitan Water District July 25, 2013 The Mission of the Metropolitan Water District is to provide its service area with adequate and reliable supplies of high-quality water to meet present and future
UWMP Standardized Tables. Chico-Hamilton City District Urban Water Management Plan Appendix H
 UWMP Standardized Tables Chico-Hamilton City District 2015 Urban Water Management Plan Appendix H Table 2-1 Retail Only: Public Water Systems Public Water System Number Public Water System Name Number
Business Plan
 2019-2023 Business Plan 2019-2023 Business Plan October 2018 This page intentionally left blank Table of Contents MESSAGE FROM THE GENERAL MANAGER 1 INTRODUCTION Overview 2 Business Plan Key Focus Areas
URBAN WATER MANAGEMENT PLAN
 2015 URBAN WATER MANAGEMENT PLAN Working Draft December 2015 THE METROPOLITAN WATER DISTRICT OF SOUTHERN CALIFORNIA 2015 URBAN WATER MANAGEMENT PLAN JUNE 2016 Working Draft December 2015 Planning for the
Energy Management Strategies at Metropolitan Water District. Roy L Wolfe, Ph.D.
 Energy Management Strategies at Metropolitan Water District Roy L Wolfe, Ph.D. Japan U.S. Joint Conference on Drinking Water Quality Management and Wastewater Control California Water and Energy March
Urban Water Management Plan
 DR af t 2015 Urban Water Management Plan June 8, 2016 2015 Urban Water Management Plan Santee, California June 8, 2016 Prepared by: 9665 Chesapeake Dr., Suite 201 San Diego, CA 92123 Project Participants
Request for Proposals
 Request for Proposals The Marina Coast Water District wishes to contract for an individual or firm to prepare Master Plans and Capacity Fees for Sewer, Water and Recycled Water Proposals due 4:00 PM October
2015 URBAN WATER MANAGEMENT PLAN VOLUME 1 FINAL REPORT
 CITY OF HEMET 2015 URBAN WATER MANAGEMENT PLAN VOLUME 1 FINAL REPORT JUNE 2016 Prepared by CITY OF HEMET 2015 URBAN WATER MANAGEMENT PLAN VOLUME 1 FINAL REPORT JUNE 2016 PREPARED FOR CITY OF HEMET 445
1.1 Introduction
 Table of Contents Executive Summary ES.1 Introduction... ES-1 ES.2 Plan Adoption... ES-1 ES.3 Plan Overview... ES-2 ES.3.1 Service Area... ES-2 ES.3.2 Water Demand... ES-3 ES.3.3 Projected Water Supply...
Executive Summary for the CII Task Force Water Use Best Management Practices
 0//0 Executive Summary for the CII Task Force Water Use Best Management Practices Formatted 0 0 0 Background and History California s water demands have begun to reach and, at some times in some places,
UWMP Standardized Tables. Kern River Valley District Urban Water Management Plan Appendix H
 UWMP Standardized Tables Kern River Valley District 2015 Urban Water Management Plan Appendix H Table 2-1 Retail Only: Public Water Systems Public Water System Number Public Water System Name Number of
San Diego, A Cadillac Desert; Presentation by: Dana Fi Friehauf, fpe P.E. Water Resources Manager
 San Diego, A Cadillac Desert; Sustainable Strategies for Living in a Desert Presentation by: Dana Fi Friehauf, fpe P.E. Water Resources Manager Green Lunch Bag Series September 24, 2014 San Diego County
URBAN WATER MANAGEMENT PLAN
 2015 URBAN WATER MANAGEMENT PLAN FINAL DRAFT JULY 2016 2015 URBAN WATER MANAGEMENT PLAN City of San Juan Capistrano DRAFT [Signature 1 Name] [Title] Prepared for: Eric Bauman Utilities Department City
2015 Urban Water Management Plan
 East Niles Community Services District 2015 Urban Water Management Plan June 2016 Prepared for: East Niles Community Services District 1417 Vale Street Bakersfield, CA 93306 Prepared by: MKN & Associates
DRAFT ANNOTATED OUTLINE 12/4/2006
 DRAFT ANNOTATED OUTLINE 12/4/2006 INTEGRATED WATER MANAGEMENT PLAN SAN DIEGO REGION A. INTRODUCTION AND REGIONAL WATER MANAGEMENT GROUP Summary This Integrated Regional Water Management Plan (IRWM Plan)
January 9, Bill Rose Gary Bousquet
 January 9, 2014 Bill Rose Gary Bousquet Status of BDCP Design Role of Water Authority Review Schedule July August Board Review Process Background & Options to Review Review Update September Costs and Funding
Sierra Mountains. LA Aqueduct. Supplies Conservation
 Sierra Mountains LA Aqueduct Delta State Water Project Supplies Groundwater and Recycling Colorado River Aqueduct Supplies Conservation Groundwater Recovery CRA 21% SWP 29% Local Supplies & LA Aqueduct
CHAPTER 3 Water Supply
 CHAPTER 3 3.1 WATER SUPPLY OVERVIEW This chapter describes the sources of water available to the City and MID. The chapter includes a description of each water source, including limitations, water quality
APPENDIX D Water Agency Profile: City of San Diego
 APPENDIX D Water Agency Profile: City of San Diego Recycled Water Summary 2005 2010 2015 2020 2025 Source 1 Total Water Demand 227,456 239,426 246,378 256,460 266,438 2005 UWMP, Table 2-9 2 Wastewater
Los Angeles 3 rd Regional
 Los Angeles 3 rd Regional Investors Conference Los Angeles, California March 31, 2016 Metropolitan Water District of Southern California 1 Metropolitan Water District of of Southern California 2 Metropolitan
3.0 Relationship to Other Conservation Plans
 3.0 Relationship to Other Conservation Plans 3.1 Water Authority NCCP/HCP The Water Authority began to prepare this Plan in 1995, at a time when other jurisdictions and regional utilities in southern California
A Case Study: Imperial Valley, California
 University of Colorado Law School Colorado Law Scholarly Commons Western Water: Expanding Uses/Finite Supplies (Summer Conference, June 2-4) Getches-Wilkinson Center Conferences, Workshops, and Hot Topics
Regional water wholesaler Serves 6 counties, 19 million people Growth: 170,000 people/yr. $1 trillion regional economy
 Regional water wholesaler Serves 6 counties, 19 million people Growth: 170,000 people/yr. $1 trillion regional economy 50%+ of region s supply (4 million acre-ft/yr) 2 State Water Project (DWR) Delta
LAKESIDE WATER DISTRICT URBAN WATER MANAGEMENT PLAN. i Lakeside Water District Urban Water Management Plan
 LAKESIDE WATER DISTRICT URBAN WATER MANAGEMENT PLAN 2015 i Lakeside Water District Urban Water Management Plan 2015 Table of Contents Chapter Page Appendices & Tables List... v 1 Introduction 1.1 Executive
SECTION SIX. Water Quality. Water Quality. Section 6
 SECTION SIX Water Quality Section 6 Water Quality SECTION 6 Water Quality Providing a safe drinking water supply to consumers is a task of paramount importance to West Basin. All prudent actions are taken
Final Draft City of Manteca 2015 Urban Water Management Plan
 10850 Gold Center Drive, Suite 350 Rancho Cordova, CA 95670 916-858-2700 916-858-2754 (Fax) Final Draft 2015 Urban Water Management Plan July 2016 Prepared for 1001 W. Center St. Manteca, California 95337
Metropolitan Water District of Southern California 2018 STATE LEGISLATIVE PRIORITIES AND PRINCIPLES
 2018 STATE LEGISLATIVE PRIORITIES AND PRINCIPLES Adopted December, 2017 State Legislative Priorities and Principles for 2018 After consulting with Metropolitan member agency legislative coordinators in
2015 Urban Water Management Plan. Adopted: June 14, 2016
 2015 Urban Water Management Plan Adopted: June 14, 2016 This page intentionally left blank City of Folsom 2015 Urban Water Management Plan Final June 2016 Prepared by: [This page intentionally left blank]
Indirect Reuse with Multiple Benefits The El Monte Valley Mining, Reclamation, and Groundwater Recharge Project
 ABSTRACT & POWERPOINT PRESENTATION Indirect Reuse with Multiple Benefits The El Monte Valley Mining, Reclamation, and Groundwater Recharge Project Tim Smith Principal Engineer Helix Water District La Mesa,
2015 Urban Water Management Plan
 Prepared for City of Stockton 2015 Urban Water Management Plan July 2016 11020 White Rock Road, Suite 200 Rancho Cordova, California 95670 Tel: 916-444-0123 Fax: 916-635-8805 www.brownandcaldwell.com
California Urban Water Agencies Water Supply Reliability Report
 Progress Update on Water Conservation, Supply Diversification and Resource Management California Urban Water Agencies Water Supply Reliability Report August 2012 San Francisco Public Utilities Commission;
TABLE OF CONTENTS 4.17 UTILITIES AND SERVICE SYSTEMS...
 TABLE OF CONTENTS 4.17 UTILITIES AND SERVICE SYSTEMS... 4.17-1 4.17.0 Introduction... 4.17-1 4.17.1 Methodology... 4.17-2 4.17.2 Existing Conditions... 4.17-2 4.17.3 Impacts... 4.17-4 4.17.4 Applicant-Proposed
AGENDA FOR MAY 27, 2010
 WATER PLANNING COMMITTEEE AGENDA FOR MAY 27, 2010 Javier Saunders Chair Rua Petty Vice Chair Betty Ferguson Vice Chair Marilyn Dailey Lynne Heidel Keith Lewinger Bud Lewis John Linden Barry Martin Dan
CHAPTER 2 POPULATION, LAND USE & WATER USE TRENDS
 Population CHAPTER 2 POPULATION, LAND USE & WATER USE TRENDS 2.1 PAST POPULATION IEUA s service area experienced rapid growth over the past ten years (see Figure 2-1). In 2000, the population within the
INDIAN WELLS VALLEY WATER DISTRICT 2010 URBAN WATER MANAGEMENT PLAN MAY Prepared by
 INDIAN WELLS VALLEY WATER DISTRICT (760) 375-5086 500 WEST RIDGECREST BOULEVARD POST OFFICE BOX 1329 RIDGECREST, CALIFORNIA 93556 RIDGECREST, CALIFORNIA 93556-1329 INDIAN WELLS VALLEY WATER DISTRICT 2010
2015 Urban Water Management Plan for District 40
 2015 Urban Water Management Plan for District 40 County of Los Angeles Department of Public Works Los Angeles County Waterworks District No. 40, Antelope Valley Alhambra, California February 2017 Table
MAKING WATER CONSERVATION A CALIFORNIA WAY OF LIFE
 Public Review Draft MAKING WATER CONSERVATION A CALIFORNIA WAY OF LIFE Primer of 2018 Legislation on Water Conservation and Drought Planning PREPARED BY California Department of Water Resources AUGUST
A Q U E D U C T O P E R A T I N G P L A N. JULY 1, 2015 to JUNE 30, Volume 10
 A Q U E D U C T O P E R A T I N G P L A N JULY 1, 2015 to JUNE 30, 2016 Volume 10 On the Cover North County Distribution Pipeline - Remote Operated Vehicle Inspection Carlsbad Desalination Construction
Acronyms and Abbreviations
 F Fahrenheit AB BA Bay-Delta BiOp BMP C.F.R. CAISO Assembly Bill Biological Assessment San Francisco Bay Sacramento River and San Joaquin River Delta USFWS Biological Opinion Best Management Practice Code
California League of Cities Briefing on Water Supply Issues
 California League of Cities Briefing on Water Supply Issues Stephen N. Arakawa Manager, Bay-Delta Initiatives The Metropolitan Water District of Southern California May 5, 2016 California WaterFix: Securing
2015 Urban Water Management Plan
 2015 Urban Water Management Plan DRAFT Temescal Valley Water District 22646 Temescal Canyon Road Corona, California 92883 (951) 277-1414 December 2017 Prepared by: 2015 Urban Water Management Plan Page
LONG-TERM CONSERVATION FRAMEWORK BRIEFING DEPARTMENT OF WATER RESOURCES. EDUCATION ADVOCACY LEADERSHIP March 15, 2019
 LONG-TERM CONSERVATION FRAMEWORK BRIEFING DEPARTMENT OF WATER RESOURCES EDUCATION ADVOCACY LEADERSHIP March 15, 2019 THANK YOU TO OUR HOST THANK YOU TO OUR SPONSORS MEDIA CONTRIBUTER Dawn Hodson, reporter
Water Shortage Contingency Planning
 Section 8: T Water Shortage Contingency Planning he Act requires water agencies to incorporate a water shortage contingency plan (WSCP) focusing on the allocation of water supplies and the management of
Assessment. Appendix I: Water Supply Assessment
 I Appendix I: Water Supply Assessment Please see the next page. CITY OF SAN LUIS OBISPO ASSESSMENT OF WATER SUPPLY Water Code 10910 et seq. To: City of San Luis Obispo 990 Palm Street San Luis Obispo,
2015 Urban Water Management Plan for Mojave Water Agency
 Courtesy: Google Earth FINAL 2015 Urban Water Management Plan for Mojave Water Agency Prepared by Kennedy/Jenks Consultants June 2016 300 North Lake Avenue, Suite 1020 Pasadena, California 91101 626-568-4300
Hollister Urban Area Water and Wastewater Master Plan Update
 Hollister Urban Area Water and Wastewater Master Plan Update City of Hollister, San Benito County Water District, and Sunnyslope County Water District June 2017 Robert H. Ellis NO. 24679 EXP. 12/31/17
SB 375: California s Grand Experiment in Regional and Intergovernmental Planning. American Planning Association April 16, 2012
 SB 375: California s Grand Experiment in Regional and Intergovernmental Planning American Planning Association April 16, 2012 Background on California Climate Legislation Pre-AB32 legislation State GHG
Approval of Shortage Management Actions in Response to MWD Supply Cutbacks and SWRCB Emergency Regulation
 Approval of Shortage Management Actions in Response to MWD Supply Cutbacks and SWRCB Emergency Regulation Lake Oroville May 14, 2015 Special Board Meeting Presentation by: Dana Friehauf, Water Resources
Imported Water Committee Special Meeting September 14, 2017
 Imported Water Committee Special Meeting September 14, 2017 Dan Denham, Colorado River Program Director Dan Denham: Assistant General Manager Kara Mathews: Senior Water Resources Specialist Background
Urban Water MANAGEMENT PLAN UPDATE. Prepared by:
 2015 Urban Water MANAGEMENT PLAN UPDATE Draft Report May 2016 Prepared by: Table of Contents 1 Introduction and Executive Summary... 1-1 1.1 Plan Preparation... 1-1 1.2 District Overview... 1-1 1.3 District
2018 OC Reliability Study Draft Report
 Item No. 1 2018 OC Reliability Study Draft Report P&O Committee Municipal Water District of Orange County October 1, 2018 Today s Goals Overview Presentation 1) Describe the Study Methodology 2) Present
CITY OF VACAVILLE URBAN WATER SHORTAGE CONTINGENCY PLAN FINAL
 CITY OF VACAVILLE URBAN WATER SHORTAGE CONTINGENCY PLAN FINAL AN AMENDMENT TO THE URBAN WATER MANAGEMENT PLAN ADOPTED JANUARY 1991 REVISED AUGUST 214 Prepared by: City of Vacaville Utilities Department
Irvine Ranch Water District s Groundwater Banking Program
 Irvine Ranch Water District s Groundwater Banking Program National Water Research Institute Drought Response Workshop October 8, 2013 1 Today s Discussion Introduction to IRWD Drought Preparedness at IRWD:
2015 URBAN WATER MANAGEMENT PLAN Final Report
 PREPARED FOR Coachella Valley Water District 2015 URBAN WATER MANAGEMENT PLAN Final Report July 1, 2016 This page left intentionally blank TABLE OF CONTENTS Section 1 Introduction and Overview... 1-1 1.1
URBAN WATER MANAGEMENT PLAN
 2015 URBAN WATER MANAGEMENT PLAN FINAL JUNE 2016 2015 URBAN WATER MANAGEMENT PLAN 2015 URBAN WATER MANAGEMENT PLAN City of Anaheim FINAL Prepared for: Thomas McCarthy Water Planning and Resources Manager
North Monterey County Drought Contingency Plan
 North Monterey County Water Total Water Management Evaluating Options for a Reliable Water Future North Monterey County Drought Contingency Plan May 31, 2018 Meeting Topics Overview of Drought Contingency
2O15 Urban Water Management Plan
 2O15 Urban Water Management Plan CITY OF SANTA ROSA 2015 URBAN WATER MANAGEMENT PLAN PREPARED BY: In conjunction with: West Yost Associates & Maddaus Water Management JUNE 2016 This page intentionally
Las Virgenes Municipal Water District 2010 Urban Water Management Plan Contact Sheet
 2010 Urban Water Management Plan Contact Sheet Date plan submitted to the Department of Water Resources: June 29, 2011 Name of person(s) preparing this plan: Mr. David Lippman, P.E., Director, Facilities
City of Rio Vista Urban Water Management Plan 2010
 1. Plan Preparation: City of Rio Vista Urban Water Management Plan 2010 The City of Rio Vista (City), as defined in the California Waster Code section 10617, qualifies as an "Urban Water Supplier". The
Section M CONSISTENCY WITH LOCAL PLANS
 CONSISTENCY WITH LOCAL PLANS Table of Contents M.1 Water Management Planning in the... M - 1 Basin Plan...... M - 2 Water Supply Plans....... M - 2 Land Use Plans...... M - 4 Habitat Protection Plans........
Report. Office of the General Manager. Colorado River Management Report. Summary. Detailed Report
 Report Office of the General Manager Summary Colorado River Management Report This report provides a summary of the activities related to the Colorado River during April and a response to a request from