A Q U E D U C T O P E R A T I N G P L A N. JULY 1, 2015 to JUNE 30, Volume 10
|
|
|
- Ann Williams
- 6 years ago
- Views:
Transcription


1 A Q U E D U C T O P E R A T I N G P L A N JULY 1, 2015 to JUNE 30, 2016 Volume 10
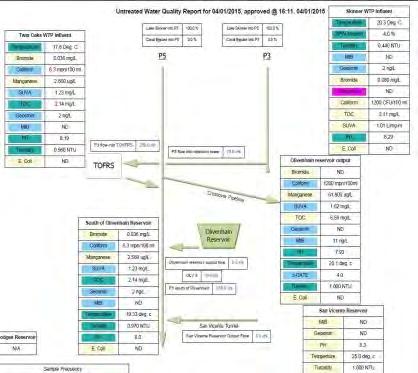
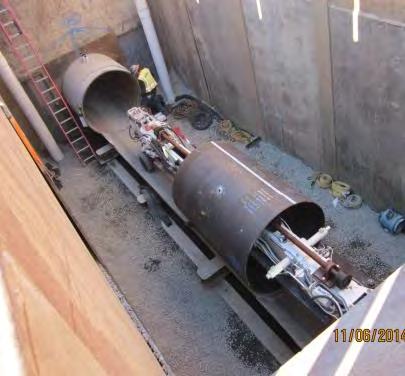
2 On the Cover North County Distribution Pipeline - Remote Operated Vehicle Inspection Carlsbad Desalination Construction (March 2015) Pipeline 4 - Disinfection Pipeline 4 - Ultrasonic Pipe Thickness Testing San Vicente Reservoir Marina Construction (April 2015) Untreated Water Quality Report: Online Operations Portal San Diego 11 FCF 36-in Cone Valve Installation Pipeline 3 Reline - Installation of Steel Liners
3 TABLE OF CONTENTS Executive Summary... 1 Water Supply/Conveyance... 3 Untreated Water Distribution Priorities... 5 Water Authority Aqueduct Shutdowns... 7 Member Agency Shutdowns Water Authority Aqueduct Energy Production/Consumption Reservoirs and Storage Opportunities Asset Management and Major Maintenance Activities FIGURES Figure 1 - FY 2016 Projected Treated Water System Utilization... 3 Figure 2 - FY 2016 Projected Untreated Water System Utilization... 3 Figure 3 - FY 2015 AOP Treated Water Demand vs. Actual Deliveries... 4 Figure 4 - FY 2015 AOP Untreated Water Demand vs. Actual Deliveries... 4 Figure 5 - Untreated Water Delivery Priorities... 5 Figure 6 - Water Authority FY 2016 Pipeline Shutdowns and Outages... 8 Figure 7 - Scheduled Member Agency Maintenance Coordination Figure 8 - Rancho Hydro Revenues vs. Projections FY Figure 9 - Annual revenue generated at Lake Hodges Pump Storage Facility Figure 10 - Location and Relative Capacities of San Diego County Reservoirs Figure 11- Regional Reservoir Levels (% of Capacity) as of May 1, Figure 12 San Diego 11 Meter and Control Valve Replacement TABLES Table 1 - Rancho Hydro Revenues vs. Projections FY Table 2 - Storage/Capacity in Member Agency and Water Authority Reservoirs (AF)... 20
4 THIS PAGE INTENTIONALLY LEFT BLANK
5 Executive Summary The annual Aqueduct Operating Plan (AOP) reflects on-going efforts to optimize the delivery, treatment, and storage of water in the San Diego region through coordination between member agency Operating Heads, Water Authority Staff, and the Metropolitan Water District of Southern California (MWD). Staff has updated the Aqueduct Operating Plan for fiscal year 2016 (FY 2016) to reflect anticipated operational opportunities and constraints, and to evaluate our performance for fiscal year 2015 (FY 2015). The AOP includes the Water Authority s anticipated pump station operating schedules and water treatment plant outages. The AOP was developed based on information received from member agencies, historical delivery/production data, capacity constraints within the Water Authority s aqueduct system, and scheduled shutdowns. Highlights for fiscal year 2016 include: Anticipated allocation amounts have been considered in developing the fiscal year 2016 AOP System capacity will not be an issue in meeting the region s anticipated treated and untreated water requests. Treated water system utilization is anticipated to be between 13 and 21 percent of treated aqueduct capacity for the high demand months of June through October. Untreated water system utilization is anticipated to be between 59 and 72 percent of untreated aqueduct capacity for the high demand months of June through October. There will be 4 treated water shutdowns and 2 treated water outages*. There will be 3 untreated water shutdowns and 2 untreated water outages*. *Shutdowns affect large portions of the system and affect deliveries to a significant number of metered connections; outages are more localized and have considerably smaller impact on aqueduct deliveries
6 THIS PAGE INTENTIONALLY LEFT BLANK - 2 -
7 Water Supply/Conveyance Based on the projected allocation levels and the anticipated Carlsbad Desalination Plant startup, it is expected that demand for both treated and untreated water for FY 2016 will not exceed system capacity and overall will be lower than the historically high demand year of FY 2004 (see Figure 1 and Figure 2). These projections indicate that treated water deliveries for the high demand months of June through October 2015 should result in flows ranging from 13 percent to 21 percent of the 650 cfs treated water pipeline capacity (Figure 1). Likewise, untreated deliveries for the high demand months of June through October 2015 should result in flows between 59 percent and 72 percent of the 780 cfs untreated pipeline capacity (Figure 2). 650 Historical High Demand (FY2004) 100% Average Monthly Flow (cfs) Jul Aug Sep Oct Nov Dec Jan Feb Mar Apr May Jun 90% 80% 70% 60% 50% 40% 30% 20% 10% 0% Percent Treated Water System Capacity Figure 1 - FY 2016 Projected Treated Water System Utilization Average Monthly Flows (cfs) Historical High Demand (FY2004) Jul Aug Sep Oct Nov Dec Jan Feb Mar Apr May Jun 100% 90% 80% 70% 60% 50% 40% 30% 20% 10% 0% Percent Untreated Water System Capacity Figure 2 - FY 2016 Projected Untreated Water System Utilization - 3 -
; however due to the lack available local supplies untreated water volumes are beginning to")
8 FY 2015 Water Authority demands for treated water have generally followed projected trends; however due to drier than expected weather conditions untreated deliveries were above projected demands. Treated water volumes were generally at or below the historically high demand year of FY 2004 (see Figure 3); however due to the lack available local supplies untreated water volumes are beginning to exceed the high demand year of FY 2004 during the summer months (see Figure 4). Average Monthly Flow (cfs) FY 2015 AOP Projections Historical High Demand (FY2004) Jul Aug Sep Oct Nov Dec Jan Feb Mar Apr May Jun 100% 90% 80% 70% 60% 50% 40% 30% 20% 10% 0% Percent Treated Water System Capacity Figure 3 - FY 2015 AOP Treated Water Demand vs. Actual Deliveries 780 Storage (Fill) FY 2015 AOP Projections Historical High Demand (FY2004) 100% Average Monthly Flow (cfs) Jul Aug Sep Oct Nov Dec Jan Feb Mar Apr May Jun 90% 80% 70% 60% 50% 40% 30% 20% 10% 0% Percent Untreated Water System Capacity Figure 4 - FY 2015 AOP Untreated Water Demand vs. Actual Deliveries - 4 -

9 Untreated Water Distribution Priorities Through a series of discussions with member agency staff, key untreated operating concerns were identified and used to develop untreated water delivery priorities. These priorities are intended to provide a framework for Water Authority operators to deal with potential conflicts during untreated water high demand periods. The Board adopted interim untreated water delivery priorities at the September 8, 2005 Board meeting. This plan complies with the interim untreated water distribution priorities and is shown in Figure 5. Figure 5 - Untreated Water Delivery Priorities - 5 -
10 THIS PAGE INTENTIONALLY LEFT BLANK - 6 -
11 Water Authority Aqueduct Shutdowns The Water Authority conducts scheduled shutdowns of sections of pipeline for internal inspection, maintenance, and Capital Improvement Project (CIP) connections on an annual basis. These pipeline shutdowns are coordinated with MWD, member agencies, and all Water Authority Departments. The schedule includes three years of shutdowns to allow for the proper planning of maintenance and CIP activities for both the Water Authority and its member agencies. This three-year schedule is updated each January to facilitate the compilation of the Annual Aqueduct Operating Plan. At that time, the next fiscal year s (July to June) Aqueduct shutdown schedules are made available to member agency personnel for review and comment, prior to inclusion in the AOP. For FY 2016, there are 4 treated water shutdowns, 3 untreated water shutdowns, 2 treated water outages, and 2 untreated water outages scheduled between October 2015 and June While the O&M Department will be involved in additional maintenance activities that will maximize the benefits of the shutdowns planned for FY 2016, the primary reasons for these shutdowns are to support activities related to either asset management or warranty inspections. As noted in the Executive Summary, the difference between shutdowns and outages are a matter of scale, shutdowns affect large portions of the system and affect deliveries to a significant number of metered connections, while outages are more localized and have considerably smaller impact on aqueduct deliveries. A timeline and brief description of the shutdowns and outages are shown in Figure 6. Based on the current construction schedule, the Carlsbad Desalination Plant and Conveyance Pipeline are projected to begin commissioning in summer/fall The facility commissioning will be conducted over a 3-4 month period and is expected to have minimal impact on the aqueduct system and our member agencies

12 Figure 6 - Water Authority FY 2016 Pipeline Shutdowns and Outages - 8 -
13 Description Shutdowns Affects on MWD Member Agency Connections Affected November 1, 2015 through November 10, Untreated Water Rancho Peñasquitos Hydro Electric Facility will be isolated for an internal inspection. A warranty inspection of the San Vicente Pipeline from West Shaft to Central Shaft. 1st Aqueduct will be shutdown to allow final tie-in to new Terminal Structure and the City of San Diego s Bypass pipeline. 1. Internal inspection of Rancho Peñasquitos Hydro Electric Facility 2. Warranty inspection of San Vicente Pipeline 3. Complete tie-in of new terminal structure on 1st Aqueduct to existing San Vicente Bypass pipeline Reduction in untreated flow demands from MWD The following connections will be out of service and unavailable during this shutdown SDSF4, SDSF5, SD5A-B-C, SD12, NCSB3, NCSB1, SD7, SD20, SD6A-B, HLX1, HLX6, HLX7, HLX8, SD9, POW3, RAM1, POW1, POW4, 1, SD2, and SD Weir. Description Shutdowns Affects on MWD Member Agency Connections Affected December 6, 2015 through December 19, Treated Water Ramona Pipeline will be isolated from Pipeline 3 and Pipeline 4 at the takeoff structures and the Ramona Pipeline inline valve to allow for installation of a new pump well and bonding cables for cathodic protection on unwelded joints. 1. Installation of new pump well and bonding cables at pipe joints previously unwelded to ensure continuity of the Ramona Pipeline for cathodic protection purposes. None, potential reduction in SDCWA system demand up to 104cfs The following connections will be affected by this shutdown: Ramona Pipeline OLIV5, SD14, SD15, RAM
14 Description Shutdowns Affects on MWD Member Agency Connections Affected February 28, 2016 through April 3, Treated Water 31 day treated water shutdown on Pipeline 3 from Diversion to Terminus. Pipeline 4 shutdown from Point of Delivery to Diversion for first 10 days. This shutdown will have 3 phases with different impacts for each phase. During Phase 1, all treated water flow from MWD, Carlsbad and Twin Oaks will be terminated from point of delivery to terminus. During Phase 2, Pipeline 4 will be placed back in service and service to all flow control facilities will be restored. Carlsbad Desal and Twin Oaks TP will be back in normal operation. Phase 3 will be to remove isolation on Pipeline 3 and will not impact Member Agencies. 2. Internal condition assessment of 14 miles of Pipeline 3 (Diversion to Paint Mtn) 3. Replacement of CR1 Flow Control Facility 4. San Marcos Vent Modification warranty inspection Pipeline 4 out of service, capacity of 450 cfs unavailable from February 28, 2016 to March 8, No impact for the duration of the shutdown. The following connections will be affected by Phase 1: DLZ1, RB9, FB6, RB8, RB7, FB4, RB6, VC8, RB3, VC7, NCDP1, RB11, VAL10, Twin Oaks TP, VID3, CR1, VAL9, VAL7, OLIV 1, OLIV3, SDSF3, OLIV2, SD10, Miramar Pump P1, SD11, PD4, SD18, SD21, HLX5, SD19, OTAY11, OTAY10, OTAY12, OTAY13, OTAY13SR, Tri Agency Pipeline VID8, VID 9, VID 10, CR3, CR4, OCS4; Ramona Pipeline OLIV5, SD14, SD15, RAM 3. Carlsbad Desal and Twin Oaks TP will be offline during Phase 1 of shutdown. During Phase 2, service to all flow control facilities will be restored and Carlsbad Desal and Twin Oaks TP will be back in normal operation. Phase 3 will be to remove isolation on Pipeline 3 and will not impact Member Agencies. Description Outage Affects on MWD Member Agency Connections Affected October 1, 2015 through May 1, 2016 Treated Water 7 month outage for Miramar Pump Station Rehabilitation project 1. Miramar Pump Station will be isolated at Pipeline 4BI takeoff to allow for facility to be rehabilitated None The following connections will be affected: Miramar P1 pump, P3 pump, C22 pump, and P2 gravity flow connection
15 Description Outage Affects on MWD Member Agency Connections Affected November 2 through November 11, 2015 Untreated Water A 10-day outage of Lake Hodges Hydroelectric Facility for annual maintenance 2. Lake Hodges Hydroelectric Facility Annual Maintenance None None Description Outage Affects on MWD Member Agency Connections Affected February 28 through March 3, 2016 Treated Water A 5-day outage of Carlsbad Desalination Plant for semi-annual maintenance 3. Carlsbad Desalination Plant Semi-Annual Maintenance None The following connection will be affected by this shutdown: Desalination Conveyance Pipeline VAL9 will not be able to receive desalinated water during shutdown; however imported treated will be available if required. Description Outage Affects on MWD Member Agency Connections Affected March 7 through March 16, 2016 Untreated Water A 10-day outage of Lake Hodges Hydroelectric Facility for semi-annual maintenance 4. Lake Hodges Hydroelectric Facility Semi-Annual Maintenance None None
16 THIS PAGE INTENTIONALLY LEFT BLANK
17 Member Agency Shutdowns In order to optimize the delivery, treatment, and storage of water in San Diego County, a request was sent to the Member Agency Operating Heads to obtain schedules for member agency treatment plant expansions, CIP tie-ins, scheduled treatment plant maintenance, and shutdowns. The goal of this request is to facilitate the production of one schedule that the member agencies can use to schedule their work at times that will have the least impact on the region. Responses from member agencies confirmed upcoming maintenance activities including those shown in Figure 7. A number of other maintenance projects were also identified, but they either lacked firm schedules or did not have a significant operational impact to the region. These types of projects, as well as Treatment Plant Shutdown coordination, will be carried throughout the year as standing discussion items at the regularly scheduled Operating Head meetings. Figure 7 - Scheduled Member Agency Maintenance Coordination
18 THIS PAGE INTENTIONALLY LEFT BLANK
19 Water Authority Aqueduct Energy Production/Consumption The Water Authority will have two power generation facilities operating during FY The Water Authority will continue operation of the Rancho Peñasquitos Hydroelectric Facility, with the Lake Hodges Pumped Storage Facility (LHH) operations contracted out to ProTrans USA. The Water Authority will be operating six pump stations and CH2M Hill/OMI will be operating the Twin Oaks Valley Water Treatment Plant in FY Following is a list of those facilities along with their anticipated operation schedules and costs: Rancho Peñasquitos Pressure Control and Hydroelectric Facility o Projected months of operation: July 2015 to June 2016 o Power generating capacity: 4.5 megawatts. o Estimated Power: 16,800 megawatt (MW) hours o Estimated Revenue: $700,000 o Projected power consumption cost per month: $1,680 o Total operational power consumption cost per year: $20,174 Lake Hodges Pumped Storage Facility o Projected months of operation: As dispatched o Power generating capacity: 20 megawatts (single turbine operation), 40 megawatts (two turbine operation) o Estimated Power: On call, based on SDG&E demands o Estimated Revenue (for availability): $2,800,000 o Projected auxiliary power consumption cost per month: $17,744 o Projected pump cost per year: $0 o Total operational power consumption cost per year: $212,932 Olivenhain Pump Station o Projected months of operation: None (only planned to be operated for quarterly maintenance) o Pumps (three available): One pump operation o Projected base facility operational power cost per month: $4,383 o Projected pump test cost for FY 2016: $0 (runs on generators only) o Total operational power consumption cost per year: $52,590 Escondido Pump Station o Projected months of operation: None (only planned to be operated if aqueduct flows are too high) o Pumps: Two pump operation o Projected base facility operational power cost per month: $760 o Projected pump cost per month: $0 o Projected pump cost for the year: $0 o Total operational power consumption cost per year: $9,
20 Pipeline 2A Pump Station o Projected months of operation: October 2015 to June 2016 o Pumps: Three pump operation o Projected base facility operational cost per month: $760 o Projected pump cost per month: $43,900 o Projected pump cost for the year: $395,100 o Total operational power consumption cost per year: $404,220 Miramar Pump Station (paid by the City of San Diego) o Projected months of operation: July 2015 through June 2016 o Pumps: One pump operation o Projected base facility operational cost per month: $0 o Projected Water Authority pump cost per month: $0 o Projected Water Authority pump cost for the year: $0 o Total operational power consumption cost per year : $0 San Vicente Pump Station o Projected months of operation: (only planned to be operated for quarterly maintenance) o Pumps(three available): Two pump operation o Projected base facility operational cost per month: $3,590 o Projected quarterly pump test cost for FY 2016: $7,820 o Total operational cost per year: $50,907 o Total operational power consumption cost per year: $58,727 Twin Oaks Valley Pump Station o Projected months of operation: None (only operated for monthly maintenance) o Projected base facility operational cost per month: $0 (included in Twin Oaks Valley Treatment Plant costs) o Projected pump test cost for FY 2016: $0 (runs on generators only) o Projected pump cost for the year: $0 o Total operational power consumption cost per year: $0 Twin Oaks Valley Water Treatment Plant o Projected months of operation: July 2015 to June 2016 o Projected operational cost per month (average): $84,230 o Total power consumption cost per year: $1,010,763 The total power cost to operate the LHH, Rancho Hydro facility, the six pump stations, and Twin Oaks Valley WTP are estimated to be $1,768,500 for FY The FY 2016 revenue for all Water Authority hydroelectricity generation is estimated to be $3,500,
21 As of the end of April, the Water Authority is projecting a $230,000 shortfall at the Rancho Hydro Facility from the FY 2015 forecast due to unplanned maintenance requirements and low flows (see Figure 8 and Table 1). $1,200,000 Cumulative Annual Revenue $1,000,000 $800,000 Forecast Actual Revenue 2015 Goal $900,000 $600,000 $400,000 $533,468 $200,000 $- Jul Aug Sep Oct Nov Dec Jan Feb Mar Apr May Jun Figure 8 - Rancho Hydro Revenues vs. Projections FY 2015 Table 1 - Rancho Hydro Revenues vs. Projections FY 2015 Month Monthly Goal Revenue Monthly Revenue YTD Revenue Goal % Comments July $128,664 $122,859 $122, % Actuator Communication Errors Aug $134,034 $107,930 $230, % Low Flows Sept $123,294 $31,940 $262, % Forced Outage (Actuator Communication Errors) Oct $85,704 $62,201 $324, % Cooling Water Modification, Inspection Nov $48,114 $116,186 $441, % High Flows Dec $42,744 $ 0 $441, % Actuator Repairs, Low Flows Jan $37,374 $ 0 $441, % Low Flows Feb $0 $0 $441, % 2/5/15 3/30/15 Planned Pipeline 5 Shutdown Mar $0 $460 $441, % 2/5/15 3/30/15 Planned Pipeline 5 Shutdown April $85,704 $91,893 $533, % Estimated Revenue May $96,444 June $117,
22 The Lake Hodges Pump Storage Facility has been operating well and has exceeded its revenue goal of $2,600,000 in April 2015 (Figure 9). FY 2015 revenues are projected to be approximately $3,000,000 for the year. Lake Hodges Pumped Storage Annual Revenue Monthly Goal Cumulative Revenue + UIE + Adjustments FY15 Goal % Available $3,000, % 100.0% $2,608,613 $2,500, % $2,600,000 $2,000, % $1,500,000 $1,000, % $500, % $- Jul Aug Sep Oct Nov Dec Jan Feb Mar Apr May Jun 0.0% Figure 9 - Annual revenue generated at Lake Hodges Pump Storage Facility. Solar Generation In October of 2010, a Solar Power and Services Agreement was signed between the Water Authority and Borrego Solar Systems Incorporated (Borrego) which allowed Borrego to install solar systems at the Kearny Mesa Headquarters, Escondido Operations Center, and the Twin Oaks Valley Water Treatment Plant. The Water Authority purchases the power generated at these sites at rates lower than the projected utility rate. The systems are owned, financed, and maintained by Borrego so that there are no expenses to the Water Authority other than the staff time required to monitor the agreements. As SDGE rates have increased, the savings from solar have increased dramatically as the solar rate remains relatively stable. Following is a list of the three solar facilities along with their anticipated operation schedules, and estimated savings to the Water Authority based on Borrego s contract: Escondido Operations Center o Projected Months of Operation: July 2015 to June 2016 o Estimated Generation: 256,500 kwh o Estimated Savings: $17,470 Twin Oaks Valley Water Treatment Plant o Projected Months of Operation: July 2015 to June 2016 o Estimated Generation: 1,995,000 kwh o Estimated Savings: $207,000 Kearny Mesa Headquarters o Projected Months of Operation: July 2015 to June 2016 o Estimated Generation: 587,600 kwh o Estimated Savings: $40,

23 Reservoirs and Storage Opportunities Member agency and Water Authority reservoirs serve multiple functions including: surface water capture, seasonal shift water storage, carryover storage, and local sources of emergency water supplies. Member agency and Water Authority reservoirs function as system capacity buffers during peak demand periods and offer a level of security for short and long-term emergency situations. The size and location of each reservoir affects the extent to which it can perform the various functions, as does the individual agencies operational plan (see Figure 10, Figure 11, and Table 2). Figure 10 - Location and Relative Capacities of San Diego County Reservoirs
24 Table 2 - Storage/Capacity in Member Agency and Water Authority Reservoirs (AF) Storage as of May 4, 2015 Reservoir 1 Total Usable Dead (unusable) Member Agency Water Authority Carryover ESP Operational Total Henshaw 51,774 51, ,249 5,249 Wohlford 6,506 6, ,934 1,934 Dixon 2,606 2, ,265 2,265 Sutherland 29,508 29, ,975 1,975 Hodges 30,632 28,422 1,829 3,145 8,475 11,620 San Dieguito San Vicente 249,358 90,041 5,228 48,839 35,195 84,034 El Capitan 112, ,992 2,815 32,064 32,064 Murray 4,684 4, ,067 4,067 Cuyamaca 8,195 8, Jennings 9,790 9,790 9,013 9,013 Loveland 25,400 25, ,624 7,624 Sweetwater 28,079 27, ,550 3,550 Morena 50,694 50, ,624 1,624 Barrett 34,806 34, ,958 1,958 Lower Otay 49,849 46,026 3,823 37,015 42,799 Miramar 6,682 5, ,465 5,465 Poway 3,330 2, ,072 3,072 Ramona 12,000 11, ,353 2,353 Turner 1,612 1, ,125 1,125 Olivenhain 24,789 24, ,000 3,328 21,328 Notes: 1. Capacity information: JMM Consulting Engineers, Inc. (1990), San Diego County Water Authority Optimal Storage Study: Reservoir Summary Report, unless updated by Member Agency staff. 2. Maximum reservoir elevation is limited to Elev. 650 (90,041 AF) until DSOD certification and completion of San Vicente By-Pass Pipeline Project. In addition to meeting local storage and operational demands, Olivenhain, San Vicente, and Hodges reservoirs play a significant role in the Water Authority s Emergency Storage Program (ESP), in response to regional emergency situations related to water supply availability. The San Vicente Reservoir will also be utilized as a regional carryover storage facility
25 100 Dead WA ESP Member Agency WA Carryover WA Operational Lake Henshaw Lake Wohlford Dixon Lake Sutherland Reservoir Lake Hodges San Dieguito Reservoir Percent Capacity San Vicente Reservoir El Capitan Reservoir Lake Murray Cuyamaca Lake Lake Jennings Loveland Reservoir Sweetwater Reservoir Morena Lake Barrett Lake Lower Otay Lake Miramar Lake Poway Lake Lake Ramona Turner Reservoir Olivenhain Reservoir Figure 11- Regional Reservoir Levels (% of Capacity) as of May 1, 2015 (This Figure represents the Water Authority Carryover Storage and Regional ESP Storage) Note: San Vicente Reservoir s total storage capacity prior to the dam raise was 90,200 AF. Following the completion of the dam the total storage capacity will be 249,358 AF. Maximum reservoir elevation is limited to Elev. 650 until DSOD certification and completion of San Vicente By-Pass Pipeline Project
26 THIS PAGE INTENTIONALLY LEFT BLANK
 that ensures optimal performance of Water Authority assets throughout their life cycles.")
27 Asset Management and Major Maintenance Activities In addition to ongoing corrective maintenance (CM) that is undertaken in response to specific needs or events, the O&M Department is also engaged in a rigorous program of preventative maintenance (PM) that ensures optimal performance of Water Authority assets throughout their life cycles. These PM activities can include inspection, rehabilitation/upkeep, and/or lubrication of assets where appropriate. In addition to routine CM and PM work, the O&M Department undertakes additional Asset Management projects and major projects that fall outside the scope of routine maintenance. Some of the activities undertaken during FY2015 included: Installation of a new valve actuator at Oceanside 6 flow control facility Installation of new control valve and venturi meter at San Diego 11 flow control facility Demolition of Otay 9 flow control facility. This facility was no longer in service and was not needed by our Member Agency Cathodic protection repair of North County Distribution Pipeline Facilities Pipeline 5EII cathodic protection improvements at San Dieguito Creek Painting of San Diego 11 Flow Control Facility and Turnout Rancho Peñasquitos Hydroelectric Facility electric actuator replacements Pipeline 3 Comprehensive Condition Assessment (MFL) from Point of Delivery to Twin Oaks Diversion Structure Remote Operated Vehicle (ROV) and visual inspection of the North County Distribution Pipeline Leak Detection survey of the Tri-Agencies Pipeline (Smart Ball) Figure 12 San Diego 11 Meter and Control Valve Replacement
28 The Asset Management and major maintenance activities planned by the O&M Department for FY 2016 include: Pipeline 3 Comprehensive Condition Assessment San Marcos to Rancho Peñasquitos Ramona Pipeline Cathodic Protection Project Flow control facility electric actuator replacements (30 locations) Painting of Poway 2 Turnout, Ramona Pipeline P3 and P4 Turnouts, VID 3 Flow Control Facility, and Tri-Agency Pipeline P3 and P4 Turnouts Access road improvements at Otay 12FCF and along the Crossover Pipeline Conversion of 37 facilities to an encrypted 3G/4G wireless technology for communication to the SCADA system Condition assessment of turbines, generators, pumps and motors at Olivenhain Pump Station, San Vicente Pump Station and Rancho Peñasquitos Hydroelectric Facility
Los Angeles 3 rd Regional
 Los Angeles 3 rd Regional Investors Conference Los Angeles, California March 31, 2016 Metropolitan Water District of Southern California 1 Metropolitan Water District of of Southern California 2 Metropolitan
4.16 WATER SUPPLY EXISTING CONDITIONS WATER SUPPLY AGENCIES. Metropolitan Water District Water Supply
 4.16 WATER SUPPLY This section evaluates the water supply impacts of the proposed Plan. The information presented was compiled from multiple sources, including the San Diego County Water Authority (SDCWA),
EMERGENCY STORAGE PROJECT
 EMERGENCY STORAGE PROJECT San Vicente Pumping Station/Surge Control Facility Carryover Storage and San Vicente Dam Raise EIR/EIS San Vicente Dam Raise Briefing Summary DATE: Oct. 18, 2006 ORGANIZATION:
3.0 Relationship to Other Conservation Plans
 3.0 Relationship to Other Conservation Plans 3.1 Water Authority NCCP/HCP The Water Authority began to prepare this Plan in 1995, at a time when other jurisdictions and regional utilities in southern California
The Confluence Model. Presentation to Modeling and Forecasting Working Group January 21, 2015
 The Confluence Model Presentation to Modeling and Forecasting Working Group January 21, 2015 Introductions Presenter: Gary Fiske Working Group Water Department staff Objective: Penetrate the Black Box
Water Supply Board Briefing. Water Operations Department March 22, 2016
 Water Supply Board Briefing Water Operations Department March 22, 2016 Water Supply Briefing California Water Supply District Water Supply Water Supply Projections Water Supply Schedule 2 California Water
CAP Excess Water Task Force
 Agenda Number 2. CAP Excess Water Task Force Patrick Dent PE CAP Water Control Manager September 6, 2017 Introduction Excess Water is defined as all Project Water that is in excess of the amounts used,
ROUTINE MAINTENANCE EMERGENCY SERVICES EQUIPMENT REPAIR
 critical facilities preventative maintenance ROUTINE MAINTENANCE EMERGENCY SERVICES EQUIPMENT REPAIR a l p h a t e c h n o l o g i e s s e r v i c e s, i n c. m e m b e r o f t h e a l p h a g r o u p
PI as a Utility- Scale PV Monitoring Platform
 PI as a Utility- Scale PV Monitoring Platform Presented by Steve Hanawalt, President Outline State of the Market Issues and Challenges Potential Solutions Benefits Summary and Q&A 2 Outline State of the
Committee on Water. Desalination as a Water Source
 Committee on Water Committee on Water Desalination as a Water Source Water Supply Reliability for San Diego County NARUC Summer Policy Summit July 17, 2017 Bob Yamada Director of Water Resources San Diego
Administration Division Public Works Department Anchorage: Performance. Value. Results.
 Administration Division Anchorage: Performance. Value. Results. Mission Provide administrative, budgetary, fiscal, and personnel support to ensure departmental compliance with Municipal policies and procedures,
San Diego County Water Authority Final 2015 Urban Water Management Plan
 San Diego County Water Authority Final 2015 Urban Water Management Plan Prepared by: SAN DIEGO COUNTY WATER AUTHORITY Water Resources Department 4677 Overland Avenue San Diego, CA 92123 June 2016 Final
Montecito Water District Drought and Quarterly Water Supply Update
 Montecito Water District Drought and Quarterly Water Supply Update October 2017 December 2017 Board Meeting February 20, 2018 Page 1 Outline 1. Drought Status 2. Total Production & Customer Demands 3.
Schedule 2 TECHNICAL INFORMATION
 Schedule 2 TECHNICAL INFORMATION This document is intended to provide context to the Haida Gwaii Request for Expressions of Interest (RFEOI) for the potential electricity supply opportunity for clean electricity
Capital Investment Plan Quarterly Report for period ending September 2017
 Report Engineering Services Group Capital Investment Plan Quarterly Report for period ending September 2017 Summary This report provides a summary of accomplishments to date on the Capital Investment Plan
Electric Forward Market Report
 Mar-01 Mar-02 Jun-02 Sep-02 Dec-02 Mar-03 Jun-03 Sep-03 Dec-03 Mar-04 Jun-04 Sep-04 Dec-04 Mar-05 May-05 Aug-05 Nov-05 Feb-06 Jun-06 Sep-06 Dec-06 Mar-07 Jun-07 Sep-07 Dec-07 Apr-08 Jun-08 Sep-08 Dec-08
TABLE OF CONTENTS 4.17 UTILITIES AND SERVICE SYSTEMS...
 TABLE OF CONTENTS 4.17 UTILITIES AND SERVICE SYSTEMS... 4.17-1 4.17.0 Introduction... 4.17-1 4.17.1 Methodology... 4.17-2 4.17.2 Existing Conditions... 4.17-2 4.17.3 Impacts... 4.17-4 4.17.4 Applicant-Proposed
PJM Roadmap for edart
 PJM Roadmap for edart As of March 15, 2017 Background edart (electronic Dispatcher Application and Reporting Tool) is suite of electronic applications used to facilitate dispatcher-todispatcher communications,
For Bandon Utilities Commission
 For Bandon Utilities Commission July 12, 2017 Profile BPA, a component of the U.S. Department of Energy, is a non-profit and self-funded power marketing administration in the Pacific Northwest. Congress
TABLE OF CONTENTS LIST OF FIGURES LIST OF ATTACHMENTS
 TABLE OF CONTENTS 2.0 TRANSMISSION SYSTEM OVERVIEW... 2-1 2.1 PROPOSED PROJECT OBJECTIVES... 2-2 2.2 SAFETY, RELIABILITY AND RESILIENCY, AND OPERATIONAL FLEXIBILITY AND CAPACITY... 2-5 2.2.0 Pipeline Safety...
Annual Report. December 2010 November Bradley Cole 2/7/2012
 Annual Report December 2010 November 2011 Bradley Cole 2/7/2012 CH2M HILL annual report to the Board of Directors of the Pine-Strawberry Water Improvement District. This annual report provides an overview
Hoover Dam Hydropower and River Operations Electric Market Forecasting Conference. Mark Cook, PE Manager, Hoover Dam
 Hoover Dam Hydropower and River Operations Electric Market Forecasting Conference Mark Cook, PE Manager, Hoover Dam Hoover Dam Type of Operation Impacts of Drought Mitigating Drought Impacts through Major
IRP 101. Intro to Integrated Resource Planning. Scott Benson Manager, Resource & Transmission Planning. March 23, 2017
 IRP 101 Intro to Integrated Resource Planning Scott Benson Manager, Resource & Transmission Planning March 23, 2017 1 What is an IRP? Definition Integrated resource planning is a process by which a power
United Water Conservation District November 2016 Hydrologic Conditions Report 2017 Water Year. December 6, 2016
 United Water Conservation District November 216 Hydrologic Conditions Report 217 Water Year December 6, 216 Page Intentionally Left Blank PRECIPITATION (INCHES) PRECIPITATION (INCHES) PRECIPITATION (INCHES)
URBAN WATER Management Plan
 2010 URBAN WATER Management Plan Prepared by San Diego County Water Authority Water Resources Department >> 2010 Urban Water Management Plan Prepared by: San Diego County Water Authority Water Resources
The Impacts of Climate Change on Portland s Water Supply
 The Impacts of Climate Change on Portland s Water Supply Richard Palmer and Margaret Hahn University of Washington Department of Civil and Environmental Engineering Joe Dvorak, Dennis Kessler, Azad Mohammadi
Wind Workshop. Technical Characterization: Dependable Capacity & Firm Energy 10:00-10:30am
 Wind Workshop Technical Characterization: Dependable Capacity & Firm Energy 10:00-10:30am Objective of this session: Understand BC Hydro s definitions and calculation methodology of dependable capacity
City of San Diego Pure Water Project October 2014
 City of San Diego Pure Water Project October 2014 SDCTA Position: SUPPORT Rationale for Position: Substantial study has demonstrated a potable reuse project within the City of San Diego would be safe,
EMERGENCY STORAGE PROJECT San Vicente Pipeline and San Vicente Dam Raise Update Presentation Summary
 EMERGENCY STORAGE PROJECT San Vicente Pipeline and San Vicente Dam Raise Update Presentation Summary DATE: Nov. 2, 2005 EVENT: MEETING LOCATION: PRESENTER(S): STAFF RESOURCES: TIME: 7:30 p.m. Lakeside
4 PLANNING DATA AND WATER DEMAND FORECASTING
 4 PLANNING DATA AND WATER DEMAND FORECASTING This chapter discusses the planning data and water demand forecast information used to assess the current and future capabilities of the District s water system.
John H. Kerr Dam and Reservoir Virginia and North Carolina (Section 216)
") John H. Kerr Dam and Reservoir Virginia and North Carolina (Section 216) Wilmington District, Corps of Engineers Stakeholder Update Presentation January 24, 2014 Authorized under Section 216 of Public
John H. Kerr Dam and Reservoir Virginia and North Carolina (Section 216) Wilmington District, Corps of Engineers Stakeholder Update Presentation January 24, 2014 Authorized under Section 216 of Public
State Agency Energy Savings Program
 Texas Department of Criminal Justice Quarterly Report April 2016 State Agency Energy Savings Program Electricity Natural Gas Gasoline Executive Order RP-49 April 2016 TABLE OF CONTENTS SECTION TITLE PAGE
2011 ANNUAL WATER REPORT
 2011 ANNUAL WATER REPORT June 2012 Engineering and Operations Department TABLE OF CONTENTS Page 2 1.0 INTRODUCTION... 3 2.0 PARKSVILLE WATER SYSTEM... 3 3.0 DISTRIBUTION SYSTEM... 6 4.0 SCADA... 9 5.0
Pumped hydro Storage Plants
 Pumped hydro Storage Plants Olivier Teller, Product Director PSP 15 Nov 2012 PSP >130 GW (99% world electricity storage) Market: 6 GW/year Europe: ~1.5GW/year 100 years / illimited cycle numbers ~1000
Business Practice Manual for The Transmission Planning Process
 Business Practice Manual for The Transmission Planning Process Posted: June 2, 2015 Intentionally left blank TABLE OF CONTENTS 1. Introduction... 9 1.1. Purpose of California ISO Business Practice Manuals...
California ISO. Q Report on Market Issues and Performance. July 10, Prepared by: Department of Market Monitoring
 California Independent System Operator Corporation California ISO Q1 2017 Report on Market Issues and Performance July 10, 2017 Prepared by: Department of Market Monitoring TABLE OF CONTENTS Executive
Missouri River Basin Water Management
 Missouri River Basin Water Management Spring 2011 Public Meetings April 12 th 11:00 a.m. Nebraska City, NE April 12 th 7:00 p.m. Fort Peck, MT April 13 th 1:00 p.m. Bismarck, ND April 13 th 7:00 p.m. Pierre,
TURBINE VENTING FOR DISSOLVED OXYGEN IMPROVEMENTS AT BULL SHOALS, NORFORK, AND TABLE ROCK DAMS
 TURBINE VENTING FOR DISSOLVED OXYGEN IMPROVEMENTS AT BULL SHOALS, NORFORK, AND TABLE ROCK DAMS Introduction E. Dean 1, M. ASCE Bethel Herrold 2 George Robbins 3, M. ASCE James C. Carter 4 The Southwestern
BEYOND O&M. Shawn Maurer SEDAC Building Energy Specialist. Smart Energy Design Assistance Center (SEDAC), University of Illinois at Urbana Champaign
, University of Illinois at Urbana Champaign") BEYOND O&M Shawn Maurer SEDAC Building Specialist Smart Design Assistance Center (SEDAC), University of Illinois at Urbana Champaign PRESENTATION OVERVIEW and Take away: Regular costs less over the long
BEYOND O&M Shawn Maurer SEDAC Building Specialist Smart Design Assistance Center (SEDAC), University of Illinois at Urbana Champaign PRESENTATION OVERVIEW and Take away: Regular costs less over the long
a comparative study of secondary glycol and direct expansion refrigeration systems
 a comparative study of secondary glycol and direct expansion refrigeration systems Second Nature Medium-Temperature secondary systems have been widely applied in commercial refrigeration since their introduction
RE: Southern California Gas Company and San Diego Gas & Electric Monthly Pipeline Safety Enhancement Plan Status Report-November 2014
 Jeff Salazar Regulatory Business Manager Regulatory Affairs 555 West Fifth Street, GT14D6 Los Angeles, CA 90013-1011 Tel: 213.244.5916 Fax: 213.244.4957 jlsalazar@semprautilities.com December 30, 2014
Traffic Division Public Works Department Anchorage: Performance. Value. Results.
 Mission Promote safe and efficient area-wide transportation that meets the needs of the community and the Anchorage Municipal Traffic Code requirements. Direct Services Design, operate and maintain the
Spring Forecast Based Operations, Folsom Dam, California
 Spring Forecast Based Operations, Folsom Dam, California Paul E. Pugner, P.E. Chief, Water Management Section Sacramento District U.S. Army 1325 J Street, Room 1126 Sacramento, CA 95814-2922 Tel: (916)
August 22, 2014 FIRE ISLAND WIND
 August 22, 2014 FIRE ISLAND WIND Phase 1 Summary: Performance Project Performance: Benefits realized: 93,500 MWh LTD >875,000 MCF of NG burn avoided ~$6.5 MM in NG purchases avoided 55,000 tons of CO2
New Hope Crushed Stone. Monthly Update Solebury Communications Group October 2017
 New Hope Crushed Stone Monthly Update Solebury Communications Group October 2017 Tom Wolf, Governor Patrick McDonnell, Secretary October 2017 Project Status STATUS AS OF: October 31, 2017 PROJECT START
Electric Price Outlook April 13, 2017
 Electric Price Outlook April 13, 2017 Scott Drzycimski, Director Customer, Community and Economic Development Jason Nielsen, Manager Regulatory Affairs Keeping you informed Ongoing pricing outlook webinars
THAYER CREEK HYDROPOWER PROJECT ANGOON, AK
 THAYER CREEK HYDROPOWER PROJECT ANGOON, AK THE CHALLENGES OF DESIGNING AND BUILDING A NEW DAM AND HYDROPOWER FACILITY IN SOUTHEAST ALASKA DEL SHANNON, PE ANGOON, ALASKA KOOTZNOOWOO, INC. ANGOON, AK, ADMIRALTY
SR 417 Extension. June 2003 INTRODUCTION AND HISTORY PROJECT SCOPE AND PURPOSE STUDY OBJECTIVE STUDY PHASES
 Planning Feasibility Study June 2003 INTRODUCTION AND HISTORY The SR 417 Extension Study was a yearlong effort undertaken by Florida s Turnpike Enterprise to investigate the feasibility of a new toll road
Section 3 Characteristics of Credits Types of units. Economic Noneconomic Generation.
 Section 3 Operating Reserve Operating Reserve Day-ahead and real-time operating reserve credits are paid to market participants under specified conditions in order to ensure that resources are not required
Integrating Energy Efficiency and Demand Response
 Integrating Energy Efficiency and Demand Response Energy Efficiency and Active Demand Management Colleen M. Snee, Director - Integrated Demand Resources Johnson Controls, Inc. ACEEE Energy Efficiency as
ANNUAL REPORT ON MARKET ISSUES & PERFORMANCE
 ANNUAL REPORT ON MARKET ISSUES & PERFORMANCE Department of Market Monitoring ACKNOWLEDGEMENT The following members of the Department of Market Monitoring contributed to this report Eric Hildebrandt Keith
Electricity Supply. Monthly Energy Grid Output by Fuel Type (MWh)
") For the first quarter of 2015, Ontario experienced overall demand that was typical for the province in winter, and strong generator output. Demand for Ontario electricity increased as a result of cold
For the first quarter of 2015, Ontario experienced overall demand that was typical for the province in winter, and strong generator output. Demand for Ontario electricity increased as a result of cold
Subject: Partial Supplement: Advice Letter Providing Information Pursuant to Resolution G-3529
 Ronald van der Leeden Director Regulatory Affairs 555 W. Fifth Street, GT14D6 Los Angeles, CA 90013-1011 Tel: 213.244.2009 Fax: 213.244.4957 RvanderLeeden@semprautilities.com December 18, 2017 Advice No.
Key Facts: Metropolitan Responses to Statements from the San Diego County Water Authority
 Key Facts: Metropolitan Responses to Statements from the San Diego County Water Authority Top Messages The San Diego County Water Authority has ramped up its negative PR campaign against the Metropolitan
PJM Manual 21: Rules and Procedures for Determination of Generating Capability Revision: 12 Effective Date: January 1, 2017
 PJM Manual 21: Rules and Procedures for Determination of Generating Capability Revision: 12 Effective Date: January 1, 2017 Prepared by System Planning Department PJM 2017 Table of Contents Table of Contents
Using Condition Assessment to more Efficiently Manage your Pipelines
 Using Condition Assessment to more Efficiently Manage your Pipelines Traditional Management Approach Prioritize Pipelines Replace Pipelines Traditionally, prioritizations were based on age, material and
Advanced Metering Infrastructure (AMI) Pilot Studies Update
 Pilot Studies Update") Advanced Metering Infrastructure (AMI) Pilot Studies Update Finance Administration Committee November 25, 2014 Presentation Overview Water Conservation Master Plan (AMI) Strategies Review of EBMUD AMR/AMI
Advanced Metering Infrastructure (AMI) Pilot Studies Update Finance Administration Committee November 25, 2014 Presentation Overview Water Conservation Master Plan (AMI) Strategies Review of EBMUD AMR/AMI
Data Viewer, Member Voting, Account Manager, DR Hub, Power Meter, and Data Miner Roadmaps
 Data Viewer, Member Voting, Account Manager, DR Hub, Power Meter, and Data Miner Roadmaps As of March 20, 2018 www.pjm.com 2018 Roadmap Data Viewer, Voting, Account Manager, DR Hub and Power Meter, Data
San Diego Basin Study IRWM RAC Meeting
 San Diego Basin Study IRWM RAC Meeting April 4 th, 2018 Allison Danner U.S. Bureau of Reclamation adanner@usbr.gov Sarah Brower, Ph.D. City of San Diego sbrower@sandiego. gov Agenda Task 2.4 Updates Review
Presentation for the Local Government Commission and the Community Environmental Council. July 13, 2007
 Community Choice Aggregation Presentation for the Local Government Commission and the Community Environmental Council July 13, 2007 1 Community Choice Aggregation (CCA) CCA Legislation (AB117) allows cities
SURFACE WATER WITHDRAWALS & LOW FLOW PROTECTION POLICY MICHAEL COLLEGE, P.E. SUSQUEHANNA RIVER BASIN COMMISSION
 SURFACE WATER WITHDRAWALS & LOW FLOW PROTECTION POLICY MICHAEL COLLEGE, P.E. SUSQUEHANNA RIVER BASIN COMMISSION SCENARIOS Direct withdrawal from surface water (SW): PA MOU w/padep NY MOU w/nysdec MD No
Master System Shutdown Schedule- WSIP Projects Master Layout by Quarters
 Project ID Critical / No. Project Name Purpose Start Finish Additional Comments 2002 Water System Improvement Program 10-Nov-06 A 05-Oct-14 Qtr 4, 2006 10-Nov-06 A 16-Jan-09 A Master System Schedule- WSIP
Folsom Dam Water Control Manual Update
 Folsom Dam Water Control Manual Update Stakeholder Discussion October 31, 2013 Location: Tsakopoulos Library Galleria, East Room, 828 I Street, Sacramento US Army Corps of Engineers WELCOME & INTRODUCTIONS
USER RATES FOR POTABLE WATER Resolution No R Effective March 1, 2014
 Page 1 of 10 USER RATES FOR POTABLE WATER Resolution No. 2013-25R Effective March 1, 2014 CUSTOMER CLASS COST PER 1,000 GALLONS Single Family Residential Tier 1 0 to 7k gal $4.79 Tier 2 7 to 15k gal $6.18
Embedded Energy in Water Studies Study 1: Statewide and Regional Water-Energy Relationship
 Embedded Energy in Water Studies Study 1: Statewide and Regional Water-Energy Relationship Prepared by GEI Consultants/Navigant Consulting, Inc. Prepared for the California Public Utilities Commission
Domestic Self-Supply and Private Landscape Irrigation Wells
 Domestic Self-Supply and Private Landscape Irrigation Wells Richard L Marella and Darbi R Berry U.S. Geological Survey Florida Water Science Center & Stacie Greco Alachua County Environmental Protection
Effects of projected climate change on energy supply and demand in the Pacific Northwest and Washington State
 Effects of projected climate change on energy supply and demand in the Pacific Northwest and Washington State Alan F. Hamlet Se-Yeun Lee Kristian Mickelson Marketa McGuire Elsner JISAO/CSES Climate Impacts
Recycled Water Master Plan Update. Planning Committee September 13, 2016
 Recycled Water Master Plan Update Planning Committee September 13, 2016 Agenda Background Current water recycling goal Potential for potable reuse Outline of Master Plan Update Schedule 2 Background First
Schedule Guidance Document
 Schedule Guidance Document Version: 1.2 Effective Date: August 20, 2013 Contents 1. Purpose... 1 2. Applicability and Basic Requirements... 2 3. Baseline Schedule... 3 3.1. General... 3 3.2. Schedule Work
ANNUAL PLATTE RIVER SURFACE WATER FLOW SUMMARY
 ANNUAL PLATTE RIVER SURFACE WATER FLOW SUMMARY 4/3/213 Platte River Recovery Implementation Program 213 ANNUAL SURFACE WATER FLOW SUMMARY DRAFT Prepared by staff of the Platte River Recovery Implementation
Power to Gas: Hydrogen Enabled Storage & Grid Stabilization
 Power to Gas: Hydrogen Enabled Storage & Grid Stabilization Some fair questions Why would you want to do this? Does this work? What about efficiency? What about safety and embrittlement? Does this pay?
Report on Groundwater Recharge in the Orange County Groundwater Basin
 2007-2008 Report on Groundwater Recharge in the Orange County Groundwater Basin Orange County Water District P.O. Box 8300 Fountain Valley, CA 92728-8300 (714) 378-3200 (714) 378-3373 fax www.ocwd.com
Energy Efficiency in Kuwait: Past, Current & Future
 Regional Workshop on: Developing a Regional Energy Efficiency Investment Pipeline UN ESCWA 19-20 June 2014 El-Gouna, Hourghada, Egypt Energy Efficiency in Kuwait: Past, Current & Future Ali Ebraheem Hajiah,
COMPANY PROFILE 2016
 COMPANY PROFILE 2016 takasolutions upgrades buildings to reduce the energy, water and costs at no expense to the owner while sharing the savings. TARGET CLIENTS THE CONCEPT Clients and buildings that are
Low Cost Building Automation System for Small- and Medium- Sized Commercial Buildings
 Low Cost Building Automation System for Small- and Medium- Sized Commercial Buildings Srinivas Katipamula, Ph.D. Staff Scientist, Pacific Northwest National Laboratory Other TAG Members: Irfan Rehmanji
Pre-Scheduling Operations
 Style Definition: PJM_Normal Style Definition: PJM_Bulleted_Para_1 PJM Manual 10: Pre-Scheduling Operations Revision: 365 Effective Date: January 1, 2017 Prepared by Operations Support Division Generation
Efficient utilization of energy sources
 Efficient utilization of energy sources Perspectives for the reduction of fossil primary energy utilization in urban areas March 28 Using the energy content the most efficient way is using COMBINED HEAT
Kogan Creek Power. Condenser. Contents. Update For ACC User Group. Kogan Creek Power Station and its Air
 Kogan Creek Power Plant s Air Cooled Condenser Update For ACC User Group September 2011 Contents Kogan Creek Power Station and its Air Cooled Condenser Design Chemistry Issues Actions Ongoing Performance
QUARTERLY OPERATIONS REPORT 3 rd Quarter, January March 2018 WASTEWATER PERMIT COMPLIANCE. Page 1 EFFLUENT MONTHLY AVERAGE INFLUENT MONTHLY AVERAGE
 QUARTERLY OPERATIONS REPORT 3 rd Quarter, January March 2018 WASTEWATER PERMIT COMPLIANCE INFLUENT MONTHLY AVERAGE Month Flow MGD CBOD mg/l TSS mg/l July 26.7 350 320 August 29.1 370 340 September 27.3
2015 IRP/RUWMP Kickoff Workshop April 8, 2015
 2015 IRP/RUWMP Kickoff Workshop April 8, 2015 Update process and goals Draft schedule Review of 2010 IRP targets and current conditions Next steps The IRP Update is split into a two-part process Technical
Does Water Resources Management in the Snake River Basin Matter for the Lower Columbia River? Or Is the Snake River Part of Another Watershed?
 Does Water Resources Management in the Snake River Basin Matter for the Lower Columbia River? Or Is the Snake River Part of Another Watershed? John C. Tracy, Director Idaho Water Resources Research Institute
SPECIAL BOARD OF DIRECTORS MEETING. 1:00 p.m.
 4677 Overland Avenue San Diego, California 92123 SPECIAL BOARD OF DIRECTORS MEETING Board Room February 13, 2014 1:00 p.m. 1. Call to order. 2. Roll call Determination of a quorum. A. Report on proxies
Achieving a cost optimal balance between heat supply efficiency and moderation of demand
 Achieving a cost optimal balance between heat supply efficiency and moderation of demand Dr. Christian Friebe Thüga Aktiengesellschaft COGEN Europe, 25th of February 560 cities and towns, 100 companies
Amortized annual capital cost ($) + Annual Operating Cost ($) = Unit Cost ($/acre-foot) Annual beneficially used water production in acre-feet (AF)
 + Annual Operating Cost ($) = Unit Cost ($/acre-foot) Annual beneficially used water production in acre-feet (AF)") Attention: Water Planning Committee Unit Cost of New Local Water Supply Alternatives (Information) Purpose This report discusses current unit costs for new local water supply alternatives including water
Attention: Water Planning Committee Unit Cost of New Local Water Supply Alternatives (Information) Purpose This report discusses current unit costs for new local water supply alternatives including water
Rainy Season Preparation & Storm Channel Maintenance
 Rainy Season Preparation & Storm Channel Maintenance City Efforts Thorough Review of the storm water system Documentation of system conditions Now part of selection criteria or maintenance Full public
System Plan Components Inventory
 Northeast San Joaquin County Groundwater Bank System Plan Components Inventory Northeast San Joaquin County Groundwater Banking Authority April, 2002 The Northeast San Joaquin County Groundwater Banking
Date: Wednesday, October 4, Location: Western Municipal Water District Board Room Meridian Parkway, Riverside, 92518
 Date: Wednesday, October 4, 2017 Time: 6 p.m. WESTERN MUNICIPAL WATER DISTRICT NEW DATE SCHEDULED FOR PUBLIC HEARING Proposed Increases in Water Rates and Service Charges Location: Western Municipal Water
BC Hydro Generation system operation Columbia Basin Regional Advisory Committee
 BC Hydro Generation system operation Columbia Basin Regional Advisory Committee Renata Kurschner Director, Generation Resource Management 11 September 2014 Generation System Operation Coordination of provincial
FY17-FY18 Audit Plan. Office of Internal Auditing
 FY17-FY18 Audit Plan Office of Internal Auditing -Page Intentionally Blank- TABLE OF CONTENTS Executive Summary... 4 Audit Plan Details... 6 Budgeted Hours... 7 Risk Assessment... 8 Allocation of Resources...
City Council Work Session Handouts. July 21, I. Review and Discuss North Texas Municipal Water District Water Supply Plan and Projects
 City Council Work Session Handouts July 21, 2014 I. Review and Discuss North Texas Municipal Water District Water Supply Plan and Projects II. Review and Discuss the Richardson Hospital Authority Dissolution
Missouri River Basin Water Management
 Missouri River Basin Water Management Spring 2015 Public Meetings April 7 th April 7 th April 8 th April 9 th April 9 th 11:00 a.m. 6:00 p.m. 11:00 a.m. 11:00 a.m. 6:00 p.m. Pierre, SD Bismarck, ND Fort
Demand Response Programs. Donnie Clary CoServ President/CEO
 Demand Response Programs Donnie Clary CoServ President/CEO CoServ at a Glance Counties served: Collin, Cooke, Denton, Grayson, Tarrant and Wise Total meters: Electric 215,000 Gas - 108,000 Electric load:
APPENDIX F. Receiving Water Conditions, Potential Impacts of MS4 Discharges, and Priority Water Quality Conditions in the San Dieguito River WMA
 APPENDIX F Receiving Water Conditions, Impacts of MS4 Discharges, and Priority Water Quality Conditions in the San Dieguito River WMA Intentionally Left Blank Appendix F Receiving Water Conditions, Impacts
Cedar River Watershed Habitat Conservation Plan
 Cedar River Watershed Habitat Conservation Plan Briefing for the WRIA 8 Salmon Recovery Council November 21, 2013 Cyndy Holtz Seattle Public Utilities cyndy.holtz@seattle.gov What is an HCP? Habitat Conservation
Third Quarter 2017 Conference Call
 Third Quarter 2017 Conference Call October 24, 2017 Forward-Looking Statements This presentation contains forward-looking statements. Actual results may differ materially from results anticipated in the
November 28, Dear Mr. Bechtold:
 4000 Hollywood Boulevard Seventh Floor, North Tower Hollywood, Florida 33021 (954) 987-0066 Fax: (954) 987-2949 November 28, 2012 Wastewater Compliance and Enforcement Section FLORIDA DEPARTMENT OF ENVIRONMENTAL
A N N U A L R E P O R T
 S A N D I E G O C O U N T Y W A T E R A U T H O R I T Y 2004 A N N U A L R E P O R T A N N U A L R E P O R T 2 0 0 4 contents Board Officers and General Manager s Message page 2 Quantification Settlement
Surface Water Supplies
 Status Report: Salinas Valley Ground Water and SVWP UCCE Irrigation and Nutrient Management Meeting February 24, 2009 Presentation Salinas Valley Ground Water Where does ground water come from? Ground-water
Wastewater System Master Plan and SSO Initiative
 Wastewater System Master Plan and SSO Initiative Project Drivers Rapid Population Growth in Fort Worth 800000 700000 46% Increase in Population Over the Last 10-Years 702,850 600000 Population 500000 400000