Inland Empire Utilities Agency CH2M HILL
|
|
|
- Amelia Greene
- 6 years ago
- Views:
Transcription
1 TECHNICAL MEMORANDUM IEUA Wastewater Facilities Master Plan TM 5 RP-1 Future Plans PREPARED FOR: PREPARED BY: Inland Empire Utilities Agency CH2M HILL DATE: October 31, 2014 Executive Summary Background and Objectives RP 1 Overview Liquid Treatment Facilities Solids Handling Facilities Current and Future Flows and Loads Treatment Requirements Discharge Requirements Recycled Water Requirements Existing Plant Capacity and Limitations Existing Plant Operation Existing Plant Capacity Process Modeling Liquid Treatment Capacity Solids Handling Capacity RP 1 Capacity Summary Flow Equalization Alternatives Evaluation Plant Expansion Needs Facility Expansion Requirements Ultimate Facilities Site Plan Year CIP Plant Expansion Projects and Capital Cost Conclusion References WBG SCO 1
2 Executive Summary Regional Water Recycling Plant No. 1 (RP 1) has undergone many expansions since its initial construction in 1948 to serve the needs of the Cities of Ontario, Rancho Cucamonga, Upland, Fontana, Montclair, and Chino. RP 1 includes both liquid treatment and solids handling facilities, receiving and treating wastewater flows from tributary communities and Regional Water Recycling Plant No. 4 (RP 4). RP 1 also includes primary and secondary flow equalization which currently exhibit odor and lagoon maintenance challenges. This technical memorandum (TM) evaluates alternatives for improving RP 1 flow equalization, identifies RP 1 plant expansion projects within the 20 year planning period, and provides preliminary capital cost estimates for the projects. Information from this TM will be incorporated into the updated 20 year Capital Improvements Program (CIP). The current and future flows and loads for RP 1 were estimated in TM 4 Wastewater Flow and Loading Forecast. An analysis of the influent wastewater characteristics at RP 1 was conducted to establish current average and peak influent flows, concentrations, and loads at the plant, and to develop flow and load projections for the 2035 planning year and the 2060 ultimate buildout year. The influent flow and loading projections and the effluent requirements detailed in the Santa Ana Regional Water Quality Control Board (RWQCB) Order No. R were used to evaluate the existing capacities of the RP 1 liquid treatment facilities. The estimated capacities were then compared to the projected flow and loads to determine the RP 1 facilities that require expansion within the 20 year planning period, and when those facilities would need to be online. A nonmonetary evaluation of potential RP 1 flow equalization alternatives identified Alternative 3 (eliminating primary effluent equalization by adding secondary clarifiers, and converting the existing lagoons to secondary effluent equalization or recycled water storage) as being the most favorable alternative. This alternative offers a sustainable and cost effective approach that significantly eliminates plant odors from primary effluent storage and pumping, and frees up the existing lagoons for other flow management needs such as secondary effluent or recycled water storage. Three plant expansion projects were identified during the 20 year CIP: the RP 1 Primary Effluent Equalization Elimination Project, the RP 1 Liquid Treatment Expansion Project, and the RP 1 Solids Treatment Expansion Project. Together, these projects would include modifications to primary flow equalization piping and pumping systems to be able to use the lagoons for secondary effluent equalization, as well as construction of a new membrane bioreactor (MBR) facility, secondary clarifiers, and anaerobic digesters. The capital costs included in the 20 year CIP for these projects are summarized in Table 5 1. The evaluation of RP 1 identified three main conclusions: Elimination of existing primary effluent flow equalization by adding secondary clarifiers and converting the existing lagoons to secondary effluent equalization or recycled water storage is the most favorable alternative. The RP 1 liquid treatment facilities will need to be expanded during the 20 year planning period with the construction of a new MBR facility (Train D). The RP 1 solids treatment facilities will need to be expanded during the 20 year planning period with the construction of new anaerobic digesters. TABLE 5 1 RP 1 Expansion Projects Capital Cost Estimate Summary Component Description RP 1 Primary Effluent Equalization Elimination Project RP 1 Liquid Treatment Expansion Project RP 1 Solids Treatment Expansion Project Total Direct Cost a $12,366,000 $28,890,000 $9,450,000 Total Estimated Construction Cost b $20,739,000 $48,450,000 $15,848,000 Total Estimated Project Costs $26,961,000 $62,985,000 $20,602,000 2 WBG SCO
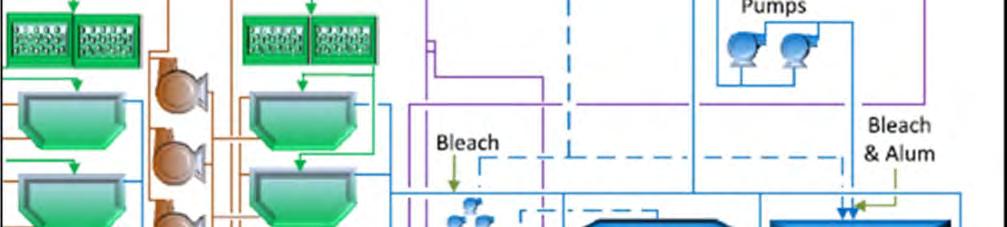
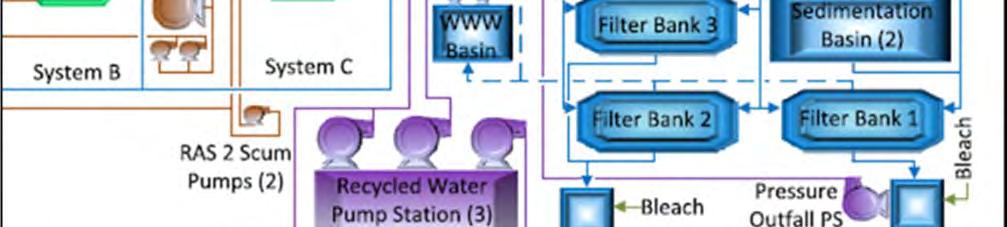
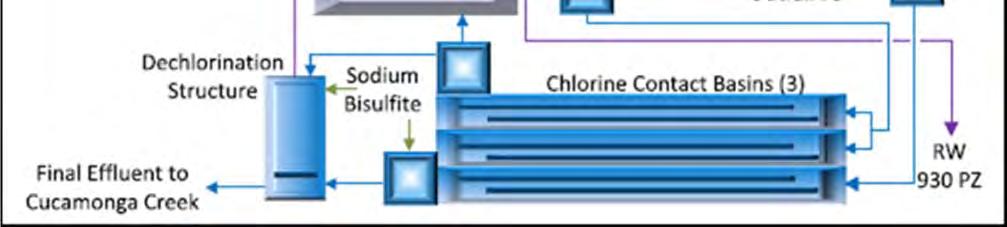
3 TABLE 5 1 RP 1 Expansion Projects Capital Cost Estimate Summary Component Description RP 1 Primary Effluent Equalization Elimination Project RP 1 Liquid Treatment Expansion Project a Engineering News Record Construction Cost Index (ENR CCI) for Los Angeles (August ,737). RP 1 Solids Treatment Expansion Project b Cost does not include escalation to midpoint of construction. The cost estimate herein is based on our perception of current conditions at the project location. This estimate reflects our professional opinion of accurate costs at this time and is subject to change as the project design matures. The Consultant Team has no control over variances in the cost of labor, materials, equipment; nor services provided by others, contractor's means and methods of executing the work or of determining prices, competitive bidding or market conditions, practices, or bidding strategies. The Consultant Team cannot and does not warrant or guarantee that proposals, bids, or actual construction costs will not vary from the costs presented as shown. 1.0 Background and Objectives The Inland Empire Utilities Agency (IEUA) contracted with CH2M HILL and Carollo Engineers (Consultant Team) to develop a Wastewater Facilities Master Plan (WFMP). The objective of the WFMP is to plan IEUA s wastewater treatment and conveyance improvements and develop a capital program. The capital program will guide IEUA in the development of major improvements to their treatment and conveyance facilities. There are five specific goals for this TM: Summarize information from TMs 1 through 4 as it pertains to RP 1. Evaluate the current capacities and limitations of the existing facilities. Evaluate three alternatives for improving RP 1 flow equalization. Determine treatment facilities required to treat projected flows and loads through planning year Estimate timing and preliminary capital costs for plant expansion projects required during the 20 year planning period. 2.0 RP-1 Overview RP 1 was originally constructed in 1948 and has undergone many expansions and improvements over the years to serve the needs of the Cities of Ontario, Rancho Cucamonga, Upland, Fontana, Montclair, and Chino. The treatment plant includes preliminary, primary, secondary, and tertiary liquid treatment facilities, and primary and secondary solids treatment facilities. The liquid facilities are designed to produce an effluent quality meeting Title 22 standards for spray irrigation, nonrestricted recreational and landscape impoundments, and groundwater recharge. The solids handling facilities are operated to achieve Class B biosolids, which are trucked to Inland Empire Regional Composting Facility (IERCF) for further treatment and composting. A schematic of the RP 1 facility process flow diagram is shown in Figure Liquid Treatment Facilities Preliminary treatment at RP 1 involves flow measurement using two Parshall flumes, screening that consists of four mechanical and two manual bar screens, and grit removal consisting of an aerated grit chamber and a vortex type grit basin. Foul air from the preliminary and primary treatment facilities is sent to a chemical scrubber or biofilter for treatment and discharge. Primary treatment consists of 10 rectangular primary clarifiers and 2 circular primary clarifiers. Ferric chloride and polymer are added upstream of the primary clarifiers to improve settling performance and reduce hydrogen sulfide and odors in digester gas in the solids handling facilities. Primary effluent flow can be equalized using two equalization basins. WBG SCO 3


4 20-IEUA-10-14F A00.AI FIGURE 5-1 REGIONAL WATER RECYCLING PLANT NO. 1 PROCESS FLOW SCHEMATIC INLAND EMPIRE UTILITIES AGENCY WASTEWATER FACILITIES MASTER PLAN
5 The secondary treatment facilities consist of three parallel, suspended growth treatment systems, each made up of two aeration basins and two circular secondary clarifiers. Two are identical, while the third has slightly larger secondary clarifiers. Aeration basins use fine bubble diffused aeration panels supplied by four centrifugal blowers. Tertiary treatment consists of filtration, coagulation, and flocculation/sedimentation of filter backwash, disinfection, and distribution of the tertiary effluent. Filtration is achieved using 26 dual media gravity filters and alum is added in line upstream. Although flocculation/clarification facilities are available upstream of filtration, the flocculation/clarification process is normally offline. Disinfection is achieved using sodium hypochlorite, and filter effluent is sent to three chlorine contact tanks. The disinfected recycled water can then be discharged directly to Cucamonga Creek or directed to the RP 1 Recycled Water Pump Station. Discharge to Cucamonga Creek or Prado Lake is dechlorinated using sodium bisulfite. Further details of the facilities are summarized in TM 1 Existing Facilities. 2.2 Solids Handling Facilities Solids from RP 1 and RP 4 are processed at the RP 1 solids handling facilities. RP 4 solids are discharged into downstream sewers and flow to RP 1; solids are removed from RP 1 primary and secondary treatment processes. RP 1 solids handling facilities consist of thickening, stabilization, and dewatering processes. There are two thickening processes in operation at RP 1: gravity thickening for primary solids, and dissolved air flotation (DAF) thickening for secondary solids. Thickened biosolids from the primary and secondary processes are stabilized in a three stage anaerobic digestion process. Digesters No. 1 and 2 can be operated as mesophilic acid digesters. Digesters No. 2 through 7 can be operated as either thermophilic or mesophilic digesters. Methane gas that is produced is sent to the cogeneration facility. Digested biosolids are then dewatered using centrifuges and sent to IERCF for composting. Foul air is diverted to a biofilter for treatment. Further details of the facilities are summarized in TM 1 Existing Facilities. 3.0 Current and Future Flows and Loads As presented in TM 4 Wastewater Flow and Loading Forecast, an analysis of the influent wastewater characteristics at RP 1 was conducted as part of this WFMP effort in order to establish current average and peak influent flows, concentrations, and loads at the plant, and to develop flow and load projections for the 2035 planning year and 2060 ultimate buildout year. The data analysis is based on 2 consecutive years of recent data provided by IEUA for influent flow and key wastewater quality constituents including biological oxygen demand (BOD), total organic carbon (TOC), total suspended solids (TSS), ammonia as nitrogen (NH3 N), and total Kjeldahl nitrogen (TKN). Flow projections were developed by the Integrated Water Resources Plan (IRP) Consultant and are based on the average influent wastewater flows measured during the flow monitoring period in November 2013 and projected through the year 2060 using population, employment, and land use information. As discussed in TM 3 Regional Trunk Sewer Alternatives Analysis, the WFMP planning effort is based on IEUA s preferred Flow Diversion Alternative 2, which includes diverting flows from Whispering Lakes and Haven Pump Stations to RP 1. The corresponding influent wastewater flow and loading projections under this alternative for the planning year 2035 form the basis of the master planning effort and treatment plant capacity evaluation presented herein. Projections are also presented for the 2060 ultimate buildout year; these projections are used for site planning considerations. Influent wastewater flows are projected to increase at RP 1 between 2020 and 2060 as a result of population growth in areas served by RP 1. A summary of the current and projected average influent wastewater flows and loads for RP 1 are presented in Tables 5 2 and 5 3, respectively. WBG SCO 5
6 TABLE 5 2 RP 1 Current and Projected Average Influent Wastewater Flows Current 2035 a 2060 a,b Average Influent Flow (mgd) c a Projections developed by IRP Consultant and IEUA based on November 2013 flow monitoring period. Reflects projected flows for IEUA preferred Flow Diversion Alternative 2. b Site planning considerations are based on the projections established for the 2060 ultimate buildout planning year. c Assumes Whispering Lakes Pump Station and Montclair Pipeline infrastructure improvements discussed in TM 3 Regional Trunk Sewer Alternatives Analysis are complete and operational by 2020, with both pump stations online and conveying flow to RP 1. TABLE 5 3 RP 1 Current and Projected Average Influent Wastewater Characteristics Current Concentration (mg/l) Current Load (lb/day) 2035 Load a (lb/day) 2060 Load a (lb/day) BOD , , ,350 TSS , , ,893 NH3 N 32 7,544 8,937 9,801 TKN 55 12,975 15,249 16,723 a Load projections based on projected flows, concentrations, and load peaking factors presented in TM 4 Wastewater Flow and Loading Forecast. 4.0 Treatment Requirements IEUA operates under an umbrella permit and must meet water quality requirements for discharge and recycled water. 4.1 Discharge Requirements The tertiary effluent from RP 1 is discharged at two discharge points (DPs) Prado Park Lake (DP 001) and Cucamonga Creek (DP 002), both regulated by RWQCB Order No. R , which replaced Order No and Order No , National Pollutant Discharge Elimination System (NPDES) No. CA This permit is an umbrella permit governing all of IEUA s wastewater treatment plants (RP 1, RP 4, RP 5, and Carbon Canyon Water Recycling Facility). It includes a stormwater discharge permit and the enforcement of an industrial pretreatment program. Effluent quality standards require tertiary treatment with filters and disinfection equivalent to Title 22 requirements for recycled water, due to the use of receiving waters for water contact recreation. A summary of the main effluent quality limits is provided in Table Recycled Water Requirements As mentioned previously, effluent from RP 1 and RP 4 is used as recycled water for irrigation and groundwater recharge via spreading in seven Phase I recharge basin sites and six Phase II recharge basin sites. Specifically, recycled water from RP 1 is discharged to a use area overlying Chino North Max Benefit Groundwater Management Zone (DP 005). Recycled water quality requirements for groundwater recharge are governed under RWQCB Order No. R Table I, Table II, and Table III in the permit provide concentration limits for many constituents of concern, such as inorganic chemicals, volatile organic chemicals, radionuclides, metals, and disinfection byproducts. Recycled water quality for irrigation is regulated by Order No. R and must meet the discharge requirements described in Table WBG SCO
7 TABLE 5 4 Summary of Effluent Quality Limits a Parameter Weekly Average Monthly Average Annual Average Daily Maximum BOD 30 mg/l b 20 mg/l b 45 mg/l weekly average and 30 mg/l TSS 30 mg/l b 20 mg/l b monthly average with 20:1 dilution. NH 4 N 4.5 mg/l Chlorine Residual Notes 0.1 Instantaneous maximum ceiling 2 mg/l TIN 8 mg/l TDS 550 mg/l Shall not exceed 12 month running average TDS concentration in water supply by more than 250 mg/l Turbidity 1. Daily average 2 NTU 2. 5% maximum in 24 hr 5 NTU 3. Instantaneous maximum 10 NTU Coliform < 2.2 MPN Maximum 23 MPN, once per month ph % compliance Free Cyanide 4.2 µg/l 8.5 µg/l Bis(2 ethylhexyl) Phthalate 5.9 µg/l 11.9 µg/l Selenium 4.1 µg/l 8.2 µg/l a RWQCB Order No. R b Without 20:1 dilution and for recycled water. TIN total inorganic nitrogen TDS total dissolved solids NH 4 N ammonia as nitrogen NTU nephelometric turbidity unit(s) MPN most probable number mg/l milligrams per liter µg/l micrograms per liter 5.0 Existing Plant Capacity and Limitations Existing facilities and the current performance of RP 1 were used as the basis for process model development. A whole plant model was developed using PRO2D and calibrated based on plant influent data and plant operations data for the period between October 15, 2011, and October 15, This period was selected as the basis after a review of the influent and plant data to reflect a 2 year long complete data set. Existing plant operation and the findings of the capacity evaluation through the use of process modeling is presented below for the liquid and solids treatment facilities at RP Existing Plant Operation A summary of RP 1 plant operations is provided in Table 5 5 for the liquid treatment and solids handling facilities. Unit process performance values were averaged over the evaluation period, with operating ranges noted. These values were used in development and calibration of the process models. Detailed data summaries for the evaluation period are provided in Appendix 5 A. WBG SCO 7
8 TABLE 5 5 RP 1 Average Plant Operations Summary Parameter Primary Treatment Value TSS Removal Rate (%) 73 TOC Removal Rate (%) 47 Primary Sludge (mgd) 1.01 Secondary Treatment (Average of System A, B, C) MLSS (mg/l) 4,400 MLVSS (%) 77 RAS SS (mg/l) 7,900 Solids Inventory (Basins Only) (lb) 141 Solids Inventory (Basins, Clarifiers, RAS) (lb) 194 Secondary Clarifier Loading (gpd/ft 2 ) 500 Secondary Clarifier Loading (lb/d/ft 2 ) 40 SVI (ml/g) SRT (Basins Only) (d) 18 Residual Alkalinity (mg as CaCO 3 /L) 138 Solids Handling Gravity Thickened Solids (% TS) 4 5 DAF Thickened Solids (%TS) Acid Phase (Digester 1) HRT (day) 3 Gas / Second Phase Digestion HRT (day) 12 Gas / Third Phase Digestion HRT (day) 6 Centrifuge Cake Solids (%TS) gpd gallons per day MLSS mixed liquor suspended solids MLVSS mixed liquor volatile suspended solids RAS SS return activated sludge suspended solids lb pound(s) ml/g milliliters per gram gpd/ft 2 gallons per day per square foot lb/d/ft 2 pounds per day per square foot SVI sludge volume index SRT solids retention time CaCO 3 /L calcium carbonate per liter TS thickened solids HRT hydraulic retention time A performance summary for the major treatment processes is presented in Table 5 6. These values, which represent the average over the evaluation period, were used in the subsequent plant process modeling and capacity evaluations for the major treatment units. Detailed data summaries for the evaluation period are provided in Appendix 5 A. 8 WBG SCO
9 TABLE 5 6 RP 1 Average Plant Performance Summary Primary Effluent Secondary Effluent Parameter System A System B System C TOC (mg/l) BOD (mg/l) TSS (mg/l) NH3 N (mg/l) NO3 N (mg/l) N/A NO2 N (mg/l) N/A TIN (mg/l) N/A Alkalinity (mg as CaCO 3 /L) N/A 138 N/A 139 N/A Not applicable NO3 N nitrate as nitrogen NO2 N nitrite as nitrogen The values above are for the current operation, which includes secondary treatment operation without internal mixed liquor recycling, configured in an anoxic oxic anoxic oxic biological nutrient removal (BNR) configuration with step feed capability. IEUA is currently planning to add internal mixed liquor pumping capability to the bioreactors, converting them to be closer to a Modified Ludzack Ettinger (MLE) configuration with step feed capability, which is expected to improve the nitrogen removal capability of the secondary treatment system. 5.2 Existing Plant Capacity Process Modeling The capacity of the existing system was evaluated through process modeling using CH2M HILL s whole plant simulator, PRO2D. PRO2D is a process simulation model that takes into account the mass balances through an entire facility for particulate and soluble components and, similar to other commercially available process models, is based on the International Water Association (IWA) ASM2D biological process kinetics. The base model was constructed to reflect the actual facility setup, including flow splits and backwash. The process model facility setup flow diagram is presented in Figure 5 2. The model was constructed with the operations and performance criteria reflective of the evaluation period, and then calibrated to reflect the actual performance, solids yields, and water quality data. As shown in Figure 5 2, the model was constructed to represent the actual plant operation for all the major process units. The model also allows establishing sizing and design considerations for each major unit process tankage and equipment. Similar to the actual operations, the plant model was built with the filter backwash and solids thickening recycles being returned to the main plant for further treatment, with the dewatering recycles being diverted offsite. The liquid and solids mass balances calculated for the current conditions allow calibration of the model against the actual field data. The calibrated model is then used to evaluate current capacity as well as establish expansion needs and process bottlenecks. The process model was constructed and calibrated using the current influent and operating data available for the facility. The purpose of the model calibration step is to establish a baseline condition that closely resembles current operations and provides a means to reliably predict operations and system limitations under different scenarios or alternatives. Key model calibration results are presented in Table 5 7. As the listed values show, the model was calibrated such that the simulation results are within a value range that is 5 percent or smaller WBG SCO 9
10 relative to the actual data. This level of accuracy will allow reliable capacity estimations to be made for the various capacity scenarios and future operation needs. TABLE 5 7 RP 1 Average Plant Performance Summary Parameter Actual Data Average Values Model Results Effluent BOD (mg/l) Effluent TSS (mg/l) Effluent TIN (mg/l) Effluent Alkalinity (mg as CaCO 3 /L) Total MLSS Inventory (lb) 424, ,000 Sludge VS Content 77% 76% Biosolids (Dry Solids lb/day) 44,400 47,400 Subsequent process modeling using the calibrated model as the base model was conducted to evaluate the following scenarios: Current plant capacity Liquid treatment capacity to meet 8 mg/l effluent TIN level under average and maximum month flow and load conditions Liquid treatment capacity to meet 5 mg/l effluent TIN level under average and maximum month flow and load conditions Solids handling capacity under average and maximum month flow and load conditions Flow equalization options and future capacity implications for the planning year 2035 Future facility footprint implications for the planning years 2035 and 2060 Findings of the current plant capacity evaluation are presented next in this section. Flow equalization and future capacity needs are presented in Sections 6.0 and 7.0, respectively. 10 WBG SCO
11 FIGURE 5 2 RP 1 Process Model Facility Setup Centrate 11 WBG SCO
12 5.2.2 Liquid Treatment Capacity IEUA WASTEWATER FACILITIES MASTER PLAN An evaluation of the liquid treatment capacity was conducted using the whole plant process model under both the average and maximum month conditions. The capacity evaluation was conducted based on achieving a plant effluent TIN concentration of 8 mg/l and 5 mg/l. As established at the onset of the project, the facility reliability and redundancy considerations are based on the IEUA s overall wastewater treatment system, with RP 5 being the end of the line facility receiving all flow diversions, if needed, from other Regional Water Recycling Plants. Additional reliability and redundancy considerations driven by the regulatory requirements, such as Title 22 requirements, were taken into account. Dewatering recycles were considered to be handled separately or treated separately onsite. Process modeling showed that the primary treatment system is not capacity limiting, because the liquid treatment capacity is limited by the secondary treatment system. One of the limitations was found to be the aeration and the ability to control dissolved oxygen (DO) in the anoxic and oxic zones in the aeration basins. The implications of DO are TIN fluctuations in the effluent and SVI values that are greater than 150 ml/g, which indicates sludge settleability could be impaired at times. Another limitation of the secondary treatment system was found to be the secondary clarification solids loading resulting from the current operations and the influent wastewater solids loading rates. Maintaining the SVI values at or below 150 ml/g is important for this reason also. The capacity of the RP 1 tertiary processes also were evaluated; the methodologies employed are consistent with those presented in the Title 22 Engineering Report (DDB Engineering, Inc. [DDB], 2010). The filters were designed based on a California Department of Public Health (CDPH) maximum filter loading rate of 5 gallons per minute per square foot (gpm/ft 2 ) for dual media gravity filters, with one filter in backwash and one filter offline. In order not to exceed the maximum approved filter loading rate, the maximum flow the filtration system can handle is 51.7 mgd. Applying a peak hourly dry weather peaking factor of 1.18, the resulting average filtration capacity is 43.8 mgd. The disinfection system was designed based on the Title 22 concentration and time (CT) and modal contact requirements of 450 milligrams per minute per liter (mg min/l), and 90 minutes during the peak hourly dry weather flow, respectively. Tracer testing completed in 2002 showed that Tanks 1 and 2 can handle a peak flow of 41.3 mgd while maintaining a modal contact time of 90 minutes (DDB, 2010). Applying a peak hourly dry weather peaking factor of 1.18, the resulting average disinfection capacity of Tanks 1 and 2 is 35 mgd. Tank 3 was designed based on 90 minutes modal contact time resulting in a peak dry weather capacity of 17.5 mgd. Applying a peak hourly dry weather peaking factor of 1.18, the resulting average disinfection capacity of Tank 3 is 14.8 mgd. Thus, the overall average disinfection capacity is approximately 49.8 mgd. The overall liquid treatment capacity is determined by its most limiting process capacity. For RP 1, the secondary treatment is limited to 32 mgd with all units in service, with primary flow equalization, for an effluent TIN of 8 mg/l, assuming that the mixed liquor return system is installed and dewatering recycles go to the Non Reclaimable Wastewater (NRW) system or are treated separately. Therefore, the RP 1 liquid treatment capacity is 32 mgd. As discussed previously, this is less than the rated capacity of 44 mgd. However, the rated capacity was based on completion of Train D, which has not been constructed. The liquid treatment capacity of the plant to achieve an effluent TIN value of 8 mg/l is illustrated in Figure 5 3. As shown, the current plant influent represents 88 percent of the plant liquid treatment capacity. To achieve 5 mg/l effluent TIN, the plant can only treat 28 mgd and will be at capacity. WBG SCO 12

13 FIGURE 5 3 RP 1 Existing Liquid Treatment Capacity Solids Handling Capacity In evaluating the solids handling system capacity, operational considerations as well as Part 503 Rule requirements were taken into account when considering the average and maximum month loading. The system capacity with and without one unit out of service was evaluated using the industry standard loading rates and operational criteria. The capacity values calculated are considered to represent equivalent plant influent flow values at the current wastewater characteristics. The plant influent includes the RP 4 solids diverted to RP 1 via the sewer system for further treatment. Primary sludge (PS) thickening is currently achieved using one gravity thickener; having a single thickener was not considered a key concern, based on the input from the IEUA staff. Thickening can be achieved in the primary clarifiers if the gravity thickener is taken out of service. WAS thickening is achieved in dissolved air floatation thickeners (DAFTs). Capacity was evaluated by maintaining a solids loading rate of 45 lb/d/ft 2 or less for the DAFTs. Waste solids digestion, achieved in the phased digestion system, was evaluated based on the current operating conditions as well as Part 503 Rule requirements. Digester loading rates of 0.1 to 0.2 pounds per day per cubic foot (lb/d/ft 3 ) and a digester SRT of 15 days with one large unit out of service were used to establish digestion capacity, using an active digester volume of 90 percent of the total digester volume including the cone space. The dewatering capacity of the centrifuges was calculated considering the hydraulic loading rate to be maintained at or below 340 gallons per minute (gpm) under the current solids loading conditions. The solids handling capacity of the plant to meet the Part 503 Rule requirements for Class B biosolids is illustrated in Figure 5 4. As shown, the digestion is the limiting unit process of the solids handling system. The current equivalent RP 1/RP 4 plant influent flows ( = 38 mgd) represent 100 percent of the anaerobic digestion capacity with one large unit out of service at the current influent wastewater characteristics and RP 4 solids loading diversion. WBG SCO 13

14 FIGURE 5 4 RP 1 Existing Solids Handling Capacity 5.3 RP-1 Capacity Summary The current RP 1 plant capacity is summarized in Table 5 8. These values constitute the basis of the future capacity requirements assessment presented later in this TM. TABLE 5 8 RP 1 Existing Process Capacity Summary Secondary Treatment Solids Handling d Tertiary Treatment All Units in Service One Unit Out of Service Plant Effluent TIN < 8 mg/l b 32 mgd 28 mgd a Plant Effluent TIN < 5 mg/l b,c 29 mgd 26 mgd PS Thickening 43.3 mgd 0 mgd e WAS Thickening 76 mgd 54 mgd e Digestion 44 mgd 38 mgd e Dewatering 66 mgd 54 mgd e Filtration f Disinfection 49.8 N/A a One secondary clarifier and one aeration basin out of service. b Assumes internal mixed liquor return (IMLR) is in place and SVI is 150 ml/g or better. c Assumes IMLR is in place, DO control is added, and DO management is practiced. d Values represent equivalent plant influent capacity and include RP 4 solids diverted to RP 1. Dewatering recycles were considered to be handled separately or treated onsite, not adding to the main plant nutrient loads. e One large unit out of service. f Two filter cells out of service, one in backwash one for maintenance. 14 WBG SCO
15 6.0 Flow Equalization Alternatives Evaluation IEUA WASTEWATER FACILITIES MASTER PLAN As part of the capacity and site planning for RP 1, primary flow equalization was evaluated for the projected RP 1 influent flows of 33.1 mgd in 2035 and 36.3 mgd in 2060 (ultimate capacity). The facility currently has three flow management lagoons as shown in Figures 5 5 and 5 6. These lagoons are used for flow management for primary effluent and secondary effluent. While all three lagoons were constructed to receive primary effluent, Lagoon 3 primarily receives secondary effluent. The primary effluent is diverted to remaining lagoons on an as needed basis to manage flow peaks at the facility. IEUA strives to minimize odors that are sometimes experienced with the storage of primary effluent in these lagoons that are not covered and are in close proximity to the neighboring community and businesses. The following flow equalization alternatives were considered for detailed review of the monetary and nonmonetary considerations: 1. Keep the existing system, continuing the current operations as long as possible. 2. Replace with a modern covered tank system with the capability to mix, drain, and clean the contents of the equalization tanks, as well as provide continuous odor control for the tank headspace. 3. Eliminate primary effluent equalization by adding planned aeration basin improvements and secondary clarifiers, and converting the lagoons to secondary effluent equalization or recycled water storage. A nonmonetary evaluation was completed considering the advantages and disadvantages of these flow equalization alternatives. The evaluation criteria included factors that are of varying levels of importance for IEUA. For example, operational flexibility, operational risk and reliability, and impacts on plant odors were of greatest importance, while footprint and space considerations had the lowest importance. The criteria, definitions, and weighting factors are listed in Table 5 9. As illustrated in Table 5 10 and Figure 5 7, the benefit scores were calculated for each alternative through independent evaluation of each criterion. Resultant total benefit scores show that Alternative 3 (eliminating the primary effluent equalization by adding secondary clarifiers, and converting the existing lagoons to secondary effluent equalization or recycled water storage) has the highest nonmonetary benefit for IEUA. This is in larger part due to the fact that this alternative significantly eliminates the plant odors from primary effluent storage and pumping, improves the overall plant aesthetics, does not have any constructability or space constraints, and provides ease of operation and maintenance because it eliminates primary effluent storage and associated pond/ mechanical equipment maintenance. WBG SCO 15


16 FIGURE 5 5 RP 1 Existing Flow Management Schematic 16 WBG SCO

17 Lagoon 1 Lagoon 2 Lagoon 1 = 5.8 MG Lagoon 2 = 6.2 MG Lagoon 3 = 10.3 MG Total = 22.3 MG Aerial image Google Earth, Annotation by CH2M HILL, Lagoon 3 " Figure 5-6 RP-1 Existing Flow Management Infrastructure Inland Empire Utilities Agency Wastewater Facilities Master Plan
18 TABLE 5 9 Nonmonetary Evaluation Criteria, Definitions, and Assigned Weighting Factors Criteria Description Weighting Factor Operational flexibility Ability of the system to respond to potential internal or external changes affecting delivery of equalized flow or treated solids without any impact on system performance. 10 Operational risk and reliability Impacts on plant odors Constructability and implementation timing Operational implications on system reliability and redundancy and the associated risk involved in operating major facilities. Use of proven systems and technologies, with similar installations currently in operation. Impacts of new processes on plant odors, and the need for additional odor control facilities to minimize plant odors. Construction implications, ease of construction, and integration with the existing systems, and the ability to implement the proposed alternative in phases. Treatment capacity impacts Impacts of the new facilities on treatment plant capacity. 8 Impacts on existing facilities Impacts on existing facilities and the ability to use existing infrastructure. Implications of site planning and the need to demolish or relocate existing facilities. Ease of operation and maintenance Relative degree of ease and extent of time required to operate and maintain the facilities. 8 Impacts on energy requirements Pumping and hydraulic requirements Additional energy required to construct and maintain new facilities, as well as the impact of the new facilities on the overall plant energy balance and power demand (for example, pumping, mixing, etc.). Implications of pumping and conveying to new facilities, and complexity of pumping and yard piping requirements. Overall aesthetics Aesthetic and visual considerations as a result of the new facilities. 6 Carbon footprint and sustainability Footprint and space constraints Potential impacts on the carbon footprint of each plant and added sustainability features as a result of construction and operation of the facilities. Overall footprint requirements and space constraints, and impacts on site planning for future facilities WBG SCO 18
19 TABLE 5 10 RP 1 Flow Equalization Non Monetary Evaluation Results Alternative 1 Keep Existing Alternative 2 Build New Tanks Alternative 3 Eliminate PE EQ Criteria Weighting Factor Score Weighted Score Score Weighted Score Score Weighted Score Operational Flexibility Operational Risk and Reliability Impacts on Plant Odors Constructability and Implementation Timing Treatment Capacity Impacts Impacts on Existing Facilities Ease of Operation and Maintenance Impacts on Energy Requirements Pumping and Hydraulic Requirements Overall Aesthetics Carbon Footprint and Sustainability Footprint and Space Constraints Final Score WBG SCO
 for the three alternatives.")


20 FIGURE 5 7 RP 1 Flow Equalization Non Monetary Evaluation Summary Monetary evaluation of these three flow equalization alternatives was completed to further assess the options. The monetary evaluation was conducted by developing life cycle costs (LCC) for the three alternatives. The cost basis was the same for the overall master plan cost criteria: 20 year planning period 3 percent inflation 6 percent bond (interest) rate 30 percent contingency 30 percent engineering, construction management, environmental, legal, etc. The monetary evaluation findings are listed in Table Accordingly, Alternative 1 will have the lowest LCC because it is the baseline alternative with no addition of new infrastructure. Alternative 2 has the highest LCC because of the addition of new infrastructure including two 180 foot covered concrete primary effluent equalization tanks, associated recirculation and flow transfer pumps, mixing, cleaning and odor control components, and elimination of some of the existing lagoon volume to provide space to construct the new tanks. New infrastructure needed for Alternative 3 includes one new secondary clarifier for each secondary treatment train (two 120 foot units and one 130 foot unit) to accommodate the unequalized loads to the secondary treatment system and associated piping and flow splitting features. As a result, it has the second highest LCC value. 20 WBG SCO
21 TABLE 5 11 RP 1 Flow Equalization Monetary Evaluation Results Alternative 1 Keep Existing Alternative 2 Build New Tanks Alternative 3 Eliminate PE EQ Capital Cost $ $ 50,661,000 $ 23,481,000 O&M Cost $ 50,000 $ 468,000 $ 130, yr LCC $ 750,000 $ 57,681,000 $ 27,079,000 IEUA has decided that Alternative 1 is not a sustainable approach because this alternative does not eliminate the currently experienced odor problems or provide a resolution to the lagoon maintenance challenges (for example, the need to clean the open lagoons properly and promptly, etc.). Alternative 2 was not preferred due to its high cost and the operational complexity. IEUA desires to eventually move toward elimination of the current primary effluent flow equalization as in Alternative 3. This will free up the existing lagoons for other flow management needs such as secondary effluent or recycled water storage. 7.0 Plant Expansion Needs The flow projections for the planning years 2035 and 2060 were established as described under Section 3.0 of this TM. Accordingly, 2035 flow projections will be the basis of the facility expansion and CIP planning effort, while the facilities needed for the 2060 flow conditions will constitute the basis of site planning. The corresponding planning flows are listed in Table TABLE 5 12 RP 1 Expansion Flow Scenarios Planning Year RP 1 Influent RP 4 Influent (Equivalent Waste Solids) mgd 14.7 mgd mgd 18.4 mgd IEUA has decided to base the capacity expansion and footprint requirements on using the MBR technology for RP 1. The benefits of the MBR technology for long term IEUA planning include small footprint requirements, elimination of secondary clarifiers and tertiary filters for recycled water production, superior water quality, and ability to produce thicker waste sludge compared to conventional technologies. The modular design capability of MBR technology also allows stepwise expansion of the treatment facility to meet both load capacity and different effluent TIN requirements. Also, the superior quality effluent can be directly fed to a reverse osmosis (RO) system if IEUA needs to produce higher quality effluent or reduce final effluent TDS. 7.1 Facility Expansion Requirements For the 2035 capacity expansion requirements that will constitute the basis of the CIP planning, facility sizing was determined using the whole plant PRO2D process model developed and calibrated for the current operation and wastewater quality. The PRO2D model simulations for average and maximum month flow and load conditions were completed to establish the facility requirements as well as liquid and mass balances for the facility. New facility sizing was based on the current IEUA operations as well as industry standards that apply to each unit process. RP 1 facility expansion requirements are summarized in Table WBG SCO 21
22 TABLE 5 13 RP 1 Facility Expansion Requirements for Planning Year 2035 Parameter Size of New Units Comments Primary Clarifiers No new units are needed. Train D Secondary Treatment (MBR) Train D MBR Bioreactor Dimensions (Length x Width x Depth) 1 module (8 mg/l TIN) 2 modules (5 mg/l TIN) 1 module 130 foot x 60 foot x 18 foot MBR system requirements include fine screening for the MBR system feed, MBR equipment includes permeate blowers and pumps. For site planning purposes, a 60 foot x 45 foot concrete equipment pad is reserved for this purpose. Two trains per module. Train D Membrane Tank Dimensions (Length x Width x Depth) Trains A, B, C New Secondary Clarifiers (PE EQ Elimination) Anaerobic Digesters 1 module 30 foot x 60 foot x 10 foot 2 x 120 foot (Trains A and B) 1 x 130 foot (Train C) 2 digesters 110 foot diameter 30 foot sidewater depth Three trains per module. Flow splitting structure for each of the trains, as well as considerations for new RAS/WAS piping and pumping requirements, were included. New digesters with complete sludge transfer and recirculation, mixing and heating, and pumping equipment. Flow Management Lagoons Modifications only to piping and pumping systems to be able to use the lagoons for secondary effluent equalization. The facility expansion configured in Table 5 13 was used as the basis of the capital and site planning under this master plan because it allows independent implementation of various facilities listed in the table. For example, elimination of primary effluent equalization impacts on secondary treatment needs to be balanced with the addition of secondary clarifiers, as noted previously. Because the clarifier addition and the MBR system addition are independent projects, they can be implemented separately. There is an alternative that combines the elimination of primary flow equalization and addition of an MBR system; this alternative needs to be further evaluated as a part of the preliminary design effort. It involves dedicating the existing six secondary clarifiers to Trains A and B, while converting Train C to MBR technology. Under this alternative, Trains A and B will have adequate capacity to handle diurnal peaks. After conversion to MBR through the addition of membrane tanks and bioreactors, as needed, Train C can provide additional capacity for treatment of RP 1 flows. Train D can be constructed in the future, if needed. This way, no new secondary clarifiers would be built, and more flows could be treated through MBR as compared to constructing Train D only. The constructability and sizing details for the conversion of existing infrastructure for this alternative need to be further evaluated during preliminary design. 7.2 Ultimate Facilities Site Plan For ultimate site planning purposes, the facilities for the ultimate capacity increase and other site planning considerations were established. In addition to the liquid treatment and solids handling facilities expansion requirements, the following site space needs were reserved for the listed future uses: 1. Secondary Treatment: Ultimate site space planning was completed using the expansion scheme listed in Table To achieve 5 mg/l effluent TIN, both MBR modules of Train D needs to be implemented. However, an alternative ultimate site plan by converting Train C to MBR technology and adding Train D also could be implemented. As indicated above, Train C conversion requirements and related site planning requirements need to be further explored during preliminary design. The secondary treatment footprint, as shown in Figure 5 8, represents the worst case scenario. 22 WBG SCO
23 2. Dewatering Recycles Treatment: Currently, IEUA diverts the dewatering recycles to the NRW line through an interagency agreement. The NRW delivers non reclaimable wastewater flows from the inland areas to the Los Angeles County Sanitation Districts (Sanitation Districts) Joint Water Pollution Control Facility (JWPCF) located in Carson, California. IEUA is planning to eliminate this discharge and manage the dewatering recycle flows onsite in the future. Dewatering recycles represent significant nutrient load (especially ammonia as nitrogen) that need to be treated. The flow can either be recycled back to the head of the plant, or be treated separately. Current advancements in treatment technologies, such as the Demon process, will allow IEUA to cost effectively treat the ammonia load separately in a biological treatment system that uses the specialty microorganisms to achieve short cut nitrogen removal. To reserve space to implement dewatering recycle treatment, a 20,000 ft 2 site space was reserved as shown in Figure Advanced Water Treatment (AWT): Currently IEUA does not need to implement AWT to further treat the tertiary effluent. However, to manage the needs for higher quality effluent or increasing TDS in the tertiary effluent, IEUA would like to reserve space for future implementation of an AWT system that could treat up to 5,000 acre feet per year (AFY) using a microfiltration (MF)/RO system and its appurtenances. If the MBR technology is implemented for the main plant expansion, the MF facility could be eliminated, depending on the AWT flow requirements. For this purpose, a 60,000 ft 2 site space was reserved as shown in Figure 5 8. WBG SCO 23
24 Aerial image Google Earth, Annotation by CH2M HILL, " Figure 5-8 RP-1 Ultimate Facilities Site Plan Inland Empire Utilities Agency Wastewater Facilities Master Plan
25 Year CIP Plant Expansion Projects and Capital Cost Three plant expansion projects were identified during the 20 year CIP: the RP 1 Primary Effluent Equalization Elimination Project, the RP 1 Liquid Treatment Expansion Project, and the RP 1 Solids Treatment Expansion Project. Capital costs were estimated for each project and those costs were placed into the 20 year CIP. The planning level capital costs for each facility identified were developed based on cost curves established from previous projects and known direct costs for similar sized projects. Additionally, several assumptions were made to estimate the total construction cost and total project costs for each expansion project. The assumptions include the following: The WFMP assumed a 20 year planning period. 10 percent of facilities subtotal for civil/site work. 0 to 5 percent of facilities subtotal for demolition depending on existing site conditions. 20 percent of facilities subtotal for electrical and instrumentation. 10 percent of total direct cost for contractor general conditions. 15 percent of total direct cost for contractor overhead and profit. 8 percent sales tax was applied to 50 percent of the total direct cost. 30 percent for construction contingency. 30 percent for engineering, construction management, environmental, and legal costs was applied to the total construction cost to estimate the total project cost. The total construction cost and total project cost for each expansion project are summarized in Table Conclusion The following conclusions can be made from the evaluation of RP 1: Elimination of existing primary effluent flow equalization by adding secondary clarifiers and converting the existing lagoons to secondary effluent equalization or recycled water storage is the most favorable alternative. The RP 1 liquid treatment facilities will need to be expanded during the 20 year planning period with the construction of a new MBR facility (Train D). The RP 1 solids treatment facilities will need to be expanded during the 20 year planning period with the construction of new anaerobic digesters References DDB Engineering, Inc. (DDB) Inland Empire Utilities Agency Regional Plant No. 1 Title 22 Engineering Report. January. WBG SCO 25
26 TABLE 5 14 RP 1 Expansion Projects Capital Cost Estimate Component Description RP 1 Primary Effluent Equalization Elimination Project RP 1 Liquid Treatment Expansion Project RP 1 Solids Treatment Expansion Project Secondary Treatment (MBR) 5 mgd $21,400,000 Secondary Clarifiers $7,200,000 Aeration Basin Distribution Box Modifications $360,000 RAS/WAS Pump Station Modifications $1,100,000 Equalization Pond Piping Modifications $500,000 Methane Phase Digestion $7,000,000 Facilities Subtotal $9,160,000 $21,400,000 $7,000,000 Civil/Site Work (10%) $916,000 $2,140,000 $700,000 Demolition (5%) $458,000 $1,070,000 $350,000 Electrical and Instrumentation (20%) $1,832,000 $4,280,000 $1,400,000 Total Direct Cost a $12,366,000 $28,890,000 $9,450,000 General Conditions (10%) $1,237,000 $2,889,000 $945,000 General Contractor Overhead and Profit (15%) $1,855,000 $4,334,000 $1,418,000 Sales Tax (8%) b $495,000 $1,156,000 $378,000 Subtotal $15,953,000 $37,269,000 $12,191,000 Construction Contingency (30%) $4,786,000 $11,181,000 $3,657,000 Total Estimated Construction Cost c $20,739,000 $48,450,000 $15,848,000 Engineering, Construction Management, Environmental, and Legal Costs (30%) $6,222,000 $14,535,000 $4,754,000 Total Estimated Project Costs $26,961,000 $62,985,000 $20,602,000 a ENR CCI Index for Los Angeles (August ,737). b Calculated assuming 50% of direct costs are taxable. c Cost does not include escalation to midpoint of construction. The cost estimate herein is based on our perception of current conditions at the project location. This estimate reflects our professional opinion of accurate costs at this time and is subject to change as the project design matures. The Consultant Team has no control over variances in the cost of labor, materials, equipment; nor services provided by others, contractor's means and methods of executing the work or of determining prices, competitive bidding or market conditions, practices, or bidding strategies. The Consultant Team cannot and does not warrant or guarantee that proposals, bids, or actual construction costs will not vary from the costs presented as shown. 26 WBG SCO
Inland Empire Utilities Agency Carollo Engineers, Inc. CH2M HILL
 TECHNICAL MEMORANDUM IEUA Wastewater Facilities Master Plan TM 8 CCWRF Future Plans PREPARED FOR: PREPARED BY: REVIEWED BY: Inland Empire Utilities Agency Carollo Engineers, Inc. CH2M HILL DATE: October
Inland Empire Utilities Agency CH2M HILL
 TECHNICAL MEMORANDUM IEUA Wastewater Facilities Master Plan TM 6 RP-4 Future Plans PREPARED FOR: PREPARED BY: Inland Empire Utilities Agency CH2M HILL DATE: October 29, 2014 Executive Summary... 2 1.0
Inland Empire Utilities Agency Regional Plant No. 1 Title 22 Engineering Report
 Regional Plant No. Title 22 Engineering Report Table of Contents Page Introduction. Background... -.2 Objective... - 2 Regulatory Requirements 2. Types of Reuse... 2-2.2 Water Recycling Criteria... 2-2.3
Carbon Canyon Water Recycling Facility Title 22 Engineering Report
 Carbon Canyon Water Recycling Facility Title 22 Engineering Report April 2014 Introduction Regulatory Requirements Inland Empire Utilities Agency Carbon Canyon Water Recycling Facility Title 22 Engineering
BEING GOOD STEWARDS: IMPROVING EFFLUENT QUALITY ON A BARRIER ISLAND. 1.0 Executive Summary
 BEING GOOD STEWARDS: IMPROVING EFFLUENT QUALITY ON A BARRIER ISLAND Brett T. Messner, PE, Tetra Tech, Inc., 201 E Pine St, Suite 1000, Orlando, FL 32801 Brett.Messner@tetratech.com, Ph: 239-851-1225 Fred
Appendix D JWPCP Background and NDN
 Appendix D JWPCP Background and NDN JWPCP Background JWPCP Water Quality Primary Clarifiers HPO Reactors Final Clarifiers Unit Influent Primary Effluent Secondary Effluent BOD mg/l 460 240
W O C H H O L Z R E G I O N A L W A T E R R E C L A M A T I O N F A C I L I T Y O V E R V I E W
 Facility Overview The recently upgraded and expanded Henry N. Wochholz Regional Water Reclamation Facility (WRWRF) treats domestic wastewater generated from the Yucaipa-Calimesa service area. The WRWRF
WASTEWATER TREATMENT PLANT MASTER PLAN 6. BUSINESS CASE EVALUATION OF ALTERNATIVES
 WASTEWATER TREATMENT PLANT MASTER PLAN 6. BUSINESS CASE EVALUATION OF ALTERNATIVES A range of potential ammonia limits were identified for alternatives evaluation, as discussed in Section 2.2.5. This chapter
Appendix C: TM T-49 Nampa WWTP Capacity Assessment
 Appendix C: TM T-49 Nampa WWTP Capacity Assessment C-1 Use of contents on this sheet is subject to the limitations specified at the end of this document. Final Facility Plan_v2_DEQReview_1.22.19.docx City
APPENDIX D ONSITE WASTEWATER TREATMENT TECHNICAL MEMORANDUM
 APPENDIX D ONSITE WASTEWATER TREATMENT TECHNICAL MEMORANDUM DRAFT FINAL TECHNICAL MEMORANDUM Crystal Geyser Onsite Wastewater Treatment PREPARED FOR: Richard Weklych/Crystal Geyser Barbara Brenner/Churchwell
City of Redlands Wastewater Treatment Plant. Redlands, CA LOCATION: Carollo Engineers; CH2M HILL MBR MANUFACTURER: COMMENTS:
 FACILITY: City of Redlands Wastewater Treatment Plant LOCATION: Redlands, CA GEO. AREA: Southern California STATUS 07/14: Operational CONSTRUCTION: ENGINEERING: Carollo Engineers; CH2M HILL MBR MANUFACTURER:
WASTEWATER TREATMENT MASTER PLAN SUPPLEMENT EXECUTIVE SUMMARY
 City of Modesto Wastewater Treatment Master Plan Jennings Road Secondary Treatment Facility WASTEWATER TREATMENT MASTER PLAN SUPPLEMENT EXECUTIVE SUMMARY DRAFT June 2008 2700 YGNACIO VALLEY ROAD, SUITE
The following biological nutrient removal processes were evaluated in detail in the 2016 Liquid Processing Facilities Plan:
 Nitrite Shunt Pilot Project Purpose: The purpose of this project is to full scale pilot test the nitrite shunt biological nutrient removal process to confirm process design criteria, impacts to sludge
Membrane Bioreactor and High Flow Biological Treatment System for the Cox Creek WRF
 Membrane Bioreactor and High Flow Biological Treatment System for the Cox Creek WRF Thor Young, GHD With Contributions from Vince Maillard, Rip Copithorn, Kristi Perri, and Jeff Sturdevant, GHD Dimitrios
VILLAGE OF ALGONQUIN 2014 WASTEWATER FACILITY PLAN UPDATE EXECUTIVE SUMMARY
 EXECUTIVE SUMMARY EXECUTIVE SUMMARY INTRODUCTION AND BACKGROUND The Village of Algonquin, located along the Fox River in McHenry County, provides wastewater collection and treatment services to the entire
OPTIMIZATION STUDY OF THE ST. MARY'S WASTEWATER TREATMENT PLANT
 XCG File No.: 3-167-09-02 October 26, 2016 OPTIMIZATION STUDY OF THE ST. MARY'S WASTEWATER TREATMENT PLANT Prepared for: B.M. ROSS & ASSOCIATES LIMITED 62 North Street Goderich, Ontario N7A 2T4 Prepared
Performance Evaluation of the Moores Creek Advanced Water Resource Recovery Facility
 Performance Evaluation of the Moores Creek Advanced Water Resource Recovery Facility Richard W. Gullick, Ph.D. Director of Operations Timothy Castillo Wastewater Manager Presented to the Albemarle County
Post-Aerobic Digester with Bioaugmentation Pilot Study City of Meridian, ID WWTP PNCWA 2010
 Post-Aerobic Digester with Bioaugmentation Pilot Study City of Meridian, ID WWTP by: William Leaf Adrienne Menniti Bruce Johnson CH2M HILL, Inc. Clint Dolsby Tracy Crane City of Meridian October 26, 21
CITY OF OXFORD WASTEWATER TREATMENT FACILITY ANNUAL PERFORMANCE REPORT FOR THE CALENDAR YEAR OF 2014
 CITY OF OXFORD WASTEWATER TREATMENT FACILITY ANNUAL PERFORMANCE REPORT FOR THE CALENDAR YEAR OF 2014 PREPARED: January 2015 2014 ANNUAL PERFORMANCE REPORT FOR THE CITY OF OXFORD WASTEWATER TREATMENT FICILITY
Sulaibiya world s largest membrane water reuse project
 Water Technologies & Solutions technical paper Sulaibiya world s largest membrane water reuse project background In May 2001, a consortium including Mohammed Abdulmohsin Al-Kharafi and Sons (The Kharafi
Watertown Wastewater Facility Plan. August 11, 2015
 Watertown Wastewater Facility Plan August 11, 2015 Watertown Wastewater Wastewater Treatment Facility History Comprehensive Planning Wastewater Concerns Capacity Condition Permitting Requirements Watertown
North Side WRP Master Plan Research and Development Department 2006 Seminar Series October 27, 2006 Metropolitan Water Reclamation District of
 North Side WRP Master Plan Research and Development Department 2006 Seminar Series October 27, 2006 Metropolitan Water Reclamation District of Greater Chicago Today s Goals Discuss project background Provide
Capital Improvement Plan Update:
 Board of Supervisors Meeting Carson City Public Works Department Capital Improvement Plan Update: Wastewater Collection, Treatment and Reuse March 14, 2013 Topics of Discussion Regionalization Existing
Nutrient Removal Optimization at the Fairview WWTP
 Alyssa Mayer, PE Principal Engineer Nutrient Removal Optimization at the Fairview WWTP Mark Strahota, PE Associate Presentation Overview Project Background Process Model Development BNR Design Considerations
Copies: Mark Hildebrand (NCA) ARCADIS Project No.: April 10, Task A 3100
 ARCADIS Project No.: April 10, Task A 3100") MEMO To: Jeff Pelz (West Yost) Kathryn Gies (West Yost) Copies: Mark Hildebrand (NCA) ARCADIS U.S., Inc. 200 Harvard Mills Square Suite 430 Wakefield Massachusetts 01880 Tel 781 224 4488 Fax 781 224 3033
MEMO To: Jeff Pelz (West Yost) Kathryn Gies (West Yost) Copies: Mark Hildebrand (NCA) ARCADIS U.S., Inc. 200 Harvard Mills Square Suite 430 Wakefield Massachusetts 01880 Tel 781 224 4488 Fax 781 224 3033
APPENDIX A. 1. Background. 1.1 Existing Facilities. Page 1
 APPENDIX A PRELIMINARY TECHNICAL SPECIFICATIONS FOR BIOSOLIDS MANAGEMENT SERVICES JEA Buckman Residuals Management Facility 1. Background JEA is seeking biosolids management services from experienced biosolids
IEUA FY Recycled Water Annual Report. Water Smart Thinking in Terms of Tomorrow
 2 0 1 7 IEUA FY 2016-2017 Recycled Water Annual Report Water Smart Thinking in Terms of Tomorrow IEUA Recycled Water 2016/17 Annual Report TABLE OF CONTENTS INTRODUCTION... 2 DEMANDS... 3 DEMANDS BY USE
Evaluation of Conventional Activated Sludge Compared to Membrane Bioreactors
 Evaluation of Conventional Activated Sludge Compared to Membrane Bioreactors Short Course on Membrane Bioreactors 3/22/06 R. Shane Trussell, Ph.D., P.E. shane@trusselltech.com Outline Introduction Process
Facilities Plan. Volume 2 Wastewater Facilities Assessment Report Executive Summary
 City of St. Joseph, Missouri Volume 2 Wastewater Facilities Assessment Report Executive Summary By Work Order No. 09-001 B&V Project 163509 October 29, 2010 Table of Contents 1.0 Introduction...1 2.0 TM-WW-1:
Chapter 2: Description of Treatment Facilities
 2020 Facilities Plan Treatment Report 2.1 Introduction Chapter 2: Description of Treatment Facilities This chapter defines the Milwaukee Metropolitan Sewerage District (MMSD) service area. It also describes
Inland Empire Utilities Agency Carollo Engineers, Inc. CH2M HILL DRAFT
 TECHNICAL MEMORANDUM IEUA Wastewater Facilities Master Plan TM 3 Regional Trunk Sewer Analysis PREPARED FOR: PREPARED BY: REVIEWED BY: Inland Empire Utilities Agency Carollo Engineers, Inc. CH2M HILL DATE:
Assuming 100 gallons per capita per day, and 3 people per REU, design flows for the development are proposed to be:
 Andelina Farms Wastewater Treatment Plant Preliminary Basis of Design May 2018 Andelina Farms is a proposed Planned Unit Development in Saline Township located along US-12 just west of the City of Saline.
BIOLOGICAL WASTEWATER BASICS
 BIOLOGICAL WASTEWATER BASICS PRESENTATION GOALS EXPLAIN DIFFERENT TYPES OF WASTEWATER EXPLAIN THE DIFFERENT BIOLOGICAL SYSTEMS AND HOW THEY FUNCTION. COMPARE AND CONTRAST AEROBIC AND ANAEROBIC SYSTEMS
City of Elk River Wastewater Treatment Facility Improvements. Achieving Wastewater Treatment Goals
 City of Elk River Wastewater Treatment Facility Improvements Achieving Wastewater Treatment Goals By Tejpal Bala, P.E. Bolton & Menk, Inc. The City of Elk River received a new NPDES permit and the existing
PERMIT TO OPERATE SILVER CLOUD CT., MONTEREY, CA TELEPHONE (831) FAX (831)
 FAX (831)") FFR MONTEREY BAY UNIFIED AIR POLLUTION CONTROL DISTRICT PERMIT TO OPERATE 24580 SILVER CLOUD CT., MONTEREY, CA 93940 TELEPHONE (831) 647-9411 FAX (831) 647-8501 15018 OPERATION UNDER THIS PERMIT MUST BE
FFR MONTEREY BAY UNIFIED AIR POLLUTION CONTROL DISTRICT PERMIT TO OPERATE 24580 SILVER CLOUD CT., MONTEREY, CA 93940 TELEPHONE (831) 647-9411 FAX (831) 647-8501 15018 OPERATION UNDER THIS PERMIT MUST BE
WASTEWATER DEPARTMENT. Bentonville Wastewater Treatment Plant Facts:
 Mission: The mission of the Bentonville Wastewater Treatment Utility and staff is to protect public health and the environment through the effective treatment of wastewater. Effective wastewater treatment
UDWQ POTW Nutrient Removal Cost Impact Study: Analysis of Tremonton City Wastewater Treatment Plant
 TECHNICAL MEMORANDUM UDWQ POTW Nutrient Removal Cost Impact Study: Analysis of Tremonton City Wastewater Treatment Plant PREPARED FOR: PREPARED BY: COPIES: Utah Division of Water Quality CH2M HILL DATE:
6. Evaluation of Wastewater Treatment Alternatives
 6. Evaluation of Wastewater Treatment Alternatives The wastewater treatment selection is closely related to the effluent management strategy. After initial screening of wastewater treatment plant processes,
City of Oxnard. Public Works Integrated Master Plan WASTEWATER PROJECT MEMORANDUM 3.4 TREATMENT PLANT PERFORMANCE AND CAPACITY
 This document is released for the purpose of information exchange review and planning only under the authority of Hugh Steve McDonald, December 2015, State of California, PE No. 44074 and Tracy Anne Clinton,
Treatability Study and Reverse Osmosis Pilot Study of Industrial Wastewater at a Wood Products Mill
 Treatability Study and Reverse Osmosis Pilot Study of Industrial Wastewater at a Wood Products Mill NC AWWA-WEA 2017 Annual Conference Randall Foulke, PE, BCEE, LEED AP Tracey Daniels, EI November 14,
Masses at Massillon: IFAS for Industrial Loads and Nutrient Removal
 OWEA Annual Conference, Sandusky, OH, Wednesday, June 24, 3:00-3:45 PM Masses at Massillon: IFAS for Industrial Loads and Nutrient Removal Kristin Waller, O Brien & Gere Kristin.Waller@obg.com #obgpresents
SECTION 8.0 NEWPCC SECOND PRIORITY CONTROL ALTERNATIVES
 SECTION 8.0 NEWPCC SECOND PRIORITY CONTROL ALTERNATIVES 8.1 PREAMBLE Table 8.1 below indicates the target ammonia concentrations for the Best Practicable and the Second Priority Levels of Control for the
Altoona Westerly Wastewater Treatment Facility BNR Conversion with Wet Weather Accommodation
 Pennsylvania Water Environment Federation PennTEC Annual Technical Conference June 4, 2013 Altoona Westerly Wastewater Treatment Facility BNR Conversion with Wet Weather Accommodation Presented by: Jim
SECTION 2.0 WASTEWATER TREATMENT PLANT AND DISPOSAL SYSTEM DESCRIPTION
 SECTION 2.0 WASTEWATER TREATMENT PLANT AND DISPOSAL SYSTEM DESCRIPTION Analytical Environmental Services 2-1 Jamul Indian Village Wastewater Treatment Plant Analytical Environmental Services 2-2 Jamul
CSR Process Simulations Can Help Municipalities Meet Stringent Nutrient Removal Requirements
 CSR Process Simulations Can Help Municipalities Meet Stringent Nutrient Removal Requirements Continuous Flow Sequencing Reactor (CSR) Basin with Moving Bridge, Submerged Diffusers, and Stationary Diffusers
CHAPTER 1 - WASTEWATER SYSTEM DESCRIPTION
 CHAPTER 1 - WASTEWATER SYSTEM DESCRIPTION 1.1 Introduction The GWA provides wastewater services for Guam s general population and for Andersen Air Force Base. The wastewater system is made up of seven
SMCSD Headworks, Primary and Secondary Treatment Pre-Design
 Technical Memorandum SMCSD Headworks, Primary and Secondary Treatment Pre-Design Water andenvironment Subject: Prepared For: Prepared by: Reviewed by: SMCSD Mark Takemoto, Dennis Gellerman Steve Clary
Technical Memorandum No. 1
 To: From: Steve McGowan, P.E., BCEE Project Manager, Malcolm Pirnie, Inc. Eric Wang, P.E. Project Engineer, Malcolm Pirnie, Inc. Date: Subject: August 11, 28 (Final) Madison MSD Project No. 84251 Malcolm
CITY OF OXFORD WASTEWATER TREATMENT FACILITY ANNUAL PERFORMANCE REPORT FOR THE CALENDAR YEAR OF 2012
 CITY OF OXFORD WASTEWATER TREATMENT FACILITY ANNUAL PERFORMANCE REPORT FOR THE CALENDAR YEAR OF 2012 PREPARED: January 2013 2012 ANNUAL PERFORMANCE REPORT FOR THE CITY OF OXFORD WASTEWATER TREATMENT FICILITY
CHAPTER 4 DESCRIPTION OF EXISTING FACILITIES
 CHAPTER 4 DESCRIPTION OF EXISTING FACILITIES Santa Clarita Valley Joint Sewerage System SCVJSS Conveyance System Solids Processing and Biosolids Management CHAPTER 4 DESCRIPTION OF EXISTING FACILITIES
MAKING THE SWITCH FROM LIME TO MEMBRANE SOFTENING: WHEN IS IT THE RIGHT TIME? Introduction
 MAKING THE SWITCH FROM LIME TO MEMBRANE SOFTENING: WHEN IS IT THE RIGHT TIME? Joseph R. Elarde CH2M HILL 5801 Pelican Bay Blvd., Suite 505 Naples, FL 34108 joe.elarde@ch2m.com 239-431-9225 Jeff Poteet,
Secondary Treatment Process Control
 SARBS One-Day Training Seminar Phoenix Club, Anaheim Secondary Treatment Process Control Graham Juby June 5, 2013 Objectives Provide an understanding of nitrogen removal process interactions to support
e~,5.eik REDDING, CALIFORNIA
 e~,5.eik REDDING, CALIFORNIA Memorandum TO: Brian Huffaker, Director of Development Services DATE: January 20,2009 Hawkins Companies.~ FROM: Paul Reuter, Managing Engineer JOB NO.: 2031.01 SUBJECT: UPDATED
Description: D05_100_OVW_015_PlantOverview.htm Plant Overview Durham Plant Overview Last Update: October 30, 2013 Purpose:
 D05_100_OVW_015_PlantOverview.htm Plant Overview Title: Durham Plant Overview Last Update: October 30, 2013 Purpose: To provide an updated layout of the Durham Advanced Wastewater Treatment Facility while
Brightwater: The Design Challenges of a 39 mgd (150 MLD) Membrane Bioreactor
 Membrane Bioreactor") Brightwater: The Design Challenges of a 39 mgd (150 MLD) Membrane Bioreactor J. Komorita 1, P. Burke 2, B. Youker 2, and G. Crawford 2 1 King County, 2 CH2M HILL ABSTRACT Many Membrane Bioreactor (MBR)
Brightwater: The Design Challenges of a 39 mgd (150 MLD) Membrane Bioreactor J. Komorita 1, P. Burke 2, B. Youker 2, and G. Crawford 2 1 King County, 2 CH2M HILL ABSTRACT Many Membrane Bioreactor (MBR)
A Battle to Be the Best: A Comparison of Two Powerful Sidestream Treatment Technologies: Post Aerobic Digestion and Anammox
 A Battle to Be the Best: A Comparison of Two Powerful Treatment Technologies: Post Aerobic Digestion and Anammox David Oerke/CH2M Tom Johnson/CH2M Bruce Johnson/CH2M Heidi Bauer/CH2M Steve Graziano/CH2M
WASTEWATER TREATMENT PLANT MASTER PLAN 3. EXISTING FACILITIES AND PERFORMANCE ASSESSMENT
 WASTEWATER TREATMENT PLANT MASTER PLAN 3. EXISTING FACILITIES AND PERFORMANCE ASSESSMENT This chapter reviews in detail the current condition of the individual components of the Napa Sanitation District
CHAPTER 5 WASTEWATER FLOWS
 CHAPTER 5 WASTEWATER FLOWS 5.1 REGIONAL FACILITIES Regional Water Recycling Plants Figure 5-1 illustrates the service area boundaries for IEUA s four water recycling plants. The four Regional facilities
WWTF Capacity Assessment Project
 Wastewater Treatment Facility Evaluation The Richland WWTF was constructed in 1985 to provide primary and secondary treatment for the City's wastewater. Section 3 includes a general description of the
Best Practice in Sewage and Effluent Treatment Technologies
 Best Practice in Sewage and Effluent Treatment Technologies Contents 1 Wastewater - Introduction 1 1.1 Earth s ecological system 1 1.1.1 Water effect on ecology 2 1.1.2 Wastewater generation 3 1.2 Wastewater
COMPARISON OF SBR AND CONTINUOUS FLOW ACTIVATED SLUDGE FOR NUTRIENT REMOVAL
 COMPARISON OF SBR AND CONTINUOUS FLOW ACTIVATED SLUDGE FOR NUTRIENT REMOVAL Alvin C. Firmin CDM Jefferson Mill, 670 North Commercial Street Suite 201 Manchester, New Hampshire 03101 ABSTRACT Sequencing
Membrane Bio-Reactors (MBRs) The Future of Wastewater Technology, Science and Economy Aspects
 The Future of Wastewater Technology, Science and Economy Aspects") Membrane Bio-Reactors (MBRs) The Future of Wastewater Technology, Science and Economy Aspects Glen T. Daigger, Ph.D., P.E., DEE, NAE Senior Vice President and Chief Technology Officer CH2M HILL Presented
Membrane Bio-Reactors (MBRs) The Future of Wastewater Technology, Science and Economy Aspects Glen T. Daigger, Ph.D., P.E., DEE, NAE Senior Vice President and Chief Technology Officer CH2M HILL Presented
Membrane BioReactor: Technology for Waste Water Reclamation
 Membrane BioReactor: Technology for Waste Water Reclamation Sachin Malekar - Senior Manager, Technology & Nilesh Tantak - Executive, Technology Ion Exchange (India) Ltd. BACKGROUND Due to diminishing water
CITY OF OXFORD WASTEWATER TREATMENT FACILITY ANNUAL PERFORMANCE REPORT FOR THE CALENDAR YEAR OF 2018
 CITY OF OXFORD WASTEWATER TREATMENT FACILITY ANNUAL PERFORMANCE REPORT FOR THE CALENDAR YEAR OF 2018 PREPARED: January 2019 2018 ANNUAL PERFORMANCE REPORT FOR THE CITY OF OXFORD WASTEWATER TREATMENT FICILITY
Review of WEFTEC 2016 Challenge & Overview of 2017 Event. Malcolm Fabiyi, PhD, MBA Spencer Snowling, PhD. P.Eng
 Review of WEFTEC 2016 Challenge & Overview of 2017 Event Malcolm Fabiyi, PhD, MBA Spencer Snowling, PhD. P.Eng Agenda Review 2016 Challenge Provide overview of updates to 2017 event Frequency WEFTEC Scores
Figure 6.3 STORAGE BASIN AREA OF INFLUENCE INTEGRATED WASTEWATER MASTER PLAN CITY OF SAN MATEO. sm0914f ai
 sm0914f10-8562.ai Figure 6.3 STORAGE BASIN AREA OF INFLUENCE INTEGRATED WASTEWATER MASTER PLAN CITY OF SAN MATEO 6.6 PRELIMINARY MODELING RESULTS FOR THE STORAGE ALTERNATIVES Following the preliminary
Fremont Water Pollution Control Center Plant Expansion for Nutrient Removal and Wet Weather Flow Treatment
 OWEA 2013 Annual Conference June 19, 2013 Fremont Water Pollution Control Center Plant Expansion for Nutrient Removal and Wet Weather Flow Treatment Jeff Lamson, Superintendent, WPCC Robert Hrusovsky,
Palmer Wastewater Treatment Plant Environmental Impacts. A summary of the impacts of this treatment alternative are listed below:
 6.1.3 Environmental Impacts A summary of the impacts of this treatment alternative are listed below: 1. The Matanuska River will receive treated effluent as it currently does. 2. Effluent quality would
Wastewater Treatment Processes
 Wastewater Treatment Processes CEL212 Environmental Engineering (2 nd Semester 2010-2011) Dr. Arun Kumar (arunku@civil.iitd.ac.in) Department of Civil Engineering Indian Institute of Technology (Delhi)
2017 Annual Performance Report
 Newcastle Water Pollution Control Plant The Regional Municipality of Durham Newcastle Water Pollution Control Plant Environmental Compliance Approval (ECA): 3-2189-87-946 Dated July 26, 1994 Amendments:
EVALUATING ALTERNATIVES FOR DISPOSING OF WATER PLANT SOLIDS INTO A WASTEWATER PLANT
 EVALUATING ALTERNATIVES FOR DISPOSING OF WATER PLANT SOLIDS INTO A WASTEWATER PLANT Matthew Valade, P.E. July 25, 2014 Barboe.pptx Presentation Outline Project Background Why Dewater Croton Residuals Offsite?
Wastewater treatment objecives
 Wastewater treatment objecives Removal of suspended and floatable materials Degradation of biodegradable organics Removal of nutrients Elimination of priority pollutants Elimination of pathogenic organisms
Startup and Performance of the World s first Large Scale Primary Dissolved Air Floatation Clarifier ABSTRACT KEYWORDS INTRODUCTION
 Startup and Performance of the World s first Large Scale Primary Dissolved Air Floatation Clarifier Bruce R. Johnson 1 *, Jennifer Phillips 2, Tim Bauer 3, Greg Smith 4, George Smith 5, John Sherlock 6
City of Staples, Minnesota
 Wastewater Treatment Facility Plan November 2012 City of Staples, Minnesota Bolton & Menk kproject No. W13.104619 104619 TABLE OF CONTENTS SECTION 1 INTRODUCTION... 1-1 A. Purpose... 1-1 B. Background...
City of Loveland Nutrient Removal Evaluation Final Report
 City of Loveland Nutrient Removal Evaluation Final Report Prepared for Prepared by March 28, 2014 Table of Contents Executive Summary... ES 1 Introduction... ES 1 Process Modeling of Nutrient Removal
EXECUTIVE SUMMARY A. INTRODUCTION B. FINDINGS AND CONCLUSIONS. 1. Conveyance System
 EXECUTIVE SUMMARY A. INTRODUCTION NACA has committed to planning, designing and constructing regional wastewater conveyance and treatment facilities to serve several municipalities in Northwest Arkansas.
Application of the AGF (Anoxic Gas Flotation) Process
 Process") Application of the AGF (Anoxic Gas Flotation) Process Dennis A. Burke Environmental Energy Company, 6007 Hill Road NE, Olympia, WA 98516 USA (E-mail: dennis@makingenergy.com http//www.makingenergy.com)
Application of the AGF (Anoxic Gas Flotation) Process Dennis A. Burke Environmental Energy Company, 6007 Hill Road NE, Olympia, WA 98516 USA (E-mail: dennis@makingenergy.com http//www.makingenergy.com)
CHAPTER 2.0 EXISTING FACILITIES
 CHAPTER 2.0 EXISTING FACILITIES CHAPTER 2 EXISTING FACILITIES 2.1 HISTORY OF LANCASTER WATER RECLAMATION PLANT District No. 14 was formed in 1938 and the discharge of treated effluent to Amargosa Creek
SIMPLE and FLEXIBLE ENERGY SAVINGS And PERFORMANCE ENHANCEMENT for OXIDATION DITCH UPGRADES
 SIMPLE and FLEXIBLE ENERGY SAVINGS And PERFORMANCE ENHANCEMENT for OXIDATION DITCH UPGRADES Oxidation ditches are very popular wastewater treatment processes for small to medium sized municipalities that
American Water College 2010
 Vocabulary Activated Sludge (Part 1) Activated Sludge Sludge particles produced in raw or settled wastewater (primary effluent) by the growth of organisms (including zoogleal bacteria) in aeration tanks
Conceptual Design for a Future Wastewater Treatment Plant
 Wastewater Master Plan DWSD Project No. CS-1314 Conceptual Design for a Future Wastewater Treatment Plant Technical Memorandum Original Date: April 1, 2003 Revision Date: September 2003 Author: CDM Table
Chapter 5: Treatment Assessment Future Condition
 2020 Facilities Plan Treatment Report 5.1 Introduction Chapter 5: Treatment Assessment Future Condition The future performance of the Milwaukee Metropolitan Sewerage District (MMSD) wastewater treatment
Table of Contents TABLE OF CONTENTS... II LIST OF FIGURES... V LIST OF TABLES... VI EXECUTIVE SUMMARY... VII 1.0 INTRODUCTION... 1
 Master Plan Table of Contents TABLE OF CONTENTS... II LIST OF FIGURES... V LIST OF TABLES... VI EXECUTIVE SUMMARY... VII 1.0 INTRODUCTION... 1 1.1 BACKGROUND... 1 1.2 PURPOSE AND SCOPE... 1 1.3 ABBREVIATIONS
COLD WEATHER NITRIFICATION OF LAGOON EFFLUENT USING A MOVING BED BIOFILM REACTOR (MBBR) TREATMENT PROCESS
 TREATMENT PROCESS") ABSTRACT COLD WEATHER NITRIFICATION OF LAGOON EFFLUENT USING A MOVING BED BIOFILM REACTOR (MBBR) TREATMENT PROCESS Mr. Flemming G. Wessman 1 and Mr. Chandler H. Johnson 1 AnoxKaldnes, Inc., 58 Weybosset
ABSTRACT COLD WEATHER NITRIFICATION OF LAGOON EFFLUENT USING A MOVING BED BIOFILM REACTOR (MBBR) TREATMENT PROCESS Mr. Flemming G. Wessman 1 and Mr. Chandler H. Johnson 1 AnoxKaldnes, Inc., 58 Weybosset
Biological Phosphorus Removal Technology. Presented by: Eugene Laschinger, P.E.
 Biological Phosphorus Removal Technology Presented by: Eugene Laschinger, P.E. Overview What is phosphorus and why do we care? How can you remove phosphorus? Biological phosphorus removal Biological phosphorus
Wastewater Facility Plan City of Marshall, Minnesota
 Wastewater Facility Plan City of Marshall, Minnesota Public Hearing March 14, 2017 Bolton & Menk, Inc. Project No. T22.108560 Glossary of General Terms & Abbreviations MPCA - Minnesota Pollution Control
Georgia Power Plant McDonough-Atkinson NPDES Permit No. GA Ash Pond Dewatering Plan. Revised May 2018
 Georgia Power Plant McDonough-Atkinson NPDES Permit No. GA0001431 Revised May 2018 Purpose This updated (Plan) describes the additional procedures, safeguards and enhanced wastewater treatment measures
Presentation Outline
 Presentation Outline Nitrification/denitrification refresher Treatment technologies available for nitrification and BNR/ENR What is the problem? BNR/ENR VPDES permitting Causes of reduced BNR performance
Operation and Control of Multiple BNR Processes in One WWTP
 Operation and Control of Multiple BNR Processes in One WWTP CENTRAL PLANT Williamsport Sanitary Authority s Chesapeake Bay and CSO Compliance Program Presented by: Phil Anderson 1 June 24, 2015 Purpose
UPGRADING FOR TOTAL NITROGEN REMOVAL WITH A POROUS MEDIA IFAS SYSTEM
 UPGRADING FOR TOTAL NITROGEN REMOVAL WITH A POROUS MEDIA IFAS SYSTEM T. Masterson, J. Federico, G. Hedman, S. Duerr BETA Group, Inc. 6 Blackstone Valley Place Lincoln, Rhode Island 02865 ABSTRACT The Westerly,
~~~~ WWTP Master Plan Project
 ~~~~ WWTP Master Plan Project City Council - April 7, 2014 WWTP History and Issues Constructed in 1994 Aging mechanical equipment - Frequent equipment failures - Resulted in TCEQ permit violations - High
Lowering The Total Cost Of Operation
 Lowering The Total Cost Of Operation The system removes more solids than conventional clarification, so filters can run longer between backwash cycles. Fewer backwash cycles means less backwash water,
Environmental Improvements Associated with Springfield WWTP EHRT. Using the Compressed Media Filter Technology
 Environmental Improvements Associated with Springfield WWTP EHRT Tuesday, June 23 9:30 am Using the Compressed Media Filter Technology WWETCO WWETCO FlexFilter ENGINEERS CLUB OF ST. LOUIS Performance Testing
Georgia Power Plant Bowen NPDES Permit No. GA Ash Pond Dewatering Plan. Revised December 2017
 Georgia Power Plant Bowen NPDES Permit No. GA0001449 Revised December 2017 Purpose This (Plan) describes the additional procedures, safeguards and enhanced wastewater treatment measures that Georgia Power
RE ENGINEERING O&M PRACTICES TO GET NITROGEN & PHOSPHORUS REMOVAL WITHOUT FACILITY UPGRADES
 RE ENGINEERING O&M PRACTICES TO GET NITROGEN & PHOSPHORUS REMOVAL WITHOUT FACILITY UPGRADES GRANT WEAVER, PE & WASTEWATER OPERATOR WISCONSIN WASTEWATER OPERATORS ASSOCIATION WISCONSIN DELLS, WI OCTOBER
WWTP Side Stream Treatment of Nutrients Considerations for City of Raleigh s Bioenergy Recovery Project. Erika L. Bailey, PE, City of Raleigh
 WWTP Side Stream Treatment of Nutrients Considerations for City of Raleigh s Bioenergy Recovery Project Erika L. Bailey, PE, City of Raleigh LNBA / NRCA 2017 Wastewater Treatment Plant Operators Training
CHAPTER 7. WASTEWATER TREATMENT ALTERNATIVES
 CHAPTER 7. WASTEWATER TREATMENT ALTERNATIVES This chapter summarizes wastewater treatment (including liquid process, disinfection, and solids handling), provides a technical evaluation of the alternative
MUNICIPALITY OF WEST ELGIN RODNEY WASTEWATER TREATMENT PLANT
 MUNICIPALITY OF WEST ELGIN RODNEY WASTEWATER TREATMENT PLANT 214 ANNUAL REPORT uary 1 to ember 31, 214 Environmental Compliance Approval # 3-871-88-949 Prepared by: Table of Contents Section 1: Overview...
Harrisburg Advanced Wastewater Treatment Facility Biosolids Facilities Improvement Plan Existing Conditions Report. February 2017
 Harrisburg Advanced Wastewater Treatment Facility Biosolids Facilities Improvement Plan Existing Conditions Report February 2017 Harrisburg Advanced Wastewater Treatment Facility Biosolids Facilities Improvement