Understanding the Trade-off: Environmental Costs and Benefits of Industrial Wind Energy Development (with Focus on Eastern US)
|
|
|
- Gary Waters
- 6 years ago
- Views:
Transcription


1 Understanding the Trade-off: Environmental Costs and Benefits of Industrial Wind Energy Development (with Focus on Eastern US) Dan Boone & Rick Webb Virginia Wind Special Session on Bats and Wind Turbines th North American Symposium on Bat Research, Scranton, PA October 24, 2008


2 Wishful thinking?
3
 Appalachian mountain")
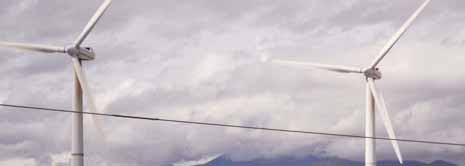
4 Mountaineer Wind Energy Center, Tucker County, WV - top of wind turbine rotor is 105 meters above ground (~350 feet) Appalachian mountain ridges
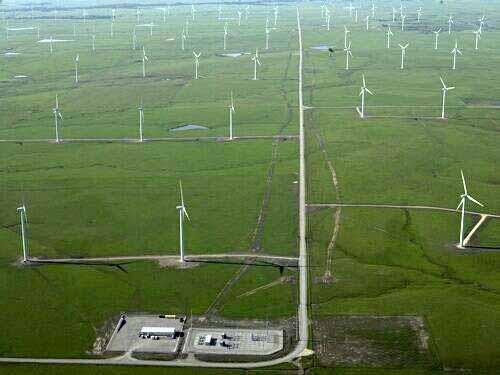
5 Density of Onshore Wind Energy Resource Among U.S. States About 93% of potential U.S. wind energy capacity is located west of the Mississippi River. kw per km >4000 Environmental Impacts of Wind Energy Projects, National Research Council, 2007

6 U.S. Wind Energy Projects (As of 09/30/2008) National Total Power Capacities (MW) Existing 21,017 Under Construction 8,383 Source: (accessed 21 Oct 2008)
 IS DUE TO POWER PLANTS ftp://ftp.eia.doe.")
7 Sources of Total GHG Emissions in the United States by Sector, in CO2 Equivalent Note: Excludes emissions from U.S. territories. Source: US DOE, EIA ONLY 35% OF THE U.S. TOTAL EMISSIONS OF GREEN HOUSE GASES (GHG) IS DUE TO POWER PLANTS ftp://ftp.eia.doe.gov/pub/oiaf/1605/cdrom/pdf/ggrpt/ pdf


")
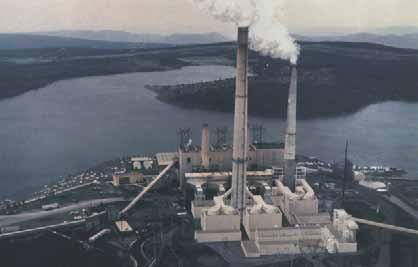
8 Mount Storm is a 1,662 MW facility operating at an 80% capacity factor To generate the same annual energy yield as this one coal-fired power plant with 2 MW turbines, there would need to be: 2,200 turbines operating at 30% annual capacity factor. However, at least 4,400 2-MW wind turbines would be needed to equal the Mount Storm facility s summer-time output due to low wind conditions during the 3 months when demand for electricity is highest (i.e., wind turbines operate on average with a 15% capacity factor in summer)
9 Inverse temporal relationship between wind power and electricity demand in the Mid-Appalachian states 10% maximum electricity demand 50% Percent of Annual Demand 9% 9% 8% 40% 30% 20% wind capacity factor 7% JAN FEB MAR APR MAY JUN JUL AUG SEP OCT NOV DEC 10% monthly electricity use in 2004 wind power capacity factor Data for electricity sales and generation from U.S. Energy Information Agency, cited in Environmental Impacts of Wind Energy Projects, National Research Council, 2007

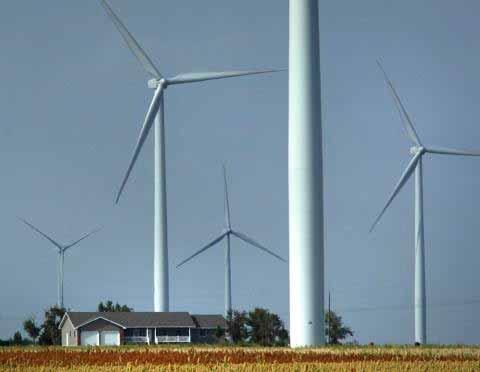
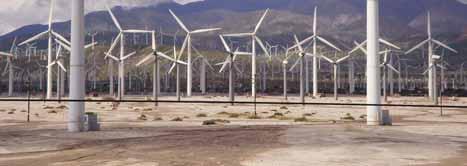
10 The diffuse nature of the wind resource Wind projects in the Appalachian Mountains are typically built in strings of about seven turbines per mile along ridgelines MW turbines would be required each year just to match West Virginia s projected growth in electricity generation This would require about 30 miles of ridgeline development per year See:

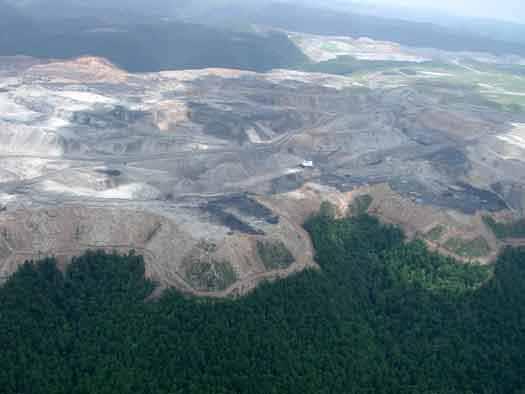
11 Environmental Benefits Reduced CO2 emissions Energy independence Improvements in air quality Reduced use of coal Obviate need for new conventional power plants Environmental Concerns Direct wildlife mortality esp. bats Indirect wildlife impacts e.g.,displacement and noise effects Habitat Loss and Fragmentation Impact upon Public Lands Aesthetic Impacts Opportunity Loss (usurps more effective and less impactful options)
12 Environmental Benefits? Energy supply Energy independence Reduced use of coal Air quality improvement SO2 and NOx CO2


13 Environmental Benefits? Energy supply Energy independence Reduced use of coal Air quality improvement SO2 and NOx CO2 The choice... is not between windmills and untouched nature. It's between windmills and the destruction of the planet's biology on a scale we can barely begin to imagine. Bill McKibben, Orion, 2003 Which takes us to the real questions: what are we actually getting for the tradeoff? can Appalachian wind development make a real difference? or is this just wishful thinking - that diverts our attention from real solutions?
14 Environmental Benefits? Percentages of U.S. electricity generation by generator type Energy supply Energy independence Reduced use of coal oil 3% renewables 9% 16% gas Air quality improvement SO2 and NOx CO2 52% 20% coal nuclear Very little oil is used for generating electricity Data from U.S. Environmental Protection Agency, cited in Environmental Impacts of Wind Energy Projects, National Research Council, 2007
15 Environmental Benefits? Projected Net Growth in U.S. Electricity Generation: Energy supply Energy independence Reduced use of coal Air quality improvement SO2 and NOx CO2 Billions of kwhs Total Generation Wind Generation Wind generation is projected to account for up to 19% of net growth in total generation. Sources other than wind will be required for the other 81%. Department of Energy projections cited in Environmental Impacts of Wind Energy Projects, National Research Council, 2007

16 G I G A W A T T S (GW) Future reliance on coal and other fossil-fuels to generate electricity in U.S. projected to dramatically increase according to National Renewable Energy Laboratory Wind turbines to provide <10% by 2050 Projected electricity generation capacity for the U.S. by different generator types. Actual generation depends on amount of capacity, as indicated by the thickness of the section of the graph, and on annual capacity factor (effective yield) of each generation source. Due to wind intermittency, the annual capacity factor for wind energy projects is only about 30% - much less than for other utility-scale electricity generator types. (The graphic is from the National Renewable Energy Laboratory, DOE: ) NOTE: 1,000 MW = 1 GW & 1,000 kw = 1 MW
17 Environmental Benefits? Projected U.S. CO2 emissions from electricity generation units and potential offset provided by projected wind energy development Energy supply Energy independence Reduced use of coal Air quality improvement SO2 and NOx CO2 Billion Tons Per Year Potential Offset Associated with Upper Estimate for Wind Energy Development 0.7% 1.8% 2.9% 4.5% Potential Offset Fossil-fuel-fired generating units account for less than 40% of U.S. CO2 emissions. The potential offset provided by onshore wind energy development is thus less than 2.25%. Projections cited in Environmental Impacts of Wind Energy Projects, National Research Council, 2007
18 Environmental Benefits? Observed and Projected Electricity Generation and Emissions for Fossil-Fuel Electrical Generating Units in the U.S. Energy supply Electricity generation SO 2 emissions NO x emissions Energy independence Reduced use of coal Air quality improvement SO2 and NOx CO2 Million MWh Millions of Tons In the context of a cap and trade program there is limited opportunity to achieve emission reductions through wind energy development. From Environmental Impacts of Wind Energy Projects, National Research Council, 2007

19 Less than 5% of nation s developable wind energy potential occurs on uplands east of Mississippi River Wind energy potential in the United States. Areas with Wind Power Class 3 and above are considered economical to develop. Most of the inland wind potential is in the Midwest. Areas with high wind potential on the mountain ridges are narrow lines that don t show up well at this map scale. (From National Renewable Energy Laboratory, DOE:

20 2005 Electricity Generation by State according to Fuel Source Source: egrid2007 Version 1.0 Year 2005 data, (created Sept 2008)


21 States regulated by EPA under the Clean Air Interstate Rule The final Clean Air Interstate Rule (CAIR) covers 28 eastern states and DC. Air emissions in these states contribute to unhealthy levels of groundlevel ozone, fine particles or both in downwind states.
 programs SOURCE: http://cleanairinfo.")
22 Projected Non-attainment Areas in 2010 & 2015 after reductions from Clean Air Interstate Rule (CAIR) and existing Clean Air Act (CAA) programs SOURCE: sentations/pm2_5_damberg.pdf
23 CAP&TRADE PROGRAMS MAKE SO2 AND NOx A ZERO-SUM GAME Any reduction in SO2 and NOx emissions associated with development of wind energy will occur against a background of substantial emission reductions obtained through the Clean Air Act and other regulatory programs. Examination of U.S. emissions data for indicates that emissions of SO2 from electrical generating units declined 37% while emissions of NOx from power plants declined by 9%.* Current regulatory programs mandate either national or regional caps on emissions of SO2 and NOx from power plants, and additional reductions of both pollutants are scheduled even though demand for electricity is projected to increase (e.g., Clean Air Interstate Rule). However, any offset of emissions from those fossil-fueled power plants whose generation would be displaced by wind turbines output likely results in the affected power plant owners selling or trading to other power plants their unused pollution allowances (which are doled out by EPA under auspices of Cap & Trade programs of the Clean Air Act) or they also could decide to burn cheaper but dirtier fuels (e.g., higher sulfur coal).** A ZERO-SUM GAME! See: * and ** &


24 Environmental Concerns Direct wildlife mortality esp. bats Indirect wildlife impacts e.g.,displacement and noise effects Habitat Loss and Fragmentation Photos by Ed Arnett, Bat Conservation International Shell/NedPower Windplant Mount Storm, WV Sept. 29, 2008 See also:


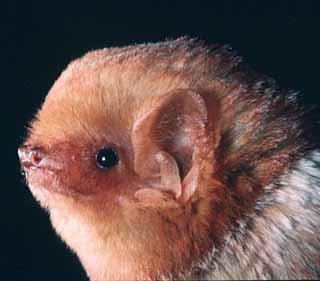
25 Up to 4,000 birds and bats were killed in collisions with 44 wind turbines in WV during 2003 Photos of bats by Merlin Tuttle, Bat Conservation International

26 Bat experts recently estimated that over 110,000 bats may be killed per year if less than 4,000 MW of industrial wind turbines are installed within the Mid-Atlantic Highlands Region Source:
27 Projections of Cumulative Annual Bat Mortality Resulting From Various Future Wind Energy Development Scenarios In the Eastern United States 1,200,000 1,000,000 1,004,500 Estimated Annual Mortality 800, , , , , ,600 1 East Coast States include New England, NY, PA, WV, MD, VA, TN & NC 2 Mid-Atlantic Highlands include non-coastal portions of PA, WV, MD and VA 3 estimate range from Kunz et al. 2007; see: 200, , ,365 67,801 36,145 Existing & under construction - East Coast states 1 (2,362 MW) Existing + Under review now - Mid- Atl. Highlands 2 (8,782 MW) Existing + Under review now - East Coast states 1 (22,000 MW) Projected via 20% by 2030 report - East Coast states 1 (35,000 MW on Source: see A Source: see B Source: see C land) Source: see D Minimum mortality estimate bats killed per MW per year3 3 Upper mortality estimate bats killed per MW per year Sources for MW estimates: A - B - C - see generator interconnection queues for PJM, NY-ISO and ISO-NE (checked Oct. 23, 2008) D (extrapolated from Fig. 1-8)

28 Source: Fig. 1-8 in: Future projection from the July 2008 report entitled 20% Wind Energy by 2030 by USDOE NREL & AWEA

29 Annual and cumulative wind installations in the US by 2030 The July 2008 report from USDOE NREL & AWEA entitled 20% Wind Energy by 2030 projects that U.S. wind power capacity needs to grow from 11.6 GW in 2006 to more than 300 GW over the next 23 years.?? The 20% Wind Scenario would require an installation rate of 16 GW per year after 2018 Source: Fig. 1-4 in: ,454 MW of wind turbines installed within USA ,249 MW of wind turbines installed 2008 projection of 7,500 MW of wind turbines installed Sources: & &

30 Projected cumulative installed wind power capacity to supply 20% of the US electricity demand by 2030 Future projection from the July 2008 report entitled 20% Wind Energy by 2030 by USDOE NREL & AWEA Source: Fig. 1-7 in:


31 Forest Fragmentation 3-5 acres cleared and acres of interior forest lost per turbine* Mountaineer - WV Meyersdale - PA *
32 Projections of Cumulative Forest Habitat Loss Resulting From Various Future Wind Energy Development Scenarios In the Eastern United States Square mile = 640 acres Estimated Number of Square Miles of Forest Loss 1 East Coast States include New England, NY, PA, WV, MD, VA, TN & NC 2 Mid-Atlantic Highlands include non-coastal portions of PA, WV, MD and VA 3 estimate range based on GIS analysis of existing wind projects (total forest loss / # turbines) - see: geography/wildlife&windconf/ Speaker_Presentations/Boone_GIS.pdf Existing & under Existing + Under Existing + Under Projected via 20% by construction - East review now - Mid-Atl. review now - East 2030 report - East Coast states (~1,200 Highlands (~4,400 Coast states (11,000 Coast states (17,500 turbines) turbines) turbines) turbines on land) Source: see A Source: see B Source: see C Source: see D Lower estimate - 2 acres lost on average per turbine3 3 Upper estimate - 5 acres lost on average per turbine Sources for # turbine estimates: A - B - C - see generator interconnection queues for PJM, NY-ISO and ISO-NE (checked Oct. 23, 2008) D - (extrapolated from Fig. 1-8). All scenarios assume turbines = 2MW
33 Projections of Cumulative Forest Interior Habitat Loss Resulting From Various Future Wind Energy Development Scenarios In the Eastern United States Forest interior occurs >100 m from edge of non-forest area or a linear break of canopy that is >30 feet in width Square mile = 640 acres Estimated Number of Square Miles of Forest Interior Loss 1 East Coast States include New England, NY, PA, WV, MD, VA, TN & NC 2 Mid-Atlantic Highlands include non-coastal portions of PA, WV, MD and VA 3 estimate range based on GIS analysis of existing wind projects (total forest loss / # turbines) - see: geography/wildlife&windconf/ Speaker_Presentations/Boone_GIS.pdf Existing & under construction - East Coast states 1(~1,200 turbines) Existing + Under review now - Mid-Atl. Highlands 2(~4,400 turbines) Existing + Under review now - East Coast states 1(11,000 turbines) Projected via 20% by 2030 report - East Coast states 1(17,500 turbines on land) Source: see A Source: see B Source: see C Source: see D Lower estimate - 10 acres lost on average per turbine Upper estimate - 20 acres lost on average per turbine Sources for # turbine estimates: A - B - C - see generator interconnection queues for PJM, NY-ISO and ISO-NE (checked Oct. 23, 2008) D - (extrapolated from Fig. 1-8). All scenarios assume turbines = 2MW

 by at least a one-mile radius (Robel et al., 2004).")
.")
34 Greater Prairie-chicken range map Greater Prairie-chicken Photo:Christopher Taylor Lesser Prairie-chicken range map The behavioral response of the Greater Prairie-chicken is similar to that of the Lesser Prairie-chicken, and it is predicted that nesting and brood-rearing hens of both species will avoid large wind turbines (1.5 MW models; 350 feet tall) by at least a one-mile radius (Robel et al., 2004). In its Briefing Paper regarding prairie grouse leks and wind turbines, the U.S. Fish and Wildlife Service recommends a five-mile buffer between occupied prairie grouse leks and wind power facilities (Manville, 2004). Source: Position of the Kansas Department of Wildlife and Parks Regarding Wind Power and Wildlife Issues -
35 Summary... wind energy development on central Appalachian ridges carries great risk of environmental harm and very little potential for benefits. 1. The wind energy capacity of the central Appalachian region is substantially less than in other regions of the U.S. 2. The areas with sufficient wind for commercial projects are the ecologically fragile areas that represent our remnant wild landscape. 3. Wind energy development in the region cannot make a significant contribution to solving our energy and environmental problems. 4. Promotion of wind energy development in the region hinders our ability to achieve real solutions for real problems.


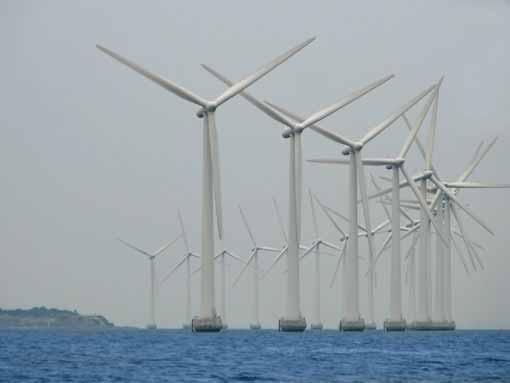
36 Offshore wind areas in Mid-Atlantic Region have far greater development potential than uplands SOURCE: Bruce Bailey -


37 Golden Eagle in Highland County, Virginia
PJM EIS Generation Attribute Tracking System (GATS)
") PJM EIS Generation Attribute Tracking System (GATS) Presented to NASEO 2015 Mid-Atlantic Regional Meeting June 22, 2015 Who is PJM EIS? PJM Environmental Information Services, Inc. Formed in February 2005
PJM EIS Generation Attribute Tracking System (GATS) Presented to NASEO 2015 Mid-Atlantic Regional Meeting June 22, 2015 Who is PJM EIS? PJM Environmental Information Services, Inc. Formed in February 2005
U.S. DEPARTMENT OF THE INTERIOR FISH AND WILDLIFE SERVICE OKLAHOMA ECOLOGICAL SERVICES FIELD OFFICE
 U.S. DEPARTMENT OF THE INTERIOR FISH AND WILDLIFE SERVICE OKLAHOMA ECOLOGICAL SERVICES FIELD OFFICE May 11, 2009 STANDARD RECOMMENDATIONS TO AVOID, MINIMIZE AND MITIGATE POTENTIAL IMPACTS OF WIND ENERGY
Transmission Planning at the Midwest ISO. Mr. Eric Laverty Senior Manager of Transmission Access Planning Midwest ISO June 26 th, 2008
 Transmission Planning at the Midwest ISO Mr. Eric Laverty Senior Manager of Transmission Access Planning Midwest ISO June 26 th, 2008 Midwest ISO: What We Do Monitor flow of power over the high voltage
The Future of Renewable Energy and Other Energy. By Peter Barth CH2M HILL Pittsburgh, PA
 The Future of Renewable Energy and Other Energy Sources By Peter Barth CH2M HILL Pittsburgh, PA Agenda EIA and PJM Energy Forecasts Shale Gas A Game Changer Renewable Energy Challenges Do State Renewable
Electric Forward Market Report
 Mar-01 Mar-02 Jun-02 Sep-02 Dec-02 Mar-03 Jun-03 Sep-03 Dec-03 Mar-04 Jun-04 Sep-04 Dec-04 Mar-05 May-05 Aug-05 Nov-05 Feb-06 Jun-06 Sep-06 Dec-06 Mar-07 Jun-07 Sep-07 Dec-07 Apr-08 Jun-08 Sep-08 Dec-08
CSAPR & MATS: What Do They Mean for Electric Power Plants?
 CSAPR & MATS: What Do They Mean for Electric Power Plants? 15 th Annual Energy, Utility, and Environment Conference (EUEC 2012) Phoenix, AZ January 31,2012 Amlan Saha +1 978 405 1263 asaha@mjbradley.com
Climate Change and Renewable Energy
 Insert Your Image Here Insert Image Credit Climate Change and Renewable Energy Jimmie Powell Covanta February 11, 2009 The Nature Conservancy The mission of The Nature Conservancy is to preserve plants,
Planned & implemented wind energy projects in Greece in protected areas Challenges & successes
 Seminar on Good Practices for Reconciling Wind Energy Development and Biodiversity Conservation, Ministry of Environment & Energy Planned & implemented wind energy projects in Greece in protected areas
New Jersey Natural Gas Market Update
 March 25, 2015 Mullica Hill, NJ New Jersey Natural Gas Market Update Presentation to: SNJDC Natural Gas Seminar Tom Kiley Northeast Gas Association Issues Regional Market Developments New Jersey Gas Market
NCSL Utility Business Model Session
 NCSL Utility Business Model Session Electric utility service has three components: generation, transmission, and distribution 2 Natural gas utility service has transmission and distribution components
ESCI-61 Introduction to Photovoltaic Technology
 April 7, 2010 1 ESCI-61 Introduction to Photovoltaic Technology Lecture #1 Ridha Hamidi, Ph.D. April 7, 2010 2 Today s Agenda 3:30-4:00 - Green sheet review and introductions 4:00-4:45 - Group Research
Fueling the Future with Natural Gas: Bringing It Home
 NCSL Energy Policy Summit Minneapolis, MN August 19, 2014 Fueling the Future with Natural Gas: Bringing It Home Kathryn Clay, Ph.D. Vice President, Policy Strategy American Gas Association Shale Gas Resources
CHP Case Studies. Midwest CHP Application Center (MAC) .org (312) University of Illinois at Chicago Energy Resources Center UIC
 .org (312) University of Illinois at Chicago Energy Resources Center UIC") CHP Case Studies Midwest CHP Application Center (MAC) www.chpcentermw.org.org (312)413-5448 University of Illinois at Chicago Energy Resources Center CHP Case Studies Elgin Community College Presbyterian
CHP Case Studies Midwest CHP Application Center (MAC) www.chpcentermw.org.org (312)413-5448 University of Illinois at Chicago Energy Resources Center CHP Case Studies Elgin Community College Presbyterian
CHP Economic Factors: Electric and Natural Gas Market Trends PREPARED BY: PREPARED FOR: DATE:
 CHP Economic Factors: Electric and Natural Gas Market Trends PREPARED BY: PREPARED FOR: DATE: Daniel Peaco, Principal Consultant Efficiency Maine Combined Heat & Power Conference SEPTEMBER 29, 2016 Discussion
Wind Energy: Opportunities and Challenges for Offshore Applications. Presentation Outline
 Wind Energy: Opportunities and Challenges for Offshore Applications Presentation to IEEE Richmond Section 07 September 2006 Saifur Rahman George Hagerman Manisa Pipattanasomporn VT Advanced Research Institute
Reducing Peak Energy Demand: The Hidden Benefit of Cool Roofs
 Reducing Peak Energy Demand: The Hidden Benefit of Cool Roofs Dr. James L. Hoff, DBA, TEGNOS Research, Inc., Keith Gere and Robert Carnick, Duro-Last Inc. November 11, 2014 MW Peak Energy Demand 30,000
Section 3 Characteristics of Credits Types of units. Economic Noneconomic Generation.
 Section 3 Operating Reserve Operating Reserve Day-ahead and real-time operating reserve credits are paid to market participants under specified conditions in order to ensure that resources are not required
Comparison of Renewable Portfolio Standards (RPS) Programs in PJM States
 Programs in PJM States") Regulation or Legislation Geographic Eligibility Reporting Period Banking Credit Multipliers Technology - Specific (set asides) NJ MD DC PA DE HB 1308 / SB 869 (2004) Bill 15-747 (4/12/2005) SB 1030/Act
Regulation or Legislation Geographic Eligibility Reporting Period Banking Credit Multipliers Technology - Specific (set asides) NJ MD DC PA DE HB 1308 / SB 869 (2004) Bill 15-747 (4/12/2005) SB 1030/Act
Electricity Supply. Monthly Energy Grid Output by Fuel Type (MWh)
") For the first quarter of 2015, Ontario experienced overall demand that was typical for the province in winter, and strong generator output. Demand for Ontario electricity increased as a result of cold
For the first quarter of 2015, Ontario experienced overall demand that was typical for the province in winter, and strong generator output. Demand for Ontario electricity increased as a result of cold
Marc de Croisset FBR CAPITAL MARKETS & CO. Coal-to-Gas Switching: Distilling the Issue
 Marc de Croisset. 646.885.5423. mdecroisset@fbr.com FBR CAPITAL MARKETS & CO. Coal-to-Gas Switching: Distilling the Issue September 20, 2012 Disclosures Important disclosures can be found at the end of
Solar Power Realities
 Solar Power Realities Supply-Demand Characteristics, Storage and Capital Costs by Peter Lang Abstract This paper provides a simple analysis of the capital cost of solar power and energy storage sufficient
2006 Sulfur Dioxide Summary
 2006 Sulfur Dioxide Summary New Jersey Department of Environmental Protection NATURE AND SOURCES Sulfur dioxide (SO 2 ) is a heavy, colorless gas with a suffocating odor that easily dissolves in water
Overview EPA s Proposed Clean Power Plan and Impacts for Louisiana
 Overview EPA s Proposed Clean Power Plan and Impacts for Louisiana Clean Cities Coalition Meeting November 5, 2014 David E. Dismukes, Ph.D. Center for Energy Studies Louisiana State University CAVEAT:
Coal, Carbon, and the Future of the Global Energy Mix
 Coal, Carbon, and the Future of the Global Energy Mix By Richard Morse Woods Institute Energy Seminar March 4, 2009 Agenda 1. Background 2. Fundamentals of the Global Trade 3. Coal in the West: Impact
Understanding the NAAQS and the Designation Process
 Understanding the NAAQS and the Designation Process Shawn Seals Senior Environmental Manager Office of Air Quality Indiana Department of Environmental Management (IDEM) September 21, 2016 1 Presentation
Oil and natural gas: market outlook and drivers
 Oil and natural gas: market outlook and drivers for American Foundry Society May 18, 216 Washington, DC by Howard Gruenspecht, Deputy Administrator U.S. Energy Information Administration Independent Statistics
For Bandon Utilities Commission
 For Bandon Utilities Commission July 12, 2017 Profile BPA, a component of the U.S. Department of Energy, is a non-profit and self-funded power marketing administration in the Pacific Northwest. Congress
IRP 101. Intro to Integrated Resource Planning. Scott Benson Manager, Resource & Transmission Planning. March 23, 2017
 IRP 101 Intro to Integrated Resource Planning Scott Benson Manager, Resource & Transmission Planning March 23, 2017 1 What is an IRP? Definition Integrated resource planning is a process by which a power
The Future of Greenhouse Gas Emissions Trading in North America
 The Future of Greenhouse Gas Emissions Trading in North America 14 th IEA-IETA-EPRI Annual Workshop on Greenhouse Gas Emission Trading Thursday October 9, 2014 Agenda California s AB 32 and Cap-and-Trade
Schedule 2 TECHNICAL INFORMATION
 Schedule 2 TECHNICAL INFORMATION This document is intended to provide context to the Haida Gwaii Request for Expressions of Interest (RFEOI) for the potential electricity supply opportunity for clean electricity
Assessing the Impact of the Diffusion of Shale Oil and Gas Technology on the Global Coal Market
 Assessing the Impact of the Diffusion of Shale Oil and Gas Technology on the Global Coal Market Frank A. Wolak Program on Energy and Sustainable Development (PESD) and Department of Economics Stanford
Renewable Energy in The Netherlands
 Renewable Energy in The Netherlands Dr. Martien Visser Professor Energy Transition & Network Integration Hanze University of Applied Sciences Groningen Partner of the Energy Academy Europe E-mail: b.m.visser@pl.hanze.nl
SURFACE WATER WITHDRAWALS & LOW FLOW PROTECTION POLICY MICHAEL COLLEGE, P.E. SUSQUEHANNA RIVER BASIN COMMISSION
 SURFACE WATER WITHDRAWALS & LOW FLOW PROTECTION POLICY MICHAEL COLLEGE, P.E. SUSQUEHANNA RIVER BASIN COMMISSION SCENARIOS Direct withdrawal from surface water (SW): PA MOU w/padep NY MOU w/nysdec MD No
Understanding the Scale of the Problem: US Energy Sources and CO2 Emissions
 Understanding the Scale of the Problem: US Energy Sources and CO2 Emissions Pete Wilcoxen Departments of Economics and Public Administration The Maxwell School, Syracuse University BUA/ECS 650/EST 696
Discussion on the Threat of Electrification to Residential Natural Gas Demand
 Discussion on the Threat of Electrification to Residential Natural Gas Demand Prepared for the American Gas Association State Affairs Committee Tuesday, October 10 h, 2017 Mike Sloan Managing Director
New England Electricity Outlook
 O C T O B E R 2 1, 2 0 1 6 S O U T H P O R T L A N D, M E New England Electricity Outlook Environmental and Energy Technology Council of Maine (E2Tech) Eric Johnson D I R E C T O R, E X T E R N A L A F
" Equivalency Analysis (EA) method. ! Case Study: Smøla Wind Farm, Norway. 1. Illustrate EA in the case of WTE collisions with turbines
 method. ! Case Study: Smøla Wind Farm, Norway. 1. Illustrate EA in the case of WTE collisions with turbines") Ex post compensation for White-Tailed Eagle impacts at the Smøla Wind Farm: An application of Equivalency Analysis (EA) Scott Cole, Swedish Agricultural University Espen Lie Dahl, Norwegian Institute for
Ex post compensation for White-Tailed Eagle impacts at the Smøla Wind Farm: An application of Equivalency Analysis (EA) Scott Cole, Swedish Agricultural University Espen Lie Dahl, Norwegian Institute for
EVALUATION OF THE IMPACT OF SUB METERING ON MULTI RESIDENTIAL ELECTRICITY CONSUMPTION AND THE POTENTIAL ECONOMIC AND ENVIRONMENTAL IMPACT ON ONTARIO
 EVALUATION OF THE IMPACT OF SUB METERING ON MULTI RESIDENTIAL ELECTRICITY CONSUMPTION AND THE POTENTIAL ECONOMIC AND ENVIRONMENTAL IMPACT ON ONTARIO Prepared for: EnerCare Connections Inc. Navigant Consulting
HVDC Transmission and the Future of Clean Energy
 HVDC Transmission and the Future of Clean Energy Presented to Southern States Energy Board September 2012 Who is Clean Line Energy? Clean Line develops high voltage, long-haul transmission lines to connect
Pumped hydro Storage Plants
 Pumped hydro Storage Plants Olivier Teller, Product Director PSP 15 Nov 2012 PSP >130 GW (99% world electricity storage) Market: 6 GW/year Europe: ~1.5GW/year 100 years / illimited cycle numbers ~1000
Administration Division Public Works Department Anchorage: Performance. Value. Results.
 Administration Division Anchorage: Performance. Value. Results. Mission Provide administrative, budgetary, fiscal, and personnel support to ensure departmental compliance with Municipal policies and procedures,
WIND ENERGY GROUP 3 MEMBERS: ALEJANDRO ESPINOLA JUAN C. ENRIQUEZ LINDA ALAMILLO THOMAS BROWN BRUCE SAENZ
 WIND ENERGY GROUP 3 MEMBERS: ALEJANDRO ESPINOLA JUAN C. ENRIQUEZ LINDA ALAMILLO THOMAS BROWN BRUCE SAENZ Overview Problem statement Wind EnergyTechnologies Technical development Status in Renewable Energy
COST ANALYSIS OF RENEWABLE ENERGY FOR POWER SUPPLY FOR REMOTE AREA IN YEMEN : A CASE STUDY FOR SOCOTRA ISLAND
 COST ANALYSIS OF RENEWABLE ENERGY FOR POWER SUPPLY FOR REMOTE AREA IN YEMEN : A CASE STUDY FOR SOCOTRA ISLAND Saqqaf A. Alkaf, Mohammed A. Muqbel and Salem M. Bin Qadhi + Mechanical Engineering Department,
Potential Impacts of a Renewable and Energy Efficiency Portfolio Standard in Kentucky
 Potential Impacts of a Renewable and Energy Efficiency Portfolio Standard in Kentucky Prepared for the Mountain Association for Community Economic Development & the Kentucky Sustainable Energy Alliance
CBIA Energy Conference Natural Gas- Coming to Your Neighborhood Soon October 10, 2013 Cromwell, Connecticut Michael Dirrane Director, Northeast
 CBIA Energy Conference Natural Gas- Coming to Your Neighborhood Soon October 10, 2013 Cromwell, Connecticut Michael Dirrane Director, Northeast Marketing Spectra Energy U.S. Transmission Map Miles of Pipe
Wind Generation s Contribution to the Management of Average Cost and Cost Volatility for Indiana
 Wind Generation s Contribution to the Management of Average Cost and Cost Volatility for Indiana Marco Velástegui Douglas J. Gotham Paul V. Preckel David G. Nderitu Forrest D. Holland State Utility Forecasting
Impact of Regional Greenhouse Gas Initiative and Renewable Portfolio Standards on Power System Planning
 Impact of Regional Greenhouse Gas Initiative and Renewable Portfolio Standards on Power System Planning Panel on Impacts of GHG Programs and Markets on the Power Industry PESGM2006 Montreal June 21, 2006
An Energy Bill Proposal for the State of Colorado. BGE Consulting Angela Cook Erica Johnson Nick Goldstein Chris Bunch Jake Walter Kindra Priest
 An Energy Bill Proposal for the State of Colorado BGE Consulting Angela Cook Erica Johnson Nick Goldstein Chris Bunch Jake Walter Kindra Priest Introduction The following report contains a realistic balanced
ACID RAIN. CE 326 Principles of Environmental Engineering Prof. Tim Ellis January 22, 2007
 ACID RAIN CE 326 Principles of Environmental Engineering Prof. Tim Ellis January 22, 2007 More accurate term may be acid deposition Occurs in two forms wet deposition (acidic rain, fog, and snow) dry deposition
Carbon Free Islands in South Korea
 Carbon Free Islands in South Korea Dong Wook(Dylan) Kim Senior Manager LG CNS 17 th Oct. 2015 I. Activities and Policies in Korea II. Case Studies 1) Jeju Island 2) Ulleung Island 3) Jo & Geomun Islands
Framework Ecology and Cumulation
 Framework Ecology and Cumulation, Ministry of Infrastructure and Environment, Commissioned by: Ministry of Economic Affairs Why assessing cumulative effects of offshore wind farm development? Plans for
The OTC Emission Reduction Workbook 2.1: Description and User s Manual
 The OTC Emission Reduction Workbook 2.1: Description and User s Manual Prepared by: Geoff Keith, David White and Bruce Biewald Synapse Energy Economics 22 Pearl Street, Cambridge, MA 02139 www.synapse-energy.com
Nuclear Power Economics and Preservation. Presentation Prepared for NARUC Subcommittee on Accounting and Finance Michael Purdie March 29, 2017
 Nuclear Power Economics and Preservation Presentation Prepared for NARUC Subcommittee on Accounting and Finance Michael Purdie March 29, 2017 What is NEI? Our mission is, with member participation: - Develop
Cedar River Watershed Habitat Conservation Plan
 Cedar River Watershed Habitat Conservation Plan Briefing for the WRIA 8 Salmon Recovery Council November 21, 2013 Cyndy Holtz Seattle Public Utilities cyndy.holtz@seattle.gov What is an HCP? Habitat Conservation
Carbon Carbon economy: Energy Consumption Consumption in the United States,
 THE HYDROGEN ECONOMY (Harnessing wind energy) Ifejesu Eni olorunda Department of Chemical Engineering Aim of presentation Overview of current carbon economy Link hydrogen production with energy generation
Technical Supplement to Opening Statement April 28, 2016 Clean Air Council Hearing The Clean Power Plan: Impact on New Jersey
 Technical Supplement to Opening Statement April 28, 2016 Clean Air Council Hearing The Clean Power Plan: Impact on New Jersey Assistant Commissioner John Giordano, Esq. Air Quality, Energy and Sustainability
Hydrogen Applications for Small Islands
 Hydrogen Applications for Small Islands Dr. Ε. Ι. Ζoulias Head of RES & H2 Technologies Section Centre for Renewable Energy Sources & Saving Is Hydrogen a Hype? Reasons: Availability of fossil fuels Decrease
Atlantic Coast Pipeline: Economics and Manufacturing Jobs
 Atlantic Coast Pipeline: Economics and Manufacturing Jobs Prepared for the Natural Resources Defense Council Authors: Rachel Wilson Sagal Alisalad Emrat Nur Marzan Bryndis Woods December 5, 2017 Page 1
Distributed Generation Technologies A Global Perspective
 Distributed Generation Technologies A Global Perspective NSF Workshop on Sustainable Energy Systems Professor Saifur Rahman Director Alexandria Research Institute Virginia Tech November 2000 Nuclear Power
Outlook for Natural Gas Demand for Winter
 Outlook for Natural Gas Demand for 2010-2011 Winter Energy Ventures Analysis, Inc. (EVA) Overview Natural gas demand this winter is projected to be about 295 BCF, or 2.5 percent, above demand levels recorded
Capacity Revenues for Existing, Base Load Generation in the PJM Interconnection
 Capacity Revenues for Existing, Base Load Generation in the PJM Interconnection A Pennsylvania Case Study Prepared by: Paul Peterson, David White, and Bruce Biewald 22 Pearl Street, Cambridge, MA 02139
CAIR: A Journey Revisited Part II
 Portfolio Media, Inc. 648 Broadway, Suite 200 New York, NY 10012 www.law360.com Phone: +1 212 537 6331 Fax: +1 212 537 6371 customerservice@portfoliomedia.com CAIR: A Journey Revisited Part II Law360,
Missouri River Basin Water Management
 Missouri River Basin Water Management Spring 2011 Public Meetings April 12 th 11:00 a.m. Nebraska City, NE April 12 th 7:00 p.m. Fort Peck, MT April 13 th 1:00 p.m. Bismarck, ND April 13 th 7:00 p.m. Pierre,
A New Market for Energy Regulation: Advancing the Clean Energy Revolution
 A New Market for Energy Regulation: Advancing the Clean Energy Revolution NCSL Task Force on Energy Supply December 5, 2012 David W. Cash Commissioner Massachusetts Department of Public Utilities 1 The
Wind Workshop. Technical Characterization: Dependable Capacity & Firm Energy 10:00-10:30am
 Wind Workshop Technical Characterization: Dependable Capacity & Firm Energy 10:00-10:30am Objective of this session: Understand BC Hydro s definitions and calculation methodology of dependable capacity
A full description of the lesser prairie chicken model and its intended uses is found in:
 The following is a description of factors used to develop a spatial model for greater prairie chickens (GRPC) in northeastern Oklahoma and adjacent areas of Kansas, Missouri, and Arkansas, and a voluntary
United Water Conservation District November 2016 Hydrologic Conditions Report 2017 Water Year. December 6, 2016
 United Water Conservation District November 216 Hydrologic Conditions Report 217 Water Year December 6, 216 Page Intentionally Left Blank PRECIPITATION (INCHES) PRECIPITATION (INCHES) PRECIPITATION (INCHES)
The Impacts of Climate Change on Portland s Water Supply
 The Impacts of Climate Change on Portland s Water Supply Richard Palmer and Margaret Hahn University of Washington Department of Civil and Environmental Engineering Joe Dvorak, Dennis Kessler, Azad Mohammadi
Natural Resources & Environmental Stewardship
 Natural Resources & Environmental Stewardship Fundamentals of Nutrient Management Melissa L. Wilson Department of Environmental Science & Technology Ag Nutrient Management Program University of Maryland,
WIND ENERGY RESOURCE ASSESSMENT: A CASE STUDY
 WIND ENERGY RESOURCE ASSESSMENT: A CASE STUDY Norman Maphosa. National university of Science and Technology, Department of Technical Teacher Education, NUST, Box AC 939, Ascot, Bulawayo, Zimbabwe. Tel:
Fertility management in organic strawberries
 Fertility management in organic strawberries Organic P management : P in composted manure is at least 70% as available as synthetic P fertilizer Using composted manure for N availability often results
Eugene Water & Electric Board. The Future of Utilities in the Pacific Northwest
 Eugene Water & Electric Board The Future of Utilities in the Pacific Northwest 1 Eugene Water & Electric Board The Future of Utilities in the Pacific Northwest Erin Erben Manager, Power & Strategic Planning
PJM Perspective of the EPA Clean Power Plan: Analysis
 PJM Perspective of the EPA Clean Power Plan: Analysis Consortium for Energy Policy Research Harvard University March 9, 2015 Cambridge, MA Muhsin K. Abdur-Rahman Senior Market Strategist Paul M. Sotkiewicz,
Potential Effects of Tall Structures on Grouse Species. New Mexico Avian Protection Workshop February
 Potential Effects of Tall Structures on Grouse Species New Mexico Avian Protection Workshop February 14-15 2012 Greater Sage-Grouse Concerns Long term population declines Extensive loss and alteration
Demystifying Rooftop Solar
 Demystifying Rooftop Solar Week 4 : Economics OLLI at Illinois Study Group Fall 2017 1:30 pm Tuesdays Blue Room Proposed Session Outline 1. Overview of solar power in general. How PV works with demos.
Wind Power Land Use and Policy Issues. M. Klepinger, Land Policy Institute Michigan State University
 Wind Power Land Use and Policy Issues M. Klepinger, Land Policy Institute Michigan State University 1 Interest in Wind Power Why is everyone talking about wind power? 1. Farmers and large tract owners,
2016 Propane Market Outlook: Driving Change in Consumer Propane Markets
 0 2016 Propane Market Outlook: Driving Change in Consumer Propane Markets NPGA Southeastern Convention & International Propane Expo April 8, 2016 Presented by: Michael Sloan ICF International 9300 Lee
The State of Renewable Energy in the Region Wind Ene rgy Te chnology &Tre nds
 The State of Renewable Energy in the Region Wind Ene rgy Te chnology &Tre nds 01 02 03 T e c h n o l o g y T r e n d s a n d F u t u r e C h a l l e n g e s M a r k e t T r e n d s a n d P o l i c y D
Georgia Power's Solar Overview. Ervan Hancock III Renewable Development and Green Strategy Manager Georgia Power Company
 Georgia Power's Solar Overview Ervan Hancock III Renewable Development and Green Strategy Manager Georgia Power Company GPC is largest of four Southern Company electric utilities $7.2 billion in revenue
ENERGY SELF SUFFICIENCY WITH RENEWABLE SOURCES BIOMASS AND WIND IN THE REHABILITATION PROJECTOF AN OLD RURAL BUILDING COMPLEX IN SICILY (ITALY)
") ENERGY SELF SUFFICIENCY WITH RENEWABLE SOURCES BIOMASS AND WIND IN THE REHABILITATION PROJECTOF AN OLD RURAL BUILDING COMPLEX IN SICILY (ITALY) Paola Caputo paola.caputo@polimi.it Politecnico di Milano,
ENERGY SELF SUFFICIENCY WITH RENEWABLE SOURCES BIOMASS AND WIND IN THE REHABILITATION PROJECTOF AN OLD RURAL BUILDING COMPLEX IN SICILY (ITALY) Paola Caputo paola.caputo@polimi.it Politecnico di Milano,
Results and Assumptions For Single Economic Dispatch Production Cost Study PROMOD Component
 Results and Assumptions For Single Economic Dispatch Production Cost Study PROMOD Component Last Revised: May 25, 26 Disclaimer: "MIDWEST ISO MAKES NO REPRESENTATIONS OR WARRANTIES OF ANY KIND, EXPRESS
Missouri River Basin Water Management
 Missouri River Basin Water Management Spring 2015 Public Meetings April 7 th April 7 th April 8 th April 9 th April 9 th 11:00 a.m. 6:00 p.m. 11:00 a.m. 11:00 a.m. 6:00 p.m. Pierre, SD Bismarck, ND Fort
From the cornbeltto the north woods; understanding the response of Minnesota. Chris Lenhart Research Assistant Professor BBE Department
 From the cornbeltto the north woods; understanding the response of Minnesota watersheds to climate change Chris Lenhart Research Assistant Professor BBE Department 1. Background Differential response of
Curtis Davis, Chief Operating Officer, Generation and Marketing Allegheny Energy Supply. Governor s Energy Summit 2010
 Curtis Davis, Chief Operating Officer, Generation and Marketing Allegheny Energy Supply Governor s Energy Summit 2010 Allegheny Energy Service Area and Generation Plants - 2 - Allegheny & FirstEnergy Combined
the wedge game unit 9
 the wedge game unit 9 This presentation is based on the Stabilization Wedges concept first presented in "Stabilization Wedges: Solving the Climate Problem for the next 50 Years with Current Technologies,
Atlantic Wind Connection Project Update. Mohamed M. El Gasseir, PhD. Alternating Current Transmission Systems Conference.
 Atlantic Wind Connection Project Update Mohamed M. El Gasseir, PhD High Voltage Direct Current & Flexible Alternating Current Transmission Systems Conference EPRI, Alto August 30, 2011 Agenda Background:
Los Angeles 3 rd Regional
 Los Angeles 3 rd Regional Investors Conference Los Angeles, California March 31, 2016 Metropolitan Water District of Southern California 1 Metropolitan Water District of of Southern California 2 Metropolitan
Demand Response. Overview. Recommendations
 Section 6 Demand Response Demand Response Markets require both a supply side and a demand side to function effectively. The demand side of wholesale electricity markets is underdeveloped. Wholesale power
CONNECTION & COSTS. Mary Doswell Alternative Energy Solutions December 7 th, 2010
 OFFSHORE WIND CONNECTION & COSTS Mary Doswell Alternative Energy Solutions December 7 th, 2010 Virginia Offshore Wind Integration Study Virginia Beach Transmission System Study Scope System studied was
Energy Efficiency and Climate Change
 Energy Efficiency and Climate Change Why cap and trade design choices really matter 50 State Street, Suite 3 Montpelier, Vermont USA 05602 Tel: 802.223.8199 Fax: 802.223.8172 ACEEE October 2, 2007 Richard
Efficient utilization of energy sources
 Efficient utilization of energy sources Perspectives for the reduction of fossil primary energy utilization in urban areas March 28 Using the energy content the most efficient way is using COMBINED HEAT
APRIL 23, Capacity Value of Wind Assumptions and Planning Reserve Margin
 APRIL 23, 2014 Capacity Value of Wind Assumptions and Planning Reserve Margin Executive Summary Effective Load Carrying Capacity (ELCC), or capacity value, of variable generation and required planning
Hedging Coal Price Risk in a Deregulated Power Market
 Hedging Coal Price Risk in a Deregulated Power Market Ginny Farrow Manager Rail Car Fleet NCCI Spring Conference Greensboro, NC April 12, 2007 Safe Harbor Statement This Presentation contains forward-looking
Prescribed Fire on JBLM. John Richardson Joint Base Lewis McChord Fish and Wildlife
 1 Prescribed Fire on JBLM John Richardson Joint Base Lewis McChord Fish and Wildlife John.f.richardson1.civ@mail.mil Location of JBLM 5/25/2017 PowerPoint Presentation Template 2 2 Fire Dependent Ecosystems
Early Examples of Tradable Permits: Lead Trading
 Early Examples of Tradable Permits: Lead Trading During phase-out of lead from gasoline, refineries were allowed to trade lead credits Timetable: 1982: credits established average level of 1.1 grams/gal
GREATER SAGE-GROUSE HABITAT ECOLOGY AND CONSERVATION. Mine Design, Operation & Closure Conference 2011 R. Northrup
 GREATER SAGE-GROUSE HABITAT ECOLOGY AND CONSERVATION Mine Design, Operation & Closure Conference 2011 R. Northrup 1 OUTLINE Sage-Grouse Status Basic Habitat Ecology Primary Habitat Issues Basic Conservation
Energy Sources: Off-shore Wind
 Energy Sources: Off-shore Wind At sea, winds are stronger and steadier than on land, so offshore wind farms deliver a higher power per unit area than onshore wind farms. The Kentish Flats wind farm in
Impacts of wind energy projects on site integrity. Monitoring & mitigation measures in Spain.
 Impacts of wind energy projects on site integrity. Monitoring & mitigation measures in Spain. Manuela de Lucas, PhD Applied Ecology Group manuela@ebd.csic.es Strait of Gibraltar http://images.jsc.nasa.gov/luceneweb/caption_direct.jsp?photoid=sts059
An investment model for large-scale green
 Fargo, ND May 31 2007 An investment model for large-scale green infrastructure: re-mosaicking the prairies 3rd International Sustainable Wetland Plant Management Conference Henry David (Hank) Venema, PhD,