CALGARY EDMONTON FORT ST. JOHN KAMLOOPS KELOWNA NELSON QUESNEL RICHMOND
|
|
|
- Herbert Justin Wiggins
- 6 years ago
- Views:
Transcription
1 Commerce Parkway, Richmond, BC V6V 3A1 Telephone: Fax: August 22, 2007 File: District of Mission 8645 Stave Lake Street Mission, BC V2V 4L9 Attention: Rick Bomhof Director of Engineering and Public Works RE: District of Mission Development Cost Charge Review Report We are pleased to provide the District of Mission with 7 copies of the final report Development Cost Charge (DCC) Review This revised version reflects all of the changes we have recently discussed. It has been a pleasure working with you on this review, and we thank you for the assistance you provided throughout the project. Should you have any questions or concerns about the final document, please do not hesitate to contact me at Yours truly, URBAN SYSTEMS LTD. Fraser Smith, P. Eng., MBA Principal /al _RBomhof_Mission DCC Review_Ltr CALGARY EDMONTON FORT ST. JOHN KAMLOOPS KELOWNA NELSON QUESNEL RICHMOND
2 Development Cost Charge (DCC) Review 2007 Final Report August 21, 2007 This report is prepared for the sole use of the District of Mission. No representations of any kind are made by Urban Systems Ltd. or its employees to any party with whom Urban Systems Ltd. does not have a contract. # Commerce Parkway Richmond, BC, V6V 3A1 Phone: Fax:
3 Development Cost Charge (DCC) Review TABLE OF CONTENTS 1. Introduction Background Objectives Guiding Principles Use of the Best Practices Guide DCC Bylaw General Considerations Legislative and Regulatory Background Public Participation Process Bylaw Exemptions Collection of Charges In-stream Applications and Grace Periods Municipal Assist Factor DCC Recoverable Costs Growth Estimates and Planning Assumptions Relationship to Other Municipal Documents Estimation of New Development Estimated Residential Development Units Commercial Development Estimates Industrial Development Estimates Institutional Development Estimates Equivalent Unit Calculations Allocation of Costs Road Development Cost Charges Road DCC Program Development Cost Charge Calculation for Roads Storm Drainage DCC Program Storm Drainage DCC Program Development Cost Charge Calculations for Storm Drainage Water DCC Program Water DCC Program Development Cost Charge Calculations for Water August 21, DCC Background Report-Final.doc i
4 Development Cost Charge (DCC) Review 7. Sanitary Sewer DCC Program Sanitary Sewer DCC Program Development Cost Charge Calculations for Sanitary Sewer Silvercreek Parkway Parkland Development Cost Charges Silvercreek Parkway Parkland Acquisition DCC Program Development Cost Charge Calculations for Silvercreek Parkway Parklands Silverdale Industrial Water And Sanitary Sewer DCC Program Silverdale Industrial Water and Sanitary Sewer DCC Program Development Cost Charge Calculations for Water and Sanitary Sewer Regional Water Supply DCC Program Regional Water Supply DCC Program Development Cost Charge Calculation for Water Regional Sewage Treatment DCC Program Regional Sewage Treatment DCC Program Development Cost Charge Calculations for Sanitary Sewer Summary of Development Cost Charges...40 LIST OF FIGURES Figure 1: All Areas DCC Plan... 4 Figure 2: Cedar Valley (Area B)... 5 Figure 3: Silverdale Industrial Water and Sewer (DCC Area)... 6 Figure 4: Horne Street Pedestrian Walkway (DCC Area)... 7 Figure 5: DCC Program, Areas A, B and C Roads Figure 6: DCC Program, Cedar Valley Roads Figure 7: DCC Program, Area B Storm Sewer Figure 8: DCC Program, Area B Watermain August 21, DCC Background Report-Final.doc ii
5 Development Cost Charge (DCC) Review LIST OF TABLES Table 1: DCC Levied by Land Use... 8 Table 2: Applicable DCCs by Area... 9 Table 3: Municipal Assist Factor by DCC Type Table 4: Type of Equivalency Units Table 5: Trip Generation Table 6: Impact Ratios Table 7: Water Population Equivalents Table 8: Sanitary Population Equivalents Table 9: Equivalent Population Factor Table 10: Population Equivalents Table 11: Population Equivalents Table 12: Proposed DCC Rate Summary APPENDICES A B C D E F G H I Population and Growth Projections Public Open House Material Capital Cost Estimates Road DCC Program and Calculations Areas A, B, and C Road DCC Program and Calculations Area B Horne Street Pedestrian Walkway DCC Program and Calculations Drainage DCC Program and Calculations Area B Water DCC Program and Calculations Area B Sanitary Sewer DCC Program and Calculations Areas A, B, and C J Silvercreek Parkway Parkland Acquisition DCC Program and Calculations Areas A, B, and C K L Silverdale Industrial Water and Sanitary Sewer DCC Program and Calculations Specified Area Regional Water Supply and Sewage Treatment DCC Program and Calculations Areas A, B, and C M The Proposed Development Cost Charge Bylaws August 21, DCC Background Report-Final.doc iii
6 Development Cost Charge (DCC) Review 1. INTRODUCTION 1.1 Background The District of Mission (the District ) is in the process of updating most of their existing Development Cost Charge ( DCC ) bylaws including their DCC funding of the Abbotsford/Mission Water and Sewer Services (regional needs) water supply and sewage treatment DCCs. The District has recently reviewed their growth trends for the community and has estimated growth to The District has also had the opportunity to assess its capital needs in the areas of roads, sanitary, drainage, water and parkland. In assessing its capital needs in these areas, consideration was given as to how these projects could be funded. In order to adequately finance the costs of implementing these various projects, the District has decided to review its current DCC program. The updated capital costs from the various reviews have also been incorporated into the DCC model. The results of these reviews form the basis for this report. This report is also an update of the DCC background report prepared in This DCC review will focus on the following DCC Bylaws: 1. Bylaw Horne Street Pedestrian Walkway DCC; 2. Bylaw Road and Parks District Wide DCCs, Cedar Valley Area B (Road, Drainage, Water and Sanitary Sewer); 3. Bylaw Silverdale DCCs for Water and Sewer; and 4. Bylaw Water Supply and Sewage Treatment District Wide. There are a number of existing DCC bylaws that were not reviewed as part of the current process, they include: 1. Bylaw Silverdale Creek Bridge and Approaches DCC; 2. Bylaw Cedar Valley Environmentally Sensitive Parkland Acquisition DCC; and 3. Bylaw Cedar Valley Sewer Extension DCC. 1.2 Objectives The purpose of this DCC Review is to: August 21, DCC Background Report-Final.doc 1. provide for the development of specific road, storm drainage, water and sanitary sewer infrastructure projects including regional water supply and sewage treatment infrastructure, and for the acquisition of open space parkland through means of DCCs; 1
7 Development Cost Charge (DCC) Review 2. determine the various factors that are used to set out a DCC, such as community growth estimates, equivalent unit calculations, analysis of community needs, allocation of those needs between the existing population and new growth, and the municipal assist factor; and 3. set out the assumptions that were made during the course of this review. The District will be able to accomplish several broad goals by completing this review. The review ensures that there is consistency between the DCC program, the planning objectives and the financial strategies of the District. This program will help to ensure that the people who will use and benefit from the services provided pay their share of the costs in a fair and equitable manner. Information that was used to develop the DCCs has been made available to the public, thereby, creating a degree of accountability to the public. The program creates certainty by providing stable charges to the development industry and by allowing the orderly and timely construction of infrastructure. 1.3 Guiding Principles In general, the DCCs for the District will be on an area specific basis, rather than a municipal wide basis. That is to say different DCCs will be assessed against the same types of land use in different geographic areas throughout the District. The reason for this is that each geographic area has its own particular capital projects because of its different servicing requirements and estimated development. It would be inequitable to charge the same DCC rate for properties which do not derive the benefit from certain capital projects. In this manner, the rest of the District is not unduly burdened with paying for projects, which would not have been necessary but for that particular new development. There are three large areas in which the many of the DCCs will be applied (see Figure 1). Area A is the Central and Fraser Area. This area is comprised primarily of the existing urban area of the District, containing single family and multi-family dwellings as well as significant commercial development. Area B is the Cedar Valley Comprehensive Development Plan (the CVCDP ) Area (see Figure 2). This area is expected to receive the majority of growth within the District in the next 10 years. Growth will include single family dwellings, multi-family dwellings and commercial space. Area C is composed of the Hatzic, Rural, Urban Reserve and Silverdale areas. Although there are several constraints which affect the ability to develop these parts of the District, some residential development is anticipated in the future. August 21, DCC Background Report-Final.doc 2
8 Development Cost Charge (DCC) Review DCCs for the Water Supply and Sewage Treatment Systems will be on a municipal wide basis (see Figure 1). Any development within the District of Mission that connects to the municipal water system and/or the municipal sewer system will pay the same DCC rates or charges for the same category of development. As the CVCDP Area (Area B) is expected to experience substantial growth, additional infrastructure will be required to service this area. Developments in Area B will be required to pay District wide DCCs as well as area specific road, drainage, sewer and water DCCs discussed in this DCC review. The Silverdale Creek Industrial area is shown on Figure 3. This area has unique water supply and sewer servicing requirements that only benefit this area. The area is planned for industrial use only. Developments in this area will pay both the regional water and sewer DCCs as well as additional water and sewer DCCs specifically for the Silverdale Creek Industrial area. The Horne Street Pedestrian Walkway also services a specific area that contains multi-family residential and commercial land uses (see Figure 4). The pedestrian walkway has been designed to service this unique area of Mission. Developments in this area will pay District wide DCCs as well as additional DCCs for the Horne Street Pedestrian Walkway. August 21, DCC Background Report-Final.doc 3
9
10
11
12
13 Development Cost Charge (DCC) Review The DCCs shall be applied to certain categories of development, such as residential, commercial, industrial and institutional, depending upon the specific DCC area. Not all of the categories of development will be charged DCCs in these programs; this will vary from area to area. The following tables set out what types of DCCs will be assessed against a particular land use and in which areas of the District. Table 1 DCC Levied by Land Use DCC Type Roads (District Wide) Roads (Area B) Drainage (Area B) Sanitary Sewer (Area B) Water (Area B) Parkland (District Wide) Regional Water Supply (District Wide) Regional Sewage Treatment (District Wide) Horne Street Pedestrian Walkway (Horne St.) Silverdale Industrial Water (Silverdale Industrial) Silverdale Industrial Sewer (Silverdale Industrial) Levied on Which Land Uses? Residential (a), Commercial (b), Institutional (c) and Industrial (d) Residential (a), Commercial (b), Institutional (c) and Industrial (d) Residential (a), Commercial (b), Institutional (c) and Industrial (d) Residential (a), Commercial (b), Institutional (c) and Industrial (d) Residential (a), Commercial (b), Institutional (c) and Industrial (d) Residential (a) Residential (a), Commercial (b), Institutional (c) and Industrial (d) Residential (a), Commercial (b), Institutional (c) and Industrial (d) Multi-family and Commercial (b) Industrial (d) Industrial (d) (a) Residential includes single family dwellings, cluster compact single family, compact single family; apartments, duplexes, triplexes, fourplexes, sixplexes, townhouses, and institutional residential units. (b) Commercial includes local centre, neighbourhood centre, mixed use commercial/residential and comprehensive development. (c) Institutional includes institutions and schools. (d) Industrial includes the general industrial, industrial park and resource processing industrial zones. August 21, DCC Background Report-Final.doc 8
14 Development Cost Charge (DCC) Review Table 2 Applicable DCCs by Area DCC Area A Area B Area C Horne St. Silverdale Industrial Roads (District Wide) Roads (Area B) Drainage (Area B) Sanitary Sewer (Area B) Water (Area B) Parkland (District Wide) Regional Water Supply (District Wide) Regional Sewage Treatment (District Wide) Horne Street Pedestrian Walkway (Horne St.) Silverdale Industrial Water (Silverdale Industrial) Silverdale Industrial Sewer (Silverdale Industrial) The timeframe for each of the service-specific DCC programs will vary, depending upon the location of the project. The DCC programs for Area A and C were originally based on the 15-year Capital Expenditure Program. The original 15-year capital list has been updated and expanded to estimate community needs to The population and growth projections are found in Appendix A. For Area B, the DCC program is based on a build out scenario, which was articulated in the CVCDP and has been refined for this DCC review. The use of the build out program will apply to the projects that are specific to Area B. Those same growth estimates that are used for the Area B specific projects will also be used to represent Area B in the calculation of DCCs which apply to all areas. August 21, DCC Background Report-Final.doc 9
15 Development Cost Charge (DCC) Review The timeframe for each of the Water Supply and Sewage Treatment DCC programs varies depending on the estimated service population of each program. The DCC program for the Water Supply will meet community needs for the period extending from 2007 to 2019 while the DCC program for Sewage Treatment will meet community needs for the period extending from 2007 to The respective programs are based on Abbotsford/Mission Water & Sewer Commission 2006 Updates of the Water Master Plan and Wastewater Master Plan. 1.4 Use of the Best Practices Guide The Ministry of Community Services (the Ministry ) has prepared a Development Cost Charge Best Practices Guide (the Best Practices Guide ). The purpose of this document is to provide direction as to the accepted administrative practices for a DCC program and allows for a streamlined review of the DCC program by the Ministry. This report was developed in consideration of the Best Practices Guide, which was followed where it was appropriate to do so. 1.5 DCC Bylaw The material provided in the background report is meant for information only. Refer to the appropriate bylaws for the specific DCC for all land uses within the District. August 21, DCC Background Report-Final.doc 10
16 Development Cost Charge (DCC) Review 2. GENERAL CONSIDERATIONS 2.1 Legislative and Regulatory Background The Local Governmen t Act, formerly the Municipal Act, R.S.B.C. 1996, c. 323 (the Act ) provides the authority for a municipality to levy DCCs within the community. The purpose of a DCC is to assist the municipality in accommodating development by providing a dedicated source of funding for the capital costs of: providing, constructing, altering or expanding sewage, water, drainage and highway facilities (other than off-street parking); and providing and improving parkland. In order to make this type of funding available to the District, the District must adopt a bylaw in order to impose DCCs (the DCC Bylaw ). The DCC Bylaw must specify in a schedule the amount of the DCCs, which may vary with respect to: different zones or different defined or specific areas; different uses; different capital costs as they relate to different classes of development; and different sizes or different numbers of lots or units in a development. The monies that are collected through DCCs must be deposited in a separate reserve fund, which is set up for each type of DCC. These monies may only be used to pay for the capital costs of the works or the principal and interest on a debt incurred for those capital works. The costs for capital works include not only the actual construction of the works but also the planning, engineering and legal costs which are directly related to the works, as well as improving the parkland if a parkland acquisition and development DCC is established. 2.2 Public Participation Process Although the Act does not require a public participation process, the Best Practices Guide does suggest that a public participation process be included as part of the development of the DCC program. The purpose of such a process is to create transparency by allowing those people that are affected to know what the program will entail and providing them with the opportunity to offer comments and input. The Best Practices Guide does not set a recommended format to be followed for public participation; instead, the type of public participation to be used is to be decided by the municipality itself. August 21, DCC Background Report-Final.doc 11
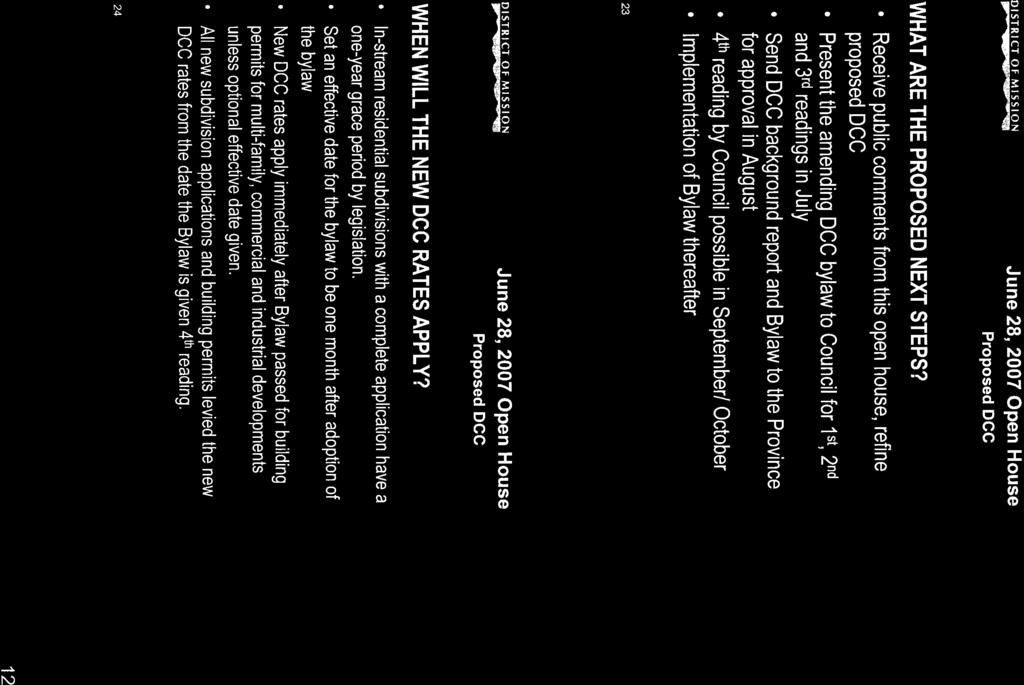
17 Development Cost Charge (DCC) Review In order to adhere to the suggestion, the District has chosen to involve the public through a public information session. The District also recognizes that the development industry will be affected by changes to the current DCC program. The District has invited the development industry to the public meeting in order to provide the development industry with adequate information about the changes to the DCC program. On June 28, 2007 a public open house was held to present the draft Development Cost Charge Bylaw rate structure and background information for the District of Mission. Thirteen people attended the open house in addition to District staff and Urban Systems. The materials presented at the open house included storyboards showing the engineering capital works, information as to how the DCCs were calculated, population estimates and the proposed and existing DCC rates. In addition to the storyboards both engineering and finance staff were on hand to answer questions from the public. A handout was provided to all who attended the meeting. Also the draft DCC background report was made available for the public at the engineering counter of the District of Mission prior to the public meeting. The meeting was announced through the local newspaper as well as through the postal service with a mail-out to the development community. Approximately 70 notices were sent out. A number of questions were raised during the public meeting. Many questions related to the implementation timeline of the DCC bylaw. Additional comments were related to the increase in the DCC rates and specifically the commercial and industrial DCC rates. A total of three comment sheets were returned to the District. In response to the questions raised, both staff and the consultant reviewed the basis of the DCC calculations and also discussed possible options for the adoption date of the new DCC bylaws. A report to the District council provided council with an understanding of the concerns expressed at the open house. District staff recommended that the proposed new DCC rates come into effect on January 1, Further delays may jeopardize the District s ability to fund the necessary capital works needed to accommodate growth. In response to the questions regarding the commercial, industrial and institutional DCC rates, the equivalency factors and trip generation values were checked and refined. This resulted in a small reduction in the ICI rates and a small increase to the residential rates. The details of the council report and public open house are included in Appendix B. August 21, DCC Background Report-Final.doc 12
18 Development Cost Charge (DCC) Review District council gave the amending DCC bylaws first, second and third readings on July 16, Bylaw Exemptions The Act is quite clear that a DCC cannot be levied if the proposed development does not impose new capital cost burdens on the District or if a DCC has already been paid in regards to the same development. However, if additional further development for the same development creates new capital cost burdens, the DCCs can levied for the additional costs. The Act further restricts the levying of DCC at the time of application for a building permit if: the building permit is for a church or place of worship; the value of the work authorized by the building permit does not exceed $50,000 or some other value established by Council by bylaw; or the building permit is for a residential building with fewer than four dwelling units. Recent changes to the legislation now allow local governments to charge DCCs on residential developments of fewer than four units, provided such a charge is provided for in the local government s DCC bylaw. At this time the District of Mission has not reflected this condition in their DCC bylaw. 2.4 Collection of Charges DCCs may be collected at the time of the approval of a subdivision or at the time of obtaining a building permit in accordance with the Act. The District has decided to collect DCCs for: single family, duplex, and triplex dwelling units after the application for a subdivision has been made but before the final approval of the subdivision has been given; and all other types of development after the application for a building permit has been made but before the building permit has been issued. August 21, DCC Background Report-Final.doc The reason for collection of DCCs by dwelling units at the subdivision stage is that it is easier to determine the number of dwelling units at the time of subdivision than the gross floor area of dwelling units at subdivision. This timing of collection is in keeping with the current practices in most other communities. 13
19 Development Cost Charge (DCC) Review The reason for the collection of DCCs at the building permit stage for all other types of development is that it is difficult to determine the size and the number of the buildings that will be on the lot prior to the application for a building permit. This method will allow for easier calculation of the DCCs based on the amount of the gross floor area indicated on the building permit. The DCC Bylaw will indicate by type of development when the DCCs will be collected. Where a type of development has not been specified in the DCC Bylaw, the DCC that is levied will be based on the rate of the most similar type of development. 2.5 In-stream Applications and Grace Periods When a DCC Bylaw, which has higher rates, is introduced, a number of subdivision applications may be at various stages of the approval process. Should a DCC Bylaw be adopted without making provisions for those subdivision applications, that have been received but have not yet been given final approval, the DCCs would then be levied on these subdivision applications, thereby imposing unanticipated costs on the applicant. In order to ensure a degree of fairness to this situation, section 943 of the Local Government Act states that: If, after (b) an application for a subdivision of land within a municipality has been submitted to an approving officer and the applicable subdivision fee has been paid, a local government adopts a bylaw under this Part [Part 26] that would otherwise be applicable to that subdivision, the bylaw has no effect with respect to that subdivision for a period of twelve months after it was adopted unless the applicant agrees in writing that it should have effect. Building permits are not given any in-stream exemptions under the Local Government Act. Further, in-stream building permit application status is not one of the grounds on which municipalities can vary DCCs. The District has decided to establish a grace period for all development by setting the effective date of the DCC bylaw to January 1, Municipal Assist Factor August 21, DCC Background Report-Final.doc The Act recognizes that it would be unfair to impose on new development all of the costs that are attributable to new development. As such, the Act stipulates that an assist factor will be included as part of the calculation of the DCCs. An assist factor represents the District s contribution towards the capital costs for the projects 14
20 Development Cost Charge (DCC) Review attributed to new development. This contribution is in addition to the costs that were allocated to the existing population and that are to be paid by the District. The portion of the costs that the District will have to cover because of the assist factor will have to be financed through other means. The actual amount of the assist factor is determined by the District. However, the Ministry only accepts a minimum assist factor of 1%. While the District can have a different assist factor for each type of capital works, i.e. sewer, water, storm drainage, roads and parkland, the District cannot have a municipal assist factor that varies for different land uses within the District, i.e. single family residential, multifamily residential, commercial, etc. According to the Act, the District should consider the following items when setting DCC rates: future land use patterns and development; the phasing of works and services; the provision of parkland described in the OCP; whether the charges are excessive in relation to the capital costs of prevailing standards of service; whether the costs will deter development; or whether the charges will discourage the construction of reasonably priced housing or the provision of reasonably priced serviced land. In consideration of all of the above matters, the assist factor has been set at the following rates for each type of DCC: Table 3 Municipal Assist Factor by DCC Type DCC Type Municipal Assist Factor Roads 1% Drainage 1% Sanitary Sewer 1% Water 1% Parkland Acquisition 1% Water Supply & Sewage Treatment (Regional) 1% Horne Street Pedestrian Walkway 1% Silverdale Industrial Water & Sewer 1% August 21, DCC Background Report-Final.doc 15
21 Development Cost Charge (DCC) Review 2.7 DCC Recoverable Costs The District has reviewed the District wide DCC road program. Projects that were completed have been removed and some new projects were identified. These DCC projects are for Areas A, B and C. The costs for those projects have been updated and form the basis of the DCC Recoverable costs for this report. A review of the engineering items in the Cedar Valley road, drainage, water and sanitary sewer program has been completed. In addition all costs were also reviewed and update as required. A summary of the cost estimates is included in the DCC rate calculations while the details of the cost estimates are included in Appendix C. These revised estimates were used in the calculations of this report. In regards to the parks projects which will affect all areas, the costs of acquisition were based on a unit increase in costs based on the 2004 Assessment Values for those particular sites. The increase was based on recent land acquisitions in the vicinity of the Silverdale Park area. The capital costs for the Water Supply and Sewage Treatment programs are based on the 2006 Water & Wastewater Master Plan Updates completed by Dayton & Knight Ltd. with costs adjusted to reflect 2007 dollars. The DCC recoverable costs for the projects include engineering costs and a contingency amount. The capital costs do not include an allowance for grant assistance or for cost sharing. The capital costs do not include charges for interim financing or interest on long-term debt financing. August 21, DCC Background Report-Final.doc 16
22 Development Cost Charge (DCC) Review 3. GROWTH ESTIMATES AND PLANNING ASSUMPTIONS 3.1 Relationship to Other Municipal Documents Several sources have been consulted in order to develop this DCC program, including the following: The District of Mission Official Community Plan Bylaw; The Background Report for Development Cost Charges for Development Cost Charge Bylaw, dated December, 2004; The Background Report for Development Cost Charges for Cedar Valley, dated January, 1997; The Subdivision Control Bylaw No. 1500, 1985; The District of Mission Development Cost Charge Bylaws where applicable Information provided by District staff; Development Cost Charge - Best Practices Guide, Ministry of Community Services, 2005; Joint Abbotsford/Mission Water & Sewer Services Update of the Water Master Plan; Joint Abbotsford/Mission Environmental System J.A.M.E.S Update of Wastewater Master Plan 3.2 Estimation of New Development Growth is broadly classified either as residential growth or non-residential growth, which includes commercial, industrial and institutional uses. 3.3 Estimated Residential Development Units Residential development in the District can be accommodated through a variety of land uses and densities. The DCC schedule has been developed in such a way as to relate the impact of different land uses and the unit estimates provided in Appendix A. Separate estimates have been prepared for Areas A, B, and C and for the areas serviced by the Horne Street pedestrian walkway and Silverdale industrial area. All of this information was used to form the basis of the calculations for the DCCs. The Statistics Canada data for 2001 established the District of Mission population at 31,272 and in 2006 at 34,505. The District population is anticipated to be 52,551 by 2033, which means an increase of 18,046 new residents. August 21, DCC Background Report-Final.doc 17
23 Development Cost Charge (DCC) Review A mix of 25% single family dwellings in the urban infill areas and 75% multi-family dwellings is anticipated in order to accommodate the new growth. As for the multifamily dwellings, it is expected that 40% of the new multi-family dwellings will be townhouses and 60% will be apartments. In Area B, the CVCDP has a variety of single family dwellings, in addition to different types of multi-family dwellings. The types of single family dwellings include traditional, suburban, compact and cluster styles; the multi-family categories range from townhouses to garden apartments to institutional residential. For the purposes of calculating the costs of projects, which are specific to Cedar Valley, the DCCs will be charged against the specific type of land use. For the purposes of calculating the proportionate costs of projects which are charged against all of the DCC areas, the estimates for all of the types of single family residential in Cedar Valley will be included in the single family category. The number for the multi-family dwellings will be included in the multi-family category to which it belongs. The tables which set out the estimated number of units by area for single family dwelling units and multi-family dwellings are located in Appendix A. Also included in Appendix A are the growth estimates used in the Horne Street Pedestrian Walkway DCC calculation. 3.4 Commercial Development Estimates Just as with residential development, the commercial development estimates have been developed in such a way as to relate the impact of different land uses and the unit projections. Commercial development estimates were developed for each of Areas A, B and C. The estimated amount of required new commercial floor space is 57,248 square metres. The growth projections and capital programs for the regional water and sewage treatment DCC is based on a 12-year and 25-year basis. The sewer program matches the timeframe in the master plan update. The water program is 12 years since there is some uncertainty regarding water supply options beyond that timeframe. Until further study is completed on the Miracle Valley source, final costs beyond 12 years are less certain. The estimated amount of required new commercial floor space to year 2019 is 33,096 square metres and to the year 2031 is 52,975 square metres. 3.5 Industrial Development Estimates August 21, DCC Background Report-Final.doc The total amount of industrial floor space required to supply the District s needs is estimated at 68,395 square metres (refer to Appendix A for details). 18
24 Development Cost Charge (DCC) Review 3.6 Institutional Development Estimates The total amount of institutional floor space required to supply the District s needs is 14,782 square metres of floor space area (refer to Appendix A for details). 3.7 Equivalent Unit Calculations Equivalent units are used to represent population and the demands that new growth population places on municipal services. Each type of development requires different services. The use of equivalent units provides a means to compare the various impacts of the different land uses. The calculations for the different types of services were based on specific types of equivalency unit calculations, which are specified in the table below. Table 4 Type of Equivalency Units Types of Service Equivalency Unit Roads Drainage Sanitary Sewer Water Parks Water Supply & Sewage Treatment (Regional) Horne Street Pedestrian Walkway Silverdale Industrial Water & Sewer Trips per Unit Impact Ratios Equivalent Population Factors Equivalent Population Factors Equivalent Population Factors Equivalent Population Factors Trips per Unit Equivalent Population Factors 3.8 Allocation of Costs For each proposed infrastructure project, costs are allocated between existing development and new growth. To determine the proper allocation for each project, individual projects can be divided into two broad categories: 1. projects that upgrade the level of service or resolve existing deficiencies; and 2. projects that are required solely to accommodate new growth. Projects in the first category provided some benefit to existing development, but they also benefit new growth. In the regional water supply DCC benefit factors of 20%, 39% and 100% have been used to allocate the cost of the works between the August 21, DCC Background Report-Final.doc 19
25 Development Cost Charge (DCC) Review existing users and the future growth. The regional sewage treatment DCC benefit factors have been established at 30%, 37% and 100% for the various DCC projects. Projects in the second category are seen as benefiting new growth only. In other words, they would not be contemplated if no new growth were forecasted. One hundred percent of the benefit and cost of each project in this category has been allocated to new growth. For most of the Mission DCC programs a 100% benefit factor has been applied after a careful review of each project. In each of the DCC programs, the exact percentage of the benefit that can be attributed to new growth is indicated in the column entitled Benefit Factor %. That factor is applied to the estimated costs to arrive at the amounts which can be recovered by DCCs before the municipal assist factor is applied. That information can be found in the column entitled Benefit Factor in all of the DCC programs in the Appendices. August 21, DCC Background Report-Final.doc 20
26 Development Cost Charge (DCC) Review 4. ROAD DEVELOPMENT COST CHARGES 4.1 Road DCC Program The Road DCC program is separated into three programs. The first program applies District wide (see Figure 5), including Cedar Valley, while the second program is specific only to Area B Cedar Valley (see Figure 6). The reason for these two separate Road DCC Programs is to ensure that the projects that are specific to Cedar Valley and are required as a result of the new growth within that area is financed by that new growth. The third separate transportation DCC is for the Horne Street Pedestrian Walkway. Projects identified for the Road DCC programs include the installation of signals, widening of roads, land acquisition, provision of a variety of items such as street lights, traffic signals, curbs and sidewalks, works to address safety concerns and works to improve the appearance and viability of upgraded roads so as to offset the impact of additional traffic volumes. A detailed cost estimate for each DCC project has been completed and is attached in Appendix C. Each Road DCC Program identifies the proportion of the costs attributable to future growth and to the existing residents. A municipal assist factor of 1% was applied to that amount in order to determine the amount of costs that is recoverable by DCCs. The Road DCC Programs are included in Appendices D, E and F. The following information summarizes the assumptions that were made in the development of the capital costs. The Road DCC Program for Areas A, B, and C 1. The cost estimates are based on the financial review done by Urban Systems Ltd. These cost estimates include contingencies, 10% allocated for engineering costs, 10% for contingencies and 5% for administration. 2. The costs have been allocated to the future population. The Road DCC Program for Area B 1. The cost estimates are based on the financial review done by Urban Systems Ltd. These cost estimates include contingencies, 10% allocated for engineering costs, 10% for contingencies and 5% for administration. 2. The costs have been allocated to the future population. August 21, DCC Background Report-Final.doc 21
27 Development Cost Charge (DCC) Review The DCC Program for the Horne Street Pedestrian Walkway 1. The cost estimate is based on the funds advanced from the general capital. This project has been completed and the DCC is being collected to reimburse the general capital fund. 2. The costs have been allocated to the future population. 4.2 Development Cost Charge Calculation for Roads By calculating the number of trip ends that result from new development within an area, we have determined the degree of impact that the new development would have on the road program. The following table sets out the number of peak hour trips that would be generated per development unit according to land use type. Table 5 Trip Generation Land Use Areas A, B, and C Single Family Residential Multi-Family Townhouse; Apartment; Duplex, Triplex, Fourplex, Sixplex Commercial Land Use Area B Single Family, Suburban, Compact, Cluster Townhouse; Garden Apartment; Institutional Residential Local, Neighbourhood, Mixed Use Commercial/Residential Number of Peak Hour Trips per Unit 1.02 per unit.65 per unit 0.29 per square metre Industrial CD Zone For Employment per square metre Institutional Schools, Institutional 0.02 per square metre Horne Street Pedestrian Walkway Horne Street Pedestrian Walkway Apartment Commercial 0.52 per unit.029 per square metre The net amount of the capital costs of the roads projects was divided by the total number of trip ends in order to determine the DCC per trip end. The detailed calculations are found in Appendices D, E and F. August 21, DCC Background Report-Final.doc 22
28
29
30 Development Cost Charge (DCC) Review 5. STORM DRAINAGE DCC PROGRAM 5.1 Storm Drainage DCC Program The Storm Drainage DCC program consists of only the Area B Cedar Valley program (see Figure 7). The type of projects identified for the Storm Drainage DCC program include culvert crossings, detention ponds, storm sewers and other drainage works. Each Storm Drainage DCC Program identifies the proportion of the costs attributable to future growth and to the existing residents. A municipal assist factor of 1% was applied to that amount in order to determine the amount of costs that is recoverable by DCCs. The following assumptions were made in developing the cost estimates. The Storm Drainage DCC Program for Area B 1. The cost estimates are based on the information contained in the Cedar Valley Area Stormwater Management Plan Update, June, 2007 and additional review and the costs have been updated to reflect current construction and land costs. 2. The allocation between new growth and existing population has been set at 100% from future growth The Storm Drainage DCC Program is set out in Appendix G. 5.2 Development Cost Charge Calculations for Storm Drainage By using an impact ratio derived from various runoff coefficients, the relative degree of impact that the new development would have on the capital projects can be ascertained. For this purpose, the following table sets the impact ratios that were used to determine equivalent units according to various land use types. The impact ratio is based on the degree of impact per 1,000 square metres. August 21, DCC Background Report-Final.doc 25
31 Development Cost Charge (DCC) Review Table 6 Impact Ratios Land Use Area B Single Family; Suburban, Compact; Cluster Impact Ratio (using a Single Family Residential Unit as the comparison point) Townhouse 0.58 Garden Apartment 0.25 Institutional Residential 1 Local, Neighbourhood, Mixed Use Commercial/ Residential per 1 sq. m. Schools and Institutional per 1 sq. m. The impact ratios were used to determine the equivalent units. The net amount of the capital costs for storm drainage was divided by the total number of equivalent units to calculate the DCC equivalent drainage unit. This process was used to determine the DCCs for Area B. The calculations for the Storm Drainage DCCs are found in Appendix G. The information listed below highlights certain assumptions within each of the calculations. The Storm Drainage DCC Program for Areas B 1. The estimated amount of new development comes from a refinement of the build out amounts in the Cedar Valley DCC Background Report. August 21, DCC Background Report-Final.doc 26
32
33 Development Cost Charge (DCC) Review 6. WATER DCC PROGRAM 6.1 Water DCC Program This Water DCC program is for Area B only (see Figure 8). In order to accommodate the growth in Cedar Valley, it is necessary to upgrade a series of water mains. The costs of these works are based on recent cost estimates. The DCC Program identifies the proportion of the costs attributable to future growth to be 100%. A municipal assist factor of 1% was applied to that amount in order to determine the amount of costs that is recoverable by DCCs. The following assumptions were made in developing the cost estimates. The Water DCC Program for Area B 1. The cost estimates are based on estimates to upgrade a group of water mains. 2. The costs are allocated to be 100% the responsibility of growth. The Water DCC Program is set out in Appendix H. 6.2 Development Cost Charge Calculations for Water By using the estimated number of persons per unit for residential growth and equivalent population for non-residential growth, the relative degree of impact that the new development would have on the capital projects can be ascertained. For this purpose, the following table sets the equivalents that were used to determine the relative impact of each land use type. Table 7 Water Population Equivalents Land Use Area B Single Family; Suburban, Compact; Cluster Townhouse Garden Apartment Institutional Residential Local Commercial Neighbourhood Commercial Mixed Use Commercial/Residential Schools and Institutional Population Equivalent 3.37 persons per dwelling unit 2.56 persons per dwelling unit 2.04 persons per dwelling unit 1.54 person per dwelling unit 55 persons per hectare 75 persons per hectare 75 persons per hectare 150 persons per hectare August 21, DCC Background Report-Final.doc 28
34 Development Cost Charge (DCC) Review The population equivalents were used to determine the equivalent units. The net amount of the capital costs for water was divided by the total number of equivalent units to calculate the DCC equivalent water unit. The calculations for the Water DCCs are found in Appendix H. The information listed below highlights certain assumptions within each of the calculations. The Water DCC Rate Calculation for Area B 1. The estimated number of units and area of new development were derived from a review of the original Cedar Valley Comprehensive Development Plan DCC Background Report and refinement of the estimates contained in that report. August 21, DCC Background Report-Final.doc 29
35
36 Development Cost Charge (DCC) Review 7. SANITARY SEWER DCC PROGRAM 7.1 Sanitary Sewer DCC Program This Sanitary Sewer DCC program is for Area B only (see Figure 2). In order to accommodate the growth in Cedar Valley, it was necessary to build a sanitary sewer trunk line. The costs of the project are based on the actual tender price. The DCC Program identifies the proportion of the costs attributable to future growth and to the existing residents. A municipal assist factor of 1% was applied to that amount in order to determine the amount of costs that is recoverable by DCCs. The following assumptions were made in developing the cost estimates. The Sanitary Sewer DCC Program for Area B 1. The cost estimates are based on the actual tender price of the project. 2. The costs are allocated to be 100% the responsibility of growth. The Sanitary Sewer DCC Program is set out in Appendix I. 7.2 Development Cost Charge Calculations for Sanitary Sewer By using the estimated number of persons per unit for residential growth and equivalent population for non-residential growth, the relative degree of impact that the new development would have on the capital projects can be ascertained. For this purpose, the following table sets the equivalents that were used to determine the relative impact of each land use type. Table 8 Sanitary Population Equivalents Land Use Area B Single Family; Suburban, Compact; Cluster Townhouse Garden Apartment Institutional Residential Local Commercial Neighbourhood Commercial Mixed Use Commercial/Residential Schools and Institutional Population Equivalent 3.37 persons per dwelling unit 2.56 persons per dwelling unit 2.04 persons per dwelling unit 1.54 person per dwelling unit 55 persons per hectare 75 persons per hectare 75 persons per hectare 150 persons per hectare August 21, DCC Background Report-Final.doc 31
37 Development Cost Charge (DCC) Review The population equivalents were used to determine the equivalent units. The net amount of the capital costs for sanitary sewer was divided by the total number of equivalent units to calculate the DCC equivalent sanitary unit. The calculations for the Sanitary Sewer DCCs are found in Appendix I. The information listed below highlights certain assumptions within each of the calculations. The Sanitary Sewer DCC Rate Calculation for Area B 1. The estimated number of units and area of new development were derived from a review of the original Cedar Valley Comprehensive Development Plan DCC Background Report, and refinement of the estimates contained in that report. August 21, DCC Background Report-Final.doc 32
38 Development Cost Charge (DCC) Review 8. SILVERCREEK PARKWAY PARKLAND DEVELOPMENT COST CHARGES 8.1 Silvercreek Parkway Parkland Acquisition DCC Program The Parkland DCC program applies District wide, including Cedar Valley. The Parkland DCC Program identifies the proportion of the costs attributable to future growth and to the existing residents. A municipal assist factor of 1% was then applied in order to determine the amount of costs that is recoverable by DCCs. The cost estimates contain the following assumptions. The Silvercreek Parkway Parkland Program for Areas A, B, and C 1. The cost estimates are based on the 2004 B.C. Assessment Authority assessed values and a 45% increase based on current typical land values. 2. The allocation between new growth and existing population is based on the remaining lands to be purchased. The land acquisition program only includes land required to support growth and therefore 100% of the land cost will be included in the DCC calculation. The Parkway DCC Program is set out in Appendix J. 8.2 Development Cost Charge Calculations for Silvercreek Parkway Parklands By using an equivalent population factor, the relative degree of impact that the new development would have on the capital projects can be determined and then used to calculate the costs to be charged. For this purpose, the following table sets out the equivalent population factors that were used for each type of land use. Since the impact on parks will come principally from residential use, only residential types of land uses will be charged a Parkland DCC. August 21, DCC Background Report-Final.doc 33
39 Development Cost Charge (DCC) Review Land Use Areas A, B, and C Table 9 Equivalent Population Factor Equivalent Population Factor (Number of Persons per that type of Dwelling Unit) Single Family All Areas 3.37 Townhouse All Areas 2.56 Apartment All Areas 2.04 Duplex, Triplex, Fourplex, Sixplex All Areas 1.54 The factors were used to determine equivalent population units. The net amount of the capital parkland projects was divided by the total number of equivalent units to calculate the DCC per equivalent unit. This process was used to determine the DCCs for the entire District. The calculations for the Parkway Parkland DCCs are found in Appendix J. Certain assumptions were made within each of the programs and are as follows. The Silvercreek Parkway Parkland DCC Rate Calculation for Areas A, B, and C 1. The estimated amount of new development for residential land uses was based on a medium growth scenario (see Appendix A for details). August 21, DCC Background Report-Final.doc 34
40 Development Cost Charge (DCC) Review 9. SILVERDALE INDUSTRIAL WATER AND SANITARY SEWER DCC PROGRAM 9.1 Silverdale Industrial Water and Sanitary Sewer DCC Program The Water and Sanitary Sewer DCC program is for a specified area of Silverdale. The specified are is shown in Figure 3. In order to accommodate growth in the Silverdale Industrial Area a unique water supply and sanitary sewer program was developed. The costs of the project are allocated 100% to future growth. The DCC Program identifies the proportion of the costs attributable to future growth. A municipal assist factor of 1% was applied to that amount in order to determine the amount of costs that is recoverable by DCCs. The following assumptions were made in developing the cost estimates. The Water and Sanitary Sewer DCC Program for Silverdale Industrial Area 1. The cost estimates are based on the actual construction costs of the project. 2. The costs are allocated to be 100% the responsibility of growth. The Water and Sanitary Sewer DCC Program is set out in Appendix K. 9.2 Development Cost Charge Calculations for Water and Sanitary Sewer By using the estimated equivalent population for non-residential growth, the relative degree of impact that the new development would have on the capital projects can be ascertained. For this purpose, the water and sanitary population equivalences were set at 45 persons per hectare. The population equivalents were used to determine the equivalent units. The net amount of the capital costs for water and sanitary sewer was divided by the total number of equivalent units to calculate the DCC equivalent water and sanitary unit respectively. The calculations for the Water and Sanitary Sewer DCCs are found in Appendix K. August 21, DCC Background Report-Final.doc 35
41 Development Cost Charge (DCC) Review 10. REGIONAL WATER SUPPLY DCC PROGRAM 10.1 Regional Water Supply DCC Program This Regional Water Supply DCC program applies District wide. The following assumptions were made in developing the cost estimates. The Water Supply DCC Program 1. The cost estimates are derived from the capital program developed in the Joint Abbotsford/Mission Water & Sewer Commission 2006 Update of Water Master Plan, prepared by Dayton and Knight Ltd. Consulting Engineers and adjusted to 2007 dollars. The proposed capital program will meet the community needs for the period 2007 to Depending on the capital project, the costs are allocated to be 20%, 39% or 100% the responsibility of growth. 3. A municipal assist factor of 1% was applied to that amount in order to determine the amount of costs that is recoverable by DCCs. The Water DCC Program is set out in Appendix L Development Cost Charge Calculation for Water By using the estimated number of persons per unit for residential growth and equivalent population for non-residential growth, the relative degree of impact that the new development would have on the capital projects can be ascertained. For this purpose, the following table sets the equivalents that were used for each land use type. August 21, DCC Background Report-Final.doc 36
42 Development Cost Charge (DCC) Review Land Use Table 10 Population Equivalents Population Equivalent Single Family; Compact; Cluster Townhouse Garden Apartment Institutional Residential Industrial General Local Commercial Neighbourhood & Mixed Use Commercial/Residential Schools and Institutional 3.37 Persons per dwelling unit 2.56 persons per dwelling unit 2.04 persons per dwelling unit 1.54 persons per dwelling unit 45 persons per hectare 55 persons per hectare 75 persons per hectare 45 persons per hectare The population equivalents were used to determine the equivalent units. The net amount of the capital costs for the water supply program was divided by the total number of equivalent units to calculate the DCC equivalent water unit. The calculations for the Water DCCs are found in Appendix L. August 21, DCC Background Report-Final.doc 37
43 Development Cost Charge (DCC) Review 11. REGIONAL SEWAGE TREATMENT DCC PROGRAM 11.1 Regional Sewage Treatment DCC Program This Regional Sewage Treatment DCC applies District wide. assumptions were made in developing the cost estimates. The following The Sewage Treatment DCC Program 1. The cost estimates are derived from the Capital Program developed in the Joint Abbotsford/Mission Water & Sewer Commission 2006 Update of Waste Water Master Plan, prepared by Dayton and Knight Ltd. Consulting Engineers and adjusted to 2007 dollars. The proposed capital program will meet the community needs for the period 2007 to Depending on the capital project, the costs are allocated to be either 30% or 100% the responsibility of growth. 3. A municipal assist factor of 1% was applied to that amount in order to determine the amount of costs that is recoverable by DCCs. The Regional Sewage Treatment DCC program is set out in Appendix L Development Cost Charge Calculations for Sanitary Sewer By using the estimated number of persons per unit for residential growth and equivalent population for non-residential growth, the relative degree of impact that the new development would have on the capital projects can be ascertained. For this purpose, the following table sets the equivalents that were used for each land use type. August 21, DCC Background Report-Final.doc 38
44 Development Cost Charge (DCC) Review Table 11 Population Equivalents Land Use Single Family; Compact; Cluster Townhouse Garden Apartment Institutional Residential Industrial General Local Commercial Population Equivalent 3.37 Persons per dwelling unit 2.56 persons per dwelling unit 2.04 persons per dwelling unit 1.54 persons per dwelling unit 45 persons per hectare 55 persons per hectare Neighbourhood & Mixed Use Commercial/Residential 75 persons per hectare Schools and Institutional 45 persons per hectare The population equivalents were used to determine the equivalent units. The net amount of the capital costs for sewage treatment program was divided by the total number of equivalent units to calculate the DCC equivalent sanitary unit. The calculations for the Regional Sanitary Sewer DCCs are found in Appendix L. August 21, DCC Background Report-Final.doc 39
45 Development Cost Charge (DCC) Review 12. SUMMARY OF DEVELOPMENT COST CHARGES Various DCCs were developed for different types of land uses according to specific areas. A summary of these proposed DCCs can be found in Table 12. As well, a comparison of the proposed DCCs and the current DCCs is also shown in Table 12. It is recommended that the new DCC rates be implemented in the new DCC bylaw; a tracking system is implemented for all of the DCC programs; and a review of the DCC programs is conducted every 4-5 years. The implementation of a tracking system for the DCC programs should track the status of the project from conceptual stage through to final construction and should include final costs and budget sources. The District should track the construction costs based on the tender prices that are received and the land costs based on the actual price of the park land acquisition, road widening strips or other land required for servicing purposes. By using this system to delete projects as they are constructed and add new projects as they arise, the District shall be able to keep the DCC program up to date. Annual or bi-annual minor amendments of the DCC programs and rates can be based on the information gained from the tracking system and any new information that becomes available on the impacts of different land uses. More major revisions of the DCC bylaw will occur when: significant land use changes are in process; new major servicing plans are prepared; or the information upon which the DCCs are calculated has become significantly outdated. Based on experience, a major revision is likely needed every four to five years. August 21, DCC Background Report-Final.doc 40
46 Table 12 Proposed DCC Rate Summary Areas Land Use Unit of Measure Roads - All Areas Regional Sewage Treatment Regional Water Supply Silvercreek Parkway Parkland Horne Street Pedestrian Bridge Cedar Valley Roads (Area B) Cedar Valley Drainage (Area B) Cedar Valley Sewer (Area B) Cedar Valley Water (Area B) Cedar Valley Enviromentally Sensitive Parkland Acquisition (Area B) Cedar Valley Enviromentally Sensitive Parkland Development (Area B) Cedar Valley Sewer Extension (Area B) (A) Silverdale Bridge Silverdale Industrial Water Silverdale Industrial Sewer Grand Totals Area "A" Mission Central and Fraser Area Area "B" Cedar Valley Comprehensive Development Area Area "C" Hatzic, Rural, Urban Reserve, Silverdale Proposed Existing Proposed Existing Proposed Existing Proposed Existing Proposed Existing Proposed Existing Proposed Existing Proposed Existing Proposed Existing Existing Existing Existing Existing Proposed Existing Proposed Existing Proposed Existing Increase % Incr. Single Family per dwelling unit 1, , , , , $ 11, $ 6, $ 4, % Townhouse per dwelling unit 1, , , , , $ 8, $ 5, $ 3, % Apartments per dwelling unit , , , , $ 7, $ 4, $ 2, % Duplexes, Triplexes, etc per dwelling unit , , , , $ 10, $ 6, $ 4, % Local Commercial per m 2 of floor area $ $ $ % Neighbourhood and Mixed Use Commercial / Residential per m 2 of floor area $ $ $ % Industrial per m 2 of floor area $ $ $ % Institutional per m 2 of floor area $ $ $ % Single Family per dwelling unit 1, , , , , , , , , , $ 25, $ 16, $ 9, % Compact Single Family per dwelling unit 1, , , , , , , , , , $ 25, $ 16, $ 9, % Cluster Compact Single Family per dwelling unit 1, , , , , , , , , , $ 25, $ 16, $ 9, % Townhouse per dwelling unit 1, , , , , , , , , $ 17, $ 11, $ 6, % Garden Apartment per dwelling unit , , , , , , , $ 12, $ 9, $ 3, % Institutional Res. per dwelling unit , , , , , , $ 10, $ 7, $ 2, % Local Commercial per m 2 of floor area $ $ $ % Neighbourhood Commercial per m 2 of floor area $ $ $ % Mixed Use Commercial / Residential per m 2 of floor area $ $ $ % School per m 2 of floor area $ $ $ % Institutional per m 2 of floor area $ $ $ % Single Family per dwelling unit 1, , , , , $ 11, $ 6, $ 4, % Townhouse per dwelling unit 1, , , , , $ 8, $ 5, $ 3, % Apartments per dwelling unit , , , , $ 6, $ 4, $ 2, % Duplexes, Triplexes, etc per dwelling unit , , , , $ 10, $ 6, $ 4, % Local Commercial per m 2 of floor area $ $ $ % Neighbourhood and Mixed Use Commercial / Residential per m 2 of floor area $ $ $ Industrial per m 2 of floor area $ $ $ % Institutional per m 2 of floor area $ $ $ % Silverdale Industrial (B) Industrial per m 2 of floor area $ $ $ % Industrial per ha of development area 49, , , , , $ 70, $ 70, $ % (A) Cedar Valley Sewer Extension only applies to specified properties in Area "B" (B) Area east of Nelson Street has an additional DCC for the Silverdale Bridge $49, unchanged from the existing DCC bylaw. Development pays both the m2 area DCC and the ha development area DCC. August 21, DCC Background Report-Final.doc 41
47 Development Cost Charge (DCC) Review APPENDIX A Population and Growth Projections (prepared by the District of Mission Planning Department) August 21, DCC Background Report-Final.doc
48 DISTRICT OF MISSION Residential Growth Projections (Medium Growth Scenario) Appendix A Year Residential One Unit Residential Two Unit Residential Townhouse Residential Apartment Residential, One Unit or Two Unit Compact Single Family Residential Cluster Compact Single Family Residential Residential Use, Townhouse Residential Use, Garden Apartment Institutional Residential/U nit Residential One Unit Residential Two Unit ,157 36, % , % ,157 38, % , % , % , % , % , % , % , % ,069 43, % , % , % , % , % , % , % , % , % , % , % ,008 51, % , % , % , % , % , % Total number of units , , ,476 2,771 6,247 18,046 AVG. 1.5% Population Equivalent Total Population Increase 1, ,349 1,673 3,491 1, , , , ,046 Assumptions: Area A - Mission Central and Fraser Area Single Family Multi Family Area B - Cedar Valley Single Family Residential Multi Family Residential Area C - Southwest Mission Single Family Multi Family 50% of Phase I in CV built in 5 years therefore 923 units per 5 years for phase I; 5 years to build out phases II, III and IV single family; multi family spread over 30 years 25% of proposed units in the urban area are infill single family; 75% multi family of which 40% are townhouse units and 60% are apartment units due to waterfront development) Area C determined by adding Hatzic, suburban and rural unit projections together and subtracting 2006 projected population Medium 2% growth per year table was used and projected population was divided over the 5 year period; Cedar Valley unit estimate tables were used for Cedar Valley which are based on number of units by zone and existing lot counts were subtracted Southwest Mission: 3400 acres/5 acre lot size x 3.37 people/household = 2,292 population increase Residential Townhouse Residential Apartment Area C - Rural Mission Single Family Multi Family Residential One Unit Residential Two Unit Residential Townhouse Residential Apartment Total Single Family Residential Units Total Multi- Family Residential Units Total New Residential Units Projected Population Increase (based on # of units) Projected Population Base Projected Growth % U:\Projects_VAN\0995\0035\01\X-Single-File\REVISED from Sharron F Mission growth projections.xls Tab: Residential Growth 8/7/ :55 AM
49 DISTRICT OF MISSION Commercial, Industrial and Institutional Growth Projections (Medium Growth Scenario) Appendix A Area A - Mission Central and Fraser Area Commercial Mixed Use Commercial/Re Area B - Cedar Valley Industrial Area C - Southwest Mission Area C - Rural Mission Silverdale Industrial Industrial Industrial East of Nelson Neighbourhood Centre Schools Institutional Commercial Industrial Institutional Commercial Industrial Institutional Commercial (m 2 ) General (m 2 ) (m²) (m²) (m²) (m²) (m²) (m²) (m²) (m²) m 2 ha m 2 ha Year Commercial (m²) Industrial (m²) Institutional (m²) Local Centre (m 2 ) sidential (m 2 ) Total m 2 of Floor Area ,784 1,858 6, , ,605 6, , ,934 7,432 1,506 6, , ,940 6, , ,006 9,290 1,729 6, , ,004 1, ,238 1,004 3, , ,574 3, , , , ,148 4,534 3, , ,000 3, , ,459 4, ,004 1, ,003 1, , , ,523 3, Total Hectares of Development Area Totals 44,105 21, ,015 6, ,259 3,523 1, , , NOTES: m 2 = meters squared ha = hectares Estimated build out over 5 year period divided by 5 equals a per year area in square meters developed (i.e. year DCCs are to be paid) Total square meters in each land use area: Local commercial - 1/4 of total lot area in Cedar Valley Neighbourhood and Mixed Use com/res. - 1/4 of total lot area in Cedar Valley General Industrial School and Institutional (non-residential) - deleted elementary school from phase 1; divide lot area by 5 for elementary school in phase 2, did not include elementary school in phase 3 (too far out) Area C - Southwest Mission - land use and density will be determined through a neighbourhood planning process Assumed no new schools or institutional However waterfront development could include post secondary school and an increase in civic use Assumed 1000m2 in Hatzic; 200m2 in Stave Falls; 100m2 in Steelhead and 400m2 in Ferdale Maximum floor area for Local Commercial sq m. Maximum floor area for Neighbourhood Commercial sq m.or 1/3 of the gross lot area where the maximum floor area is greater than 50% of the gross lot area The estimate area in the Urban Reserve designation is 100,500 sq m. of useable area (or 70% of the total area minus the multi family and local commercial area) divided by 3 (or 1/3 of area = the estimated floor area) Not sure that the elementary school and fire hall in Phase I (AND THEREFORE IT HAS BEEN DELETED) and the secondary school in Phase II will be built. Exclude the Urban Reserve Area until actual land uses are clearer & most of local commercial in phase 4 8/7/ :58 AM
50 DISTRICT OF MISSION HORNE STREET PED. GROWTH Appendix A REVISED Growth Projections (from District March 13, 2007) Horne Street Pedestrian Walkway Old Report December 2004 From District March 13, 2007 Area (Acre) Total Com. (m2) Total Multi. (units) Area (Acre) Total Com. (m2) Total Multi. (units) Safeway Locale Commercial ( m2/ ac.) , ,492 Multi Family (15/ac.) Waterfront Area Commercial ( m2/ ac.) 8.8 9, ,798 Multi Family (15/ac.) Downtown East Area Commercial ( m2/ ac.) , Multi Family Mini Storage 3100 Total Note: (1) Conversion factor 1133 m 2 per acre. Updated March 13/07 Urban Systems Ltd. U:\Projects_VAN\0995\0035\01\X-Single-File\FINAL with_summary_table_proposed DCC Rate Calc_merged.xls 8/7/2007 9:42 AM
51 Development Cost Charge (DCC) Review APPENDIX B Public Open House Information August 21, DCC Background Report-Final.doc

52

53

54

55

56
57

58

59

60

61

62


63


64


65

66
67
68

69
70 Development Cost Charge (DCC) Review APPENDIX C Capital Cost Estimates August 21, DCC Background Report-Final.doc
71 Development Cost Charge (DCC) Review ROAD CAPITAL COST ESTIMATES District Wide (Areas A, B, and C) August 21, DCC Background Report- Final.doc
72 Appendix C DISTRICT of MISSION D.C.C. Cost Estimate SITE 1: Provide full signals at Murray and Seventh Avenue Updated 2007 Unit Description Unit Quantity Price Total ESTIMATED CONSTRUCTION COSTS Full signals including pedestrian crossing, siren actuated pre-emption L.S , , NOTE: This estimate will be less if existing ducts are not DCC items Sub-total 150, % - Engineering 15, % - Contingency 15, % - Administration 7, TOTAL COST $188, SITE 2: Provide full signals at Cedar Street and Best Avenue Updated 2007 Unit Description Unit Quantity Price Total ESTIMATED CONSTRUCTION COSTS Full signals including pedestrian crossing, siren actuated pre-emption L.S , , NOTE: This estimate will be less if existing ducts are not DCC items Sub-total 150, % - Engineering 15, % - Contingency 15, % - Administration 7, TOTAL COST $188, U:\Projects_VAN\0995\0035\01\X-Single-File\Cost Estimates\ Road Cost Estimates.xls
73 Appendix C DISTRICT of MISSION D.C.C. Cost Estimate SITE 4: Updated 2007 Reconstruct Stave Lake Street from Best Avenue to Cherry (22nd) Avenue, from 7m rural to 14m urban arterial standard Approximate Section length: 390 m Unit Description Unit Quantity Price Total ESTIMATED CONSTRUCTION COSTS Arterial Road Construction m 390 1, , Earthworks m , Import Fill (allow average of 15 m 3 /m at $30.00/m 3 ) m , Retaining wall south of East side (Allowance) L.S , , Storm Sewer m , Pole Relocates (one side only) m , Sub-total 965, % - Engineering 96, % - Contingency 96, % - Administration 48, TOTAL COST $1,207, U:\Projects_VAN\0995\0035\01\X-Single-File\Cost Estimates\ Road Cost Estimates.xls
74 Appendix C DISTRICT of MISSION D.C.C. Cost Estimate SITE 5: Updated 2007 Reconstruct Stave Lake Street from Best Avenue to 11th Avenue to 14m urban arterial from 7m Approximate Section length: 933m Unit Description Unit Quantity Price Total ESTIMATED CONSTRUCTION COSTS Arterial Road Construction m 933 1, , Earthworks m , Retaining wall (933 x 2 x $300.00) m , Storm Sewer m , Pole Relocates L.S. 1 85, , Sub-total 2,208, % - Engineering 220, % - Contingency 220, % - Administration 110, TOTAL COST $2,761, U:\Projects_VAN\0995\0035\01\X-Single-File\Cost Estimates\ Road Cost Estimates.xls
75 Appendix C DISTRICT of MISSION D.C.C. Cost Estimate SITE 6: Updated 2007 Wren Street from Stewart Street to Kenney is to be upgraded from 6m rural to 7m rural plus a 1.8m walking strip Approximate Section length: 636 m (northerly 270 metres is complete) Unit Description Unit Quantity Price Total ESTIMATED CONSTRUCTION COSTS Road Upgrade m , Earthworks at south end m , Allowance for retaining system L.S , , Sub-total 501, % - Engineering 50, % - Contingency 50, % - Administration 25, TOTAL COST $627, U:\Projects_VAN\0995\0035\01\X-Single-File\Cost Estimates\ Road Cost Estimates.xls
76 Appendix C DISTRICT of MISSION D.C.C. Cost Estimate SITE 7: Wren Street from 7th to Stewart Street is to be upgraded to an arterial road section Updated 2007 (14metre from existing 7 metre) Unit Description Unit Quantity Price Total ESTIMATED CONSTRUCTION COSTS Arterial road upgrade m 600 1, , Earthwork m , Storm sewer m , Pole relocation m , Sub-total 780, % - Engineering 78, % - Contingency 78, % - Administration 39, TOTAL COST $976, U:\Projects_VAN\0995\0035\01\X-Single-File\Cost Estimates\ Road Cost Estimates.xls
77 Appendix C DISTRICT of MISSION D.C.C. Cost Estimate SITE 8: Updated 2007 Tyler/ Silver Creek Bridge Unit Description Unit Quantity Price Total ESTIMATED CONSTRUCTION COSTS Assumed 10m wide bridge Assumed 25m span Bridge cost per m 2 m , , Sub-total 750, % - Engineering 75, % - Contingency 75, % - Administration 37, TOTAL COST $938, U:\Projects_VAN\0995\0035\01\X-Single-File\Cost Estimates\ Road Cost Estimates.xls
78 Appendix C DISTRICT of MISSION D.C.C. Cost Estimate SITE 9: Updated 2007 Upgrade 14th Avenue: Grand to Hurd to a 12m wide urban collector road from a rural section (no ditch) 7 to 10 m wide. Approximate Section length: 1707 m Unit Description Unit Quantity Price Total ESTIMATED CONSTRUCTION COSTS Arterial road upgrade m ,039, New arterial road m 512 1, , Storm Sewer m , Pole relocates m , Earthworks m , Credit for 200m north side of West of Cedar m 200 ($870 / 2) -56, Retaining Structure - Bear Crescent sq.m , Miscellaneous retaining walls m , Landscape Reinstatement m , Sub-total 2,145, Land Costs m , % - Engineering 214, % - Contingency 214, % - Administration 107, TOTAL COST $2,890, Land cost estimate provided by District May 23, U:\Projects_VAN\0995\0035\01\X-Single-File\Cost Estimates\ Road Cost Estimates.xls
79 Appendix C DISTRICT of MISSION D.C.C. Cost Estimate SITE 10 Updated 2007 Stave Lake Street from Cherry Avenue to Dewdney Trunk Road is to be upgraded from a 7 m rural road to a 14 m urban arterial Approximate Section length: 416 m Unit Description Unit Quantity Price Total ESTIMATED CONSTRUCTION COSTS Arterial road upgrade m 316 1, , New Arterial m 100 1, , Earthworks m , Import Fill (100 x 7 x 5) m , Pole Relocate (each side) m , Storm Sewer m , Sub-total 916, % - Engineering 91, % - Contingency 91, % - Administration 45, TOTAL COST $1,146, U:\Projects_VAN\0995\0035\01\X-Single-File\Cost Estimates\ Road Cost Estimates.xls
80 Appendix C DISTRICT of MISSION D.C.C. Cost Estimate SITE 11 Highway 7/ Nelson Intersection Approximate Section length: n/a Unit Description Unit Quantity Price Total ESTIMATED CONSTRUCTION COSTS New Arterial m 0.00 Storm Sewer m 0.00 Earthworks m 0.00 Hydro/Tel Relocate m 0.00 Removals L.S Intersection Allowance L.S Sub-total % - Engineering % - Contingency % - Administration 0.00 TOTAL COST $1,000, Estimate based on discussion with District staff, preliminary at this time. U:\Projects_VAN\0995\0035\01\X-Single-File\Cost Estimates\ Road Cost Estimates.xls
81 Appendix C DISTRICT OF MISSION D.C.C. Cost Estimate Site Original 2007 Intersection Upgrade-Cedar and 7th Introduce centre left turn lanes with median (5m total) on 4 legs plus signal upgrade Unit Description Unit Quantity Price Total Estimated Construction Costs Re/re curb and gutter m 1000 $ $ 100, Asphalt widening sq.m $ $ 72, Re/re sidewalk m 1000 $ $ 120, Earthwork allowance cu.m $ $ 70, Median construction m 260 $ $ 65, CB relocation ea. 2 $ 1, $ 3, Line painting m 2500 $ 3.00 $ 7, Reconfigure signals (use ex. Control) L.S. 1 $ 75, $ 75, Landscape restoration sq.m $ 6.00 $ 27, Tree planting ea. 64 $ $ 32, Subtotal $ 571, Land Costs sq.m $ 150, % - Engineering $ 57, % - Contingency $ 57, % - Administration $ 28, TOTAL COST $ 865, Land cost estimate provided by District May 23, U:\Projects_VAN\0995\0035\01\X-Single-File\Cost Estimates\ Road Cost Estimates.xls Cedar-7th
82 Appendix C New 7m Rural Road Item Cost Subgrade Preparation /sq.m. Sub-base gravel with excavation (7 x 0.3 x 65) /cu.m. gravel 20/cu.m. excavation Base gravel with excavation (7 x 0.15 x 75) /cu.m. gravel 20/cu.m. excavation Asphalt (80mm) /tonne Boulevard seeding /sq.m. Traffic management measures TOTAL COST / m $ m Arterial from 9m Rural Section Item Cost Patch and Seal allowance Sub-base gravel with excavation (6.4 x 0.3 x 65) /cu.m. gravel 20/cu.m. excavation Base gravel with excavation (6.4 x 0.15 x 75) /cu.m. gravel 20/cu.m. excavation Base asphalt widening (50mm-3.0m wide) /tonne New asphalt overlay (50mm-12m wide) /tonne Curb & gutter Sidewalk (one side) Street lights per pole 40m spacing Boulevard grading/sodding /sq.m. Traffic management measures TOTAL COST / m $ New 12m Arterial Road Item Cost Subgrade Preparation /sq.m. Sub-base gravel with excavation (15.4 x 0.3 x 65) /cu.m. gravel 20/cu.m. excavation Base gravel with excavation (15.4 x 0.15 x 75) /cu.m. gravel 20/cu.m. excavation Binder Asphalt (50mm-12m wide) /tonne Wearing Asphalt (50mm-12m wide) /tonne Curb Sidewalk (one side) Street lights per pole 40m spacing Boulevard grading/sodding /sq.m. Traffic management measures TOTAL COST / m $1, m Arterial from 7m Rural Section Item Cost Patch and seal existing pavement Sub-base gravel with excavation (8.4 x 0.3 x 65) /cu.m. gravel 20/cu.m. excavation Base gravel with excavation (8.4 x 0.15 x 75) /cu.m. gravel 20/cu.m. excavation Base asphalt (50mm-5m wide) /tonne New asphalt overlay (50mm-12m wide) /tonne Curb Sidewalk (one side) Street lights per pole 40m spacing Boulevard grading/sodding /sq.m. Traffic management measures TOTAL COST / m $ U:\Projects_VAN\0995\0035\01\X-Single-File\Cost Estimates\ Road Cost Estimates.xls
83 Appendix C 14m Arterial from existing 7m Road Item Cost Patch and seal existing pavement Sub-base gravel with excavation (10.4 x 0.3 x 65) /cu.m. gravel 20/cu.m. excavation Base gravel with excavation (10.4 x 0.15 x 75) /cu.m. gravel 20/cu.m. excavation Base asphalt widening (50mm-7m wide) /tonne New asphalt (50mm-14m wide) /tonne Curb Sidewalk Street lights per pole 40m spacing Boulevard grading/sodding /sq.m. Traffic management measures TOTAL COST / m (two sidewalks) $1, One Sidewalk $ Upgrade 6m Road to 7m Walking Strip Item Cost Patch & seal existing pavement Sub-base gravel with excavation (3.8 x 0.3 x 65) /cu.m. gravel 20/cu.m. excavation Base gravel with excavation (3.8 x 0.15 x 75) /cu.m. gravel 20/cu.m. excavation Base asphalt widening (50mm-1m wide) /tonne Asphalt overlay (50mm-8.8m wide) /tonne Ditches (reconstruct 1 / regrade 1) incl. Seed Pavement Markings (3 lines) 9.00 Minor cut/fill TOTAL COST / m $ NO allowance for earthwork or walls 14m Arterial from existing 11m Road (two sidewalks) Item Cost Cost Patch and seal existing pavement Sub-base gravel with excavation (6.4 x 0.3 x 65) /cu.m. gravel 20/cu.m. excavation Base gravel with excavation (6.4 x 0.15 x 75) /cu.m. gravel 20/cu.m. excavation Base asphalt widening (50mm-3m wide) /tonne New asphalt (50mm-14m wide) /tonne Curb Sidewalk Street lights per pole 40m spacing Boulevard grading/sodding /sq.m. Traffic management measures TOTAL COST / m $ $ <-- Reconstruct 1/2 road (site 7A) Arterial Road Cost (14 m + 2 sidewalks) Item Cost Subgrade Preparation Sub-base gravel with excavation (17.4 x 0.3 x 65) /cu.m. gravel 20/cu.m. excavation Base gravel with excavation (17.4 x 0.15 x 75) /cu.m. gravel 20/cu.m. excavation Base asphalt widening (50mm-14m wide) /tonne Wearing asphalt (25mm-14m wide) /tonne Curb Sidewalk Street lights per pole 40m spacing Boulevard grading/sodding /sq.m. Traffic management measures TOTAL COST / m $1, NO allowance for earthwork or walls U:\Projects_VAN\0995\0035\01\X-Single-File\Cost Estimates\ Road Cost Estimates.xls
84 Appendix C Arterial Road Cost (14 m + 2 sidewalks+median) Item Cost Subgrade Preparation Sub-base gravel with excavation (17.4 x 0.3 x 65) /cu.m. gravel 20/cu.m. excavation Base gravel with excavation (17.4 x 0.15 x 75) /cu.m. gravel 20/cu.m. excavation Base asphalt widening (50mm-14m wide) /tonne Wearing asphalt (25mm-14m wide) /tonne Curb Sidewalk Median Street lights per pole 40m spacing Boulevard grading/sodding /sq.m. Landscape trees trees in each boulevard and median at 15m spacing Traffic management measures TOTAL COST / m $1, NO allowance for earthwork or walls Arterial Road Drainage Item Cost Storm sewer ( mm) incl. MH's, CB's & appurtenances Storm sewer ( mm) incl. MH's, CB's & appurtenances Pole relocates 4000/pole/35 (m per pole) Gas relocate (allowance) Minor retaining walls per face sq. m mm diameter Storm Sewer Item Cost Storm Pipe c/w import backfill m spacing m spacing * $ m spacing Over excavation and import backfill Pavement restoration TOTAL COST / m $ mm diameter Storm Sewer Item Cost Storm Pipe c/w import backfill m spacing m spacing * $ m spacing Over excavation and import backfill Pavement restoration TOTAL COST / m $ mm diameter Storm Sewer Item Cost Storm Pipe c/w import backfill m spacing m spacing * $ m spacing Over excavation and import backfill Pavement restoration TOTAL COST / m $ U:\Projects_VAN\0995\0035\01\X-Single-File\Cost Estimates\ Road Cost Estimates.xls
85 Appendix C 900 and 1050 mm diameter Storm Sewer Item Cost Storm Pipe c/w import backfill m spacing m spacing * $ m spacing Over excavation and import backfill Pavement restoration TOTAL COST / m $1, and 1350 mm diameter Storm Sewer Item Cost Storm Pipe c/w import backfill 1, m spacing m spacing * $ m spacing Over excavation and import backfill Pavement restoration TOTAL COST / m $1, U:\Projects_VAN\0995\0035\01\X-Single-File\Cost Estimates\ Road Cost Estimates.xls
86 Development Cost Charge (DCC) Review ROAD CAPITAL COST ESTIMATES Cedar Valley (Area B) August 21, DCC Background Report- Final.doc
87 Appendix C DISTRICT OF MISSION D.C.C. Cost Estimate Site Updated 2007 Cade Barr - DTR to 14th (CVR 1) Upgrade to 14m arterial from 10m half road, length of 990 metres Unit Description Unit Quantity Price Total Estimated Construction Costs Arterial road widening m 990 $ $ 891, Earthworks allowance m 990 $ $ 79, Storm sewer m 990 $ $ 450, Underground utilities m 990 $ $ 594, Retaining at Whidden (80m x 3m high) sq.m. 240 $ $ 120, Retaining- miscelaneous Best to Whidden sq.m. 150 $ $ 45, Subtotal $ 2,179, % - Engineering $ 218, % - Contingency $ 218, % - Administration $ 109, TOTAL COST $ $2,725, Notes: 1. Excludes partial area through new development south of DRT built out. U:\Projects_VAN\0995\0035\01\X-Single-File\Cost Estimates\ Cedar Valley Road cost estimates.xls CVR1
88 Appendix C DISTRICT OF MISSION D.C.C. Cost Estimate Site Updated 2007 Cedar Street - Laminman to Dewdney Trunk Road (CVR 2) Upgrade to 14m divided arterial from 6m road, length of 300 metres Unit Description Unit Quantity Price Total Estimated Construction Costs New arterial road m 300 $ 1, $ 466, Earthworks m 300 $ $ 24, Storm sewer m 300 $ $ 136, Pole relocates m 300 $ $ 69, Underground utilities m 300 $ $ 180, Subtotal $ 876, Land Costs sq.m $ 167, % - Engineering $ 87, % - Contingency $ 87, % - Administration $ 43, TOTAL COST $ $1,263, Land cost estimate provided by District May 23, /16/2007 U:\Projects_VAN\0995\0035\01\X-Single-File\Cost Estimates\ Cedar Valley Road cost estimates.xls CVR2
89 Appendix C DISTRICT OF MISSION D.C.C. Cost Estimate Site Updated 2007 Cedar Street - Egglestone to Tunbridge (CVR 3) Upgrade to 14m divided arterial from 6m road, length of 400 metres Unit Description Unit Quantity Price Total Estimated Construction Costs New arterial road m 400 $ 1, $ 622, Earthworks m 400 $ $ 32, Storm sewer m 400 $ $ 256, Pole relocates m 400 $ $ 92, Underground utilities m 400 $ $ 240, Subtotal $ 1,242, Land Costs sq.m $ 324, % - Engineering $ 124, % - Contingency $ 124, % - Administration $ 62, TOTAL COST $ $1,877, Land cost estimate provided by District May 23, /16/2007 U:\Projects_VAN\0995\0035\01\X-Single-File\Cost Estimates\ Cedar Valley Road cost estimates.xls CVR3
90 Appendix C DISTRICT OF MISSION D.C.C. Cost Estimate Site Updated 2007 Cedar Street - Tunbridge to Laminman (CVR 4) Upgrade to 14m divided arterial from 6m road, length of 540 metres Unit Description Unit Quantity Price Total Estimated Construction Costs New arterial road m 540 $ 1, $ 839, Earthworks m 540 $ $ 43, Storm sewer m 540 $ $ 245, Pole relocates m 540 $ $ 124, Underground utilities m 540 $ $ 324, Subtotal $ 1,576, Land Costs sq.m $ 292, % - Engineering $ 157, % - Contingency $ 157, % - Administration $ 78, TOTAL COST $ $2,264, Land cost estimate provided by District May 23, /16/2007 U:\Projects_VAN\0995\0035\01\X-Single-File\Cost Estimates\ Cedar Valley Road cost estimates.xls CVR4
91 Appendix C DISTRICT OF MISSION D.C.C. Cost Estimate Site Updated 2007 Cedar Street - Cherry to Egglestone (CVR 5) Upgrade to 14m divided arterial from 6m road, length of 420 metres Unit Description Unit Quantity Price Total Estimated Construction Costs New arterial road m 420 $ 1, $ 653, Earthworks m 420 $ $ 33, Storm sewer m 420 $ $ 268, Pole relocates m 420 $ $ 96, Underground utilities m 420 $ $ 252, Subtotal $ 1,304, Land Costs sq.m $ 229, % - Engineering $ 130, % - Contingency $ 130, % - Administration $ 65, TOTAL COST $ $1,860, Land cost estimate provided by District May 23, /16/2007 U:\Projects_VAN\0995\0035\01\X-Single-File\Cost Estimates\ Cedar Valley Road cost estimates.xls CVR5
92 Appendix C DISTRICT OF MISSION D.C.C. Cost Estimate Site Updated th Avenue - Cade Barr to Grand (CRV11) Upgrade to 14m atrerial from 9 metre rural, length of 560 metres Unit Description Unit Quantity Price Total Estimated Construction Costs Arterial road widening m 560 $ 1, $ 596, Earthworks allowance m 560 $ $ 44, Storm sewer m 280 $ $ 127, Underground utilities m 560 $ $ 336, Subtotal $ 1,104, % - Engineering $ 110, % - Contingency $ 110, % - Administration $ 55, TOTAL COST $ $1,381, U:\Projects_VAN\0995\0035\01\X-Single-File\Cost Estimates\ Cedar Valley Road cost estimates.xls CVR11
93 Appendix C DISTRICT OF MISSION D.C.C. Cost Estimate Site Updated 2007 Grand - 14th Ave. to 11th Ave. (CVR12) Half Road improvement plus intersection, length of 340 metres Unit Description Unit Quantity Price Total Estimated Construction Costs Arterial road widening m 240 $ $ 153, Arterial Road construction m 100 $ 1, $ 127, Earthworks allowance m 340 $ $ 27, Storm sewer m 340 $ $ 154, Underground utilities m 340 $ $ 204, Subtotal $ 667, % - Engineering $ 66, % - Contingency $ 66, % - Administration $ 33, TOTAL COST $ $835, U:\Projects_VAN\0995\0035\01\X-Single-File\Cost Estimates\ Cedar Valley Road cost estimates.xls CVR12
94 Appendix C DISTRICT of MISSION D.C.C. Cost Estimate CVR Signals Updated 2007 Unit Description Unit Quantity Price Total ESTIMATED CONSTRUCTION COSTS Full signals including pedestrian crossing, siren actuated pre-emption L.S , , NOTE: This estimate will be less if existing ducts are not DCC items Sub-total 150, % - Engineering 15, % - Contingency 15, % - Administration 7, TOTAL COST $188, U:\Projects_VAN\0995\0035\01\X-Single-File\Cost Estimates\ Cedar Valley Road cost estimates.xls
95 Appendix C DISTRICT OF MISSION D.C.C. Cost Estimate Unit Cost for Cedar Street Arterial Road Cost (14 m + 2 sidewalks+median) Item Cost Subgrade Preparation Sub-base gravel with excavation (17.4 x 0.3 x 65) /gravel 20/cexcavation Base gravel with excavation (17.4 x 0.15 x 75) /gravel 20/cexcavation Base asphalt widening (50mm-14m wide) /tonne Wearing asphalt (25mm-14m wide) /tonne Curb Sidewalk Median Street lights per pole 40m spacing Boulevard grading/sodding /sq.m. Landscape trees trees in each boulevard and med Traffic management measures TOTAL COST / m $1, NO allowance for earthwork or walls *Road assumed as completely new due to centre median configuration 8/16/2007 U:\Projects_VAN\0995\0035\01\X-Single-File\Cost Estimates\ Cedar Valley Road cost estimates.xls Unit Cost Cedar
96 Development Cost Charge (DCC) Review DRAINAGE CAPITAL COST ESTIMATES Cedar Valley (Area B) August 21, DCC Background Report- Final.doc
97
98 DISTRICT of MISSION D.C.C. Cost Estimate Appendix C Drainage (Area A page 1 of 2) CV Culvert Area A: 1500 mm culvert Updated 2007 (1) Unit Description Unit Quantity Price Total ESTIMATED CONSTRUCTION COSTS Culvert 1500mm m 40 1, , Sub-total 72, % - Engineering 10, % - Contingency 21, % - Administration 3, TOTAL COST $108, CV Trk Stm & Struc Area A: 1050mm storm sewer, diversion structure, 675mm outfall Updated 2007 (1) Unit Description Unit Quantity Price Total ESTIMATED CONSTRUCTION COSTS 1050mm storm sewer m , Diversion structure L.S. 1 15, , mm outfall m , Sub-total 299, % - Engineering 45, % - Contingency 90, % - Administration 15, TOTAL COST $450, Notes: (1) Cost from 2006 USL, Cedar Valley Master Drainage plan update. U:\Projects_VAN\0995\0035\01\X-Single-File\Cost Estimates\ Drainage Cost Estimates.xls
99 DISTRICT of MISSION D.C.C. Cost Estimate Appendix C Drainage (Area A page 2 of 2) CV Detention Pond Area A: 19,400 m 3 pond Updated 2007 (1) Unit Description Unit Quantity Price Total ESTIMATED CONSTRUCTION COSTS Pond A m ,455, Sub-total 1,455, Land Costs (2) 233, % - Engineering (excluding land) 218, % - Contingency (excluding land) 436, % - Administration (excluding land) 72, TOTAL COST $2,417, Notes: (1) Cost from 2006 USL, Cedar Valley Master Drainage plan update. (2) Reflects debt owing Land Sale Reserve Fund of $231,627 inflated to collect full amount with 1% assist factor ($233,967). U:\Projects_VAN\0995\0035\01\X-Single-File\Cost Estimates\ Drainage Cost Estimates.xls
100 DISTRICT of MISSION D.C.C. Cost Estimate Appendix C Drainage (Area B page 1 of 2) CV Culvert 1 Area B: 1350 mm culvert Updated 2007 (1) Unit Description Unit Quantity Price Total ESTIMATED CONSTRUCTION COSTS Culvert 1350mm m 50 1, , Sub-total 79, % - Engineering 12, % - Contingency 24, % - Administration 4, TOTAL COST $120, CV Culvert 2 Area B: 1500 mm culvert Updated 2007 (1) Unit Description Unit Quantity Price Total ESTIMATED CONSTRUCTION COSTS Culvert 1500mm m 25 1, , Sub-total 45, % - Engineering 6, % - Contingency 13, % - Administration 2, TOTAL COST $68, Notes: (1) Cost from 2006 USL, Cedar Valley Master Drainage plan update. U:\Projects_VAN\0995\0035\01\X-Single-File\Cost Estimates\ Drainage Cost Estimates.xls
101 DISTRICT of MISSION D.C.C. Cost Estimate Appendix C Drainage (Area B page 2 of 2) CV Trk Stm & Outfall Area B: 900mm storm sewer, 375mm outfall Updated 2007 (1) Unit Description Unit Quantity Price Total ESTIMATED CONSTRUCTION COSTS 900mm m , mm outfall m , Sub-total 401, % - Engineering 60, % - Contingency 120, % - Administration 20, TOTAL COST $602, CV Detention Pond Area B: 8,500 m 3 pond Updated 2007 (1) Unit Description Unit Quantity Price Total ESTIMATED CONSTRUCTION COSTS Pond B m , Sub-total 637, Land Costs (2) m ,196, % - Engineering (excluding land) 95, % - Contingency (excluding land) 191, % - Administration (excluding land) 31, TOTAL COST $2,153, Notes: (1) Cost from 2006 USL, Cedar Valley Master Drainage plan update. (2) Land cost estimate provided by District May 23, U:\Projects_VAN\0995\0035\01\X-Single-File\Cost Estimates\ Drainage Cost Estimates.xls
102 DISTRICT of MISSION D.C.C. Cost Estimate Appendix C Drainage (Area C page 1 of 1) CV Trk Stm & Outfall Area C: 750mm storm sewer, 450mm outfall Updated 2007 (1) Unit Description Unit Quantity Price Total ESTIMATED CONSTRUCTION COSTS 750mm m , mm outfall m , Sub-total 60, % - Engineering 9, % - Contingency 18, % - Administration 3, TOTAL COST $91, CV Detention Pond Area C: 5,000 m 3 pond Updated 2007 (1) Unit Description Unit Quantity Price Total ESTIMATED CONSTRUCTION COSTS Pond C m , Sub-total 375, Land Costs (2) m , % - Engineering (excluding land) 56, % - Contingency (excluding land) 112, % - Administration (excluding land) 18, TOTAL COST $1,317, Notes: (1) Cost from 2006 USL, Cedar Valley Master Drainage plan update. (2) Land cost estimate provided by District May 23, U:\Projects_VAN\0995\0035\01\X-Single-File\Cost Estimates\ Drainage Cost Estimates.xls
103 DISTRICT of MISSION D.C.C. Cost Estimate Appendix C Drainage (Area D page 1 of 5) CV Culvert 1 Area D: 2400X1200mm Box Culvert Updated 2007 (1) Unit Description Unit Quantity Price Total ESTIMATED CONSTRUCTION COSTS 2400X1200mm Box Culvert m 25 3, , Sub-total 75, % - Engineering 11, % - Contingency 22, % - Administration 3, TOTAL COST $113, CV Culvert 2 Area D: 2400X1200mm Box Culvert Updated 2007 (1) Unit Description Unit Quantity Price Total ESTIMATED CONSTRUCTION COSTS 2400X1200mm Box Culvert m 25 3, , Sub-total 75, % - Engineering 11, % - Contingency 22, % - Administration 3, TOTAL COST $113, Notes: (1) Cost from 2006 USL, Cedar Valley Master Drainage plan update. U:\Projects_VAN\0995\0035\01\X-Single-File\Cost Estimates\ Drainage Cost Estimates.xls
104 DISTRICT of MISSION D.C.C. Cost Estimate Appendix C Drainage (Area D page 2 of 5) CV Culvert 3 Area D: 2400X1200mm Box Culvert Updated 2007 (1) Unit Description Unit Quantity Price Total ESTIMATED CONSTRUCTION COSTS 2400X1200mm Box Culvert m 25 3, , Sub-total 75, % - Engineering 11, % - Contingency 22, % - Administration 3, TOTAL COST $113, CV Trk Stm & Outfall Area D: 900mm storm sewer, Diversion structure, 900mm outfall Updated 2007 (1) Unit Description Unit Quantity Price Total ESTIMATED CONSTRUCTION COSTS 900mm m , Diversion structure L.S. 25, mm outfall m Sub-total 353, % - Engineering 53, % - Contingency 106, % - Administration 17, TOTAL COST $531, Notes: (1) Cost from 2006 USL, Cedar Valley Master Drainage plan update. U:\Projects_VAN\0995\0035\01\X-Single-File\Cost Estimates\ Drainage Cost Estimates.xls
105 DISTRICT of MISSION D.C.C. Cost Estimate Appendix C Drainage (Area D page 3 of 5) CV Detention Pond D1 Area D: 7,970 m 3 pond Updated 2007 (1) Unit Description Unit Quantity Price Total ESTIMATED CONSTRUCTION COSTS Pond D1 m , Sub-total 597, Land Costs (2) m ,131, % - Engineering (excluding land) 89, % - Contingency (excluding land) 179, % - Administration (excluding land) 29, TOTAL COST $2,028, CV Detention Pond D2 Area D: 1,640 m 3 pond Updated 2007 (1) Unit Description Unit Quantity Price Total ESTIMATED CONSTRUCTION COSTS Pond D2 m , Sub-total 123, Land Costs (3) 180, % - Engineering (excluding land) 18, % - Contingency (excluding land) 36, % - Administration (excluding land) 6, TOTAL COST $366, Notes: (1) Cost from 2006 USL, Cedar Valley Master Drainage plan update. (2) Land cost estimate provided by District June 5, (3) Reflects debt owing Land Sale Reserve Fund of $178,611 inflated to collect full amount with 1% assist factor ($180,415). U:\Projects_VAN\0995\0035\01\X-Single-File\Cost Estimates\ Drainage Cost Estimates.xls
106 DISTRICT of MISSION D.C.C. Cost Estimate Appendix C Drainage (Area D page 4 of 5) CV Detention Pond D3 Area D: 3,710 m 3 pond Updated 2007 (1) Unit Description Unit Quantity Price Total ESTIMATED CONSTRUCTION COSTS Pond D3 m , Sub-total 278, Land Costs (2) m , % - Engineering (excluding land) 41, % - Contingency (excluding land) 83, % - Administration (excluding land) 14, TOTAL COST $1,003, CV Detention Pond D4 Area D: 1,440 m 3 pond Updated 2007 (1) Unit Description Unit Quantity Price Total ESTIMATED CONSTRUCTION COSTS Pond D4 m , Sub-total 108, Land Costs (2) m , % - Engineering (excluding land) 16, % - Contingency (excluding land) 32, % - Administration (excluding land) 5, TOTAL COST $448, Notes: (1) Cost from 2006 USL, Cedar Valley Master Drainage plan update. (2) Land cost estimate provided by District June 5, U:\Projects_VAN\0995\0035\01\X-Single-File\Cost Estimates\ Drainage Cost Estimates.xls
107 DISTRICT of MISSION D.C.C. Cost Estimate Appendix C Drainage (Area D page 5 of 5) CV Detention Pond D5 Area D: 115 m 3 pond Updated 2007 (1) Unit Description Unit Quantity Price Total ESTIMATED CONSTRUCTION COSTS Pond D5 (2) m , Sub-total Land Costs (3) m Contingency (4) 7, TOTAL COST $65, CV Detention Pond D6 Area D: 1,020 m 3 pond Updated 2007 (1) Unit Description Unit Quantity Price Total ESTIMATED CONSTRUCTION COSTS Pond D6 m , Sub-total 76, Land Costs (3) m , % - Engineering (excluding land) 11, % - Contingency (excluding land) 23, % - Administration (excluding land) 3, TOTAL COST $336, Notes: (1) Cost from 2006 USL, Cedar Valley Master Drainage plan update. (2) Cost estimate from July 19, 2007 faxed quotation from Vantage Contracting Ltd. (3) Land cost estimate provided by District June 5, (4) Contingecy estimate provided by District August 19, U:\Projects_VAN\0995\0035\01\X-Single-File\Cost Estimates\ Drainage Cost Estimates.xls
108 DISTRICT of MISSION D.C.C. Cost Estimate Appendix C Drainage (Area E page 1 of 3) CV Culvert 1 Area E: 1050 mm culvert Updated 2007 (1) Unit Description Unit Quantity Price Total ESTIMATED CONSTRUCTION COSTS Culvert 1050mm m 25 1, , Sub-total 29, % - Engineering 4, % - Contingency 8, % - Administration 1, TOTAL COST $45, CV Detention Pond E1 Area E: 2,065m 3 pond Updated 2007 (1) Unit Description Unit Quantity Price Total ESTIMATED CONSTRUCTION COSTS Pond E1 m , Sub-total 154, Land Costs (2) m % - Engineering (excluding land) 23, % - Contingency (excluding land) 46, % - Administration (excluding land) 7, TOTAL COST $233, Notes: (1) Cost from 2006 USL, Cedar Valley Master Drainage plan update. U:\Projects_VAN\0995\0035\01\X-Single-File\Cost Estimates\ Drainage Cost Estimates.xls
109 DISTRICT of MISSION D.C.C. Cost Estimate Appendix C Drainage (Area E page 2 of 3) CV Detention Pond E2 Area E: 185m 3 pond Updated 2007 (1) Unit Description Unit Quantity Price Total ESTIMATED CONSTRUCTION COSTS Pond E2 m , Sub-total 13, Land Costs (2) m , % - Engineering (excluding land) 2, % - Contingency (excluding land) 4, % - Administration (excluding land) TOTAL COST $99, CV Detention Pond E4 Area E: 870m 3 pond Updated 2007 (1) Unit Description Unit Quantity Price Total ESTIMATED CONSTRUCTION COSTS Pond E4 m , Sub-total 65, Land Costs (2) m , % - Engineering (excluding land) 9, % - Contingency (excluding land) 19, % - Administration (excluding land) 3, TOTAL COST $293, Notes: (1) Cost from 2006 USL, Cedar Valley Master Drainage plan update. U:\Projects_VAN\0995\0035\01\X-Single-File\Cost Estimates\ Drainage Cost Estimates.xls
110 DISTRICT of MISSION D.C.C. Cost Estimate Appendix C Drainage (Area E page 3 of 3) CV Detention Pond E5 Area E: 400m 3 pond Updated 2007 (1) Unit Description Unit Quantity Price Total ESTIMATED CONSTRUCTION COSTS Pond E5 m , Sub-total 30, Land Costs (2) m , % - Engineering (excluding land) 4, % - Contingency (excluding land) 9, % - Administration (excluding land) 1, TOTAL COST $162, Notes: (1) Cost from 2006 USL, Cedar Valley Master Drainage plan update. U:\Projects_VAN\0995\0035\01\X-Single-File\Cost Estimates\ Drainage Cost Estimates.xls
111 DISTRICT of MISSION D.C.C. Cost Estimate Appendix C Drainage (Dewdney Trunk page 1 of 1) CV Dewdney Trunk Ditch Improvements Required by DFO as part of the Cedar Valley Master Drainage Plan Update Updated 2007 (1) Unit Description Unit Quantity Price Total ESTIMATED CONSTRUCTION COSTS Ditch improvements m 260 1, , Sub-total 286, Land Costs (2) m 2 15% - Engineering (excluding land) 42, % - Contingency (excluding land) 85, % - Administration (excluding land) 14, TOTAL COST $429, Notes: (1) Cost from 2006 USL, Cedar Valley Master Drainage plan update. U:\Projects_VAN\0995\0035\01\X-Single-File\Cost Estimates\ Drainage Cost Estimates.xls
112 DISTRICT of MISSION D.C.C. Cost Estimate Appendix C Drainage (Gaudin Creek page 1 of 1) CV Gaudin Creek South Realignment Updated 2007 (1) Unit Description Unit Quantity Price Total ESTIMATED CONSTRUCTION COSTS Creek realignment and land acquisition m 900 1, , Sub-total 990, Land Costs (2) m ,696, % - Engineering (excluding land) 148, % - Contingency (excluding land) 297, % - Administration (excluding land) 49, TOTAL COST $3,182, Notes: (1) Cost from 2006 USL, Cedar Valley Master Drainage plan update. (2) Land cost estimate provided by District June 5, 2007 ($526,103/ acre, $130/m2). U:\Projects_VAN\0995\0035\01\X-Single-File\Cost Estimates\ Drainage Cost Estimates.xls
113 Appendix C Urban Systems Ltd. Proj. # District of Mission Cedar Valley Master Drainage Plan Update Basis of Costs CAPITAL COSTS O&M COSTS $/lin.m.* Detention Ponds 4% of Capital Cost Pipe Size (mm dia) Storm Drains Culverts Storm Drain Systems 1% of Capital Cost 300 $180 Water Quality Structures 4% of Capital Cost 375 $230 Environmental / Fisheries 5% of Capital Cost 450 $ $340 Present Worth of O&M Costs 600 $391 $ $440 $725 PW = 1-(1+i) -n 750 $490 $810 i 900 $590 $ $690 $1,185 where i = 5.50% 1200 $800 $1,395 n = 20 years 1350 $900 $1, $1,000 $1,800 Manholes (mm dia) $/each $/metre** 1050 (for <900mm pipe) $2,500 $ (for 1050 mm pipe) $3,500 $ (for 1200 mm pipe) $5,000 $ (for 1350 mm pipe) $6,000 $ (for 1500 mm pipe) $7,250 $50 Detention Ponds (<1.5m deep) $75 per cu.m. storage volume Detention Ponds (>1.5m deep) $85 per cu.m. storage volume Riparian Planting $25 per sq.m. Road Removal / Restoration $40 per sq.m. * Price includes installation and imported bedding / backfill. ** Assumes 155 metre spacing between manholes. Other Unit Costs Top inlet catch basin $1,500 per each Service Connections 100 mm $100 per lin.m. 150 mm $115 per lin.m. 200 mm $130 per lin.m. Inspection Chambers $500 per each Rip Rap $35 per cu.m. Oil / Sediment Removal Structure $25,000 per each Disconnection of Roof Leaders $500 per lot Swales $20 per lin.m. Swales with Perforated Underdrain $120 per lin.m. Ditch Excavation $70 per lin.m. Wetland Vegetation Planting $45 per sq.m. Check Dams $250 per each Rock Liners $80 per lin.m. Porous Pavement (Asphalt) $40 per sq.m. Large Woody Debris (LWD) $150 per each Gravel / Cobble Stream Substrate $80 per sq.m. Bioengineered Slope Stabilization: Live Reinforced Earth Walls $150 per lin.m. Wattle Fences $90 per lin.m. Live Stakes $5 per sq.m. (based on 1 m spacing) Ditch Habitat Enhancement $260 per lin.m. File: U:\Projects_VAN\0995\0035\01\X-Single-File\Cost Estimates\ Drainage Cost Estimates.xls.xls 8/21/2007
114 Development Cost Charge (DCC) Review WATER CAPITAL COST ESTIMATES Cedar Valley (Area B) August 21, DCC Background Report- Final.doc
115 Appendix C Length Size Cost/m Total Cost Emiry - North of Laminman $ 65, Laminman $ 206, Rosetta - Cedar to Hammond $ 266, Egglestone - West of Cedar $ 495, Dalke $ 210, Right-of-way - Dewdney Trunk Rd. (DTR) to E. end of Rosetta $ 168, DTR - Cedar to Ferndale $ 705, DTR - Ferndale to Tunbridge $ 564, DTR - Tunbridge to Harms $ 606, U:\Projects_VAN\0995\0035\01\X-Single-File\Cost Estimates\2007 water cost estimates (version 1).xls
116 Appendix C PIPE INSTALLATION Item Units Pipes (with imported backfill) Size mm Material PVC PVC PVC PVC Unit Cost $/m Valve-Tee Assembly Type gate Size mm Price $ $ 2,000 $ 3,000 $ 4,200 $ 7,000 Spacing m Hydrant Type Size mm Price hydrant $/ea $ 2, $ 2, $ 2, $ 2, Tee $/ea $ $ $ $ 2, lead $/m $ $ $ $ valve $/ea $ $ $ $ Subtotal $/ea $ 4, $ 4, $ 4, $ 5, Spacing m Service Connections Commercial $/ea 4000 Spacing m 200 Traffic Control $/day $ 1, $ 1, $ 1, $ 1, m/day Subtotal Unit Cost $/m $ $ $ $ Engineering and Contingency 35% $/m $ $ $ $ TOTAL UNIT COST $/m $ $ $ $ RESTORATION Item Units Shoulder (50%) mm base $/m 2 $ 7.50 $ 7.50 $ 7.50 $ 7.50 Asphalt (50%) 300mm subbase $/m^2 $ $ $ $ mm base $/m^2 $ 7.50 $ 7.50 $ 7.50 $ mm asphalt $/m^2 $ $ $ $ Subtotal $/m^2 $ $ $ $ Trench width m 2 /m Subtotal Unit Cost $/m $ $ $ $ Engineering and Contingency 35% $/m $ $ $ $ TOTAL UNIT COST $/m $ $ $ $ TOTAL PIPE + RESTORATION $/m $ $ $ $ ADMINSTRATION 5% $ $ $ $ Say $ $ $ $ U:\Projects_VAN\0995\0035\01\X-Single-File\Cost Estimates\2007 water cost estimates (version 1).xls
117 Development Cost Charge (DCC) Review APPENDIX D Road DCC Program and Calculations Areas A, B, and C August 21, DCC Background Report-Final.doc
118 DISTRICT OF MISSION ROADS DCC PROGRAM AREAS A, B, AND C Appendix D MISSION CENTRAL FRASER; CEDAR VALLEY; HATZIC, RURAL, URBAN RESERVE AND SILVERDALE Project No. Location Column Col. (1) Col. (2) Col. (3) Description Cost Estimate (1) Col. (4) = Col. (2) x Col. (3) Benefit to New Development Col. (5) Municipal Assist Factor 1% Col. (6) = Col. (4) - Col. (5) DCC Recoverable Col. (7) = Col. (2) - Col. (6) Total Municipal Responsibility On From To 1 Intersection Murray Street Seventh Avenue Signal $188, % $188,000 $1,880 $186,120 $1,880 2 Intersection Cedar Street Best Avenue Signal $188, % $188,000 $1,880 $186,120 $1,880 3 Cedar Valley Connector (2) Fraser Crescent Seventh Avenue New Arterial Road $1,533, % $1,533,113 $15,331 $1,517,782 $15,331 4 Stave Lake Street Best Avenue Cherry Avenue (22nd) Road Upgrade $1,207, % $1,207,000 $12,070 $1,194,930 $12,070 5 Stave Lake Street Best Avenue Eleventh Avenue Road Upgrade $2,761, % $2,761,000 $27,610 $2,733,390 $27,610 6 Wren Street Teal Street Kenny Avenue Road Upgrade $627, % $627,000 $6,270 $620,730 $6,270 7 Wren Street Seventh Avenue Teal Street Road Upgrade $976, % $976,000 $9,760 $966,240 $9,760 8 Wren Street Tyler Street Silvercreek Bridge Bridge Upgrade $938, % $938,000 $9,380 $928,620 $9,380 9 Fourteenth Grand Street Hurd Street Road Upgrade $2,890, % $2,890,000 $28,900 $2,861,100 $28, Stave Lake Street Cherry Avenue Dewdney Trunk Road Road Upgrade $1,146, % $1,146,000 $11,460 $1,134,540 $11, Highway 7 Highway 7 Nelson Intersection $1,000, % $1,000,000 $10,000 $990,000 $10, Lougheed Hwy E. Bypass Study Study $45, % $45,000 $450 $44,550 $ Cedar Cedar 7th Avenue Intersection $865, % $865,300 $8,653 $856,647 $8, Transportation Study Study $100, % $100,000 $1,000 $99,000 $1, DCC Review Study $24, % $24,000 $240 $23,760 $240 TOTALS $14,488,413 $14,488,413 $144,884 $14,343,529 $144,884 Benefit Factor Notes (1) Cost estimates have been updated from the 2004 DCC Review and include 10% engineering, 10% contingency and 5% administration.. (2) Original estimate for Project #3 reflects a contribution from the Canada/ BC Infrastructure Program. Cost reflects balance owing the Mission Equipment Replacement Reserve and Segregated General Capital Reserve Funds ($1,425,000, $92,782). From District of Mission March 30, Urban Systems Ltd. U:\Projects_VAN\0995\0035\01\X-Single-File\FINAL with_summary_table_proposed DCC Rate Calc_merged.xls 8/7/ :01 AM
119 DISTRICT OF MISSION ROAD DCC RATE CALCULATION AREAS A, B AND C Appendix D MISSION CENTRAL FRASER; CEDAR VALLEY; HATZIC, RURAL, URBAN RESERVE AND SILVERDALE A: Traffic Generation Calculation Col. (1) Col. (2) Col. (3) Col. (4) = (1) x (3) Land Use Trips/Unit (residential - per Estimated New Development Unit peak hr/unit; other - trips per Trips peak hr/m 2 ) Single Family Residential (1) 3,476 Dwelling Units ,546 Multi Family Residential Townhouse (1) 1,548 Dwelling Units ,006 Apartment (1) 1,223 Dwelling Units Duplex, Triplex, Fourplex, Sixplex (1) 0 Dwelling Units Commercial (1) 57,248 square metres gross floor area ,660 Industrial (1) 68,395 square metres gross floor area Institutional (1) 14,782 square metres gross floor area ,368 Total Trip Ends 8524 (a) B: Unit Road DCC Calculation Net Road DCC Program Recoverable $14,343,529 (b) Existing DCC Reserve Monies $771,706 (c) Net Amount to be Paid by DCCs $13,571,823 (d) = (b) - (c) DCC per Trip End $1, (e) = (d)/(a) C: Resulting Road DCCs Single Family Residential $1, per Dwelling Unit (e) x Col. (3) Multi Family Residential Townhouse $1, per Dwelling Unit (e) x Col. (3) Apartment $ per Dwelling Unit (e) x Col. (3) Duplex, Triplex, Fourplex, Sixplex $ per Dwelling Unit (e) x Col. (3) Commercial $46.18 per square meter gross floor area (e) x Col. (3) Industrial $7.17 per square meter gross floor area (e) x Col. (3) Institutional $31.85 per square meter gross floor area (e) x Col. (3) Notes (1) Growth projections provided by the District March 14, (2) DCC reserves from District of Mission March 30, 2007, balance to December 31, (3) Residential values do include the Southwest Mission area. Urban Systems Ltd. U:\Projects_VAN\0995\0035\01\X-Single-File\FINAL with_summary_table_proposed DCC Rate Calc_merged.xls 8/7/ :00 AM
120 Development Cost Charge (DCC) Review APPENDIX E Road DCC Program and Calculations Area B August 21, DCC Background Report-Final.doc
121 DISTRICT OF MISSION ROAD DCC PROGRAM AREA B Appendix E CEDAR VALLEY Project No. Column Location Col. (1) Col. (2) Col. (3) Cost Estimate (2) Col. (4) = Col. (2) x Col. (3) Col. (5) Municipal Assist Factor 1% Col. (6) = Col. (4) - Col. (5) DCC Recoverable Col. (7) = Col. (2) - Col. (6) Total Municipal Responsibility Description On From To CVR1 Cade Barr Widening DTR 14th Road Widening $2,725, % $2,725,000 $27,250 $2,697,750 $27,250 CVR2 Cedar Street Laminmen DTR Road Widening $1,263, % $1,263,000 $12,630 $1,250,370 $12,630 CVR3 Cedar Street Egglestone Tunbridge Road Widening $1,877, % $1,877,000 $18,770 $1,858,230 $18,770 CVR4 Cedar Street Tunbridge Laminmen Road Widening $2,264, % $2,264,000 $22,640 $2,241,360 $22,640 CVR5 Cedar Street Cherry Egglestone Road Widening $1,860, % $1,860,000 $18,600 $1,841,400 $18,600 CVR11 14th Cade Barr Grand Road Widening $1,381, % $1,381,000 $13,810 $1,367,190 $13,810 CVR12 Grand 14th 11th Road Widening $835, % $835,000 $8,350 $826,650 $8,350 CVR13 Intersection 14th Grand Signalization $188, % $188,000 $1,880 $186,120 $1,880 CVR15 Intersection Cedar Laminman Signalization $188, % $188,000 $1,880 $186,120 $1,880 CVR16 Intersection Cedar Tunbridge Signalization $188, % $188,000 $1,880 $186,120 $1,880 CVR17 Intersection Cherry Cade Barr Signalization $188, % $188,000 $1,880 $186,120 $1,880 CVR18 Intersection DTR Cade Barr Signalization $188, % $188,000 $1,880 $186,120 $1,880 CVR19 Intersection DTR Tunbridge Signalization $188, % $188,000 $1,880 $186,120 $1,880 CVR20 Intersection Cedar Egglestone Signalization $188, % $188,000 $1,880 $186,120 $1,880 CRV21 Intersection Cade Barr Best Signalization $188, % $188,000 $1,880 $186,120 $1,880 CRV22 DCC Review Study $24, % $24,000 $240 $23,760 $240 TOTALS $13,733,000 $13,733,000 $137,330 $13,595,670 $137,330 Benefit Factor Benefit to New Development Notes (1) Cost estimates have been updated from the 2004 DCC Review and include 10% engineering, 10% contingency and 5% administration.. (2) The allocation between new and existing population is based on the percentages used in the Cedar Valley DCC Background Report. Urban Systems Ltd. U:\Projects_VAN\0995\0035\01\X-Single-File\FINAL with_summary_table_proposed DCC Rate Calc_merged.xls 8/7/ :32 AM
122 DISTRICT OF MISSION ROAD DCC RATE CALCULATION AREA B Appendix E CEDAR VALLEY A: Traffic Generation Calculation Col. (1) Col. (2) Col. (3) Col. 4 = Col. (1) x Col. Col. (5) = Trips per Col. (6) = (Net Cost x Col. (3) Category/Total Trips (5))/ Col. (1) Land Use Trips/Unit (residential - per Estimated New Development Unit peak hr/unit; other - trips per peak hr/m2) Trips % of Trips Single Family Residential Single Family (1) 1,036 Dwelling Units % $3, Compact (1) 373 Dwelling Units % $3, Cluster (1) 233 Dwelling Units % $3, Multi Family Residential Townhouse (1) 1,021 Dwelling Units % $2, Garden Apartment (1) 152 Dwelling Units % $2, Institutional Residential (1) 251 Dwelling Units % $2, Commercial Local (1) 648 square metres gross floor area % $ Neighbourhood (1) 6,780 square metres gross floor area % $ Mixed Use Commercial/Residential (1) 4,015 square metres gross floor area % $ Institutional Schools (1) 11,259 square metres gross floor area % $77.18 Institutional (1) 3,523 square metres gross floor area % $8.45 B: Unit Road DCC Calculation Net Road DCC Program Recoverable Existing DCC Reserve Monies Net Amount to be Paid by DCCs DCC per Trip End C: Resulting Road DCCs Single Family Residential Multi Family Residential Commercial Institutional Industrial Total Trip Ends $13,595,670 (b) $1,341,154 (c) $12,254,516 (d) = (b) - (c) $3, (e) = (d)/(a) Single Family $3, per dwelling unit (e) x Col. (3) Compact $3, per dwelling unit (e) x Col. (3) Cluster $3, per dwelling unit (e) x Col. (3) Townhouse $2, per dwelling unit (e) x Col. (3) Garden Apartment $2, per dwelling unit (e) x Col. (3) Institutional $2, per dwelling unit (e) x Col. (3) Local $ per square metre of floor area (e) x Col. (3) Neighbourhood $ per square metre of floor area (e) x Col. (3) Mixed Use Commercial/Residential $ per square metre of floor area (e) x Col. (3) Schools $77.18 per square metre of floor area (e) x Col. (3) Institutional $77.18 per square metre of floor area (e) x Col. (3) 3176 (a) Notes (1) Growth projections provided by the District March 14, (2) DCC reserves from District of Mission March 30, 2007, balance to December 31, Urban Systems Ltd. U:\Projects_VAN\0995\0035\01\X-Single-File\FINAL with_summary_table_proposed DCC Rate Calc_merged.xls 8/7/ :35 AM
123 Development Cost Charge (DCC) Review APPENDIX F Horne Street Pedestrian Walkway DCC Program and Calculations August 21, DCC Background Report-Final.doc
124 DISTRICT OF MISSION HORNE STREET PEDESTRIAN WALKWAY PROGRAM Appendix F Project No. Col. (3) =Col. (1) X Col.(5) = Col. (3) - Col. Col. (6) = Col.(1) - Col. Column Col.(1) Col.(2) Col. (4) Col. (2) (4) (5) Benefit to New Municipal Assist Total Municipal Name Cost Estimate Benefit Factor % DCC Recoverable Development Factor 1% Responsibility 1 Horne Street Pedestrian Walkway $581, % $581,785 $5,818 $575,967 $5,818 Totals $581,785 $575,967 $5,818 Notes: (1) General capital fund advanced project funds for this project. Urban Systems Ltd. U:\Projects_VAN\0995\0035\01\X-Single-File\FINAL with_summary_table_proposed DCC Rate Calc_merged.xls 8/7/ :04 AM
125 DISTRICT OF MISSION HORNE STREET PEDESTRIAN WALKWAY Appendix F A: Traffic Generation Calculation Land Use Col. (1) Col. (2) Col. (3) Estimated New Development Unit Trips/ Unit (trips per day/m 2 ) Col. (4) = Col. (1) x Col. (3) Trips Residential Apartment 411 Dwelling Units Commercial 44,890 square metres gross floor area Total Trip Ends B: Unit Road DCC Calculation Net Road DCC Program Recoverable $575,967 (b) Existing DCC Reserve Monies $4 (c) Net Amount to be Paid by DCCs $575,963 (d) = (b) - (c) DCC per Trip End $ (e) = (d) / (a) C: Resulting Road DCCs Residential Apartment $ per Dwelling Units (e) x Col (3) 1516 (a) Commercial $11.02 per square metres gross floor area (e) x Col (3) Notes (1) Growth projections provided by the District March 14, (2) DCC reserves from District of Mission March 30, 2007, balance to December 31, (3) Trip/ unit from 2004 DCC report. Urban Systems Ltd. U:\Projects_VAN\0995\0035\01\X-Single-File\FINAL with_summary_table_proposed DCC Rate Calc_merged.xls 8/7/ :04 AM
126 Development Cost Charge (DCC) Review APPENDIX G Drainage DCC Program and Calculations Area B August 21, DCC Background Report-Final.doc
127 DISTRICT OF MISSION STORM DRAINAGE DCC PROGRAM AREA B CEDAR VALLEY Project No. Column Col.(1) Col. (2) Name Cost Estimate (1) Benefit Factor % (2) Col. (3) =Col. (1) x Col. (2) Benefit to New Development Col. (4) Municipal Assist Factor 1% Col. (5) = Col. (3) - Col. (4) DCC Recoverable Col. (6) = Col.(1) - Col. (5) Total Municipal Responsibility CVD1 CV Master Drainage Report $40, % $40,000 $400 $39,600 $400 CVD2 CV Culvert Area A $108, % $108,000 $1,080 $106,920 $1,080 CVD3 CV Culvert 1 Area B $120, % $120,000 $1,200 $118,800 $1,200 CVD4 CV Culvert 2 Area B $68, % $68,000 $680 $67,320 $680 CVD5 CV Culvert 1 Area D $113, % $113,000 $1,130 $111,870 $1,130 CVD6 CV Culvert 2 Area D $113, % $113,000 $1,130 $111,870 $1,130 CVD7 CV Culvert 3 Area D $113, % $113,000 $1,130 $111,870 $1,130 CVD8 CV Culvert Area E $45, % $45,000 $450 $44,550 $450 CVD9 CV Trk Stm S. Area A $450, % $450,000 $4,500 $445,500 $4,500 CVD10 CV Trk Stm S. Area B $602, % $602,000 $6,020 $595,980 $6,020 CVD11 CV Trk Stm S. Area C $91, % $91,000 $910 $90,090 $910 CVD12 CV Trk Stm S. Area D $531, % $531,000 $5,310 $525,690 $5,310 CVD13 CV Detention Pond A (3) $2,417, % $2,417,000 $24,170 $2,392,830 $24,170 CVD14 CV Detention Pond B $2,153, % $2,153,000 $21,530 $2,131,470 $21,530 CVD15 CV Detention Pond C $1,317, % $1,317,000 $13,170 $1,303,830 $13,170 CVD16 CV Detention Pond D1 $2,028, % $2,028,000 $20,280 $2,007,720 $20,280 CVD17 CV Detention Pond D2 (4) $366, % $366,000 $3,660 $362,340 $3,660 CVD18 CV Detention Pond D3 $1,003, % $1,003,000 $10,030 $992,970 $10,030 CVD19 CV Detention Pond D4 $448, % $448,000 $4,480 $443,520 $4,480 CVD20 CV Detention Pond D5 $65, % $65,000 $650 $64,350 $650 CVD21 CV Detention Pond D6 $336, % $336,000 $3,360 $332,640 $3,360 CVD22 CV Detention Pond E1 $233, % $233,000 $2,330 $230,670 $2,330 CVD23 CV Detention Pond E2 $99, % $99,000 $990 $98,010 $990 CVD24 CV Detention Pond E4 $293, % $293,000 $2,930 $290,070 $2,930 CVD25 CV Detention Pond E5 $162, % $162,000 $1,620 $160,380 $1,620 CVD26 Dewdney Trunk Ditch Improvements $429, % $429,000 $4,290 $424,710 $4,290 CVD27 CV Gaudin Creek South Realignment $3,182, % $3,182,000 $31,820 $3,150,180 $31,820 CVD28 Flow (3) and rainfall (1) monitoring stations $85, % $85,500 $855 $84,645 $855 CVD29 Stormwater Modeling Software/ Licensing $50, % $50,000 $500 $49,500 $500 CVD30 DCC Review $24, % $24,000 $240 $23,760 $240 Totals $17,084,500 $17,084,500 $170,845 $16,913,655 $170,845 Notes (1) Cost estimates are from the Cedar Valley Area Stormwater Management Plan Update, June, 2007 which include a 35% contingency on construction. All other costs have been updated to 2006 $. (2) The allocation between new and existing population is based on the percentages used in the Cedar Valley DCC Background Report. (3) Cost estimate include $231,627 borrowed from Land Sale Reserve Fund for land purchase at 9034 Dewdney Trunk Road. (4) Cost estimate include $178,661 borrowed from Land Sale Reserve Fund for land purchase at 8890 Cedar Street. Urban Systems Ltd. U:\Projects_VAN\0995\0035\01\X-Single-File\FINAL with_summary_table_proposed DCC Rate Calc_merged.xls Page 1 8/21/ :33 PM
128 DISTRICT OF MISSION STORM DRAINAGE DCC RATE CALCULATION AREA B CEDAR VALLEY A: Storm Drainage Impact Calculation Land Use Col. (1) Col. (2) Col. (3) Development Units Impact Ratio Col. (4) = Col. (1) x Col. Multiple Single Family Residential Single Family (1) 1,036 Dwelling Units Compact (1) 373 Dwelling Units Cluster (1) 233 Dwelling Units Multi Family Residential Townhouse (1) 1,021 Dwelling Units Garden Apartment (1) 152 Dwelling Units Institutional Residential (1) 251 Dwelling Units Commercial Local (1) 648 square metres gross floor area Neighbourhood (1) 6,780 square metres gross floor area Mixed Use Commercial/Residential (1) 4,015 square metres gross floor area Institutional Schools (1) 11,259 square metres gross floor area Institutional (1) 3,523 square metres gross floor area Total B: Unit Drainage DCC Calculation Net Storm Drainage DCC Program Recoverable $16,913,655 (b) Existing DCC Reserve Monies $46,957 (c) Net Amount to be Paid by DCCs $16,866,698 (d) = (b) - (c) DCC per Equivalent Drainage Unit $6, (e) = (d) / (a) C: Resulting Drainage DCCs Single Family Residential Single Family $6, per dwelling unit (e) x Col (3) Compact $6, per dwelling unit (e) x Col (3) Cluster $6, per dwelling unit (e) x Col (3) Multi Family Residential Townhouse $4, per dwelling unit (e) x Col (3) Garden Apartment $1, per dwelling unit (e) x Col (3) Institutional Residential $1, per dwelling unit (e) x Col (3) Commercial Local $22.34 per square metres gross floor area (e) x Col (3) Neighbourhood $22.34 per square metres gross floor area (e) x Col (3) Mixed Use Commercial/Residential $22.34 per square metres gross floor area (e) x Col (3) Institutional Schools $20.94 per square metre of floor area (e) x Col. (3) Institutional $20.94 per square metre of floor area (e) x Col. (3) 2416 (a) Notes (1) Growth projections provided by the District March 14, (2) DCC reserves from District of Mission March 30, 2007, balance to December 31, Urban Systems Ltd. U:\Projects_VAN\0995\0035\01\X-Single-File\FINAL with_summary_table_proposed DCC Rate Calc_merged.xls Page 1 8/21/ :33 PM
129 Development Cost Charge (DCC) Review APPENDIX H Water DCC Program and Calculations Area B August 21, DCC Background Report-Final.doc
130 DISTRICT OF MISSION WATERMAIN PROGRAM Appendix H Area B Cedar Valley Project No. Name Column Col.(1) Col. (2) Cost Estimate (1) Benefit Factor % (2) Col. (3) =Col. (1) x Col. (2) Benefit to New Development Col. (4) Municipal Assist Factor 1% Col. (5) = Col. (3) - Col. (4) DCC Recoverable Col. (6) = Col.(1) - Col. (5) Total Municipal Responsibility CVW1 Emiry - North of Laminman $65, % $65,475 $655 $64,820 $655 CVW2 Laminman - Cedar to Emiry $206, % $206,125 $2,061 $204,064 $2,061 CVW3 Rosetta - Cedar to Hammond $266, % $266,750 $2,668 $264,083 $2,668 CVW4 Egglestone - West of Cedar $495, % $495,000 $4,950 $490,050 $4,950 CVW5 Dalke - DTR west 350m $210, % $210,000 $2,100 $207,900 $2,100 CVW6 Right-of-way - Dewdney Trunk Rd. (DTR) to E. end of Rosetta $168, % $168,000 $1,680 $166,320 $1,680 CVW7 DTR - Cedar to Ferndale $705, % $705,000 $7,050 $697,950 $7,050 CVW8 DTR - Ferndale to Tunbridge $564, % $564,000 $5,640 $558,360 $5,640 CVW9 DTR - Tunbridge to Harms $606, % $606,300 $6,063 $600,237 $6,063 CVW10 DCC Review $24, % $24,000 $240 $23,760 $240 Totals $3,310,650 $3,310,650 $33,107 $3,277,544 $33,107 Notes (1) Cost estimates are based on scope of project information provided by the District and includes 35% for engineering and contingency and 5% for project administration. (2) The allocation between new and existing population is based on the percentages used in the Cedar Valley DCC Background Report. Urban Systems Ltd. U:\Projects_VAN\0995\0035\01\X-Single-File\FINAL with_summary_table_proposed DCC Rate Calc_merged.xls 8/7/ :08 AM
131 DISTRICT OF MISSION WATERMAIN DCC RATES Appendix H Area B Cedar Valley A: Water Impact Calculation Single Family Residential Multi Family Residential Commercial Institutional Land Use Col. (1) Col. (2) Col. (3) Development Units Person per unit (residential)/ Equivalent Population/hectare (other land uses) Col. (4) = Col. (1) x Col. (3) Multiple Single Family (1) 1,036 Dwelling Units Compact (1) 373 Dwelling Units Cluster (1) 233 Dwelling Units Townhouse (1) 1,021 Dwelling Units Garden Apartment (1) 152 Dwelling Units Institutional Residential (1) 251 Dwelling Units Local (1) 0.06 hectares 55 4 Neighbourhood (1) 0.68 hectares Mixed Use Commercial/Residential (1) 0.40 hectares Schools (1) 1.13 hectares Institutional (1) 0.35 hectares Total B: Unit Water DCC Calculation Net Water DCC Program Recoverable Existing DCC Reserve Monies (2) Net Amount to be Paid by DCCs DCC per Equivalent Water Unit $3,277,544 (b) $150,744 (c) $3,126,799 (d) = (b) - (c) $ (e) = (d) / (a) 9150 (a) C: Resulting Water DCCs Single Family Residential Single Family $1, per Dwelling Unit (e) x Col (3) Compact $1, per Dwelling Unit (e) x Col (3) Cluster $1, per Dwelling Unit (e) x Col (3) Multi Family Residential Townhouse $ per Dwelling Unit (e) x Col (3) Garden Apartment $ per Dwelling Unit (e) x Col (3) Institutional Residential $ per Dwelling Unit (e) x Col (3) Commercial Local $1.88 per square metres gross floor area (e) x Col (3)/10,000 Neighbourhood $2.56 per square metres gross floor area (e) x Col (3)/10,000 Mixed Use Commercial/Residential $2.56 per square metres gross floor area (e) x Col (3)/10,000 Institutional (e) x Col (3)/10,000 Schools $5.13 per square metres gross floor area (e) x Col (3)/10,000 Institutional $5.13 per square metres gross floor area (e) x Col (3)/10,000 Notes (1) Growth projections provided by the District March 14, (2) DCC reserves from District of Mission March 30, 2007, balance to December 31, Urban Systems Ltd. U:\Projects_VAN\0995\0035\01\X-Single-File\FINAL with_summary_table_proposed DCC Rate Calc_merged.xls 8/7/ :09 AM
132 Development Cost Charge (DCC) Review APPENDIX I Sanitary Sewer DCC Program and Calculations Area B August 21, DCC Background Report-Final.doc
133 DISTRICT OF MISSION SANITARY SEWER PROGRAM Appendix I Area B Cedar Valley Project No. Column Col.(1) Col. (2) Name Cost Estimate (1) Benefit Factor % (2) Col. (3) =Col. (1) x Col. (2) Benefit to New Development Col. (4) Municipal Assist Factor 1% Col. (5) = Col. (3) - Col. (4) DCC Recoverable Col. (6) = Col.(1) - Col. (5) Total Municipal Responsibility CVS1 Gravity trunk sewer, forcemain and pump station $1,895, % $1,895,190 $18,952 $1,876,238 $18,952 CVS2 DCC Review $24, % $24,000 $240 $23,760 $240 Totals $1,919,190 $1,919,190 $19,192 $1,899,998 $19,192 Notes (1) Cost estimates is based on advanced project funds from Sewer Capital Reserve Funds, must recover $1,876,237. District of Mission March 30, (2) The allocation between new and existing population is based on the percentages used in the Cedar Valley DCC Background Report. Urban Systems Ltd. U:\Projects_VAN\0995\0035\01\X-Single-File\FINAL with_summary_table_proposed DCC Rate Calc_merged.xls 8/7/ :10 AM
134 DISTRICT OF MISSION SANITARY SEWER DCC RATES Appendix I Area B Cedar Valley A: Sanitary Sewer Impact Calculation Single Family Residential Multi Family Residential Commercial Institutional Land Use Col. (1) Col. (2) Col. (3) Development Units Person per unit (residential)/ Equivalent Population/hectare (other land uses) Col. (4) = Col. (1) x Col. (3) Multiple Single Family (1) 1,036 Dwelling Units Compact (1) 373 Dwelling Units Cluster (1) 233 Dwelling Units Townhouse (1) 1,021 Dwelling Units Garden Apartment (1) 152 Dwelling Units Institutional Residential (1) 251 Dwelling Units Local (1) 0.06 hectares 55 4 Neighbourhood (1) 0.68 hectares Mixed Use Commercial/Residential (1) 0.40 hectares Schools (1) 1.13 hectares Institutional (1) 0.35 hectares Total B: Unit Sanitary DCC Calculation Net Sanitary Sewer DCC Program Recoverable Existing DCC Reserve Monies (2) Net Amount to be Paid by DCCs DCC per Equivalent Sanitary Sewer Unit $1,899,998 (b) $206,800 (c) $1,693,198 (d) = (b) - (c) $ (e) = (d) / (a) 9150 (a) C: Resulting Sanitary Sewer DCCs Single Family Residential Single Family $ per Dwelling Unit (e) x Col (3) Compact $ per Dwelling Unit (e) x Col (3) Cluster $ per Dwelling Unit (e) x Col (3) Multi Family Residential Townhouse $ per Dwelling Unit (e) x Col (3) Garden Apartment $ per Dwelling Unit (e) x Col (3) Institutional Residential $ per Dwelling Unit (e) x Col (3) Commercial Local $1.02 per square metres gross floor area (e) x Col (3)/10,000 Neighbourhood $1.39 per square metres gross floor area (e) x Col (3)/10,000 Mixed Use Commercial/Residential $1.39 per square metres gross floor area (e) x Col (3)/10,000 Institutional (e) x Col (3)/10,000 Schools $2.78 per square metres gross floor area (e) x Col (3)/10,000 Institutional $2.78 per square metres gross floor area (e) x Col (3)/10,000 Notes (1) Growth projections provided by the District March 14, (2) DCC reserves from District of Mission March 30, 2007, balance to December 31, Urban Systems Ltd. U:\Projects_VAN\0995\0035\01\X-Single-File\FINAL with_summary_table_proposed DCC Rate Calc_merged.xls 8/7/ :13 AM
135 Development Cost Charge (DCC) Review APPENDIX J Silvercreek Parkway Parkland Acquisition DCC Program and Calculations Areas A, B, and C August 21, DCC Background Report-Final.doc
136 DISTRICT OF MISSION SILVERCREEK PARKWAY PARKLAND DCC PROGRAM - ALL AREAS Appendix J Project No. Column Col. (1) Col. (2) Col. (3) Name Roll # Total Site Size (Acres) Amount of Land Required (Acres) Total Parcel Cost Estimate (1) DCC Land Cost Estimates 2004 DCC Land Cost Estimates 2007 (1.45%) Col. (4) = Col. (2) x Col. (3) Benefit Benefit to New Factor % (2) Development Col. (5) Municipal Assist Factor 1% Col. (6) = Col. (4) x Col. (5) DCC Recoverable Col. (7) = Col. (2) - Col. (6) Total Municipal Responsibility Dewdney Trunk Road $237,600 $237,600 $344, % $344,520 $3,445 $341,075 $3, Wiebe Street $442,800 $442,800 $642, % $642,060 $6,421 $635,639 $6, $253,900 $253,900 $368, % $368,155 $3,682 $364,473 $3, Clay Street $206,000 $103,000 $149, % $149,350 $1,494 $147,857 $1, Clay Street $198,000 $63,360 $91, % $91,872 $919 $90,953 $ Clay Street $208,000 $74,880 $108, % $108,576 $1,086 $107,490 $1, Clay Street $206,000 $73,322 $106, % $106,317 $1,063 $105,254 $1, Clay Street $206,000 $72,100 $104, % $104,545 $1,045 $103,500 $1, Clay Street $229,000 $27,480 $39, % $39,846 $398 $39,448 $ Tunbridge Avenue $200,000 $200,000 $290, % $290,000 $2,900 $287,100 $2, Cherry Avenue $237,000 $196,138 $284, % $284,400 $2,844 $281,556 $2, Silverdale Avenue $694,000 $694,000 $1,006, % $1,006,300 $10,063 $996,237 $10, Silverdale Avenue $7,700 $5,080 $7, % $7,366 $74 $7,292 $ Silverdale Avenue $265,000 $60,663 $87, % $87,961 $880 $87,081 $ Hemlock Street $154,200 $152,610 $221, % $221,285 $2,213 $219,072 $2, Silverdale Avenue $6,200 $5,683 $8, % $8,241 $82 $8,158 $ Silverdale Avenue $311,100 $311,100 $451, % $451,095 $4,511 $446,584 $4, Silverdale Avenue $2,500 $2,222 $3, % $3,222 $32 $3,190 $32 28 Silverdale $8,900 $817 $1, % $1,185 $12 $1,173 $ Lougheed Hwy # $1,180,000 $113,403 $164, % $164,434 $1,644 $162,789 $1, Hemlock Street $1,000 $1,000 $1, % $1,450 $15 $1,436 $ Tunbridge Avenue $50,000 $50,000 $72, % $72,500 $725 $71,775 $ Tyler Street $281,000 $281,000 $407, % $407,450 $4,075 $403,376 $4, Tyler Street $92,000 $92,000 $133, % $133,400 $1,334 $132,066 $1, Hemlock $126,800 $126,800 $183, % $183,860 $1,839 $182,021 $1, Silverdale Avenue $12,800 $12,800 $18, % $18,560 $186 $18,374 $186 12a 9320 Clay Street $3,900 $1,014 $1, % $1,470 $15 $1,456 $15 12b 9338 Clay Street $184,000 $61,333 $88, % $88,933 $889 $88,044 $ Ducks Silverdale $1,187,000 $225,000 $225, % $225,000 $2,250 $222,750 $2, Ducks Lougheed Hwy # Ducks Silverdale Avenue Ducks Silverdale Ducks Turner Street Totals $7,192,400 $3,941,106 $5,613,353 $5,613,353 $56,134 $5,557,220 $56,134 Notes (1) Cost estimates are from the District of Mission, September 22, 2004, land assessment value typically w/o improvements, unless full property is required, increased by 45% to reflect current costs. (2) The 100% reflects benefit to future residents. (3) The total area required for Ducks property is 112 acres. The land required for the DCC program is 56 acres. This is the total area of #26, 29, 36,37,38. Acquired for $1,187,000 of which the District's share was $600,000. Urban Systems Ltd. U:\Projects_VAN\0995\0035\01\X-Single-File\FINAL with_summary_table_proposed DCC Rate Calc_merged.xls 8/7/ :21 AM
137 DISTRICT OF MISSION SILVERCREEK PARKWAY PARKLAND DCC - ALL AREAS Appendix J A: Park Impact Calculation Land Use Col. (1) Col. (2) Col. (3) Development Units Equivalent Population Factor Single Family Residential (1) 3,476 Dwelling Units Multi Family Residential Townhouse (1) 1,548 Dwelling Units Apartment (1) 1,223 Dwelling Units Duplex, Triplex, Fourplex, Sixplex (1) 0 Dwelling Units Total B: Unit Park DCC Calculation Net Park DCC Program Recoverable Existing DCC Reserve Monies Net Amount to be Paid by DCCs DCC per Equivalent Person C: Resulting Parks DCCs $5,557,220 (b) $340,115 (c) $5,217,104 (d) = (b) - (c) $ (e) = (d) / (a) Single Family Residential $ per Dwelling Unit (e) x Col (3) Multi Family Residential Townhouse $ per Dwelling Unit (e) x Col (3) Apartment $ per Dwelling Unit (e) x Col (3) Duplex, Triplex, Fourplex, Sixplex $ per Dwelling Unit (e) x Col (3) (1) Growth projections provided by the District March 14, (2) DCC reserves from District of Mission March 30, 2007, balance to December 31, Col. (4) Multiple (a) Urban Systems Ltd. U:\Projects_VAN\0995\0035\01\X-Single-File\FINAL with_summary_table_proposed DCC Rate Calc_merged.xls 8/7/ :22 AM
138 Development Cost Charge (DCC) Review APPENDIX K Silverdale Industrial Water and Sanitary Sewer DCC Program and Calculations Specified Area August 21, DCC Background Report-Final.doc
139 DISTRICT OF MISSION SILVERDALE IND. WATER PROGRAM Appendix K Project No. Col. (3) =Col. (1) X Col.(5) = Col. (3) - Col. Col. (6) = Col.(1) - Col. Column Col.(1) Col.(2) Col. (4) Col. (2) (4) (5) Benefit to New Municipal Assist Total Municipal Name Cost Estimate Benefit Factor % DCC Recoverable Development Factor 1% Responsibility 1 Silverdale Water Works $429, % $429,347 $4,293 $425,053 $4,293 Totals $429,347 $425,053 $4,293 Notes: (1) Capital cost provided by the District May 29, Urban Systems Ltd. U:\Projects_VAN\0995\0035\01\X-Single-File\FINAL with_summary_table_proposed DCC Rate Calc_merged.xls 8/7/ :24 AM
140 DISTRICT OF MISSION SILVERDALE IND. WATER DCC RATES Appendix K A: Water Impact Calculation Land Use Col. (1) Col. (2) Col. (3) Estimated New Development Unit Person per unit (residential)/ Equivalent Population/hectare (other land uses) Col. (4) = Col. (1) x Col. (3) Trips Industrial hectares B: Unit Water DCC Calculation Net Water DCC Program Recoverable $425,053 (b) Existing DCC Reserve Monies (2) $65,308 (c) Net Amount to be Paid by DCCs $359,745 (d) = (b) - (c) DCC per Equivalent WaterUnit $ (e) = (d) / (a) C: Resulting Water DCCs Industrial $14, per hectare (e) x Col (3) $1.46 per square metres gross site area 1111 (a) Notes (1) Growth projections provided by the District March 27, (2) DCC reserves from District of Mission March 30, 2007, balance to December 31, Urban Systems Ltd. U:\Projects_VAN\0995\0035\01\X-Single-File\FINAL with_summary_table_proposed DCC Rate Calc_merged.xls 8/7/ :25 AM
141 DISTRICT OF MISSION SILVERDALE IND. SEWER PROGRAM Appendix K Project No. Col. (3) =Col. (1) X Col.(5) = Col. (3) - Col. Col. (6) = Col.(1) - Col. Column Col.(1) Col.(2) Col. (4) Col. (2) (4) (5) Benefit to New Municipal Assist Total Municipal Name Cost Estimate Benefit Factor % DCC Recoverable Development Factor 1% Responsibility 1 Silverdale Industrial Sewer Works $235, % $235,783 $2,358 $233,425 $2,358 Totals $235,783 $233,425 $2,358 Notes: (1) Capital cost provided by the District May 29, Urban Systems Ltd. U:\Projects_VAN\0995\0035\01\X-Single-File\FINAL with_summary_table_proposed DCC Rate Calc_merged.xls 8/7/ :26 AM
142 DISTRICT OF MISSION SILVERDALE IND. SEWER DCC RATES Appendix K A: Sanitary Sewer Impact Calculation Land Use Col. (1) Col. (2) Col. (3) Estimated New Development Unit Person per unit (residential)/ Equivalent Population/hectare (other land uses) Col. (4) = Col. (1) x Col. (3) Trips Industrial hectares Total B: Unit Sanitary DCC Calculation Net Sanitary Sewer DCC Program Recoverable $233,425 (b) Existing DCC Reserve Monies (2) $65,986 (c) Net Amount to be Paid by DCCs $167,439 (d) = (b) - (c) DCC per Equivalent Sanitary Sewer Unit $ (e) = (d) / (a) C: Resulting Sewer DCCs Industrial $6, per hectare (e) x Col (3) $0.68 per square metres gross site area 1111 (a) Notes (1) Growth projections provided by the District March 27, (2) DCC reserves from District of Mission March 30, 2007, balance to December 31, Urban Systems Ltd. U:\Projects_VAN\0995\0035\01\X-Single-File\FINAL with_summary_table_proposed DCC Rate Calc_merged.xls 8/7/ :27 AM
143 Development Cost Charge (DCC) Review APPENDIX L Regional Water Supply and Sewage Treatment DCC Program and Calculations Areas A, B, and C August 21, DCC Background Report-Final.doc
144 DISTRICT OF MISSION WATER SUPPLY DCC - 12 YEAR PROGRAM Appendix L Col. (1) Col. (2) Col. (3) = % x Col. (2) Col. (4) = % x Col. (2) Col. (5) Col. (6) = Col. (4) x Col. (5) Col. (7) = % x Col. (6) Col. (8) = Col. (6) - Col. (7) Col. (9) = Col. (4) - Col. (8) Project No. Project Description Total Cost Estimate Cost Share Abbotsford (74.32%) Cost Share Mission (25.68%) Benefit Factor Benefit to New Development Municipal Assist Factor (1%) DCC Recoverable Total Municipal Responsibility Norrish Creek PH Adjustment $1,424,000 $1,058,317 $365,683 39% $142,616 $1,426 $141,190 $224,493 Mill Lake production wells - 25Ml/d (C/F) $3,496,500 $2,598,599 $897, % $897,901 $8,979 $888,922 $8,979 Filtration Membrane (Balance of project costs) (C/F) $236,250 $175,581 $60,669 20% $12,134 $121 $12,013 $48,656 Norrish Main Upgrade/Booster (Feasibility study/design) $210,000 $156,072 $53, % $53,928 $539 $53,389 $539 Stave Lake preliminary engineering $52,500 $39,018 $13, % $13,482 $135 $13,347 $135 Miracle Valley aquifer assessment $315,000 $234,108 $80, % $80,892 $809 $80,083 $809 Ackerman booster pump station - 8 Ml/d $577,500 $429,198 $148, % $148,302 $1,483 $146,819 $1,483 Dickson Lake control facility $955,500 $710,128 $245, % $245,372 $2,454 $242,918 $2,454 Maclure reservoir - 14Ml $5,733,000 $4,260,766 $1,472, % $1,472,234 $14,722 $1,457,512 $14,722 Transmission main - Maclure Reservoir to McKee Road $11,907,000 $8,849,282 $3,057, % $3,057,718 $30,577 $3,027,141 $30,577 Update water master plan $210,000 $156,072 $53, % $53,928 $539 $53,389 $539 Hatzic Booster pump station Ml/d $13,041,000 $9,692,071 $3,348, % $3,348,929 $33,489 $3,315,440 $33,489 Norrish Creek WTP - Stage 2, 144 Ml/d $16,485,000 $12,251,652 $4,233, % $4,233,348 $42,333 $4,191,015 $42,333 Transmission main - Hatzic booster to Mt. Mary Ann reservoir $10,416,000 $7,741,171 $2,674, % $2,674,829 $26,748 $2,648,081 $26,748 Transmission main - Mt. Mary Ann reservoir to Best Ave. $2,583,000 $1,919,686 $663, % $663,314 $6,633 $656,681 $6,633 Totals $67,642,250 $50,271,721 $17,370,529 $17,098,927 $170,987 $16,927,940 $442,589
145 DISTRICT OF MISSION WATER SUPPLY DCC RATES - 12 YEAR DCC PROGRAM Appendix L A: Water Impact Calculation LAND USE Col. (1) Development Units Col. (2) Col. (3) Col. (4) = Col. (1) x Col. (3) Person per unit (residential) Equivalent Population/hectare (other land uses) Multiple Single Family Residential Residential One Unit or Two Unit 1,361 Dwelling Units , Compact 304 Dwelling Units , Cluster 144 Dwelling Units Multi Family Residential Townhouse 888 Dwelling Units , Garden Apartment 474 Dwelling Units Insitutitional Residential 80 Dwelling Units Commercial Local Hectares Neighbourhood & Mixed Use Commercial/Residential Hectares Industrial General Hectares Institutional Schools & Institutional Hectares Total 10, (a) B: Unit Water DCC Calculation Total DCCs Receivable $16,927,940 b) = Appendix "A" - Water Less: Existing DCC Reserve Funds ($902,139) c) = DCC Balance Net Amount to be Paid by DCC's $16,025,801 d) = b - c DCC per Equivalent Water Unit $1, e) = d / a C: Resulting Water DCCs Single Family Residential Single Family $5, per Dwelling Unit (e) x Col (3) Compact $5, per Dwelling Unit (e) x Col (3) Cluster $5, per Dwelling Unit (e) x Col (3) Multi Family Residential Townhouse $4, per Dwelling Unit (e) x Col (3) Garden Apartment $3, per Dwelling Unit (e) x Col (3) Institutional Residential $2, per Dwelling Unit (e) x Col (3) Commercial Local $8.72 per square metres gross floor area (e) x Col (3)/10,000 Neighbourhood & Mixed Use Commercial/Residential $11.90 per square metres gross floor area (e) x Col (3)/10,000 Industrial General $7.14 per square metres gross floor area (e) x Col (3)/10,000 Institutional Schools & Institutional $7.14 per square metres gross floor area (e) x Col (3)/10,000
146 DISTRICT OF MISSION SEWAGE TREATMENT DCC 25 YEAR PROGRAM Appendix L Col. (1) Col. (2) Col. (3) = % x Col. (2) Col. (4) = % x Col. (2) Col. (5) Col. (6) = Col. (4) x Col. (5) Col. (7) = % x Col. (6) Col. (8) = Col. (6) - Col. (7) Col. (9) = Col. (4) - Col. (8) Project No. Project Description Total Cost Estimate Cost Share Abbotsford (77.43%) Cost Share Mission (22.57%) Benefit Factor Benefit to New Development Municipal Assist Factor (1%) DCC Recoverable Total Municipal Responsibility Influent Pumping Expansion Station $126,000 $97,562 $28, % $28,438 $284 $28,154 $284 RS1 Head Works - Add 3rd Screen $0 $0 $0 30% $0 $0 $0 $0 RS4 Head Works - Replace Existing Screens $815,000 $631,055 $183,946 30% $55,184 $552 $54,632 $129,314 RS5 Solids Handling & Treatment - Additional Dewatering Capacity $91,000 $70,461 $20,539 30% $6,162 $62 $6,100 $14,439 Solids Handling & Treatment - Additional Dewatering Capacity $1,380,750 $1,069,115 $311,635 30% $93,491 $935 $92,556 $219,079 RS9 Secondary Treatment - Adding Trickling Filter $0 $0 $0 100% $0 $0 $0 $0 RS17 Secondary Treatment - Trickling Filter/Solid Contact $49,350 $38,212 $11, % $11,138 $111 $11,027 $111 RS18 Secondary Treatment - Secondary Clarifier $0 $0 $0 100% $0 $0 $0 $0 Digester gas upgrades $210,000 $162,603 $47,397 37% $17,537 $175 $17,362 $30,035 Primary, primary effluent pump station study $26,250 $20,325 $5, % $5,925 $59 $5,866 $59 Outfall, Effluent pump station study $15,750 $12,195 $3, % $3,555 $36 $3,519 $36 Electrical, SCADA HMI/Data Historian upgrade $52,500 $40,651 $11,849 37% $4,384 $44 $4,340 $7,509 Electrical, power quality monitoring to SCADA $15,750 $12,195 $3,555 37% $1,315 $13 $1,302 $2,253 Influent, add #3 screw pump with 2 channels $1,554,000 $1,203,262 $350, % $350,738 $3,507 $347,231 $3,507 Headworks, Relocate septage receiving station $525,000 $406,508 $118,493 37% $43,842 $438 $43,404 $75,089 Secondary, Stress testing #1 & #2 TF study $15,750 $12,195 $3, % $3,555 $36 $3,519 $36 Solids, Refurbish biosolids building $210,000 $162,603 $47,397 37% $17,537 $175 $17,362 $30,035 Solids, Replace belt presses with 2 centrifuges $1,139,250 $882,121 $257,129 37% $95,138 $951 $94,187 $162,942 Solids, Structural improvements to biosolids roof $525,000 $406,508 $118,493 37% $43,842 $438 $43,404 $75,089 Solids, WBS thickener capacity study $15,750 $12,195 $3, % $3,555 $36 $3,519 $36 Pressate, Design operating criteria study $15,750 $12,195 $3, % $3,555 $36 $3,519 $36 Electrical, integration of SCADA systems study $21,000 $16,260 $4,740 37% $1,754 $18 $1,736 $3,004 Electrical, ControlLogix platform upgrade $115,500 $89,432 $26,068 37% $9,645 $96 $9,549 $16,519 Electrical, Fibreoptic link between buildings for PLC $220,500 $170,733 $49, % $49,767 $498 $49,269 $498 Electrical, Technology implementation strategy $78,750 $60,976 $17, % $17,774 $178 $17,596 $178 General, Future footprint and hydraulic plan study $31,500 $24,390 $7, % $7,110 $71 $7,039 $71 Influent, Emergency storage pump station/piping $525,000 $406,508 $118,493 37% $43,842 $438 $43,404 $75,089 Headworks, Upgrade screenings handling $315,000 $243,905 $71,096 37% $26,306 $263 $26,043 $45,053 Primary, Upgrade scum dewatering system $315,000 $243,905 $71,096 37% $26,306 $263 $26,043 $45,053 Secondary, Add #3 TF/SC and site piping $11,340,000 $8,780,562 $2,559, % $2,559,438 $25,594 $2,533,844 $25,594 Disinfection, UV disinfection evaluation study $15,750 $12,195 $3, % $3,555 $36 $3,519 $36 Outfall, Upgrade effluent pump station $315,000 $243,905 $71,096 37% $26,306 $263 $26,043 $45,053 Solids, Pasteurization capacity study $26,250 $20,325 $5, % $5,925 $59 $5,866 $59 Solids, twin existing boiler $315,000 $243,905 $71, % $71,096 $711 $70,385 $711 Electrical, Security and video surveillance $220,500 $170,733 $49,767 37% $18,414 $184 $18,230 $31,537 Electrical, Add two pad mounted transformers $682,500 $528,460 $154, % $154,040 $1,540 $152,500 $1,540 Primary, Upgrade primary pump station/building $525,000 $406,508 $118,493 37% $43,842 $438 $43,404 $75,089 Gas, Miscellaneous digestor gas upgrades $420,000 $325,206 $94,794 37% $35,074 $351 $34,723 $60,071 Secondary, Upgrade SC tank aeration system $367,500 $284,555 $82,945 37% $30,690 $307 $30,383 $52,562 Influent, Add #4 screw pump $315,000 $243,905 $71, % $71,096 $711 $70,385 $711 Headworks, Add #4 and #5 grit tanks (convert) $157,500 $121,952 $35, % $35,548 $355 $35,193 $355 Headworks, Add second hydro gritter $52,500 $40,651 $11, % $11,849 $118 $11,731 $118 Primary, relocate and upgrade scum dewatering $525,000 $406,508 $118,493 37% $43,842 $438 $43,404 $75,089 Secondary, Add #4 clarifier/piping $4,410,000 $3,414,663 $995, % $995,337 $9,953 $985,384 $9,953 Secondary, Add RBS pumping station $3,150,000 $2,439,045 $710, % $710,955 $7,110 $703,845 $7,110 Disinfection, Add #2 contact Channel $1,575,000 $1,219,523 $355, % $355,478 $3,555 $351,923 $3,555 Solids, Add #2 WBS thickner $1,050,000 $813,015 $236, % $236,985 $2,370 $234,615 $2,370 Solids, Expand biosolid storage area $105,000 $81,302 $23, % $23,699 $237 $23,462 $237 Pressate, Add pressate/centrate treatment system $1,785,000 $1,382,126 $402, % $402,875 $4,029 $398,846 $4,029 Outfall, Upgrade and expand reclaimed water $210,000 $162,603 $47,397 37% $17,537 $175 $17,362 $30,035 Generation, Replace co-generation with alt tech $1,386,000 $1,073,180 $312, % $312,820 $3,128 $309,692 $3,128 Solids, Add third centrifuge $630,000 $487,809 $142, % $142,191 $1,422 $140,769 $1,422 Update Sewer master plan $525,000 $406,508 $118, % $118,493 $1,185 $117,308 $1,185 Headworks, add #4 screen $420,000 $325,206 $94, % $94,794 $948 $93,846 $948 Electrical, SCADA/electrical upgrades $1,575,000 $1,219,523 $355,478 37% $131,527 $1,315 $130,212 $225,266 Odour, Cover #1 to #3 TF and ducting $2,730,000 $2,113,839 $616,161 37% $227,980 $2,280 $225,700 $390,461 Odour, expand biofilter $3,150,000 $2,439,045 $710, % $710,955 $7,110 $703,845 $7,110 Disinfection, Expand sodium hypochlorite system $1,050,000 $813,015 $236, % $236,985 $2,370 $234,615 $2,370 Solids, add #4 digester and piping $4,935,000 $3,821,171 $1,113, % $1,113,830 $11,138 $1,102,692 $11,138 Solids, Add #3 boiler $210,000 $162,603 $47, % $47,397 $474 $46,923 $474 Solids, Additional sludge heat exachanger $525,000 $406,508 $118, % $118,493 $1,185 $117,308 $1,185 Solids, Upgrade sludge pumping and piping $525,000 $406,508 $118, % $118,493 $1,185 $117,308 $1,185 Gas, expand gas collection and usage system $577,500 $447,158 $130, % $130,342 $1,303 $129,039 $1,303 Gas, duplicate gas storage $262,500 $203,254 $59, % $59,246 $592 $58,654 $592 Generation, Add second generator $1,050,000 $813,015 $236, % $236,985 $2,370 $234,615 $2,370 Electrical, Add third pad mounted transformer $315,000 $243,905 $71, % $71,096 $711 $70,385 $711 Odour, cover #1 to #9 primary tanks and ducting $2,625,000 $2,032,538 $592,463 37% $219,211 $2,192 $217,019 $375,444 Headworks, replace #1 screen $420,000 $325,206 $94,794 37% $35,074 $351 $34,723 $60,071 Secondary, Add #4 TF/SC and piping $11,340,000 $8,780,562 $2,559, % $2,559,438 $25,594 $2,533,844 $25,594 Odour, Cover #4 TF and ducting $787,500 $609,761 $177, % $177,739 $1,777 $175,962 $1,777 Secondary, Add #5 clarifier and piping $4,410,000 $3,414,663 $995, % $995,337 $9,953 $985,384 $9,953 Outfall, Add second river outfall $3,150,000 $2,439,045 $710, % $710,955 $7,110 $703,845 $7,110 Primary, Add #8 and #9 primary tanks $1,575,000 $1,219,523 $355, % $355,478 $3,555 $351,923 $3,555 Disinfection, Add UV disinfection $5,250,000 $4,065,075 $1,184, % $1,184,925 $11,849 $1,173,076 $11,849 Influent, Add #5 screw pump with 1 channel $771,750 $597,566 $174, % $174,184 $1,742 $172,442 $1,742 Headworks, replace septage receiving station $262,500 $203,254 $59,246 37% $21,921 $219 $21,702 $37,544 Headworks, replace #2 & #3 screens $840,000 $650,412 $189,588 37% $70,148 $701 $69,447 $120,141 Secondary, Add #6 clarifier and pumping $4,200,000 $3,252,060 $947, % $947,940 $9,479 $938,461 $9,479 Secondary, Expand RBS pump station $525,000 $406,508 $118, % $118,493 $1,185 $117,308 $1,185 Outfall, Add west effluent pump station/piping (UV) $4,200,000 $3,252,060 $947, % $947,940 $9,479 $938,461 $9,479 Solids, Add #5 digestor and piping $4,725,000 $3,658,568 $1,066, % $1,066,433 $10,664 $1,055,769 $10,664 Add 2 grit tanks $157,500 $121,952 $35, % $35,548 $355 $35,193 $355 Add primary sedimentation tanks #10 & #11 $1,575,000 $1,219,523 $355, % $355,478 $3,555 $351,923 $3,555 Scada and electrical upgrades $389,188 $301,348 $87,840 37% $32,501 $325 $32,176 $55,664 Cover primary tanks #10 & #11 & ducting $630,000 $487,809 $142, % $142,191 $1,422 $140,769 $1,422 Totals $103,667,038 $80,269,397 $23,397,666 $20,847,537 $208,470 $20,639,067 $2,758,599
147 DISTRICT OF MISSION SEWAGE TREATMENT DCC RATES - 25 YEAR PROGRAM Appendix L A: Sewer Impact Calculation LAND USE Col. (1) Development Units Col. (2) Col. (3) Person per unit (residential) Equivalent Population/hectare (other land uses) Col. (4) = Col. (1) x Col. (3) Multiple Single Family Residential Residential One Unit or Two Unit 2,808 Dwelling Units , Compact 373 Dwelling Units , Cluster 217 Dwelling Units Multi Family Residential Townhouse 1,464 Dwelling Units , Garden Apartment 930 Dwelling Units , Insitutitional Residential 205 Dwelling Units Commercial Local Hectares Nighbourhood & Mixed Use Commercial/Residential Hectares Industrial General Hectares Institutional Schools & Institutional Hectares Total 18, (a) B: Unit Sewer DCC Calculation Total DCCs Receivable $20,639,067 b) = Appendix "A" - Sewer Less: Existing DCC Reserve Funds ($627,068) c) = DCC Balance Net Amount to be Paid by DCC's $20,011,999 d) = b - c DCC per Equivalent Water Unit $1, e) = d / a C: Resulting Sewer DCCs Single Family Residential Single Family $3, per Dwelling Unit (e) x Col (3) Compact $3, per Dwelling Unit (e) x Col (3) Cluster $3, per Dwelling Unit (e) x Col (3) Multi Family Residential Townhouse $2, per Dwelling Unit (e) x Col (3) Garden Apartment $2, per Dwelling Unit (e) x Col (3) Institutional Residential $1, per Dwelling Unit (e) x Col (3) Commercial Local $6.08 per square metres gross floor area (e) x Col (3)/10,000 Nighbourhood & Mixed Use Commercial/Residential $8.29 per square metres gross floor area (e) x Col (3)/10,000 Industrial General $4.97 per square metres gross floor area (e) x Col (3)/10,000 Institutional Schools & Institutional $4.97 per square metres gross floor area (e) x Col (3)/10,000
148 Development Cost Charge (DCC) Review APPENDIX M The Proposed Development Cost Charge Bylaws August 21, DCC Background Report-Final.doc
149 DISTRICT OF MISSION BYLAW (2) A Bylaw to amend "District of Mission Silverdale Development Cost Charge Bylaw " WHEREAS the Council of the District of Mission did, on the 7 th day of May, 1990, enact a bylaw cited as District of Mission Silverdale Development Cost Charge Bylaw ; AND WHEREAS the Council of the District of Mission deems it advisable to amend the said bylaw; NOW THEREFORE the Council of the District of Mission, in open meeting assembled, ENACTS AS FOLLOWS: 1. This bylaw may be cited for all purposes as "District of Mission Silverdale Development Cost Charge Amending Bylaw (2). 2. "District of Mission Silverdale Development Cost Charge Bylaw " is hereby amended by: (a) deleting Schedule A in its entirety and replacing it with the Schedule A attached to and forming part of this bylaw; and (b) deleting Schedule "B" in its entirety and replacing it with the Schedule "B" attached to and forming part of this bylaw. 3. This bylaw comes into effect the 1 st day of January, READ A FIRST TIME this 16 th day of July, 2007 READ A SECOND TIME this 16 th day of July, 2007 READ A THIRD TIME this 16 th day of July, 2007 APPROVED by the Inspector of Municipalities this >> ADOPTED this >> MAYOR DIRECTOR OF CORPORATE ADMINISTRATION I HEREBY CERTIFY the foregoing to be a true and correct copy of "District of Mission Development Cost Charges Amending Bylaw (2). DIRECTOR OF CORPORATE ADMINISTRATION
150 District of Mission Silverdale Development Cost Charge Amending Bylaw (2) Page 2 SCHEDULE "A" Facility Development Cost Charge Payable per Hectare of Land Being Subdivided or Development Area Sewerage $ 6, Water $ 14,576.38
151 SCHEDULE "B" District of Mission Silverdale Development Cost Charge Amending Bylaw (2) Page 3
152
153 DISTRICT OF MISSION BYLAW (3) A Bylaw to amend "District of Mission Development Cost Charges Bylaw " WHEREAS the Council of the District of Mission did, on the 17 th day of January 2005, enact a bylaw cited as District of Mission Development Cost Charges Bylaw ; AND WHEREAS the Council of the District of Mission deems it advisable to amend the said bylaw; NOW THEREFORE the Council of the District of Mission, in open meeting assembled, ENACTS AS FOLLOWS: 1. This bylaw may be cited for all purposes as "District of Mission Development Cost Charges Amending Bylaw (3). 2. "District of Mission Development Cost Charges Bylaw " is hereby amended by: (a) (b) deleting Schedule A in its entirety and replacing it with the Schedule A attached to and forming part of this bylaw; and deleting Schedule B in its entirety and replacing it with the Schedule B attached to and forming part of this bylaw. 3. This bylaw comes into effect on the 1 st day of January, READ A FIRST TIME this 16 th day of July, 2007 READ A SECOND TIME this 16 th day of July, 2007 READ A THIRD TIME this 16 th day of July, 2007 THIRD READING RESCINDED this 20 th day of August, 2007 AMENDED AND READ A THIRD TIME this 20 th day of August, 2007 APPROVED by the Inspector of Municipalities this >> ADOPTED this >> MAYOR DIRECTOR OF CORPORATE ADMINISTRATION I HEREBY CERTIFY the foregoing to be a true and correct copy of "District of Mission Development Cost Charges Amending Bylaw (3). DIRECTOR OF CORPORATE ADMINISTRATION
154 SCHEDULE "A" DEVELOPMENT COST CHARGES 1. Each Development Cost Charge payable for a particular subdivision or development proposal in Areas A, B, or C (as shown in Schedule "B") is that charge set out opposite the land use/class of development corresponding to the proposal for that Area. 2. For a subdivision for Residential Use, One or Two Unit, Cluster Compact Single Family Residential, Townhouse or Garden Apartment, the calculation is based on a per dwelling unit charge. For other classes of development the calculation is based upon the floor area of a building intended to be created as part of the proposed development. Areas Land Use Unit Roads- All Areas (Areas A, B and C) Roads Area B Drainage Area B Sanitary Area B Water Area B Sanitary Spec Area B Per Schedule C Parks All Areas Cedar Valley Environmentally Sensitive Parkland (Area B) Acquisition Development Water Supply All Areas (Areas A, B and C) Sewage Treatment All Areas (Areas A, B and C) Area A Mission Central, Single Family Per dwelling unit $1, $ $5, $3, Fraser Area Townhouse Per dwelling unit $1, $ $4, $2, Apartments Per dwelling unit $ $ $3, $2, Duplexes, Triplexes Per dwelling unit $ $ $5, $3, Local Commercial Per m2 of floor area $46.18 $8.72 $6.08 Neighbourhood & Mixed Use Commercial/ Residential Per m2 of floor area $46.18 $11.90 $8.29 Area B Cedar Valley Comprehensive Area C Includes all areas exclusive of Areas "A" and "B" within the municipal boundary (includes Silverdale industrial area) Industrial Per m2 of floor area $7.17 $7.14 $4.97 Institutional Per m2 of floor area $31.85 $7.14 $4.97 Single Family Per dwelling unit $1, $3, $ $ $1, $ $ $ $70.21 $5, $3, Compact S Per dwelling unit $1, $3, $ $ $1, $ $ $ $70.21 $5, $3, Cluster Comp. S.F. Per dwelling unit $1, $3, $ $ $1, $ $ $ $70.21 $5, $3, Townhouse Per dwelling unit $1, $2, $ $ $ $ $ $ $53.33 $4, $2, Garden Apartment Per dwelling unit $ $2, $ $ $ $ $ $ $42.50 $3, $2, Institutional Res. Per dwelling unit $ $2, $ $ $ $ $ $32.08 $2, $1, Local Commercial Per m2 of floor area $46.18 $ $22.34 $1.02 $ $8.72 $6.08 Neighbourhood Per m2 of floor area $46.18 $ $22.34 $1.39 $2.56 $0.77 $11.90 $8.29 Commercial Mixed Use Per m2 of floor area $46.18 $ $22.34 $1.39 $2.56 $0.77 $4.90 $0.34 $11.90 $8.29 Com/Res School Per m2 of floor area $31.85 $77.18 $20.94 $2.78 $5.13 $1.53 $7.14 $4.97 Institutional Per m2 of floor area $31.85 $77.18 $20.94 $2.78 $5.13 $1.53 $7.14 $4.97 Single Family Per dwelling unit $1, $ $5, $3, Townhouse Per dwelling unit $1, $ $4, $2, Apartments Per dwelling unit $ $ $3, $2, Duplexes, Triplexes Per dwelling unit $ $ $5, $3, Local Commercial Per m2 of floor area $46.18 $8.72 $6.08 Neighbourhood & Mixed Use Commercial/ Residential Per m2 of floor area $46.18 $11.90 $8.29 Industrial Per m2 of floor area $7.17 $7.14 $4.97 Institutional Per m2 of floor area $31.85 $7.14 $4.97

155
Development Cost Charge (DCC) Update
 Update") Development Cost Charge (DCC) Update Purpose Provide developers and other professionals with an overview of Development Cost Charges (DCCs) Review highlights of 2016 DCC program Projected growth and projects
Development Cost Charge (DCC) Update Purpose Provide developers and other professionals with an overview of Development Cost Charges (DCCs) Review highlights of 2016 DCC program Projected growth and projects
BACKGROUND INFORMATION DEVELOPMENT COST CHARGE BYLAW REVIEW & UPDATE
 BACKGROUND INFORMATION DEVELOPMENT COST CHARGE BYLAW REVIEW & UPDATE On April 29, 2013 the District of North Vancouver adopted a new DCC bylaw containing new rates that become effective November 1, 2013.
DRAFT FINAL REPORT. City of Kalispell. Stormwater Impact Fee Study
 DRAFT FINAL REPORT City of Kalispell Stormwater Impact Fee Study April 2017 April 13, 2017 Ms. Susie Turner, P.E. Public Works Director City of Kalispell 201 First Avenue East Kalispell, MT 59901 Subject:
Sunnyside Heights (Grandview Heights Area #2) Neighbourhood Concept Plan (NCP) - Engineering Servicing and Financial Strategies
 Neighbourhood Concept Plan (NCP) - Engineering Servicing and Financial Strategies") CORPORATE REPORT NO: R236 COUNCIL DATE: November 15, 2010 REGULAR COUNCIL TO: Mayor & Council DATE: November 10, 2010 FROM: General Manager, Engineering FILE: 6520-20 (GH#2) SUBJECT: Sunnyside Heights
CORPORATE REPORT NO: R236 COUNCIL DATE: November 15, 2010 REGULAR COUNCIL TO: Mayor & Council DATE: November 10, 2010 FROM: General Manager, Engineering FILE: 6520-20 (GH#2) SUBJECT: Sunnyside Heights
City of Ottawa Water, Wastewater and Stormwater Rate Structure Review
 City of Ottawa Water, Wastewater and Stormwater Rate Structure Review The City of Ottawa is developing a new rate structure to fund its water, wastewater and stormwater infrastructure. We need your help
CITY OF TORONTO WATER AND WASTEWATER UTILITY RATES
 PUBLIC REPORT TO CORPORATE AFFAIRS, STRATEGIC PLANNING AND PROPERTY COMMITTEE CITY OF TORONTO WATER AND WASTEWATER UTILITY RATES I can do all this through Him who gives me strength. Philippians 4:13 (NIV)
TOWNSHIP OF SPRINGWATER MIDHURST - WATER, WASTEWATER & TRANSPORTATION CLASS ENVIRONMENTAL ASSESSMENT PHASE 3 & 4. January 7, 2015 Education Meeting
 TOWNSHIP OF SPRINGWATER MIDHURST - WATER, WASTEWATER & TRANSPORTATION CLASS ENVIRONMENTAL ASSESSMENT PHASE 3 & 4 January 7, 2015 Education Meeting 1 Overview of Presentation Overview of the Class Environmental
6. INFRASTRUCTURE CHARGES
 6.1 Overview 6. INFRASTRUCTURE CHARGES Aquatera currently uses infrastructure charges to recover the capital cost of construction related to Water and Wastewater services. The Infrastructure Charge is
METRO VANCOUVER MOBILITY PRICING INDEPENDENT COMMISSION FINAL TERMS OF REFERENCE. Revised - June 30, 2017
 METRO VANCOUVER MOBILITY PRICING INDEPENDENT COMMISSION FINAL TERMS OF REFERENCE Revised - June 30, 2017 Contents 1. POLICY CONTEXT... 3 2. PROBLEM... 3 3. MANDATE... 4 4. SUPPORTING REGIONAL OBJECTIVES
SPRINGBANK Phase 1 Background Report
 Phase 1 Background Report Table of Contents 1.0 CONTEXT... 4 CENTRAL ASP... 4 NORTH ASP... 4 MODDLE ASP... 5 2.0 PROJECT SCOPE... 5 3.0 PLANNING POLICY FRAMEWORK... 6 COUNTY PLAN (BYLAW C-7280-2013)...
Syracuse General Redevelopment Plan Study Areas #1-3
 2010 Syracuse General Redevelopment Plan Study Areas #1-3 JEO Consulting Group, Inc. SYRACUSE GENERAL REDEVELOPMENT PLAN STUDY AREAS 1-3 Introduction/Background INTRODUCTION The Syracuse General Redevelopment
Wastewater System Financial Plan. For the Corporation of the City of Thunder Bay
 Wastewater System Financial Plan For the Corporation of the City of Thunder Bay Prepared January 2015 City of Thunder Bay 500 Donald Street East PO Box 800 Thunder Bay, Ontario, Canada P7C 5K4 Contents
Project Plan and Financing Plan for Reinvestment Zone Number Two,
 Project Plan and Financing Plan for Reinvestment Zone Number Two, City of Richardson, Texas (Program for Tax Increment Financing) Revised November 2012 Stein Planning, LLC by for the City of Richardson
KNL Lands Proposed Drainage Diversion to the Kizell Municipal Drain, City of Ottawa, Kanata North Ward
 KNL Lands Proposed Drainage Diversion to the Kizell Municipal Drain, City of Ottawa, Kanata North Ward Drainage Act, RSO 1990 Chapter D. 17, Section 65 Prepared for: City of Ottawa Prepared by: Stantec
THE LEGISLATIVE FRAMEWORK FOR MUNICIPAL PLANNING, SUBDIVISION, AND DEVELOPMENT CONTROL
 THE LEGISLATIVE FRAMEWORK FOR MUNICIPAL PLANNING, SUBDIVISION, AND DEVELOPMENT CONTROL Alberta Municipal Affairs February 1997 Updated March 2002 1.0 INTRODUCTION The authority for municipal planning,
What is a stormwater utility fee?
 What is a stormwater utility fee? A stormwater utility fee is similar to a water or sewer utility fee. In essence, customers pay a fee to convey stormwater from their properties. The City of Goodlettsville
GRAND NIAGARA Proposed Secondary Plan
 GRAND NIAGARA Proposed Secondary Plan Public Open House #3 January 17. 2017 scope + process BUILT Grand Niagara Secondary Plan The Grand Niagara Secondary Plan will establish a framework for the future
City of Salem Stormwater Utility Answers to Frequently Asked Questions
 Answers to Frequently Asked Questions Questions about Urban Stormwater Runoff... 3 1. What is urban stormwater runoff?...3 2. What is impervious surface?...3 3. Why is there a concern about stormwater
TOWN OF EAST GWILLIMBURY WATER AND WASTEWATER CONSERVATION STRATEGY
 TOWN OF EAST GWILLIMBURY WATER AND WASTEWATER CONSERVATION STRATEGY George Zukovs 1, Wayne Hunt 2 1. XCG Consultants Ltd, Oakville Ontario, Canada georgez@xcg.com 2. Town of East Gwillimbury Ontario, Canada
DEVELOPMENT ENGINEERING REVIEW MANUAL (Regional Services)
") DEVELOPMENT ENGINEERING REVIEW MANUAL (Regional Services) FEBRUARY, 2005 PLANNING AND TRANSPORTATION SERVICES PLANNING AND PUBLIC WORKS DEPARTMENT TABLE OF CONTENTS Introduction 1 Application Review 1.1
DEVELOPMENT ENGINEERING REVIEW MANUAL (Regional Services) FEBRUARY, 2005 PLANNING AND TRANSPORTATION SERVICES PLANNING AND PUBLIC WORKS DEPARTMENT TABLE OF CONTENTS Introduction 1 Application Review 1.1
Transportation Impact Fees (TIF)
") 2017 Frequently Asked Questions About. Transportation Impact Fees (TIF) Answers to commonly asked questions about TIF charges and who to contact for further information. Question: What are Transportation
2017 Frequently Asked Questions About. Transportation Impact Fees (TIF) Answers to commonly asked questions about TIF charges and who to contact for further information. Question: What are Transportation
AREA STRUCTURE PLAN PROCESS
 AREA STRUCTURE PLAN PROCESS Planning & Development Guide County of Grande Prairie No. 1 10001 84 Avenue Clairmont, Alberta, T0H 0W0 Tel: (780) 513-3950 Fax: (780) 539-7686 www.countygp.ab.ca Page 1 TABLE
CITY OF PITTSBURG DEVELOPMENT OF WATER AND SEWER FACILITY RESERVE CHARGES
 FINAL ADMINISTRATIVE DRAFT CITY OF PITTSBURG DEVELOPMENT OF WATER AND SEWER FACILITY RESERVE CHARGES April 2005 Prepared by: 201 North Civic Drive, Suite 115 Walnut Creek, California 94596-3864 March 28,
Improvement District Conversion Guide
 Improvement District Conversion Guide Ministry of Community, Aboriginal and Women s Services 2004 Table of Contents Introduction 2 Reasons for Conversion 2 Participants in the Conversion Process 3 Regional
City of Brantford Chapter 3 TABLE OF CONTENTS
 Chapter 3 The Land Use & Transportation Connection TABLE OF CONTENTS 3.1 THE LAND USE & TRANSPORTATION LINK... 1 3.2 POPULATION & EMPLOYMENT GROWTH FORECASTS... 3 3.2.1 Proposed Places to Grow Plan Forecasts
CITY OF ASHLAND REDEVELOPMENT PLAN FOR THE ASHLAND INVESTMENT CO., LLC HOUSING DEVELOPMENT
 CITY OF ASHLAND REDEVELOPMENT PLAN FOR THE ASHLAND INVESTMENT CO., LLC HOUSING DEVELOPMENT I. INTRODUCTION. The City of Ashland, Nebraska, recognizes that blight is a threat to the continued stability
Planning Justification Report. 70 Pioneer Trail Fernbrook Homes (Parkside) Ltd. Official Plan Amendment Zoning By-law Amendment.
 Ltd. Official Plan Amendment Zoning By-law Amendment.") 70 Pioneer Trail Fernbrook Homes (Parkside) Ltd Planning Justification Report Official Plan Amendment Zoning By-law Amendment September 2016 The Jones Consulting Group Ltd. #1-229 Mapleview Drive East,
70 Pioneer Trail Fernbrook Homes (Parkside) Ltd Planning Justification Report Official Plan Amendment Zoning By-law Amendment September 2016 The Jones Consulting Group Ltd. #1-229 Mapleview Drive East,
CITY OF VALLEJO PUBLIC WORKS DEPARTMENT TRAFFIC IMPACT Analysis/Study GUIDELINES
 The City Engineer, under the authority of the Public Works Director and recommendations from the Traffic Engineer, will make the final decision on the need for a traffic study. The purpose of the traffic
Transit Service Guidelines
 G R E AT E R VA N CO U V E R T R A N S P O RTAT I O N A U T H O R I T Y Transit Service Guidelines PUBLIC SUMMARY REPORT JUNE 2004 Greater Vancouver Transportation Authority TRANSIT SERVICE GUIDELINES
COMMISSIONERS OF PUBLIC WORKS of the CITY OF CHARLESTON, SOUTH CAROLINA DEVELOPMENT POLICIES
 COMMISSIONERS OF PUBLIC WORKS of the CITY OF CHARLESTON, SOUTH CAROLINA DEVELOPMENT POLICIES TABLE OF CONTENTS DEFINITIONS WATER POLICIES Water System Extensions.... W88001 Water System Activation / Service
Designing Regional Service Arrangements: An Introduction
 Designing Regional Service Arrangements: An Introduction Library and Archives Canada Cataloguing in Publication Data Main entry under title: Designing regional service arrangements : an introduction. Also
TravelSmart: Planning for Sustainable Urban Transportation
 Case Studies in Sustainable Transportation KAMLOOPS, BRITISH COLUMBIA CASE STUDY 3 TravelSmart: Planning for Sustainable Urban Transportation Organization City of Kamloops Transportation Department, Community
Draft Noise Abatement Guidelines
 Document under Separate Cover refer to IMLC01-13 Draft Noise Abatement Guidelines April 2013 Legislative & Planning Services Table of Contents 1.0 Introduction...1 1.1 Key Definitions...1 2.0 Existing
Transportation and Works Department The Regional Municipality of York Yonge Street Newmarket, Ontario L3Y 6Z1
 TRANSPORTATION IMPACT STUDY (TIS) GUIDELINES FOR DEVELOPMENT APPLICATIONS Transportation and Works Department The Regional Municipality of York 17250 Yonge Street Newmarket, Ontario L3Y 6Z1 August, 2007
Dunpar Developments Inc.
 Dunpar Developments Inc. Proposed Townhouse Development 2158, 2168, 2180 and 2192 Trafalgar Road Oakville, Ontario Functional Servicing and Stormwater Management Report (in Support of a Re-Zoning and Site
DISTRICT OF NORTH VANCOUVER GUIDELINES FOR THE DEVELOPMENT OF CONSTRUCTION TRAFFIC MANAGEMENT PLANS
 DISTRICT OF NORTH VANCOUVER GUIDELINES FOR THE DEVELOPMENT OF CONSTRUCTION TRAFFIC MANAGEMENT PLANS Construction Impact Mitigation Strategy Guidelines for Major Developments The District of North Vancouver
CITY OF HAMILTON PUBLIC WORKS DEPARTMENT Hamilton Water Division
 CITY OF HAMILTON PUBLIC WORKS DEPARTMENT Hamilton Water Division TO: Chair and Members Public Works Committee COMMITTEE DATE: March 17, 2014 SUBJECT/REPORT NO: Accelerated Remediation of Illegal Sewer
TES Industrial Development SW ¼ SEC Lacombe County Outline Plan
 TES Industrial Development Lacombe County Outline Plan 112849297 June 2012 am v:\1128\active\112849297\07_reports_studies\rpt_tes_20120508.doc i Table of Contents 1.0 INTRODUCTION... 1 1.1 PURPOSE... 1
Bonnie Doon Grade Separation
 6. 2 Bonnie Doon Grade Separation Recommendation: That the April 18, 2017, Integrated Infrastructure Services report CR_4461, be received for information. Report Summary This report provides information
FERRY COUNTY COUNTY-WIDE PLANNING POLICIES
 FERRY COUNTY COUNTY-WIDE PLANNING POLICIES This memorandum of understanding lays out the framework upon which the comprehensive planning process for Ferry County and the City of Republic will be built.
Debrob Investments Limited FUNCTIONAL SERVICING REPORT DRAFT PLAN OF SUBDIVISION, CITYVIEW DRIVE CITY OF GUELPH
 JULY 2013 DOCUMENT CONTROL Client: Project Name: Report Title: IBI Reference: 25528 Cityview Drive Version: JULY 2013 Digital Master: Originator: Reviewer: Authorization: [File Location] Scott MacDonald,
Corporate Report. Report from Office of the Chief Administrative Officer, Administration
 Corporate Report Report from Office of the Chief Administrative Officer, Administration Date of Report: April 12, 2013 Date of Meeting: April 22, 2013 Report Number: CAO-110-2013 File: 35.23.26 Subject:
TRANSPORTATION MOBILITY PLAN GUIDELINES
 TRANSPORTATION MOBILITY PLAN GUIDELINES for Development Applications November 2016 Executive Summary The Regional Municipality of York (the Region) is located in the heart of the Greater Toronto Area (GTA)
Authors Matt Ainsaar Allen Stephens
 Authors Matt Ainsaar Allen Stephens Document Information: Filename: cardinia road dcp document final 02_09_08 (pdp 9) Last Saved: 2 September 2008 1:59 PM Last Printed: 5 September 2008 5:10 PM File Size:
Handout 5: Stormwater Cost of Service
 Handout 5: Stormwater Cost of Service Introduction The purpose of this handout is to describe the current cost allocation methodology for the stormwater program. The existing Stormwater Management Service
2.1 Summary of Existing and Future Population Estimates
 SECTION 2 Demographics This technical memorandum identifies the uncertainties and describes potential future demographics that might affect wastewater facilities in the City of McCall, Idaho (the City).
SUBURBAN RESIDENTIAL. QLDC PROPOSED DISTRICT PLAN [PART THREE] DECISIONS VERSION 7 lower density SUBURBAN residential
![SUBURBAN RESIDENTIAL. QLDC PROPOSED DISTRICT PLAN [PART THREE] DECISIONS VERSION 7 lower density SUBURBAN residential](/thumbs/79/80169357.jpg "SUBURBAN RESIDENTIAL. QLDC PROPOSED DISTRICT PLAN [PART THREE] DECISIONS VERSION 7 lower density SUBURBAN residential") 7 LOWER DENSITY SUBURBAN RESIDENTIAL 7.1 Zone Purpose The Lower Density Suburban Residential Zone is the largest residential zone in the District. The District Plan includes such zoning that is within
7 LOWER DENSITY SUBURBAN RESIDENTIAL 7.1 Zone Purpose The Lower Density Suburban Residential Zone is the largest residential zone in the District. The District Plan includes such zoning that is within
INFRASTRUCTURE ELEMENT STORMWATER SUB-ELEMENT GOALS, OBJECTIVES & POLICIES
 INFRASTRUCTURE ELEMENT STORMWATER SUB-ELEMENT GOALS, OBJECTIVES & POLICIES GOALS, OBJECTIVES & POLICIES GOAL DR 1: STORMWATER MANAGEMENT/DRAINAGE SYSTEMS. It is the goal of the City of Casselberry to provide
Municipality of Kincardine Kincardine Business Park (KBP) Servicing Master Plan
 Servicing Master Plan") Municipality of Kincardine Kincardine Business Park (KBP) Servicing Master Plan Public Meeting and Open-House March 27, 2013 Agenda The Master Plan Process History of the Area Draft Servicing Strategy
Municipality of Kincardine Kincardine Business Park (KBP) Servicing Master Plan Public Meeting and Open-House March 27, 2013 Agenda The Master Plan Process History of the Area Draft Servicing Strategy
BYLAW NO LEDUC COUNTY
 BYLAW NO. 27-14 LEDUC COUNTY A BYLAW OF LEDUC COUNTY, IN THE PROVINCE OF ALBERTA, TO AMEND THE CITY OF LEDUC/LEDUC COUNTY INTERMUNICIPAL DEVELOPMENT PLAN BYLAW 30-11. WHEREAS The Council of Leduc County
WASTE MINIMISATION AND LANDFILL LIFE EXPECTANCY AT QUEENSTOWN LAKES DISTRICT COUNCIL
 WASTE MINIMISATION AND LANDFILL LIFE EXPECTANCY AT QUEENSTOWN LAKES DISTRICT COUNCIL William Clifford 1 *, John Cocks 1, Linda Wright 2 1 MWH NZ Ltd; 2 One World Consulting Ltd * P O Box 4, Dunedin, william.m.clifford@mwhglobal.com,
Chapter 21 Stormwater Management Bylaw
 Chapter 21 Stormwater Management Bylaw SECTION 1. PURPOSE The purpose of this Bylaw is to: implement the requirements of the National Pollutant Discharge Elimination System (NPDES) General Permit for Storm
Stormwater Rate Financing in Canada How to Make it Work TRIECA Ray Tufgar M.Eng., P.Eng MBA - AECOM Mike Gregory, P.Eng. CHI
 Stormwater Rate Financing in Canada How to Make it Work TRIECA 2017 Ray Tufgar M.Eng., P.Eng MBA - AECOM Mike Gregory, P.Eng. CHI March 22, 2017 3 3 Introductions & Welcome 1. Background 2. Rate Financing
Action Plan for a New Local Governance System in New Brunswick
 Action Plan for a New Local Governance System in New Brunswick December 2011 A message from the Premier As part of our 2010 election platform, Putting New Brunswick First, our Government committed to forging
Long Term Waste Management Strategy Terms of Reference
 STAFF REPORT ACTION REQUIRED Long Term Waste Management Strategy Terms of Reference Date: June 4, 2013 To: From: Wards: Reference Number: Public Works and Infrastructure Committee General Manager, Solid
CITY OF BRANTFORD GROWTH MANAGEMENT STRATEGY MHBC PLANNING
 CITY OF BRANTFORD GROWTH MANAGEMENT STRATEGY MHBC PLANNING April 18, 2006 TABLE OF CONTENTS Executive Summary...i Introduction...1 Part A The Identification of Land Needs...2 Factors Affecting Growth Trends
RURAL RESIDENTIAL COMMUNITY ROLE COUNCIL ROLE RURAL RESIDENTIAL ALL COMMUNITIES
 Orderly and Efficient Land Use Align land use, development patterns, and infrastructure to make the best use of public and private investment. Discourage future development of rural residential patterns
CITY OF BOYNTON BEACH COMPREHENSIVE PLAN UTILITIES ELEMENT
 EXHIBIT B CITY OF BOYNTON BEACH COMPREHENSIVE PLAN UTILITIES ELEMENT PROPOSED AMENDMENTS Table of Contents Objective Page Sanitary Sewer Sub-Element 3A.1 Secure reserve capacity at the South Central Regional
SANTA CRUZ LOCAL AGENCY FORMATION COMMISSION SPHERES OF INFLUENCE POLICIES AND GUIDELINES
 SANTA CRUZ LOCAL AGENCY FORMATION COMMISSION SPHERES OF INFLUENCE POLICIES AND GUIDELINES I. Legislative Authority Amended by Resolution No. 2011-1; February 2, 2011 The Knox-Nisbet Act of 1963 (former
Technical and Physical Feasibility Fact Sheet Alternative 28: Infill/Density
 Technical and Physical Feasibility Fact Sheet Alternative 28: Infill/Density Acknowledgements: This fact sheet was written by Phyllis Taylor of Sites Southwest as part of the Evaluation of Alternative
THE CORPORATION OF THE CITY OF BELLEVILLE SITE PLAN GUIDELINES
 THE CORPORATION OF THE CITY OF BELLEVILLE SITE PLAN GUIDELINES Manual Respecting Procedures, Policies, Standards Development Services Department January 31, 2005 This document contains the standards and
Plan Edmonton: Edmonton s Municipal Development Plan
 Plan Edmonton: Edmonton s Municipal Development Plan Schedule A of Bylaw No. 11777 Approved August 31, 1998, with Amendments to January 22, 2007 The City Council of the City of Edmonton will amend Plan
Development in the City of Toronto
 Development in the City of Toronto Water Infrastructure Challenges and Opportunities Graham Harding, P.Eng. Toronto Water, City of Toronto Urban Land Institute Leadership Program February 16, 2017 Toronto
National Water Demand Management Policy
 National Water Demand Management Policy Introduction In 1997, the Ministry of Water and Irrigation developed Jordan s Water Strategy and the following four policies, which include: Water Utility Policy;
NOW, THEREFORE, BE IT RESOLVED by the AUTHORITY that the following Wastewater Service Charges are established effective immediately.
 10-129 NORTH HUDSON SEWERAGE AUTHORITY WASTEWATER SERVICE CHARGE RESOLUTION ----------------------------------------------------------------------------------------------------------------------- MOTIONED
development services strategic plan
 development services strategic plan 2016 2018 contents 4 Branch manager s message 6 what we do 12 role of the strategic plan 14 city vision 15 corporate strategy: the way ahead 16 department & branch
Memorandum. FROM: Jim Ortbal Rosalynn Hughey Barry Ng TO: HONORABLE MAYOR, CITY COUNCIL. DATE: June 16, 2017
 CITY OF SANjOSE CAPITAL OF SILICON VALLEY TO: HONORABLE MAYOR, CITY COUNCIL SUBJECT: TRANSPORTATION POLICY UPDATE REQUIRED BY STATE LAW - LOS TO VMT Memorandum FROM: Jim Ortbal Rosalynn Hughey Barry Ng
1 RICHMOND HILL CENTRE / LANGSTAFF URBAN GROWTH CENTRE - TRANSPORTATION STUDY
 Report No. 4 of the Transportation Services Committee Regional Council Meeting of April 22, 2010 1 RICHMOND HILL CENTRE / LANGSTAFF URBAN GROWTH CENTRE - TRANSPORTATION STUDY The Transportation Services
District of North Vancouver Construction Traffic Management Plan Guidelines
 District of North Vancouver Construction Traffic Management Plan Guidelines The District of North Vancouver is committed to ensuring that the disruptions to the community and traffic associated with construction
VDOT Land Use Overview. Brad Shelton, AICP Transportation and Mobility Planning Division June 2015
 VDOT Land Use Overview Brad Shelton, AICP Transportation and Mobility Planning Division June 2015 VDOT Land Development Programs Local/State Plan and Program Consistency Review local comp plan transportation
B. Stakeholder Guide: Infrastructure and utility providers
 B. Stakeholder Guide: Infrastructure and utility providers Why is the Government proposing new legislation? As our population grows, the Government wants to accelerate the building of new communities and
LAND USE POLICIES BY COMMUNITY DESIGNATION
 137 2040 138 Land Use Policies by Community Designation As discussed earlier in Thrive MSP 2040, the Council assigns a community designation to each city and township. This designation indicates the overall
Section 9 Implementation
 Section 9 Implementation 9 Section 9: Implementation 9.1 Overview The primary role of Your Bright Future is to provide a community sustainability based framework to direct the future growth and development
STORM WATER MANAGEMENT REPORT
 Silvercreek Junction STORM WATER MANAGEMENT REPORT Howitt Creek at the Silvercreek Parkway Site Guelph, Ontario August, 2008 TSH File 22304A-04 August 19, 2008 STORMWATER MANAGEMENT REPORT Howitt Creek
ELECTRIC COST OF SERVICE AND RATE DESIGN STUDY
 DRAFT Report ELECTRIC COST OF SERVICE AND RATE DESIGN STUDY Navajo Tribal Utility Authority August 2007 DRAFT NAVAJO TRIBAL UTILITY AUTHORITY ELECTRIC COST OF SERVICE AND RATE DESIGN STUDY Table of Contents
Town of Petawawa Infrastructure Study Update 2013
 2013 TABLE OF CONTENTS Chapter 1 Overview Chapter 2 Sanitary Sewer System Chapter 3 Storm Drainage System Chapter 4 Road System Chapter 5 Water Distribution System Chapter 6 Comprehensive Plan Appendix
CITY OF PHOENIX URBAN RENEWAL PLAN
 CITY OF PHOENIX URBAN RENEWAL PLAN Phoenix Urban Renewal Agency June, 2005 CITY OF PHOENIX URBAN RENEWAL PLAN CITY OF PHOENIX URBAN RENEWAL PLAN ACKNOWLEDGEMENTS This urban renewal plan was prepared with
Title 15 BUILDINGS AND CONSTRUCTION
 Title 15 BUILDINGS AND CONSTRUCTION Chapters: 15.04 International Codes Adopted 15.08 Building Permits 15.12 Movement of Buildings Chapter 15.04 INTERNATIONAL CODE COMMISSION CODES Sections: 15.04.010
Niagara Region Transportation Master Plan Niagara-Hamilton Trade Corridor Technical Paper
 Niagara-Hamilton Trade Corridor Technical Paper 1. Purpose In the report to Council on the Regional Council Strategic Priorities Implementation Plan, pursuing Provincial commitment for the Niagara to Greater
Water, Wastewater and Stormwater 2017 Budget 2018 Plan
 Executive Summary Water, Wastewater and Stormwater In May 2000, the E.coli outbreak and water contamination events in the Town of Walkerton led to an inquiry under Justice Dennis O Conner. The recommendations
Building a Highway Network: Who Pays for Highway Improvements as a Result of Development
 Building a Highway Network: Who Pays for Highway Improvements as a Result of Development Friday, February 20, 2009 Executive Summary Introduction The highway network throughout Alberta is a vital contributor
Natural Systems Planning Primer
 Natural Systems Planning Primer Lise.Guevremont@ottawa.ca Amy.Macpherson@ottawa.ca Land Use and Natural Systems Unit Planning and Growth Management November 2015 1 Welcome Policy Framework Development
Project Plan for TAX INCREMENTAL FINANCE DISTRICT #41 (UNIVERSITY-WHITNEY) City of Madison
 City of Madison") Project Plan for TAX INCREMENTAL FINANCE DISTRICT #41 (UNIVERSITY-WHITNEY) City of Madison Prepared by: Department of Planning and Community and Economic Development Economic Development Division Office
Project Plan for TAX INCREMENTAL FINANCE DISTRICT #41 (UNIVERSITY-WHITNEY) City of Madison Prepared by: Department of Planning and Community and Economic Development Economic Development Division Office
April 19, Dear Ms. Haskins
 227 West Trade Street Phone 704 373 1199 www.raftelis.com Suite 1400 Fax 704 373 1113 Charlotte, NC 28202 April 19, 2018 Ms. Rhonda Haskins, CPA Director of Financial Planning Fayetteville Public Works
The rezoning application and proposed transportation facility warrants consideration.
 Date: November 11, 2014 To: Re: Chair and Members Planning & Development Committee PDE File Number: REZ1400020 275 Conception Bay South Bypass Road, Ward 5 Application to Rezone Land to Industrial General
OAKLAND COUNTY HEALTH DIVISION SANITARY CODE ARTICLE II - GROUNDWATER PROTECTION
 OAKLAND COUNTY HEALTH DIVISION SANITARY CODE ARTICLE II - GROUNDWATER PROTECTION INDEX OF CODE SECTION 1 SECTION 2 SECTION 3 SECTION 4 SECTION 5 SECTION 6 DEFINITIONS RESIDENTIAL BUILDING SITES COMMERCIAL
Improvement District Governance: Policy Statement
 Improvement District Governance: Policy Statement Improvement 2006 District Governance: Policy Statement p.0 Improvement District Governance: Policy Statement Table of Contents 1.0 PURPOSE 1 2.0 SUMMARY
Chapter 1. Introduction
 Chapter 1 Introduction James P. Heaney, Robert Pitt, and Richard Field Introduction Stormwater has traditionally been considered a nuisance, requiring rapid and complete drainage from areas of habitation.
Community Lifecycle Infrastructure Costing (CLIC) Tool: User Guide (Version 1.0) Ministry of Community, Sport and Cultural Development
 Tool: User Guide (Version 1.0) Ministry of Community, Sport and Cultural Development") Community Lifecycle Infrastructure Costing (CLIC) Tool: User Guide (Version 1.0) Ministry of Community, Sport May 2015 Prepared for the Ministry of Community, Sport by Stantec Consulting Inc. COMMUNITY
Community Lifecycle Infrastructure Costing (CLIC) Tool: User Guide (Version 1.0) Ministry of Community, Sport May 2015 Prepared for the Ministry of Community, Sport by Stantec Consulting Inc. COMMUNITY
Watercare $ 7 August Productivity Commission PO Box 8036 WELLINGTON Attention: Steven Bailey.
 Watercare $ An Auckland Council Organisation -.. _._. 7 August 2015 Watercare Services Limited 73 Remuera Road, Remuera Auckland 1050, New Zealand Private Bag 92521 Wellesley Street, Auckland 1141, New
Municipality of Central Manitoulin
 Municipality of Central Manitoulin Municipal Asset Management Plan December 31 st, 2013 Asset Management Planning for the Municipality of Central Manitoulin Table of Contents The contacts in connection
Wastewater Treatment & Water Supply Alternatives Analysis
 Wastewater Treatment & Water Supply Alternatives Analysis Lake Sallie & Lake Melissa Chain of Lakes Prepared for Pelican River Watershed District February 2008 Table of Contents 1.0 EXECUTIVE SUMMARY...
Reducing Flood Risk in Toronto. David Kellershohn, M.Eng., P. Eng. Toronto Water, City of Toronto
 Reducing Flood Risk in Toronto David Kellershohn, M.Eng., P. Eng. Toronto Water, City of Toronto Institute for Catastrophic Loss Reduction February 19, 2016 1 Agenda Reducing Flood Risk in Toronto 1) Overview
WAUKEE CENTRAL URBAN RENEWAL PLAN WAUKEE CENTRAL URBAN RENEWAL AREA WAUKEE, IOWA
 WAUKEE CENTRAL URBAN RENEWAL PLAN for the WAUKEE CENTRAL URBAN RENEWAL AREA WAUKEE, IOWA October 2017-1 - TABLE OF CONTENTS SECTION A. INTRODUCTION B. DESCRIPTION OF THE URBAN RENEWAL AREA C. AREA DESIGNATION
LOT GRADING GUIDELINES
 LOT GRADING GUIDELINES RESIDENTIAL PROPERTIES The Drainage Bylaw 18093 came into effect on January 1, 2018 replacing previous versions of the Drainage Bylaw 16200. This Bylaw requires that all single family,
Policy for determining capital contributions on Vector s electricity distribution networks. From 1 December 2017
 Policy for determining capital contributions on Vector s electricity distribution networks From 1 December 2017 Pursuant to: Electricity Distribution Information Disclosure Determination 2012 1 Table of
227 West Trade Street Phone Suite 1400 Fax Charlotte, NC 28202
 227 West Trade Street Phone 704 373 1199 www.raftelis.com Suite 1400 Fax 704 373 1113 Charlotte, NC 28202 March 13, 2018 Ms. Courtney Driver Utilities Director Winston-Salem/Forsyth County Utilities PO
Potable Water Supply, Wastewater & Reuse Element
 Potable Water Supply, Wastewater & Reuse Element GOAL ONE: HIGH QUALITY AND AFFORDABLE POTABLE WATER WILL BE AVAILABLE TO MEET THE EXISTING AND PROJECTED DEMANDS OF PINELLAS COUNTY UTILITY CUSTOMERS. 1.1.
DISTRICT OF SECHELT SUBDIVISION AND DEVELOPMENT CONTROL SERVICING STANDARDS BYLAW No. 430, 2003
 DISTRICT OF SECHELT SUBDIVISION AND DEVELOPMENT CONTROL SERVICING STANDARDS BYLAW No. 430, 2003 Consolidated for convenience January 2014 This Consolidation includes the following Bylaw Amendments: 430-1,
Wairaka Precinct (Unitec) Wastewater Servicing
 Wastewater Servicing") mps limited 29 Chamberlain Street Grey Lynn, Auckland 1021 Ph: 021 899 221 30 October 2015 Unitec Institute of Technology Private Bag 92025 Victoria Street West Auckland 1142 Attention: Will Smith Dear
mps limited 29 Chamberlain Street Grey Lynn, Auckland 1021 Ph: 021 899 221 30 October 2015 Unitec Institute of Technology Private Bag 92025 Victoria Street West Auckland 1142 Attention: Will Smith Dear