Response to request for review Blended Cement Project with Fly Ash Lafarge India Private Limited (0715)
|
|
|
- Pearl Copeland
- 5 years ago
- Views:
Transcription
20 7357 6080 Fax: +44 (0) 20 7407 1239 http://www.dnv.com Your ref.: Our ref.")
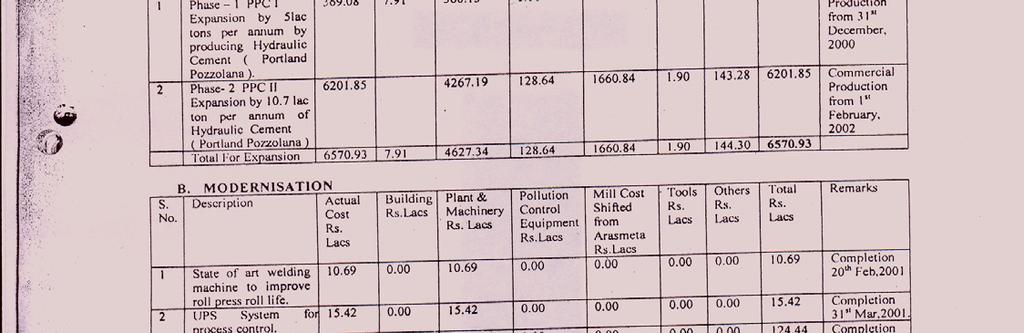
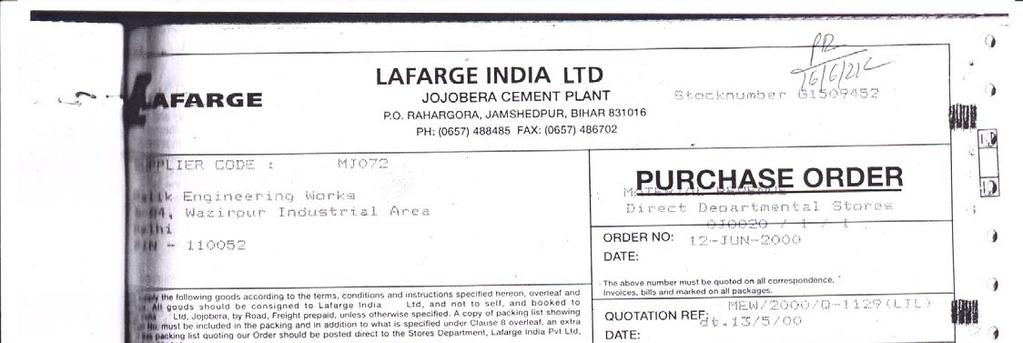
1 DET NORSKE VERITAS UNFCCC Secretariat Martin-Luther-King-Strasse 8 D Bonn Germany Att: CDM Executive Board DET NORSKE VERITAS CERTIFICATION LTD Palace House 3 Cathedral Street London SE19DE United Kingdom Tel: +44 (0) Fax: +44 (0) Your ref.: Our ref.: Date: CDM Ref 0715 MLEH/KCHA 22 January 2007 Response to request for review Blended Cement Project with Fly Ash Lafarge India Private Limited (0715) Dear Members of the CDM Executive Board, We refer to the requests for review raised by four Board members concerning DNV s request for registration of the Blended Cement Project with Fly Ash Lafarge India Private Limited (Ref 0715) and would like to provide an initial response to the issues raised in these requests for review. Comment #1: The application and interpretation of step 0 and step 3 of the tool for assessment of additionality are not sufficiently substantiated. The project claims credits retroactively. Neither the PDD nor the validation report is convincing on the documentation which was available at or prior to the start of the project, showing that CDM was seriously considered in the decision to proceed with the project activity. Moreover, since additionality is claimed based on the need to construct new equipment for PPC Circuit I and a totally new (greenfield) PPC circuit II, the starting dates of the construction of this equipment is missing as well. DNV s response: We draw your attention to section 3.4 of DNV s validation report, which clearly states that As the project proponent wishes to have a crediting starting prior to the registration of project activity which started before registration, it must be established that the CDM was seriously considered during project inception. The following primary documentation to this effect has been verified: i) The purchase order for additional equipment such as air separator, bucket elevator, air slides and solid flow meter incorporated into the system in order to produce PPC from the existing mills. ii) Internal management notes dated April 2001 mentioning the cost benefit analysis and also possibility of CDM credits for environment friendly projects in cement plants. iii) Plant records and evidence on R&D activities and trend showing increase in percentage of fly ash addition The evidences of the above are enclosed to this letter in attachment 1.
2 DET NORSKE VERITAS As indicated in the PDD, DNV was able to confirm that implementation of additional equipments in PPC circuit #I was completed on 15 May 2001 and PPC circuit #2 was commissioned on 1 July DNV was also able to verify that the following additional equipments have been added to PPC circuit #1 as a result of the project activity: OSPA V air separator, bucket elevator, air slides and solid flow meters, all totalling to an investment of INR 35 million. Moreover, it was demonstrated that Lafarge has invested INR 452 million in designing, procuring and installation of the second ball mill, specifically for PPC production with incremental addition of fly ash. This is apart from INR 2.8 million invested for procuring quality control and R&D equipments in order to produce best quality PPC and high share of fly ash. Kindly refer to attachment 1 in the response provided by the project proponent for evidences on the investments made for PPC circuits #1 and #2. Comment #2: In the country a steady trend of increasing additives (hence decreasing the clinker content) is occurring without the assistance of CDM. Nowadays the production of PPC (Portland Pozzolanic Cement) replacing 22 25% of clinker by fly ash is current practice in the country. Comparing the project activity to the identified baseline plants it remains unclear to which extent the content of fly ash and other additives is increased in the project activity and why this increase would constitute a specific barrier." DNV s response: The baseline has been selected by evaluating the prevailing clinker percentage in PPC manufacturing in the selected region (the states of Bihar, Jharkhand, Assam, Meghalaya, Orissa and West Bengal), which use similar inputs as the project and face similar economic, market and technical circumstances. The published data of CMA of India has been used for verification of the same. In DNV s opinion, it is sufficiently demonstrated that the project activity is not common practice by presenting facts on the following three perspectives: Historically low share in consumption of blended cement in India Comparison of blend percentages in the region of the project activity and How Lafarge is overcoming the perceived barriers We also draw your attention to the Clarification Request # 1 to 4 in in Table 3 of Appendix A to DNV s validation report and the response from Lafage which address this issue to a very large extent. Historically low share in consumption of blended cement in India While we acknowledge the fact that use of fly-ash based cement in India has grown over the last five years, it must also be noted that the project activity is all about increasing the share of additives (i.e. reduce the share of clinker) in the production of cement types beyond current practices in the country. This is in line with the applicability conditions stipulated in the approved baseline methodology (ACM005) adopted as well. The project activity is using increased level of additives, i.e. fly-ash from neighbouring thermal power plants (National Thermal Power Corporation-NTPC) to replace clinker in the manufacturing of Portland Pozzolana Cement (PPC) beyond the current levels in the eastern region.
3 DET NORSKE VERITAS The report by ICRA The Indian Cement Industry 2006 (attachment 2) states several reasons behind the historically low share in consumption of blended cement in India: As the compressive strength of the blended cements is comparable to the 33-grade OPC, which is the lowest grade, the market perceives the blended cements as relatively lowerstrength varieties. The cement consumer is not confident of the quality of the blended material used for manufacturing blended cements. The darker colour of blended cements and the colour variations in them are mistakenly attributed to impurity. For example, PPC is generally of darker colour as compared with OPC because of the carbon present in fly ash. Consumers are yet to realize the advantages of using blended cements in certain locations, like aggressive soils. Further, there is a wrong impression in the market that addition of blended material degrades the properties of blended cements. The aforementioned reasons for lower share blended cement consumption in the region have also been addressed in the PDD and in DNV s validation report Comparison of blend percentages in the region of the project activity The baseline has been selected by determining the common prevailing clinker percentage of PPC in other manufacturing plants in the selected region that use similar raw material as the project and face similar economic, market and technical circumstances. The data published by the Cement Manufacturers Association of India (CMA) has been sourced for the same. As per the selection criteria stipulated in ACM0005, for selection of the region, it has been justified that, i) 95% of total production is sold with in the region selected, ii) The region selected includes six plants with published data from 2001, and iii) Production in the region is more than the minimum four times of project plant s output as required by the methodology As indicated in the PDD and in the validation report, data available from CMA of India demonstrates that the manufacturing of PPC with fly ash percentage of 22-25% in the region was a common practice at the time of project implementation. However, the project plans to increase the fly ash proportion from 30% to 35% over the crediting period, which is beyond the common practise in the region. It has been sufficiently demonstrated that increasing fly ash content is a difficult proposition because of various market related & technical barriers as indicated above and addressed in the PDD. How Lafarge is overcoming the perceived barriers While Bureau of Standards (BIS, a government body) has set a maximum limit of 35% of fly ash content in PPC, most companies have not been able to raise the percentage levels beyond 25% for the reasons stated as above. DNV was able to confirm that Lafarge has initiated the following efforts to increase the fly ash proportion beyond the common practise in the region: Investments towards utilization of different types of fly ash: Getting high quality fly ash that could be mixed in PPC is also a problem faced by the project promoter. Lafarge has invested towards procuring quality control and R&D equipments to handle different types of fly ash in the plant. As elucidated above for comment #1, it has been verified by DNV that INR 35 million was invested for installation of additional equipment in the existing ball mill and about INR 452 million was invested in designing, procuring and installation
4 DET NORSKE VERITAS of the second ball mill, specifically for PPC production with incremental addition of fly ash, in addition to INR 2.8 million for procuring quality control and R&D equipments in order to produce best quality PPC and high share of fly ash. These investments are solely for the purpose of producing PPC Improving market perception: Various marketing campaigns aimed towards improving customer awareness about high blend cement in the market have been verified by DNV Kindly refer to the evidences for the above, provided in the project proponents response to the request for review EB comment #3: No information is provided on the economical benefits of producing PPC (e.g. cost savings as a result of a decreased use of clinker), which makes it difficult to understand why additional investments are to be considered as barriers. DNV s response: As indicated in the validation report, CDM revenues is likely to enhance the viability of the project, strengthen process control and is expected to impact the project proponent s research and marketing efforts towards overcoming the market barriers. Hence, CDM is required for initial overcoming of barriers as well as long term investment for the sustenance of the project. Moreover, a detailed economic internal rate of return calculation as sought by the DNA in India, the Ministry of Environment and Forest's CDM cell enclosed (attachment 3) demonstrates that the economic costs and benefits accrued due to the project activity is determined to be 28%. We sincerely hope that the Board accepts our aforementioned explanations. Yours faithfully for DET NORSKE VERITAS CERTIFICATION LTD Michael Lehmann Technical Director International Climate Change Service Chandrashekara Kumaraswamy Manager (South Asia) ATTACHMENTS: Attachment 1: CDM consideration - evidence Attachment 2: ICRA Cement data Attachment 3: Economic IRR analysis
5 Attachment 1
6

7
8


9
10
11
12
13
14
15
16 Attachment 2
17 ICRA THE INDIAN INDUSTRY July 2006 ICRA Sector Analysis Industry Comment
18 Contacts : Vineet Nigam Amul Gogna Assistant General Manager Executive Director Copyright, ICRA Limited, 26 Kasturba Gandhi Marg, New Delhi None of the information contained in this publication may be copied, otherwise reproduced, repackaged, further transmitted, disseminated, redistributed, or resold, or stored for subsequent use for any such purpose, in whole or in part, in any form or manner or by means whatsoever, by any person without ICRA's prior written permission. All information contained herein has been obtained by ICRA from sources believed by it to be accurate and reasonable. Although reasonable care has been taken to ensure that the information herein is true, such information is provided 'as is' without any warranty of any kind, and ICRA in particular, makes no representation or warranty, express or implied, as to the accuracy, timeliness or completeness of any such information. All information contained herein must be construed solely as statements of opinion and ICRA shall not be liable for any losses incurred by users from any use of this publication or its contents. In the course of work, ICRA may have received information from companies being rated or graded. However, this publication does not contain any confidential information obtained by ICRA in the process of rating or grading. This publication contains data/information available only in the public domain or available through secondary sources. Opinions expressed in this publication are not an indication of prospective rating/grading for any instruments to be issued by any of the companies concerned. Page 2 of 32
19 TABLE OF CONTENTS ENVIRONMENT ANALYSIS-PORTER'S MODEL... 4 STRUCTURE OF THE INDUSTRY... 5 MAJOR PLAYERS... 5 SIGNIFICANT CONSOLIDATIONS... 5 DECLINING ROLE OF PUBLIC SECTOR... 6 THE MINI- INDUSTRY... 6 PROCESS TECHNOLOGY... 7 SCALE OF OPERATIONS... 8 IMPORTANCE TO ECONOMY... 8 DUTIES ON... 9 DEMAND-SUPPLY POSITION... 9 ROBUST PRODUCTION GROWTH... 9 LOW BUT RISING SHARE OF BLENDED IN INDIA REGIONAL PRODUCTION PATTERNS MAJOR PLAYERS LOCATIONAL ISSUES HIGH GROWTH IN DOMESTIC CONSUMPTION END-USER PROFILE EXPORTS DEMAND-SUPPLY POSITION PRICES RAW MATERIALS LIMESTONE GYPSUM GRANULATED BLAST FURNACE SLAG (GBFS) MAINTENANCE AND STORES REQUIREMENTS ENERGY AND TRANSPORT REQUIREMENTS COAL POWER TRANSPORTATION NEW/EXPANSION PROJECTS FINANCIAL PERFORMANCE COST STRUCTURE VOLUME GROWTH AND CAPACITY UTILISATION MARGINS RETURNS FINANCIAL PERFORMANCE DURING FY OUTLOOK Page 3 of 32
20 ENVIRONMENT ANALYSIS PORTER S MODEL Threat of Substitutes - Limited Bitumen in Road, and Engineering Plastics in Building offer some element of competition Threat of New Entrants- Limited High Capital Investment (Rs.3500/tonne), Distribution Network and Oversupplied market deters new entrants. Technology and Manpower easily available Inter Firm Rivalry-Intense Large number of players, intermittent overcapacity; marginal product differentiation; high storage costs; and, high exit barrier in form of significant capital investment Bargaining Power of Buyers-Limited Rising share of retail purchase, Declining share of bulk purchase Bargaining Power of Suppliers-Very High Monopolistic control of external cost element (coal, power, transportation) result in high bargaining power with the government Page 4 of 32
21 STRUCTURE OF THE INDUSTRY Major Players With an installed capacity of around 157 million tonnes per annum (mtpa) at end-march 2006, large cement plants accounted for 93% of the total installed capacity in India. The installed capacity is distributed over across approximately 129 large cement plants owned by around 54 companies. The structure of the industry is fragmented, although, the concentration at the top is increasing. The fragmented structure is a result of the low entry barriers in the post decontrol period and the ready availability of technology. However, cement plants are capital intensive and require a capital investment of over Rs. 3,500 per tonne of cement, which translates into an investment of Rs. 3,500 million for a 1 mtpa plant. The cement industry has witnessed substantial reorganisation of capacities during the last couple of years. Some examples of the consolidation witnessed during the recent past include: Gujarat Ambuja taking a stake of 14% in ACC; Gujarat Ambuja taking over DLF Cements and Modi Cement; India Cement taking over Raasi Cement and Sri Vishnu Cement; Grasim's acquisition of the cement business of L&T; Indian Rayon's cement division merging with Grasim; Grasim taking over Sri Digvijay Cements; L&T taking over Narmada Cements; ACC taking over IDCOL. Multinational cement companies have also initiated the acquisition process in the Indian cement market. Swiss cement major Holcim has picked up 14.8% of the promoters stake in Gujarat Ambuja Cements (GACL). In January 2006, Holderind Investments (Holcim Mauritius), an indirect, wholly-owned subsidiary of Holcim, acquired 200 million equity shares of GACL at a price of Rs.105 per share from the promoters. Post-sale, the share of promoters in the company is 9%. Holcim also made an open offer to acquire an additional 20% stake in GACL at Rs per share. Earlier, Holcim had entered into a strategic alliance with GACL, and acquired a 67% controlling stake in Ambuja Cement India. Through this holding company, Holcim acquired a majority in Ambuja Cement Eastern and a substantial stake in ACC. Ambuja Cement India holds a 34% share in ACC and a 97% share in Ambuja Cement Eastern. Holcim's acquisition has led to the emergence of two major groups in the Indian cement industry, the Holcim-ACC-Gujarat Ambuja Cements combine (capacity of 33.5 mt) and the Aditya Birla group through Grasim Industries and Ultratech Cement (combined capacity of 31.1 mt). Lafarge, the French cement major, had acquired the cement plants of Raymond and Tisco in the recent past, and has an installed capacity of 5 mtpa. Italy based Italcementi has acquired a stake in the K.K. Birla promoted Zuari Industries' cement plant in AP, with a capacity of 3.4 mtpa. Recently, Heidelberg Cement has entered into an equal joint-venture agreement with S P Lohia Group controlled Indo-Rama Cement. Heidelberg Cement is expected to take a 50% controlling stake in Indo-Rama's grinding plant of 0.75 mtpa at Raigad in Maharashtra. As on March 2006, ACC was the largest player with a capacity of mtpa. UltraTech CemCo Ltd. 1 now occupies the second slot with a capacity of 17 mtpa (which includes 1.5 mtpa of subsidiary Narmada Cement). The Gujarat Ambuja group has emerged as the third largest player with a capacity of mtpa. Grasim ranks fourth with a capacity of mtpa. Other leading players include India Cements, Jaypee group, Century Textiles, Madras Cements, Lafarge, and Birla Corp. Significant Consolidations As discussed above, the cement industry is witnessing a number of Mergers & Acquisitions (M&As). The extent of concentration in the industry has increased over the years. This concentration is mainly because of the focus of the larger and the more efficient units to consolidate their operations by restructuring their business and taking over relatively weaker units. The relatively smaller and weaker units are finding it difficult to withstand the cyclical pressure of the cement industry. Some of the key benefits accruing to the acquiring companies from these acquisition deals include: economies of scale resulting from the larger size of operations savings in the time and cost required to set up a new unit access to new markets access to special facilities / features of the acquired company and, benefits of tax shelter. 1 The company formed subsequent to the demerger of the cement business of L&T and acquisition of the same by the Aditya Birla Group. The scheme of demerger became effective from 14/5/2004 and the cement business was transferred to UltraTech CemCo Ltd. from the Appointed Day viz. 1/4/ Page 5 of 32
22 The relative market share of large players in the cement industry has changed significantly over the years. Consolidation of capacities has seen UltraTech, Grasim, India Cement and Gujarat Ambuja emerge as the leading players apart from ACC, which has been the market leader during all the years excepting FY2001. All the players have resorted to a combination of greenfield capacities as well as takeover of existing capacities for growth. Market Share of Leading Cement Producers FY The Associated Cement Companies Limited 11.2% 12.2% 12.8% 13.5% 13.0% 12.6% UltraTech CemCo Ltd. 11.9% 11.1% 10.5% 10.1% 10.1% 9.7% Gujarat Ambuja Cements Limited 10.6% 8.7% 9.5% 10.1% 11.3% 10.6% Grasim Industries Limited. 9.2% 10.3% 10.9% 10.9% 10.3% 10.3% Century Textiles and Industries Limited 5.4% 5.0% 4.8% 4.8% 4.8% 4.7% Birla Corp Limited 4.2% 4.0% 4.1% 4.1% 3.9% 3.6% The India Cements Limited 7.3% 5.8% 5.4% 5.4% 5.1% 5.9% Jaiprakash Industries Limited 2.3% 3.9% 3.8% 3.6% 4.3% 4.5% Lafarge 3.8% 3.8% 3.4% 3.2% 3.4% 3.2% Others 34.1% 35.2% 34.8% 34.3% 33.7% 34.8% Total 100% 100% 100% 100% 100% 100% Declining Role of Public Sector Historically, cement has been one of the most important areas of operations for the Indian private sector. Unlike much of heavy industry and utilities, cement was not deemed to be the exclusive preserve of the State sector in the post-independence development strategy. Cement was also the industry of choice of many corporates diversifying away from the troubled traditional areas of jute and textiles. Over the years, the share of the public sector in cement production has declined. While the private sector (large companies) accounts for around 95% of the total installed capacity, the share of public sector companies has declined from a level of 11% in FY1996 to around 4.4% in FY2006. The share in production of the public sector companies is even lower at 1.2% in FY2006 as compared to 6.5% in FY1996. Among cement public sector undertakings (PSUs), Cement Corporation of India (CCI), a central PSU, is the leading player. It has 10 cement plants with a total installed capacity of 3.85 mtpa at end-fy2006. Other PSU companies manufacturing cement include State entities such as UP State Cement Corporation (3 units with total capacity of 2.16 mtpa); and Tamil Nadu Cement (2 plants with a total capacity of 0.9 mtpa). Given the extent of losses being incurred by most of these plants, restructuring and revival through privatisation appears imminent. Accordingly, the Yerraguntla unit in Andhra Pradesh, which belonged to CCI, was taken over by India Cements in FY1998. The three units of UP State Cement Corporation have been closed since early These units were taken over by Jaypee Group in FY2006. The Mini-Cement Industry In order to reduce transportation as well as capital costs, to increase regional development and to make use of smaller limestone deposits, many mini-cement plants have been set up in dispersed locations across India. Construction of such plants began in the early-1980s and their capacity (including capacities of white cement plants) aggregates about 11.1 mtpa. The main attraction of the mini-cement plant concept is the lower capital costs per tonne of capacity as compared to large plants. Against the requirement of Rs per tonne of capacity of large plants, capital costs for mini-cement plants come to about Rs. 1,400-1,600 per tonne. This reduces to a large extent the fixed cost per tonne of cement produced. Also, as the main market is in the vicinity of a mini-cement plant, savings are large on transportation costs. All these benefits however are negated by other factors like diseconomies associated with small-scale operation, significant competition from large-scale units and rising cost of production. The mini-cement plants rely almost entirely on the State Electricity Boards (SEBs) for power supply, since captive generation is uneconomical for small size. A backup DG set for meeting 25% of the power is however usually provided for. Hence, even when Page 6 of 32
23 mini-cement plants consume fewer units their power costs are comparable to those of large cement plants. Further, reliance on SEB power implies exposure to frequent power cuts. Primarily, the mini cement plant was conceived to utilise isolated limestone deposits too small to support a large cement plant. Strategically, the policy makers may have viewed them as a counter weight against concentration, both in terms of output and as a means of reducing the threshold entry barrier. However, most of these plants are yet to make an upgradation from mini to large cement plant. Even with the excise concession, these plants have not made any significant inroads into the Indian cement market. One reason is that the quantity produced by these plants is extremely insignificant to give any real price competition to large cement companies. The realisations achieved by mini-cement plants are lower compared to large cement plants due to the quality perceptions of the established brands of large companies. Further, most of the mini cement plants are to some measure dependent on clinker from the large cement plants. Their flexibility to be price setters is limited by their poor financial health. Process Technology While adding fresh capacities, the cement manufacturers are very conscious of the technology used. In cement production, raw materials preparation involves primary and secondary crushing of the quarried material, drying the material (for use in the dry process) or undertaking a further raw grinding through either wet or dry processes, and blending the materials. Clinker production is the most energy-intensive step, accounting for about 80% of the energy used in cement production. Produced by burning a mixture of materials, mainly limestone, silicon oxides, aluminum, and iron oxides, clinker is made by one of two production processes: wet or dry; these terms refer to the grinding processes although other configurations and mixed forms (semi-wet, semi-dry) exist for both types. In the dry process, the raw materials are ground, mixed, and fed into the kiln in their dry state. In the wet process, the crushed and proportioned materials are ground with water, mixed, and fed into the kiln in the form of a slurry. The choice among different processes is dictated by the characteristics and availability of raw materials. For example, a wet process may be necessary for raw materials with high moisture content (greater than 15%) or for certain chalks and alloys that can best be processed as a slurry. The dry process is the more modern and energy-efficient configuration. In general, the dry process is much more energy efficient than the wet process, and the semi-wet somewhat more energy efficient than the semi-dry process. The semi-dry process has never played an important role in Indian cement production and accounts for less than 0.2% of total production. In 1960, around 94% of the cement plants in India used wet process kilns. These kilns have been phased out over the past 46 years and at present, 96.3% of the kilns are dry process, 3% are wet, and only 1% are semidry process. Dry process kilns are typically larger, with capacities in India ranging from 300-8,000 tonnes per day or tpd (average of 2,880 tpd). While capacities in semi-dry kilns range from 600-1,200 tpd (average 521 tpd), capacities in wet process kilns range from tpd (average 425 tpd). Over the last decade, increased preference is being given to the energy efficient dry process technology so as to obtain a cost advantage in a competitive market. Moreover, since the initiation of the decontrol process, many manufactures have switched over from the wet technology to the dry technology by making suitable modifications in their plants. Due to new, even more efficient technologies, the wet process is expected to be completely phased out in the near future. Due to the dominant use of carbon intensive fuels such as coal in clinker making, the cement industry has been a major source of carbon dioxide (CO2) emissions. Besides energy consumption, the clinker making process also emits CO2 due to the calcining process. Increased atmospheric concentration of gases such as CO2, methane, and nitrous are believed to be responsible for the rise in global mean land and sea temperatures since the 1850s. The warming occurs because these so-called greenhouse gases, while they are transparent to incoming solar radiation, absorb infrared (heat) radiation from the Earth that would otherwise escape from the atmosphere into space; the greenhouse gases then re-radiate some of this heat back towards the surface of the Earth. India's per capita carbon emission rate was 0.33 tonnes during 2003, which was below the global average of 1.14 and the smallest per capita rate of any country with fossil-fuel CO2 emissions exceeding 35 mt of carbon. Page 7 of 32
24 The global cement industry contributes about 4% to global CO2 emissions, making the cement industry an important sector for CO2-emission mitigation strategies. In India, while CO2 emissions from cement production has increased from 7.32 mt of carbon in 1993 to mt in 2003, its share in total CO2 emissions by India has increased from 3.3% to 4.8%. Emission mitigation options include enhancing energy efficiency; process conversion away from wet- to dry-/semi-dry processes; using blast furnace slag, power station fly ash, natural pozzolana or limestone as a constituent of the final cement thereby reducing the clinker required; shift to low carbon fuels; application of waste fuels; and increased use of additives in cement making. In India, CO2 emissions per tonne of cement production have declined with increased share of blended cements, where energy use and associated emissions are reduced; increased share of dry processes; energy efficiencies; and other emission mitigation measures. Indian cement plants are also beginning to explore the use of alternative and waste fuels, such as lignite, pet coke, tires, rice husks, groundnut shells, etc., to replace the use of coal in cement kilns. Scale of Operations The cement industry has witnessed a significant change in the scale of operations. In 1961, the largest kiln in operation had a capacity of 750 tpd. In 1970, of the total 119 kilns, 1 had over 1,000 tpd capacity, with 55 having under 400 tpd capacity. In 1980, 11 of the total 141 kilns were over the 1000 tpd mark, with 1 kiln having a capacity larger than 3,000 tpd (roughly 1 mtpa). The 1990s saw still higher capacity tpd (or 1.5 mtpa) kilns. The recent practice for a large size plant is to have 6,500-7,000 tpd (or 2.5 mtpa) capacity. As of end-fy2006, there were 7 plants with a capacity exceeding 3 mtpa at a single location, and 71 plants with a capacity exceeding 1 mtpa at a single location. Plants with a capacity exceeding 1 mtpa at a single location had a cumulative installed capacity of mtpa at end-fy2006, accounting for 80.3% of total installed capacity. Distribution of Single-location Plants by Installed Capacity and Production FY2006 Volume Share of (thousand tonnes) total (%) Plant Size by No. of Installed Production No. of Installed Production Installed Capacity plants Capacity plants Capacity >5 mtpa 1 5,300 3, mtpa 24 60,443 59, mtpa 46 60,474 53, <1 mtpa 67 30,928 24, Total , , The average kiln capacity of a dry process technology plant is around 2,880 tpd (0.9-1 mtpa). These large sizes contribute towards reduction in energy consumption, and provide the units with scale benefits. The minimum economic size also appears to have risen because of the rise in investment cost per tonne of cement. This investment cost has risen from Rs. 650 per tonne in the late 1970s to around Rs. 3,500 today. Importance to Economy The cement industry accounts for approximately 1.3% of GDP and employs over 0.14 million people. It is a significant contributor to the revenue collected by both the central and state governments through excise and sales taxes. For example, central excise collections from cement industry aggregated Rs billion in FY2005 and accounted for 4.3% of total excise revenue collected by the government. Cement has consistently figured among the top 5-7 commodities. It is a heavily taxed commodity and the duties amount to around 30% of the selling price of cement. India is the second largest producer of cement in the world. In 2005, India produced 142 mt of cement, accounting for 6.4% of global production of 2.22 billion tonnes. India is the second largest producer-behind China (1,000 mt), but ahead of the US (99 mt) and Japan (66 mt). India's cement industry-both installed capacity and actual production-has grown significantly over the past three decades, with production increasing at an average rate of 8.1% per year between 1981 and Page 8 of 32
25 In recent years, the cement sector has accounted for a declining share of gross bank credit (GBC) of scheduled commercial banks (SCBs), largely because of decline in credit during FY2004. With GBC of Rs billion in March 2005, the cement industry accounted for 1.67% of industry GBC of SCBs in March 2005, as compared with 1.81% in March GBC to Cement Industry As of last Friday of March Compiled by ICRA Duties on Cement Traditionally, cement has been a heavily taxed sector with both the central and the state governments levying the taxes. The major taxes/ levies comprise central excise duty; sales tax levied by the respective state governments; royalty and cess on limestone and coal; and, duties on power tariff. These duties account for around 30% of the sale price of cement or around 70% of the ex-factory price (excluding local transport and dealer margins). Duties on Cement Item Duty Amount Excise Rs. 408 per tonne Royalty on Limestone Rs. 45 per tonne Limestone and Dolomite Mine Workers' Welfare Cess Rs. 1 per tonne Royalty on Lignite Rs. 50 per tonne Royalty on Non-Coking Coal Rs (for CIL depending on grade), Rs. 90 per tonne for Singareni Sales Tax Rates 0-28% The excise duty rates on cement are on specific basis, as against ad valorem rates on most products. These specific rates have risen manifold from Rs. 65 per tonne in 1977 to the current level of Rs. 400 per tonne. The excise revenue collection from the cement Industry has shown an increasing trend over the years. The duties in India (relative to the selling price of cement) are among the highest in the world. DEMAND-SUPPLY POSITION Robust Production Growth India's cement production increased 11.2% during FY2006 to mt. By comparison, production increased 8.6% during FY2005, and 5.5% during FY2004. Production has increased at a 3-year compound annual growth rate (CAGR) of 8.4%. On a decadal basis, India's cement production increased at an annual average of 8.2% during FY , as compared with 6.9% during FY Page 9 of 32
26 India's Cement Production and Growth FY Compiled by ICRA During FY2006, after the slack of the monsoon season, cement production registered high growth since October High growth in the cement sector reflected robust demand from the construction sector and high exports. Monthly Cement Production mt Cement production and consumption has strong co-relation with economic growth and industrial activity. Growth in Cement Production, GDP and Index of Industrial Production (IIP) Page 10 of 32
27 As cement is a basic construction material with virtually no substitute, it is used worldwide for all construction work. Thus, the growth in the construction industry has a direct relation with the production and consumption of cement. GDP from the construction industry has grown at a high rate over the last three years-12.1% during FY2006, 12.5% during FY2005, and 10.9% during FY2004. This has had a positive impact on cement consumption, which increased 10.1% during FY2006, as compared with 8.1% during FY2005. Growth in GDP from Construction and Cement Production The increased growth in cement consumption since 2004 has had a positive impact of the capacity utilisation of cement producers. Capacity utilisation increased from 76% in FY2002 to around 90% in FY2006. Installed Capacity and Capacity Utilisation FY Compiled by ICRA Low but Rising Share of Blended Cement in India In India, about 44% of the cement produced is Ordinary Portland Cement (OPC), 47% is Pozzolana Cement (PPC), 8% is Portland Blast Furnace Slag Cement (PBFS), and the remaining 1% are special cements. Blended cement (PPC and PBFS) has a low but rising share of India's cement production. Energy usage is significantly lower in blended cement because a portion of the clinker is replaced by other materials such as fly ash or blast furnace slag. Blended cements are composite cements produced by blending clinker -which is the output of the kiln- at the grinding stage with pozzolonic or other material with cement like properties. Although compressive strength of the major types of blended cement is equivalent to that of Grade 33 OPC cement; blended cement offers a reduction in the risk of thermal cracking; superior performance under elevated temperature curing conditions; good long-term strength; higher resistance to acids, sulphates and alkali attacks, with more suitability Page 11 of 32
28 for coastal areas; reduced permeability with consequent improvement in durability; smoother finishing, etc. In India, the share of blended cement in the total production had increased from 47% in to 76% in After this, the Indian cement industry witnessed a higher production of the higher grade OPC, and the production of blended cement gradually declined to 27% in However, this was followed by an upward trend, and the share of blended cement reached approximately 56% in Domestic Production of Cement % of total There are several reasons behind the historically low share in consumption of blended cement in India: As the compressive strength of the blended cements is comparable to the 33-grade OPC, which is the lowest grade, the market perceives the blended cements as relatively lower-strength varieties. The cement consumer is not confident of the quality of the blended material used for manufacturing blended cements. The darker colour of blended cements and the colour variations in them are mistakenly attributed to impurity. For example, PPC is generally of darker colour as compared with OPC because of the carbon present in flyash. Consumers are yet to realise the advantages of using blended cements in certain locations, like aggressive soils. Further, there is a wrong impression in the market that addition of blended material degrades the properties of blended cements. These perceptions on blended cement are gradually phasing out with consequent increase in consumption share of blended cement. In fact there are certain regions in India, such as Punjab, Himachal Pradesh, Jharkhand, Uttar Pradesh, West Bengal, Chattisgarh, Tamil Nadu, Kerala, Bihar, Orissa, Madhya Pradesh, and West Bengal, where blended cement is more popular and hence, more than 50% (more than 80% in some cases) of the cement produced in these states is of the blended variety. Given the strong benefits associated with the use of blended cement, the industry can initiate corrective action for enhancing its consumption. Some of the likely ways in which this can be done are as follows: Improving the quality of the additive. For example, the quality of a pozzolonic material like flyash can be improved by processing it, so that its fineness and chemical composition can be assured. Increasing customer awareness by organising training programmes. The Government can also play a role by taking strategic initiatives like increasing the concession on excise duty on blended cements, or providing sales tax exemption benefits to producers of blended cement. Key benefits accruing to the country from this move would include greater pollution control (because of the effective use of waste material like slag) and preservation of the valuable limestone reserve of the country. Besides, it would also help in improving the construction quality in the country. Page 12 of 32
29 Regional Production Patterns The Indian cement industry is comprised of 129 large cement plants and 300 mini-cement plants, with installed capacities of mtpa and mtpa, respectively at end-fy2005. Since cement is a high bulk and low value commodity, the growth of the cement industry has been around the limestone deposits. Proximity to limestone deposits contributes considerably to pushing down the costs of transportation of heavy limestone. If units are located close to limestone resources, trucks can be used to move limestone instead of railways. The proximity of coal deposits constitutes another important factor in cement manufacturing. Nearly 68% of the coal required by the cement industry during FY2005 was transported by rail; the balance 32% was moved by road. There are at present seven clusters-satna (Madhya Pradesh), Chandrapur (North Andhra Pradesh and Maharashtra), Gulbarga (North Karnataka and East AP), Chanderia (South Rajasthan + Jawad & Neemuch in MP), Bilaspur (Chattisgarh), Yerraguntla (South AP), and Nalgonda (Central AP)-with a total capacity of mtpa at end-march 2005, accounting for 48.4% of the total installed capacity. Cluster-wise Cement Capacity and Production in FY2005 mt AP is the largest cement producing state with an installed capacity of 24.9 mt. Cement production during FY2006 was 19.9 mt. Other major cement producing states include Rajasthan, Madhya Pradesh, and Gujarat. Major Cement Producing States % of total In terms of regional concentration, the Southern region accounts for 32% of installed capacity, followed by Western region. MP is traditionally considered a part of the Western region although as much as 65% of cement output from this state serves the Northern and Eastern regions. Page 13 of 32
30 Regional Distribution of Capacity and Production Million tonnes Share of total FY Capacity North East South West Central Production North East South West Central Major Players As discussed, ACC is the largest player with a capacity of mtpa at end-march UltraTech CemCo Ltd. now occupies the second slot with a capacity of 17 mtpa (which includes 1.5 mtpa of subsidiary Narmada Cement). The Gujarat Ambuja group has emerged as the third largest player with a capacity of mtpa. Grasim ranks fourth with a capacity of mtpa. Other leading players include India Cements, Jaypee group, Century Textiles, Madras Cements, Lafarge, and Birla Corp. Major Players in Indian Cement Industry Thousand tonnes FY2005 FY2006 Installed Capacity Production Installed Capacity Production ACC 18,228 16,606 18,640 17,902 Gujarat Ambuja 14,570 14,467 14,860 15,094 Ultratech 17,000 12,921 17,000 13,707 Grasim 14,115 13,143 14,115 14,649 India Cements 8,810 6,506 8,810 8,434 JK Group 6,415 5,769 6,680 6,174 Jaypee Group 5,600 5,429 6,531 6,316 Century Textiles 5,900 6,070 6,300 6,636 Madras Cements 5,470 3,663 5,470 4,550 Birla Corp. 4,780 5,017 5,113 5,150 Lafarge 5,000 4,391 5,000 4,573 Others 45,456 33,589 48,627 38,620 Total 151, , , ,805 Locational Issues Cement being a high bulk and low value commodity, outward freight accounts for close to one fifth of the total manufacturing cost. In addition, for every tonne of cement produced, close to 1.7 tonnes of raw material (including coal) is transported. In this scenario, the location of the cement plant becomes crucial. While deciding on the plant location, there is a trade-off between proximity to raw material sources and proximity to markets. A split-location cement plant can be a good compromise between the two options. The plant also has to address issues of logistics (evacuation of cement by rail, road or waterways), power availability in the region, and availability of materials (limestone, coal, slag, etc). Page 14 of 32
31 The bulk of the cement manufactured is consumed near urban centres. In the manufacture of cement, for every 1 tonne of clinker, about tonnes of limestone and coal need to be assembled. For OPC, another 50 kg of gypsum is required while grinding the clinker down. For PPC, up to another 250 kg of pozzolonic material such as fly ash requires to be assembled. Thus, there can be two broad locational strategies, stemming from the principal objective, which is not merely to minimise unit-manufacturing cost, but to minimise unit delivered cost as well. The first strategy is to locate manufacturing facilities near the consuming centres. In this case, outward freight is minimised and marketing flexibility enhanced at the cost of higher raw material assembly costs. The second strategy is to locate the plant close to the mineral deposits, so as to minimise raw material assembly costs. Given that tonnes of limestone are required per tonne of clinker, locating the plant along the limestone deposits is the logical corollary. Occasionally, as in areas like Satna, Rewa, and Raipur, the coal pitheads are also quite close by. As long as retention prices were the norm, outward freight was of no concern to cement companies. All the cement plants thus naturally gravitated to one of the several large limestone bearing areas in the country. With the introduction of partial, and later full, decontrol, outward freight has become a critical issue in determining a company's profitability. However, if the list of new plants which have come up since 1982 as well as those under implementation today, is examine, it may be observed that barring some, all companies continue to opt for the limestone-deposit bias in locating new capacity. However, a hybrid strategy exists. The clinker to cement ratio is virtually 1:1 for OPC, with the addition of gypsum being only 5%. For PPC, with fly ash addition, the clinker to cement ratio is 0.8:1. Split location plants thus become a distinct possibility, with the clinker manufacture near limestone deposits and grinding and bagging facilities near the consuming centres. The advantages of this split location strategy derive from the ease of transporting clinker in open-to-sky condition (rather than bagged cement under protective cover), lower handling losses in transit and ease of storage of clinker (as opposed to cement at the market centred grinding mills). This is especially true for PPC/PBFS, since fly ash/slag is available from the thermal power stations/steel plants, which are located in, and around the country's urban centres. Flyash disposal by power utilities has become a contentious environmental issue. Similarly, steel producers face problems in disposing slag. Therefore, utilisation of these materials in this manner can improve the cement company's profitability while benefiting the environment. By locating such grinding units close to the markets, the distribution costs are reduced to a great extent. If the grinding unit is near a port with a steel mill or power plant near by, this becomes an ideal situation for targeting the export markets. Such possibilities exist near Mangalore, Vizag and Cochin, where the clinker can also be moved economically by coastal shipping from plants located in North-western India. However, this strategy will be limited somewhat by the extent in which PPC is accepted in the market. Over the last decade, the share of PPC/PBFS has increased significantly from 28.3% in FY1995 to 55.6% in FY2005. High Growth in Domestic Cement Consumption India's cement consumption increased 10.1% during FY2006 to mt. By comparison, consumption 8.1% during FY2005, and 5.8% during FY2004. Production has increased at a 3-year compound annual growth rate (CAGR) of 8%. India's Cement Consumption and Growth FY Compiled by ICRA Page 15 of 32
32 On a decadal basis, India's cement consumption has increased at a 10-year CAGR of 8.2% during FY Demand has largely been driven by a shift in housing construction preferences to concrete and the rapidly rising population. The healthy growth beginning in FY2005 is also due to increased demand from National Highway Development Projects (NHDP). In India, the percentage of pucca houses in urban areas increased from 73% in 1991 to 75% in 2001, whereas the percentage of semi-pucca and kutcha houses in the urban areas has declined. The percentage of pucca houses in rural areas increased from 31% in 1991 to 35% in This implies that use of permanent building materials for the construction of walls and roofs is becoming more popular in rural areas also. Data from the 58th Round of Survey by National Sample Survey Organisation (NSSO) indicates that the percentage of pucca dwellings in urban areas increased from 74% in 1993 to around 77% in Over the same period, the percentage of pucca dwellings in rural areas increased from 32% to 36%. Housing Stock in India Million units Units % of total Units % of total Units % of total Urban Pucca Semi-Pucca Kutcha Rural Pucca Semi-Pucca Kutcha Total Pucca Semi-Pucca Kutcha Housing completions in urban areas in each decade has shown an increasing trend from million in to million in Similarly, housing completions in rural areas has also increased from million to million. Apart from increased preference for pucca constructions, housing size has also increased in urban areas. Overall, while the share of 1-room houses has declined from 45% in 1981 to 39% in 2001, the share of 3-or more rooms has increased from 27% to 32%. In India, cement consumption and sales follows a seasonal pattern with lean sales during the monsoon season (July-September) and higher sales during October-March. 2 Built of pucca materials comprising cement, concrete, oven-burnt bricks, hollow cement/ash bricks, stone, stone blocks, jack boards (cement-plastered reeds), iron, zinc or other metal sheets, timber, tiles, slate, corrugated iron, asbestos cement sheet, veneer, plywood, artificial wood of synthetic material and PVC. Page 16 of 32
33 Monthly Cement Consumption mt In terms of regional consumption, the Southern region accounted for 29% of the total consumption of approximately mt during FY2006, followed by Northern and Western regions. Although, there has been an year to year variation in the region-wise consumption growth rates, the relative shares of each region has more or less remain stable across the past few years. Regional Distribution of Cement Consumption Million tonnes Share of total FY North East South West Central Total Regional disparity has been witnessed in the consumption growth. During FY2006, the Southern region witnessed the strongest consumption growth, driven by higher construction activities from both Government and private sector projects. By comparison, while consumption in Western region increased 5.4% during FY2006, consumption in Central region increased only 0.8%. The major consumption states for cement in India include Maharashtra (16.8 mt in FY2006), UP (14.2 mt), Andhra Pradesh (11.5 mt), and Tamil Nadu (11.1 mt). Over the last three years, consumption growth has outpaced the national average in Andhra Pradesh, Haryana, Rajasthan, and Karnataka. Major Cement Consuming States-FY2006 % of total Page 17 of 32
34 End-User Profile The profile of the end-user for cement has changed over the years. Till the early 1980s, the Government used to be the biggest final user, which is no longer the case. According to industry sources, till the early 1980s, the government departments and agencies accounted for over 50% of the total domestic consumption. However, with the lifting of controls and with the initiation of the privatisation programme, the private sectors' share in the total cement consumption has gone up and today, Government demand accounts for just around one fifth of the total domestic demand. Government demand declined during the last few years, following reduced spending on public works. Housing accounts for the largest share (over 55%) of the total cement consumption in India. This is largely due to the various financial sops given to this sector in the successive Union Budgets. The Housing sector is followed by Infrastructure sector (25%) and Commercial Projects (20%). Exports The Indian cement industry exported around 6 mt of cement during FY2006, accounting for around 4% of the total production. There has been a significant year on year variation in the export trend, implying that Companies rely on cement exports to balance out the domestic demand supply situation. Because of increased overseas demand, cement exports increased from 4.07 mt in FY2005 to 6.01 mt during FY2006. However, increased domestic demand resulted in clinker exports declining from 5.99 mt to 3.18 mt. India's Cement Exports FY Compiled by ICRA As cement is a low value, high bulk commodity, freight cost becomes a significant factor in determining the landed cost of cement. This has resulted in a very low volume of international trade in cement. World cement trade has averaged just around 6-7% of the total production. Although, world trade in cement is limited because of high freight costs, there are countries, which either import a significant share of their total consumption or export a major share of their total production. Countries, which import a significant share of their consumption, appear to be falling in the developing world category, where the public expenditure on infrastructure projects is very high. The Middle East countries (although not falling in the developing world category) have huge requirements of cement because of construction work in projects in the oil sector. Also in these countries, unfavourable conditions (for example, inadequate cement limestone reserves) have discouraged cement capacity creation. Countries, which export a large share of their domestic production, appear to be having one thing in common. Countries with high export thrust opt for bulk transportation for exporting cement. For example, by opting for bulk transportation, Greece is in a position to export over 50% of its cement production. Bulk transportation leads to significant advantages such as savings in freight costs and packing costs, avoidance of transit loss, adulteration, pilferage, bursting of bags and damage to cement. Page 18 of 32
35 At the ex-factory level, Indian cement is quite competitive with many global cement producing regions. However, a plethora of duties along with infrastructure bottleneck reduces this competitiveness. As cement is primarily a regional commodity, international competitiveness is not really a serious issue. However, in times of oversupply in the domestic market, being competitive ensures access to the export market. The export performance of Indian Cement industry has been healthy in recent years and has witnessed growth at a CAGR of 20.1% during FY During FY2006, cement exports were higher by 47.7%. There has been a significant year on year variation in the export trend, implying that companies rely on cement exports to balance out the domestic demand supply situation. Because of freight costs, India is in a position to export cement through sea routes to countries in Indian subcontinent, South East Asia, Middle East, countries on the East coast of African continent including South Africa, Madagascar, and also Mauritius and other islands of the Indian Ocean. India can export to the neighbouring and land-locked countries such as Pakistan, Nepal and Bangladesh through rail as well as road routes. An additional route for exports to Bangladesh is the Inland Waterways on the river Brahmaputra. Major Destinations for India's Cement Exports-FY2005 Demand-Supply Position Overview The cement industry has been in a surplus position since a long time. This has resulted in increased exports over the last few years. Although there exists a surplus of cement in the country, the surplus has declined from 0.42 mt in FY2005 to 0.23 mt during FY2006, mainly because of higher growth in consumption. This has resulted in capacity utilisation increasing from 84% in FY2005 to 90% in FY2006. India's annual per capita cement production of 0.13 tonnes in FY2006 is significantly below the world average of 0.3 tonnes and China's production of 0.76 tonnes during It has been observed that cement consumption increases along with the rise in per capita income in developing countries. Thereafter, once all the major developmental projects are in place and the country has a per capita income comparable with that of the developed nations, the demand for cement stagnates/declines. Accordingly, the per capita cement consumption also stagnates/declines. Growth in population density is a minor (but steady) driver of demand growth for cement in all countries. Cement consumption has a strong co-relation with GDP growth. High GDP growth leads to high cement consumption. The reverse is true when GDP growth declines. The cement intensity of GDP (i.e. rate of growth of cement consumption relative to GDP growth) is different for different countries. For a under-developed country, the cement intensity of GDP is very low. It rises with the progress in economic development, reaches a peak level, and then starts declining once all the developmental projects are in place and the country has achieved a very high level of economic growth. While the Indian cement industry is in a surplus position since a long time, the surplus position is gradually declining. While limited greenfield capacity is envisaged in the near to medium term, it is very easy to increase capacity through either brownfield projects or by resorting to manufacturing blended cements. As per present expansion plans, an additional 6.6 mtpa of capacity is expected to be operational in FY2007. Considering an expected production and consumption growth of 10% during FY2007, the demand supply position of the Indian cement industry is expected to improve. Page 19 of 32
36 Regional Position There exist regional surplus/shortages in the Indian cement industry. The following table details the region-wise production and consumption of cement. Regional Capacity, Production, and Consumption of Cement mt FY2006 FY2005 Capacity Production Consn. Supply Capacity Production Consn. Supply Surplus Surplus North East South West Central Total As can be seen from the above table, South India leads in both cement production and consumption. While demand in the eastern region is primarily driven by the housing sector; infrastructure, investments in industrial projects and the housing sector (in varying proportions) have propelled demand in the western, northern and southern regions. The oversupply is largely in the Southern and Northern regions. By contrast, there is a supply shortage in Eastern and Western regions. There is significant inter-regional movement of cement, which plays a crucial role in the regional demand-supply dynamics. Most of the cement movement across regions takes place from North to Central (3.35 mt during FY2005), South to West (5.20 mt), Central to North (2.45 mt), and Central to East (2.51 mt). Regional Production minus domestic consumption mt PRICES The regional variations in the Indian market has resulted in the cement prices across regions witnessing movement within a band, with no appreciable increase in any region. Differences in regional demand supply situation has translated into price differences across regions. Page 20 of 32
37 Regional Cement Prices Rs. Per 50 kg bag Prices are lower in Southern regions where there is normally a supply surplus. However, prices are higher in Eastern and Western regions where shortages exist. The surplus position had resulted in significant pressure on price realisations in recent years. The cyclical trough in the late-1990s had a severe impact on the industry financials and many companies were referred to BIFR. However, cement prices have firmed up during the last few years due to improvement in demand-supply position and increasing consolidation in the industry. The Wholesale Price Index (WPI) for cement increased 3.9% during FY2005, as compared with a growth of 1.2% during FY2004. The WPI for March 2006 was 11% higher than the WPI for March WPI for Cement =100 ICRA's demand supply projection shows that the industry is likely to remain in a Surplus situation in the near to medium term. However, the extent of surplus is likely to decline. This coupled with the increasing consolidation in the sector suggests stabilisation of prices in a higher band. On the negative side, the cement companies are expected to continue facing the problem of rising manufacturing costs, as they do not have control on the external cost elements, such as energy and freight. Accordingly, while the earnings of the cement industry on an aggregate may improve, there may be select players in the industry who may show a relatively higher growth in earnings. This would include players, who increasingly focus on enhancing operating efficiency, have high economies of scale, are not dependent on few regional markets, have good distribution logistics and possess a good brand name. Page 21 of 32
38 RAW MATERIALS Cement is usually used in mortar or concrete. Here it is mixed with inert material (called aggregate), like sand and coarse rock. Portland cement consists of compounds of lime mixed with oxides like silica, alumina and iron oxide. There are three major raw materials for cement: Limestone Limestone is the main raw material and is the source of calcium carbonate. Calcium carbonate is burnt to obtain calcium oxide (CaO). The other sources of calcium carbonate are marl, chalk, seashell and coral reef. Limestone is the most abundant source of CaO. The other user industries for limestone are iron & steel, fertilizer and chemicals. Cement is the biggest limestone user in India accounting for over 75-80% of limestone produced in India. The composition of limestone used by the various sectors varies. For cement, the CaO content of limestone should be a minimum of 44%. Typically, tonnes of limestone are required per tonne of clinker. Thus, for a 1 million tonne cement plant, assured availability of cement grade limestone reserves of the order of mt in the close vicinity is important. Gypsum Gypsum is used as a retarding agent. Ground clinker, on contact with water, tends to set instantaneously because of the very fast reaction between tri-calcium alluminate and water. In the presence of gypsum, the desired setting time can be achieved. Gypsum is added to the extent of 5% during the clinker grinding stage. Gypsum is naturally available in abundance in Rajasthan, Gujarat and Tamilnadu. Granulated Blast Furnace Slag (GBFS) The other raw materials that are also used in the manufacture of cement are blast furnace slag (a waste product obtained from iron-smelting furnaces) and flyash (leftover ash from a thermal power station). Limestone contains about 52% of lime and about 80% of this lime is lost during ignition of the raw materials. Similarly, Clay contributes about 57% silica of which about 25% is lost during ignition. GBFS is obtained by granulation of slag obtained as a by-product during the manufacture of steel. It is a complex calcium aluminum silicate and has latent hydraulic properties. That is why it is used in the manufacture of portland blast furnace slag cement. Maintenance And Stores Requirements The two important items of stores and spares in the case of cement manufacture are refractory material and grinding media. For grinding media, high chrome grinding balls are normally used. In the case of refractory materials, companies go in for two kinds of refractory bricks-high alumina and high chrome. Typically, the life of the refractory material is 6-8 months (with the indigenously made high-alumina bricks), after which the kiln has to be stopped and the affected sections relined, a process, which takes 3-4 days. Kiln relining is normally made to coincide with the normal planned shutdown. Some companies are also experimenting with imported high-chrome bricks, which provide for a longer uninterrupted operational life of months. In practice, this can extend the availability of calendar hours and thereby enhance the actual capacity of the plant. ENERGY AND TRANSPORT REQUIREMENTS The cement industry is dependent on three major infrastructural sectors of the economy: coal, power and transport. The inputs from these three sectors account for roughly 50% of the cost of cement. Both the availability and the cost of these inputs have a vital bearing on the fortunes of the cement players. All these sectors are largely in the State sector, and, historically cement companies have had virtually no control on the cost or availability of these inputs. Hence, the industry response has largely been in the form of achieving efficiency gains and finding alternatives (captive power, use of waterways). One additional external influencer of the cement industry performance is the taxes and levies imposed by the Central and State Governments. These together account for around 30% of the selling price of cement in the Indian context. Page 22 of 32
39 Coal Coal is an important input in cement manufacture and accounts for 15-20% of the total cost. Coal serves a dual role in cement manufacture. Firstly, the heat value in coal provides the thermal energy required for the operation of the kiln. Secondly, the mineral content in coal (basically, silica content) acts as a constituent in clinker. For every tonne of clinker, around kg of coal is consumed. Coal consumption by cement plants has increased from 19 mt in FY2000 to around 33 mt in FY2005. Cement accounts for around 4.5% of India's coal demand. Consumption of coal for production of cement has not increased proportionately with cement production because of the switch to the dry process, efficiency improvements in cement kilns and the increased use of fly ash produced in power plants and granulated slag produced in blast furnaces of steel plants in the production of cement. In India, overall coal distribution was statutorily governed by the Colliery Control Order of Subsequently, this order has been amended and the new Colliery Control Order 2000 has been notified according to which the price and distribution of all grades of coal have been deregulated with effect from To ensure smooth and co-ordinated supplies of coal to all consumers, the Government and the coal companies have adopted a system of linking of supply sources with consuming units and their requirement. All consumers are broadly classified into two different categories viz. core sector and non-core sector. Cement comes under the core sector. Each consumer is given a linkage (allocation) of quantity on an appropriate field. The linkages to cement plants and power utilities are decided by the Standing Linkage Committee (SLC). Key members of the SLC include representatives from the Ministry of Coal, the Ministry of Railways, the Ministry of Power/Industry, the Planning Commission, the coal companies and the Central Fuel Research Institute (CFRI). The quantity, and the coalfields from where the coal is to be supplied to a particular cement plant, is decided by the SLC even before the cement plant is commissioned. The actual movement programme is, however, drawn up by the SLC every quarter indicating the quantities to be moved, the mode of transport and the coal Fields/ coal company with which the cement company is to be linked. To meet the requirement of Indian consumers, there are seven grades of coal available from Indian collieries. The classification is done based on the Useful Heat Value content of coal, as mentioned below: Classification of Indian Coal Grade Useful Heat Value (Kcal/kg) A Over 6200 B C D E F G Cement plants are allocated grades D, E and F. Given that the bulk of the output is in these grades, most users, including the power sector, consume the same low grade coal. Grades notwithstanding, the quality of Indian coal is quite poor, and has deteriorated over the years. In addition to the deteriorating quality of Indian coal, coal prices have also increased in recent years. These rises in the price of domestic coal grades along with the rise in rail and road tariffs are expected to force the Indian cement industry to look at alternative sources of coal/energy in the future. The shortage in domestic coal production coupled with the poor quality has resulted in cement companies resorting to importing coal, or going in for open market purchase of coal, or using alternative fuel such as lignite or petcoke. Use of imported coal has become an essential feature of the Indian cement industry and has shown a rising trend during the last few years. Page 23 of 32
40 Estimated Demand for Coal by Indian Cement Industry Mt Power Cement is a power intensive industry requiring on an average units of power per tonne of cement produced. Significantly power accounts for 15-20% of the variable cost of cement manufacturing. Cement manufacturing consumes power mainly for three purposes: raw meal grinding, kiln rotation and clinker grinding. Each stage accounts for roughly one third of the total power consumption. A dry process plant typically has an average connected load of 15 MW. Based on the present installed capacity of 157 mtpa of cement, the total industry requirement is roughly 2300 MW. This is just around 2% of India's total current power generating capacity. Over the years, the cement industry has consistently suffered from power cuts. In fact, availability and quality of power have always been crucial issues for cement companies. Further, price increases by State Electricity Boards (SEBs) have meant that even their poor quality power comes at a high cost. Rising power tariffs have reduced the diseconomies associated with self-generation through Diesel Generating (DG) sets. Accordingly, to insulate themselves from power cuts, cement units had initially installed captive DG sets as a standby. However, with the increase in the frequency of power cuts and rising power tariffs, many cement companies are meeting % of their power requirement through captive facilities. The captive power generation capacity of cement plants is presently estimated at around 1,800 MW. During FY2005, roughly 43% of the total domestic cement production was undertaken using captive power as against only 21% in FY1995. Thus, the share of cement production using captive power has only increased over the years. Captive Power Generation by Cement Plants and Share of Captive Generation to Total Requirement by Cement Plants FY Page 24 of 32
41 Of the total captive generation capacity, DG sets account for around 65% while the balance 35% is accounted for by thermal power plants. There is increasing focus on setting up thermal power plants as against DG sets since operating costs for the latter are lower. The industry initially opted for DG sets, which typically have smaller capacity (4-6 MW against MW for thermal sets). This was because of the smaller size of the earlier plants, and moreover the DG sets were meant for backup purposes only. Transportation Outward freight on cement is an important element in the operating cost of a cement plant. It accounts for around one third of the total variable costs. Most of the cement plants in India are located in and around the limestone clusters. These clusters are distant from the collieries and the markets for cement. Cement has an average lead of around 535 km. Thus, cement companies have to rely on extensive transportation for moving coal from the coal pitheads to the cement plants and for despatching cement from the plant to the markets. As both coal and cement are of low value and bulky in nature, freight costs are considerably high for cement plants. Cement companies use both road and rail transport to transport cement and to receive coal. Rail despatches amount for about 33% while roads carry the balance 66%. The balance 1% is accounted by Sea transporation. The share of road over rail has only gone up over the years. For coal transportation, the dependence on rail network is still very high and accounts for around 70% of coal movement. Cement Despatches by Rail, Road and Sea Mt Although rail transportation is more economical for distances beyond km, cement companies have started preferring road transportation even for longer distances because of several reasons. Rising railway traffic coupled with insufficient investments by the railways for increased wagon supplies and the fact that the cement industry is not an important customer of the Railways (cement cargo accounts for just 7-8% of the total railway freight) have resulted in a shortage of wagon supply to the cement industry. The railways had launched the "Own Your Wagon" scheme-a scheme where companies could buy wagons and lease it to the Railways and the Railways would in turn operate these wagons and ensure their availability to the owner. But the unfavourable terms and conditions of this scheme prevented its successful commercialisation. The The Railways have also increased their tariff on a regular basis (often higher than the increases in the road sector), making them uneconomical vis-à-vis road tariffs even for longer distances. NEW/EXPANSION PROJECTS During FY2007, ACC plans to expand capacity at its Rajasthan plant from 0.6 mtpa to 1.6 mtpa at a cost of Rs. 4 billion. It is also expected to invest in expansion of grinding capacities at various plants. With these brownfield expansions, the company's installed capacity is expected to increase by around 2 mtpa in FY2007. Grasim Industries is planning to expand capacity by 8 mtpa in both greenfield and brownfield projects in Rajasthan at an estimated cost of Rs billion. Page 25 of 32
42 Madras Cements is planning to set up a 2 mtpa greenfield unit in TN at a cost of Rs billion, and an additional clinker facility at its existing plant in AP at a cost of Rs billion. The clinker facility is expected to result in increase in cement production capacity at its AP unit from 1.6 mtpa to 3.6 mtpa. The new unit and the clinker facility are expected to be operational during Q4FY2008 and Q2FY2008, respectively. India Cements plans to set up a 2 mtpa plant in HP at a cost of Rs. 7.5 billion. The plant is expected to be operational in India Cement is also expanding capacity at its existing plants by 2 mtpa. Shree Cement plans to set up a new 1.5 mtpa plant at Rajasthan at an approximate cost of Rs. 4 billion. The plant is expected to be operational by FY2008. OCL India plans to increase its capacity by 2.4 mtpa at its existing plant in Orissa at an investment of Rs. 7 billion. The project is expected to be commissioned by September Gujarat Ambuja group company-ambuja Cement Eastern-is expanding capacity at its clinker unit in Sankrail, West Bengal at an investment of Rs. 8 billion. It is also setting up a greenfield plant in West Bengal. Post-completion by end-fy2007, the company's installed capacity is expected to increase from 2 mtpa to 3 mtpa. Heidelberg Cement plans to expand its capacity to 5-10 mtpa over the next three years. Lafarge is planning to expand capacity by 2 mtpa at its Sonadih plant in Chattisgarh. Binani Cement plans to increase capacity by 2 mtpa at its cement plant in Sirohi, Rajasthan. The Jaypee group plans to invest Rs. 30 billion by 2007 to increase capacity from 6.5 mtpa to 15 mtpa. FINANCIAL PERFORMANCE Cost Structure The cement industry is one of the most energy-intensive sector within the Indian economy. Clinker production is the most energy intensive step, accounting for nearly 75% of the energy used in cement production. In India, an estimated 90-94% of the thermal energy requirement in cement manufacturing is met by coal. The remaining is met by fuel oil and high-speed diesel oil. For each kg. of clinker, the cement industry on an average requires 800 K. Cal of coal for dry process and 1350 K. Cal. of coal for wet process. Over the years, there has been deterioration in the quality of coal. In particular, the ash content has increased implying lower calorific values for coal, and improper and inefficient burning, etc. Coal consumption thus increased resulting in higher fuel and transportation costs. In order to reduce these problems, the cement industry started implementing coal washeries which reduce the ash content of the coal at the mine itself. Generally, the cement industry in India on an average requires units of power in the wet process, and units of power in the dry process to produce one tonne of cement. The energy costs and cement freight costs are the two most important elements in the cost structure of a cement company. While, the share of energy costs has increased marginally, freight cost has experienced a decline in its share of total operating costs. The share of other costs (such as stores & spares, manufacturing overheads, and administrative expenses) have declined. The share of costs on account of material, repair and maintenance, employees and selling expenses have more or less remained stable. Cost Structure % of Cost of Sales FY Raw Material Cost Power & Fuel Employee Costs Other Manufacturing Outward Freight Other Operating Costs Page 26 of 32
43 The average energy costs for cement companies have increased from Rs. 482/tonne (of cement production) in FY1994 to Rs. 637/tonne in FY1998. This represents a CAGR of 7.3%. The costs increased despite successful efforts by the companies to reduce specific energy consumption in cement manufacture. Since then, the average energy cost per tonne have however declined from Rs. 590 in FY2000 to Rs. 568 in FY2005. Cost control measures such as: increased reliance on imported coal; greater stress on producing cement through captive power; and focus on reducing power consumption have resulted in this development. Major Costs per tonne of Production Rs. per tonne However, inspite of energy efficiencies, energy costs have increased during FY2005 mainly because of significant rise in costs of coal and liquid fuels. Raw material costs have also increased because of increase in royalty on limestone from Rs. 40 per tonne to Rs. 45 per tonne from October 14, Volume Growth and Capacity Utilisation The cumulative cement production of the large cement plants in India increased 11.2% during FY2006 to mt, as compared with a growth of 8.6% during FY2005. Despatches also increased 11.4% during FY2006 to mt, as compared with a growth of 8.5% during FY2005, and 5.5% during FY2002. After a 0.6% decline in production during FY2001, the cement industry has now enjoyed five years of moderate to healthy growth, with growth accelerating during FY The healthy increase in cement production and despatches during FY was on account of an increase in domestic consumption (on account of buoyant economic growth, and increased spending on construction projects). Exports have also witnessed high growth during FY In response to the healthy growth in consumption during the last few years, the capacity utilisation of Indian cement industry has also increased from 81.4% during FY2004 to 84.3% during FY2005, and 90.2% during FY2006. Although all regions have reported improved capacity utilisation, capacity utilisation in the Northern region exceeded 100% during FY2006. Region-wise Capacity Utilisation Rs. per tonne Page 27 of 32
44 Margins Cement prices have firmed up during the last few years due to improvement in demand-supply position and increasing consolidation in the industry. The trend in gross sales realisation is similar for the cement companies in our sample (comprising pure cement companies accounting for around two-thirds of industry production and sales). The operating profits and margins for cement companies are most sensitive to cement sales realisations. During FY , riding on high average sales realisations, the cement companies posted increased operating profits and margins. This reversed the decline in operating profits and margins during FY This was mainly because of excess capacity and the consequent low price realisations. While sales volume of the sample companies improved 7%, operating income (OI) increased 24.2% to Rs billion. Growth in Sales Volume and Value % Although operating costs increased 21.5% during FY2005, the higher increase in sales value resulted in an improvement in operating margins from 14.3% during FY2004 to 16.1% during FY2005. Operating profits per tonne of sales increased from Rs. 249 in FY2003 to Rs. 275 in FY2004 and to Rs. 361 in FY2005. Although debt levels increased during FY2005, interest costs declined in FY2005 mainly because of lower interest rates. The significant decline in interest costs (as % of OI) resulted in a significant increase in net margins from 2.8% during FY2004 to 6.9% during FY2005. Net profit per tonne of sales improved from Rs. 49 in FY2003 to Rs. 54 in FY2004, and to Rs. 155 in FY2005. Significantly, all the companies in the sample (except GACL) reported improved net profits per tonne/lower net losses per tonne during FY2001. By contrast, only five (out of 15) reported increased profits per tonne/lower net losses per tonne during FY2000. Operating and Net Margins % Page 28 of 32
45 Returns The fluctuating fortunes of the Indian cement industry are very typical of a commodity industry. The companies make bumper returns during the boom years (FY , and FY ) while the performance goes down drastically during the lean years (FY ). The returns have improved significantly since FY2003 because of higher capacity utilisations, operational efficiency and cost control measures supplemented with higher sales realisations. Return on Capital Employed (ROCE) and Return on Net Worth (RONW) % Financial Performance during FY2006 During 12MFY2006 (April 2005-March 2006), the cement companies reported higher revenues and improved their profitability. However, the smaller companies were not able to improve their topline and wilted under pressure of higher expenses reporting net losses. Sales of ICRA's sample of 23 listed cement companies increased 23.8% (yoy) to Rs billion during 12MFY2006. An increase in energy costs on account of higher fuel prices was more than offset by higher increase in prices. As a result, operating profits increased 46.3% (yoy). Operating margins increased from 16.1% during 12MFY2005 to 19% during 12MFY2006. Lower interest and depreciation costs resulted in a 83.9% (yoy) increase in net profits. Net margins improved significantly from 7.3% during 12MFY2005 to 10.8% during 12MFY2006. Financial Performance of Indian Cement Industry-12MFY2006 Rs. Million, except percentages Rs. Million Change (%) % of OI 12 months ended March Net Sales/OI 217, , Raw Material Cost 33,153 28, Employee Costs 10,850 9, Power & Fuel Costs 54,905 49, Other Operating Costs 77,540 60, Cost of Sales 176, , OPBDIT 41,406 28, Interest 7,755 8, Depreciation 12,245 11, OPBT 21,406 8, Other Income 8,630 6, PBT 30,036 14, Tax 6,517 1, PAT 23,519 12, Page 29 of 32
46 Healthy demand growth during FY2007, and sustained price growth is expected to have a positive impact on revenues, profits, and margins during FY2007. However, the location of the plant and the trend in its operating costs would be the other determinants of the actual profitability. Trends in Gross Sales and Operating Margins for Indian Cement Industry OUTLOOK The cement sector is expected to witness strong production and consumption growth of 10% during FY2007 in line with the economic growth because of the strong co-relation with GDP and the increased activity in the construction sector. Future drivers of cement demand growth in India would be increased spending on road and housing projects. The Union Budget for FY2007 has provided further thrust to the infrastructure sector through several initiatives, such as: Budget support on the National Highways Development Programme (NHDP) increased from Rs billion in to Rs billion in The NHDP envisages an investment of Rs. 2,200 billion on concessions/contracts to be awarded by 2012; Special accelerated road development programme for the North Eastern region at an estimated cost of Rs billion has been approved. The Government has also decided to develop 1,000 kms of accesscontrolled Expressways. 'Bharat Nirman' to focus on 6 components of rural infrastructure including irrigation, roads, water supply, housing, rural electrification and rural telecom connectivity. Outlay on `Bharat Nirman' increased from Rs billion to Rs billion. Increase in outlay from Rs. 45 billion to Rs billion with the objective of improving the pace of implementation of irrigation projects. The housing sector, which accounts for around 55-60% of total demand, is likely to continue to be the driving force behind cement demand. It is estimated that requirement of new dwelling units over a period of 25 years ( to ) will be around 140 million units requiring an investment of approximately Rs. 20,000 billion. Besides, demand from infrastructure projects and industrial/commercial ventures account for 20% each. Even as NHDP-I (comprising the Golden Quadrilateral or GQ and North-East-South-West or NESW) near completion (GQ by end-2006, and NESW by 2009), demand in the port and airport segments may pick up, keeping demand buoyant. Further, NDHP-III to NHDP-VII ( ) envisages construction of another 36,000 kms of roads at an estimated cost of Rs. 1,270 billion. Overall, from the demand perspective, the fundamentals look bright, and cement demand in the medium term is expected to grow by around 9%. The Planning Commission's Working Group on Cement Industry predicts Page 30 of 32
47 cement production in India to grow at a rate of 10% during the Tenth Five-Year Plan ( ). By comparison, the cement industry is expected to grow at around 8-10% during the period. Growth of 9% per annum from FY would result in cement production increasing to around 196 mt in FY2010. By comparison, consumption could increase to 190 mt in FY2010. China, the world's largest producer of cement, has seen sustained cement production average annual growth of 10% since 1980, mostly due to the enormous infrastructure development that country has experienced over this period. Page 31 of 32
48 CORPORATE & REGISTERED OFFICE ICRA Limited Kailash Building, 11 th Floor 26, Kasturba Gandhi Marg New Delhi Tel. : +(91 11) Fax : +(91 11) Website :
49 Attachment 3

50 Economic IRR submitted to Ministry of Environment and Forest Government of India to show the economic benefits of the project
Comment : "The application and interpretation of step 0 and step 3 of the tool for assessment of additionality are not sufficiently substantiated.
 to request for review "Blended Cement Project with Fly Ash Lafarge India Private Limited", project # 0715 Comment : "The application and interpretation of step 0 and step 3 of the tool for assessment of
CEMENT. November 2010
 CEMENT November 2010 CEMENT November 2010 Contents Advantage India Market overview Investments Policy and regulatory framework Opportunities Industry associations 2 ADVANTAGE INDIA Advantage India India
Cement AUGUST For updated information, please visit
 Cement AUGUST 1 Contents Advantage India Market overview and trends Growth drivers Success stories: Innovative solutions Opportunities Useful information 2 Cement AUGUST Advantage India Strong demand Robust
Importance of Cement Industry in India
 International Journal of Marketing and Technology Vol. 7 Issue 8, August 2017, ISSN: 2249-1058 Impact Factor: 6.559 Journal Homepage: Double-Blind Peer Reviewed Refereed Open Access International Journal
Cement Industry: Stable credit outlook - Demand recovery and higher sales realization to result in improved profitability in FY15
 : Stable credit outlook - Demand recovery and higher sales realization to result in improved profitability in FY15 Cement Industry July 21, 2014 FY14 performance impacted due to slowdown in demand and
CARE s Rating Methodology for Cement Industry
 CARE s Rating Methodology for Cement Industry Industry Overview The cement industry, part of the manufacturing sector, plays a pivotal role in the infrastructure development of the country. The industry
Second largest Cement market. Dominated by private players. Higher share of large plants. Large concentration in South and West
 Second largest Cement market With nearly 300 million tonne of cement production capacity, India is the second largest cement producer in the world Dominated by private players Of the total capacity, 98
Cement Sector In India
 Cement Sector In India M&A - Way For Cementing Growth 2018 In this issue: 1 Global Overview 2 Fragmented Domestic Market 3 Outlook Driven by Domestic Growth 4 Criticality of Raw Material Linkage 5 M&A
INTERNATIONAL JOURNAL OF MANAGEMENT RESEARCH AND REVIEW
 INTERNATIONAL JOURNAL OF MANAGEMENT RESEARCH AND REVIEW GROWTH OF INDIAN CEMENT INDUSTRIES: AN ANALYSIS Sunil Kumar* 1, Dr. N.C. Bansal 2 1 Research Scholar, SRM University, NCR Campus, Modinagar, Ghaziabad.
RE: Comments on the National Ports Authority Tariff Application 2018/2019
 11 September 2017 The Chairman Ports Regulator Private Bag X54322 Durban 4000 Dear Sir RE: Comments on the National Ports Authority Tariff Application 2018/2019 We are pleased to provide our comments on
A Study of Employee Perception on Talent Management Practices in Cement Industries in Rajasthan
 A Study of Employee Perception on Talent Management Practices in Cement Industries in Rajasthan Hitesh Chelawat V.H. Enterprises Udaipur, Rajasthan, India Abstract Cement Sector is one of the most important
Chapter: 1.1 Energy Scenario
 Chapter: 1.1 Energy Scenario Part-I: Objective type questions and answers 1. The energy sources, that are either found or stored in nature are a) Secondary Energy Sources b) Primary Energy Sources c) both
Second largest cement market. Dominated by private players. Higher share of large plants. Large concentration in South and West
 Second largest cement market With nearly 350 million tonnes of cement production capacity, India is the second largest cement producer in the world. By 2020, cement production will reach to 550 million
Rating criteria for the cement industry. February 2018
 Rating criteria for the cement industry February 2018 Criteria contacts Pawan Agrawal Chief Analytical Officer CRISIL Ratings Email: pawan.agrawal@crisil.com Sameer Charania Director Rating Criteria and
Indian Cement Industry Outlook: Business Opportunities and Future Growth Potential to 2016
 Indian Cement Industry Outlook: Business Opportunities and Future Growth Potential to 2016 Industry Forecast Report Reference code: CN0509MR Published: June 2012 BRICdata John Carpenter House 7 Carmelite
ANALYTICAL HIGHLIGHTS
 IV ANALYTICAL HIGHLIGHTS 1. Reserves and Potential for Generation India s energy-mix comprises both non-renewable (coal, lignite, petroleum and natural gas) and renewable energy sources (wind, solar, small
Registered CDM Projects Average Annual Emission Reduction (tco 2 ) Total ERs by 2012 (tco 2 )
 Total ERs by 2012 (tco 2 )") Institute for Global Environmental Strategies Current Status of CDM in India IGES Market Mechanism Project / Climate Change Area Nozomi Okubo May 2009 Basic Information(as of 1 May 2009) Project Status
Institute for Global Environmental Strategies Current Status of CDM in India IGES Market Mechanism Project / Climate Change Area Nozomi Okubo May 2009 Basic Information(as of 1 May 2009) Project Status
RU B B E R & P L A S T I C S
 RU B B E R & P L A S T I C S The Rubber industry in India has been growing rapidly On the Supply side, Production and Imports have been growing steadily Domestic Production at 3.8 per cent CAGR and Imports
TheStudyEstimatesandAssessesGreenhouseGasEmissionsandRemovalsfrom thefollowingsectors: N O CH 4. Methane
 September17 Analysis of Greenhouse Gas Emission Trends from 5 to 13 TrendAnalysisof GHGEmissionsinIndia GHG Platform India is a collective civil society initiative providing an independent estimation and
Energy Saving Measures in. Cement Industry
 CH2356 Energy Engineering Energy Saving Measures in Cement Industry Dr. M. Subramanian Associate Professor Department of Chemical Engineering Sri Sivasubramaniya Nadar College of Engineering Kalavakkam
Registered CDM Projects. (tco 2 )
") Institute for Global Environmental Strategies Current Status of CDM in India Basic Information(as of 1 June 2010) Project Status N. of projects CDM projects registered at CDM executive board 506 CDM projects
Institute for Global Environmental Strategies Current Status of CDM in India Basic Information(as of 1 June 2010) Project Status N. of projects CDM projects registered at CDM executive board 506 CDM projects
STATUS OF ALTERNATE FUELS & RAW MATERIALS USAGE IN INDIA- Industry Perspective. Dr. S.K. Handoo
 STATUS OF ALTERNATE FUELS & RAW MATERIALS USAGE IN INDIA- Industry Perspective INTERNATIONAL CONFERENCE ON ENHANCED USAGE OF ALTERNATE FUELS & RAW MATERIALS CO-PROCESSING IN CEMENT PLANTS Dr. S.K. Handoo
CEMENT OCTOBER For updated information, please visit
 1 Executive Summary.... 3 Advantage India.... 4 Market Overview and Trends.. 6 Porters Five Forces Analysis.. 19 Strategies Adopted...21 Growth Drivers... 23 Opportunities. 31 Success Stories. 34 Useful
Fixed Forever! Knowledge Series 8. DhanBank PRU takes you on a whirlwind tour of the industry.
 Knowledge Series 8 Fixed Forever! It is the critical glue required to build up any economy. Whether it s for the new housing complex, the newest mall in town, the expressway that stretches out ahead of
May 3, 2018 I Research. Cement: Round-up and outlook. Graph 1. Global Cement Production ( By region)
") Cement: Round-up and outlook Contact: Madan Sabnavis Chief Economist madan.sabnavis@careratings.com 91-22-67543489 Ashish K Nainan Research Analyst ashish.nainan@careratings.com Mradul Mishra mradul.mishra@careratings.com
Cement: Round-up and outlook Contact: Madan Sabnavis Chief Economist madan.sabnavis@careratings.com 91-22-67543489 Ashish K Nainan Research Analyst ashish.nainan@careratings.com Mradul Mishra mradul.mishra@careratings.com
CEMENT. MAY 2017 (As of 11 May 2017) For updated information, please visit
 For updated information, please visit") (As of 11 May 2017) 1 Executive Summary.... 3 Advantage India.... 4 Market Overview and Trends.. 6 Porters Five Forces Analysis.. 19 Strategies Adopted...21 Growth Drivers... 23 Opportunities. 31 Success
(As of 11 May 2017) 1 Executive Summary.... 3 Advantage India.... 4 Market Overview and Trends.. 6 Porters Five Forces Analysis.. 19 Strategies Adopted...21 Growth Drivers... 23 Opportunities. 31 Success
Technology Gap Assessment
 INDIAN CEMENT INDUSTRY Technology Gap Assessment By Ashutosh Saxena Joint Director & Anil Kumar Group Manager National Council for Cement and Building Materials INDIAN CEMENT INDUSTRY Installed capacity
Domestic & Export Cement Market, Transportation Capacity Utilization & Outlook in India
 Domestic & Export Cement Market, Transportation Capacity Utilization & Outlook in India - 2017 Fact E-RP Market Research Series June 2017 Why enincon s report upon Domestic & Export Cement Market, Transportation,
DEMAND FOR FRUITS AND VEGETABLES IN INDIA
 Agric. Econ. Res. Rev., Vol. 8(2), pp. 7-17 (1995) DEMAND FOR FRUITS AND VEGETABLES IN INDIA Praduman Kumar and Mruthyunjaya Division of Agricultural Economics, IARI, New Delhi India is a vast country,
Validation Report. Report No , Revision April 2007
 Validation Report BIRLA PLUS CEMENT Validation of the Optimum utilisation of clinker for Pozzolana Portland Cement (PPC) production at Birla Plus Cement in Bathinda, Punjab, India project Report No. 869837,
Admixtures. Lecture No. 12
 Admixtures Lecture No. 12 Artificial Pozzolans Fly ash Blast Furnace Slag Silica Fume Rice Husk ash Metakaoline Surkhi. Fly Ash Fly ash is finely divided residue resulting from the combustion of powdered
CHAPTER-15 MINING. Twenty largest producer countries 2012 ( without construction minerals, in Billion US $)
") CHAPTER-15 MINING 15.1 World scenario & India : Minerals are valuable natural resources being finite and non renewable. Besides catering to the energy requirements of the world, they are valuable inputs
CHAPTER-15 MINING 15.1 World scenario & India : Minerals are valuable natural resources being finite and non renewable. Besides catering to the energy requirements of the world, they are valuable inputs
CDM and NAMA in India
 CDM and NAMA in India looking back (1) and looking forward (2) Mumbai, 8 th of October 2014 Enrico Rubertus Project Director GIZ New Delhi Seite 1 Background The first commitment period of Kyoto Protocol
PROJECT DESIGN DOCUMENT FORM (CDM PDD) - Version 02
 - Version 02") CDM Executive Board page 1 CLEAN DEVELOPMENT MECHANISM PROJECT DESIGN DOCUMENT FORM (CDM-PDD) Version 02 - in effect as of: 1 July 2004) CONTENTS A. General description of project activity B. Application
CDM Executive Board page 1 CLEAN DEVELOPMENT MECHANISM PROJECT DESIGN DOCUMENT FORM (CDM-PDD) Version 02 - in effect as of: 1 July 2004) CONTENTS A. General description of project activity B. Application
Fact Track-Power Distribution Sector in India
 June 2013 Fact Factor Report Series Copyright 2013, All rights reserved Fact Track-Power Distribution Sector in India 2 Power Distribution Sector in India- An Overview Research Base AT&C Losses Over the
MINERAL ADMIXTURES IN CONCRETE
 MINERAL ADMIXTURES IN CONCRETE by Dr J D BAPAT Seminar on Admixtures in Concrete 28 June 2011 Institution of Engineers, Shivajinagar Pune, Maharashtra, India FOREWORD THIS PRESENTATION GIVES BRIEF VIEW
Progress and Potential of Horticulture in India
 Ind. Jn. of Agri.Econ. Vol.63, No.3, July-Sept. 2008 SUBJECT I TRIGGERING AGRICULTURAL DEVELOPMENT THROUGH HORTICULTURE CROPS Progress and Potential of Horticulture in India Ramesh Chand, S.S. Raju and
Energy Scenario for Achieving Sustainability in Indian Situations
 International Journal of Engineering Research and Technology. ISSN 0974-3154 Volume 6, Number 6 (2013), pp. 811-816 International Research Publication House http://www.irphouse.com Energy Scenario for
CHAPTER-5 POROBLEMS AND SUGGESTIONS
 CHAPTER-5 POROBLEMS AND SUGGESTIONS Problems of Cement Industries in Nepal Suggestions 195 196 CHAPTER-5 POROBLEMS AND SUGGESTIONS 5.1 Problems of Cement Industries in Nepal Nepal is one of the poorest
CDM Developments in India & Challenges Ahead. Pamposh Bhat Head, GTZ CDM - India Indo German Energy Programme Bureau of Energy Efficiency
 CDM Developments in India & Challenges Ahead Pamposh Bhat Head, GTZ CDM - India Indo German Energy Programme Bureau of Energy Efficiency CDM in India India signed Kyoto Protocol in December, 1997 & ratified
Logistics Market China
 Logistics Market China November 2014 Executive Summary Market Logistics market value in China is expected to reach USD 55.1 tn by 2018 from USD 28 tn in 2012, growing at a CAGR of 11.9% Industrial products
CLEAN DEVELOPMENT MECHANISM PROJECT DESIGN DOCUMENT FORM (CDM-PDD) Version 02 - in effect as of: 1 July 2004) CONTENTS
 Version 02 - in effect as of: 1 July 2004) CONTENTS") CDM Executive Board page 1 CLEAN DEVELOPMENT MECHANISM PROJECT DESIGN DOCUMENT FORM (CDM-PDD) Version 02 - in effect as of: 1 July 2004) CONTENTS A. General description of project activity B. Application
CDM Executive Board page 1 CLEAN DEVELOPMENT MECHANISM PROJECT DESIGN DOCUMENT FORM (CDM-PDD) Version 02 - in effect as of: 1 July 2004) CONTENTS A. General description of project activity B. Application
Sustainability and Concrete Technology
 Sustainability and Concrete Technology by V.M. Malhotra Sustainability as defined in Brundtland Report 1987 Development that meets the needs of the present without compromising the ability of the future
CHAPTER - V COST OF PRODUCTION AND MARKETING ASPECTS OF CEMENT INDUSTRY
 CHAPTER - V COST OF PRODUCTION AND MARKETING ASPECTS OF CEMENT INDUSTRY V. COST OF PRODUCTION AND MARKETING ASPECTS OF CEMENT INDUSTRY 1. COST OF CEMENT PRODUCTION This chapter examines the various cost
AG R I C U LT U R A L E Q U I P M E N T
 AG R I C U LT U R A L E Q U I P M E N T The share of Agriculture in India s GDP has been diminishing The agriculture sector has shown a mild recovery in growth over the past 3 years Agriculture Growth
Technology Compendium
 Technology Compendium On Energy Saving Opportunities Cement Sector August 2013 2 Disclaimer This report is part of Shakti Sustainable Energy Foundation (SSEF) and CII Godrej GBC s effort to assist the
Building Materials and Construction Prof. Dr. B. Bhattacharjee Department of Civil Engineering Indian Institute of Technology, Delhi
 Building Materials and Construction Prof. Dr. B. Bhattacharjee Department of Civil Engineering Indian Institute of Technology, Delhi Module - 3 Lecture - 1 Concrete: Material If you remember in the last
CDM in India, Challenges and Success. by Pamposh Bhat Head, CDM-India, New Delhi Dec 23,06 EPCO, Bhopal,M.P
 CDM in India, Challenges and Success by Pamposh Bhat Head, CDM-India, New Delhi Dec 23,06 EPCO, Bhopal,M.P India s Position in The Global Carbon Market India has consolidated its leadership position in
QUALITY TREND IN INDIAN CEMENTS - A DECADE APPRAISAL
 QUALITY TREND IN INDIAN CEMENTS - A DECADE APPRAISAL U S Sinha, K Bhatnagar, R Gupta and M M Ali National Council for Cement and Building Materials, India Abstract Cement industry plays a vital role in
% % % % % % % % % % %
 v vi vii ***** A. General viii Highlights of Mineral Production April 2014 to March 2015 During the financial year 2014-15, the total value of mineral production (excluding atomic minerals and minor minerals
Presentation F t u ur u e o f o M ercha h nt n C ok o e I n I d n u d s u try I n I
 Presentation Future of Merchant Coke Industry In India An attractive opportunity for coking coal miners to invest in coke making business in India, given the low cost coke plant technology as well as lowest
Decomposition analysis of CO 2 Emissions Changes in the Indian Cement Industries
 DECOMPOSITION ANALYSIS OF CO 2 EMISSIONS CHANGES IN THE INDIAN CEMENT INDUSTRIES 5 Contents 5.1 Introduction 5.2 Decomposition Analysis 5.3 Methodology 5.4 Data Integration and Classification 5.5 Complete
ZAIN IMPEX ZAIN IMPEX. URL: Company Profile
 ZAIN IMPEX www.zainimpex.com Company Profile VISION To become an environmentally friendly Imports & Exports company with focus on Minerals & Metals Products MISSION -Focus on core competency and sustainable
Guideline For Waste Treatment/Recycling By Businesses
 Guideline For Waste Treatment/Recycling By Businesses July 12, 2001 Waste Recycling Subcommittee Industrial Structure Council 1. Iron and steel industry Given that the iron and steel industry is designated
IN BRIEF KEY FIGURES OF LAFARGEHOLCIM GLOBAL PRESENCE OF LAFARGEHOLCIM. Page 10. Page 16
 IN BRIEF 9 KEY FIGURES OF Page 10 GLOBAL PRESENCE OF Page 16 10 Annual Report 2016 AT A GLANCE 52 % developing markets * 48 % mature markets * Balanced global footprint * of net sales 2,300 operating sites
C O N S U M E R D U R A B L E S
 C O N S U M E R D U R A B L E S www.ibef.org The Indian Consumer Durables Industry can be segmented into 3 Key Groups Consumer Durables White Goods Refrigerators Washing Machines Air Conditioners Speakers
RE: Comment on the National Ports Authority Tariff Application 2013/2014
 11 December 2012 The Chairman Ports Regulator Private Bag X54322 Durban 4000 Dear Sir RE: Comment on the National Ports Authority Tariff Application 2013/2014 Background OSHO SA Cement (Pty) Limited is
IMS (Integrated Milling System)
") IMS (Integrated Milling System) PORTABLE CEMENT GRINDING PLANT IMSATEC GmbH Grinding Plant IMS (Integrated Milling System) CONCEPT Mini Cement grinding plants with greater efficiency in the cement market.
IMS (Integrated Milling System) PORTABLE CEMENT GRINDING PLANT IMSATEC GmbH Grinding Plant IMS (Integrated Milling System) CONCEPT Mini Cement grinding plants with greater efficiency in the cement market.
INNOVATION IN ENERGY CONSUMPTION
 INNOVATION IN ENERGY CONSUMPTION SYNOPSIS In the cement industry, during the last few years there has been a steep rise in the cost of production as the cost of energy inputs has increased sharply. Studies
Automakers and Auto Parts manufacturers
 Last updated: July 13, 2011 Rating Methodology by Sector Automakers and Auto Parts manufacturers 1. Business base Susceptible as it is to business fluctuations, the demand for new automobiles is relatively
Public Private Partnership in Wind Power in India
 Public Private Partnership in Wind Power in India Introduction India is the one of the fastest growing economies in the world. In the last five years, India has averaged a phenomenal 8.775% growth, as
Response to requests for review Aços Villares Natural gas fuel switch project (0474)
") UNFCCC Secretariat Martin-Luther-King-Strasse 8 D-53153 Bonn Germany Att: CDM Executive Board Your ref.: Our ref.: Date: CDM Ref 0474 MLEH/SUHA 11 September 2006 Response to requests for review Aços Villares
UNFCCC Secretariat Martin-Luther-King-Strasse 8 D-53153 Bonn Germany Att: CDM Executive Board Your ref.: Our ref.: Date: CDM Ref 0474 MLEH/SUHA 11 September 2006 Response to requests for review Aços Villares
EXECUTIVE SUMMARY. Objective. Database. Methodology
 EXECUTIVE SUMMARY Objective The purpose of this report I.3 is to identify and analyse the historical development of production, energy consumption, CO2 emission and efficiency of Vietnam s cement sector
L26942OR1949PLC000185
 OCL INDIA LIMITED Regd. Office: At/Po/Ps: Rajgangpur, Dist: Sundargarh, Odisha-770017 CIN: L26942OR1949PLC000185 Tel. No. :(06624)221212, 220121 Website: www.ocl.in / www.oclindialtd.in, E-mail: ocl_rajgangpur@ocl.in
CLASS: II YEAR / IV SEMESTER CIVIL SUBJECT CODE AND NAME: CE 6401 CONSTRUCTION MATERIALS UNIT I STONES-BRICKS-CONCRETE BLOCKS
 CLASS: II YEAR / IV SEMESTER CIVIL SUBJECT CODE AND NAME: CE 6401 CONSTRUCTION MATERIALS UNIT I STONES-BRICKS-CONCRETE BLOCKS PART-A 1. What are the important uses of stones? 2. What are the different
Recommended Action Plan for the Chosen AFR's
 Recommended Action Plan for the Chosen AFR's Sanjay Jain Senior General Manager Consulting Pvt. Ltd. Most Promising Alternate Fuels RDF from municipal solid waste [ MSW ] Used tyres Hazardous waste Industrial
To contextualise our comments please find below Figure 1 which provides an overview of integrated cement production across the value chain 1.
 Ports Regulator of South Africa 11 th Floor, The Marine Building 22 Dorothy Nyembe Street Durban 4001. Attention: Mr Mahesh Fakir Miss Atiyah Bhabha 5 th October 2018 OSHO CEMENT APPLICATION FOR THE 2019/20
RATING METHODOLOGY December 2016
 RATING METHODOLOGY January 2017 ICRA Rating Feature This rating methodology updates and supersedes ICRA's earlier methodology note on the sector, published in October 2012. While this revised version incorporates
Indian Pulses Market.
 Indian Pulses Market Indian Pulses Market India is the largest producer, importer and consumer of pulses, accounting for 25% of global production from 35% of global area under pulses. However, the productivity
Welcome to South Ferriby Cement Plant
 Welcome to South Ferriby Cement Plant 1 A long tradition The Humber estuary village of South Ferriby has been making cement for nearly 70 years. Over that period, the industry has provided much needed
Hydro & Small Hydro Outlook in India 2017
 Hydro & Small Hydro Outlook in India 217 Evaluating Business Case & Future Scenario of Large & Small Hydro Power Plants in India Report Summary enincon consulting llp, 217, New Delhi, India Enincon s Key
Indian Copper Industry: Poised For Escalating Growth - Metalworld Research Team
 Indian Copper Industry: Poised For Escalating Growth - Metalworld Research Team The copper industry is highly dependent on the performance of and demand for products like power and telecommunication cables,
CLEAN DEVELOPMENT MECHANISM PROJECT DESIGN DOCUMENT FORM (CDM-PDD) Version 02 - in effect as of: 1 July 2004) CONTENTS
 Version 02 - in effect as of: 1 July 2004) CONTENTS") CDM Executive Board page 1 CLEAN DEVELOPMENT MECHANISM PROJECT DESIGN DOCUMENT FORM (CDM-PDD) Version 02 - in effect as of: 1 July 2004) CONTENTS A. General description of project activity B. Application
CDM Executive Board page 1 CLEAN DEVELOPMENT MECHANISM PROJECT DESIGN DOCUMENT FORM (CDM-PDD) Version 02 - in effect as of: 1 July 2004) CONTENTS A. General description of project activity B. Application
Coal s Role in the Cement Industry
 Coal s Role in the Cement Industry Christian Dueweke LafargeHolcim The Coal Institute Summer Trade Seminar July 17, 2017 Table of Contents 1. About LafargeHolcim 2. Insight into the Cement Markets then,
DEVELOPMENT OF A LOCAL EMBODIED CARBON DATABASE
 DEVELOPMENT OF A LOCAL EMBODIED CARBON DATABASE FOR CONSTRUCTION MATERIALS Jack C.P. Cheng1, Irene M.C. Lo, Vincent J.L. Gan, Ran Jing, Jing L. Zhang Department of Civil and Environmental Engineering,
Rating Methodology by Sector. Iron & Steel
 Last updated: March 26, 2012 Rating Methodology by Sector Iron & Steel *This rating methodology is a modification of the rating methodology made public on July 13, 2011, and modifications are made to the
ISSN: Page 1
 SSRG International Journal of Civil Engineering ( SSRG IJCE ) Volume 3 Issue 6 June 26 Strength, Permeability and Carbonation properties of Concrete containing Kota Stone Slurry Aman Jain, Rohan Majumder
Impact of Fly Ash and Silpozz as Alternative Cementitious Material in Crusher Dust Concrete [1]
![Impact of Fly Ash and Silpozz as Alternative Cementitious Material in Crusher Dust Concrete [1]](/thumbs/89/97974119.jpg "Impact of Fly Ash and Silpozz as Alternative Cementitious Material in Crusher Dust Concrete [1]") Impact of Fly Ash and Silpozz as Alternative Cementitious Material in Crusher Dust Concrete [1] S. Jena, [2] K. C. Panda, [3] P. Sarangi [1] Assistant Professor, [2] Associate Professor, [3] Assistant
Impact of Fly Ash and Silpozz as Alternative Cementitious Material in Crusher Dust Concrete [1] S. Jena, [2] K. C. Panda, [3] P. Sarangi [1] Assistant Professor, [2] Associate Professor, [3] Assistant
AUTOCLAVED AERATED CONCRETE (AAC) BLOCKS PLANT
 BLOCKS PLANT") BRINGING YOU AND TECHNOLOGY TOGETHER AUTOCLAVED AERATED CONCRETE (AAC) BLOCKS PLANT REG. OFFICE:- 520-527, Poddar Arcade, Khand Bazaar, Varachha Road, Surat - 395006 (Gujarat) India. Ph. +91-261-2554153/54,
BRINGING YOU AND TECHNOLOGY TOGETHER AUTOCLAVED AERATED CONCRETE (AAC) BLOCKS PLANT REG. OFFICE:- 520-527, Poddar Arcade, Khand Bazaar, Varachha Road, Surat - 395006 (Gujarat) India. Ph. +91-261-2554153/54,
RESPONSE TO REQUESTS FOR REVIEW
 RESPONSE TO REQUESTS FOR REVIEW BVQI have validated the CDM Project Grid-connected electricity generation from renewable sources at Satara by M/s Bajaj Auto Ltd. (BAL) using wind Power. The request for
Media Release Adani Transmission Ltd s Consolidated PAT rose to Rs.842 Cr. in Q3 FY18 compared to Rs.67 Cr in Q2FY18. EDITOR S SYNOPSIS Consistent ope
 Media Release Adani Transmission Ltd s Consolidated PAT rose to Rs.842 Cr. in Q3 FY18 compared to Rs.67 Cr in Q2FY18. EDITOR S SYNOPSIS Consistent operational Network availability ranging from 99.82% to
Indian DRI Industry Challenges for Sustainable Growth 2 nd World DRI and Pellet Congress th April, 2014 Ritz-Carlton, Abu Dhabi
 Indian DRI Industry Challenges for Sustainable Growth 2 nd World DRI and Pellet Congress 2014 28-30 th April, 2014 Ritz-Carlton, Abu Dhabi Deependra Kashiva Executive Director World Steel and DRI Growth
CLEAN DEVELOPMENT MECHANISM (CDM)
") CLEAN DEVELOPMENT MECHANISM (CDM) SPECTRO ANALYTICAL LABS LTD is one of the leading laboratories in India, also offering a wide range of Integrated Solutions in various Environmental Sectors. CDM is one
CLEAN DEVELOPMENT MECHANISM (CDM) SPECTRO ANALYTICAL LABS LTD is one of the leading laboratories in India, also offering a wide range of Integrated Solutions in various Environmental Sectors. CDM is one
Mining and mineral based industries: BIG NUMBERS. Centre for Science and Environment New Delhi
 Mining and mineral based industries: BIG NUMBERS Centre for Science and Environment New Delhi The Study o Data on forests and environment clearances granted by the MoEF in the last five years - 11 th FYP
Co-processing waste in the cement industry:
 Co-processing waste in the cement industry: A solution to natural resource preservation and total emission reduction Anne Dekeukelaere - Cementis 1 Waste an ever lasting problem Waste is produced all over
Characterization and Application of Rice Husk Ash As Pozzolanic Material In Concrete
 IOSR Journal of Mechanical and Civil Engineering (IOSR-JMCE) e-issn: 2278-1684,p-ISSN: 2320-334X, Volume 12, Issue 3 Ver. III (May. - Jun. 2015), PP 28-32 www.iosrjournals.org Characterization and Application
Sr No Description Page No
 Contents Sr Description Page 1 About the Index 3 2 Carbon Intensity Estimation Methodology 4 3 Index Methodology 6 4 Index Performance 8 5 Frequently Asked Questions 10 6 Contact 12 2 About the Index The
Low-Carbon Cement in China
 CSI Forum --Learning-by-Sharing Open Forum Low-Carbon Cement in China China Building Materials Academy 2011.9.21 China Building Materials Academy Founded in 1950, owned by the central government. The largest
TECHNOLOGICAL ADVANCEMENTS IN THE APPLICATION OF ALTERNATE RAW MATERIALS IN CEMENT MANUFACTURE - NCB'S EXPERIENCE
 TECHNOLOGICAL ADVANCEMENTS IN THE APPLICATION OF ALTERNATE RAW MATERIALS IN CEMENT MANUFACTURE NCB'S EXPERIENCE ASHWANI PAHUJA Director General NATIONAL COUNCIL FOR CEMENT AND BUILDING MATERIALS, Sustainability
Looking EAST CEMENT BY VAIBHAV AGARWAL
 CEMENT BY VAIBHAV AGARWAL Looking EAST 2017 has remained a challenging year for the cement industry. As per Department of Industrial Policy & Promotion, cement production fell 2% yoy in April-October 2017.
Need Additional Information? LEGAL DISCLAIMER ACKNOWLEDGEMENT:
 LEGAL DISCLAIMER This work was implemented as part of the CGIAR Research Program on Climate Change, Agriculture and Food Security (CCAFS) hosted by BISA-CIMMYT in South Asia. The views expressed in this
MINING IN INDIA 2016
 Now Available MINING IN INDIA 2016 Sector Analysis and Market Outlook Research Report Data-set (Excel) India Infrastructure Research www.indiainfrastructure.com 1. Executive Summary SECTION I: SECTOR OVERVIEW
SUMMARY AND CONCLUSION
 CHAPTER - VIII SUMMARY AND CONCLUSION This chapter presents a summary of work done viz, statement of problem, objectives, Methodology and findings. Besides, the data were empirically tested and the conclusions
Executive Summary. India Mining Report Astra Mining Australia India Indonesia Singapore
 Executive Summary India Mining Report Astra Mining 14.12.10 Australia India Indonesia Singapore International Head Office Level 11, 82 Eagle Street, Brisbane, QLD 4000, Australia For more information visit
Lime burning in India
 Lime burning in India Resources Limestone is a sedimentary rock composed largely of the minerals calcite and aragonite. Many limestones are composed from skeletal fragments of marine organisms. A seashell
Rating criteria for the steel industry. February 2018
 Rating criteria for the steel industry February 2018 Criteria contacts Pawan Agrawal Chief Analytical Officer CRISIL Ratings Email: pawan.agrawal@crisil.com Ramesh Karunakaran Director Rating Criteria
Sample Reports of Central Sales Tax
 Sample Reports of Central Sales Tax The information contained in this document is current as of the date of publication and subject to change. Because Tally must respond to changing market conditions,
Iron & Steel. Last updated: July 13, Rating Methodology by Sector
 Last updated: July 13, 2011 Rating Methodology by Sector Iron & Steel 1. Business base Japan s steel industry is a basic materials industry, in which fluctuations in supply and demand and market conditions
Cementing the future... sustaining an essential British industry
 mpa cement members CEMEX UK Hanson Cement Hope Construction Materials Lafarge Tarmac mpa cement associate member Kerneos Aluminate Technologies Dennis Gilbert/viewpictures.co.uk Mineral Products Association
INDONESIA PACKAGING MACHINERY MARKET ASSESSMENT. An Analysis of Market Opportunities for Packaging Machinery Manufacturers
 2016 INDONESIA PACKAGING MACHINERY MARKET ASSESSMENT An Analysis of Market Opportunities for Packaging Machinery Manufacturers PRODUCED BY PMMI 11911 Freedom Drive Suite 600 Reston, VA 20190 USA 2016