SOLID WASTE MANAGEMENT FACILITIES STUDY Town of New London, New Hampshire
|
|
|
- Jack Reynolds
- 6 years ago
- Views:
Transcription
1 SOLID WASTE MANAGEMENT FACILITIES STUDY Town of New London, New Hampshire Prepared for New London Department of Public Works File No November 2017
2 TABLE OF CONTENTS 1.0 BACKGROUND AND PURPOSE Current Operational Issues and Study Objectives Study Framework Summary of Existing Operations Existing Conditions Site Plans SOLID WASTE & RECYCLING DATA REVIEW & PROJECTIONS Review of Existing Data and Calculation of Per Capita Generation Rates Solid Waste and Recycling Projections Estimating Individual Recycling Stream Tonnages FACILITY SIZING Bunker Bay Sizing for Recyclable Materials Summary of Bunker Sizing and Bale Production Rates Baler Area, Interior Bale Storage, and Loading Dock Recommendations Recycling Building Dimensions Transfer Station Sizing TRANSFER STATION TRAFFIC OBSERVATIONS Overview Methodology Estimating Vehicle Access and Parking Sanborn Head On-Site Observers Video Recording Data Recording Summary of Observations and Data Recording Total Vehicles Visiting Facility Queuing Observations Parking Spaces Occupied in Drop-off Area Drop-off Times General Observations Conclusions SITE PLAN ALTERNATIVES Summary of Concepts Evaluated Concept Option 1 Optimize Development at Existing Transfer Station Site through Acquisition of NHDOT Land Concept Option 2 Optimize Development within Existing Transfer Station Property Limits Concept Option 3 Consolidate Operations at New Site Opinion of Construction Cost REGIONAL OPPORTUNITIES Overview... 36
3 November 20, 2017 Page ii Solid Waste Management Facilities Study Final.docx Regionalization Interest Town of Wilmot Town of Andover Administrative Considerations Facility Sizing Considerations NEXT STEPS TABLES Table 2.1 New London Annual Trash and Recycling Tonnages 2013 to 2016 Table 2.2 Current (2017) Peak Solid Waste and Household Recycling Projections Table 2.3 Future (2047) Peak Solid Waste and Household Recycling Projections Table 2.4 Components of Household Recycling Stream Used to Refine Material Storage Requirements at Proposed Facility Table 2.5 Percentages of Household Recyclables in the Solid Waste Stream Derived from EPA Data Table 2.6 Percent of Plastic in Waste Stream by Type and Theoretical Maximum that can be Recovered Table 2.7 Percent of Paper in Waste Stream by Type and Theoretical Maximum that can be Recovered Table 2.8 Percent of Metal Containers in Waste Stream by Type and Theoretical Maximum that can be Recovered Table 2.9 Tonnage Estimates for Source Separation of Recyclables into Component Streams Peak Trash and Recycling Tonnage Table 2.10 Tonnage Estimates for Source Separation of Recyclables into Component Streams Peak Trash and Recycling Tonnage Table 3.1 Recyclable Material Bunker Bay Storage Sizing for 2017 Estimated Peak Demands Table 3.2 Recyclable Material Bunker Bay Storage Sizing for Future (2047) Estimated Peak Demands Table 3.3 Summary of Recycling Bunker Bay Sizing, Bale Production, and Annual Trailer Load Estimates for Proposed Facility Table 3.4 Summary of Recycling Bunker Bay Sizing, Bale Production, and Annual Trailer Load Estimates for Proposed Facility (Assumes #3 through #7 Plastic is not Recycled and One Bay Stores All Grades of Paper Except Cardboard) Table 3.5 Components of Recycling Building Width Table 3.6 Conceptual Dimensions for New Recycling Building Table 3.7 On-Site Transfer Trailer Storage Recommendations Table 4.1 Total Vehicles Visiting Transfer Station and Recycling Center Table 4.2 Typical Times Spent by Residents at the Site Table 5.1 Conceptual-Level Construction Costs Options 1, 2 and 3 Table 6.1 B.C.E.P Operating Budget Table Tonnage Estimates for Wilmot and Andover Using New London Generation Rates
4 November 20, 2017 Page iii Solid Waste Management Facilities Study Final.docx FIGURES Figure 1 Figure 2 Figure 3 Figure 4 Figure 5 Figure 6 Figure 7 Figure 8 Figure 9 Figure 10 Material Handling Flow Diagram for Solid Waste & Recyclables (Existing Town Operations) Locus Plan of Town Solid Waste & Recycling Sites Transfer Station & Recycling Center, Newport Road Miscellaneous Recyclables Drop-off & Storage at DPW Facility, South Pleasant Street Yard Waste and Scrap Metal Drop-off Area, Old Dump Road Glass Crushing Site, Shepherd Pit, Mountain Road Vehicle Access & Parking Plan, Existing Transfer Station & Recycling Center Vehicle and Drop-off Area Data Recording Form Parking Demand Chart Transfer Station & Recycling Center Drop-off Area (August 19, 2017) Locus Plan of Wilmot and Andover Transfer Stations APPENDICES Appendix A Appendix B Appendix C Appendix D Traffic Observation Photographs Vehicle and Drop-off Area Site Observation Data Conceptual Site Plans Option 1 Optimize Development at Existing Transfer Station Site through Acquisition of NHDOT Land Option 2 Optimize Development within Existing Transfer Station Property Limits Option 3 - Consolidate Operations at New Site Opinion of Construction Cost Concept Planning Phase
5 1.0 BACKGROUND AND PURPOSE 1.1 Current Operational Issues and Study Objectives The New London Transfer Station and Recycling Center, located on Newport Road near exit 12 on Route 89, has served as the Town s trash disposal and household recycling facility since the mid-1980s. When the facility first began operating, recycling was more of a grassroots activity, driven less by regulatory edict or a need to reduce disposal costs and more by individual preference and commitment to the concept of reduce, reuse, recycle. For these reasons, the recycling demands on the facility were relatively light in the early years of operation and were met by converting the wooden storage garage into a recycling building. However, over the past 35 years the demands placed on the small building have outpaced its ability to accommodate the compounding effect of both the growth in recycling and the overall growth in the Town s population. The Town s population has grown by approximately 50% since the mid-1980s (from approximately 3,000 residents to a current population of 4,500). This has not only taxed the capacity of the recycling building to meet growing volume demands, but has taxed the capacity of the 5-acre site to safely and efficiently accommodate the volume of vehicular and pedestrian traffic experienced during high demand periods. The small size of the site, combined with the minimal space available within the recycling building to store materials, has resulted in the Town relying on multiple sites to meet its solid waste and recycling drop-off and storage needs. The Town s reliance on multiple sites contributes to operational inefficiencies by requiring the Public Works Department (DPW) to handle recyclable materials multiple times in the course of processing, storing and delivering the material to out-of-town recycling markets. These system-wide operational inefficiencies, in combination with the Town s desire to improve the safe and convenient use of the transfer station and recycling center for its residents, prompted the preparation of this Solid Waste Management Facilities Study. There are two primary objectives associated with the Facilities Study: 1. Optimizing the function and efficiency of the existing transfer station and recycling center on Newport Road; and 2. Identifying an optimal facility layout that will allow all or most of the Town s current solid waste and recycling operations to be consolidated to a single location. In addition to these two primary objectives, a subordinate objective is to evaluate interest that the Towns of Wilmot and Andover may have in participating in a regional transfer station and recycling facility, as well as presenting an overview of administrative issues associated with regionalization.
6 November 20, 2017 Page Solid Waste Management Facilities Study Final.docx Study Framework To meet the Study objectives Sanborn Head familiarized itself with the Town s existing solid waste and recycling operations, which included site visits to the various drop-off and storage locations. We then performed a detailed review of the Town s solid waste and recycling tonnages, using this information and both population trends and EPA data to project current (2017) and future (2047) waste and recycling quantities. We then observed and documented traffic conditions at the transfer station site and used this information to assist us in developing the site layout options. A total of three concept options were prepared by Sanborn Head: two for the existing transfer station site and one for a new, hypothetical site. Regionalization issues were then explored and findings summarized. The Study concludes with suggested next steps the Town could take as it moves the planning effort forward. 1.3 Summary of Existing Operations The Town relies on four sites to support its solid waste and recycling operations: Transfer Station and Recycling Center on Newport Road trash and recycling drop-off, where recyclables include glass, metal, plastic and paper; Department of Public Works on South Pleasant Street Aluminum and plastic bale storage, as well as loose steel/tin/foil storage (delivered from the transfer station to the DPW), and residential drop-off of e-waste and used motor oil; Old Landfill Site located on Old Dump Road Residential drop-off of brush and scrap metal items (white goods); and Shepherd Pit on Mountain Road Glass consolidation (transferred from the transfer station and delivered from other communities in connection with NRRA-brokered recycling) and annual glass crushing. If one site was to be identified as a hub it would be the transfer station and recycling center. It is here that the majority of the Town s recycling activities are performed, including baling of aluminum, plastic and cardboard, as well as the transfer of glass to Shepherd Pit and the transfer of baled aluminum, baled plastic, and loose tin to the Public Works Department. The transfer station is open to residents five days per week (Tuesday, Wednesday, Thursday, Saturday and Sunday) between the hours of 9:00 am and 3:30 pm. The facility is also open on Fridays during these same operating hours, where its use is restricted to commercial haulers only. Based on our review and understanding of the Town s existing operations, we have prepared a Material Handling Flow Diagram summarizing the waste and recycling drop-off and processing activities performed at each site in Town. The Flow Diagram, provided as Figure 1, shows how the transfer station and recycling center serves as the primary receiving, processing and distribution hub for the majority of the Town s solid waste and recyclable materials. The Flow Diagram also depicts the extent of material handling performed by the DPW from the moment recyclables are dropped off at the site. For example, steel/tin, aluminum, and plastic is handled as many as seven to eight times in the course of processing, storing and delivering the material to out-of-town recycling markets.
7 November 20, 2017 Page Solid Waste Management Facilities Study Final.docx Existing Conditions Site Plans The locations of the Town s four drop-off sites are shown on the Locus Plan provided in Figure 2. Schematic layout plans depicting existing conditions at each site are provided in Figures 3 through 6.
8 November 20, 2017 Page Solid Waste Management Facilities Study Final.docx SOLID WASTE & RECYCLING DATA REVIEW & PROJECTIONS 2.1 Review of Existing Data and Calculation of Per Capita Generation Rates The Town provided Sanborn Head with its annual solid waste (trash) and recycling tonnages for the years 2013 through These four years of data were obtained from the Recycling and Disposal Report presented on Page 20 of the Town s Annual Report for the Year Ending 2016 (dated March 2017). The data provided in the Annual Report segregated the material into the following categories: Trash; Newspaper; Cardboard; Glass; Steel/tin cans; Aluminum cans; PETE (#1) plastic HDPE (#2) plastic Scrap metal; Batteries; Electronic waste; Used clothing Sanborn Head sorted and summarized the data, focusing specifically on the trash and household recyclables (consisting of glass, metal and plastic containers; newspaper, which includes mixed paper; and cardboard). The other recyclable streams (scrap metal, e-waste, batteries, and used clothing) were also summarized, but these materials represent only a small percentage of the Town s total trash and recycling stream. As such, these other recyclables are considered subordinate to the primary focus on estimating trash and household recycling quantities that would be handled at an expanded or newly constructed facility. The ability to reasonably estimate future quantities of household recyclables has a direct impact on sizing the loose storage requirements for these materials within a new building s bunker bays, as well as anticipated bale storage space needs. Table 2.1 summarizes Sanborn Head s sorting of the Town s past four years of trash and recycling data. The table totals the trash and household recycling quantities and identifies the percentage of trash and household recyclables as a function of the total of these two streams. As shown in the table, the percentage of trash to household recyclables has been fairly steady over the past four years, with trash representing between 77% and 80% of the combined trash and household recyclables tonnage (household recyclables representing between 20% and 23%). Table 2.1 also includes the Town s annual population data from 2013 through The population figures are estimates based upon US Census data for 2010 (population of 4,397) and 2015 population estimates prepared by the New Hampshire Office of Energy and Planning (population estimated at 4,493). The 2010 and 2015 published information was used by Sanborn Head to estimate population growth between these years, where the annual growth rate (approximately 0.433% per year) was projected from 2010 to estimate annual population figures for 2013 through Using the population data, per-capita waste generation rates
9 Table 2.1 New London, New Hampshire Annual Trash and Recycling Tonnages to 2016 Household Recyclables Trash and All Recyclables Other Recyclables Trash & Household Recyclables Only YEAR POPULATION TRASH GLASS METAL CONTAINERS PLASTIC CONTAINERS PAPER Steel/Tin Aluminum #1 PETE #2 HDPE Mixed Paper & Newspaper Cardboard LIGHT METAL (Scrap Metal) ELECTRONIC WASTE BATTERIES USED CLOTHING TOTAL Trash Household Recyclables Total ,454 2, , , , % of Total Tonnage 6.10% 0.62% 0.11% 0.32% 0.26% 7.72% 6.89% 1.21% 0.38% 0.00% 0.53% 75.9% 6.10% 0.73% 0.58% 14.61% 100% 77.5% 22.5% 100% 2.12% 22.02% Per Capita lbs/(person/day) ,474 2, , , , % of Total Tonnage 6.10% 0.58% 0.11% 0.35% 0.26% 6.97% 7.09% 1.12% 0.44% 0.002% 0.54% 76.5% 6.10% 0.69% 0.61% 14.06% 100% 78.1% 21.9% 100% 2.10% 21.45% Per Capita lbs/(person/day) ,493 2, , , , % of Total Tonnage 6.17% 0.59% 0.12% 0.37% 0.28% 6.16% 6.89% 0.73% 0.32% 0.05% 0.52% 77.8% 6.17% 0.71% 0.65% 13.05% 100% 1.62% 20.58% Per Capita lbs/(person/day) ,512 2, , , , % of Total Tonnage 6.18% 0.60% 0.12% 0.39% 0.29% 6.54% 6.75% 1.52% 0.31% 0.05% 0.57% 76.7% 6.18% 0.72% 0.68% 13.29% 100% 78.6% 21.4% 100% 2.46% 20.87% Per Capita lbs/(person/day) 79.1% 20.9% 100% Average Annual Trash and Household Recyclables Tonnage from 2013 to 2016: 2, Notes: 1. Population estimates based on US Census data for 2010 (population of 4,397) and 2015 population estimates prepared by the New Hampshire Office of Energy and Planning (population estimated at 4,493). A straight-line annual growth rate was calculated between 2010 and 2015, where this 2. Maximum per capita generation rates for trash and household recyclables are highlighted with gold shading. Solid Waste Management Facilities Study Town of New London, New Hampshire P:\4200\4220\Source Files\Report\Qtys Population Projections_Final.xlsx Sanborn Head & Associates November 2017
10 November 20, 2017 Page Solid Waste Management Facilities Study Final.docx (pounds per person per day) were calculated for each material type for the four years of data. Total per-capita generation rates for the aggregate of all materials (trash, household recyclables, and other recyclables) and combined trash and household-recyclables-only were also calculated for each year and are shown in Table 2.1. The information presented in Table 2.1, combined with a 30-year future Town population projection, served as the basis for projecting future trash and recycling quantities. These future projections were then used to estimate trash and recycling storage requirements appropriate for the facility during its operating life. 2.2 Solid Waste and Recycling Projections Solid waste and recycling projections were developed using the peak per capita generation rates associated with each material type recorded during the past four years, as highlighted in Table 2.1. For example, as shown in Table 2.1, the peak per capita generation rate for trash was recorded in 2013 (2.69 lbs/person/day), whereas the peak generation rate for #1 and #2 plastics was recorded in 2016 ( and 0.01 lbs/person/day, respectively). These peak per capita generation rates for each material type were then applied to New London s current population estimate for 2017 (4,532) to estimate current peak tonnages that the Town may experience at the transfer station and recycling facility. The same peak generation rates were also applied to the future population projection for New London in 2047 (7,380). Applying the per-capita generation rates to the population projection for 2047 provides a means of estimating increased volume demands that a new facility should be designed to accommodate over a long-term operating period. The solid waste and recycling projections for 2017 and 2047, using the previous four-year peak per capita generation rates, are summarized in Table 2.2 (2017) and Table 2.3 (2047). Table 2.2 Current (2017) Peak Solid Waste and Household Recycling Projections 2017 Estimated Population: 4,532 2 Household Recyclables Trash & Household Recyclables Trash GLASS METAL CONTAINERS Steel/ Tin Alum. #1 PETE PLASTIC #2 HDPE ONP 3 / Mixed PAPER OCC 4 TOTALS Trash Percentages Household Recyclables Per Capita Gen Rates lbs/(person/ day) % 22.6% Tons 2, ,870 2, Per capita generation rates (highlighted in gold) taken from peak rates recorded for each material type for the years 2013 through 2016 (see Table 2.1). 2. Population estimate for 2017 based on US Census data for 2010 (population of 4,397) and 2015 population estimates prepared by the New Hampshire Office of Energy and Planning (population estimated at 4,493). A straight-line annual growth rate was calculated between 2010 and 2015, where this growth rate was used to project from 2015 to estimate the Town s 2017 population. 3. ONP = Newspaper 4. OCC = Cardboard
11 November 20, 2017 Page Solid Waste Management Facilities Study Final.docx Table 2.3 Future (2047) Peak Solid Waste and Household Recycling Projections 2047 Estimated Population: 7,380 2 Household Recyclables Trash & Household Recyclables Trash GLASS METAL CONTAINERS Steel/ Tin Alum. #1 PETE PLASTIC #2 HDPE ONP 3 / Mixed PAPER OCC 4 TOTALS Trash Percentages Household Recyclables Per Capita Gen Rates lbs/(person/ day) % 22.6% Tons 3, ,674 3,620 1, Per capita generation rates (highlighted in gold) taken from peak rates recorded for each material type for the years 2013 through 2016 (see Table 2.1). 2. Population estimate for 2047 based on population data obtained from the following sources: 1) July 2012 Town of New London Master Plan Executive Summary; 2) US Census data; and 3) 2015 Population Estimates of New Hampshire Cities and Towns, prepared by the New Hampshire Office of Energy and Planning (OEP), July The New London Master Plan provided population data for 1970, 1980 and 2005, supplemented by US Census data for 2000 and 2010 and the OEP population estimate for A straight-line annual growth rate was calculated between 1970 and 2015 (annual growth rate of approximately 1.56% per year) and projected to the end of the 30-year facility life cycle, resulting in a projected Town population of 7,380 in ONP = Newspaper 4. OCC = Cardboard Based on the information provided in Table 2.2, the projected peak tonnage for trash and household recyclables that could be brought to the facility (existing or new) under current conditions is estimated at approximately 2,900 tons per year. The average tonnage for trash and household recyclables brought to the facility during the past four years is approximately 2,750 tons per year (see Table 2.1), meaning the peak demands estimated in Table 2.1 represent approximately a 6% increase to the average demands placed on the facility over the past four years. The long-range projections provided in Table 2.3 represent the design basis quantities for a new transfer station and recycling facility. While the future trash and recycling demands will serve as the basis for identifying the optimal size for the facility, the estimated peak tonnages for 2017 will also be carried forward in the facility sizing calculations for the purposes of providing the Town with a comparison of how the size and operation of the facility will vary if it were designed for current tonnages that have been peaked (Table 2.2) versus long-range projected tonnage demands (Table 2.3). 2.3 Estimating Individual Recycling Stream Tonnages Having generated the trash and household recycling projections, the next step in the waste stream analysis is to estimate the individual material components of the household recycling stream and what a theoretical maximum recovery rate of these materials could be so that this increased recycling rate is accounted for in the evaluation of bunker bay storage requirements for a new recycling facility.
12 November 20, 2017 Page Solid Waste Management Facilities Study Final.docx For the purposes of identifying storage volume requirements for source-separated recyclables at a new facility or expansion of the existing facility, the household recycling tonnages provided in Tables 2.2 and 2.3 were divided into the following individual streams: Table 2.4 Components of Household Recycling Stream Used to Refine Material Storage Requirements at Proposed Facility Household Recycling Stream Glass Metal Plastic Paper Individual Components of Recycling Stream Glass Steel & Tin Aluminum PETE (#1) HDPE (#2) #3 #7 Newspaper (ONP) Mixed Paper Cardboard (OCC) Using national data available from the EPA, Sanborn Head estimated the percentage distribution of the individual components of each recycling stream (for metals, percentage of steel cans and percentage of aluminum cans; for plastic, percentage of PETE, percentage of HDPE, and percentage of #3 - #7, and similar percentages for newspaper, mixed paper and cardboard in the paper stream). The percentages of the individual components of the glass, metal and plastic recycling streams were derived from solid waste data provided in the EPA document titled Advancing Sustainable Materials Management: 2014 Tables and Figures, Assessing Trends in Material Generation, Recycling, Composting, Combustion with Energy Recovery and Landfilling in the United States, December Sanborn Head compiled data provided in various tables in the EPA document where the data pertains to materials referenced in Table 2.4. The compilation of this data, showing percentages of household recyclables in the solid waste stream, is presented in Table 2.5. As shown in Table 2.5, the theoretical maximum recycling rate for glass, metal, paper and plastic is estimated at approximately 36.5% of the waste stream. Based on actual EPA recycling rates for these materials, the current (2014) national recovery rate is approximately 23%, which is also summarized in Table 2.5. The theoretical maximum recycling rates for each material type derived and presented in Table 2.5 are used to further refine the individual recycling rates for the individual components of each recycling stream. These component recycling rates for household glass, metal, and plastic materials are calculated and presented in Table 2.6 (Plastic), Table 2.7 (Paper), and Table 2.8 (Metal).
13 Table 2.5 Percentages of Household Recyclables in the Solid Waste Stream Derived from EPA Data TOTAL WASTE GENERATION (EPA 2014), Million Tons These figures are for all waste materials generated, of which some are not routinely recycled. For example, "plastics" includes durable and non-durable goods, as well as containers and packaging. Durable and nondurable plastics account for about half of all plastics generated (the other half being plastics in containers and packaging). Durable plastics include plastics used in cars, electronics and appliances; non-durable plastics include cups and plates - all of which are not readily recyclable. Therefore, the portion of the plastic material generated that could be recovered from a household recycling stream (mostly containers and packaging) was identified and used to estimate the maximum theoretical percentage of plastic material that could be recycled. This same methodology was used to calculate the maximum theoretical percentage of the other recyclable materials shown in Table 2.5. TOTAL MSW (EPA Table 1) Material Million Tons % of Total ONP Books/Mags/ Office Paper Other Steel Aluminum Other Million of Tons Current Recycle Rate Paper % NA NA NA NA % 23.8% % Yard Waste % NA NA NA NA NA NA NA 0 EPA Table 8 Plastics % NA NA 1.02 α NA NA 14.3 β % 6.8% % Rubber & Leather % NA NA NA NA NA NA NA 0 Textiles % NA NA NA NA NA NA NA 0 EPA Table 7 Metals % NA NA NA NA % 1.8% % Wood % NA NA NA NA NA NA NA 0 Food Waste % NA NA NA NA NA NA NA 0 EPA Table 6 Glass % 2.28 NA NA NA NA NA % 4.1% % Other % NA NA NA NA NA NA TOTAL % 36.5% 23.1% Plastics: α = Plates and cups (non-durable goods) β = No. 1 thru 7 container/packaging plastic Durable Goods (EPA Tables 6, 7 & 8) (Million Tons) Non-Durable Goods (EPA Table 18) (Million Tons) Containers & Packaging (EPA Table 22) (Million Tons) Total Non-Durable and Containers & Packaging (Million Tons) Actual Recycled (EPA Tables 19 & 24) 1. EPA tables referenced in Table 2.5 refer to data tables provided in the EPA document entitled Advancing Sustainable Materials Management: 2014 Tables and Figures - Assessing Trends in Material Generation, Recycling, Composting, Combustion with Energy Recovery and Landfilling in the United States, December Yard waste generated in 2014 (34.5 million tons) is not reported in Table 2.5 in order to calibrate the theroretically achievable recycling rates derived from the national figures to the total waste and recycling tonnages associated with New London. Because the total waste and recycling figures summarized for New London in Table 2.1 do not include yard waste tonnages, Table 2.5 should likewise not include yard waste tonnage as part of the total MSW waste stream. Theor % of Material that could be Recycled Theor % of Total Household Waste Stream that could be Recycled
14 November 20, 2017 Page Solid Waste Management Facilities Study Final.docx Plastic ID No. Table 2.6 Percent of Plastic in Waste Stream by Type and Theoretical Maximum that can be Recovered Description Generation (Mil tons) 1 % of Total Plastic Aggregate % Plastic that can be Recovered 2 % of Total Waste Stream that can be Recovered 1 PETE % 6.8% 1.8% 2 HDPE % 6.8% 1.8% 3 PVC % 6.8% 0.2% 4 LDPE % 6.8% 1.7% 5 Polypropylene % 6.8% 0.8% 6 Polystyrene % 6.8% 0.3% 7 Other % 6.8% 0.2% TOTAL % 6.8% 1. Generation tonnage (2014) obtained from Table 8 of EPA s Advancing Sustainable Materials Management: 2014 Tables and Figures, Assessing Trends in Material Generation, Recycling, Composting, Combustion with Energy Recovery and Landfilling in the United States, December Aggregate % plastic that can be recovered from household waste stream is calculated in Table 2.5. Type Table 2.7 Percent of Paper in Waste Stream by Type and Theoretical Maximum that can be Recovered Generation (Mil Tons) 1 % of Total Paper Aggregate % Paper that can be Recovered 2 % of Total Waste Stream that can be Recovered Newspaper (ONP) % 23.8% 2.6% Books/Magazines/Tissue % 23.8% 7.6% Cardboard (OCC) % 23.8% 10.6% Gable tops % 23.8% 0.2% Folding Cartons % 23.8% 1.9% Bags & Sacks % 23.8% 0.3% Other Paper % 23.8% 0.6% TOTAL % 23.8% 1. Generation tonnage (2014) obtained from Table 5 of EPA s Advancing Sustainable Materials Management: 2014 Tables and Figures, Assessing Trends in Material Generation, Recycling, Composting, Combustion with Energy Recovery and Landfilling in the United States, December Aggregate % paper that can be recovered from household waste stream is calculated in Table 2.5.
15 November 20, 2017 Page Solid Waste Management Facilities Study Final.docx Type Table 2.8 Percent of Metal Containers in Waste Stream by Type and Theoretical Maximum that can be Recovered Generation (Mil Tons) 1 % of Total Metal Containers Aggregate % Metal that can be Recovered 2 % of Total Waste Stream that can be Recovered Steel Cans % 1.8% 1% Aluminum Cans % 1.8% 0.8% TOTAL % 1.8% 1. Generation tonnage (2014) obtained from Table 22 of EPA s Advancing Sustainable Materials Management: 2014 Tables and Figures, Assessing Trends in Material Generation, Recycling, Composting, Combustion with Energy Recovery and Landfilling in the United States, December Aggregate % metal that can be recovered from household waste stream is calculated in Table 2.5. With the individual recycling percentages estimated in Tables 2.6 through 2.8, these percentages can be used to estimate the tonnages of the source separated material that would be brought to the New London Transfer Station and Recycling Facility under current (2017) and future (2047) conditions. These tonnage distributions for the trash and household recycling streams are presented in Table 2.9 and Table Year Table 2.9 Tonnage Estimates for Source Separation of Recyclables into Component Streams 2017 Peak Trash and Recycling Tonnages Total Projected Tons (Trash & Household Recyclables) ,870 Recyclable Stream % of Total Waste Stream Based on EPA Numbers 2 Glass Glass 4.1% Metal Plastic Paper Maximum Theoretical Recycling Rate & Tonnage (provides conservative basis for sizing recycling storage needs) Roll-up - EPA Theoretical Max Recovery Using EPA %s to Calculate Individual Recycling Components (Tons) Steel & Tin 1.0% Aluminum 0.8% HDPE 1.8% 12.7% PETE 1.8% #3 #7 3.2% Newspaper (ONP) 2.6% Mixed Paper 10.6% 23.8% Cardboard (OCC) 10.6% Total Roll-up (Tons) % 1, % Net Trash Tonnage (63.5%) 1, % Until 36.5% recycling rate can be achieved, assume trash tonnage is 80% of total stream (provides conservative basis for evaluating trash storage needs) 1. Total projected peak rate tonnages for 2017 were obtained from Table Waste stream percentages obtained from Tables 2.5 (glass), 2.6 (plastic), 2.7 (paper) and 2.8 (metal). 2, %
16 November 20, 2017 Page Solid Waste Management Facilities Study Final.docx Year Table 2.10 Tonnage Estimates for Source Separation of Recyclables into Component Streams 2047 Peak Trash and Recycling Tonnages Total Projected Tons (Trash & Household Recyclables) ,674 Recyclable Stream % of Total Waste Stream Based on EPA Numbers 2 Glass Glass 4.1% Metal Plastic Paper Maximum Theoretical Recycling Rate & Tonnage (provides conservative basis for sizing recycling storage needs) Roll-up - EPA Theoretical Max Recovery Using EPA %s to Calculate Individual Recycling Components (Tons) Steel & Tin 1.0% Aluminum 0.8% HDPE 1.8% 12.7% PETE 1.8% #3 - #7 3.2% Newspaper (ONP) 2.6% Mixed Paper 10.6% 23.8% Cardboard (OCC) 10.6% Total Roll-up (Tons) , % 1, % Net Trash Tonnage (63.5%) 2, % Until 36.5% recycling rate can be achieved, assume trash tonnage is 80% of total stream (provides conservative basis for evaluating trash storage needs) 1. Total projected tonnages for 2047 were obtained from Table Waste stream percentages obtained from Tables 2.5 (glass), 2.6 (plastic), 2.7 (paper) and 2.8 (metal). 3, % The information provided in Tables 2.9 and 2.10 summarizes the quantity of household recyclables that could be delivered to the facility under current and future conditions, where the recycling rates represent the estimated maximum recovery of these materials from the waste stream. As shown in Tables 2.9 and 2.10, the maximum estimated peak recycling rate is 36.5%, compared to the Town s current rate, which varies between 20% and 23%. The peak recycling rate provides the specific design basis tonnages for the maximum quantities of glass, metal, and plastic materials that will be processed through a new facility. It would follow that if the peak recycling rate is estimated at 36.5%, then the resulting trash rate would be 63.5%. However, for facility sizing purposes, it is more appropriate to assume that the trash disposal rate will initially be in the 80% range (consistent with the current rate, see Table 2.1) and reduce over time as the recycling rate increases to the peak projected 36.5% rate. For this reason, Table 2.10 identifies the projected trash and recycling tonnages that a new facility would be designed around: 1) 1,708 tons of recyclables representing a maximum anticipated recycling rate of 36.5%; and 2) 3,739 tons of solid waste representing a maximum trash disposal rate of 80%. It is worth noting that the maximum predicted quantity of glass that could be recycled by the Town under current (2017) conditions, as summarized in Table 2.9, is approximately 117 tons, which is less than the 170 tons per year the Town has achieved since 2013 (see Table 2.1). Since the predicted recycling tonnages shown in Tables 2.9 and 2.10 are intended to provide a conservative basis around which to identify facility sizing needs, it is appropriate to adjust the glass quantity so that the 2017 and 2047 planning numbers properly capture the tonnage the
17 November 20, 2017 Page Solid Waste Management Facilities Study Final.docx Town is currently experiencing. To this end, the 2017 glass volume will be set at 170 tons per year plus a 10% peaking factor, for a total projected 2017 peak glass tonnage of 187 tons per year. With respect to the projected glass tonnage estimated for 2047 (192 tons), bunker bay sizing will be based on a 2047 projected glass tonnage of 291 tons, which is the value calculated based on the Town s per-capita generation rate for glass, as shown in Table 2.3. The information provided in Tables 2.9 and 2.10, together with the adjustments noted for glass as noted above, will be used to estimate the loose volume storage requirements for trash and source-separated recyclables that would be delivered to a new recycling building, as well as the estimated bale production rate and bale storage requirements. This facility sizing methodology is described in Section 3.
18 November 20, 2017 Page Solid Waste Management Facilities Study Final.docx FACILITY SIZING 3.1 Bunker Bay Sizing for Recyclable Materials Determining bunker bay storage requirements for residential drop-off of trash and recyclables represents one of the primary sizing criteria for a new facility. Using the annual tonnages for each recycling stream provided in Tables 2.9 and 2.10, we can estimate required bunker sizes for these materials using typical loose density volumes associated with each material. This information is presented in Tables 3.1 and 3.2. Table 3.1 depicts criteria relevant to estimating bunker bay storage requirements based on 2017 peak estimated recycling activities (i.e. a 36.5% recycling rate) and Table 3.2 depicts similar criteria used to estimate future (2047) bunker bay storage requirements. As shown in Tables 3.1 and 3.2, the estimated annual tonnage of each recyclable material is converted into an average daily and weekly tonnage based on a 5-day operating week. These daily and weekly tonnages are then converted into daily and weekly volumes (cubic yards) using the loose volume densities for each material. The bunker bay sizes required to store these volumes can be determined by establishing a standard bay height and bay depth and then calculating the bunker width required to meet the loose volume storage needs. For this evaluation, all recycling bunker bays are assumed to have an 8-foot storage height and 15-foot length (partition wall length), resulting in a cross-sectional area of 120 square feet for each bay. Accounting for an angle of repose on the stockpiled material (45 degrees), the effective cross-sectional area that can be stored in an 8-foot high by 15-foot long bunker bay reduces to 88 square feet. Using the effective cross-sectional area of 88 square feet for each bay, the bay width may then be calculated. For example, as shown in Table 3.1, the loose storage volume for steel cans was calculated at 1.9 cubic yards per day. This equates to 51.3 cubic feet per day. Based upon a cross-sectional storage area of 88 square feet for an 8-foot high by 15-foot long bay, the required bunker bay width for one day of storage would be: 51.3 cubic feet/day 88 square feet = 0.58 feet for one day of storage (rounded to 0.6 in Table 3.1) One week s worth of storage (5 operating days) for steel cans would be 0.58 x 5 = 2.9 feet. In this way, the bunker bay dimensions required to store a day s worth and week s worth of each recyclable material was calculated and the results are shown in Tables 3.1 and 3.2. As shown in the tables, some materials can be provided with small bay widths that will provide for a week s worth of storage (steel and metal cans for example), while other materials require notably greater widths to meet a day s worth of storage (cardboard). The final column in Tables 3.1 and 3.2 identifies the theoretical bunker width that would be required (for an 8-foot high by 15-foot long bay) to store one bale s worth of material. These unit bunker widths are useful in that they can be used to estimate the equivalent bale storage provided in each bay. For example, the bunker bay width required to store one bale s worth of steel cans in an 8-foot by 15-foot bunker is 5 feet. Therefore, if a bay width of 10 feet was provided for this material, it would, when full, provide sufficient storage to make approximately 2 bales (10 feet wide 5 feet/bale = 2 bales).
19 Table 3.1 Recyclable Material Bunker Bay Storage Sizing for 2017 Estimated Peak Demands Material Characteristics Typical Bale Characteristics Peak 2017 Tonnage Rates and Equivalent Loose Storage Volumes Assumed Fixed Bunker Dimensions (ft): Effective Cross-Section Height 8 88 Loose Storage Estimated Current Peak Tonnages Loose Storage Volume Depth (front to back) 15 Unit Material Loose Density Bale Density Bale Bale Bale Reqd for 1 Bale Delivered to Facility (36.5% Recycle) Requirements Bunker Width for Bunker Width for Bunker Width for lb/cy lb/cf lb/cy Volume (cy) Weight (lbs) Wt at 90% (cy) Tons/Yr Tons/Day Tons/Week cy/day cy/wk Projected TPD (ft) Projected TPW (ft) 1 bale (ft) Glass Steel Cans Alum. Cans PETE HDPE No OCC ONP Mixed Paper Loose material densities are based on typical values provided in solid waste literature, including EPA data and data provided by the American Public Works Association (Solid Waste Pocket Guide). 2. Bale density and bale volumes are based on American Baler (formerly Lindemann) RAM II 75 S1 HP dual ram baler. 3. Bale volume assumes bale size of: 30" high x 45" wide x 60" long = approx 47 cf/bale = 1.74 cy/bale. 4. Tons per year obtained from Table 2.9, except for glass (see Note 5). 5. Annual tonnage for glass based on average tonnage currently experienced by the Town (170 TPY) and increased with a 10% peaking factor (187 TPY). Table 3.2 Recyclable Material Bunker Bay Storage Sizing for Future (2047) Estimated Peak Demands Material Characteristics Typical Bale Characteristics 2, 3 Future Tonnage Rates and Equivalent Loose Storage Volumes Assumed Fixed Bunker Dimensions (ft): Effective Cross-Section Height 8 88 Loose Storage Estimated Future (2047) Tonnages Loose Storage Volume Depth (front to back) 15 Unit Material Loose Density Bale Density Bale Bale Bale Reqd for 1 Bale Delivered to Facility (36.5% Recycle) Requirements Bunker Width for Bunker Width for Bunker Width for lb/cy 1 lb/cf lb/cy Volume (cy) 3 Weight (lbs) Wt at 90% (cy) Tons/Yr 4 Tons/Day Tons/Week cy/day cy/wk Projected TPD (ft) Projected TPW (ft) 1 bale (ft) Glass Steel Cans Alum. Cans PETE HDPE No OCC ONP Mixed Paper Loose material densities are based on typical values provided in solid waste literature, including EPA data and data provided by the American Public Works Association (Solid Waste Pocket Guide). 2. Bale density and bale volumes are based on American Baler (formerly Lindemann) RAM II 75 S1 HP dual ram baler. 3. Bale volume assumes bale size of: 30" high x 45" wide x 60" long = approx 47 cf/bale = 1.74 cy/bale. 4. Tons per year obtained from Table 2.10 except for glass (see Note 5). 5. Annual tonnage for glass based on projected tonnage provided in Table 2.3. Solid Waste Management Facilities Study Town of New London, New Hampshire P:\4200\4220\Source Files\Report\Qtys Population Projections_Final.xlsx Sanborn Head & Associates November 2017
20 November 20, 2017 Page Solid Waste Management Facilities Study Final.docx It should be noted that the unit bunker widths to make one bale is a function of the bale densities and volumes that can be achieved with a specific piece of equipment. As noted in Tables 3.1 and 3.2, bale densities and volumes are based on the American Baler 75 horsepower Ram II dual ram baler. Balers that achieve lower bale weights (for equivalent size bales) than those shown in Tables 3.1 and 3.2 will require less loose storage volume to make a bale, however, more bales will be produced to meet an equivalent tonnage throughput. 3.2 Summary of Bunker Sizing and Bale Production Rates The results of the storage bay sizing for a new recycling building are summarized in Table 3.3, which provides sizing information for both current (2017) and future conditions (2047). The table shows the selected bunker widths for the following nine categories of source separated household recyclables: 1. Glass; 2. Steel containers; 3. Aluminum containers; 4. PETE; 5. HDPE; 6. No. 3 through No. 7 plastics; 7. Cardboard; 8. Newspaper; and 9. Mixed paper. Table 3.3 is built off of: 1) the bunker widths needed to provide one day s storage for each material type; and 2) the minimum bunker widths needed to make one bale of each material type (aka unit bunker widths ). Both of these widths are taken from Tables 3.1 and 3.2. The greater of these two widths (one day s storage for the material versus storage required to make one bale) was then selected as the appropriate width for the specific bay under consideration, where widths were rounded up to a minimum dimension of 10-feet, reflecting the minimum recommended width for removing recyclables from the bay using a skid steer loader. The rounded-up width for each bunker bay was then used to calculate bunker storage capacity (in days) and the equivalent number of bales that can be produced from each bay when full. This information was then used to predict the number of bales produced annually under current and future conditions, as well as the estimated number of bale trailer loads that would be hauled from the building annually under current and future conditions. As shown in Table 3.3, the total clear opening linear footage for the nine recycling bays is estimated at 99 feet for current conditions and 105 feet for 2047 projected tonnages. This indicates the minimal impact to building size when comparing current to future conditions, owing principally to the rounding up of bay sizes to meet the minimum 10-foot width criteria for skid steer access. Accounting for partition walls that separate each bunker (assumed to be 8- inches thick), the total recommended recycling building length is 111 feet rounded to 115 feet, which would be appropriate to accommodate the recycling bunker bay storage requirements anticipated under future conditions. The 2017 numbers provided in Table 3.3 are provided as a means of comparing the relative size difference in the building if it were designed to meet current peak demands only. For planning purposes, the data associated with the 2047 future projections
21 Table 3.3 Summary of Recycling Bunker Bay Sizing, Bale Production, and Annual Trailer Load Estimates for Proposed Facility Year Glass Steel Aluminum PETE HDPE No. 3 thru 7 OCC ONP Mixed Paper Totals 3 "Raw" Bunker Width (ft) Needed to Provide 1 Day's Storage Minimum Bunker Width Needed to Make One Bale 2 NA Round Up Size 3 (ft) Linear Feet Bunker Storage Capacity (days) Equiv # Bales NA Avg # Bales Made per Year 5 NA ,417 Bales/year Est. # Bales per Trailer 6 NA Est. # Trailer Loads per Year NA Trailers/year "Raw" Bunker Width (ft) Needed to Provide 1 Day's Storage Minimum Bunker Width Needed to Make One Bale 2 NA Round Up Size 3 (ft) Linear Feet Bunker Storage Capacity (days) Equiv # Bales NA Avg # Bales Made per Year 5 NA ,307 Bales/year Est. # Bales per Trailer 6 NA Est. # Trailer Loads per Year NA Trailers/year 1. Bunker bay widths for recyclables are based on bay heights of 8 feet and lengths of 15 feet (widths shown are from Tables 3.1 for 2017 and 3.2 for 2047). Widths shown reflect clear dimensions for bunker storage (dimensions do not include bunker wall partition widths - see Note 4 below). 2. Minimum bunker with to make one bale of the specified material is shown in Table 3.1 for 2017 projections and Table 3.2 for 2047 projections. 3. Round-up sizes for bunker widths are based on rounding up the "raw" widths to a minimum of 10 feet, reflecting the minimum recommended width for removing recyclables from the bay by skid-steer loader. Greater widths were selected where calculations showed these were required to store a minumum amount of material to make one bale. 4. Total linear footage calculated for recyclable bay storage does not include partition wall widths. For space planning purposes, it is assumed that the width of each bunker wall partition is 8 inches. Based upon the number of bunker bays (nine), an 8-inch partition for each bunker wall partition would add 6 feet to the clear opening bay widths provided in Table Bales made per year based on a 5-day per week, 52 week per year operating schedule. 6. Bale storage on trailers (based on bale weight ranges and a 22 ton trailer load [trailer length approx 48 feet]): Material lbs/bale Tons/bale Tons/trailer Estimated bales/trailer Steel Aluminum PETE HDPE #3-# OCC ONP Mixed Paper Solid Waste Management Facilities Study Town of New London, New Hampshire P:\4200\4220\Source Files\Report\Qtys Population Projections_Final.xlsx Sanborn Head & Associates November 2017
22 November 20, 2017 Page Solid Waste Management Facilities Study Final.docx will be used as the preferred data around which to size the proposed facility for nine recycling bays (115 feet). Sizing the recycling building to accommodate the source separation of recyclables into nine individual bunker bays is a conservative approach that yields a greater building length as compared to designing the facility with fewer bunker bays. Nevertheless, for comparison purposes, and given the tight site constraints at the existing transfer station site, Sanborn Head evaluated building length requirements if the number of bunker bays is reduced from nine to seven. The bay reduction reflects the elimination of source separating No. 3 through No. 7 plastics, which the Town does not currently recycle (these items are disposed of in the trash stream), as well as combining newspaper and other mixed paper (boxboard, office wastepaper, magazines, etc.) into a single bunker bay. The results of this reduced bunker bay evaluation are summarized in Table 3.4. As shown in the table, the total clear opening linear footage for seven recycling bays is estimated at 74 feet for current conditions and 80 feet for 2047 projected tonnages. The building length is reduced by 25 feet as a result of: 1) eliminating bunker storage for No. 3 through No. 7 plastics (a 15-foot reduction); and 2) combining newspaper and other mixed paper into a single bay (a 10-foot reduction). Accounting for bunker partition widths, the building width would increase to 86 feet, which we have rounded to 90-feet for conceptual planning purposes. The conceptual layout plans presented in Section 5 include both nine-bay and seven-bay options for the proposed recycling building.
23 Table 3.4 Summary of Recycling Bunker Bay Sizing, Bale Production, and Annual Trailer Load Estimates for Proposed Facility (Assumes#3 through #7 Plastic is not Recycled and One Bay Stores All Grades of Paper Except Cardboard) TRASH 6 7 Year Glass Steel Aluminum PETE HDPE No. 3 thru 7 OCC ONP & Mixed Paper Totals 3 "Raw" Bunker Width (ft) Needed to Provide 1 Day's Storage Minimum Bunker Width Needed to Make One Bale 2 NA Round Up Size 3 (ft) Linear Feet Bunker Storage Capacity (days) Equiv # Bales NA Avg # Bales Made per Year 5 NA ,027 Bales/year Est. # Bales per Trailer 6 NA Est. # Trailer Loads per Year NA Trailers/year "Raw" Bunker Width (ft) Needed to Provide 1 Day's Storage Minimum Bunker Width Needed to Make One Bale 2 NA Round Up Size 3 (ft) Linear Feet Bunker Storage Capacity (days) Equiv # Bales NA Avg # Bales Made per Year 5 NA ,672 Bales/year Est. # Bales per Trailer 6 NA Est. # Trailer Loads per Year NA Trailers/year 1. Bunker bay widths for recyclables are based on bay heights of 8 feet and lengths of 15 feet (widths shown are from Tables 3.1 for 2017 and 3.2 for 2047). Widths shown reflect clear dimensions for bunker storage (dimensions do not include bunker wall partition widths - see Note 4 below). 2. Minimum bunker with to make one bale of the specified material is shown in Table 3.1 for 2017 projections and Table 3.2 for 2047 projections. 3. Round-up sizes for bunker widths are based on rounding up the "raw" widths to a minimum of 10 feet, reflecting the minimum recommended width for removing recyclables from the bay by skid-steer loader. Greater widths were selected where calculations showed these were required to store a minumum amount of material to make one bale. 4. Total linear footage calculated for recyclable bay storage does not include partition wall widths. For space planning purposes, it is assumed that the width of each bunker wall partition is 8 inches. Based upon the number of bunker bays (seven), an 8-inch partition for each bunker wall partition would add 5 feet to the clear opening bay widths provided in Table Bales made per year based on a 5-day per week, 52 week per year operating schedule. 6. Bale storage on trailers (based on bale weight ranges and a 22 ton trailer load [trailer length approx 48 feet]): Material lbs/bale Tons/bale Tons/trailer Estimated bales/trailer Steel Aluminum PETE HDPE #3-# OCC ONP Mixed Paper Solid Waste Management Facilities Study Town of New London, New Hampshire P:\4200\4220\Source Files\Report\Qtys Population Projections_Final.xlsx Sanborn Head & Associates November 2017
24 November 20, 2017 Page Solid Waste Management Facilities Study Final.docx Baler Area, Interior Bale Storage, and Loading Dock Recommendations As presented in Section 3.2, the bunker bay storage widths define the length of the recycling building. The width of the building is based upon four primary factors: 1) length of bunker partition walls (in this evaluation, 15 feet); 2) size of the baler and associated components (motor, pit and incline conveyor, wire tier, stairs to the control unit); 3) clearances around the baling equipment; and 4) interior bale storage needs. For planning purposes, Sanborn Head has assumed a larger footprint for the baling equipment than what would likely be required at facility start-up. Specifically, we have selected a footprint of 30 feet by 55 feet for the baler (dual ram) and components, which will provide sufficient space to upgrade the baling equipment should the Town wish to do so during the life of the facility. With respect to bale storage requirements, the projections in Table 3.3 indicate that a nine-bay facility, under future conditions, may produce as many as 2,307 bales per year (average of 9 bales per day) and a seven bay facility may produce as many as 1,672 bales per year (average of 6.5 bales per day). For planning purposes, the proposed recycling building will be sized to provide interior storage for one week s worth of bale production (2047 conditions). This equates to 45 bales for the nine-bay facility (which will also serve as the minimum interior storage needs for a seven bay facility). Based on an individual bale size of approximately 4-feet by 5-feet by 30- inches high, up to 60 bales can be stored within a floor area 10 feet wide by 40 feet long stacked to a height of 7.5 feet (bales stacked three courses high). Therefore, an interior bale storage area of 10 feet by 40 feet will be included in the sizing requirements for the proposed recycling building. As shown in Table 3.3, the number of loads of baled recyclables hauled from the facility is estimated at 77 trailers per year under the nine-bay building scenario. This equates to between one and two trailer hauls per week. Given this low haul rate, one loading dock is deemed sufficient to meet the needs of the proposed facility. The features that make-up the width of the recycling building are summarized in Table 3.5. Table 3.5 Components of Recycling Building Width Length of bunker partition wall Clearance from end of bunker partition wall to baling equipment Width reserved for baling equipment Clearance from baling equipment to interior bale storage area Width of bale storage area Total Building Width 15 feet 25 feet 30 feet 20 feet 10 feet 100 feet The design phase for the proposed new facility will present opportunities to refine the width of the proposed recycling building. These refinements may warrant reducing the width of the building to some degree, depending on the specific baling equipment the Town chooses to install.
25 November 20, 2017 Page Solid Waste Management Facilities Study Final.docx Recycling Building Dimensions Section 3.2 described the methodology for defining the length of the proposed recycling building and Section 3.3 described the methodology for defining its width. The resulting dimensional requirements for the building are summarized in Table 3.6, which highlights the dimensional requirements for a nine bunker bay facility versus a seven bay facility. Table 3.6 Conceptual Dimensions for New Recycling Building Number of Bunker Bays for Differing Types of Source-Separated Recyclables Nine Seven Building Dimensions 115 feet by 100 feet 90 feet by 100 feet 3.5 Transfer Station Sizing Identifying the dimensions for the new transfer station is less a function of tonnage delivered to the facility and more dependent on how the facility will operate because variability in tonnage can be addressed by varying the frequency of trailer hauls made from the transfer station. This is particularly true for a direct dump type of transfer station like the existing New London facility, where identifying tipping floor dimensions for waste storage is not an operational component. Given these considerations, it is appropriate to summarize how the existing transfer station operates, since these operations have been identified by the Department of Public Works as meeting the Town s needs and therefore represent a reasonable system to replicate as part of any new transfer station construction. The existing transfer station is a small direct dump facility where waste drop-off consists of residents and commercial vehicles direct dumping into a compactor hopper, where the compactor cycles the waste into a compaction trailer below, located at a grade approximately 16 feet below the hopper floor elevation. The drop-off portion of the transfer station has dimensions of approximately 32 feet by 16 feet. Approximately half of this area is dedicated to the compactor hopper and the remaining area (16 feet by 16 feet) is interior floor space used by commercial vehicles to direct dump into the compactor hopper. Residents dispose of their waste through a 12-foot wide chute opening in the face of the building located directly above the hopper. When developing layout concepts for a new transfer station and recycling facility, the size and operational characteristics of the existing transfer station will be used as a model for one of the concepts. The transfer station layout will include provisions for on-site trailer storage, which is estimated by projecting the number of trailer hauls that will be made from the facility. Currently, an average of two trailer hauls per week are made from the transfer station. The Town owns two 106 cubic yard compaction trailers and one 80 cubic yard compaction trailer. The Town hauls their full trailers to the Meredith Transfer Station, where the trailer is then hauled to the Androscoggin Regional Refuse Disposal District Landfill in Berlin, New Hampshire. The New London Transfer Station has space to store one spare transfer trailer. The second trailer on-site is the live transfer trailer (trailer being loaded), with the third generally in transit between
26 November 20, 2017 Page Solid Waste Management Facilities Study Final.docx New London and Meredith. The goal of the concept planning will be to increase on-site trailer storage capacity at the current site or at a new site. The on-site trailer storage requirements to be included in the conceptual planning effort are summarized in Table 3.7. Year Table 3.7 On-Site Transfer Trailer Storage Recommendations Annual Trash Tonnage 1 Average Tons Hauled Per Trailer 2 Average Trailer Hauls Per Week On-Site Storage Recommendations , One (1) bay for empty/full trailer One (1) spare bay Provides on-site storage capacity for one week s worth of trash disposal (including trailer being loaded) , Two (2) bays for empty/full trailers One (1) spare bay Provides on-site storage capacity for one week s worth of trash disposal (including trailer being loaded) 1. Annual trash tonnages for current (2017) and future (2047) conditions were obtained from Tables 2.2 and Average tonnage per compaction trailer based on information provided by New London DPW. As summarized in Table 3.7, on-site trailer storage recommendations are based on providing one week s worth of trash storage within the compaction trailers (which includes the trailer being filled at the transfer station). The conceptual layouts presented in Section 5 will incorporate the trailer storage recommendations associated with future (2047) tonnage projections.
27 November 20, 2017 Page Solid Waste Management Facilities Study Final.docx TRANSFER STATION TRAFFIC OBSERVATIONS 4.1 Overview On Saturday, August 19, 2017 representatives from Sanborn Head visited the New London Transfer Station and Recycling Center to observe residential drop-off activities. Our observations focused on vehicle queuing, pedestrian and vehicle conflicts, potential interferences to residential drop-off activities, and typical times required to complete the dropoff activities. Observations and data recorded during the site visit are summarized in this section, together with conclusions that served to guide the preparation of the conceptual site plan options presented in Section Methodology Estimating Vehicle Access and Parking In preparation for the site visit, Sanborn Head reviewed the March 4, 2016 brief video taken by the Northeast Resource Recovery Association (this video is referenced in NRRA s April 4, 2016 Site Review memorandum to the Town). The video review was performed to gain an initial understanding of how residents use the facility, specifically, the manner in which vehicles park and how residents deliver their materials to the various drop-off nodes (transfer station, recycling building, recyclable paper roll-off container, and used clothing donation bin). Based on our review of the video, Sanborn Head prepared a reference sketch depicting approximate parking and queuing locations available within the site and along the access road leading from Newport Road to the site entrance gate. The reference sketch was used by our on-site observers to log the locations occupied by vehicles while we were recording the residents use of the site. The parking and queuing locations are shown on the Vehicle Access and Parking Plan provided in Figure 7. As shown on Figure 7, the facility provides capacity for approximately 26 parking spaces, all of which are located inside the entrance gate. These are assumed to represent the maximum number of parking spaces that residents have available to them when dropping off material. The queuing capacity is assumed to be the number of spaces where residents are too far from the transfer station and recycling building to conveniently drop material off and instead they will idle in these spaces until they enter the site and can park. For the purposes of this evaluation, the queuing area is taken as the entrance lane into the site from Newport Road up to the entrance gate. As shown on Figure 7, the queuing area capacity is estimated at 10 vehicles (labeled as Q1 through Q10) Sanborn Head On-Site Observers Based on our review of the NRRA video and Sanborn Head s previous visits to the site (April 28, 2017 and July 11, 2017), we determined that two observers would be sufficient to record the residential traffic and drop-off operations at the facility. One observer was focused on the site entrance area and was located near the cottage building where the individual could track the total number of incoming vehicles, queuing outside the gate, as well as observe selected drop-off activities. The second observer was located near the transfer station and was focused on recording parking locations, drop-off activities, and total number of vehicles in the drop-off area at various times during the day. As traffic conditions allowed, each observer would move from their primary location to other locations in an effort to log drop-off activities from differing vantage points. The primary location of each observer is shown on Figure 7 and labeled as OBS- 1 and OBS-2.
28 November 20, 2017 Page Solid Waste Management Facilities Study Final.docx Video Recording To provide real-time back-up to our on-site observations and data recording, Sanborn Head employed a video camera to record the day s activities in the drop-off area. Recording was performed for the entirety of the operating day, from 9:00 am to 3:30 pm, with the only interruptions occurring when the camera battery needed to be changed. The camera was mounted to the face of the transfer station building near the office entrance door, which was found to provide the most unobtrusive and complete view of the drop-off area. The camera location is shown on Figure 7. Photograph 1, provided in Appendix A, provides a video camera still-frame image of the drop-off area immediately before the site opened (8:58 am) Data Recording Information recorded by Sanborn Head while on-site included the following: Total number of vehicles visiting the facility during the day; Vehicle type (car, SUV, pick-up, etc.); Time entering site; Time exiting site; Whether vehicles are waiting in a queue and if so, what queue position they are in when they arrive at the site; Drop-off parking location (referenced to the numbering system for parking spaces inside the entrance gate, as shown on Figure 7); Time when parked in the drop-off area; Start and finish time for trash disposal; Start and finish time for recyclables drop-off at the recycling building; Start and finish time for newspaper (ONP), magazine (OMG), and office wastepaper (OWP) drop-off at the recyclable paper roll-off container; and Total number of vehicles parked in the drop-off area at various time intervals. With the exception of the total number of vehicles visiting the facility, our on-site observers logged the above information onto a Vehicle and Drop-off Area Data Recording Form, a blank copy of which is provided as Figure 8. The estimated total number of vehicles visiting the facility was recorded by the observer located near the site entrance using a handheld tally counter. Following the site visit, the data recorded on the Vehicle and Drop-off Area Data Recording Forms was compiled into an Excel spreadsheet. The compiled data is provided in Table B-1 of Appendix B. 4.3 Summary of Observations and Data Recording Total Vehicles Visiting Facility Sanborn Head counted a total of 505 vehicles visiting the site during the day. We recorded the accumulating total on an hourly basis, as shown in Table 4.1.
29 November 20, 2017 Page Solid Waste Management Facilities Study Final.docx Table 4.1 Total Vehicles Visiting Transfer Station and Recycling Center Period Approximate Number of Vehicles per Period Cumulative Number of Vehicles 9:00 am to 10:00 am :00 am to 11:00 am :00 am to Noon Noon to 1:00 pm :00 pm to 2:00 pm :00 pm to 3:00 pm :00 pm to 3:30 pm As shown in Table 4.1, the hourly rate of vehicles visiting the facility was steady and at its highest between 9:00 am and noon, during which time they were arriving at a rate of approximately 100 vehicles per hour. The next highest arrival rate occurred between 2:00 pm and 3:00 pm, when approximately 70 vehicles visited the site. Overall, the first three hours of operation saw approximately 300 vehicles visiting the site, compared to 205 visiting the site over the final three-and-a-half hours of operation. Surges in vehicles visiting the site were indirectly recorded by documenting the number of parking spaces occupied within the drop-off area. The higher number of occupied spaces generally indicated periods when peak vehicle arrival rates were occurring. These observations are summarized in Section Queuing Observations As defined in Section 4.2.1, the queuing area is taken as the entrance lane into the site from Newport Road up to the entrance gate. During the August 19 site observations, the only time this area was occupied was immediately prior to the site opening at 9:00 am. At that time, nine vehicles were observed in the queuing area, waiting for the entrance gate to open. These vehicles occupied the nine spaces as labeled on Figure 7 (positions Q1 through Q9). Transfer station staff informed Sanborn Head that during peak demand days, the queue lane will extend onto Newport Road. This is assumed to occur when all available drop-off spaces are occupied and the facility is receiving an influx of vehicles at a rate greater than the rate at which vehicles are departing the drop-off area Parking Spaces Occupied in Drop-off Area At various times during the day, Sanborn Head recorded the total number of vehicles parked in the drop-off area. When possible, this information was recorded within 15 minute intervals. The objective in capturing this information was to identify general trends related to peak parking demands, when these peak periods occurred, and how quickly they dissipated. This information is recorded in the far right columns of Table B-1 (Appendix B). A total of 58 entries were made regarding total parking observed in the drop-off area. The frequency at which the observations were made varied, largely dictated by the availability of the observer to record parking information while recording other drop-off activities. No fewer than six entries were recorded per hour documenting parking demands in the drop-off area, with as many as 13 readings
30 November 20, 2017 Page Solid Waste Management Facilities Study Final.docx recorded during the period from 2:00 pm to 3:00 pm. The typical number of parking readings taken per hour ranged from seven to nine. The parking observations recorded in Table B-1 were plotted and are shown on the bar chart provided in Figure 9. As shown on the chart, the peak number of parking spaces occupied within the drop-off area was 12, where this was documented twice at 9:35 am and 10:24 am. Remaining peak parking demands ranged between 8 and 10 spaces occupied, which occurred predominantly in the morning until approximately 11:45 am. The parking demand then leveledoff between 12:00 pm and 2:15 pm with readings as low as one space occupied to as many as seven occupied, with a typical range of 4 to 5 spaces occupied during this period. A spike was recorded towards the end of the day with a steady demand of more than seven spaces occupied between 2:15 and 3:00 pm. The early morning parking demand and late afternoon parking spike follows the general pattern of the total vehicle traffic count recorded for the day, where the highest traffic volume occurred between 9:00 am and noon, followed by an end-of-day surge between 2:00 pm and 3:00 pm Drop-off Times A total of 117 vehicles were tracked by Sanborn Head for the purposes of recording total time on-site and recording times required to complete drop-off activities at the transfer station, recycling building and other locations. Of the 117 vehicles, 99 were tracked by Sanborn Head to record the time spent by residents to complete drop-off activities at the various drop-off locations. Based on our observations, we found that the time spent dropping off material at any specific location was less telling than the cumulative time required for a resident to complete all drop-off activities. This is because the cumulative time equated, in nearly all cases, to the total time a vehicle occupied a single parking space in the drop-off area (based on observations, residents typically complete all drop-off activities from a single parking space). Of the 99 vehicles tracked in the drop-off area, the maximum time required for a resident to complete drop-off activities was approximately 17 minutes, where drop-off was limited to trash at the transfer station and recyclables at the recycling building. The minimum time required to complete drop-off activities was just under one minute (50 seconds), where the resident was dropping off trash only. The average time to complete all drop-off activities was approximately four minutes. The maximum, minimum and average time recorded for both total on-site vehicle time and total time spent in the drop-off area is summarized in Table 4.2. Table 4.2 Typical Times Spent by Residents at the Site Criteria Total Time On Site 1 Total Time in Drop-off Area 2 Maximum Time 0:18:00 0:17:14 Minimum Time 0:01:00 0:00:50 Average Time 0:04:29 0:04:17 1. Values provided for total on-site time are based upon times recorded for 63 vehicles visiting the facility. 2. Values provided for total time in the Drop-off Area are based upon times recorded for 99 vehicles visiting the facility.
31 November 20, 2017 Page Solid Waste Management Facilities Study Final.docx The total on-site times and individual drop-off area times recorded by Sanborn Head are provided in Table B-1. The individual entries reveal the manner in which residents use the facility, which shows that virtually all drop-off activities are completed from a single parking location with multiple trips made by the residents walking back and forth to their vehicles to bring materials to the different drop-off locations. The effect this has on both vehicle and pedestrian traffic patterns, as well as other observations made by Sanborn Head while on site, is presented in Section General Observations Several observations related to facility layout, pedestrian and vehicular interaction, and the manner in which residents perform drop-off activities were noted by Sanborn Head while onsite. These observations are summarized below. 1. The facility consists of four distinct drop-off nodes: Transfer station; Recycling building; Recyclable paper (ONP/OMG/OWP) roll-off container; and Used clothing donation bin. The transfer station, recycling building and recyclable paper container are all located within 60 feet of each other, with the used clothing bin located within 110 feet of the other three nodes. Because these nodes are located in such close proximity to each other, configured tightly around the inner and outer edges of the cul-de-sac style drop-off area, the four nodes essentially function as a single node for parking purposes. This is evidenced by the manner in which residents use the facility, where the proximity of each node allows residents to park in a single location and from that location walk with their waste and recyclables to as many nodes as they need to visit. Depending upon where residents park and the amount of material they have with them, a single visit can lead to considerable back-and-forth pedestrian traffic that often will cross and weave around vehicles as the vehicles are entering or leaving the drop-off area. 2. Examples of pedestrian and vehicular interaction are shown in Photographs 2 through 6 of Appendix A. The photographs are still images taken from the video recording performed by Sanborn Head. 3. Sanborn Head observed some instances, during high demand periods, where vehicle and pedestrian conflict was evident. These instances included pedestrians crossing the center drive-through lane, where vehicles were entering or leaving the drop-off area, as well as along the edge of the drive-through area, particularly along the face of the recycling building and transfer station. In these instances, pedestrians appeared more focused on their drop-off activities at the buildings, whereas the vehicles parked in these areas (particularly in parking locations 2, 3, 10 and 11 - see Figure 7), were focused on leaving their parking spaces. This led to some observed quick stops by both pedestrians and vehicles as each were in the same tight quarters with drivers looking to their left to watch for drive-through traffic, while pedestrians were walking around the cars as they were approaching or leaving the buildings.
32 November 20, 2017 Page Solid Waste Management Facilities Study Final.docx There were some isolated instances where Sanborn Head observed children helping adults with their drop-off activities. In one instance during a high traffic demand period, two children were taking several loads of cardboard to the recycling building, crossing traffic from a parking location near the recyclable paper container (parking location 6). The children tended to run back to their vehicle after each drop-off, contributing to potential conflict points between vehicles and pedestrians. 5. Parallel parking is the predominant method used by residents when in the drop-off area (parking along the edge of the travelled way). On occasion, vehicles with trailer hitches visited the site and when parked in front of the recycling building or transfer station, would occupy two parking spaces, contributing to traffic congestion during high demand periods. 6. Sanborn Head observed some isolated cases where residents left their initial parking space to drive to the used clothing donation bin. The more remote location of the clothing bin demonstrates that when residents perceive a node as being further away than the distance they are prepared to walk, they will drive to the node for convenience sake. Given the limited parking availability near the transfer station and recycling building, having residents move their vehicles from that area to where the used clothing bin is located helps free-up parking in the higher-demand portion of the site. 7. It was common to observe instances where residents who needed to complete drop-off activities at multiple nodes would do so in a random, repetitive node-visiting manner. One example of this was a resident who parked in front of the transfer station and made eight trips to the different drop-off nodes in the following order: 1) recycling building; 2) recyclable paper container; 3) recycling building; 4) transfer station; 5) recycling building (dropping off swap shop items); 6) recyclable paper container; 7) recycling building; and 8) used clothing bin. The total time required to complete these drop-off activities was almost 15 minutes (see line item entries 33 through 38 of Table B-1). This again demonstrates how the facility serves as a single node from a parking perspective and then breaking down into a multi-node facility for a significant amount of pedestrian traffic. 8. The multiple pedestrian visits to different nodes speaks to an inefficiency in how material is disposed of at the existing facility, which is exacerbated by the fact that all locations are accessible from a single parking spot. The inefficiency related to pedestrians walking to the different nodes manifests itself in several ways, including: 1) extending the time residents spend on-site; 2) limiting the number of available parking spaces, particularly during peak demand periods; and 3) increasing the potential for vehicular and pedestrian conflicts. 9. In general, residents were observed spending most of their time at the recycling building. Much of this time is related to dropping-off their source separated recyclables in the building, consisting of aluminum cans, tin cans, cardboard, glass, and plastic containers. This time is often lengthened by the number of trips the residents make back and forth to their vehicles to retrieve the different recyclable materials. Many residents spend additional time in the building dropping off swap shop items. Many of these residents will stay in the building to look at and possibly retrieve swap shop items brought by others.
33 November 20, 2017 Page Solid Waste Management Facilities Study Final.docx Some residents were observed sorting and preparing their materials for drop-off while parked at the site. These activities included organizing items for donation at the swap shop and crushing cardboard boxes. Improvements to the facility layout may not alter this practice, but it could disperse it to locations where it would have a lesser impact on overall parking accessibility. 4.4 Conclusions As a result of the vehicular data recording and general user observations made during the August 19, 2017 site visit, Sanborn Head has drawn several conclusions that were used to guide the development of the conceptual site plan alternatives presented in Section 5. These conclusions are summarized below. 1. Facility improvements should focus on creating greater separation between the various drop-off nodes such that each node can provide sufficient parking capacity associated with the demands anticipated at that node. 2. The layout should promote organized and efficient traffic flow between nodes, and provide convenient residential access to each node from the node s parking area. 3. Layout modifications should focus on eliminating, to the greatest extent possible, an overlay of vehicular and pedestrian traffic. A fundamental consideration in this regard will be to create parking areas and access points to the drop-off nodes that eliminate pedestrians having to cross vehicular travel lanes. 4. As part of any modified or new facility layout, swap shop activities should be planned as a separate drop-off node. The layout and location of the node should be developed so that it provides sufficient parking for extended stay time and located in an area where it will not interfere with other drop-off operations. Limiting the hours of swap shop operations may also help control demands that can be placed on the node. 5. The maximum number of parking spaces occupied in the drop-off area was 12, as observed by Sanborn Head during the August 19, 2017 site visit. These spaces reflect the number required to support activities at all of the existing drop-off nodes. Therefore, by separating the nodes and creating individual parking areas for each (as recommended under Item 1), it follows that a lesser number of spaces at each node would be appropriate. Nevertheless, for planning purposes, 12 spaces per node (with the transfer station and recycling building serving as a single node) served as the current baseline for parking requirements at a new or modified facility. To account for future growth over a 30-year planning period, considerations for increasing parking space requirements by 60% (minimum of 20 spaces for the transfer station/recycling building node) should be factored into a new or modified facility layout, if possible. The 60% increase reflects the population growth predicted for New London between 2017 and Queuing capacity for a new or modified layout should remain at a minimum of 10 vehicles, where the queuing area would extend along the access road between the main public roadway and the proposed parking area for the first drop-off node (the transfer station/recycling building node). If possible, the queuing area should be increased to 16 spaces (60% increase over the 10-space minimum) to account for future growth over the 30-year planning period.
34 November 20, 2017 Page Solid Waste Management Facilities Study Final.docx SITE PLAN ALTERNATIVES 5.1 Summary of Concepts Evaluated Sanborn Head prepared conceptual site plans for three possible development scenarios. Two of the scenarios were focused on site improvements that could be achieved at the existing transfer station site on Newport Road and the third scenario was focused on preparing a conceptual site plan that would consolidate all of the Town s solid waste and recycling activities at a new site that has not yet been identified. Given the relatively small size of the existing transfer station site (approximately 5 acres), the intent of evaluating two separate development alternatives at the facility was aimed at estimating: 1. The optimal buildout that could theoretically be achieved if wetlands did not serve as a site constraint and if additional property could be obtained from the New Hampshire Department of Transportation (NHDOT) along Newport Road; compared to 2. The optimal buildout that could theoretically be achieved if development was restricted to within the existing property limits and wetland disruption (where wetlands are assumed to be present) is minimized. The above two scenarios represent Option 1 and Option 2, respectively, for the concept alternatives associated with the existing transfer station site. Option 3 presents a conceptual layout plan for consolidating all recycling and solid waste functions at a new site in Town. Since there is no site location associated with Option 3, there are no specific constraints, such as wetlands, ledge outcroppings, or other site features that need to be accounted for as part of the layout. To this end, Option 3 represents a consolidated operations concept model that is useful in identifying the approximate size of a parcel that would need to be obtained to support the proposed development. The main features associated with each option, as well as their respective limitations and other considerations, are summarized in Sections 5.2 through 5.4. The conceptual site plan for each option is provided in Appendix C and referenced as sheet C-1 through C-3, corresponding to Options 1 through Concept Option 1 Optimize Development at Existing Transfer Station Site through Acquisition of NHDOT Land The concept layout for Option 1 is shown on Sheet C-1 provided in Appendix C. The main features of this option include: 1. Acquiring approximately 0.55 acres of land from NHDOT located along a portion of Newport Road. 2. Constructing a new recycling building (115 feet by 100 feet i.e. a nine bunker bay facility) to accept source-separated recyclables; 3. Preserving and continuing to use the existing transfer station; 4. With the exception of glass, all recyclables brought to the proposed recycling building can be stored at the site for delivery to out-of-town markets (baled aluminum, baled plastic,
35 November 20, 2017 Page Solid Waste Management Facilities Study Final.docx and steel/tin containers would no longer need to be stored at the DPW facility on South Pleasant Street). Glass storage at the new building will be greater than that provided at the existing recycling building, however, the glass would still be delivered from the new building to the Shepherd Pit site for crushing. 5. Adding a vehicle weigh scale for weighing outgoing trailers (recyclables and solid waste); 6. Providing an area for yard waste and scrap metal drop-off (allowing these activities to be terminated at the existing site on Old Dump Road); and 7. Providing a dedicated area for a new swap shop. Sheet C-1 provides additional information on features associated with this option, including specific drop-off functions that are not provided for in the layout due to space limitations. Several limitations and other considerations associated with Option 1 are also outlined on Sheet C-1. It should be noted that since there is no current mapping of the transfer station site, the extent of wetlands on the property is unknown, although the Town has indicated that there are wetlands in the southern portion of the site. Option 1 was prepared on the assumption that, in the absence of knowing where wetlands are located, the full area could be proposed for development and any wetland replication requirements would need to be addressed at an offsite location, subject to state and local approval of this approach. With respect to stormwater management, Option 1 does not include stormwater provisions at this early planning stage. Water quality swales, bioretention areas, and other stormwater features will likely be required if this option was to be implemented and those features resulting in the least land area requirements should be prioritized. Stormwater provisions may require some drop-off area relocation from what is shown on Option 1, resulting in the need to develop the northeast corner of the site to accommodate some drop-off operations. Implementing the improvements associated with Option 1 will result in disruption to existing drop-off operations, principally the continued operation of the existing recycling building. The building will likely require demolition prior to constructing the new recycling building. Therefore, to allow residential drop-off of recyclables to continue while construction is ongoing, the recycling drop-off operations would likely need to be temporarily located to another portion of the site, where the recyclables may need to be commingled and not baled until such time that the drop-off activities can be relocated to the new recycling building. The details associated with sequencing construction activities to allow continued drop-off of recyclables and trash throughout the course of construction would be developed during the design phase for the project. At this conceptual planning stage, the ability to sequence construction in a manner that allows the facility to continue operating appears feasible, particularly given that this option preserves the continued operation of the existing transfer station. 5.3 Concept Option 2 Optimize Development within Existing Transfer Station Property Limits The concept layout for Option 2 is shown on Sheet C-2 provided in Appendix C. The main features of this option include: 1. Confining site improvements to within the limits of the existing transfer station property;
36 November 20, 2017 Page Solid Waste Management Facilities Study Final.docx Constructing a new transfer station/recycling building; 3. The recycling portion of the building (90 feet by 100 feet i.e. a seven bunker bay facility) will accept source-separated recyclables; 4. The transfer station portion of the building (55 feet by 50 feet) will accommodate an open-top transfer trailer that will be located in a trailer pit within the building where: a. residents can direct drop their trash into the trailer via pass-through windows in the building s exterior; and b. commercial vehicles can direct dump their waste into the trailer via the tipping floor portion of the building. 5. As with Option 1, all recyclables brought to the proposed recycling building with the exception of glass - can be stored at the site for delivery to out-of-town markets (baled aluminum, baled plastic, and steel/tin containers would no longer need to be stored at the DPW facility on South Pleasant Street). Glass storage at the new building will be greater than that provided at the existing recycling building, however, the glass would still be delivered from the new building to the Shepherd Pit site for crushing. 6. Adding a vehicle weigh scale for weighing outgoing trailers (recyclables and solid waste); 7. Providing a drop-off area for asphalt shingles, bulky waste (furniture, mattresses, etc.), lumber debris; and concrete debris; and 8. Providing a dedicated area for a new swap shop (with greater parking and a more remote location than Option 1). Sheet C-2 provides additional information on features associated with this option, including specific drop-off functions that are not provided for in the layout due to space limitations. Several limitations and other considerations associated with Option 2 are also outlined on Sheet C-2. Option 2 was prepared on the assumption that the proposed development in the southern portion of the site (the asphalt shingle, bulky waste, lumber debris and concrete debris drop-off area) can be performed without impacting wetlands that may be located in this general area. In the event wetlands are located within the limit of the proposed drop-off area, it is assumed this area would not be constructed. As with Option 1, Option 2 does not include stormwater management provisions. Water quality swales, bioretention areas, and other stormwater features will likely be required if this option was to be implemented and those features resulting in the least land area requirements should be prioritized. For Option 2 it is assumed that stormwater management systems would be constructed in the southern-most portion of the site. Similar to Option 1, implementing the improvements associated with Option 2 will result in disruption to existing drop-off operations, however these disruptions will be more extensive as they also involve demolition and reconstruction of the transfer station. Construction of the new recycling building and transfer station and the disruption this will cause in the center portion of the site may make it difficult to sequence construction activities so that the facility can remain open during construction. Although maintaining operations may be possible, at this conceptual planning level, it is more appropriate to assume a temporary shut-down of existing operations
37 November 20, 2017 Page Solid Waste Management Facilities Study Final.docx would be required in connection with Option 2. Evaluating construction sequencing concepts aimed at maintaining existing operations would be evaluated further during the design phase. If the sequencing concepts indicate that all drop-off operations cannot be maintained throughout construction, the intent of the sequencing plan would be to identify the duration required for a temporary shutdown of all or some of these operations. 5.4 Concept Option 3 Consolidate Operations at New Site The concept layout for Option 3 is shown on Sheet C-3 provided in Appendix C. The main features of this option include: 1. Consolidating all of the Town s current solid waste and recycling operations including yard waste and scrap metal operations currently performed at the Old Dump Road site to a new, as yet identified, site in Town; 2. Constructing a new transfer station/recycling building; 3. The recycling portion of the building (115 feet by 100 feet i.e. a nine bunker bay facility) will accept source-separated recyclables; 4. The transfer station portion of the building ( T -shaped with an area of approximately 1,200 square feet) will function similar to the current transfer station using a compactor and compaction trailers to handle waste, where: a. residents can direct drop their trash into the trailer via pass-through windows in the building s exterior; b. commercial vehicles can direct dump their waste into a compactor hopper that will feed a closed-top compaction trailer; and c. an office space will be suspended above the compaction trailer, similar to the current transfer station office configuration. 5. As with Options 1 and 2, all recyclables brought to the proposed recycling building with the exception of glass - can be stored at the site for delivery to out-of-town markets (baled aluminum, baled plastic, and steel/tin containers would no longer need to be stored at the DPW facility on South Pleasant Street). Glass storage at the new building will be greater than that provided at the existing recycling building, but the glass would still be delivered from the new building to the Shepherd Pit site for crushing. 6. Providing a 2.3-acre Yard Waste, Scrap Metal & Bulky Waste Drop-off Area with locations for: a. leaf, grass, brush, and pine needle drop-off; b. composting area for leaves and grass; c. finished compost area and sawdust drop-off/pickup area; d. scrap metal drop-off, including refrigerators and other white goods, bulky scrap metal, and light metal; e. concrete debris drop-off; f. bulky waste, lumber debris and asphalt shingle disposal; and g. DPW materials including ditching spoils, brush, and street sweepings.
38 November 20, 2017 Page Solid Waste Management Facilities Study Final.docx Providing a Miscellaneous Materials Drop-off Area for items such as propane tanks, waste oil, electronic waste, fluorescent bulbs, used clothes, used books, and tires; 8. A vehicle weigh scale for weighing outgoing trailers (recyclables and solid waste) with layout flexibility that could accommodate weighing of commercial vehicles visiting the transfer station; 9. Providing a dedicated swap shop area separated from other drop-off operations on-site; and 10. Providing an area of approximately 1 acre for stormwater management, conceptually sized to account for the extent of imperious surface (paved and gravel areas) associated with this option. Sheet C-3 provides additional information on features associated with this option. For planning purposes, a 50-foot setback was placed around the limit of proposed development (including stormwater area). The setback is intended to provide a buffer around the entirety of the facility and the 50-foot distance was selected to coincide with the property line setback referenced in NHDES regulations for Collection, Storage, and Transfer (C/S/T) facilities. Based on the proposed limits of development and including the 50-foot setback, the area required for Option 3 is approximately 11 acres. If the setback area was to be reduced, the total area requirements for Option 3 could be reduced accordingly. However, for planning purposes, and given that an actual site is likely to present siting constraints (for example wetlands) that may impact final layout, 11 acres is recommended as a minimum area requirement for the new site development option. 5.5 Opinion of Construction Cost Sanborn Head has prepared planning level opinions of construction cost for the three concept options. These opinions of cost are intended to be order-of-magnitude estimates to assist the Town in evaluating and comparing the relative costs associated with each option, recognizing that the costs have been prepared with minimal site information for the existing transfer station (no subsurface or topographic information for Options 1 and 2) and in the case of Option 3, prepared as a concept model where the layout is not configured to any specific site or site constraints. In the absence of information that can be used to refine earthwork and other construction costs, and where building and layout at this stage is at the schematic level, it is appropriate to include a conservative estimating contingency to cover the degree of unknowns associated with each option. To this end, the opinions of construction cost for each option include a 30% estimating contingency on site and building costs. A 10% contingency is included on equipment items (truck scale, baler, and compactor). The costs for each option are summarized in Table 5.1.
39 November 20, 2017 Page Solid Waste Management Facilities Study Final.docx Table 5.1 Conceptual-Level Construction Costs Options 1, 2 and 3 Option Opinion of Construction Cost 1. Optimize Development at Existing Transfer Station Site through Acquisition of NHDOT Land 2. Optimize Development within Existing Transfer Station Property Limits $5,342,000 See Note 1 $6,173,000 See Note 1 $7,178, Consolidate Operations at New Site (Does not include land acquisition cost) See Notes 1 and 2 1. Cost includes pit-style truck scale and 30 horsepower dual ram baler manufactured by International Baler, Model No. TR Cost includes installation of new WASTEC-rated 6.85 cubic yard stationary compactor manufactured by Wastequip, Model No. 1000HD (same as compactor currently in use at existing transfer station). 3. Opinions of cost were prepared using unit costs from RS Means construction cost data (2015) and NHDOT weighted average unit prices for projects between April 1, 2016 and March 31, An itemized breakdown of the costs for each option is provided in Table D-1 of Appendix D.
40 November 20, 2017 Page Solid Waste Management Facilities Study Final.docx REGIONAL OPPORTUNITIES 6.1 Overview As New London considers opportunities for improving its solid waste and recycling infrastructure, it has occurred to the Town that issues they are faced with may also be present in their neighboring communities. Small site size combined with limited space to store materials could be creating operational issues for Towns near New London, and if so perhaps a regional solution may be worth pursuing. To this end, one of the objectives of the Solid Waste Management Facilities Study is to identify whether there may be interest among nearby Towns to deliver their waste and recyclables to a regional facility. The scope of the regionalization inquiry is intended to be limited recognizing that the focus of the Solid Waste Management Facilities Study is aimed at evaluating New London s operations and how best to improve them locally as a Town-only resource. As such, the exploration of a regional alternative at this early planning stage is intended to provide New London with initial feedback on community interest and general administrative considerations associated with the concept. As coordinated with the Town, the initial inquiry into the regionalization concept was based on the following approach: 1. The facility would be located in New London; 2. Interest in regionalization will be gauged by contacting representatives from Wilmot and Andover who are familiar with their existing solid waste and recycling operations; and 3. Administrative considerations associated with regionalization will be based on the organizational structure of the B.C.E.P. Solid Waste District, comprised of the towns of Barnstead, Chichester, Epsom, and Pittsfield, New Hampshire. The remainder of this section addresses the results of Sanborn Head s inquiry into regionalization. With respect to soliciting feedback from Wilmot and Andover, it is helpful to know where their transfer stations are located relative to each other and relative to the New London Transfer Station. The locations of the three facilities are shown on Figure 10. The figure also depicts an enlarged aerial view of the Andover and Wilmot facilities, providing an indication of the extent of the operations performed at each site. 6.2 Regionalization Interest Town of Wilmot The Town of Wilmot transfer station and recycling center is a small facility located on Route 11 near the Wilmot/Andover town line. The site is open Wednesdays and Saturdays from 8:00 am to 4:00 pm and serves a community of 1,358 residents (2010 Census). The Wilmot Highway Department is responsible for the operation of the transfer station. Sanborn Head contacted the Wilmot road agent to discuss the operation of the existing facility and identify whether there may be interest in being part of a regional transfer station and recycling facility located in New London. Based on information provided by the road agent, use of the site is limited to residents-only. The site supports drop-off of the following materials: household trash; commingled plastic and metal
41 November 20, 2017 Page Solid Waste Management Facilities Study Final.docx containers; commingled cardboard and other paper; construction and demolition debris (C&D); glass; scrap metal; and electronic waste. Residents dispose of their trash in an outdoor compactor that discharges to a 50 cubic yard compaction container. Residents drop-off commingled plastic and metal, commingled cardboard and paper, and C&D in at-grade roll-off containers, while glass is deposited in an at-grade bunker bay. Electronic waste is stored in a Conex container, and scrap metal is dropped off in a metal pile. The road agent stated that their trash container is hauled weekly with an average weight of 8 tons per haul, equating to an annual trash tonnage of approximately 400 tons per year. He was unable to provide the quantity of household recyclables generated by the Town. He noted that the operating budget for the facility is approximately $100,000 per year. Although the drop-off area is fairly small (approximately half-an-acre) the road agent stated that there are no traffic or public safety issues at the site. The only operational improvement the Town is considering is the construction of a pole building or canopy over the open-top roll-off containers to protect them from snow. The agent s overall opinion was that the facility functions well, has no space constraints, and works well for the residents. Given this, he did not see how Wilmot would benefit from being part of a regional facility or what would motivate them to move in that direction. He also did not anticipate much support from the residents, particularly if it meant driving further to visit a regional facility Town of Andover The Town of Andover transfer station and recycling center is a larger facility than Wilmot, with a drop-off area that encompasses approximately 2.5 acres. The facility is located at 640 Main Street (Route 11), approximately 1.3 miles from the Wilmot transfer station. The site is open Wednesdays from 7:00 am to 6:00 pm and Saturdays from 7:00 am to 5:00 pm and serves a community of 2,371 residents (2010 Census). The site supports the drop-off of the following materials: household trash; commingled plastic, metal and paper; glass; scrap metal; tires; electronic waste; fluorescent bulbs; C&D debris; and yard waste. Residents dispose of their trash in an outdoor compactor that discharges to a closedtop transfer trailer (similar to the trailers used in New London). Residents drop off commingled plastic, metal and paper in a compactor that discharges into a compaction container. Glass, scrap metal, and C&D is stored in open-top roll-off containers and tires are stored in a semi-trailer. Electronic waste and fluorescent bulbs are stored in an enclosed building located in the center of the drop-off area, where the commingled recycling compactor and glass roll-off containers are also located. The facility is operated under the authority of the Board of Selectman and managed by the Transfer Station Supervisor. Sanborn Head contacted the Andover Chair of the Board of Selectmen to discuss current operational issues at their transfer station and possible Town interest in regionalization. With respect to operational issues, the Chair noted that the layout of the facility is not optimal and there are areas of vehicular and pedestrian conflict that is cause for safety concern. The Chair commented that the Town is interested in evaluating layout modifications that will improve operational efficiency and address safety concerns in connection with the residential drop-off activities. The Chair further commented that Andover could be interested in regionalization, but the general feeling of the current board is that this presents a number of unknowns, of which the equity in cost-sharing is a primary consideration. The Chair also noted that the Town s operating budget for the facility is approximately $198,000 per year.
42 November 20, 2017 Page Solid Waste Management Facilities Study Final.docx Administrative Considerations In the event the Town of New London and other nearby communities were to join together to create a regional facility for solid waste and recyclables management, the administration of the facility would likely be defined in a multilateral inter-municipal agreement between the member communities. For the purposes of exploring typical administrative issues that New London should be aware of as part of its evaluation of a regional alternative, Sanborn Head has referred to the governance provisions outlined in the inter-municipal Solid Waste District Agreement created by the Towns of Barnstead, Chichester, Epsom, and Pittsfield, New Hampshire. These four communities created the B.C.E.P. Solid Waste District in 1992 and entered into the Solid Waste District Agreement that year. The provisions of the agreement addressing District management, cost sharing, budgeting, and host community considerations are highlighted below and are intended to serve as a guide for how these issues would be addressed in a similar manner for a regional facility located in New London. 1. Provision for Sharing Construction Cost: Sanborn Head contacted B.C.E.P. in an effort to confirm how they allocated the cost of constructing the facility amongst the member communities. The District Administrator did not have the history to advise how this was accomplished. For planning purposes, this cost could be allocated similar to how operational costs are allocated: on a pro-rated basis by population of the member communities. 2. Operation Costs of Facility: Each member community bears the operating, capital, and other costs of the facility prorated upon the basis of their respective populations as indicated by the most recent census by the State of New Hampshire. 3. Solid Waste District Committee: The District Committee consists of three members appointed from each member community. One member is a current member of the Board of Selectmen and serves a one year term. The other two members from each community must be residents of the community and are appointed for a two-year term. 4. Authority of District Committee Members: Each member has equal authority and carries one vote, with the exception that only Board of Selectmen members and/or the Treasurer have the authority to sign checks for expenditures by the facility. A quorum shall be defined as at least one representative from each of any three member towns. A simple majority of the members present shall be sufficient for the transaction of business, after a quorum has been obtained. The committee has the authority to manage all aspects of the operation of the Solid Waste District. 5. Budget Committee and Adoption of Annual Budget: A separate budget committee serves as an advisory group to the District Committee. The budget committee consists of one person from each member community, where these individuals are appointed by the Board of Selectmen in their respective towns. The District Committee, in cooperation with the budget committee, prepares preliminary budget and apportionments for each member community for the upcoming year. A public hearing is then held to receive public comments on the preliminary budget. Following public comment, the District Committee determines its final budget and certifies the apportionment to each member community.
43 November 20, 2017 Page Solid Waste Management Facilities Study Final.docx Administration: The District Committee may select an administrator for the facility to serve at the Committee's discretion. The District Administrator is authorized to manage the financial and operational aspects of the District. 7. Committee Meetings: The District Committee meets a minimum of once monthly. 8. Host Community Services Fee: The Town of Pittsfield, as the host community, bears responsibility to provide to the District fire, police and other services. In recognition of these services, the District pays Pittsfield an annual fee that increases each year by the Consumer Price Index. The services fee paid by the District to Pittsfield in 2016 was $10,272. To help provide additional context regarding operating costs and income for a regional facility, Sanborn Head has summarized the B.C.E.P. budget for 2016, where this information can be interpreted relative to the population of the four communities that form the B.C.E.P. Solid Waste District. The population of the four member communities is 15,788 (2010 Census) and the 2016 operating budget is summarized in Table 6.1. Table 6.1 B.C.E.P 2016 Operating Budget Income General (disposal fees, etc.) $250,574 Recycling $120,841 Tax Revenue from Member Communities $580,195 Total Income $951,610 $951,610 Expenses Administrative $148,063 Capital (equipment) $16,875 Hauling $267,560 Maintenance $54,905 Operations $477,527 Total Expenses $964,930 $964,930 Net Operating Expense $13, Population of the B.C.E.P. member communities is 15,788 (2010 Census). 6.4 Facility Sizing Considerations If Wilmot and Andover were to be part of a regional district with New London, Option 3 presented in Section 5 would reasonably represent the type of facility that could serve a regional need. To provide an initial interpretation on additional tonnage of trash and recyclables that would be brought to the facility, Sanborn Head used the 2016 per-capita generation rates calculated for New London (see Table 2.1) and applied these rates to the populations of Wilmot and Andover. Their combined estimated tonnage is approximately 80% of the current tonnage associated with New London. The current tonnage estimates for Wilmot and Andover are summarized in Table 6.2.
44 November 20, 2017 Page Solid Waste Management Facilities Study Final.docx Table Tonnage Estimates for Wilmot and Andover Using New London Generation Rates Town Population 1 Per Capita Generation Rates 2 Trash Household Recyclables 3 Tonnage Estimates Trash Household Recyclables 3 Wilmot 1, Andover 2, , Totals 3,729 1, New London (for comparison) 4, , Population for Wilmot and Andover is from the 2010 Census. New London population reflects 2016 estimate, which is based on 2015 New Hampshire Office of Energy and Planning estimate, increased by an average annual growth rate calculated between 2010 and 2015 and extended one year to estimate the 2016 population. 2. Per capita generations rates (lbs/person/day) are those calculated by Sanborn Head for New London (see Table 2.1) and applied to the populations of Wilmot and Andover. 3. Household recyclables are defined herein as glass, metal containers, plastic containers, and paper. The tonnage contributions from Wilmot and Andover would not require the proposed recycling building presented in Option 3 to be enlarged because there is sufficient handling and storage capacity provided within the structure (the increased tonnage would only translate to an increased rate of baled material being hauled from the facility). However, what cannot be confirmed at this stage is the impact the added traffic from Wilmot and Andover would have on the facility. Additional traffic count information should be collected at both sites to interpret whether additional parking and queuing capacity may need to be factored into the design for a regional facility. This could have an impact on the preferred layout of the transfer station, where increased residential access to the building may be needed (similar to what is provided under the Option 2 concept, where residents can access the full length of a long-haul trash trailer).
45 November 20, 2017 Page Solid Waste Management Facilities Study Final.docx NEXT STEPS The results of the Study, specifically the facility layout options presented in Section 5, as well as the regionalization considerations presented in Section 6, provide New London with planninglevel information that will help the Town chart a path towards implementing long-term improvements to its solid waste and recycling operations. Putting the regionalization concept aside, the fundamental consideration is whether the Town views the existing transfer station site on Newport Road as a preferred location to expand and improve its existing operations, or whether the potential challenges associated with consolidating all or most of the trash and recycling operations to this site makes the identification of a new site a more attractive alternative. The intent of Option 1 is to show that, with the acquisition of a portion of abutting NHDOT land, the site can support significant facility improvements, including an area for yard waste and scrap metal drop-off. Option 1 assumes that wetlands would not limit the ability to develop the southern portion of the site, and that a sufficient area for stormwater management can be found. The intent of Option 2 is to show that even without the acquisition of the NHDOT land - the existing transfer station site can support a number of facility improvements, however, relocating yard waste and scrap metal activities to the site would not be viable, particularly if wetlands are confirmed to be present in the southern portion of the site. Option 3 has the advantage of accommodating all of the Town s operations at a single site, with the limitation that a site of sufficient size (approximately 11 acres) would need to be identified and its location supported by the residents. Option 3 may also present the best alternative if the Town is interested in pursuing a regional approach to waste and recycling management. Given the above considerations, Sanborn Head recommends the Town take the next steps to further its evaluation of the options presented: 1. If the Town is interested in further evaluating the development potential at the existing transfer station site, we recommend that an existing conditions topographic survey, including wetland mapping, be performed for the entirety of the parcel. This information can then be used to identify actual site constraints that may impact the extent of improvements that can be achieved at the site. 2. Using the existing conditions survey, an initial evaluation of stormwater management systems should be explored in connection with the Town s preferred site development option. The evaluation would be aimed at identifying methods for managing stormwater in a manner that requires the least land area and works in concert, to the greatest extent possible, with the preferred development option. 3. If the results of the topographic mapping confirms that wetlands are located in proposed development areas, we recommend the Town meet with representatives from the local conservation commission to discuss the mapping and concepts related to the proposed development. This initial coordination activity at the local level may warrant a follow-up coordination meeting with the New Hampshire Department of Environmental Services to identify strategies that could accomplish the development goals while complying with wetland protection requirements.
46 November 20, 2017 Page Solid Waste Management Facilities Study Final.docx In connection with Item 1, we recommend discussions be held with representatives from the New Hampshire Department of Transportation to identify whether NHDOT would entertain a transfer of some of its land to the Town and, if so, to confirm the process and timing associated with such a transfer. 5. If the Town is interested in further evaluating a regional alternative, consider broadening the communities it may wish to include in this effort. New London has shown interest in the concept of regionalization because of the issues the Town is currently facing with respect to expanding and improving its existing operations. We recommend the Town identify whether any nearby communities are confronted with similar issues as those in New London. This could establish a common ground with other communities that would promote their interest in considering a regional approach. 6. From Sanborn Head s initial inquiry of Wilmot and Andover, Wilmot does not appear to be contending with any notable operational issues at their transfer station site, therefore Wilmot does not appear to be a viable candidate for regionalization at the present time. By comparison, Andover is experiencing some issues with its current layout, although these issues appear to be less due to space constraints and more related to general layout of their drop-off area. For this reason, there may be more potential in furthering a regionalization discussion with Andover, given the Town s interest in modifying its existing facility layout. P:\4200s\ \Source Files\Report\ Solid Waste Management Facilities Study_Final.docx
47 FIGURES
48 COMMERCIAL DROP-OFF AT TRANSFER STATION & RECYCLING CENTER RESIDENTIAL DROP-OFF AT TRANSFER STATION & RECYCLING CENTER COMMERCIAL DROP-OFF AT TRANSFER STATION & RECYCLING CENTER Trash Trash ONP/Mixed Paper Glass Tin Cans and Foil Aluminum Cans No. 1 Plastic No. 2 Plastic OCC OCC On Tuesdays & Fridays One Packer Truck from Casella and One from Naughton & Sons Direct Dump into Compactor Hopper Average of Two Full Compaction Trailers Hauled from Transfer Station Each Week (hauled to Meredith TS for further transfer to Berlin) Direct Dump into Compactor Hopper via TS Pass- Thru Windows RESIDENTIAL RECYCLING DROP-OFF AT OTHER TOWN LOCATIONS Brush and Metal Disposal Electronic Waste (fee charged) & Used Motor Oil 30 yd walkin roll-off container Container Hauled from Transfer Station every 7 to 9 Operating Days (Naughton hauls to Casella Recycling Facility in White River Junction) 50 Gal Barrel Weigh Barrels on Portable Scale Hand-Dump Barrels (12 to 15) into 1 Ton Truck (loading performed at loading bay at rear of building) 50 Gal Barrel Clean Material Sorted into Black Boxes Weigh Box on Portable Scale Load Boxes (2 max) onto 1 Ton Truck with Fork Lift (loading performed in front of building) Out-of-State Redeemables Sorted into Bags 50 Gal Barrel Clean Material Sorted into Black Boxes Sorted Redeemables Placed in Bags and Stored On- Site in Cottage House Redeemables Hauled from Site by Private Contractor (Hauled to VT) 50 Gal Barrel Clean Material Sorted into Black Boxes Vertical Baler A (for Al and Plastic) Weigh Bale on Portable Scale Load Bales (2 max) onto 1 Ton Truck with Fork Lift (loading performed in front of building) Black Box Bin Sort out Contaminants Wood Caster Bin Sort out Contaminants Vertical Baler B (for OCC) Bobcat Hauls Bale to on-site Trailer (rented) 63 Bale Capacity Hauled from Site Approx Every 60 Days (disposal location identified by NRRA) On Fridays Packer Truck from Naughton & Sons Dumps OCC Load in Front of Building Clean Material Sorted into Wood Caster Bin Drop-off at Old Landfill on Old Dump Road Drop-off at Public Works Department Material Handling Location Trash Handling Activities Recyclables Handling Activities Haul to Shepherd Pit (Regional NRRA storage location for glass crushed annually. Crushed material mixed with gravel and used by DPW for road repairs) Haul to Public Works Department Dump Material in Storage Bay where DPW Crushes it with a Loader DPW 10-Wheel Dump Truck Hauls Material to Claremont (American Recycling) Baled Aluminum Haul to Public Works Department Store Bales in Bale Storage Building Long Haul Trailer Both Grades of Plastic Bales Hauled on Same Trailer (disposal location identified by NRRA) SANBORN November 2017 Project No: Figure 1 MATERIAL HANDLING FLOW DIAGRAM FOR SOLID WASTE & RECYCLABLES (EXISTING TOWN OPERATIONS) HEAD Baling Solid Waste Management Facilities Study Town of New London, New Hampshire
 YARD")


 FILE: P:\4200s\4220.")
49 c 2017 SANBORN, HEAD & ASSOCIATES, INC. Figure 2 LOCUS PLAN OF TOWN SOLID WASTE & RECYCLING SITES TRANSFER STATION AND RECYCLING FACILITY, NEWPORT ROAD (SEE FIGURE 3) YARD WASTE AND SCRAP METAL DROP-OFF AREA, OLD DUMP ROAD (SEE FIGURE 5) SPRINGFIELD WILMOT Solid Waste Management Facilities Study Town of New London, New Hampshire Notes Drawn By: C. Murphy Designed By: C. Murphy Reviewed By: S. Wright Project No: Date: November Town base map shown on Figure 1 is from the 2017 Town of New London Zoning Map, available online at IMAGES: P:\4200s\ \Graphics Files\CAD\XRefs\18_S_Pleasant.png P:\4200s\ \PDF Figures\Locus\2017 Zoning map image.png SUNAPEE XREFS: SUTTON GLASS CRUSHING SITE, SHEPHERD PIT, MOUNTAIN ROAD (SEE FIGURE 6) FILE: P:\4200s\ \Graphics Files\CAD\Work\New London Locus Plan.dwg LAYOUT: LOCUS USER: cmurphy PLOT DATE: :44 AM NEWBURY MISCELLANEOUS RECYCLABLES DROP-OFF & STORAGE DPW FACILITY, SOUTH PLEASANT STREET (SEE FIGURE 4) GRAPHICAL SCALE 1500' 750' 0' 1500' 3000' SANBORN HEAD
50 c 2017 SANBORN, HEAD & ASSOCIATES, INC. Figure 3 TRANSFER STATION & RECYCLING CENTER, NEWPORT ROAD NEWPORT ROAD Solid Waste Management Facilities Study Town of New London, New Hampshire Notes Drawn By: C. Murphy Designed By: C. Murphy Reviewed By: S. Wright Project No: Date: November Roadway, building, and other site features are based on aerial imagery of site area (Google Earth, April 2011) with field measurement checks of selected features performed by Sanborn Head on July 11, IMAGES: P:\4200s\ \Graphics Files\CAD\XRefs\ESRI_NewLondon_TS.png P:\4200s\ \Graphics Files\CAD\XRefs\T station whole property google earth.jpg TOWN OF NEW LONDON 4.8 AC. RECYCLING BUILDING "COTTAGE" STORAGE BUILDING USED CLOTHING DROP-OFF ENTRANCE GATE 2. Property line information, lot acreage, and lot ownership obtained from Town of New London assessors office, online mapping tools, "Tri-Town, NH." 3. All information shown on this figure depicts approximate site conditions and has been compiled by Sanborn Head solely for reference and planning purposes in support of the Solid Waste Management Facilities Study. OFF RAMP (RT. 89) TRANSFER TRAILER NEWSPAPER/MIXED PAPER ROLL-OFF Legend APPROXIMATE PROPERTY LINE TRANSFER STATION BUILDING/STRUCTURE EDGE OF PAVED ROADWAY ON-SITE PAVEMENT AREA XREFS: CARDBOARD TRAILER CROZER GEORGE & KATHARINE 25.2 AC. TREELINE TREE GRAVEL AREA CONCRETE RETAINING WALL STONE RETAINING WALL FILE: P:\4200s\ \Graphics Files\CAD\Work\Transfer Station Drawings\T Station Existing Layout.dwg LAYOUT: 30 scale_no image USER: cmurphy PLOT DATE: :55 AM UTILITY POLE GRAPHICAL SCALE 30' 15' 0' 30' SANBORN 60' HEAD
51 c 2017 SANBORN, HEAD & ASSOCIATES, INC. PUBLIC SERVICE OF NH 0.9AC MCCULLOUGH TIMOTHY & ERICA 5.02AC Figure 4 MISC. RECYCLABLES DROP-OFF & STORAGE DPW FACILITY, SOUTH PLEASANT STREET Solid Waste Management Facilities Study Town of New London, New Hampshire IMAGES: P:\4200s\ \Graphics Files\CAD\XRefs\18_S_Pleasant.png P:\4200s\ \Graphics Files\CAD\XRefs\DPW google maps.png HAMEL PETER & MELISSA 8.4AC TOWN OF NEW LONDON 4.13AC TOWN OF NEW LONDON 4.01AC BALE STORAGE AREA FOR ALUMINUM & PLASTICS BALER AT TRANSFER STATION STORAGE TENT STORAGE BUILDING ROLL-OFF CONTAINERS DPW VEHICLE MAINTENANCE BUILDING TIN/STEEL DROP-OFF BAY DPW MATERIAL STORAGE BAYS (6) DPW GARAGE & OFFICE SANDER RACK ELECTRONICS (E-WASTE) DROP-OFF AT OFFICE (SEE NOTE 3) SOUTH PLEASANT STREET JACKSON PAUL & TERESA 2.01AC SKUNK HOLLOW ENTERPRISES LLC 19.94AC FERREIRA DANIEL & JUDITH TRUSTS 0.6AC Notes Legend Drawn By: C. Murphy Designed By: C. Murphy Reviewed By: S. Wright Project No: Date: November Roadway, building, and other site features are based on aerial imagery of site area (Google Maps, 2017). 2. Property line information, lot acreage, and lot ownership obtained from Town of New London assessors office, online mapping tools, "Tri-Town, NH." 3. Electronics waste drop-off requires residents to pay a fee. E-waste items accepted at DPW consist of computer monitors, televisions, microwaves, CPU's, & printers. APPROXIMATE PROPERTY LINE XREFS: PUBLIC SERVICE OF NH 0.2AC NORTHWIND SECURITY PRODUCTS LLC 1.0AC BUILDING/STRUCTURE EDGE OF PAVED ROADWAY FENCE ELECTRICAL UTILITY EASEMENT TREELINE CONCRETE RETAINING WALL NORTHWIND SECURITY PRODUCTS LLC 1.0AC ON-SITE PAVEMENT AREA FILE: P:\4200s\ \Graphics Files\CAD\Work\Figure 4 DPW Layout.dwg LAYOUT: 30 scale_no image USER: cmurphy PLOT DATE: :18 PM HOGLUND PETER R & KAREN B 6.01AC GRAPHICAL SCALE 40' 20' 0' 40' SANBORN 80' HEAD
52 c 2017 SANBORN, HEAD & ASSOCIATES, INC. NEW LONDON SPFLD WATER PRECNCT 1.36AC STATE OF NEW HAMPSHIRE 15.4AC Figure 5 YARD WASTE AND SCRAP METAL DROP-OFF AREA, OLD DUMP ROAD FINISHED COMPOST PILE APPROXIMATE LIMIT OF DROP-OFF AREA : ±1.8 AC Solid Waste Management Facilities Study Town of New London, New Hampshire Drawn By: C. Murphy Designed By: C. Murphy Reviewed By: S. Wright Project No: Date: November 2017 IMAGES: P:\4200s\ \Graphics Files\CAD\XRefs\old dump road google maps.png P:\4200s\ \Graphics Files\CAD\XRefs\Old_Dump_Rd.png PINE NEEDLE STOCKPILES ENTRANCE GATE SAW DUST STOCKPILE PROPANE TANK DISPOSAL BRUSH STOCKPILE SHED LEAF AND GRASS DROP-OFF PILE BULK SCRAP METAL STOCKPILE RAW (IN PROCESS) LEAF AND GRASS COMPOST PILE REFRIGERATOR DISPOSAL AREA WASHING MACHINE/ OVEN/WATER HEATER DISPOSAL AREA TOWN OF NEW LONDON 6.4AC Notes 1. Roadway, building, and other site features are based on aerial imagery of site area (Google Earth, April 2011) with field measurement checks of selected features performed by Sanborn Head on July 11, All information shown on this figure depicts approximate site conditions and has been compiled by Sanborn Head solely for reference and planning purposes in support of the Solid Waste Management Facilities Study. STREET SWEEPINGS STOCKPILE DITCHING MATERIAL/ BRUSH STOCKPILE TREE BUTTS AND BRUSH STOCKPILE LIGHT SCRAP METAL STOCKPILE XREFS: BADMINGTON RICHARDS R & CATHERINE S 8.87AC Legend APPROXIMATE PROPERTY LINE BUILDING/STRUCTURE EDGE OF PAVED ROADWAY GRAVEL AREA TREELINE FILE: P:\4200s\ \Graphics Files\CAD\Work\Old Dump Road ConceptualLayout_July2017.dwg LAYOUT: 30 scale_no image USER: cmurphy PLOT DATE: :04 AM BUCKLIN CHARLES M FAMILY TRUST 47.78AC METAL DROP-OFF AREAS GRAPHICAL SCALE 30' 15' 0' 30' 60' SANBORN HEAD
53 c 2017 SANBORN, HEAD & ASSOCIATES, INC. SPEAR WILLIAM F & PAMELA A 15.76AC NEW LONDON SUTTON Figure 6 GLASS CRUSHING SITE, SHEPHERD PIT, MOUNTAIN ROAD Solid Waste Management Facilities Study Town of New London, New Hampshire CANANE EDWARD & CYNTHIA 15.18AC Drawn By: C. Murphy Designed By: C. Murphy Reviewed By: S. Wright Project No: Date: November 2017 MISC. BRUSH/TREE/WOODCHIP AREA Notes IMAGES: P:\4200s\ \Graphics Files\CAD\XRefs\Mountain Road assessors map.png P:\4200s\ \Graphics Files\CAD\XRefs\Mtn_Rd.png..\XRefs\Shepherds pit google maps.png VEHICLE DUMPING AREA FOR GLASS LOADS EARTHEN SLOPE GLASS DROP-OFF AREA GRANITE CURBING STORAGE AREA STUMP/BOULDER STOCKPILE CRUSHED GLASS STOCKPILE BRUSH STOCKPILE WOOD DEBRIS/DEMO STOCKPILE NEW LONDON POLICE DEPT. SHOOTING RANGE APPROXIMATE LIMIT OF SHEPHERD PIT OPERATIONS: ±6.65AC 1. Roadway, building, and other site features are based on aerial imagery of site area (Google Earth, April 2011) with field measurement checks of selected features performed by Sanborn Head on July 11, All information shown on this figure depicts approximate site conditions and has been compiled by Sanborn Head solely for reference and planning purposes in support of the Solid Waste Management Facilities Study. TOWN OF NEW LONDON 53.3AC ROAD DEBRIS STOCKPILE WOOD CHIP STOCKPILE CRUSHED GLASS STOCKPILE CONEX BOX Legend TOWN LINE APPROXIMATE PROPERTY LINE XREFS: TREELINE TREE SHEPHERD PIT OPERATIONS LIMIT GRAVEL AREA MOUNTAIN ROAD ON-SITE PAVEMENT AREA FILE: P:\4200s\ \Graphics Files\CAD\Work\Figure 6 Shepherd Pit Layout.dwg LAYOUT: 50 scale_ no image USER: cmurphy PLOT DATE: :42 AM TOWN LAND (53.3 AC) PROPERTY LOCUS GLASS HANDLING AREAS GRAPHICAL SCALE 50' 25' 0' 50' 100' SANBORN HEAD
54 c 2017 SANBORN, HEAD & ASSOCIATES, INC. VEHICLE ACCESS & PARKING PLAN, EXISTING TRANSFER STATION & RECYCLING CENTER Solid Waste Management Facilities Study Town of New London, New Hampshire Notes Figure 7 Drawn By: C. Murphy Designed By: C. Murphy Reviewed By: S. Wright Project No: Date: November Roadway, building, and other site features are based on aerial imagery of site area (Google Earth, April 2011) with field measurement checks of selected features performed by Sanborn Head on July 11, Property line information, lot acreage, and lot ownership obtained from Town of New London assessors office, online mapping tools, "Tri-Town, NH." IMAGES: P:\4200s\ \Graphics Files\CAD\XRefs\ESRI_NewLondon_TS.png 3. All information shown on this figure depicts approximate site conditions and has been compiled by Sanborn Head solely for reference and planning purposes in support of the Solid Waste Management Facilities Study. Legend APPROXIMATE PROPERTY LINE BUILDING/STRUCTURE EDGE OF PAVED ROADWAY TREELINE TREE GRAVEL AREA CONCRETE RETAINING WALL STONE RETAINING WALL UTILITY POLE TRAFFIC CONE XREFS: O OBS-1 PRIMARY TRAFFIC OBSERVATION LOCATIONS (SANBORN HEAD OBSERVER LOCATION) DRIVE-THROUGH LANE FILE: P:\4200s\ \Graphics Files\CAD\Work\Transfer Station Drawings\T Station Layout Traffic Study.dwg LAYOUT: TRAFFIC STUDY USER: cmurphy PLOT DATE: :41 AM Q1/13 15' VIDEO CAMERA SANBORN 8' VEHICLE PARKING OR QUEUING SPACE GRAPHICAL SCALE 0' 15' 30' HEAD
55 c 2017 SANBORN, HEAD & ASSOCIATES, INC. NEW LONDON TRANSFER STATION AND RECYCLING FACILITY Vehicle and Drop-off Area Data Recording Form Saturday, August 19, 2017 Vehicle Information Selected Site Entrance & Exit Observations Selected Tash & Recycling Drop-Off Area Observations Vehicle Designation (1) (C / HT / RO / PU / V / PK) Color Time when Entering Site Waiting in Queue? (Y/N) if Yes note vehicle location and approx cars in queue Time when Exiting Site Parking Location & Time when Parked Location Time when Parked Trash Disposal Time Recycling Bldg Drop-off Time ONP, OMG, OWP (2) Roll-Off Container Drop-off Time Start Time Finish Time Start Time Finish Time Start Time Finish Time Total Number of Vehicles Parked in Drop-Off Area (record number observed at frequent (15 min) intervals) Number of Vehicles Time of Observ FILE: P:\4200s\ \Graphics Files\CAD\Work\Transfer Station Drawings\TrafficStudyFigure 2-3.dwg LAYOUT: Figure 2 USER: cmurphy PLOT DATE: :43 AM P:\4200s\ \Source Files\Traffic\Traffic Observation Tables.xlsx 1. Vehicle designation C = car/sedan; HT = heavy truck (panel truck or stake truck); RO = roll-off truck; PU = pickup truck, V= Van; PK = packer truck; 2. Paper grades abbreviated as follows: ONP = Old Newspapers OMG = Old Magazines OWP = Office Wastepaper SANBORN November 2017 Project No: HEAD Figure 8 VEHICLE AND DROP-OFF AREA DATA RECORDING FORM Solid Waste Management Facilities Study Town of New London, New Hampshire
56 XREFS: FILE: P:\4200s\ \Graphics Files\CAD\Work\Traffic Study Figure 2.dwg LAYOUT: Figure 3 11x17 USER: cmurphy PLOT DATE: :21 PM IMAGES: P:\4200s\ \Graphics Files\CAD\XRefs\ESRI_NewLondon_TS.png c 2017 SANBORN, HEAD & ASSOCIATES, INC. SANBORN HEAD November 2017 Project No: Figure 39 PARKING DEMAND CHART TRANSFER STATION & RECYCLING CENTER DROP-OFF AREA Solid Waste Management Facilities Study Town of New London, New Hampshire


57 NH-4 c 2017 SANBORN, HEAD & ASSOCIATES, INC. Figure 10 LOCUS PLAN OF WILMOT AND ANDOVER TRANSFER STATIONS Solid Waste Management Facilities Study Town of New London, New Hampshire Drawn By: C. Murphy Designed By: C. Murphy Reviewed By: S. Wright Project No: Date: November 2017 SPRINGFIEL NEW LONDON TRANSFER STATION DANBURY Notes 1. The aerial images of both the Andover and Wilmot Transfer Stations were taken as screenshots from Google Earth. 2. The Town property lines, highway, and road layouts were taken from the Road Inventory section at NH Dept. of Transportation, Bureau of Planning. IMAGES: P:\4200s\ \Graphics Files\CAD\XRefs\Andover Transfer Station.jpg P:\4200s\ \Graphics Files\CAD\XRefs\Export.tif P:\4200s\ \Graphics Files\CAD\XRefs\Wilmot Transfer Station.jpg SUNAPEE NEWPORT ROAD I-89 NH-114 NH-114 NEW LONDON NH-11 NH-4A WILMOT NH-11 NH-11 ANDOVER NH-4 ANDOVER TRANSFER STATION NH-103A SALISBURY SUTTON XREFS: P:\4200s\ \Graphics Files\CAD\XRefs\ Edited.dwg NEWBURY TOWN LOCUS PLAN GRAPHICAL SCALE WARNER 1 mi 0.5 mi 0 1 mi 2 mi FILE: P:\4200s\ \Graphics Files\CAD\Work\Figure 10 Regional Transfer Stations.dwg LAYOUT: LOCUS USER: cmurphy PLOT DATE: :43 AM WILMOT TRANSFER STATION SANBORN HEAD
58 APPENDIX A TRAFFIC OBSERVATION PHOTOGRAPHS
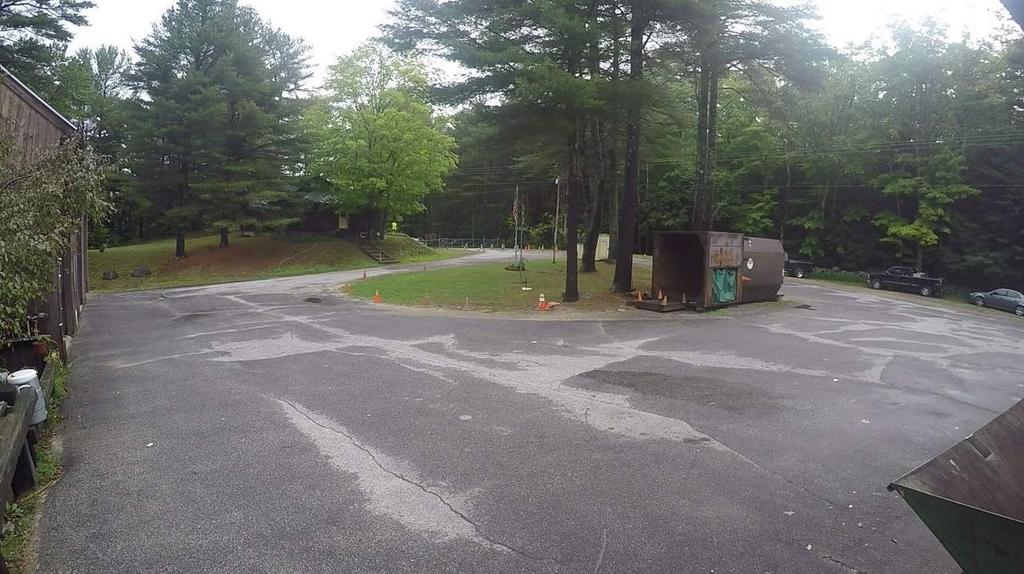
59
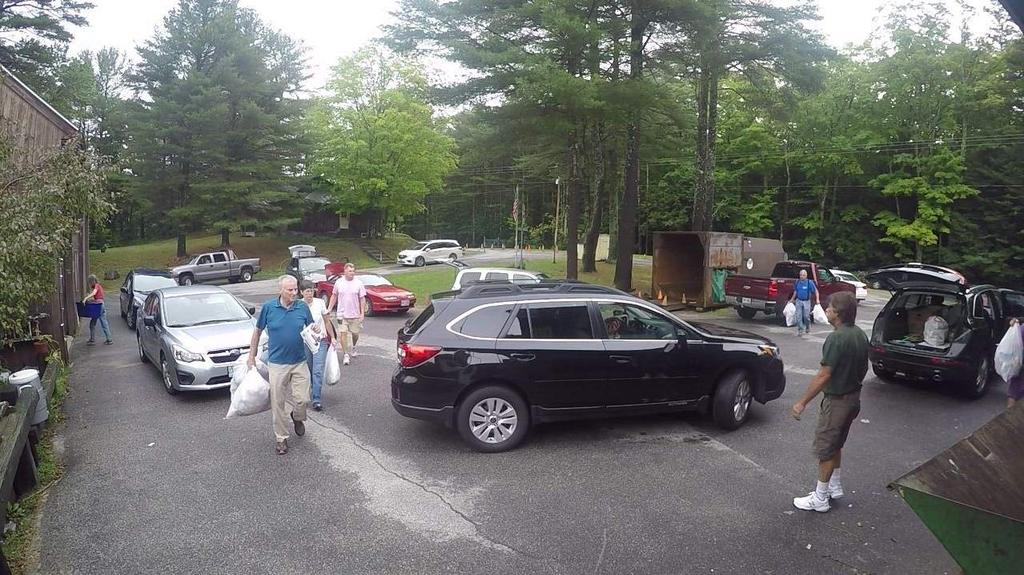
60
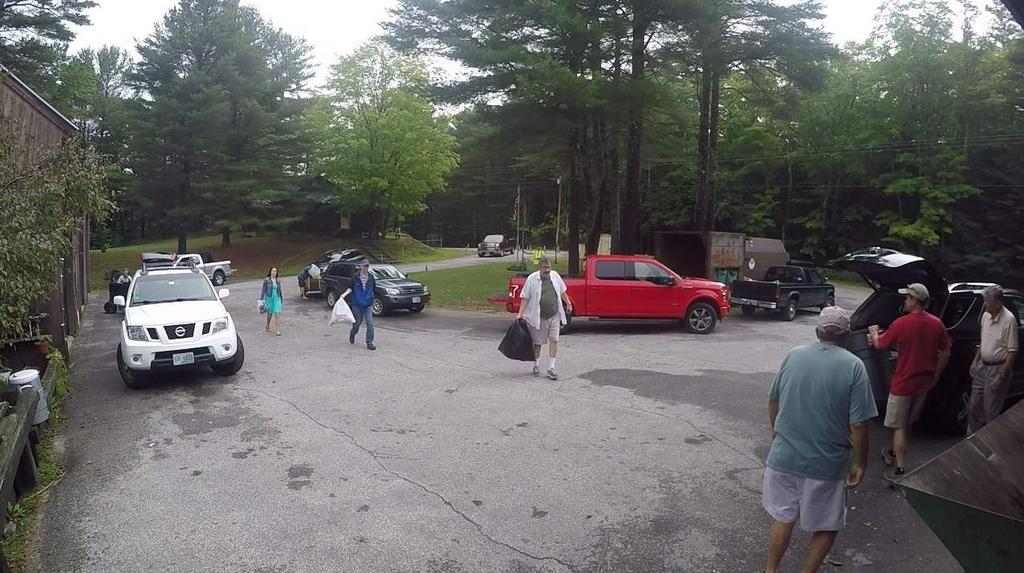
61
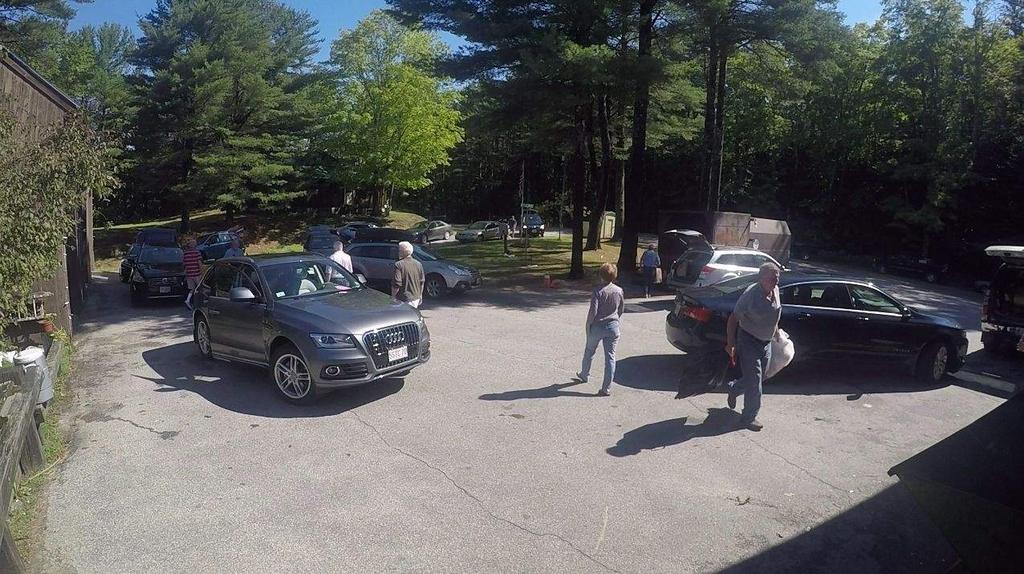
62
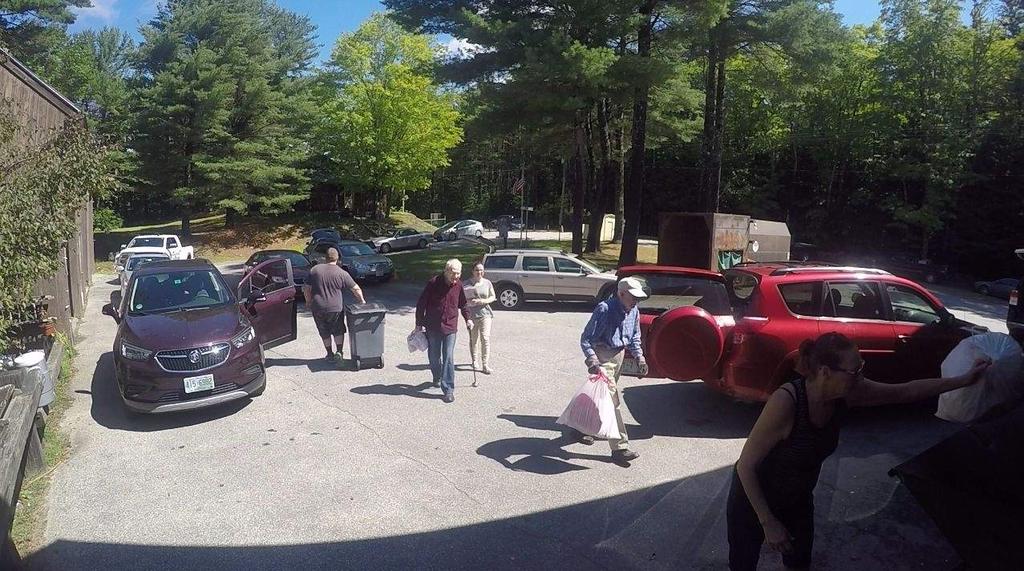
63
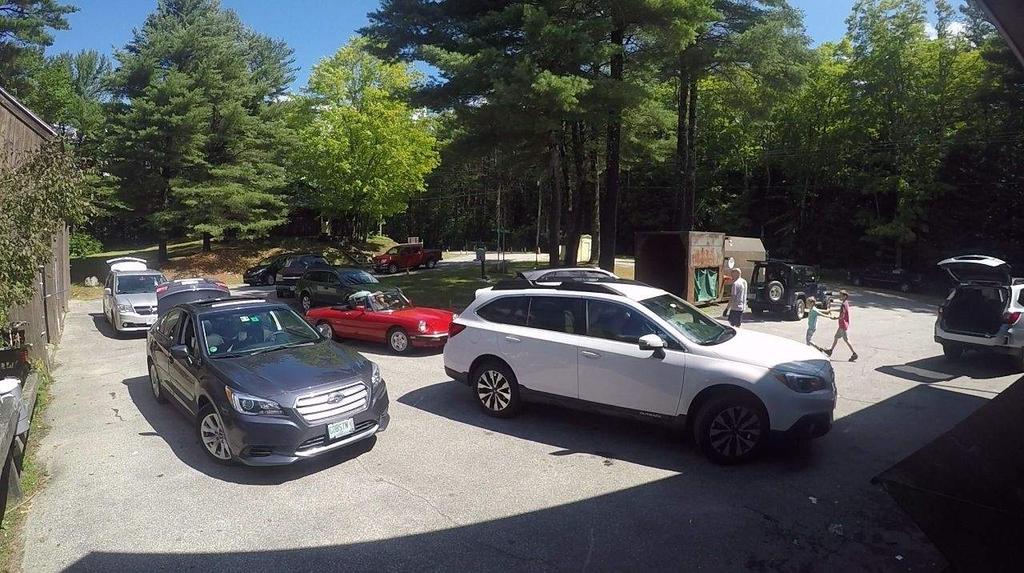
64
Municipal Solid Waste Generation, Recycling, and Disposal in the United States: Facts and Figures for 2008
 Municipal Solid Waste Generation, Recycling, and Disposal in the United States: Facts and Figures for 2008 The U.S. Environmental Protection Agency (EPA) has collected and reported data on the generation
Municipal Solid Waste Generation, Recycling, and Disposal in the United States: Facts and Figures for 2011
 Municipal Solid Waste Generation, Recycling, and Disposal in the United States: Facts and Figures for 2011 The U.S. Environmental Protection Agency (EPA) has collected and reported data on the generation
SWANA RECYCLING TECHNICAL ASSISTANCE STUDY PROPOSED BRADFORD COUNTY FIBER PROCESSING FACILTITY
 SWANA RECYCLING TECHNICAL ASSISTANCE STUDY PROPOSED BRADFORD COUNTY FIBER PROCESSING FACILTITY Prepared for: NORTHERN TIER SOLID WASTE AUTHORITY WEST BURLINGTON TOWNSHIP, BRADFORD COUNTY, PENNSYLVANIA
Municipal Solid Waste Generation, Recycling, and Disposal in the United States: Facts and Figures for 2010
 Municipal Solid Waste Generation, Recycling, and Disposal in the United States: Facts and Figures for 2010 The U.S. Environmental Protection Agency (EPA) has collected and reported data on the generation
ORANGE COUNTY WASTE COMPOSITION STUDY
 ORANGE COUNTY WASTE COMPOSITION STUDY June 2017 Prepared for: Submitted by: Orange County Solid Waste Management PO Box 17177 Chapel Hill, NC 27516 Kessler Consulting, Inc. innovative waste solutions 14620
Source Reduction, Recycling, Composting, and Disposal Information and Worksheets
 Source Reduction, Recycling, Composting, and Disposal Information and Worksheets These pages contain helpful background information and instructions. You are encouraged to read through them and complete
Commonwealth of Virginia Locality Recycling Rate Report For Calendar Year 2014
 Commonwealth of Virginia Locality Recycling Rate Report For Calendar Year 2014 Contact Information Reporting Solid Waste Planning Unit: Person Completing This Form: Title: Address: Street/P.O. Box City
TN RECYCLES INVEST IN SUSTAINABLE GROWTH REDUCE DISPOSAL REALIZED POTENTIAL CAPTURE VALUE CREATE JOBS
 TN RECYCLES INVEST IN SUSTAINABLE GROWTH CREATE JOBS REDUCE DISPOSAL CAPTURE VALUE REALIZED POTENTIAL Lifecycle of Material in Tennessee s Recycling Economy JOBS MATERIAL COST/VALUE URBAN W/ CURBSIDE &
Falcon Heights Recycling Report. Greg & Willie Tennis Tennis Sanitation 2/14/2014
 2013 Falcon Heights Recycling Report Greg & Willie Tennis Tennis Sanitation 2/14/2014 Index of Recycling Report Letter of Purpose. Page 1 Recycling Data Summary.... Page 2 Recycling Data (Single Family)...
Tompkins County Solid Waste Management Plan Executive Summary
 Tompkins County Solid Waste Management Plan Executive Summary Tompkins County has prepared a comprehensive, twenty-year Solid Waste Management Plan to comply with the requirements of the Solid Waste Management
Annual Recycling Report Instructions for Forms FM-11, FM-12 or FM-13 COMPLETE ONLY ONE OF THE RECYCLING REPORT FORMS!
 Annual Recycling Report Instructions for Forms FM-11, FM-12 or FM-13 COMPLETE ONLY ONE OF THE RECYCLING REPT FMS! HOW TO DECIDE WHICH REPT TO SUBMIT: Act 101 Compliance Report for Commercial, Municipal
New River Resource Authority Annual Recycling Report Instructions:
 New River Resource Authority Annual Recycling Report Instructions: The New River Resource Authority is requesting all nonresidential solid waste generators and commercial operations that manage solid waste
Volume 2 Waste Stream Composition Study
 Volume 2 Waste Stream Composition Study Sustainable Materials Management Plan 2015 Table of Contents Executive Summary... 6 Objective... 6 Methodology... 6 Results... 7 1. Introduction and Objectives...
PARTICIPATION & SET-OUT RATE ASSESSMENT
 October 0, 206 Marcus Zbinden Environmentalist III Carver County Department of Environmental Services Carver County Courthouse 600 4 th Street East Chaska, Minnesota 5338-202 Re: Carver County Residential
Carroll County Solid Waste Management Plan
 5.0 SOLID WASTE MANAGEMENT PLAN OF ACTION An integrated Solid Waste Management Plan provides specific management tools to handle various components of the waste stream. Numerous programs, which comprise
2015 King County Waste Characterization and Customer Survey Report
 2015 King County Waste Characterization and Customer Survey Report King County Waste Monitoring Program FINAL Table of Contents Executive Summary... 1 1. Project Purpose and Background... 5 King County
PINELLAS COUNTY, FLORIDA 2014 WASTE CHARACTERIZATION STUDY
 PINELLAS COUNTY, FLORIDA 2014 WASTE CHARACTERIZATION STUDY January 2015 Prepared for: Submitted by: Pinellas County Solid Waste Department 3095 114 th Avenue North St. Petersburg, FL 33716 Kessler Consulting,
Construction and Demolition Material Recovery Facility Feasibility Study
 FINAL REPORT North Central Texas Council of Governments Construction and Demolition Material Recovery Facility Feasibility Study AUGUST 2007 This study was funded through a solid waste management grant
COUNTY OF PRINCE WILLIAM
 COUNTY OF PRINCE WILLIAM DEPARTMENT OF 5 County Complex Court, Suite 250 PUBLIC WORKS Prince William, Virginia 22192-5308 (703) 792-6254 Fax: (703) 792-4617 Solid Waste Division Thomas Bruun Director January
Annual Recycling Report Instructions for Form FM-11, FM-12 or FM-13 COMPLETE ONLY ONE OF THE RECYCLING REPORT FORMS!
 Annual Recycling Report Instructions for Form FM-11, FM-12 or FM-13 COMPLETE ONLY ONE OF THE RECYCLING REPT FMS! HOW TO DECIDE WHICH REPT TO SUBMIT: Act 101 Compliance Report for Commercial, Municipal
2006 Waste Characterization Study
 Final Report 2006 Waste Characterization Study City and County of Honolulu April 2007 Table of Contents Table of Contents List of Tables List of Figures Executive Summary Section 1. Introduction and Overview....1-1
Annual Recycling Report Instructions for Form FM-11, FM-12 or FM-13 COMPLETE ONLY ONE OF THE RECYCLING REPORT FORMS!
 Annual Recycling Report Instructions for Form FM-11, FM-12 or FM-13 COMPLETE ONLY ONE OF THE RECYCLING REPT FMS! HOW TO DECIDE WHICH REPT TO SUBMIT: Act 101 Compliance Report for Commercial, Municipal
COMPLETE ONLY ONE OF THE RECYCLING REPORT FORMS! HOW TO DECIDE WHICH REPORT TO SUBMIT:
 Annual Recycling Report Instructions for Forms FM-11, FM-12 or FM-13 COMPLETE ONLY ONE OF THE RECYCLING REPT FMS! HOW TO DECIDE WHICH REPT TO SUBMIT: Act 101 Compliance Report for Commercial, Municipal
RECYCLING TECHNICAL ASSISTANCE Project #562 FINAL REPORT
 RECYCLING TECHNICAL ASSISTANCE Project #562 FINAL REPORT BOROUGH OF LEWISTOWN MIFFLIN COUNTY, PENNSYLVANIA PRELIMINARY RATE EVALUATION CURBSIDE REFUSE AND RECYCLABLES COLLECTION AND DISPOSAL PROGRAM FEBRUARY
2010 Residential Waste Stream Composition Study Results. Seattle Public Utilities and Neighborhoods Committee March 8, 2011
 2010 Residential Waste Stream Composition Study Results Seattle Public Utilities and Neighborhoods Committee March 8, 2011 Presentation Overview Overview of Seattle waste stream Waste Composition Study
Delaware Solid Waste Authority Statewide Waste Characterization Study, FY 2016
 Submitted by: Delaware Solid Waste Authority Statewide Waste Characterization Study, FY 2016 FINAL REPORT January 9, 2017 Delaware Solid Waste Authority Statewide Waste Characterization Study FY 2016 TABLE
CHARACTERIZATION OF MUNICIPAL SOLID WASTE IN THE UNITED STATES: 1998 UPDATE. Prepared for
 CHARACTERIZATION OF MUNICIPAL SOLID WASTE IN THE UNITED STATES: 1998 UPDATE Prepared for U.S. Environmental Protection Agency Municipal and Industrial Solid Waste Division Office of Solid Waste Report
Suggestions for the Recycling Program and Analysis of the Recycling Center Building Plans. City of Jeannette
 Suggestions for the Recycling Program and Analysis of the Recycling Center Building Plans City of Jeannette December, 2000 Table of Contents Background... 2 Introduction... 2 Purpose... 3 Scope of Work...
Exploring Hub and Spoke Recycling
 Exploring Hub and Spoke Recycling Mississippi Solid Waste and Recycling Conference Bay St. Louis, MS May 2018 Content Overview Introduction to The Recycling Partnership 1 Content Overview Introduction
Minneapolis Public Works Department
 Minneapolis Public Works Department Solid Waste & Recycling Briefing Transportation and Public Works Committee October 12, 2010 MN Historical Society 1 Solid Waste & Recycling Briefing Presentation Outline
TRI R LANDFILL, RECYCLING AND REUSE CENTRE. Prepared by: Amy Tilley On behalf of the TRI R COMMITTEE PROJECT #511.11
 TRI R LANDFILL, RECYCLING AND REUSE CENTRE Prepared by: Amy Tilley On behalf of the TRI R COMMITTEE PROJECT #511.11 EXECUTIVE SUMMARY The Municipalities of Armour, Burk s Falls and Ryerson have jointly
VOLUME IV DESIGN AND OPERATIONS REPORT CAPITAL REGION RESOURCE RECOVERY CENTRE
 VOLUME IV DESIGN AND OPERATIONS REPORT CAPITAL REGION RESOURCE RECOVERY CENTRE APPENDIX E Materials Recovery Facility Design and Operations Report No. 12-1125-0045/4500/vol IV APPENDIX E Materials Recovery
Chapter 9&12. Separation and Processing of Solid Waste. Recovery of Materials in MSW
 Chapter 9&12 Separation and Processing of Solid Waste Recovery of Materials in MSW The methods now used to recover source-separated waste materials include curb side collection and homeowner delivery of
Minnesota Statewide Waste Characterization Study
 Minnesota Statewide Waste Characterization Study for the 2014 SWANA/AWMA Landfill Operators Conference by Robert Craggs Solid Waste and Resource Recovery Manager Project Team Burns &McDonnell Lead Consultant
TABLE OF CONTENTS. 1.1 General Background Waste Diversion Waste Disposal WASTE COLLECTION AND DISPOSAL...
 Draft Environmental Assessment Terms of Reference Supplementary Document Waste Management System Summary TABLE OF CONTENTS 1. INTRODUCTION...1 1.1 General...1 1.2 Background...1 1.3 Waste Diversion...1
Trends Affecting Recycling s Future. Jerry Powell Resource Recycling Portland, Oregon
 Trends Affecting Recycling s Future Jerry Powell Resource Recycling Portland, Oregon www.resource-recycling.com What we ll look at today A quick review of recycling s progress An analysis of key trends
REQUEST FOR PROPOSALS FOR THE OPERATION OF THE SHOREWAY RECYCLING AND DISPOSAL CENTER (SRDC)
") REQUEST FOR PROPOSALS FOR THE OPERATION OF THE SHOREWAY RECYCLING AND DISPOSAL CENTER (SRDC) SRDC Facility Operations RFP - 1 - SBWMA Table of Contents SECTION I...7 GENERAL INFORMATION...7 1.1 INTRODUCTION...7
REQUEST FOR PROPOSALS FOR THE OPERATION OF THE SHOREWAY RECYCLING AND DISPOSAL CENTER (SRDC) SRDC Facility Operations RFP - 1 - SBWMA Table of Contents SECTION I...7 GENERAL INFORMATION...7 1.1 INTRODUCTION...7
COMPACTOR COST SAVINGS MUNICIPAL CORPORATION OF THE TOWNSHIP OF ARMOUR CIF PROJECT # 1040 FINAL REPORT February 27, 2018
 COMPACTOR COST SAVINGS MUNICIPAL CORPORATION OF THE TOWNSHIP OF ARMOUR CIF PROJECT # 1040 FINAL REPORT February 27, 2018 Prepared for: Resource Productivity and Recovery Authority Continuous Improvement
Source Reduction, Recycling, Composting, and Disposal Information and Worksheets
 Source Reduction, Recycling, Composting, and Disposal Information and Worksheets These pages contain helpful background information and instructions. You are encourage to read through them and complete
A bit of History and Why we do what we do...
 Master Recycler Introduction Spring Fall Class A bit of History and Why we do what we do... Presented by: Sarah Grimm, Waste reduction Specialist, Lane County Public Works The Birth of Recycling 1950 s
6.20 UTILITIES SOLID WASTE
 6.20 UTILITIES SOLID WASTE 6.20.1 OVERVIEW AND SUMMARY Solid waste generated by the proposed project would be disposed primarily at the Toland Road Landfill. Prior to disposal, recyclable materials would
Recycling Plan Element Borough of Highlands, County of Monmouth October 2004 RECYCLING PLAN ELEMENT HIGHLANDSNJ.US
 INTRODUCTION RECYCLING PLAN ELEMENT Over the last decade the recycling of waste and used materials has become a required and commonly accepted practice within the State of New Jersey. In the early 1990s
State of Recycling In Arkansas 2003
 State of Recycling In Arkansas 2003 Arkansas is well on the way to reaching its goal of recycling 40 percent of the municipal solid waste stream by 2005. Nearly 39 percent of the 2003 solid waste stream
2013 Statewide Waste Characterization
 Final Report 2013 Statewide Waste Characterization Minnesota Pollution Control Agency December 2013 2013 Statewide Waste Characterization prepared for Minnesota Pollution Control Agency St. Paul, Minnesota
Household Container Recycling - High School Student Worksheet. Newspapers, Plastic Bottles, Glass Jars, Cardboard Boxes, etc.
 Name: Date: Part I: Introduction 1. List 4 household items that can be recycled. Newspas, Plastic Bottles, Glass Jars, Cardboard Boxes, etc. 2. What is Single Stream Recycling? A system where all types
Three Watson Irvine, CA Recycling
 Three Watson Irvine, CA 92618-2767 Recycling Contents Three Watson Irvine, CA 92618-2767 Website: www.sdlback.com Copyright 2009 by Saddleback Educational Publishing All rights reserved. No part of this
Municipal Infrastructure
 The Town of Hebron Section 5 2014 Plan of Conservation and Development Municipal Infrastructure C. Public Works (Draft: 5/2/13) This section of the plan will identify the services provided by the Town
Evaluation of Enhanced Residential Waste and Recyclables Collection and Processing for New Castle County
 Evaluation of Enhanced Residential Waste and Recyclables Collection and Processing for New Castle County FINAL REPORT OCTOBER 15, 2003 Presented to Delaware Recycling Public Advisory Council Prepared by:
RECYCLING TECHNICAL ASSISTANCE Project #548 FINAL REPORT
 RECYCLING TECHNICAL ASSISTANCE Project #548 FINAL REPORT BOROUGH OF SHIPPENSBURG CUMBERLAND COUNTY, PENNSYLVANIA MUNICIPAL CURBSIDE RECYCLING PROGRAM EVALUATION GANNETT FLEMING, INC. HARRISBURG, PENNSYLVANIA
Ramsey County Master Plan
 Ramsey County Master Plan Solid Waste Advisory Committee Meeting April 18, 2017 Welcome Introduction Purpose and expectations of the Solid Waste Advisory Committee Orientation to Solid Waste Master Plan
Recycling Coalition of WV, Inc.
 The Recycling Coalition of West Virginia (RCWV) is a non-profit environmental organization whose mission is to promote the effective and sustainable reduction, reuse, and recycling of materials otherwise
Waste Composition Studies Understanding the Results. Ted Siegler DSM Environmental Services, Inc. Windsor, VT
 Waste Composition Studies Understanding the Results Ted Siegler DSM Environmental Services, Inc. Windsor, VT www.dsmenvironmental.com Overview 6/14/2016 DSM Environmental Services, Inc. 2 Two Ways to Assess
Recycling Technical Assistance Project # 570. Chester County. C&D Evaluation
 Recycling Technical Assistance Project # 570 Chester County C&D Evaluation Sponsored by the Pennsylvania Department of Environmental Protection through the Pennsylvania State Association of Township Supervisors
CHAPTER 7: RECYCLING PROGRAMS AND MARKET DEVELOPMENT
 CHAPTER 7: RECYCLING PROGRAMS AND MARKET DEVELOPMENT Promoting the development and growth of successful recycling programs in West Virginia is an integral part of a SWAs responsibilities. Recycling is
CITY OF MANASSAS MANASSAS, VA PUBLIC WORKS & UTILITIES DEPARTMENT 8500 Public Works Drive Manassas, VA 20110
 DIRECTOR OF PUBLIC WORKS & UTILITIES Michael C. Moon CITY OF MANASSAS MANASSAS, VA 20110 PUBLIC WORKS & UTILITIES DEPARTMENT 8500 Public Works Drive Manassas, VA 20110 Facsimile: 703/330-4429 Telephone:
Advancing Sustainable Materials Management: 2013 Fact Sheet
 Advancing Sustainable Materials Management: 2013 Fact Sheet Assessing Trends in Material Generation, Recycling and Disposal in the United States June 2015 Introduction U.S. Environmental Protection Agency
City of Peterborough. Peterborough MRF Conversion Options. Draft. Prepared By: Date Submitted:
 Peterborough Draft Prepared By: exp Services Inc. 1595 Clark Blvd Brampton, ON L6T 4V1 Canada T: +1.905.793.9800 F: +1.905.793.0641 www.exp.com Date Submitted: November 2017 Table of Contents 1. Introduction...1
Waste Disposal and Diversion Findings for Selected Industry Groups
 Contractor s Report to the Board Executive Summary and Excerpts Targeted Statewide Waste Characterization Study: Waste Disposal and Diversion Findings for Selected Industry Groups June 2006 Produced under
Economic Impact of Recycling in Alabama and Opportunities for Growth. Alabama Department of Environmental Management. Land Division Solid Waste Branch
 Economic Impact of Recycling in Alabama and Opportunities for Growth Alabama Department of Environmental Management Land Division Solid Waste Branch June 2012 Alabama Department of Environmental Management
EVALUATION AND APPRAISAL REPORT FOR THE INDIAN RIVER COUNTY COMPREHENSIVE PLAN SOLID WASTE SUB-ELEMENT DRAFT
 EVALUATION AND APPRAISAL REPORT FOR THE INDIAN RIVER COUNTY COMPREHENSIVE PLAN SOLID WASTE SUB-ELEMENT DRAFT 2008 INDIAN RIVER COUNTY COMMUNITY DEVELOPMENT DEPARTMENT 1801 27TH STREET VERO BEACH, FLORIDA
The Mecklenburg County Experience
 Fall 1989, Vol. 15, No. 2 In The Works Integrated Waste Management: The Mecklenburg County Experience Elizabeth W. Dora In response to rising costs, legal barriers, environmental concerns, and public opposition
BEDFORD COUNTY SOLID WASTE MANAGEMENT PLAN
 BEDFORD COUNTY SOLID WASTE MANAGEMENT PLAN County of Bedford, Virginia Board of Supervisors March 14, 2016 1 CHECK LIST FOR THE DEVELOPMENT OF SOLID WASTE MANAGEMENT PLANS Mandatory Plan Contents Section(s)
APPENDIX A. Recommendations
 APPENDIX A Recommendations Preliminary Draft - Comprehensive Solid Waste Management Plan Update 2006 APPENDIX A Recommendations COLLECTION No additional recommendations are made for changing the collection
Reduce, Reuse, Recycle. Lesson Plan: NRES G1-1
 Reduce, Reuse, Recycle Lesson Plan: NRES G1-1 1 Anticipated Problems 1. What do reduce, reuse, and recycle mean? 2. Why is reducing, reusing, and recycling important? 2 Terms recycling reducing reusing
Morris County New Jersey Solid Waste Management Plan Amendment
 Morris County New Jersey Solid Waste Management Plan Amendment Inclusion of Electronic Recyclers International, Inc. Class D Recycling Center for Electronics Demanufacturing Borough of Lincoln Park, New
Recycling and Solid Waste Management
 Metro Vancouver Recycling and Solid Waste Management 2017 Report Metro Vancouver Recycling and Solid Waste Management - 2017 Summary Page 1 Metro Vancouver is responsible for the planning and management
Solid Waste Management
 Chapter 1 Solid Waste A brief history of waste and landfills When the majority of people lived in rural areas, their waste, which consisted almost entirely of organic materials derived from plants, humans,
Table of Contents. LASAN CLARTS OPF Abbreviated Feasibility Report November 17, Page 1 of 10
 Table of Contents I. Executive Summary... 2 II. Project Concept and Goals... 3 III. Waste Stream Composition... 3 IV. Project Data... 4 V. Existing Facility... 5 VI. Location of OPF on the CLARTS Site...
Sumter County Recycling Plan
 Sumter County Recycling Plan INTRODUCTION The amount and type of waste generated by a community, and the strategies employed to manage or treat the waste, contribute to the many facets of a sustainable
California State University, Chico Campus Conservation Committee
 CSU, Chico established the Campus Conservation Committee (CCC) in August 2000 to review the university s waste management procedures and to make recommendations to campus administration on ways to further
Mohawk Council of Kahnawà:ke. Annual Progress Report for Redevance Funding Waste Management Plan Action Items Period April 2017 to March 2018
 Annual Progress Report for Redevance Funding Waste Management Plan Action s Period April to March 2018 Waste Management Department Public Works Holly McComber, Manager April 30, 2018 As required by the
REGIONAL RECYCLING PLAN
 REGIONAL RECYCLING PLAN OCTOBER 2000 RECYCLING PLAN FOR THE NASHUA REGION Prepared by the NASHUA REGIONAL PLANNING COMMISSION October 2000 TABLE OF CONTENTS INTRODUCTION... 1 Introduction and Overview
Waste Management. Innovation, Sustainability and Customer Value Tennessee Symposium: Growing Tennessee s Recycling Economy.
 Waste Management Innovation, Sustainability and Customer Value 2013 Tennessee Symposium: Growing Tennessee s Recycling Economy August 15, 2013 Jessica Preston, ATAK Market Area Sustainability Program Director
3. In the first simulation with 2 workers, how many total items are sorted in one hour?
 Name: Date: Part I: Introduction 1. List 4 household items that can be recycled. 2. What is Single Stream Recycling? 3. What are three benefits of recycling? 4. What are three possible disadvantages of
Volume to Weight Conversion Ratios for Commercial Office Waste in New York City
 Volume to Weight Conversion Ratios for Commercial Office Waste in New York City Authors: Amy Marpman, Matthew Shurtleff, Ross Guberman, Richard Fuller Date: January 2013 Abstract This paper establishes
University of Washington
 University of Washington Waste Characterization Study Prepared for University of Washington, Building Services Department Prepared by Cascadia Consulting Group, Inc. July 2018 Tel (206) 343-9759 Fax (206)
1 Hutto Recycling Center Materials Data. 2 Hazardous Household Waste (HHW) Bi-Yearly Event Data. 3 Brush Diversion Data
 Bi-Yearly Event Data. 3 Brush Diversion Data") 1 Hutto Recycling Center Materials Data 2 Hazardous Household Waste (HHW) Bi-Yearly Event Data 3 Brush Diversion Data 4 Williamson County Landfill Information & Contacts Material 2012 2013 2014 2015 2016
1 Hutto Recycling Center Materials Data 2 Hazardous Household Waste (HHW) Bi-Yearly Event Data 3 Brush Diversion Data 4 Williamson County Landfill Information & Contacts Material 2012 2013 2014 2015 2016
CE 326 Principles of Environmental Engineering INTEGRATED SOLID WASTE MANAGEMENT
 CE 326 Principles of Environmental Engineering INTEGRATED SOLID WASTE MANAGEMENT Field Trip: Meet at the Ames Resource Recovery Plant at half past the hour of the scheduled lab period. The plant is located
Quick Service Restaurant Waste Composition Study
 Quick Service Restaurant Waste Composition Study September 20, 2012 Upon adoption through the ARR Director and the support from the Zero Waste Advisory Commission, the elements of this document will be
CT Department of Environmental Protection. Getting SMART Waste Management to Reduce Disposal & Increase Recycling
 CT Department of Environmental Protection Getting SMART Waste Management to Reduce Disposal & Increase Recycling Resource Conservation Challenge Workshop March 25, 2009 Municipal Unit Based Pricing Programs
CONSTRUCTING THE NEW DERRY TRANSFER STATION- CHASING THE DREAM
 CONSTRUCTING THE NEW DERRY TRANSFER STATION- CHASING THE DREAM Michael A. Fowler, P. E., Director of Public Works Joanie Hamel, Recycling Coordinator/Crew Chief DERRY, NH KEY STATISTICS Population 33,000
Mixed Paper Clean Up System CIF Project#: REV
 Mixed Paper Clean Up System CIF Project#: 831.3 REV Acknowledgement: This Project has been delivered with the assistance of the Continuous Improvement Fund, a fund financed by Ontario municipalities and
Just the Facts and the Data
 Just the Facts and the Data Reporting Indiana s recycling numbers Greg Overtoom Office Data Coordinator IDEM Office of Land Quality Chris Ronson Solutions Manager Emerge Knowledge An Inglorious Beginning
Sanitation Services Bulk and Brush Program - Update. Quality of Life & Environment Committee November 14, 2016
 Sanitation Services Bulk and Brush Program - Update Quality of Life & Environment Committee November 14, 2016 Briefing Overview Provide a recap of the current collection program Provide information related
DRAFT. Memorandum of Agreement Report Summary. Statewide Mandatory Curbside Recycling Program
 DRAFT Memorandum of Agreement Report Summary Statewide Mandatory Curbside Recycling Program Prepared by: Delaware Recycling Public Advisory Council Delaware Department of Natural Resources and Environmental
Contents. McMaster University Waste Audit Report. Introduction.3 Terminology.5 Current Collection Procedure...6 Methodology..8. Composition Study 10
 Waste Audit Report 2018 Contents Summary 3 Introduction.3 Terminology.5 Current Collection Procedure....6 Methodology..8 Composition Study 10 Hedden Hall.10 McKay Hall 12 Unmeasurable Contents.....14 Benchmark
City of Columbia 701 East Broadway, Columbia, Missouri 65201
 Department Source: City Utilities - Solid Waste To: City Council From: City Manager & Staff Council Meeting Date: August 6, 2018 Re: Solid Waste Utility Compost Operation and Food Waste Collection Programs
Berkeley Recycling. Community Conservation Centers, Inc. Operated by. In Partnership with the City Of Berkeley. a local non-profit corporation
 Berkeley Recycling Operated by Community Conservation Centers, Inc. a local non-profit corporation In Partnership with the City Of Berkeley History of Berkeley Recycling 1980 Received a $350,000 State
Recycling Markets and Opportunities for Local Government Recycling Program Expansion
 Recycling Markets and Opportunities for Local Government Recycling Program Expansion Overview It is commonly argued that there are limits to recycling because of lack of markets or weakness in markets.
THE PARADIGM SHIFT What s Wrong With Our Financials? SERDC November 2016 David Lank
 THE PARADIGM SHIFT What s Wrong With Our Financials? SERDC November 2016 David Lank THE OLD PARADIGM Recycling is source separated from trash OCC is large and flat Fiber is 2 dimensional, mostly newspaper
Arizona Department of Environmental Quality Annual Waste Reduction and Recycling Questionnaire
 Arizona Department of Environmental Quality Annual Waste Reduction and Recycling Questionnaire Fiscal Year 2000: July 1, 1999 to June 30, 2000 Jurisdiction: This questionnaire contains the following five
WASTE AUDITS. What Is a Waste Audit? What Should We Do First? Collect & Sort
 WASTE AUDITS What Is a Waste Audit? A waste audit is a process used to determine the amount and the types of waste being generated by a group. The high volume materials identified in the audit are then
MATERIALS RECOVERY FACILITY STUDY Chippewa County January 31, 2013 Executive Summary
 MATERIALS RECOVERY FACILITY STUDY Chippewa County January 31, 2013 Executive Summary INTRODUCTION The Chippewa County Land Conservation and Forest Management (LCFM) Materials Recovery Facility (MRF) Study
Casar. Please submit this form to by September 1, Mailing Address:PO Box 1014 City: Shelby Zip: 28151
 Local Government Required - Enter Your Local Government Casar State of North Carolina Department of Environment and Natural Resources Division of Waste Management & Division of Environmental Assistance
Annual Recycling Report Instructions for Form 4500-FM-SW0011, 4500-FM-SW0012 or 4500-FM-SW0013 COMPLETE ONLY ONE OF THE RECYCLING REPORT FORMS!
 4500-FM-SW0013 Rev. 12/2009 COMMONWEALTH OF PENNSYLVANIA Instructions Annual Recycling Report Instructions for Form 4500-FM-SW0011, 4500-FM-SW0012 or 4500-FM-SW0013 This report is due on or before February
Figure -1 Functional Elements of the Life Cycle Analysis of Municipal Solid Waste Management Alternatives.
 System Description for a Life-Cycle Inventory of Municipal Solid Waste Management Alternatives Morton A. Barlaz and Ranji Ranjithan North Carolina State University (7/22/95) Executive Summary The objective
2011 ANNUAL SOLID WASTE MANAGEMENT REPORT for MUNICIPALITIES and DEP-licensed TRANSFER STATIONS AND LANDFILLS
 2011 ANNUAL SOLID WASTE MAGEMENT REPORT for MUNICIPALITIES and DEP-licensed TRANSFER STATIONS AND LANDFILLS REPORTING ENTITY: Town of Cumberland This report includes information on MSW disposal for the
Appendix E: Records Review Worksheets
 Appendix E: Records Review Worksheets Complete a worksheet for each waste stream you are assessing. Examples and tips are provided at the bottom of the page. Summarize the totals on each worksheet on Worksheet
RECYCLING & TRASH REPORT FY 2015
 RECYCLING & TRASH REPORT FY 2015 EXECUTIVE SUMMARY In May 2010, Temple University adopted its Climate Action Plan, which addresses the role of recycling and waste minimization as part of its comprehensive