Water Development Office 6920 YELLOWTAIL ROAD TELEPHONE: (307) CHEYENNE, WY FAX: (307)
|
|
|
- Johnathan Owens
- 5 years ago
- Views:
Transcription
 Contents 1.0 Introduction...1 2.0 Historic and Current Agriculture Activity...2 2.1 Livestock...2 2.2 Irrigation.")
1 THE STATE OF WYOMING Water Development Office 6920 YELLOWTAIL ROAD TELEPHONE: (307) CHEYENNE, WY FAX: (307) TECHNICAL MEMORANDUM TO: Water Development Commission DATE: January 18, 2013 FROM: Dave K. Myer, P.E. REFERENCE: Snake/Salt River Basin Plan Update, SUBJECT: Tab I () Contents 1.0 Introduction Historic and Current Agriculture Activity Livestock Irrigation Future Projections Approach for Developing Projections Livestock Irrigation Future Water Demand Projections Water Use Factors Projected Annual Water Demands by Scenario References Introduction The purpose of this technical memorandum is to summarize the agricultural water use investigation performed as part of the Snake/Salt River Basin Plan Update ( Update). The memorandum starts with sections that describe the historic and current agricultural water use activity in the Basin within two primary areas of water use: livestock and irrigation. Future agricultural water use scenarios are then defined, followed by future water use projections that have been based on trends, economic drivers, local insight, population, and other factors. Data collection, information, and methodologies used for the previous Snake/Salt River Basin Plan in 2003 (previous Basin Plan) as documented in the following technical memoranda were referred to for parts of this analysis: : Task 4, Memo 1: Historic and Current Economic and Demographic Conditions (BBC Research & Consulting (a), 2002). : Task 4, Memo 2: Future Economic and Demographic Scenarios (BBC Research & Consulting (b), 2002). Wyoming Water Development Office Page 1
2 : Memo 3: Future Water Demand Projections (BBC Research & Consulting (c), 2002). As in the previous Basin Plan, in order to understand historic and current agricultural activity in the Basin and factors that may affect future numbers, WWDO planning staff interviewed relevant personnel and collected data from a variety of federal and state land management, conservation, and agricultural agencies, including the following: Star Valley Conservation District Lincoln County Conservation District Sublette County Conservation District Teton County Conservation District USFS Buffalo Ranger District USFS Jackson Ranger District USFS Greys River Ranger District Lincoln County Brand Inspector Teton County Brand Inspector Lincoln County Planning and Engineering USDA National Agricultural Statistics Services (NASS) 2.0 Historic and Current Agriculture Activity This section discusses the historic and current agricultural activity within the Snake/Salt Basin as related to livestock and irrigation. The approach used to estimate historic and current livestock numbers is described in Section 2.1 followed by descriptions of livestock inventories in terms of historic and present day estimates for cattle, dairy cattle, sheep, and horses. Section 2.2 provides an overview of current irrigation within the Basin in terms of cropping patterns and acreages. 2.1 Livestock The methodology and data used in the previous Basin Plan for its livestock investigation were reviewed to determine whether the same approach could be implemented for this study. For the Update, it was decided that a departure from the previous Basin Plan was appropriate, involving the use of a different tactic to estimate current and historic livestock numbers within the Basin. The previous Basin Plan approximated livestock counts based on grazing allotment numbers. However, it was thought that this approach may have overestimated livestock counts, particularly with respect to sheep. Since the numbers were tied to grazing permits, tallies may not reflect under-utilized permits within a given year, nor account for livestock that was brought in from out-of-basin on a temporary basis (commonly referred to here as tourist livestock ). (Additional information on current grazing allotments in the Bridger Teton National Forest is presented later in this section.) This study relied on county numbers obtained from USDA National Agricultural Statistics Services (NASS) as a starting point. Then, based on information and evidence obtained from interviews and spatial associations, the county numbers were calibrated to more accurately describe average annual tallies of livestock residency within the Basin. It was felt that this approach would yield reasonable livestock counts that could be used to ultimately determine current and future annual water demands for livestock within the Basin. Wyoming Water Development Office Page 2
3 The Snake/Salt River Basin in Wyoming encompasses all or parts of Teton, Lincoln, Sublette, and Fremont Counties. Data were obtained from the NASS website for Teton, Lincoln, and Sublette Counties with a period of record from 1975 to (NASS, ), which provided a graphical picture of historic trends in each county. As in the previous Basin Plan, the gathered data and analysis consisted of four livestock animal types: cattle, dairy cattle, sheep, and horses. Table 1 lists the percentage of land area of each county that is in the Snake/Salt Basin from a spatial perspective. For example, approximately 28 percent of Lincoln County is within the Snake/Salt Basin. These percentages were used as a starting point to pare down county livestock inventories to those actually residing within the Basin. Then, based on anecdotal evidence obtained from interviews, further calibrations were completed to determine a reasonable estimate for the assumed percentage of each animal type for each county within the Basin as summarized in Table 2. For instance, it was assumed that 40 percent of the dairy cattle inventoried by NASS in all of Lincoln County inhabit the Snake/Salt Basin. Note that a small portion of the Snake/Salt River Basin is also located within Fremont County. Primarily consisting of the upper portions of the Gros Ventre River and Buffalo Fork Basins, this area, due to its relatively small extent and topography, was disregarded in terms of livestock occupancy within the Basin. Also note that in Teton County, it should be recognized that a certain number of livestock may reside on the western aspects of the Teton Range near Alta, Wyoming. These livestock do not deplete surface water sourced from the main stem of the Snake River or its tributaries; instead, they draw upon surface water supplied within the Teton River Sub-basin. This analysis did not distinguish between surface water depleted by livestock from the Snake River Sub-basin and the other sub-basins that are disconnected from the main stem of the Snake River. Table 1: Approximate Percentage of County by Land Area within the Snake/Salt Basin Approximate Percentage in County Snake/Salt Basin Teton 100% Lincoln 28% Sublette 1 8% 1. Primarily consists of the upper portion of the Hoback River Basin. Table 2: Summary of Assumed Percentages of County Inventories Located in the Snake/Salt Basin Animal Type Teton County 1 Lincoln County Sublette County Cattle 100.0% 8.0% 3.5% Dairy Cattle 100.0% 40.0% 3.5% Sheep 100.0% 28.0% 8.0% Horses 100.0% 28.0% 3.5% 1. It was assumed that 100 percent of Teton County is located within the Snake/Salt Basin. The following sections describe more specific methodologies, anecdotal evidence, further information, and assumptions made to determine historic and current livestock counts for cattle, Wyoming Water Development Office Page 3
4 dairy cattle, sheep, and horses, respectively. Graphical representations of historic trends are also provided. Cattle NASS data provided cattle inventories by head from 1975 to for Teton, Lincoln, and Sublette Counties. The data for all three counties consisted of full periods of record with no missing data; therefore, data filling was not required. Due to the very small numbers of dairy cattle located within Teton and Sublette Counties, dairy cattle counts were merged into the cattle counts for these two counties. In Teton County, there are large numbers of beef cattle, primarily yearlings, near Jackson Hole in the Snake River valley. Perhaps as many as 10,000 head inhabit the area during the summer months. These cattle are brought in to utilize the grass and to meet conservation easement requirements to maintain agricultural operations. Only a few of these cattle are wintered in the area (Teton County Brand Inspector, ). Based on this information, a current-day, year round average of 4,500 cattle head was assumed to reside in Teton County within the Snake/Salt Basin which corresponds to year NASS data obtained for the county. Within Lincoln County, not many beef cattle reside in Star Valley (Salt River area). For many years, the valley was home to numerous dairies, but there has been a shift to small acreage operations with various livestock mixes. Some have shifted from traditional agricultural operations to hay production and fishing lease operations. Such operations hay the meadows, sell the hay, and lease fishing rights on the streams. There has also been movement toward more natural, organic grass fed Kobe beef cattle with 10 or so head currently in the region with plans to expand to 30 to 50 head in the future. These cattle are not grazed on forest permit lands; instead, they are pastured on irrigated lands. However, approximately 2,000 cattle still utilize grazing allotments within the USFS Greys River District (Lincoln County Conservation District, ) (Star Valley Conservation District, ). Given the above evidence, a current-day, year round average of 2,928 cattle head was assumed to reside in Lincoln County within the Snake/Salt Basin, or 8 percent of the total county counts provided by NASS for year. A number of beef cattle currently inhabit the upper portions of the Hoback River Basin in Sublette County, most residing in traditional family ranch operations. Some cattle do winter in this region, but never more that about 1,500 head. Typically, these numbers increase to over 2,500 head during the non-winter months (Sublette County Conservation District, ). A current-day, year round average of 1,855 head was assumed to reside in Sublette County within the Snake/Salt Basin, or 3.5 percent of the total county counts provided by NASS for. Figure 1 illustrates the resulting historic trends approximated for cattle inventories within the Snake/Salt Basin by county. The figure shows an overall decline in cattle numbers since 1975 with most pronounced declines evident in Teton County. Cattle counts in Lincoln and Sublette County remained fairly constant over the historic period of record. As indicated on the figure, it is estimated that 9,283 cattle currently reside within the Snake/Salt Basin. Current year () counts are also shown on the chart for each county. Linear regression lines and equations are displayed to help illustrate the historic inventory trend for each county. The slope of the line gives the approximate increase or decrease in annual cattle inventory over the historic period of record. The growth rates corresponding to the regression lines are also shown on the figure. Wyoming Water Development Office Page 4
5 Bear in mind that available historic data was limited to total county numbers. For Lincoln and Sublette Counties, cattle counts obtained from NASS included those cattle residing outside of the Snake/Salt Basin. Therefore, the overall shape of the graphs for Lincoln and Sublette Counties on Figure 1 provides an indication of historic trending within those entire counties and not necessarily related to historic occurrences specific to within the Basin. Only the numbers have been calibrated to reflect current day inventories within the Basin; the overall shape of each graph remains attached to historic trending in the entire county. 30,000 25,000 Cattle Inventory (Head) 20,000 15,000 10,000 y = x R² = % 9,283 5,000 y = x R² = 3E % y = x R² = % 4,500 2,928 0 y = x R² = % 1,855 Teton County Lincoln County Sublette County Total Snake/Salt Basin Linear (Teton) Linear (Lincoln) Linear (Sublette) Linear (Total) Figure 1: Cattle Inventory and Historic Trends in the Snake/Salt Basin by County Dairy Cattle NASS data provided dairy cattle inventories by head from 1975 to for Teton, Lincoln, and Sublette Counties. Due to the very small numbers of dairy cattle located within Teton and Sublette Counties, dairy cattle counts were merged into the cattle counts for those counties. The data for Lincoln County lacked records for the years 2009 through which were filled by using the average annual rate of decline from 2004 through 2008, or approximately 6 percent. The only portion of the Snake/Salt Basin where notable numbers of dairy cattle are still found is in the Star Valley region in Lincoln County (Salt River Sub-basin). For many years, the Star Valley region was home to numerous dairies. In recent years, however, the cheese factory in Star Valley has closed along with a cheese factory and creamery in Rexburg, Idaho. This has forced many dairy operations to haul milk farther out of the valley to other areas in Idaho. This situation, along with other compounding factors, has led to the shut-down of some dairy cattle operations in the area. As such, there has been a shifting away from traditional dairy to small Wyoming Water Development Office Page 5
6 acreage operations involving various livestock (horses, cattle, alpaca, etc.). Despite the significant regional decline in dairy industry, about four to six dairies still operate within the valley today. Four of these operations are in Wyoming (Lincoln County Conservation District, ) (Lincoln County Planning and Engineering, ) (Star Valley Conservation District, ). Based on the above evidence, a current-day, year round average of 405 dairy cattle head was assumed to reside in Lincoln County within the Snake/Salt Basin, or 40 percent of the total county counts provided by NASS for year. Note that for this analysis, due to the very small numbers of dairy cattle located within Teton and Sublette Counties, dairy cattle counts were merged into the cattle counts for those counties. Figure 2 illustrates the resulting historic trend of dairy cattle inventories within Lincoln County and the Snake/Salt Basin. The figure approximates the overall decline in dairy cattle numbers since 1975, peaking with nearly 2,000 head in 1990 and then dropping to an estimated 405 head in. A linear regression line and equation are also shown to help illustrate the historic population trend. The slope of the line gives the approximate decrease in annual dairy cattle inventory over the historic period of record. The growth rate corresponding to the regression line is also shown on the figure. Similar to the cattle inventory, the available historic data from NASS represented total dairy cattle numbers in all of Lincoln County. Therefore, the overall shape of the graph provides an indication of historic trending within Lincoln County in its entirety and not necessarily related to historic occurrences specific to within the Basin. Dairy cattle numbers have been calibrated by percentage of total to reflect current day inventories within the Basin; the overall shape of each graph remains attached to historic trending in the entire county. Wyoming Water Development Office Page 6
7 2,250 2,000 1,750 Dairy Cattle Inventory (Head) 1,500 1,250 1, y = x R² = % Lincoln County Linear (Lincoln) Figure 2: Dairy Cattle Inventory and Historic Trends in the Snake/Salt Basin in Lincoln County Sheep NASS data provided sheep inventories by head from 1975 to for Teton, Lincoln, and Sublette Counties. The data for Teton County lacked records for the years 2001 through 2009 which were filled by linear interpolation based on a count of 1,000 head in year 2000 and a count of 300 head in years 2010 through. The Lincoln County NASS data lacked records for years 2004 through 2007 which were also filled by linear interpolation. For Sublette County, data were only available through year A straight line reduction was applied from a count of 1,120 sheep in 2003 to 300 sheep in. In Teton County, NASS records indicate a current count of 300 sheep in. Most of these sheep reside in the Teton Range s western aspects near Alta, Wyoming. There are currently no notable sheep counts in the Jackson area (Resor, ). Within Lincoln County, a few sheep ranches currently operate in the Narrows (Star Valley, Salt River Sub-basin). Also, based on a rough count, approximately 23,000 sheep still utilize grazing allotments within the USFS Greys River District during the summer months (Star Valley Conservation District, ). Given the above evidence obtained from interviews, a current-day, year round average of 10,920 sheep head was assumed to reside in Lincoln County within the Snake/Salt Basin, or 28 percent of the total county counts provided by NASS for. Only a limited number of sheep currently inhabit the upper portions of the Hoback River Basin in Sublette County, most staying on forest allotments managed by the Big Piney Forest District Wyoming Water Development Office Page 7
8 (Sublette County Conservation District, ). A current-day, year round average of 300 sheep head was assumed to reside in Sublette County within the Snake/Salt Basin, or 8 percent of the total county counts provided by NASS for year. Figure 3 illustrates the approximated historic trends of sheep inventories within the Snake/Salt Basin by county. The figure shows a fairly steady sheep count for Teton and Sublette Counties throughout the period of record. Historic counts for sheep in Lincoln County have been sporadic, ranging from nearly 16,000 sheep in 1975, dropping to about 7,000 sheep in 1991, and increasing again to a current count of approximately 11,000 head. As indicated on the figure, it is estimated that 11,520 sheep currently reside within the Snake/Salt Basin. Current year () counts for each county are also shown on the chart. Linear regression lines and equations are displayed to help illustrate the historic population trend for each county. The slope of the line gives the approximate increase or decrease in annual sheep population over the historic period of record. The growth rates that correspond to the regression lines are also shown on the figure. Once again, the available historic data were limited to total county numbers. For Lincoln and Sublette Counties, sheep counts obtained from NASS included those residing outside of the Snake/Salt Basin. Therefore, the overall shape of the graphs provides an indication of historic trending within those entire counties and not necessarily related to historic occurrences specific to within the Basin. Sheep numbers have been calibrated by percentage of total to reflect current day inventories within the Basin; the overall shape of each graph remains attached to historic trending in the entire county. Wyoming Water Development Office Page 8
9 18,000 16,000 14,000 Sheep Inventory (Head) 12,000 10,000 8,000 6,000 y = x R² = % 11,520 10,920 y = x R² = % 4,000 2,000 y = x R² = % y = x R² = 6E % Teton County Lincoln County Sublette County Total Snake/Salt Basin Linear (Teton) Linear (Lincoln) Linear (Sublette) Linear (Total) Figure 3: Sheep Inventory and Historic Trends in the Snake/Salt Basin by County Horses NASS data provided inventories of horses for Teton, Lincoln, and Sublette Counties in five-year increments, starting with year 1975 and ending with year Data for all the missing years between 1975 and 2007 were filled by linear interpolation between known quantities. To estimate counts from 2008 to, data were filled for each county by using the average rate of increases tallied over the period of record: for Teton County, approximately 5.0 percent; for Lincoln County, approximately 2.7 percent; and for Sublette County, approximately 1.6 percent. Most horses within the Snake/Salt Basin are being used for recreational riding, although some working ranch horses are still in use. There are private recreational horses and commercial recreational horses. Commercial recreational horses are those used by outfitters, recreational riding businesses, and dude ranches. Private recreational horses are those owned by individuals who reside on one of the numerous ranchettes in the basin. Historic and current horse counts described in the following paragraphs are comprised of all of these usage types. In Teton County, the previous Basin Plan estimated 1,794 horses in year 2002, which closely corresponds to NASS count of 1,753 horses for the same year. For 2007, NASS records indicated a count of about 3,100 horses. Extrapolating the data to year as described above yielded a current count of 4,005 horses, encompassing private, commercial, and working horses in Teton County. Wyoming Water Development Office Page 9
10 Horses used for commercial riding in the Snake/Salt Basin are frequently wintered in Lincoln County. For instance, Yellowstone Outfitters operates dude ranches in Yellowstone National Park and normally winters around 1,000 horses in the Star Valley region. A number of these horses are also rotated from the area to Yellowstone and different parts of the Basin throughout the year for commercial riding. Private recreational horses in Lincoln County are difficult to estimate since they are usually not counted in any census. However, there are numerous 5- to 10-acre ranchettes in the area with families that own 2 or 3 horses (Lincoln County Brand Inspector, ) (Lincoln County Conservation District, ) (Star Valley Conservation District, ). The previous Basin Plan estimated 959 horses in Lincoln County in year Based on this information, a current-day, year round average of 1,182 horses was assumed to reside in Lincoln County within the Snake/Salt Basin, or 28 percent of the total county counts provided by the study team s extrapolation of NASS data to. These horse counts are comprised of private, commercial, and recreational horses. Approximately 400 horses currently inhabit the upper portions of the Hoback River Basin in Sublette County, but most of these are wintered elsewhere (Sublette County Conservation District, ). The previous Basin Plan estimated 122 horses in Sublette County in year A current-day, year round average of 162 horses was assumed to reside in Sublette County within the Snake/Salt Basin, or 3.5 percent of the total county counts provided by the study team s extrapolation of NASS data to year. Once again, these horse counts encompass private, commercial, and recreational horses. Figure 4 illustrates the approximated historic trends of horse inventories within the Snake/Salt Basin by county. The figure demonstrates a relatively strong increase in the number of horses in Teton County most likely related to the expansion of commercial riding sectors in the area. Horse numbers in Lincoln and Sublette Counties within the Basin have also been increasing but at lower rates than in Teton County. As indicated on the figure, it is estimated that 5,349 horses currently reside within the Snake/Salt Basin. Current year () counts for each county are also shown on the chart. Linear regression lines and equations are displayed to help illustrate the historic population trend for each county. The slope of the line gives the approximate increase or decrease in annual horse population over the historic period of record. The growth rates corresponding to the regression lines are also presented on the figure. As previously stated, the available historic data were limited to total county numbers. For Lincoln and Sublette Counties, horse counts obtained from NASS included those residing outside of the Snake/Salt Basin. Therefore, the overall shape of the graphs provides an indication of historic trending within those entire counties and not necessarily related to historic occurrences specific to within the Basin. Horse numbers have been calibrated by percentage of total to reflect current day inventories within the Basin; the overall shape of each graph remains attached to historic trending in the entire county. Wyoming Water Development Office Page 10
11 6,000 5,349 5,000 Horses Inventory (Head) 4,000 3,000 2,000 y = x R² = % 4,005 y = x R² = % 1,000 0 y = 17.68x R² = % y = x R² = % 1, Teton County Lincoln County Sublette County Total Snake/Salt Basin Linear (Teton) Linear (Lincoln) Linear (Sublette) Linear (Total) Figure 4: Horse Inventory and Historic Trends in the Snake/Salt Basin by County Bridger Teton National Forest Grazing Allotments In the Buffalo Ranger District within Teton County, allotment numbers have dramatically dropped since the previous Basin Plan and prior to two years ago. Personnel from the Buffalo Ranger District noted that most of the allotments have been abandoned due to livestock predation from wolves and grizzly bears. Currently, a single allotment exists in this district, permitted for 55 mother cows and 20 yearlings owned by a local family within the Basin (Buffalo Ranger District, ). Within the Jackson Ranger District, only two active allotments are in place, used by a small, but unknown number of livestock (Teton County Brand Inspector, ). A number of active allotments are in place within the Greys River Ranger District. Some of these allotments are located within the Salt River Basin. The permits consist of cattle-horse allotments and sheep-horse allotments. The number of livestock on these allotments varies from year to year depending on markets and range conditions. Also, the majority of sheep using these allotments are brought in from out of state, mainly Idaho (Greys River Ranger District, ). 2.2 Irrigation Crop production in the Basin has not changed much since the previous Basin Plan, still mainly consisting of hay (both irrigated meadow and alfalfa) used for supplemental livestock feed. There is some grain grown in the Teton River Basin on the west side of the Teton Range and along the Salt River. Some grass pasture is also irrigated in these areas. According to data acquired from the NASS website, roughly 60 percent to 85 percent of irrigable lands within Teton County have been historically irrigated since 1987 (NASS, ). Wyoming Water Development Office Page 11
12 As shown on Figure 5, the Update established the following seven irrigation zones as a basis for obtaining representative climatic data, cropping patterns, and consumptive irrigation requirements: Zone 1: Teton Zone 2: Upper Snake Zone 3: Lower Snake Zone 4: Hoback Zone 5: Lower Salt Zone 6: Upper Salt Zone 7: Greys Table 3 presents irrigated acreage quantities established for the Update, by crop and county, for each of the seven irrigation zones. The table demonstrates the differences in crop types between the Teton and Lincoln County portions of the Basin. The vast majorly of acreage within the Snake River Basin (Zones 2 and 3) is planted to mountain meadow hay, followed by only a small amount of grass pasture. The upper elevations of the Hoback River Basin in Sublette County exclusively grow only mountain meadow hay (Zone 4). In contrast, the largest acreage along the Salt River in Lincoln County (Zones 5, 6, and 7) is planted to alfalfa, followed by comparable mixes of grain and grass pasture. Only a small amount of mountain meadow hay is irrigated in Lincoln County. The irrigated lands within the Teton River Basin near Alta (Zone 1) are somewhat an exception, growing relatively equal portions of alfalfa, grain, and grass pasture. Note that Irrigation Zone 1 (Teton) is located on the western aspects of the Teton Range near Alta, Wyoming. Irrigation within this zone does not deplete surface water sourced from the main stem of the Snake River or its tributaries; instead, it draws upon surface water supplied within the Teton River Sub-basin. Table 3: Current Irrigated Acreage within the Snake/Salt Basin by Crop and County County Irrigation Zone Alfalfa Grain Mtn. Grass Meadow Pasture 1 Hay 1 Total Zone 1: Teton 1,859 1,394 1, ,647 Teton Zone 2: Upper Snake ,967 6,967 Zone 3: Lower Snake ,657 18,017 Total Teton County 1,859 1,394 1,754 24,624 29,631 Sublette Zone 4: Hoback ,979 3,979 Zone 5: Lower Salt 19,610 8,453 4,057 1,691 33,810 Lincoln Zone 6: Upper Salt 15,690 5,648 7,531 2,510 31,380 Zone 7: Greys Total Lincoln County 35,300 14,101 11,588 4,430 65,419 Total Snake/Salt Basin 37,159 15,495 13,343 33,033 99, Cropping mixes assumed for this study were similar to those used in the previous Basin Plan. The distinction between grass pasture and mountain meadow hay is based on the method of irrigation, with grass pasture being sprinkler irrigated and mountain meadow hay being flood irrigated. For further information on irrigation zones and cropping patterns, refer to Technical Memorandum, Tab XX: Crop Water Requirements. Additional information on the quantification of irrigated acreages within the Snake/Salt Basin for the Update can be found in Technical Memorandum, Tab XX: Irrigated Acreage. Wyoming Water Development Office Page 12


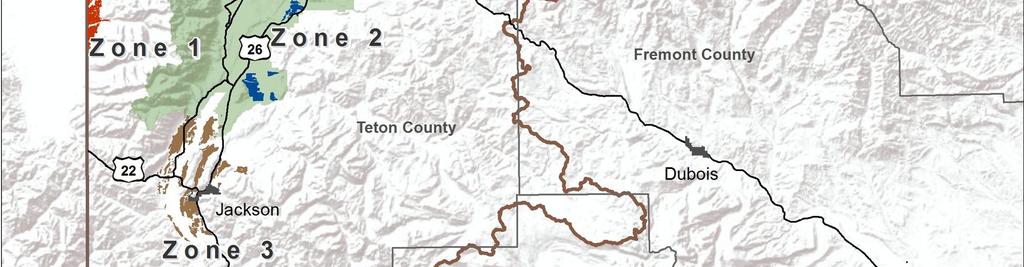


13 Figure 5: Irrigation Zones Established for the Snake/Salt River Basin Wyoming Water Development Office Page 13
14 3.0 Future Projections Section 3.0 discusses the future projections of agricultural activity within the Snake/Salt Basin in terms of livestock and irrigation. Section 3.1 summarizes the approach used to develop the projections. Section 3.2 discusses the livestock inventory projections, and Section 3.3 discusses projections in terms of irrigation acreage. 3.1 Approach for Developing Projections Future projections for this Update utilized a 20-year planning horizon, forecasting agricultural activity and water use to year 2032 under the same three scenarios used in the previous Basin Plan: high-growth, mid-growth, and low-growth. The high-growth scenario incorporates the study team s views of the most growth that could potentially occur over the forecast horizon while the low-growth scenario represents the least growth expected to occur. The mid-growth scenario embodies the study team s view of the most realistic level of growth likely to occur within the projection period (BBC Research & Consulting (b), 2002). Using trend analyses on the historic data that stretch back to 1975, livestock numbers were projected from the last year of historic data () to the end of the planning horizon (2032) based on assumed projection rates. A key assumption in this approach was that future changes in livestock inventories will more or less follow similar time-trends as historic inventories. Projections in irrigation were applied to the current-day estimated irrigated acreages tallied as part of the Update and as discussed in Section 2.2. Projections rates used in this study considered information obtained from interviews along with information presented in the previous Basin Plan regarding potential future constraints to agricultural growth (BBC Research & Consulting (b), 2002). All projections for this analysis were calculated annually based on the straight-line projection method as expressed in Equation 1. Equation 1 P FUTURE Rate P 100 INITIAL P PREVIOUS where, P FUTURE = future, or next year s population Rate = projection rate in percent P INITIAL = initial population (in this case, year population) P PREVIOUS = previous year s population 3.2 Livestock Individual projection rates were assumed for each county within the Snake/Salt Basin for cattle, dairy cattle, and sheep. In other words, the projection rate used for sheep in Lincoln County was different than the projection rates used for sheep in in Teton County. Individual projections rates for horses were assumed for three different usage categories: private, commercial, and working horses. Wyoming Water Development Office Page 14
15 The general aim in estimating and assigning livestock projections rates for the mid-growth scenarios was to keep the numbers roughly the same to the counts with only modest increases or decreases, reflecting historic trends and information obtained from interviews. For the low-growth scenarios, rates were assumed that resulted in livestock counts to decrease only slightly. Similarly, the high-growth scenarios assumed rates that resulted in livestock counts to only slightly increase. As previously mentioned, a certain number of livestock reside on the western aspects of the Teton Range near Alta, Wyoming. These livestock do not deplete surface water sourced from the main stem of the Snake River or its tributaries; instead, they draw upon surface water supplied within the Teton River Sub-basin. This analysis did not distinguish projections between livestock residing in either of these sub-basins. The following sections describe the further information and assumptions made to estimate future projections for cattle, dairy cattle, sheep, and horse inventories, respectively. Graphical representations of future inventory projections are also provided. Although straight-line projections were employed in this study and successively illustrated on the forthcoming graphs, it should be recognized that actual future livestock increases or decreases will more than likely follow a more sporadic, varied nature, similar to that represented in historic trends. As such, the estimated annual increases or decreases in livestock head that are presented in the following sections should be interpreted from more of an overall perspective on what is generally predicted to occur within the 20-year planning horizon. Cattle Linear regressions of historic data that started in 1975 approximated growth rates for cattle in Teton, Lincoln, and Sublette Counties within the Snake/Salt Basin as percent, zero percent, and 0.75 percent, respectively. This equates to an aggregate historic growth rate of approximately percent for the entire Snake/Salt Basin. (Refer to Figure 1.) For Teton County, a percent growth rate was assumed for the mid-growth scenario to reflect the study team s anticipated overall decline of approximately 45 head of cattle annually during the next 20 years. A percent growth rate was used for the low-growth scenario to suggest a more significant decrease of 90 cattle head annually. For the high-growth scenario, a 0.50 percent growth rate was assumed, representing a potential for a slight annual overall increase of about 23 cattle head. For Lincoln County, a zero percent growth rate was used for the mid-growth scenario, predicating that cattle counts will be roughly constant during the next 20 years. A percent growth rate was used for the low-growth scenario to suggest a slight overall decrease of about 15 cattle head annually. Similarly, for the high-growth scenario, a 0.50 percent growth rate was assumed to suggest a slight annual increase of approximately 15 cattle head. For Sublette County, a zero percent growth rate was used for the mid-growth scenario which assumes that cattle counts will be roughly constant over the planning horizon. A percent growth rate was used for the low-growth scenario to suggest a slight annual overall decrease of Wyoming Water Development Office Page 15
16 about 9 cattle head. Similarly, for the high-growth scenario, a 0.50 percent growth rate was assumed to suggest a slight increase of about 9 cattle head annually. Table 4 summarizes the growth rates assumed for cattle along with the current () and projected (2032) inventories of cattle head by county within the Snake/Salt Basin. Annual overall increases or decreases in cattle populations are also shown. Figure 6 illustrates the projected cattle inventories within the Basin for the high-, mid-, and low-growth scenarios. The historic cattle inventory, trend line, and growth rate is displayed. Current and projected population counts are also shown along with the resulting aggregated projection rates that are comprised of the individual rates assumed for Teton, Lincoln, and Sublette Counties. Table 4: Cattle Projections Summary County Inventory (Head) Growth Scenario Rate Inventory (Head) Annual Increase or Decrease (Head) 2 Teton 4,500 Lincoln 2,928 Sublette 1,855 Total Cattle Snake/Salt Basin 9,283 High 0.50% 4, Mid -1.00% 3, Low -2.00% 2, High 0.50% 3, Mid 0.00% 2,928 0 Low -0.50% 2, High 0.50% 2,041 9 Mid 0.00% 1,855 0 Low -0.50% 1,670-9 High 0.50% 10, Mid -0.48% 8, Low -1.23% 7, Rates shown in Total rows (in italics) represent the resulting rates based on aggregating the individual rates used for Teton, Lincoln, and Sublette Counties. 2. Annual increases or decreases in cattle head should be interpreted from an overall perspective throughout the planning horizon. Actual increases or decreases are expected to be more varied in nature, similar to historic tendencies. Wyoming Water Development Office Page 16
17 Cattle Inventory (Head) 0 5,000 10,000 15,000 20,000 25,000 30,000 y = x R² = % Cattle (Historic) Cattle (High-Growth Scenario) Cattle (Mid-Growth Scenario) Cattle (Low-Growth Scenario) Linear (Cattle (Historic)) 9, % 10, % 8, % 7, Figure 6: Cattle Projections for the Snake/Salt Basin Dairy Cattle The only portion of the Snake/Salt Basin where notable numbers of dairy cattle are still found is in the Star Valley region in Lincoln County (Salt River Sub-basin). As such, projections for dairy cattle within the Snake/Salt Basin were limited to only Lincoln County. Linear regression of historic data from 1975 through approximated a growth rate for dairy cattle in Lincoln County and within the Snake/Salt Basin as percent. (Refer to Figure 2.) A percent growth rate was assumed for the mid-growth scenario to reflect the study team s anticipation of a slight overall decline of about 2 dairy cattle per year over the next 20 years. A percent growth rate was used for the low-growth scenario to suggest a more significant decrease of approximately 8 dairy cattle annually. For the high-growth scenario, a 1.00 percent growth rate was assumed, representing a potential for a slight increase of about 4 dairy cattle per year. Table 5 summarizes the growth rates assumed for dairy cattle along with the current () and projected (2032) inventories within the Snake/Salt Basin. Annual increases or decreases in overall dairy cattle populations are also shown. Figure 7 illustrates the projected dairy cattle inventories within the Basin for the high-, mid-, and low-growth scenarios. The historic dairy cattle inventory, trend line, and growth rate is also displayed. Current and projected population counts are also shown. Wyoming Water Development Office Page 17
18 Table 5: Dairy Cattle Projections Summary County Inventory (Head) Lincoln 405 Growth Scenario Rate 2032 Inventory (Head) Annual Increase or Decrease (Head) 1 High 1.00% Mid -0.50% Low -2.00% Annual increases or decreases in dairy cattle head should be interpreted from an overall perspective throughout the planning horizon. Actual increases or decreases are expected to be more varied in nature, similar to historic tendencies. Dairy Cattle Inventory (Head) ,000 1,500 2,000 2,500 y = x R² = % Dairy Cattle (Historic) Dairy Cattle (High-Growth Scenario) Dairy Cattle (Mid-Growth Scenario) Dairy Cattle (Low-Growth Scenario) Linear (Dairy Cattle (Historic)) % -0.50% -2.00% Figure 7: Dairy Cattle Projections for the Snake/Salt Basin Sheep Linear regressions of historic data that started in 1975 approximated growth rates for sheep in Teton, Lincoln, and Sublette Counties within the Snake/Salt Basin as zero percent, 0.11 percent, and 3.94 percent, respectively. This equates to an aggregate historic growth rate of approximately 0.24 percent for the entire Snake/Salt Basin. (Refer to Figure 3.) For Teton and Sublette Counties, a 0.50 percent growth rate was used for the mid-growth scenarios which assume a slight overall increase of about 2 sheep each year over the planning horizon. For the high-growth scenario, a 1.00 percent growth rate was assumed, representing the potential for a slightly higher increase of approximately 3 sheep per year. A percent Wyoming Water Development Office Page 18
19 growth rate was used for the low-growth scenario to suggest a slight decrease of about a single sheep annually. For Lincoln County, the mid-growth scenario was based on a 0.50 percent growth rate, predicating that sheep numbers would generally increase annually by about 55 sheep. The highgrowth scenario assumed a 1.00 percent growth rate which results in sheep numbers increasing by about 109 per year overall. The low-growth scenario used a zero percent growth rate that assumed sheep counts would remain roughly the same for the next 20 years. Table 6 summarizes the growth rates assumed for sheep along with the current () and projected (2032) inventories of sheep head by county within the Snake/Salt Basin. Annual increases or decreases in overall sheep populations are also shown. Figure 8 illustrates the projected sheep inventories within the Basin for the high-, mid-, and low-growth scenarios. The historic sheep inventory, trend line, and growth rate is also displayed. Current and projected population counts are also shown along with the resulting aggregated projection rates that reflect the individual rates assumed for Teton, Lincoln, and Sublette Counties. Table 6: Sheep Projections Summary County Inventory (Head) Growth Scenario Rate Inventory (Head) Annual Increase or Decrease (Head) 2 Teton 300 Lincoln 10,920 Sublette 300 Total Sheep Snake/Salt Basin 11,520 High 1.00% Mid 0.50% Low -0.25% High 1.00% 13, Mid 0.50% 12, Low 0.00% 10,920 0 High 1.00% Mid 0.50% Low -0.25% High 1.00% 13, Mid 0.50% 12, Low -0.01% 11, Rates shown in Total rows (in italics) represent the resulting rates based on aggregating the individual rates used for Teton, Lincoln, and Sublette Counties. 2. Annual increases or decreases in sheep head should be interpreted from an overall perspective throughout the planning horizon. Actual increases or decreases are expected to be more varied in nature, similar to historic tendencies. Wyoming Water Development Office Page 19
20 Sheep Inventory (Head) 0 2,000 4,000 6,000 8,000 10,000 12,000 14,000 16,000 18,000 y = x R² = % Sheep (Historic) Sheep (High-Growth Scenario) Sheep (Mid-Growth Scenario) Sheep (Low-Growth Scenario) Linear (Sheep (Historic)) 11, % 0.50% -0.01% 13,824 12,672 11, Figure 8: Sheep Projections for the Snake/Salt Basin Horses Linear regressions of historic data approximated growth rates for horses in Teton, Lincoln, and Sublette Counties within the Snake/Salt Basin as 7.07 percent, 3.96 percent, and 2.77 percent, respectively, all indicating that horse numbers have been increasing. This equates to an aggregate historic growth rate of approximately 5.82 percent for the entire Snake/Salt Basin. (Refer to Figure 4.) Rather than by county, future horse numbers were predicted based on three different usage categories: private, commercial, and working horses. Private horses are defined as those owned by individuals who reside outside of municipal areas on one of the many ranchettes within the Basin. Commercial horses are those used by riding businesses such as dude ranches and outfitters. Working horses are those owned and used on ranches in a traditional working horse environment. The study team felt that grouping horses into these use categories would help formulate a more tangible basis for projections. A better impression on future horse numbers throughout the Basin could be established rather than developing projections by county. For instance, commercial horses, which represent the largest sector of horses within the Basin, are commonly relocated to different counties throughout different times of the year, thereby making projections by county problematic. From a conceptual perspective, this method proved to be more reasonable and understandable than attempting to project future horse numbers by county. Wyoming Water Development Office Page 20
21 A current year () total count of 5,349 horses within the Snake/Salt Basin was established in Section 2.1. From this total count, percentages of private, commercial, and working horses were assumed as follows: Private Horses: 20 Percent (or 1,070 horses for year ) Commercial Horses: 65 Percent (or 3,477 horses for year ) Working Horses: 15 Percent (or 802 horses for year ) Projection rates for private horses were approximately tied to the projection rates developed for human population growth, predicating that horse numbers would increase at more or less the same rate as the population of individuals residing within rural areas in the Snake/Salt Basin. A 1.00 percent growth rate was assumed for the mid-growth scenario, which equates to an overall increase of about 11 horses per year. The low-growth scenario assumed a 0.30 percent growth rate or an increase of approximately 3 horses each year. For the high-growth scenario, a 2.30 percent growth rate was used, equating to an overall increase of about 25 horses per year. These projection rates generally match the rates assumed for population growth within the Basin. (Refer to, Tab XX: Population and Economics.) Commercial horses represent the largest sector of horse population within the Basin, primarily as part of the burgeoning commercial riding that has been developing in the Basin in order to meet recreational demands. A 1.00 percent growth rate was used for the mid-growth scenario to reflect the study team s assumption that commercial horse counts will generally increase by about 35 horses annually during the next 20 years. A zero percent growth rate was used for the low-growth scenario to suggest no change in commercial horse numbers within the planning horizon. For the high-growth scenario, a 2.00 percent growth rate was assumed to suggest an overall annual increase in commercial horse numbers by about 70 horses. For working horses, a zero percent growth rate was used for the mid-growth scenario to suggest that the number of traditional working horses within the Basin would stay roughly the same during the next 20 years. A percent growth rate was used for the low-growth scenario to suggest an overall decline in working ranch horse numbers of about 8 horses per year. For the high-growth scenario, a 0.50 percent growth rate was assumed to propose a slight increase in working horse numbers of about 4 per year. Table 7 summarizes the growth rates assumed for horses along with the current () and projected (2032) inventories of horse numbers by usage type within the Snake/Salt Basin. Annual increases or decreases in overall horse populations are also shown. Figure 9 illustrates the projected horse inventories within the Basin for the high-, mid-, and low-growth scenarios. The historic horse inventory, trend line, and growth rate is also displayed. Current and projected counts are shown along with the resulting aggregated projection rates that are comprised of the individual rates assumed for private, commercial, and working horses. Wyoming Water Development Office Page 21
22 Table 7: Horse Projections Summary Use Category Private Horses Commercial Horses Working Horses Total Horses Snake/Salt Basin Inventory (Head) 1,070 3, ,349 Growth Scenario Rate Inventory (Head) Annual Increase or Decrease (Head) 2 High 2.30% 1, Mid 1.00% 1, Low 0.30% 1,134 3 High 2.00% 4, Mid 1.00% 4, Low 0.00% 3,477 0 High 0.50% Mid 0.00% Low -1.00% High 1.83% 7, Mid 0.85% 6, Low -0.09% 5, Rates shown in Total rows (in italics) represent the resulting rates based on aggregating the individual rates used for private, commercial, and working horses. 2. Annual increases or decreases in horse head should be interpreted from an overall perspective throughout the planning horizon. Actual increases or decreases are expected to be more varied in nature, similar to historic tendencies. Horse Inventory (Head) 0 1,000 2,000 3,000 4,000 5,000 6,000 7,000 8,000 y = x R² = % 5,349 Horses (Historic) Horses (High-Growth Scenario) Horses (Mid-Growth Scenario) Horses (Low-Growth Scenario) Linear (Horses (Historic)) 1.83% 0.85% -0.09% 7,312 6,258 5, Figure 9: Horse Projections for the Snake/Salt Basin Wyoming Water Development Office Page 22
TABLE OF CONTENTS. B. Future Economic and Demographic Scenarios IV-9
 TABLE OF CONTENTS IV. DEMAND PROJECTIONS IV-1 A. Historic & Current Economic and Demographic Conditions IV-1 Demographic Overview IV-1 Historic Population Growth IV-1 Economic Overview IV-2 Historic Employment
Basin Water Use Profile - Agriculture
 TECHNICAL MEMORANDUM SUBJECT: PREPARED BY: Basin Water Use Profile - Agriculture Sunrise Engineering, Inc. DATE: August 23, 2002 Introduction: Agricultural water uses consume more water than any other
Water Development Office
 THE STATE OF WYOMING Water Development Office 6920 YELLOWTAIL ROAD TELEPHONE: (307) 777-7626 CHEYENNE, WY 82002 FAX: (307) 777-6819 TECHNICAL MEMORANDUM TO: Water Development Commission DATE: November
An Economic Assessment of the Bridger Teton National Forest
 An Economic Assessment of the Bridger Teton National Forest David T. Taylor, Roger H. Coupal, Thomas Foulke, Benjamin Rashford and Desiree Olson University of Wyoming, Department of Agricultural & Applied
Analysis & Comments. Livestock Marketing Information Center State Extension Services in Cooperation with USDA. National Hay Situation and Outlook
 Analysis & Comments Livestock Marketing Information Center State Extension Services in Cooperation with USDA April 2, 2015 Letter #12 www.lmic.info National Hay Situation and Outlook The 2014 calendar
An Overview of Agriculture in the Rural Municipalities of the Lower Souris River Watershed. Dana Harper Jim Unterschultz Scott Jeffrey
 RURAL ECONOMY An Overview of Agriculture in the Rural Municipalities of the Lower Souris River Watershed Dana Harper Jim Unterschultz Scott Jeffrey Project Report #8-3 Project Report Department of Rural
An Economic Profile of the Bridger Teton National Forest
 An Economic Profile of the Bridger Teton National Forest David T. Taylor, Roger H. Coupal, Thomas Foulke, Benjamin Rashford and Desiree Olson University of Wyoming, Department of Agricultural & Applied
Valuing Soil Health Benefits for WY Ranchers. Holly Dyer John Ritten John Tanaka David Taylor Kristie Maczko Jennifer Moore-Kucera
 Valuing Soil Health Benefits for WY Ranchers Holly Dyer John Ritten John Tanaka David Taylor Kristie Maczko Jennifer Moore-Kucera Ranch A Ranch B VS. From the Journal of Integrated Pest Management. https://seocontoh.co/11a6cce/journal-of-integrated-pest-management.html
Basin Water Use Profile Domestic
 TECHNICAL MEMORANDUM SUBJECT: PREPARED BY: Basin Water Use Profile Domestic Sunrise Engineering, Inc. DATE: November 22, 2002 Introduction: Domestic water use consists of the water necessary for the function
Water Development Office
 THE STATE OF WYOMING Water Development Office 6920 YELLOWTAIL ROAD TELEPHONE: (307) 777-7626 CHEYENNE, WY 82002 FAX: (307) 777-6819 TECHNICAL MEMORANDUM TO: Water Development Commission DATE: July 22,
Department of Agricultural and Resource Economics, Fort Collins, CO
 October 2011 EDR 11-01 Department of Agricultural and Resource Economics, Fort Collins, CO 80523-1172 http://dare.colostate.edu/pubs AGRICULTURE ECONOMIC IMPACT OF ENERGY ALTERNATIVES AND CLIMATE CHANGE
Green River Basin Plan Executive Summary
 Green River Basin Plan Executive Summary December 2010 Prepared for: Wyoming Water Development Commission Basin Planning Program Prepared by: WWC Engineering AECOM ERO Resources Corp. Table of Contents
OUTDOOR PROPERTIES. Monroe Land & Livestock
 OUTDOOR PROPERTIES of Monroe Land & Livestock INTRODUCTION Monroe Land and Livestock is an opportunity to own an incredible income generating property. Encompassing 2300+/- total deeded acres, this hay
Irrigation in the Idaho Economy
 Irrigation in the Idaho Economy Garth Taylor, Steve Hines, Terrell Sorensen, and Joel Packham Treasure Valley Irrigation Conference 9am Nampa Civic Center December 15, 2016 Back to 2011 -- 2016 cash receipts
Historical Crop Consumptive Use Analysis North Platte River Basin. Final Report
 Historical Crop Consumptive Use Analysis North Platte River Basin Final Report October 2012 Acknowledgments The work described in this report was funded by the State of Colorado, Colorado Water Conservation
APPENDIX A PROJECT BUILDOUT ANALYSES
 APPENDIX A PROJECT BUILDOUT ANALYSES Project Effects Evaluated. The Mitigated Negative Declaration and Initial Study (MND/IS) is intended to evaluate the potential effects of the above-described general
Duane & Dixie McGarva Ranch
 Duane & Dixie McGarva Ranch 985 acres plus 52 AU BLM Permit Likely, CA BILL WRIGHT SHASTA LAND SERVICES, INC. 358 Hartnell Avenue, Suite C Redding, CA 96002 (530) 91-8100 www.ranch-lands.com Duane & Dixie
Implications for the Regional Economy from Changes in Federal Grazing: Park County, Wyoming
 Implications for the Regional Economy from Changes in Federal Grazing: Park County, Wyoming The Western Regional Science Association Forty-Fifth Annual Meeting Santa Fe, New Mexico February 22-25, 2006
A general pattern of. Private Tribal Public Ownership in Idaho
 WILD OPEN SPACES Rangelands are wild open spaces! Nearly half of Idaho is wild land called "rangeland." These huge areas of grasses, shrubs, wildflowers and scattered trees might seem empty, but they are
Candia Agricultural Survey Proposed Approach
 Candia Agricultural Survey Proposed Approach 1. Set up a survey with questions (below). Have a paper version and SurveyMonkey or other on-line tool for the survey. 2. Start the list with current members
Devin Murnin. Director of Industry Programs Colorado Cattlemen s Association
 Devin Murnin Director of Industry Programs Colorado Cattlemen s Association Colorado Agriculture Statistics Agriculture Second Largest Contributor to Colorado Economy Approximate Land Area: 66.3 Million
Irrigated Lands Mapping and Permit GIS Data
 TECHNICAL MEMORANDUM SUBJECT: PREPARED BY: Irrigated Lands Mapping and Permit GIS Data Robert E. King Sunrise Engineering, Inc. DATE: January 11, 2003 Introduction Irrigated agriculture represents the
Conversion of irrigated agricultural land in the Intermountain West to non-agricultural uses: consequences for water management and hydrology
 Conversion of irrigated agricultural land in the Intermountain West to non-agricultural uses: consequences for water management and hydrology Rob Van Kirk, Humboldt State University, Project Director Brian
EMERGING ISSUES WITH ALFALFA AND FORAGES IN IDAHO
 EMERGING ISSUES WITH ALFALFA AND FORAGES IN IDAHO Glenn E. Shewmaker 1 ABSTRACT Alfalfa is a major crop in acreage and economic importance for Idaho and is used by and marketed for dairy cows, beef cattle,
High Plains Ranch J. Hewlett and J. Parsons
 How Much Risk Is Right For You? Ag Survivor Scenario Guide (July, 2010) #SG-10-08) High Plains Ranch J. Hewlett and J. Parsons The High Plains Ranch is representative of many of the mountain valley cow/calf
Water Development Office
 THE STATE OF WYOMING Water Development Office 6920 YELLOWTAIL ROAD TELEPHONE: (307) 777-7626 CHEYENNE, WY 82002 FAX: (307) 777-6819 TECHNICAL MEMORANDUM TO: Water Development Commission DATE: May 4, 2012
ALFALFA MARKET CONDITIONS AND TRENDS IN WESTERN STATES. Seth Hoyt 1 ABSTRACT
 ALFALFA MARKET CONDITIONS AND TRENDS IN WESTERN STATES Seth Hoyt 1 ABSTRACT After two years of disappointing returns and tough market conditions, alfalfa growers in the western states braced for another
ABSTRACT FARM COSTS AND RETURNS STUDIES
 COSTS and RETURNS ABSTRACT Net returns in 1970 were record-high on viable commercial cattle ranches in the Northern Plains and Northern Rocky Mountain areas, 2 of the most important cow-calf producing
Drought Practices. C. V. Plath James R. Gray. Agricultural Experiment Station Oregon State College Corvallis. Circular of Information 591 August 1958
 Drought Practices C. V. Plath James R. Gray Press or radio ain bulletin shoiim n.t SEr Agricultural Experiment Station Oregon State College Corvallis Circular of Information 591 August 1958 Drought Practices
Kaufman County Appraisal District 3950 S Houston, P O Box 819 Kaufman, TX (972) Phone (972) Fax
 Phone (972) Fax") Kaufman County Appraisal District 3950 S Houston, P O Box 819 Kaufman, TX 75142 (972) 932-6081 Phone (972) 932-4749 Fax (Referenced) Texas Property Tax Code Section 23.51 Guidelines to Qualify for 1-d-1
Kaufman County Appraisal District 3950 S Houston, P O Box 819 Kaufman, TX 75142 (972) 932-6081 Phone (972) 932-4749 Fax (Referenced) Texas Property Tax Code Section 23.51 Guidelines to Qualify for 1-d-1
The Wyoming Wildlife Advocates also value the Caribou-Targhee National
 May 20, 2016 Jay Pence District Ranger USDA Forest Service Caribou-Targhee National Forest P.O. Box 777 Driggs, ID 83422 Re: Comments on the proposed Southern Valley Recreation Project, submitted to the
Report by Greg Dejong, Organic Alberta, September 2018
 ORGANIC AGRICULTURE IN ALBERTA 2017 Statistics Report by Greg Dejong, Organic Alberta, September 2018 TABLE OF CONTENTS EXECUTIVE SUMMARY 02 Methodology 03 Regions 04 ORGANIC OPERATIONS IN ALBERTA 05 Cereal
TIMELY INFORMATION. Agriculture & Natural Resources AGRICULTURAL ECONOMICS AND RURAL SOCIOLOGY, AUBURN UNIVERSITY, AL
 AG ECONOMIC SERIES TIMELY INFORMATION Agriculture & Natural Resources AGRICULTURAL ECONOMICS AND RURAL SOCIOLOGY, AUBURN UNIVERSITY, AL 36849-5639 DAERS 08-5 September 2008 U. S. Beef Cattle Situation
Agriculture Water Demand and Forecasting Technical Work Group: Agenda, Approach, and Key Questions
 Agriculture Water Demand and Forecasting Technical Work Group: Agenda, Approach, and Key Questions Meeting Purposes: Conference Call - January 7, 2013 from 2:00 p.m. 4:00 p.m. 1. Provide a more detailed
HEADQUARTERS WEST LTD. PHOENIX - TUCSON - SONOITA - COTTONWOOD - ST. JOHNS
 Offered for sale exclusively by: Traegen Knight Headquarters West, Ltd. PO BOX 1980 St. Johns, AZ 85936 Phone: (928) 524-3740, Fax: (928) 563-7004, Cell: (602) 228-3494 info@headquarterswest.com www.headquarterswest.com
2 Okanogan County Regional Setting
 1 1 1 1 1 1 1 1 0 1 0 1 Okanogan County Regional Setting.1 Okanogan County Profile Okanogan County is in North Central Washington State. The county borders Canada in the North and the southern and eastern
OUTDOOR PROPERTIES. Independence Valley Farm & Ranch
 OUTDOOR PROPERTIES of Independence Valley Farm & Ranch INTRODUCTION Located in Northeast Nevada, the Independence Valley Farm & Ranch (IVF&R) is a spectacular property with endless natural resources. Currently
Riding Point With Animal Science
 Riding Point With Animal Science April, 2010 Volume 2, No. 4 Proper Scour Prevention Means Healthy Calf Crop Clifford Mitchell Cattle Today Points of Interest By Scott Lake A cattleman s calendar often
A GRAZING AND HAYING SYSTEM WITH WINTER ANNUAL GRASSES. Steve Orloff and Dan Drake 1 ABSTRACT
 A GRAZING AND HAYING SYSTEM WITH WINTER ANNUAL GRASSES Steve Orloff and Dan Drake 1 ABSTRACT Forage to graze is not available for much of the year in the Intermountain Region and producers are forced to
SALZMAN FARM & RANCH
 SALZMAN FARM & RANCH Cochise County, Arizona 8,381 Fee Acres Offered by: J ack Doughty, Three Rivers Ag Investments LOCATION The Salzman Farm and Ranch sits at the north end of the White Water Draw of
CRUMP RANCH ADEL, OR $5,950, CASH REDUCED!! ACRES 2, PRIMARY WATER RIGHTS BEAUTIFUL MEADOWS BLM and STATE LEASES THREE HOMES
 64347 HARNEY AVE CRANE, OR 97732 3910.30 ACRES 2,771.09 PRIMARY WATER RIGHTS BEAUTIFUL MEADOWS BLM and STATE LEASES THREE HOMES CRUMP RANCH ADEL, OR 900 HEAD FEEDLOT SHOP HAY SHED COMMODITY BUILDING FEEDLOT
Challenges in Prospective Temporary Fallowing of Irrigated Agriculture in the Upper Colorado River Basin
 Challenges in Prospective Temporary Fallowing of Irrigated Agriculture in the Upper Colorado River Basin Prepared by Kristin Gangwer for the Environmental Defense Fund December, 2011 Introduction Between
TIMELY INFORMATION Agriculture & Natural Resources
 AG ECONOMIC SERIES TIMELY INFORMATION Agriculture & Natural Resources DAERS 2010 4 September 2010 U. S. Beef Cattle Situation and Price Outlook Walt Prevatt, Ph.D. Extension Economist and Professor Auburn
The Impacts of Increasing Fuel Costs on Nevada s Agricultural Enterprises
 Fact Sheet-08-37 The Impacts of Increasing Fuel Costs on Nevada s Agricultural Enterprises Kynda R. Curtis, Agriculture Marketing Specialist, University of Nevada Cooperative Extension; and Assistant Professor,
The Contributions Approach to Establishing Equitable Pasture Lease Agreements Stocking Rates
 PB 1816-D The Contributions Approach to Establishing Equitable Pasture Lease Agreements This publication provides management information and guidelines for landlords and tenants to follow when negotiating
EC Estimating the Most Profitable Use of Center-Pivot Irrigation for a Ranch
 University of Nebraska - Lincoln DigitalCommons@University of Nebraska - Lincoln Historical Materials from University of Nebraska- Lincoln Extension Extension 1974 EC74-861 Estimating the Most Profitable
TECHNICAL MEMORANDUM
 January 17, 2001 Page 1 TECHNICAL MEMORANDUM SUBJECT: Green River Basin Plan Future Recreational and Environmental Water Requirements PREPARED BY: Gary Watts, Watts and Associates, Inc. Introduction This
Regional Alfalfa Situation
 CENTER FOR GRICULTURL BUSINESS NINETEENTH NNUL GRIBUSINESS MNGEMENT CONFERENCE Executive Summary Regional lfalfa Situation by James H. Cothern, Professor Department of gricultural Economics 2 California
Assessing the impact of long term climate forecast on north central Florida livestock producers using linear programming
 Assessing the impact of long term climate forecast on north central Florida livestock producers using linear programming International Workshop on Regional Integrated Assessment of Climate Impacts Castelvecchio,
CORN: WILL ACREAGE REBOUND IN 2002
 CORN: WILL ACREAGE REBOUND IN 2002 JANUARY 2002 Darrel Good 2002 - NO.1 Summary The USDA s Crop Production and Grain Stocks reports released on January 11 reflected a smaller domestic supply of corn and
Monitoring site - Indian Creek
 Indian Creek Watershed Management Plan GIS and EPA Bacteria Indicator Tool (BIT) February 17, 2009 2009 Indiana GIS Conference Bloomington Monroe County Convention Center Stacey Jarboe, Stantec t Consulting
Chapter 4 Agricultural Resources of Juniata and Mifflin Counties
 Chapter 4 Agricultural Resources of Juniata and Mifflin Counties Agricultural Resources of Juniata and Mifflin Counties Introduction Juniata and Mifflin Counties have significant farmland nestled between
Crop production and cattle census for the 5-state project area. Report prepared for
 Crop production and cattle census for the 5-state project area Report prepared for Legume adoption practices in western central United States: economic and environmental benefits in face of increased climatic
Appendix I. Estimating California s Agricultural Acreage
 Appendix I. Estimating California s Agricultural Acreage How much agricultural land is there in California? Of course, the answer depends on how agricultural land is defined. But even when one is working
MADISON WATERSHED PLANNING
 Groundwater Information Overview MADISON WATERSHED PLANNING Introduction Less than 1% of freshwater on earth is located in streams, rivers, and lakes. An additional 68 % of earth s freshwater is stored
SURVEY OF LIVESTOCK PRODUCERS IN SOUTHERN NEW ENGLAND
 University of Connecticut College of Agriculture and Natural Resources SURVEY OF LIVESTOCK PRODUCERS IN SOUTHERN NEW ENGLAND Northeast SARE Professional Development Program State Implementation Plan for:
LIMITED IRRIGATION OF FOUR SUMMER CROPS IN WESTERN KANSAS. Alan Schlegel, Loyd Stone, and Troy Dumler Kansas State University SUMMARY
 LIMITED IRRIGATION OF FOUR SUMMER CROPS IN WESTERN KANSAS Alan Schlegel, Loyd Stone, and Troy Dumler Kansas State University SUMMARY Research was initiated under sprinkler irrigation to evaluate limited
Grain Market & Economic Outlook
 DEC 2014 Corn Contract Grain Market & Economic Outlook DEC 2014 Corn @ $5.15/bu. Stephen R. Koontz Professor & extension economist Department of Agricultural & Resource Economics Colorado State University
native cutthroat, abundant wildlife, and highway 64 frontage.
 Chas S. Middleton and Son has been awarded the privilege of an exclusive listing on a spectacular high mountain ranch The High Timber - owned by one family since 1957. Located in north central New Mexico,
Elko County Cow-Calf Production Costs & Returns, 2006
 Fact Sheet-07-08 (Replaces Fact Sheet-05-40) Elko County Cow-Calf Production Costs & Returns, 2006 Kynda R. Curtis, Agriculture Marketing Specialist, University of Nevada Cooperative Extension; and Assistant
2.1 Summary of Existing and Future Population Estimates
 SECTION 2 Demographics This technical memorandum identifies the uncertainties and describes potential future demographics that might affect wastewater facilities in the City of McCall, Idaho (the City).
WATER ALLOCATION STRATEGIES WHEN IRRIGATION SUPPLIES ARE LIMITED. Dr. Howard Neibling, P.E. 1 ABSTRACT
 WATER ALLOCATION STRATEGIES WHEN IRRIGATION SUPPLIES ARE LIMITED Dr. Howard Neibling, P.E. 1 ABSTRACT A computer-based planning tool (ET Planner) was developed for Southern Idaho conditions to help farmers
Agricultural. Credit Conditions. Farmland Markets Show Signs of Cooling. SURVEY of TENTH DISTRICT
 SURVEY of TENTH DISTRICT Agricultural Credit Conditions S4 et hp tqeuma rb te err 22 00 1 30 FF ee dd ee rraall RReesseerrvvee BBa annk k o of f KKa an ns sa as s C Ci ti ty y Farmland Markets Show Signs
1. GENERAL DESCRIPTION OF LAND USE / COVER TYPES (SEE GENERAL DESCRIPTIONS ON PAGE 7) A 2. ADJACENT LANDS & EASEMENTS 3. FAMILY AGRICULTURAL LEGACY
 A 2. ADJACENT LANDS & EASEMENTS 3. FAMILY AGRICULTURAL LEGACY") CONSERVATION EASEMENT PROJECT: COUNTY: NAME OF LANDOWNER: CELL/OFFICE PHONE: NAME OF FARM / SITE MANAGER: CELL/OFFICE PHONE: GENERAL DESCRIPTION OF LAND USE / COVER TYPES (SEE GENERAL DESCRIPTIONS ON PAGE
CONSERVATION EASEMENT PROJECT: COUNTY: NAME OF LANDOWNER: CELL/OFFICE PHONE: NAME OF FARM / SITE MANAGER: CELL/OFFICE PHONE: GENERAL DESCRIPTION OF LAND USE / COVER TYPES (SEE GENERAL DESCRIPTIONS ON PAGE
FOREST PLAN AMENDMENT FOR GRIZZLY BEAR HABITAT CONSERVATION RECORD OF DECISION FOR THE GREATER YELLOWSTONE AREA NATIONAL FORESTS
 UNITED STATES DEPARTMENT OF AGRICULTURE FOREST SERVICE APRIL 26 FOREST PLAN AMENDMENT FOR GRIZZLY BEAR HABITAT CONSERVATION FOR THE GREATER YELLOWSTONE AREA NATIONAL FORESTS RECORD OF DECISION BEAVERHEAD-DEERLODGE
U.S. DEPARTMENT OF AGRICULTURE ECONOMIC RESEARCH SERVICE August 1972 FCR-83 cooperating with New Mexico State University COSTS NOV
 U.S. DEPARTMENT OF AGRICULTURE ECONOMIC RESEARCH SERVICE August 1972 FCR-83 cooperating with New Mexico State University COSTS NOV 2 1872 and RETURNS FARM COSTS AND RETURNS STUDIES This report is part
ABSTRACT. Keywords: Alfalfa, Medicago sativa, hay production, hay acreage, forage ACREAGE AND PRODUCTION OF HAY
 EMERGING ISSUES WITH ALFALFA IN THE PACIFIC NORTHWEST Glenn E. Shewmaker, Steve C. Fransen, and David A. Hannaway 1 ABSTRACT Alfalfa is a major crop in acreage and economic importance for the Pacific Northwest
Contact your local USDA Farm Service Agency Service Center Office for more information and to apply.
 2017 LIVESTOCK FORAGE DISASTER PROGRAM (LFP) AVAILABLE LFP provides compensation to eligible livestock producers that have suffered grazing losses for covered livestock on land that is native or improved
MAWG "Middle Ground" Proposal Jackson Hole Conservation Area Prescriptions
 MAWG "Middle Ground" Proposal Jackson Hole Conservation Area Prescriptions We recommend the designation of several Jackson Hole Conservation Areas (JHCA) totaling approximately 214,000 acres to be comprised
CALCULATED LAND USE VALUES
 Staff Paper SP 2015-08 May 2015 CALCULATED LAND USE VALUES FOR LOUISIANA S AGRICULTURAL AND HORTICULTURAL LAND, 2011-2014 Prepared for The Louisiana Tax Commission Prepared by Dr. Michael Salassi & Dr.
BEAVER CREEK RANCH McArthur, CA
 BEAVER CREEK RANCH McArthur, CA 2,701 acres BILL WRIGHT & BILL QUINN SHASTA LAND SERVICES, INC. 358 Hartnell Avenue, Suite C Redding, CA 96002 (530) 221-8100 www.ranch-lands.com BEAVER CREEK RANCH McArthur,
This article was presented on June 26, 1996 at the Purdue Hay Day.
 This article was presented on June 26, 1996 at the Purdue Hay Day. CUT FEED EXPENSES BY UTILIZING CORN RESIDUES, STOCKPILED PASTURE AND COVER CROPS 1 G. S. Premachandra, Keith D. Johnson, and Miles E.
APPENDIX F LIVESTOCK MANAGEMENT TOOLS
 APPENDIX F LIVESTOCK MANAGEMENT TOOLS Management of livestock grazing has always been a fluid process that requires the flexibility to address resource issues/concerns as they occur, there is not a one
HARDIN COUNTY APPRAISAL DISTRICT PRODUCTIVITY GUIDELINES
 HARDIN COUNTY APPRAISAL DISTRICT PRODUCTIVITY GUIDELINES 1. To qualify for an agricultural use or timber use, special valuation, a property must be currently devoted principally (the most important or
Considerations in the Dairy Relocation Decision
 Considerations in the Dairy Relocation Decision Brian K. Herbst Joe L. Outlaw 2124 TAMUS 2124 TAMUS College Station, TX 77843-2124 College Station, TX 77843-2124 herbst@tamu.edu joutlaw@tamu.edu David
National Agricultural Statistics Service Overview
 National Agricultural Statistics Service Overview Hubert Hamer, Administrator USDA s National Agricultural Statistics Service Lincoln, Nebraska September 24, 2016 Mission of NASS The National Agricultural
This is a digital document from the collections of the Wyoming Water Resources Data System (WRDS) Library.
 Library.") This is a digital document from the collections of the Wyoming Water Resources Data System (WRDS) Library. For additional information about this document and the document conversion process, please contact
This is a digital document from the collections of the Wyoming Water Resources Data System (WRDS) Library. For additional information about this document and the document conversion process, please contact
Adjustment for Non-Response Bias in a Rural Mailed Survey
 Adjustment for Non-Response Bias in a Rural Mailed Survey By A. L. Finkner Reasonable reliability of the mailed inquiry has been attained by Agricultural Estimates and other agencies whose restricted budgets
Summary of Annual Agricultural Outreach Plan Requirements
 Attachment A WYOMING DEPARTMENT OF WORKFORCE SERVICES INTEGRATED WORKFORCE PLAN PROGRAM YEAR 2013 Modification Summary of Annual Agricultural Outreach Plan Requirements The Agricultural Outreach Plan (AOP)
Relationship Between Land Use and Water Quality
 Quality Assurance. Quality assurance testing of laboratory performance suggests that there are many more organisms in the creeks, sewage effluent and the river than were measured. Laboratory performance
Monroe Land & Livestock Lovelock, Nevada
 The Opportunity Monroe Land and Livestock is one of the finest agricultural properties in the Western U.S. The property is a 100% deeded, diversified farm and ranch operation. The ranch has been owned
Iowa Farm Outlook. February 2018 Ames, Iowa Econ. Info Betting on the Come in the Fed Cattle Market
 Iowa Farm Outlook 0BDepartment of Economics February 2018 Ames, Iowa Econ. Info. 2094 Betting on the Come in the Fed Cattle Market Prices feedlot managers are bidding for feeder cattle suggest that feedlot
Feedlot Financial Needs Report
 Feedlot Financial Needs Report for Feedlots with Less Than 300 Animal Units to Comply with Applicable State Rules and Statutes by October 1, 2010 Minnesota Board of Water and Soil Resources January 2008
Agricultural. Credit Conditions. Cropland values reach record highs. SURVEY of TENTH DISTRICT
 SURVEY of TENTH DISTRICT Agricultural Credit Conditions S3 er dp tqeuma br te err 22 1 1 FF ee dd ee rraall RReesseerrvvee BBa annk k o of f KKa an ns sa as s C Ci ti ty y Cropland values reach record
TRENDS IN ALFALFA HAY MARKETING IN ARIZONA. Barry R. Tickes
 TRENDS IN ALFALFA HAY MARKETING IN ARIZONA Barry R. Tickes Extension Agent, Agriculture, University of Arizona..Cooperative Extension, 1047 4th Avenue, Yuma, AZ 85364 Abstract: Alfalfa has historically
3.3 Denmark (Mette Vaarst, Anne Braad Kudahl)
") 3.3 Denmark (Mette Vaarst, Anne Braad Kudahl) The majority of the milk in Denmark is produced in Jutland, the western part of the country. The holdings are basically family farms with one or two employees.
3.3 Denmark (Mette Vaarst, Anne Braad Kudahl) The majority of the milk in Denmark is produced in Jutland, the western part of the country. The holdings are basically family farms with one or two employees.
ARIZONA CONSERVATION REQUIREMENTS. Management Plans MUNICIPAL CONSERVATION REQUIREMENTS
 ARIZONA CONSERVATION REQUIREMENTS Management Plans The Arizona Groundwater Management Code establishes the legal framework for conserving water in Arizona's most populous areas. To help achieve its goals,
Contribution of Agribusiness to the Magic Valley Economy, 2013
 BUL 916 Contribution of Agribusiness to the Magic Valley Economy, 2013 Steven Hines University of Idaho Extension, Jerome County Joel Packham UI Extension, Cassia County Carmen Wilmore UI Extension, Lincoln
BLUESTEM PASTURE RELEASE 2017
 1320 Research Park Dr. Manhattan, KS 66506 Phone (785) 564-6700 BLUESTEM PASTURE RELEASE 2017 Agricultural Land Use Survey Center 304 Waters Hall Manhattan, KS 66506-4026 Phone (785) 532-1517 Released:
WRIA 59 Water Bank Feasibility Study
 DRAFT WRIA 59 Water Bank Feasibility Study Water Bank Demand Evaluation December 31, 2014 Prepared for: Stevens County And WRIA 59 Watershed Management Board Prepared by: Water & Natural Resource Group,
HAY PRICES AND TRENDS IN WESTERN STATES
 HAY PRICES AND TRENDS IN WESTERN STATES Seth Hoyt 1 ABSTRACT Alfalfa hay markets in Western States generally follow similar trends. NOT IN 20!! Markets in California, the leading alfalfa hay producing
Pasture Stick. Plate Meter. Estimating Dry Matter Intake. C-Dax Pasture Meter 3/31/2014
 Tuesday March 18, 2014 If you do not monitor it you can not manage it. Tools for monitoring pasture growth. Mat Haan Extension Dairy Educator Penn State Extension Berks County MANAGING PASTURE SURPLUS
THE COST OF PASTURE VERSUS HAY
 THE COST OF PASTURE VERSUS HAY Kenny Burdine Extension Economist University of Kentucky Whenever I discuss the economics of grazing, I like to start by thinking about hay production costs. Regardless of
Lane Code CHAPTER 10 CONTENTS
 Lane Code CHAPTER 10 CONTENTS GENERAL RURAL I DISTRICT (GR-I) 10.112-05 Purpose. 10.112-10 Permitted Buildings and Uses. 10.112-15 Special Uses-Planning Director Approval. 10.112-20 Special Uses-Hearings
Emmett Ranch 194. Gem County, Idaho. Executive Summary Provided by: Garren Apple (208)
") Emmett Ranch 194 Gem County, Idaho Executive Summary Provided by: Garren Apple (208) 546-1194 www.agproconsulting.net EMMETT FARM 194 Gem County - Idaho Location - Description: Access: Features: Water
Emmett Ranch 194 Gem County, Idaho Executive Summary Provided by: Garren Apple (208) 546-1194 www.agproconsulting.net EMMETT FARM 194 Gem County - Idaho Location - Description: Access: Features: Water
Issue Establishing commodity prices and authorizing sale of crops grown at the Twenty Mile South Farm (TMSF).
.") Date: February 15, 2017 To: Public Works Commission From: Ben Nydegger, Biosolids Manager Subject: Minimum Commodity Price List, 2017 Issue Establishing commodity prices and authorizing sale of crops grown
Date: February 15, 2017 To: Public Works Commission From: Ben Nydegger, Biosolids Manager Subject: Minimum Commodity Price List, 2017 Issue Establishing commodity prices and authorizing sale of crops grown
The South Dakota Dairy Industry in 2006
 South Dakota State University Open PRAIRIE: Open Public Research Access Institutional Repository and Information Exchange Fact Sheets SDSU Extension 3-1-2006 The South Dakota Dairy Industry in 2006 Alvaro
Statement of. Jim Stone, Rancher and Chairman Rolling Stone Ranch and The Blackfoot Challenge
 Statement of Jim Stone, Rancher and Chairman Rolling Stone Ranch and The Blackfoot Challenge Before the U.S. House of Representatives Subcommittee on National Parks, Forests, and Public Lands at the hearing
American Indian Reservations Montana, North Dakota, and South Dakota Pilot Project
 Indian Reservations Montana, North Dakota, and South Dakota Pilot Project Specialty Products Part AC0SP Issued October 00 U.S. Department of Agriculture Ann M. Veneman, Secretary Dr. Joseph J. Jen, Under
IRRIGATION WATER USE IN THE YAMPA RIVER BASIN
 IRRIGATION WATER USE IN THE YAMPA RIVER BASIN by D. H. Smith, R. H. Nichols, and F. M. Smith Colorado State University Kent Holt Division 6 Colorado Division of Water Resources No. 8 November 1998 This