Decisions to be Made
|
|
|
- Gavin Stevenson
- 5 years ago
- Views:
Transcription

1 1 Word of the
2 2
3 Decisions to be Made 1. Base Acre Reallocation Decision 2. Payment Yield Update Decision 3. Decision between Price Loss Coverage PLC (price based) Agriculture Risk Coverage ARC (revenue based) 4. Integrating Supplemental Coverage Option (SCO) with crop insurance 3
4 Consider YOUR Objectives What are your risk management needs? What are your objectives with ARC, PLC/SCO choices? Yield risk, price risk, revenue risk, catastrophic low prices Are you attempting to maximize farm program payments or manage revenue risk? Balance and consider near-term payments vs. long-term risk management. Get comfortable with your risk position no matter what happens in the future. 4
5 Timeline for Actions Updated by USDA Base Acre Reallocation and Yield Updates: September 29, 2014 through February 27, 2015 March 31, 2015 Selection of Crop Insurance Options, RP, ACR, SCO March 1 through March 15, 2015 Election of ARC-CO, ARC-IC, or PLC for November 17, 2014 through March 31, 2015 ARC/PLC Annual Enrollment for crop years: Proposed for Mid-April through Summer of
6 Program Compliance Items CCC-931 Average AGI Certification and Consent to Disclosure of Tax Information *$900,000 AGI Limitation AD-1026 Highly Erodible Land Conservation and Wetland Conservation Certification *now also linked to crop insurance subsidy. CCC-901,902, etc. Actively Engaged in Farming/Cash Rent Tenant Determination *Applicable to ARCPLC Program Contact your county FSA for other items. 6

7 Summary Acreage History Report received in August,


8 Base Acre Decision & Payment Yield Decision Reallocate Base Acres according to Plantings or Keep Current Base Reallocate based on plantings Base Acre Decision Do not reallocate, keep current base * * * * * * * * * * * * SEPARATE DECISIONS * * * * * * * * * * Update to 90% of avg. county yield Payment Yield Decision Do not update, keep payment yield Update Payment Yields to 90% of average yield or Keep Current Payment Yields 8
9 Base Acre Decision & Payment Yield Decision Update Decision (Base & Yield) : A current OWNER makes the update decision: Reallocate or Retain Base Acres Update or Retain Yields NOTE: Current owner is defined as an owner on the farm the day the CCC-858 form is submitted to the county office 9
10 Base Acre Decision Reallocate based on plantings Do not reallocate, keep current base 12 Farm owners get a one-time opportunity to reallocate base acres. Not an increase of your total base acres, but a reallocation among your base acres.
11 Base Acre Decision Farm Example #1 Farm #9999 Total Cropland 200 acres Corn Base 80 a. Soybean Base 80 a. Oats Base 40 a. Crop History Corn Soybean

12 USDA Base Reallocation Tool 14
13 Base Acre Decision Farm Example #2 Farm #8888 Total Cropland 200 acres Corn Base 80 a. Soybean Base 80 a. Oats Base 40 a. Crop History Corn Alfalfa (not covered commodity) 15

14 USDA Base Reallocation Tool 16
15 Base Acre Decision Farm Example #3 Farm #7777 Total Cropland 200 acres Corn Base 100 a. Soybean Base 100 a. Crop History Corn Soybeans

16 USDA Base Reallocation Tool 18
17 Base Acre Decision Farm Example #4 Farm #6666 Total Cropland 112 acres Corn Base 80 a. Soybean Base 20 a. Oats Base 12 a. Crop History Corn Soybeans

18 USDA Base Reallocation Tool 20
19 The Value of Corn & Soybean Base The following slides compare the value of corn and soybean base in Kossuth and Lucas Counties by comparing estimated 5-yr total payments from ARC and PLC for corn and for soybeans on graphs. The line that is further to the right and lower is the dominant choice at that particular probability. 21
20 Understanding Charts Used in the Analysis Probability that payment will be that amount or lower The line being to the right shows dominance The line being to the right shows dominance 22 CDF graph: Cumulative Distributive Function
21 The value of Corn & Soybean Base The right most line shows dominance Both corn choices are dominant compared to the soybean choices. 23
22 The value of Corn & Soybean Base The right most line shows dominance Corn is still dominant, but less dominant in this county. 24
23 The Value of Corn & Soybean Base For Kossuth county, corn base is expected to have more value than soybean base as either option in corn (ARC or PLC) dominate both of the soybean options. For Lucas county, corn base is more valuable that soybean base, but is not as dominant as in Kossuth county. About 7% of the time, soybean base in ARC will outperform corn base in ARC. 25

24 Payment Yield Decision Update to 90% of average yield Do not update, keep current payment yield Update Payment Yields to 90% of average yield or Keep Current Payment Yields 26
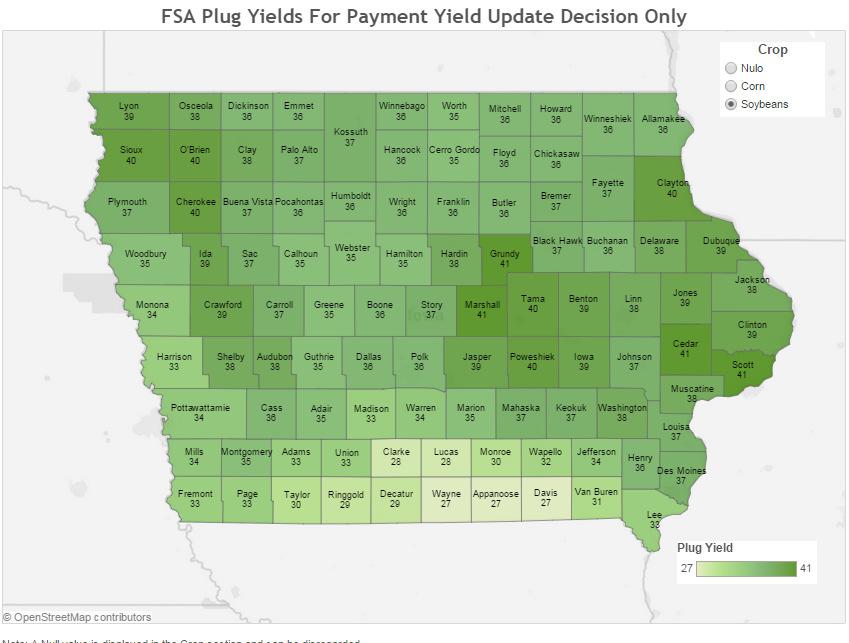
25 Update Payment Yields to 90% of avg. yield or Keep Current Payment Yields Farm owners get one-time opportunity to update payment yields. Crop-by-crop decision: yields can be updated for one crop, but not the other. Payment yields will be 90% of average yield per planted acre. If farm yield in any of the years is less than 75% of the county yield, USDA will assign 75% of county yield for that year as a plug yield. 27
26 Using Plug Yields in Payment Yield Update If any year s yield ( ) is less than 75% of the simple yield average, then the substitute yield of 75% of the county average is used for that year in the calculation. If there are no yield records for a year the crop was planted, then substitute yield is used for that year. If there is a year with no planted acres for the crop, then that year is not used in the average Prevented planting acres are also not used in the average. 29
27 Update Payment Yields to 90% of avg. yield or Keep Current Payment Yields 30 Example #1: Payment Yield Using Plug Yield: Corn County Example Adjusted Yield Farm Yield Farm Yield Average Yield Plug (75% of Avg.) 128 Updated Payment Yield (90%) 152 Current Payment Yield 138 Easy decision here, but each farm and/or county may face a different situation.
28 Update Payment Yields to 90% of avg. yield or Keep Current Payment Yields Example #2: Payment Yield Using Plug Yield: Corn 31 County Example Adjusted Yield Farm Yield Farm Yield not planted not planted Average Yield Plug (75% of Avg.) 128 Updated Payment Yield (90%) 140 Current Payment Yield 138 Easy decision here, but each farm and/or county may face a different situation.
29 Certified Yield Evidence Self-certified yields are subject to spot-check and the owner will be responsible for providing the records to verify the accuracy of the yields. Acceptable records for a spot-check would include: RMA data, specific year yields used in APH records Production Evidence, sold or commercial storage On-Farm storage records FSA Loan Records ACRE program yields Keep your records in case of spot-check 32
30 Using Plug Yields in Payment Yield Update Notes: The plug yields really matter to the payment yield update some counties may have 2 production shortfalls in the 5 year period. If you had a low yield(s) in those years, your updated yield may not be as high as expected. Review your yield history for corn & soybeans. The next two slides are maps that show the plug yields (for the yield update decision only) 33
31 34
32 35
33 Farm Program Decision PLC ARC-CO (county) ARC-IC (individual) PLC = Price Loss Coverage ARC = Agriculture Risk Coverage 37
34 ARC/PLC Election Process Current Producers make the Election of PLC, ARC-CO or ARC-IC on each FSA Farm Number: a. Current producers with an interest in cropland on the farm will make the one-time irrevocable election. b. Failure to make an election by the deadline will result in PLC election starting in 2015 through 2018 and NO payments for
35 ARC/PLC Election Process Current Producer: Means the person or legal entity meeting the definition of producer on the day that person or legal entity is signing any form or performing any action required for the election process. 39
36 ARC/PLC Election Process Definition of a producer: A person or legal entity with a share in a crop on cropland on the farm and shares in the risk of producing the crop on the farm. NOTE: Cash Rent Owners do not have a share in the crop nor does the owner share in the risk of producing the crop 40
37 Farm Program Decision One-time, five year election decision, each program based on base acres PLC ARC (county) ARC (individual) Decision between Price Loss Coverage (price based) Agriculture Risk Coverage (revenue based) 41

38 Farm Program Decision PLC ARC (county) ARC (individual) Program Name: What is covered? Payment on what percentage of base acres? How is benchmark revenue/price guarantee determined? If there is a payment, what is the payment? 42 Price Loss Coverage Agriculture Risk Coverage (county) Agriculture Risk Coverage (individual/farm) Individual commodities Individual commodities All commodities combined Payments on 85% of base acres Reference Prices: Corn = $3.70 Soybeans = $8.40 Difference between actual price (larger of actual MYA price & the loan rate) and reference price X 85% PLC participants may buy Supplemental Coverage Option (SCO) starting in 2015 Payments on 85% of base acres 5-year Olympic average* of county yields multiplied by the 5-year Olympic average* of national prices Difference between actual county revenue and county ARC revenue guarantee (86% of benchmark) X 85% (limit:10% of benchmark) Payments on 65% of TOTAL base acres on farm 5-year Olympic average* of revenue sum (national price X farm yield) for all covered commodities Difference between actual revenue and individual ARC revenue guarantee (86% of benchmark) X 65% (limit:10% of benchmark) *Olympic average (drop high & low before averaging)
39 What is covered? Payment on what percentage of base acres? How is benchmark revenue/price guarantee determined? If there is a payment, what is the payment? Farm Program Decision Price Loss Coverage (PLC) Individual commodities Payments on 85% of base acres Reference Prices: Corn = $3.70 Soybeans = $8.40 Difference between actual price (larger of actual MYA price & loan rate) and reference price X 85% PLC participants may purchase Supplemental Coverage Option (SCO) starting in
40 Farm Program Decision Price Loss Coverage (PLC) What is covered? Individual commodities With PLC, corn and soybeans can be covered separately 44
41 Farm Program Decision Price Loss Coverage (PLC) Payment on what percentage of base acres? Payments on 85% of base acres For Farm Example #1: 100 A. Corn base &100 A. Soybean base: Payment would be on 85 A. corn and 85 A. soybeans; >Not based on planted acres< 45
42 Farm Program Decision Price Loss Coverage (PLC) How is price guarantee determined? Reference Prices: Corn = $3.70 Soybeans = $8.40 For PLC, payments are made only if Marketing Year Average (MYA) price is below reference price 46
43 Farm Program Decision Price Loss Coverage (PLC) If there is a payment, what is the payment? Difference between actual price (larger of actual MYA price & loan rate) and reference price X 85% Example: If MYA price for 2015 is $3.45, payment would be ($3.70 minus $3.45) X payment yield X 85% X base acres 47 *subject to payment limits
44 Farm Program Decision Agriculture Risk Coverage (ARC-CO) What is covered? Payment on what percentage of base acres? How is benchmark revenue/price guarantee determined? If there is a payment, what is the payment? Individual commodities Payments on 85% of base acres 5-year Olympic average* of county yields multiplied by the 5-year Olympic average* of national prices Difference between actual county revenue and county ARC revenue guarantee (86% of benchmark) X 85% (limit:10% of benchmark) *Olympic average (drop high & low before averaging) 48
45 Farm Program Decision Agriculture Risk Coverage (ARC-CO) What is covered? Individual commodities With ARC-CO, corn and soybeans can be covered separately. For example, a farm can have ARC-CO for soybeans and PLC for corn. 49
46 Farm Program Decision Agriculture Risk Coverage (ARC-CO) Payment on what percentage of base acres? Payments on 85% of base acres For Farm Example #1: 100 A. Corn base & 100 A. Soybean base: Payment would be on 85 A. corn and 85 A. soybeans; >Not based on planted acres< 50
47 Farm Program Decision Agriculture Risk Coverage (ARC-CO) How is benchmark revenue determined? 5-year Olympic average* of county yields multiplied by the 5-year Olympic average* of national prices *Olympic average (drop high & low before averaging) 51 County Yield Olympic Avg. Yield 171 MYA Corn 2009 $ $ $ $ $4.46 Olympic Avg. Price $ bpa X $5.29/bu. = $905 is benchmark. Payments are based on 86% of benchmark or $778/base acre.
48 Farm Program Decision Agriculture Risk Coverage (ARC-CO) If there is a payment, what is the payment? Difference between actual county revenue and county ARC revenue guarantee (86% of benchmark) X 85% (limit:10% of benchmark) Payments are based on 86% of benchmark or $778/base acre. If Actual County Revenue (county yield X MYA Price) for a year is $728, example payment would be $50 per acre. Payment can not exceed 10% of benchmark or $90.50 in this example 52 *subject to payment limits
49 Farm Program Decision Agriculture Risk Coverage (ARC-IC) What is covered? Payment on what percentage of base acres? How is benchmark revenue/price guarantee determined? If there is a payment, what is the payment? All commodities combined Payments on 65% of TOTAL base acres on farm 5-year Olympic average* of revenue sum (national price X farm yield) for all covered commodities Difference between actual revenue and individual ARC revenue guarantee (86% of benchmark) X 65% (limit:10% of benchmark) *Olympic average (drop high & low before averaging) 53
50 Farm Program Decision Agriculture Risk Coverage (ARC-IC) What is covered? All commodities combined With ARC-IC, all covered commodities are combined. For example corn, soybeans, oats and all program crops which have established base acres are combined. 54
51 Payment on what percentage of base acres? Farm Program Decision Agriculture Risk Coverage (ARC-IC) Payments on 65% of TOTAL base acres on farm For Farm Example #1 (100 A. Corn base, 100 A. Soybean base): Payment would be on 130 acres (65% of 200 A. total base). 55
52 How is benchmark revenue determined? Farm Program Decision Agriculture Risk Coverage (ARC-IC) *Olympic average (drop high & low before averaging) 5-year Olympic average* of revenue sum (national price X farm yield) for all covered commodities 1. National Price X Farm Yield for each of 5 years 2. 70% of county T-yield can be used as plug. 3. The 5-year Olympic average of those revenues. 4. Allocation weighted by planted acres 56
53 If there is a payment, what is the payment? Farm Program Decision Agriculture Risk Coverage (ARC-IC) Difference between actual revenue and individual ARC revenue guarantee (86% of farm benchmark) X 65% (limit:10% of benchmark) Payments are based on 86% of benchmark. If Actual Farm Revenue (farm yield X MYA Price) for a year is less than revenue guarantee, payment is made. Payment can not exceed 10% of farm benchmark. 57 *Subject to payment limitations
54 Farm Program Decision Agriculture Risk Coverage (ARC-IC) Example 100 A. Corn base, 100 A. Soybean base MYA Farm MYA Farm Corn Yield Revenue Soybean Yield Revenue 2009 $ $611 $ $ $ $896 $ $ $ $1,089 $ $ $ $641 $ $ $ $812 $ $702 Olympic Average Revenue (Benchmark Revenue) $783 $569 ARC -IC Revenue Guarantee (86%) $673 $489 Gray figures indicate plugs used: Reference price and/or 70% of county yield. 58
55 Farm Program Decision Agriculture Risk Coverage (ARC-IC) Example ARC-IC Revenue Guarantee (86%) Corn $673 Soybeans $489 If planted 60% corn, 40% soybeans: Farm Revenue benchmark (60% of $673)+(40% of $489)=$600 Actual revenue: Corn = $600, Soybeans = $500. (60% of $600)+(40% of $500)=$560 Benchmark less Actual = $40 X 200 total base acres = $8000. Paid at 65% = $5,200 or $26/acre Max would be 10% of Farm Revenue Benchmark of $600 or $60/acre. 59
56 Market viewpoint influences: Can you project the national average cash prices in 2014, 2015, 2016, 2017 and 2018? Marketing Year Average (MYA) prices are used Annually, this MYA price must be below the reference price to trigger a PLC payment $3.70/bu. Corn; $8.40/bu. Soybeans Price projections and information FAPRI, USDA, CBO, Futures-Based and others 61
57 Prices used in PLC and ARC Price Loss Coverage (PLC) Reference Prices SET UNTIL 2018 Corn $3.70/bu. Soybeans $8.40/bu ARC Price ARC 5 year Olympic Average Market Year Price (for 2014) Year Corn Soybeans 2009 $3.55 $3.70 $ $5.18 $ $6.22 $ $6.89 $ $4.46 $13.00 $5.29 $12.27 These can change every year! 62
58 Prices used in PLC and ARC Price Loss Coverage (PLC) Reference Prices SET UNTIL 2018 Corn $3.70/bu. Soybeans $8.40/bu ARC ARC 5 year Olympic Average Market Year Price Est. (for 2015) Year Corn Soybeans 2009 $3.55 $3.70 $ $5.18 $ $6.22 $ $6.89 $ $4.46 $ $3.70 $3.50 $10.00 $5.29 $ same ARC price as Marketing Year Average (MYA) prices used in ARC price calculations are the average of FAPRI and USDA projected price series.
59 National Average Corn Cash Price Forecasts $5.29/bu. Olympic Average National Price 64 Source: USDA WASDE & FAPRI (Oct 14), ISU Extension
60 National Avg. Soybean Cash Price Forecasts $12.27/bu. OA National Price 65Source: USDA WASDE & FAPRI (Oct 14), ISU Extension
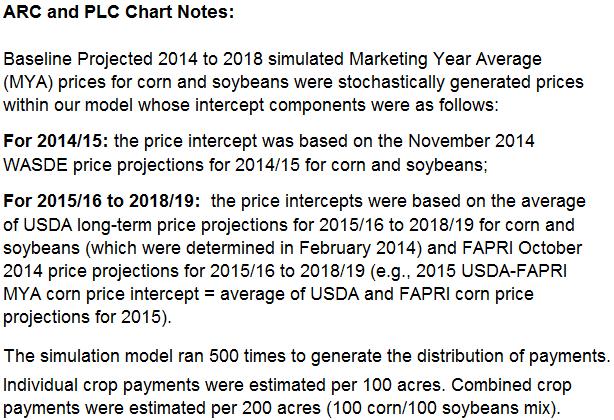
61 Price Comparison: Corn USDA prices: 2014 is November 2014 WASDE price projections for 2014/ /16 to 2018/19 are the USDA long-term price projections for 2015/16 to 2018/19 (which were determined in February 2014). FAPRI prices: October 2014 price projections for 2014/15 to 2018/19. Price intercepts: 2014 is November 2014 WASDE price projections for 2014/ /16 to 2018/19: Average of USDA & FAPRI projections 66
62 Price Comparison: Soybeans USDA prices: 2014 is November 2014 WASDE price projections for 2014/ /16 to 2018/19 are the USDA long-term price projections for 2015/16 to 2018/19 (which were determined in February 2014). FAPRI prices: October 2014 price projections for 2014/15 to 2018/19. Price intercepts: 2014 is November 2014 WASDE price projections for 2014/ /16 to 2018/19: Average of USDA & FAPRI projections 67
63 Prices used in PLC and ARC Price Loss Coverage (PLC) Reference Prices SET UNTIL 2018 Corn $3.70/bu. Soybeans $8.40/bu ARC Price ARC 5 year Olympic Average Market Year Price Est. (for 2016) Year Corn Soybeans 2009 $3.55 $3.70 $ $5.18 $ $6.22 $ $6.89 $ $4.46 $ $3.70 $3.50 $ $3.70 $3.52 $8.89 $4.79 $11.83 ARC price starts to drop in 2016 from $5.29 and $
64 Prices used in PLC and ARC Price Loss Coverage (PLC) Reference Prices SET UNTIL 2018 Corn $3.70/bu. Soybeans $8.40/bu ARC Price Year Corn Soybeans 2009 $3.55 $3.70 $ $5.18 $ $6.22 $ $6.89 $ $4.46 $ $3.70 $3.50 $ $3.70 $3.52 $ $3.70 $3.67 $9.23 Both ARC prices continue decline; adding lower priced years 69 ARC 5 year Olympic Average Market Year Price Est. (for 2017) $3.95 $10.74
65 Prices used in PLC and ARC Price Loss Coverage (PLC) Reference Prices SET UNTIL 2018 Corn $3.70/bu. Soybeans $8.40/bu ARC Price ARC 5 year Olympic Average Market Year Price Est. (for 2018) Year Corn Soybeans 2009 $3.70 $3.55 $ $5.18 $ $6.22 $ $6.89 $ $4.46 $ $3.50 $3.70 $ $3.70 $3.52 $ $3.67 $3.70 $ $3.82 $9.66 $3.74 $9.63 Corn ARC price close to reference price; Soybean ARC price never below reference price.
66 Key Points of ARC and PLC PLC and ARC-CO are commodity by commodity; ARC-IC based on all commodities on farm combined. Relationship of Olympic average price and PLC reference price over the 5 year time period are influential in program choice. If price is well below PLC reference price ($3.70 corn; $8.40 soybeans) during the farm bill period, PLC may be worth consideration; Higher prices? ARC may have an advantage. ARC-CO pays on 85% of base acres, ARC- IC pays on 65% of base acres. 71
67 Let s see what can happen in 2014 to ARC-CO and PLC when the market year average corn price changes. The following slides are updated from the original presentation with the USDA 2014 county yields released in Feb
68 Updated with USDA 2014 county yields released in Feb $3.00
69 Updated with USDA 2014 county yields released in Feb $3.25

70 Updated with USDA 2014 county yields released in Feb $3.50
71 Updated with USDA 2014 county yields released in Feb $3.75
72 Updated with USDA 2014 county yields released in Feb $4.00
73 Let s see what can happen in 2014 to ARC-CO and PLC when the market year average soybean price changes. 78

74 Not updated from original presentation

75 Not updated from original presentation

76 Not updated from original presentation
77 What you have seen so far is static analysis. Now moving into dynamic (Stochastic) analysis. 82
78 Understanding Charts Used in the Analysis 83
79 Understanding Charts Used in the Analysis Probability that payment will be that amount or lower The line being to the right shows dominance The line being to the right shows dominance 84 CDF graph: Cumulative Distributive Function
80 Understanding Charts Used in the Analysis PLC risk management dominates here (larger payments are expected from PLC over this range of the distribution). ARC maxed out (shown by vertical line). ARC risk management dominates here (larger payments are expected at a higher probability from ARC in this area). 85 CDF graph: Cumulative Distributive Function
81 86
82 Kossuth Corn Updated with USDA 2014 county yields released in Feb Prices truncated to the $3.40-$3.90 range in the Feb. WASDE report.
83 Lucas Corn Updated with USDA 2014 county yields released in Feb Prices truncated to the $3.40-$3.90 range in the Feb. WASDE report.
84 Kossuth Soybeans Updated with USDA 2014 county yields released in Feb Prices truncated to the $ range in the Feb. WASDE report.
85 Lucas Soybeans Updated with USDA 2014 county yields released in Feb


86 Updated with USDA 2014 county yields released in Feb Kossuth Corn & Soybeans 91 Prices truncated to the price range in the Feb. WASDE report.
87 Updated with USDA 2014 county yields released in Feb Lucas Corn & Soybeans 92 Prices truncated to the price range in the Feb. WASDE report.
88 Supplemental Coverage Option (SCO) An additional insurance policy to cover shallow losses Shallow loss = part of the deductible on the producer s underlying crop insurance policy SCO has a county-level payment trigger Indemnities are paid when the county experiences losses greater than 14% Premium subsidy: 65% Starts in 2015 Can t elect ARC for a crop and purchase SCO. 94
89 Supplemental Coverage Option (SCO) A couple bad years, APH taken a hit, SCO is county based, A county-based policy may give a better top end coverage, but vulnerable to local event. Individual disaster coverage can be put in place by using a lower % RP product 65% RP & 21% SCO or 75% RP & 11% SCO 95
90 96 ARC & RP85 vs PLC RP75 & SCO Kossuth Corn
91 97 ARC & RP85 vs PLC RP75 & SCO Kossuth Corn
92 98 ARC & RP85 vs PLC RP75 & SCO Kossuth Corn & Soybeans

93 99 ARC & RP85 vs PLC RP75 & SCO Kossuth Corn & Soybeans
94 Side-by-side Program Comparison 100
95 Agricultural Act of 2014 PLC ARC-CO ARC-IC Price and Yield Comparison Uses MYA price and PLC yield Uses MYA price and County Average Yield Uses MYA price and producer s historical yield on the farm(s) Base Acre Comparison Payment determined by individual covered commodity crop base acres Payment determined by individual covered commodity crop base acres Payment determined by planted covered commodities combined on the farm(s) in the State 101
96 Agricultural Act of 2014 PLC ARC-CO ARC-IC Payment Acre Comparison Payments made on 85% of specific crop base acres on farm Payments made on 85% of specific crop base acres on farm Payments made on 65% of TOTAL base acres on farm Production Reports Production report NOT required Production report NOT required Requires annual production report of all covered commodities planted 102
97 Agricultural Act of 2014 PLC ARC-CO ARC-IC Requirement to Plant? Planting of covered commodities NOT required Planting of covered commodities NOT required Planting of covered commodities REQUIRED Program Election Comparison Elect by Covered Commodity Base Acres by farm May mix ARC-CO and PLC on same farm by base crop Elect by Covered Commodity Base Acres by farm May mix ARC-CO and PLC on same farm by base crop Elect on ALL Covered Commodities on the farm ARC-CO & PLC not eligible on farm 103
98 Agricultural Act of 2014 PLC ARC-CO ARC-IC When Do Payments Trigger? When the effective price of a base acreage commodity falls below reference price When the ACTUAL county revenue (per acre) of a base acreage commodity falls below the ARC-CO guarantee for that crop the county. When ACTUAL farm revenue from enrolled farms falls below the calculated ARC-IC guarantee for all enrolled farms in the state. 104
99 Payment Limitations Maximum dollar amount that can be received annually, directly or indirectly, under various programs by a person or legal entity. Such limitations on payments are controlled by direct attribution. 105

100 106 ARC vs PLC Kossuth 1,000 acres Corn & 1,000 acres Soybeans

101 107 ARC vs PLC Kossuth 1,000 acres Corn & 1,000 acres Soybeans
102 Payment Limitations Payment Limitations can impact program choice If payment limits are likely and you have multiple farm numbers: Consider splitting enrollment between ARC & PLC with higher yielding farms in PLC. 108
103 Program Summary Planting and harvesting fruits and vegetables (FAV) is subject to an acre for acre payment reduction when: (No longer a violation ) - More than 15% of base acres of the farm enrolled in ARC-CO or PLC are planted to FAV - More than 35% of base acres of a farm enrolled in ARC-IC are planted to FAV ARC/PLC Payments: 2014 payments are issued after October 1, 2015 for PLC/ARC- CO/ARC-IC if triggered payments are issued after MYA prices are determined and after October 1 of the subsequent year 109
104 Program Summary Current FSA-211, Power of Attorneys, are valid for the ARCPLC program if Section A and B are marked as follows: Section A, item 2, All current and ALL future programs Section B, item 1, All Actions Check with FSA Office on Power of Attorney forms. 110
105 Your Actions ARC/PLC Program Process: Update: Owners can Reallocate Base acres and/or update Counter-Cyclical Yields. Elect: Once Base Acres and Yields are set, then the Election of PLC, ARC-CO or ARC-IC can completed. Enroll: Once Election has been completed then Enrollment takes place. 111
106 Farmer Decision Tools 112

107 Base Reallocation, Yield Update and USDA funded Decision Tools on USDA Website 113
108 ISU s Farm Bill Calculator and Analyzer Type of Information Needed Farm identification Program base acres Reallocated base acres CC (counter-cyclical or old program) yield actual farm yields per planted acre planted and considered planted acres planted yield per acre 114

109 ISU s 2014 Farm Bill Analyzer Example Start by zeroing out the planted and projected planted acres so that you can see only program effects.

110 ISU s 2014 Farm Bill Analyzer Example Select from: USDA FAPRI Futures
111 ISU s 2014 Farm Bill Analyzer Example USDA Price Projections (0 planted acres)
112 ISU s 2014 Farm Bill Analyzer Example Here we inserted the price intercepts used in the Farm Bureau Crop Model (average of FAPRI and USDA)
113 ISU s 2014 Farm Bill Analyzer Example FB Price Intercepts (0 planted acres)
 automatically adjust to a likely")
114 ISU s 2014 Farm Bill Analyzer Example When you change the price projection selection the crop insurance price columns (projected & harvest) automatically adjust to a likely price range.

115 ISU s 2014 Farm Bill Analyzer Example Add planted acres to include the effects of crop revenue and crop insurance in analysis.
116 ISU s 2014 Farm Bill Analyzer Example USDA Price Projections

117 ISU s 2014 Farm Bill Analyzer Example Also, provides dollar amounts of payments and net indemnities for each combination listed.

118 ISU s 2014 Farm Bill Analyzer Example
119 ISU s 2014 Farm Bill Analyzer Example Low Revenue tab = bottom 10% of total crop revenues in each year

120 ISU s 2014 Farm Bill Calculator Example Deterministic (no simulations are involved)
121 127 Agriculture Policy Analysis System (APAS) Information Needed APAS Sample Farm quick review of your county APAS Custom Farm build your farm Farm: state, county, # base acres, entities Add crops: crop, expected yield, 2014 planted acres Base acres, payment yield Select price series: CBO, USDA, FAPRI, Custom Farm Analytics: comparing programs, includes crop insurance
 U.")
122 128 Agriculture Policy Analysis System (APAS) U. Of Illinois FarmDoc
")
123 129 Agriculture Policy Analysis System (APAS)

124 Agriculture Policy Analysis System (APAS) Select: Safety Net Crop revenue only Scenarios 130
125 NAAFP (FAPRI and Texas A&M) Information Needed Login and create new farm unit Farm name, Farm #, crop, state, county Input yields, base, crop insurance, future acres, harvest basis, historical yields, FAPRI, USDA or custom price projections are provided. Graphs and tables presented to compare programs 131
 Decision")
126 133 NAAFP (FAPRI and Texas A&M) Decision Aid

127 134 NAAFP (FAPRI and Texas A&M)
128 Selected USDA-FSA Forms 135

129 136 CCC-859: Yield Worksheet

130 137 CCC-858: Base Reallocation and Yield Update Decision

131 138 CCC-857: ARC and PLC Program Election

132 Reporting on NASS Surveys is Important to Administer Farm Programs and Crop Insurance High quality statistical information is essential for the smooth operation of federal farm programs and crop insurance programs NASS provides the FSA and RMA with important statistics that they use to serve farmers Data are provided in aggregate form so that no individual operation or operator can be identified 139
133 Programs that Depend on NASS State and County Level Data FSA RMA County Loan Rates for Wheat, Feed Grains and Oilseeds Dairy Programs Area Risk Protection Insurance Plan Loan Repayment Rates Program Parameters for ARC and PLC Non-Insured Crop Disaster Assistance Program (NAP) Livestock Disaster Assistance Programs Conservation Reserve Program (CRP) Beginning Farmer Ownership Loan Eligibility Production Loss Calculations Funding Targets and Allocations Actual Revenue History (ARH) Pilot Program Establishment of Transitional Yields Establishment of Price Elections on Non- Program Crops 140

134 Resources: graphs for your county, links, etc. 141
135 Resources for your decisions! click on Decision Farm Bill banner PDF s of graphs for each county, links USDA FSA Farm Bill Base Allocation Tool, Yield Update Tool on right Decision Tools (FarmDoc, Texas A & M) on bottom ISU Extension and Outreach (information and link to decision tools), Farm Bill Information, Ag Risk Library, CFFM, Univ. of Minnesota Farm Bill under Hot Topics Thank You! Individual questions can best be answered at your county FSA office. Please fill out your evaluation and leave with your facilitator. 142
ARC/PLC Program Overview
 ARC/PLC Program Overview FSA and University of MN Extension Producer Meetings December 2014 January 2015 The 2014 Farm Bill provides the following: Eliminates DCP and ACRE program Allows for a one-time
ARC / PLC Program Overview
 ARC / PLC Program Overview 1 The 2014 Farm Bill provides the following: Eliminates DCP and ACRE program Allows for a one-time decision REALLOCATE base acres and/or UPDATE Counter-Cyclical Yields on a farm
ARC / PLC Program Overview
 ARC / PLC Program Overview The 2014 Farm Bill provides the following: Eliminates DCP and ACRE program Allows for a one-time decision REALLOCATE base acres and/or UPDATE Counter-Cyclical Yields on a farm
ARC / PLC Program Overview
 ARC / PLC Program Overview 1 The 2014 Farm Bill provides the following: Eliminates DCP and ACRE program Allows for a one-time decision REALLOCATE base acres and/or UPDATE Counter-Cyclical Yields on a farm
Agricultural Act of 2014
 PLC (Price Loss Coverage) And ARC (Agricultural Risk Coverage) FSA 2014 Farm Bill Training Colorado Producer Meetings 1 Subjects to be covered at today s meeting Elimination of direct payments for 2014
Support for this Farm Bill Educational Programming Effort was done with the help of the following sponsors THE SETTING: 25 YEARS OF CORN PRICES
 Support for this Farm Bill Educational Programming Effort was done with the help of the following sponsors THE SETTING: 25 YEARS OF CORN PRICES 1 FARM AND RISK MANAGEMENT IMPLICATIONS OF THE AGRICULTURAL
2014 Farm Bill Training October 14-17, Agricultural Risk Coverage & Price Loss Coverage. Acreage History Update
 2014 Farm Bill Training October 14-17, 2014 Agricultural Risk Coverage & Price Loss Coverage Acreage History Update ARC/PLC Process ARC/PLC Program Process has three PARTS: Update: Owner(s) choice to reallocate
The Agricultural Act of Farm Service Agency Programs.
 The Agricultural Act of 2014 Farm Service Agency Programs www.fsa.usda.gov/ne The Agricultural Act of 2014 1 2014 Farm Bill 2014 Farm Bill repealed Direct Payments Strengthened the Farm Program Safety
Overview of Commodity Program Changes
 Overview of Commodity Program Changes Jody Campiche Assistant Professor and Extension Economist Oklahoma State University November 10, 2014 Policy changes for commodity producers Elimination of direct,
Covered Commodities. Pulse Crops
 Covered Commodities Wheat, Oats, Barley, Corn, Grain Sorghum, Long Grain Rice, Medium Grain Rice, Pulse Crops, Soybeans, Other Oilseeds and Peanuts Other Oilseeds Sunflower seed, Rapeseed, Canola, Safflower,
Landowner Elections Under 2014 Farm Bill 1/9/15. Ohio Food, Ag, & Environmental Law Webinar Series
 OHIO STATE UNIVERSITY EXTENSION Ohio Food, Agriculture and Environmental Law The 2014 Farm Bill: Guiding a Client through the New Law Bill Bridgforth Ramsay, Bridgforth, Robinson & Raley LLP, Pine Bluff,
retain the counter-cyclical (CC) yield, as listed on the farm record as of September 30, 2013, for upland cotton, multiplied by 2.
 yield, as listed on the farm record as of September 30, 2013, for upland cotton, multiplied by 2.") UNITED STATES DEPARTMENT OF AGRICULTURE Farm Service Agency Washington, DC 20250 Notice ARCPLC-51 For: Upland Cotton State and County Offices Price Loss Coverage (PLC) Yield Update for Seed Cotton Approved
UNITED STATES DEPARTMENT OF AGRICULTURE Farm Service Agency Washington, DC 20250 Notice ARCPLC-51 For: Upland Cotton State and County Offices Price Loss Coverage (PLC) Yield Update for Seed Cotton Approved
2008 Farm Bill: Doug Yoder, Illinois Farm Bureau
 2008 Farm Bill: ACRE Overview Doug Yoder, Illinois Farm Bureau Average Crop Revenue Election (ACRE) ACRE provides a revenue target based on a 2-year moving average of U.S. crop season average price and
Summary and Benefits of ACRE. University of Illinois
 Summary and Benefits of ACRE Gary Schnitkey and Nick Paulson University of Illinois Presentations 2008 FARM BILL: ACRE OVERVIEW Doug Yoder, Illinois Farm Bureau ACRE ELECTION AND ENROLLMENT Stan Wilson,
Steven D. Johnson. Presentation Objectives
 April 2014 Steven D. Johnson Farm & Ag Business Management Specialist (515) 957-5790 sdjohns@iastate.edu www.extension.iastate.edu/polk/farm-management Presentation Objectives Review the latest Corn &
Potential ARC-CO and PLC Payment Calculations Using FAPRI s Baseline MYA Price Estimates
 Staff Report No. 2014-23 December 2014 Potential ARC-CO and PLC Payment Calculations Using FAPRI s Baseline MYA Price Estimates Michael A. Deliberto and Michael E. Salassi Louisiana State University Agricultural
The Price Loss Coverage (PLC) Program of the 2014 Farm Bill
 Program of the 2014 Farm Bill") Staff Report No. 2014-10 July 2014 The Price Loss Coverage (PLC) Program of the 2014 Farm Bill Michael A. Deliberto and Michael E. Salassi Department of Agricultural Economics and Agribusiness Louisiana
Staff Report No. 2014-10 July 2014 The Price Loss Coverage (PLC) Program of the 2014 Farm Bill Michael A. Deliberto and Michael E. Salassi Department of Agricultural Economics and Agribusiness Louisiana
Key Questions You Should Be Asking About Crop Program Decisions Carl Zulauf, Ohio State University, November 2014
 Key Questions You Should Be Asking About Crop Program Decisions Carl Zulauf, Ohio State University, November 2014 Background: Understanding the questions one should ask is always important it is hard to
2008 FARM BILL: WITH FOCUS ON ACRE AND SURE
 2008 FARM BILL: WITH FOCUS ON ACRE AND SURE Carl Zulauf Ag. Economist, Ohio State University Updated: 1 2008 Farm Bill: Big Picture Themes Continued Expansion in Scope of the Bill First livestock title
Making Decisions for the 2014 Farm Bill
 Making Decisions for the 2014 Farm Bill Making Decisions for the 2014 Farm Bill February 2015 Archie Flanders Department of Agricultural Economics and Agribusiness Northeast Research and Extension Center
Seed Cotton Options. Bipartisan Budget Act of 2018 (BBA) Seed Cotton/Generic Base August 2018
 Seed Cotton/Generic Base August 2018") Seed Cotton Options Bipartisan Budget Act of 2018 (BBA) Seed Cotton/Generic Base August 2018 Brandi Roper Tatum Dunklin County Ryan Eddy New Madrid County Chris Grojean Scott County Megan Dunkle Stoddard
Seed Cotton Options Bipartisan Budget Act of 2018 (BBA) Seed Cotton/Generic Base August 2018 Brandi Roper Tatum Dunklin County Ryan Eddy New Madrid County Chris Grojean Scott County Megan Dunkle Stoddard
Figure Farm Bill Spending, June 2017 Congressional Budget Office 10-Year Projections
 FARM BILL The farm bill is omnibus, multi-year authorizing legislation that governs an array of agricultural and food programs. It is typically renewed about every five years. The 2014 Farm Bill contains
Revenue Components. Yield Government Programs Crop Insurance
 Farm Financial Conditions 25th Annual Crop Insurance Conference January 22, 2018 Fargo, ND Andrew Swenson Extension Farm Management Specialist Department of Agribusiness and Applied Economics North Dakota
Seed Cotton As A Covered Commodity:
 Seed Cotton As A Covered Commodity: An overview of new seed cotton provisions added to the 2014 Farm Bill Program information based on a review of the legislative language. Final details are subject to
2014 FARM BILL TRAINING
 2014 FARM BILL TRAINING MARYLAND AUGUST 2014 TOPICS -Average Gross Income -ARC/PLC -Disaster Program Summary -Livestock Indemnity Program -Livestock Forage Disaster Program -Emergency Livestock and Forage
Producer Decisions Under the 2014 Farm Bill: Program Yield Update Decisions
 Producer Decisions Under the 2014 Farm Bill: Program Yield Update Decisions FIRM Team Fact Sheet 14-05 Available at http://www.fs1405.firm.msue.msu.edu David B. Schweikhardt Roger Betz Dennis Stein Adam
A First Look at the Agricultural Improvement Act of 2018 (Farm Bill 2018)-Version 2
-Version 2") A First Look at the Agricultural Improvement Act of 2018 (Farm Bill 2018)-Version 2 Robin Reid (robinreid@ksu.edu), G.A. Art Barnaby (barnaby@ksu.edu), Rich Llewelyn (rvd@ksu.edu) and Mykel Taylor (mtaylor@ksu.edu)
A First Look at the Agricultural Improvement Act of 2018 (Farm Bill 2018)-Version 2 Robin Reid (robinreid@ksu.edu), G.A. Art Barnaby (barnaby@ksu.edu), Rich Llewelyn (rvd@ksu.edu) and Mykel Taylor (mtaylor@ksu.edu)
 Grain Farm Income and Cash Rent Outlook: 2016 and 2017 Sep 7, 2016 Grain Farm Income and Cash Rent Outlook: 2016 and 2017 Budgets in management section of farmdoc Gary Schnitkey University of Illinois
2018 Farm Bill- House Proposal
 2018 Farm Bill- House Proposal The text of the legislation, summary materials and supporting documents shared by the House Agriculture Committee can be found here: https://agriculture.house.gov/farmbill/.
2018 Seed Cotton ARC CO and PLC Programs for Upland Cotton 1 Beginning with the 2018 Crop Draft Updated October 31, 2018
 2018 Seed Cotton ARC CO and PLC Programs for Upland Cotton 1 Beginning with the 2018 Crop Draft Updated October 31, 2018 Program: Seed cotton is designated as a covered commodity eligible for Title I Price
2018 Farm Bill Survey
 2018 Farm Bill Survey In preparation for participating in development of the 2018 Farm Bill, we are surveying producers on key issues that are likely to be considered by Congress during this process. The
LATE PLANTING DECISIONS WITH CROP INSURANCE: DECISION GUIDELINES FOR MICHIGAN FARMERS IN SPRING 2011
 Staff Paper LATE PLANTING DECISIONS WITH CROP INSURANCE: DECISION GUIDELINES FOR MICHIGAN FARMERS IN SPRING 2011 Roger Betz, David B. Schweikhardt, J. Roy Black, and James Hilker Staff Paper 2011-06 June
December Steven D. Johnson
 December 2013 Steven D. Johnson Farm & Ag Business Management Specialist (515) 957-5790 sdjohns@iastate.edu www.extension.iastate.edu/polk/farm-management Learning Objectives Review lessons learned from
ARC or PLC: an example for wheat
 or PLC: an example for wheat April 2014 Grain Marketing Report #01-14 Mark Welch Texas A&M AgriLife Extension Economist 600 John Kimbrough Blvd, AGLS 335 TAMU 2124 College Station, Texas 77843 Tel. (979)845-8011
CRS Report for Congress
 Order Code RS21779 Updated December 13, 2004 CRS Report for Congress Received through the CRS Web Summary Farm Commodity Programs: Direct Payments, Counter-Cyclical Payments, and Marketing Loans Jim Monke
A Business Newsletter for Agriculture
 A Business Newsletter for Agriculture Vol. 6, No. 11 www.extension.iastate.edu/agdm September 2002 Five options offered for 2002 Farm Bill by William Edwards, extension economist, 515-294-6161, wedwards@iastate.edu
THE FARM BILL AND THE WESTERN HAY INDUSTRY. Daniel A. Sumner and William Matthews 1
 THE FARM BILL AND THE WESTERN HAY INDUSTRY Daniel A. Sumner and William Matthews 1 ABSTRACT Farm subsidies have been a part of U.S. agriculture for eight decades. The 2014 farm bill changed the form of
Background on U.S. Agricultural Policy: Food Security Objectives and Trade Implications
 Background on U.S. Agricultural Policy: Food Security Objectives and Trade Implications Workshop Post Bali Agricultural and Trade Policy Options: Focus on China 23 October 2014 jason.hafemeister@fas.usda.gov
Cornhusker Economics
 October 21, 2018 agecon.unl.edu/cornhuskereconomics Cornhusker Economics Farm Programs, Payments and Prospects Market Report Year Ago 4 Wks Ago 10-19-18 Livestock and Products, Weekly Average Nebraska
For additional information, contact the Washington Office staff person who serves your state.
 FARM BILL Issue: The farm bill is omnibus, multi-year authorizing legislation that governs an array of agricultural and food programs. It is typically renewed about every five years. The 2014 Farm Bill
The 2014 farm bill is now
 A Business Newsletter for Agriculture Vol. 18, No. 6 www.extension.iastate.edu/agdm April 2014 New farm program to provide enrollment decisions By Steven D. Johnson, PhD, ISU Extension and Outreach farm
UNDERSTANDING ACRE FOR COTTON. Suwen Pan, Darren Hudson, Don Ethridge, Maria Mutuc, Mohamadou Fadiga, and Phil Johnson 1
 UNDERSTANDING ACRE FOR COTTON Suwen Pan, Darren Hudson, Don Ethridge, Maria Mutuc, Mohamadou Fadiga, and Phil Johnson 1 Cotton Economics Research Institute Briefing Paper CERI-BP08-01 Released 10/01/2008
BioEnergy Policy Brief July 2009 BPB
 BPB 07 01 A Brief Description of AGSIM: An Econometric-Simulation Model of the Agricultural Economy Used for Biofuel Evaluation C. Robert Taylor Mollie M. Taylor AGSIM is an economic impact simulation
The Economics of Rice Production
 The Economics of Rice Production LATMC Meeting Marksville, LA Friday, February 19, 2016 Dr. Michael Deliberto Department of Agricultural Economics & Agribusiness Louisiana State University Agricultural
Single Year National Avg. Prices Crop Name Units
 Potential Montana Covered Commodities Program Rates Direct National Loan Rates * Target Prices for CCPs: * Payment Crop Year Crop Years Crop Year Crop Years Crop Name Units Rate per Unit 2009 2010-2012
November variable Yield can
 The Forgotten Variable: Yield and the Choice of Crop Program Option Carl Zulauf, Ohio State University, and Gary Schnitkey, Jonathan Coppess, and Nick Paulson, University of Illinois at Urbana-Champaign
What Will the 2014 Farm Bill Mean for Midwest Agriculture?
 What Will the 2014 Farm Bill Mean for Midwest Agriculture? Roman Keeney, Associate Professor The Agriculture Act of 2014, better known as the 2014 Farm Bill was signed into law on February 7, 2014. The
Grain Profitability Projections
 Grain Profitability Projections 2015-2016 Greg Halich 859-257-8841 Greg.Halich@uky.edu 311 CE Barnhart Dept. Agricultural Economics University of Kentucky Lexington, KY 40546 Corn and Soybean Prices New
Baseline Update for U.S. Farm Income and Government Outlays
 Baseline Update for U.S. Farm Income and Government Outlays October 2016 FAPRI MU Report #06 16 Prepared by the Food and Agricultural Policy Research Institute University of Missouri www.fapri.missouri.edu
The Revenue Program Option in the 2008 U.S. Farm Bill: Evaluating Performance Characteristics of the ACRE Program
 The Revenue Program Option in the 2008 U.S. Farm Bill: Evaluating Performance Characteristics of the ACRE Program Carl Zulauf and David Orden Had only a farm program like the new ACRE state revenue program
AGECON February 21, 2018 Understanding Your Generic Base Conversion Options With the Seed Cotton Program
 AGECON-18-04 February 21, 2018 Understanding Your Generic Base Conversion Options With the Seed Cotton Program Don Shurley and Adam N. Rabinowitz Department of Agricultural and Applied Economics, University
Competitiveness of U.S. Wheat: the Role of Productivity
 Competitiveness of U.S. Wheat: the Role of Productivity A report to the National Association of Wheat Growers 415 Second Street NE, Suite 300 Washington, DC 20002 August 31, 2015 Dr. J. Mark Welch, Associate
ARC/PLC Acreage History and Yield Software for Seed Cotton Approved by: Acting Deputy Administrator, Farm Programs
 UNITED STATES DEPARTMENT OF AGRICULTURE Farm Service Agency Washington, DC 20250 Notice ARCPLC-52 For: State and County Offices ARC/PLC Acreage History and Yield Software for Seed Cotton Approved by: Acting
Ag Policy Update within the Bipartisan Budget Act of 2018
 Ag Policy Update within the Bipartisan Budget Act of 2018 February 2018 Adam N. Rabinowitz W. Don Shurley Amanda R. Smith Disclaimer The information presented is what we have interpreted and gleaned from
Cotton Economics Market Outlook, Production, and Policy
 Louisiana Agricultural Technology and Management Conference Louisiana Agricultural Consultants Association Paragon Casino and Resort, Marksville, LA Tuesday, February 12, 2019 Cotton Economics Market Outlook,
Crop Economics Outlook Gary Schnitkey University of Illinois
 Crop Economics Outlook 2014 Gary Schnitkey University of Illinois 2 Presentation Materials Visit the Downloads page at farmdoc.illinois.edu/webinars PDF of slides available now Video available tomorrow
A Summary of Changes to Seed Cotton and the Dairy Margin Protection Program as a Result of the Bipartisan Budget Act of 2018
 W 482 A Summary of Changes to Seed Cotton and the Dairy Margin Protection Program as a Result of the Bipartisan Budget Act of 2018 S. Aaron Smith, Assistant Professor Andrew Muhammad, Professor and Blasingame
2017 Tennessee Agricultural Outlook. Aaron Smith Crop Economist University of Tennessee Extension
 2017 Tennessee Agricultural Outlook Aaron Smith Crop Economist University of Tennessee Extension Overview Review of the Tennessee Agricultural Economy Crops Livestock 2017 Estimated Net Returns Principle
House and Senate Side-By-Side Farm Bill Provisions
 House and Senate Side-By-Side Farm Bill Provisions Title I - Commodities ARC and PLC ARC-CO and PLC are reauthorized. Farmers will have an opportunity to elect a program for the 2019 to 2023 crop years.
Base Information and Verification
 Base Information and Verification 1 Base Information and Verification Needed Information Needed Information Most long-time commodity program participants will have filed annual acreage reports with FSA
Outlook for the 2014 U.S. Farm Economy. Kevin Patrick Farm Economy Branch Resource and Rural Economics Division
 Outlook for the 214 U.S. Farm Economy Kevin Patrick Farm Economy Branch Resource and Rural Economics Division Overview Net farm income in 214 forecast: $95.8 billion Down more than 25% from 213 Net cash
National Cotton Council Seed Cotton PLC/ARC Program 1 Beginning with the 2018 Crop Draft Updated February 16, 2018
 National Cotton Council Seed Cotton PLC/ARC Program 1 Beginning with the 2018 Crop Draft Updated February 16, 2018 Program: Seed Cotton is designated as a covered commodity eligible for Title I Price Loss
Farmland Leasing Trends
 Farmland Leasing Trends Alejandro Plastina, PhD Assistant Professor, Economics ASFMRA Iowa Chapter Spring Seminar Ames, IA March 22, 2017 Main topics Trends in Cash Rents Factors affecting Cash Rents:
2017 Corn School. Current Situation
 2017 Corn School Corn Marketing and Price Update Olathe, Kansas January 13, 2017 Rich Llewelyn rvl@ksu.edu Current Situation Low grain prices, due primarily to huge grain supplies in the U.S. and world.
Darren Hudson and Bing Liu 1. International Center for Agricultural Competitiveness Briefing Paper BP Released April 2018
 PROJECTED U.S. COTTON PRODUCTION, SEED COTTON PRICE, AND PRICE LOSS COVERAGE PROGRAM PAYMENTS Darren Hudson and Bing Liu 1 International Center for Agricultural Competitiveness Briefing Paper BP-03-18
Crops Marketing and Management Update
 Crops Marketing and Management Update Grains and Forage Center of Excellence Dr. Todd D. Davis Assistant Extension Professor Department of Agricultural Economics Vol. 2019 (2) February 27, 2019 Topics
ADVERSE IMPACTS OF DROUGHT ON CROPS AND CROP PRODUCERS IN THE WEST
 ADVERSE IMPACTS OF DROUGHT ON CROPS AND CROP PRODUCERS IN THE WEST James Johnson and Vince Smith Montana State University Department of Agricultural Economics and Economics Introduction Drought often creates
EASTERN CORN BELT DELAYS CONTINUE, MORE FARM PROGRAM DETAILS
 May 31, 22 Ames, Iowa Econ. Info. 1839 EASTERN CORN BELT DELAYS CONTINUE, MORE FARM PROGRAM DETAILS Corn prices in the next two weeks will continue to be moderately sensitive to weather and planting progress
The Agricultural Act of
 A Business Newsletter for Agriculture Vol. 18, No. 11 www.extension.iastate.edu/agdm September 2014 Base acreage reallocation and payment yield update by Alejandro Plastina, extension economist, plastina@iastate.edu,
Devin Murnin. Director of Industry Programs Colorado Cattlemen s Association
 Devin Murnin Director of Industry Programs Colorado Cattlemen s Association Colorado Agriculture Statistics Agriculture Second Largest Contributor to Colorado Economy Approximate Land Area: 66.3 Million
CALCULATED LAND USE VALUES
 Staff Paper SP 2015-08 May 2015 CALCULATED LAND USE VALUES FOR LOUISIANA S AGRICULTURAL AND HORTICULTURAL LAND, 2011-2014 Prepared for The Louisiana Tax Commission Prepared by Dr. Michael Salassi & Dr.
Agriculture Improvement Act of 2018 Summary
 Agriculture Improvement Act of 2018 Summary The Farm Bill Prepared by the NAWG Staff Shortly after the 2018 Farm Bill conference report was released the NAWG staff prepared a summary of the bill regarding
U.S. Farm Sector Profits
 Financial stress Alejandro Plastina, PhD Assistant Professor, Economics Crop Advantage-Denison, IA January 26, 2018 U.S. Farm Sector Profits 1 Overview 1) How has the financial situation of Iowa farms
Pat Westhoff FAPRI-MU director University of Missouri
 Farm Bill Decision Aid Training Memphis, Tennessee September 25, 214 Pat Westhoff (westhoffp@missouri.edu) FAPRI-MU director University of Missouri www.fapri.missouri.edu FAPRI-MU crop market outlook Price
Updating Payment Yields
 Updating Payment Yields 2014 Farm Bill March 2015 Robin Reid Mykel Taylor G.A. Art Barnaby Extension Associate Assistant Professor Extension Specialist Kansas State University Kansas State University Kansas
2018 Hurricane Florence Agricultural Disaster Assistance Program
 2018 Hurricane Florence Agricultural Disaster Assistance Program Dr. Sandy Stewart NCDA&CS Assistant Commissioner of Agricultural Services October 31, 2018 10/31/18 1 Purpose Invest in North Carolina s
Row Crop Market Outlook for 2018
 Row Crop Market Outlook for 2018 Panhandle Row Crop Short Course Marianna, FL March 1, 2018 Adam N. Rabinowitz, PhD Assistant Professor and Extension Economist Agricultural and Applied Economics Changes
Illinois Crop Yield Database
 Illinois Crop Yield Database With this program, the user can access and analyze historic crop yields from 1972 to 2002 for corn, soybeans, and wheat at the county level, state level, or by NASS cropreporting
A Tax Incentive for Certified Seed: An Assessment
 A Tax Incentive for Certified Seed: An Assessment Al Mussell, PhD Canada s Independent Agri-Food Think Tank Outline Potential benefits of increased use of certified seed Estimating the tax credit The cost
Government Conservation Programs
 Government Conservation Programs Policy Resolutions Webinar 2017 Illinois Farm Bureau Governmental Affairs & Commodities Division Lyndsey Ramsey Assoc. Director of Natural and Environmental Resources CURRENT
Wheat Pricing Guide. David Kenyon and Katie Lucas
 Wheat Pricing Guide David Kenyon and Katie Lucas 5.00 4.50 Dollars per bushel 4.00 3.50 3.00 2.50 2.00 81 82 83 84 85 86 87 88 89 90 91 92 93 94 95 96 97 Year David Kenyon is Professor and Katie Lucas
Farm Financial Outlook
 Farm Financial Outlook Alejandro Plastina, PhD Assistant Professor, Economics NACM Heartland - National Agriculture Retail Credit Exchange Group Ankeny, IA March 2, 2017 Main topics Farm Financial Situation
2014 Farm Bill. FACT SHEET March Noninsured Crop Disaster Assistance Program for 2015 and Subsequent Years
 UNITED STATES DEPARTMENT OF AGRICULTURE FARM SERVICE AGENCY 2014 Farm Bill Noninsured Crop Disaster Assistance Program for 2015 and Subsequent Years FACT SHEET March 2016 OVERVIEW The Noninsured Crop Disaster
Wheat Market Outlook for
 Wheat Market Outlook for 2018-2019 2018 KSU Wheat Schools Ness City & Lenora, Kansas DANIEL O BRIEN EXTENSION AGRICULTURAL ECONOMIST Topics to be discussed.. 1) U.S.-China Trade & Other Key Grain Market
Grain Market Outlook and Marketing Strategies
 Grain Market Outlook and Marketing Strategies Presented by: Brian Roach Dec 6 & 7, 2016 Roach Ag Marketing, Ltd. Disclaimer: Futures/options trading involves substantial risk of loss and trading may not
Report: Effects of Farm Subsidies on Farm Management Decisions
 Report: Effects of Farm Subsidies on Farm Management Decisions March 2018 U.S. agriculture subsidies were created in the 1930s during the Great Depression with an intent to prop up low crop prices and
AGEC 429: AGRICULTURAL POLICY. LECTURE 21: Guest Speaker: Dr. James Richardson: Performance of 2014 Farm Bill and prospects for a 2018 Farm Bill
 AGEC 429: AGRICULTURAL POLICY LECTURE 21: Guest Speaker: Dr. James Richardson: Performance of 2014 Farm Bill and prospects for a 2018 Farm Bill GUEST SPEAKER Dr. James W. Richardson, Co-Director Regents
Ag Business Climate Outlook for 2017
 Ag Business Climate Outlook for 2017 Chris Hurt, Professor & Extension Economist Michael Langemeier, Professor & Associate Director James Mintert, Professor & Director Purdue Center for Commercial Agriculture
Appendix I Whole Farm Analysis Procedures and Measures
 Appendix I Whole Farm Analysis Procedures and Measures The whole-farm reports (except for the balance sheets) include the same number of farms, which were all of the farms whose records were judged to
Can the United States Meet Its Prospective Doha Commitments under the 2008 Farm Bill? Bruce A. Babcock 1
 Apoyo a los procesos de apertura e integración al comercio internacional ATN/ME-9565-RG BID/FOMIN Can the United States Meet Its Prospective Doha Commitments under the 28 Farm Bill? Bruce A. Babcock Trabajo
Fall Crop Outlook Webinar
 Fall Crop Outlook Webinar Chris Hurt, Professor, Department of Agricultural Economics Michael Langemeier, Associate Director, Center for Commercial Agriculture James Mintert, Director, Center for Commercial
FARM BILL. Issue: For additional information, contact the Washington Office staff person who serves your state.
 FARM BILL Issue: The farm bill is an omnibus, multi-year piece of authorizing legislation that governs an array of agricultural and food programs. It is typically renewed about every five years. The 2014
2014 Farm Bill FACT SHEET. The Noninsured Crop Disaster Assistance Program for 2015 and Subsequent Years
 UNITED STATES DEPARTMENT OF AGRICULTURE FARM SERVICE AGENCY OVERVIEW 2014 Farm Bill The Noninsured Crop Disaster Assistance Program for 2015 and Subsequent Years The Noninsured Crop Disaster Assistance
Funding for Small Acreage Horticultural Producers. Luis A. Ribera Assistant Professor and Extension Economist June 7, 2011
 2008 Farm Bill Programs for Specialty Crops Funding for Small Acreage Horticultural Producers Luis A. Ribera Assistant Professor and Extension Economist June 7, 2011 Presentation Outline The 2008 Farm
ACRE Sign-up Deadline June 1, 2010 Jim Hilker, Roger Betz, Dave Schweikhardt and Roy Black Michigan State University Extension May 13, 2010
 ACRE Sign-up Deadline June 1, 2010 Jim Hilker, Roger Betz, Dave Schweikhardt and Roy Black Michigan State University Extension May 13, 2010 Farmers should be aware June 1, 2010 is the deadline for signing
Commodity Value Enhancement Fund Analysis
 Commodity Value Enhancement Fund Analysis AFPC Issue Paper 01-2 Abner W. Womack Edward G. Smith Agricultural and Food Policy Center Department of Agricultural Economics Texas Agricultural Experiment Station
Ag Outlook Webinar. Chris Hurt, Professor, Department of Agricultural Economics
 Ag Outlook Webinar Chris Hurt, Professor, Department of Agricultural Economics Michael Langemeier, Associate Director, Center for Commercial Agriculture James Mintert, Director, Center for Commercial Agriculture
Economics 230 Lab 4 Section 1 2 Due September 24 Fall 2010 WHOLE FARM BUDGET
 Economics 230 Name Lab 4 Section 1 2 Due September 24 Fall 2010 WHOLE FARM BUDGET The purpose of this lab is to (a) learn how to prepare a whole farm budget for a hypothetical farming situation, and use
U.S. Dairy Products, Cash Receipts
 Statement of Dr. Scott Brown Before the U.S. House of Representatives Committee on Agriculture Rural Economic Outlook: Setting the Stage for the Next Farm Bill February 15, 2017 Chairman Conaway, Ranking