INSTRUCTIONAL MODULES DEMONSTRATING BUILDING ENERGY ANALYSIS USING A BUILDING INFORMATION MODEL CHRISTIAN DANIEL DOUGLASS
|
|
|
- Felicia Dennis
- 6 years ago
- Views:
Transcription
1 INSTRUCTIONAL MODULES DEMONSTRATING BUILDING ENERGY ANALYSIS USING A BUILDING INFORMATION MODEL BY CHRISTIAN DANIEL DOUGLASS THESIS Submitted in partial fulfillment of the requirements for the degree of Master of Science in Systems and Entrepreneurial Engineering in the Graduate College of the University of Illinois at Urbana-Champaign, 2010 Urbana, Illinois Advisers: Professor Deborah Thurston James Leake, Director of Engineering Graphics
2 ABSTRACT The design and analysis of buildings require a high level of collaboration and coordination among the disciplines of architecture, engineering, and construction. Efficiencies can be gained through the sharing of data across disciplines; however, this prospect has not been fully realized. Traditionally, building energy models have been created separately from architectural building information models (BIMs), and energy analyses have relied on a single analysis tool. By leveraging existing data from the BIM, energy models can be generated more quickly and the use of multiple analysis tools is more practical. A set of three instructional modules is used to demonstrate BIM-based methods of building energy analysis and simulation. The workflow leverages existing data in the architectural model for energy analysis, as opposed to creating separate models within each analysis program. Autodesk Revit Architecture is used to create a building information model based on a residential dwelling designed by Frank Lloyd Wright. Relevant data from the building information model is exported to two separate analysis tools - Autodesk Ecotect and DesignBuilder. Ecotect is used to provide early feedback on weather, heating and cooling loads, and heat loss information, and DesignBuilder is used to evaluate the effect of adding various energy conservation measures (ECMs). The two programs are used in conjunction to analyze the effects of solar orientation and passive solar design elements. The BIM data is able to successfully generate the two external energy analysis models. Some issues are encountered in the process of importing BIM data into the analysis tools; however, all issues are able to be resolved. The features of the BIM workflow found to add the most value are the ability to export building geometry and thermal zone information and the ability to use material take-offs for comparing the cost of design alternatives. Simulation results from Ecotect and DesignBuilder show a 15% difference in annual heating and cooling energy between the best case and worst case passive solar design strategies. Results from the DesignBuilder ECM study indicate that a total energy savings of 21% can be achieved cost-effectively compared to a baseline design, for a 10-year time horizon. ii
3 TABLE OF CONTENTS CHAPTER 1: INTRODUCTION Background Purpose and Objectives Organization... 2 CHAPTER 2: LITERATURE REVIEW Energy Consumed by the Built Environment Building Information Modeling (BIM) Building Energy Simulation CHAPTER 3: METHODOLOGY Software Selection Building Selection Baseline Energy Model Specification CHAPTER 4: INSTRUCTIONAL MODULE CONTENT Summary Module 1: Building Model Creation Module 2: Data Exchange and Energy Model Preparation Module 3: Simulation and Data Analysis CHAPTER 5: CONCLUSIONS AND RECOMMENDATIONS Conclusions Recommendations REFERENCES APPENDIX A APPENDIX B iii
4 CHAPTER 1: INTRODUCTION 1.1 Background Residential and commercial buildings consume a significant amount of energy in the United States. In 2006, the built environment consumed 39% of all primary energy and 72% of all electricity (1), (2). In addition, buildings contributed 38% of all carbon dioxide emissions, 55% of sulfur dioxide, and 18% of nitrous oxides (3), (4). Luckily, the opportunities to reduce the energy and environmental impacts of the built environment are equally as great. The U.S. Department of Energy s Building America program estimates that the energy consumption of new homes in the U.S. can be reduced by 40% or more with little to no impact on the cost of ownership (5). Similar programs for commercial buildings have shown energy savings of 50% for new construction and 30% for retrofits of existing building stock (6). In 2008, a team of students and faculty from the University of Illinois at Urbana-Champaign participated in a study of energy efficient and net-zero energy buildings. Students and faculty were selected from both the engineering and architecture schools. The research study considered the possibility of an international prize competition for cost-effective, highly energy efficient homes. The competition would be similar to those organized by the well-known X-PRIZE Foundation (7). The students from both disciplines were asked to collaborate on many tasks associated with the project, including: assisting in the development of rules and performance metrics for the competition, assessing typical energy use and energy usage patterns in American homes, completing an energy audit of a local home in the Champaign-Urbana area, defining a typical reference home which could serve as a benchmark for energy analysis studies, and developing energy simulation models of the reference home and other more efficient design alternatives. While many research studies have addressed specific components of building energy, few studies have provided a comprehensive demonstration of the tools and technologies that enable collaborative 1
5 design of energy efficient buildings. A deep multi-disciplinary understanding of building energy is critical for all who are involved in the field: professional engineers and architects who design the buildings that people live and work in, academic institutions that provide further improvement in energy simulation and decision-making tools, and students who are in building energy related disciplines and participate in competitions such as the Solar Decathlon (8). 1.2 Purpose and Objectives This thesis addresses the limited availability of resources which provide a comprehensive discussion and demonstration of building energy modeling from a multi-disciplinary perspective. The overall objectives of this research are to: 1) take the fundamental approach of the aforementioned research study and apply it to this work, 2) discuss the capabilities of building information modeling (BIM) and building energy simulation programs in evaluating many alternatives early in the design process, 3) demonstrate a logical procedure for creating a building information model, analyzing its energy use through simulation, and evaluating its performance 4) develop a set of instructional modules that follow the procedure outlined in objective 3, and 5) make the modules freely available to all academic institutions to promote the collaboration of various disciplines in the design of energy efficient buildings. 1.3 Organization This thesis is divided into five chapters, with additional appendices included at the end. Chapter 1 provides background information, as well as the purpose and motivation of the study. Chapter 2 provides a review of building energy, BIM, and building energy simulation. Section 2.1 describes building energy consumed in the United States. Typical end-uses of building energy are discussed, as well as the distribution of energy end-uses common in residential and commercial buildings. Section 2.2 addresses BIM. A brief history of BIM is given along with a summary of programs that are currently available. The benefits of integrating BIM into the design process are addressed, as well as the challenges of BIM to achieve a more wide-spread adoption. A special emphasis is placed on the ability to 2
6 leverage the BIM model for the purpose of building energy simulation. Section 2.3 provides an overview of building energy simulation. The most popular computational methods used in building energy simulation programs are discussed. A summary of current simulation software is given, along with a comparison of software features and limitations. Chapter 3 provides the methodology of the study. A floor plan is selected for the building that is the basis of the study. A building information modeling program is selected, as well as two different external energy analysis tools. A baseline building is defined as a source of comparison for all other alternative design scenarios that include some sort of energy efficiency strategy. Most of the parameters for the baseline building are taken from the Building America Research Benchmark. Tables provide the baseline parameters that are specific to the site and building. Chapter 4 provides content for instructional modules demonstrating building energy analysis using a building information model. The content is broken into three parts, or modules. Module 1 outlines the creation of the building model in a building information modeling program. In this module, the building envelope is defined as well as the layout of interior walls and spaces. Module 2 covers building energy simulation. The building from Module 1 is prepared for export by defining thermal zones and other export parameters. The building is then imported into two separate external energy analysis programs where the building s energy performance can be analyzed. The set-up procedures necessary for energy simulation are addressed, in addition to potential data quality issues that may be encountered in the import process. Module 3 describes the simulation process and how to evaluate the energy performance of the baseline and alternative designs. Energy performance is compared based on annual fuel consumption. The cost performance of design alternatives is judged based on the net present value of avoided energy costs compared to the baseline building. Chapter 5 draws conclusions from the building study and offers recommendations for future work. Additional appendices provide module presentation slides and supplementary information. 3

 were single-family, detached dwellings with an")


 system accounts for the greatest")
, and lighting (11.6%).")
 and various")

7 CHAPTER 2: LITERATURE REVIEW 2.1 Energy Consumed by the Built Environment In 2005, there were 108 million residential households in the U.S. The majority of homes (71%) were single-family, detached dwellings with an average living space of 2,456 square feet. The remaining households were either multi-family units or mobile homes. Figure 1 shows a typical distribution of energy end-uses for a residential building. As the figure illustrates, the energy required by a home s heating, ventilation, and air conditioning (HVAC) system accounts for the greatest share (39.4%) of total home energy use, followed by hot water heating (12.5%), and lighting (11.6%). The remaining energy is consumed by major appliances (refrigerator, clothes washer and dryer, dishwasher, cooking appliances) and various electric plug loads (9). Cooking 5% Clothes washer/dryer and dishwasher 6% Computers 1% Other small electric devices 4% Adjustment factor 6% Space heating 26% Refrigeration 7% TV and office equipment 8% Lighting 12% Water heating 13% Space cooling 13% Figure 1: Energy end-use splits for residential homes in the U.S. The adjustment factor accounts for discrepanices between data sources. 4

, education facilities (14%), warehouse and storage facilities")

, office equipment such as")


8 The U.S. commercial building stock is made up of 4.7 million buildings totaling 68.5 billion square feet of floor space. Office buildings account for the greatest percentage of commercial space (17%), followed by retail buildings and malls (16%), education facilities (14%), warehouse and storage facilities (14%), and others. Energy end-uses for commercial buildings look considerably different than residential dwellings. As shown in Figure 2, the largest end-use for commercial buildings is lighting (24.8%). Other major end-uses include space heating and cooling (25%), office equipment such as electronics and computers (11%), and ventilation (7%) (10). Adjustment factor 7% Cooking 2% Computers 4% Refrigeration 4% Other 13% Lighting 25% Space cooling 13% Water heating 6% Ventilation 7% Electronics 8% Space heating 12% Figure 2: Energy end-use splits for commercial buildings in the U.S. The adjustment factor accounts for discrepancies between data sources. Understanding the difference between residential and commercial energy end-use profiles is critical for determining a strategy for energy savings. Typically, the internal heat gains (gains attributed to lighting, equipment, and building occupants) of commercial buildings tend to dominate heat gains through the building s envelope, or skin. Thus, commercial building energy savings are realized 5
9 primarily from the reduction of internal gains. For residential buildings, typically the opposite is true. Residential buildings tend to be skin-dominated, meaning that heat gains through the building skin are more significant than internal heat gains from lighting, equipment, and occupants (11). For this reason, residential energy savings are realized primarily through improvements to the building envelope. Although these trends are true in general, factors such as climate can significantly impact a building s energy end-use profile. 2.2 Building Information Modeling (BIM) History of BIM The construction industry traditionally involves bringing together multiple disciplines in one project. A successful project implementation requires a high level of collaboration and coordination among architecture, engineering, and construction (AEC) personnel. The highly fragmented nature of the design, build, and management process has resulted in a variety of information sources within each discipline (12). For this reason, a comprehensive representation of all necessary information has long been an objective for firms in the AEC sector (13). Building information modeling applications evolved from the computer aided design (CAD) and computer aided manufacturing (CAM) systems that were first developed for the aeronautical and automotive industries (14). During the 1970 s, CAD vendors released low-level data exchange applications targeted toward the construction industry. These early applications were written in proprietary file formats, so the integration of multiple applications and information sources was limited. The drawbacks of the proprietary formats led to the development of common formats, such as the Interim Graphics Exchange Specification (IGES) format and the Drawing exchange Format (DXF). Perhaps the most influential common format was the Standard for the Exchange of Product Model Data (STEP) format developed in 1984 by the International Standards Organization (ISO). The STEP format was developed with the intention of improving communication of engineering information and enabling integration through the coordination of open standards for data exchange and data sharing (13). 6
10 Early CAD programs used explicit, two-dimensional (2D) coordinate-based geometries to create graphic entities. The 2D programs eventually evolved to three-dimensional (3D) surface and solid modeling programs. These programs were more intelligent and enabled the creation of more complex forms, however, the explicit, coordinate-based geometries made editing difficult. Parametric solid modeling was the breakthrough that enabled easier editing through the use of model parameters and constraints. The technology was adopted early on by the mechanical design world, but lagged in the area of building design due to issues of scaling (15). Eventually, parametric modeling was implemented for building models. By the mid-1990 s, building model applications expanded the 3D model beyond vectorial data to include complementary data, such as physical characteristics, unit costs, quantity takeoffs, and more. These innovations created what is now recognized as the BIM (14). Only recently has BIM emerged in real world projects. Before 2000, most BIM use was limited to academic institutions. Since 2002, the term building information model has become widespread (16). A variety of BIM applications are currently available, including Graphisoft ArchiCAD, Bentley Architecture, and Autodesk Revit. A 2007 survey of industry professionals asked which BIM solutions they were currently using or evaluating. Revit was most popular, used by 67.1% of respondents, AchiCAD was second with 31.7%, and Bentley was third with 14.8% (17) Capabilities and Benefits of BIM Applications The modern building information model can be leveraged for a multitude of purposes throughout a building s entire lifecycle. In the early design phase, BIM applications can be used to create the building s form. Some applications allow the user to create a building using either a bottom-up or topdown design approach. For the bottom-up approach, a user creates the building on an element by element basis. Typically in a 2D plan view, walls are placed followed by floors, ceilings, etc. until the building s overall shape is defined (Figure 3). Top-down modeling takes an opposite approach. The building s overall shape is first defined, and then building elements, such as walls, floors, and walls, are applied to either interior or exterior surfaces (Figure 4). The use of top-down modeling at the early design stage can 7

, followed by windows and doors")
, followed by floors (middle), and finally, walls, windows,")

11 be advantageous, especially for building energy simulation. A building s shape can impact its energy performance, thus a simple massing model allows the user to quickly compare the relative energy performance of different building forms without specifying the details required by a bottom-up design approach (18). Figure 3: For a bottom-up design approach, the building's exterior and interior walls are defined in a 2D view (left image), followed by windows and doors (middle), and finally, floors, ceilings, and a roof (right). Figure 4: For a top-down approach, the building's overall shape is defined in a 3D view (left image), followed by floors (middle), and finally, walls, windows, and a roof (right). Building energy simulation is one of the major benefits afforded by the BIM, both in the early stages of design and later stages of analysis. The common green building Xtensible Markup Language (gbxml) format allows the export of BIM data to a building energy simulation program (19). The building energy simulation program can provide useful insight into changes that can be made for improved energy performance. The parametric nature of most BIM applications allows the building model to be quickly updated with the design changes suggested by the energy simulation. 8
12 The capabilities of BIM applications extend far beyond geometric modeling and energy simulation. The BIM can be used for a host of other purposes throughout a building s lifecycle, including: Visualization: The BIM can be used to create plan views, section views, and photo-realistic 3D renderings. Some applications allow additional visualization features such as virtual walkthroughs and simulated construction sequencing (20). Fabrication/shop drawings: Drawings for components requiring fabrication, such as HVAC ductwork, can be extracted from the BIM. Assembly instruction: Assembly notes can be attached to the pertinent elements in the BIM (14). Cost estimation: Quantitative information related to the building s elements can be linked to a cost database, which can produce cost estimates. Estimates are updated automatically if changes are made to the building. Conflict and collision detection: Architectural, structural, and HVAC sub-models can be combined into a composite model to check for the improper overlapping of building elements. Construction sequencing: The BIM can be used to create material ordering, fabrication, and delivery schedules for all building elements. Code reviews: The building model can be checked for compliance with fire and building codes. Forensic analysis: The BIM can be used to identify potential leaks and failures as well as possible evacuation plans. Facilities management: Building owners and operators can use the building model for renovations, space planning, and maintenance operations (20). The benefits of BIM implementation across all disciplines of the AEC sector are well documented in the literature. The most direct benefit of a BIM is an accurate geometrical representation of the building in an integrated data environment. Other benefits can include faster and more effective processes, controlled whole-life costs, better production quality, automated assembly, better customer 9
13 service, and better design through rigorous analysis and simulation (20). A study of 32 building projects conducted by the Stanford University Center for Integrated Facilities Engineering (CIFE) found that the use of BIM could save both time and money. BIM projects eliminated 40% of unbudgeted costs and saved 10% of contract values through early collision detection. Cost estimation times were reduced by up to 80% and total project times reduced by up to 7% (21) Implementation Challenges Data standardization and platform integration According to a survey of building practitioners, the integration (or lack of) of BIM software is seen as a barrier to its widespread adoption (22). While some vendors currently offer a suite of BIM tools that work well amongst themselves, it is still uncommon for applications from multiple vendors to have a high level of interoperability. This is due, in part, to issues of data format standardization that still exist in the industry. Over the past decade, organizations around the world have been established to further the development of neutral CAD data exchange formats (14). Currently, much of the effort in BIM standardization is focused on the Industry Foundation Classes (IFC) and the CIMSteel Integration Standards. Both standards are neutral data formats and are defined using the ISO STEP description methods (12) Education and skill Widespread BIM adoption is challenged by a deficiency of personnel with BIM skills. A survey of BIM use identified lack of adequate training as the most significant impediment to BIM adoption. Courses on BIM have been slow to enter engineering curricula. While 3D parametric solid modeling has become the main design medium in mechanical engineering and industrial design education, civil engineering programs have been less likely to include 3D modeling in the curriculum, especially at the undergraduate level (23). 10
14 2.3 Building Energy Simulation Overview Architects and engineers have performed building energy analyses since before the time of personal computers. At that time, analyses relied on rule-of-thumb methods and extrapolations in cases where design concepts were unconventional. This approach frequently led to incorrectly sized building equipment, and as a result, poor energy performance. Computer-based building energy simulations began in the 1960 s, and became increasingly popular in the research community by the 1970 s. In the late 70 s and early 80 s, advancements in desktop personal computing enabled the development of building simulation programs as they are known today. These programs attempted to imitate physical conditions by treating time as the independent variable and solving a series of equation sets in discrete steps. Due to the level of difficulty and high cost of early programs, most simulation projects were confined to research laboratories. It was not until the 1990 s that building energy simulation was adopted into professional practices (24). In the time since the first applications, hundreds of building energy simulation programs (BESPs) have been developed. The capabilities and intended uses of programs vary widely. The proper selection of tools is complicated by the fact that a common language for describing what tools can do does not exist (25). Furthermore, there appears to be little consensus on how BESPs should be classified and organized. Hong et. al. group simulation programs into two categories: design tools (DTs) and detailed simulation programs (DSPs). DTs are defined as purpose-specific, early design phase tools that require simple and relatively little input data. DSPs are considered to be tools that require more complex computational techniques (such as finite difference, finite element, state space, and transfer functions) for the calculation of building loads and energy use (24). Charron and Athientis categorize BESPs as either open architecture, white box tools or black box tools. White box tools are defined as those that allow users to examine and modify underlying source code to meet specific modeling needs, while black box tools are 11
15 defined as those programs that do not allow source code access to the user. According to Charron, black box programs tend to be more user friendly than white box programs (26). There are BESPs available today that can simulate nearly every aspect of a building s energy performance. Some of the aspects that can be captured by current applications include (25): solar radiation, outside a building and within interior zones thermal zone loads and human comfort levels air flows due to infiltration and natural / mechanical ventilation lighting, equipment, and human loads renewable energy generation HVAC system behavior lighting controls and integrated shading devices environmental emissions BESPs can also be used effectively in the early design phase to evaluate what-if scenarios in the search for optimal solutions. Such scenarios can investigate and assess the energy impact of: building shape and form solar orientation material construction of the envelope glazing type and placement HVAC system type and efficiency Building Energy Simulation Programs (BESPs) Considered for this Study DOE 2 DOE-2 is a BESP originally sponsored by the U.S. Department of Energy and developed by Lawrence Berkeley National Laboratory (LBNL) and James J. Hirsch & Associates (27). Since its first 12
16 release in 1979, DOE-2 has undergone a series of alterations and improvements. It is now used in more than 40 countries to design energy efficient buildings, develop energy conservation standards, and analyze the impact of new building technologies. It has been validated with measured data from actual buildings, and it has been used for the design and retrofit of well-known buildings such as the White House, the World Trade Center, and the Sears Tower. Over 20 interfaces have been created by private sector firms in order to make the program more user-friendly. DOE-2 is an hourly, whole building simulation program. Whole building refers to the program s ability to model and simulate the entire building as opposed to just one building system. Hourly denotes the length of the time step at which the program s calculations are carried out. DOE-2 is internally made up of four subprograms: the Building Description Language (BDL) processor, LOADS, HVAC, and ECON. The BDL processor takes the building geometry inputted by the user and translates it into a form recognizable by the program. LOADS calculates hourly heating and cooling loads for the building s spaces. Heating and cooling loads are affected by a host of factors, including weather and solar conditions, infiltration, heat transfer through the envelope, and the scheduling of people, lighting, and equipment. HVAC sizes and simulates both primary and secondary HVAC equipment based on the demands calculated in LOADS. ECON is used to calculate cost performance of a building in terms of energy savings, design savings, or retrofit savings (28). DOE-2 s major advantage is its ability to analyze detailed, multi-zone buildings quickly and reliably. DOE-2 simulations run in a fraction of the time of other simulation programs. One disadvantage of the program is the high level of expertise required if a third party environment is not used (29) EnergyPlus EnergyPlus is a new generation BESP that combines the features of a few predecessor applications including DOE-2 and the Building Loads Analysis and System Thermodynamics (BLAST) 13
17 program developed by the University of Illinois at Urbana-Champaign. Like DOE-2, EnergyPlus is a whole-building energy simulation program. Unlike DOE-2, EnergyPlus has the ability to use sub-hourly time steps. This allows the program to more accurately predict space temperatures, which is crucial for system and plant sizing and human comfort calculations. EnergyPlus s simulation engine can simulate some systems and behaviors that DOE-2 and other programs cannot. These include realistic system controls, moisture adsorption and desorption in building elements, radiant heating and cooling systems, and inter-zone air flow. To calculate space temperatures, EnergyPlus uses the heat balance method. The heat balance method calculates radiation and convection processes at each time step. Although this method is more sophisticated than the methods used by other simulation packages, it is still a simplification of reality. The method assumes that air is well stirred and thus a uniform temperature throughout. A better alternative would be a computational fluid dynamics (CFD) based method; however this would add significant complexity and computational effort (30). In addition to being able to simulate whole buildings in sub-hourly time steps, EnergyPlus has a few major advantages. Relative to other programs, it has been tested extensively and validated with actual data. Its modular structure allows for new components to be created and plugged in for simulation. Finally, it has one of the most extensive weather libraries with data available for 1250 locations worldwide. Similar to DOE-2, EnergyPlus has the disadvantage of requiring a high level of skill without the help of a third party interface and relatively long simulation times (29) Autodesk Ecotect Autodesk Ecotect is a flexible simulation tool that works as a stand-alone application and as a source of input for other energy simulation programs. Building geometry can be created with Ecotect s 3D modeler, or it can be imported using the gbxml or DXF formats. Ecotect provides solar, thermal, lighting, acoustic, and cost analyses that are ideal for early design stage feedback (Figure 5). For more detailed studies, building geometry and information can be exported to hourly programs such as equest or EnergyPlus (31). 14

18 Figure 5: A sun path analysis in Ecotect allows the user to see how building facades are shaded throughout the year equest EQuest is a widely used, time-proven simulation program that is freely available to the public. Its user base consists of building designers, operators, owners, energy and LEED consultants, regulatory professionals, universities and researchers. With an average of 10,000 downloads annually, it is one of the most popular simulation tools used today. EQuest is an interface that uses DOE-2 as its simulation engine. A major advantage of the program is its ability to accommodate three different levels of user expertise. For beginners, the schematic design wizard allows a building to be created by using simple input data (Figure 6). The design development wizard allows a greater level of input for more intermediate users, and for advanced users, the detailed mode allows the manipulation of all building parameters. EQuest can accommodate single simulation runs, multiple runs, and parametric studies. Drawbacks of the program include simplified 15

19 models for ground coupling, infiltration, and natural ventilation. In addition, daylighting can be applied only to convex surfaces and cannot transmit through interior glazed surfaces (29). Figure 6: An example of a two-story office building in equest DesignBuilder DesignBuilder, similar to equest, is an interface combined with a powerful simulation engine, however instead of DOE-2, DesignBuilder uses an enhanced version of EnergyPlus. Building geometry can be created within DesignBuilder s OpenGL modeler, or it can be imported as a gbxml file from an architectural modeling program (Figure 7). Data inheritance allows changes to be made to the entire building, a building block, or a single thermal zone (32). 16
 is a web-based application that uses the DOE-2 engine for energy simulation (33).")
20 Figure 7: An example residential building shown in DesignBuilder's rendering environment Autodesk Green Building Studio Green Building Studio (GBS) is a web-based application that uses the DOE-2 engine for energy simulation (33). It provides information on a building s energy use, carbon footprint, water use, material costs, and more. Design alternatives can be compared side by side for quick design decisions. Building parameters can be changed in a web-based interface that is simpler to use than most other BESPs. The simple interface comes at the expense of being able to enter the level of detail afforded by other BESPs; however the GBS files can be exported to detailed hourly simulation programs. 17
21 CHAPTER 3: METHODOLOGY 3.1 Software Selection Autodesk Revit Architecture 2011 is chosen as the software package for creating the building information model. Revit provides tools for both top-down and bottom-up build strategies, and accommodates the export of building data for the purpose of external energy analysis. For energy analysis, Ecotect 2011 and DesignBuilder (version 2.2) are selected. Both programs support the ability to import building information model data for energy analysis. Ecotect is chosen for its ability to generate quick, early design studies as well as for purposes of visualization. DesignBuilder is chosen for its ability to execute detailed energy simulations using EnergyPlus. 3.2 Building Selection The design and floor plan of the building used for this study are based on the First Jacobs House, a 1550 square foot residential building designed by Frank Lloyd Wright in The First Jacobs House was part of Wright s Usonia movement, which stressed the importance of home affordability and also energy efficiency. The building, located in Madison, Wisconsin, was chosen for two main reasons. One, its smaller size as a residential building compared to a commercial building made it more tractable for the purpose of a comprehensive study. Two, the analysis of a well-known design was thought to be of more interest than one created from scratch. The use of an existing design allows the interesting possibility of exploring both the energy performance of the building as designed, and the energy performance of the building with upgraded features. 3.3 Baseline Energy Model Specification Depending on the analysis tool used and the particular study, a building energy model can require a host of parameters. These parameters may include: element material constructions and associated thermal properties 18
22 HVAC and hot water system types and efficiencies lighting type, density, and efficiency building occupancy plug loads, such as appliances and electronic devices internal heat gains from plug loads and occupancy building natural infiltration rate (air leakage) natural ventilation (i.e. the opening and closing of windows) thermostat set-point temperatures operating schedules Not all energy analysis programs require the same parameters or the same level of detail. This could reflect the fact that some programs are intended to be early-stage design tools, and thus require less detailed information. It may also reflect the lack of standardization in the industry. The U.S. Department of Energy s Building America Research Benchmark Definition is used as a guiding standard for most baseline energy model parameters of this study (34). The goal of the Building America program is to reduce energy consumption of new homes by 40% or more with little to no impact on the cost of ownership. The Building America Research Benchmark (subsequently referred to as Research Benchmark or Benchmark) establishes baseline energy usage for residential buildings. It is generally consistent with construction practices from the mid-1990s. Using factors such as the building s type (e.g. single family attached, single family detached, multifamily), size, and location, the benchmark provides values for the energy model input parameters. These parameters include all of the ones in the list above. The number of heating degree days (HDD), base 65 degrees Fahrenheit, for the building s location is used in the calculation of certain parameters. HDDs are an index to reflect heating energy demand for a building and are equal to the summation of differences between the average daily temperature and a base temperature (typically 65 F) (35). For Madison, Wisconsin, 7499 HDD are 19
23 assumed. Other parameters are based on the building s finished floor area (FFA), which in this case is 1550 square feet. In certain cases, a standard other than the Benchmark is used for parameter definition. For example, energy usage figures for the refrigerator, clothes washer, and dishwasher are taken from Energy Star. In this case, this is done so that cost estimates for Energy Star appliances are consistent with their energy use. In other cases, a parameter specified by the Benchmark may be inconsistent with a parameter required by either Ecotect or DesignBuilder. While the original Jacobs House was not built to the standard set by the Benchmark, it is assumed that the building is upgraded to meet modern standard practice. A summary of the major baseline energy model parameters is included below Envelope Parameters The parameters of the baseline building envelope depend on the building s location, and thus on the number of HDD. Since a building is typically designed in the context of its environment, the location of the actual Jacobs House Madison, WI is chosen as the location for the energy model. Based on Madison s 7499 HDD, the Benchmark specifies the overall heat coefficients, or U-values, shown in Table 1. Also provided are the element R-values (a measure of thermal resistance) which are equal to the reciprocal of the U-values. An infiltration rate of 0.5 air changes per hour is assumed for all simulations. Table 1: Envelope parameters for baseline energy model. Building Element U-Value R-Value (Btu/h ft 2 F) (h ft 2 F/Btu) Exterior wall Roof/ceiling Exterior doors Slab insulation Windows
24 3.3.2 HVAC and Hot Water System Parameters The efficiency of the baseline building s HVAC is dependent on the type of system used. Although the actual Jacobs House used radiant heating for occupant comfort, the Benchmark uses forced air systems for its standard. For that reason, the baseline building is assumed to have a natural gas furnace and electric air conditioning system. The furnace is assumed to have an Annual Fuel Utilization Efficiency (AFUE) of 78% and the air conditioner is assumed to have a Seasonal Energy Efficiency Ratio (SEER) of 10. Heating and cooling set points are maintained at 71 F and 76 F, respectively, with no setup or setback periods. Hot water system efficiency also depends on system type. In this case, an electric tank hot water heater is assumed with an Energy Factor (EF) of 0.89 and hot water service of 50 gallons/day Appliance and Plug Load Parameters Residential buildings contain many electric loads, both large and small. The Research Benchmark provides annual energy usages for typical loads. Energy usages for large loads, such as kitchen and laundry appliances, are given separately. Smaller loads, such as televisions, battery chargers, and toasters, are grouped into a larger miscellaneous load category. The magnitude of the loads is based on the number of bedrooms and finished floor area of the building under investigation. The appliance and plug loads of the example building are given in Table 2, based on the building having two bedrooms and approximately 1550 square feet of livable floor area. Sensible and latent heat gains associated with the electric loads should be included in the energy models as they affect the building s HVAC operation. Sensible heat gains affect air temperature while latent gains affect moisture in the air (36). 21
25 Table 2: Baseline energy model parameters for appliances and electric loads. Appliance or Electric Load Electricity (kwh/yr) Sensible Load Latent Load Fraction Fraction Refrigerator Clothes washer Clothes dryer Dishwasher Range Variable Miscellaneous Fixed Miscellaneous Lighting Parameters The Benchmark provides a simple and a complex method for specifying baseline lighting loads. Here, the simple method is chosen. Annual energy usages can be calculated for interior hard-wired, interior plug-in, garage, and exterior lighting. Since the building used in this study does not have a garage, this fraction of the lighting is omitted. The annual energy usages for the other three categories is given in Table 3, based on the finished floor area of the building. The baseline energy usages assume that 86% of all lights are incandescent and 14% are compact fluorescent (CFL). The lighting loads are operated according to a schedule, which is included in the Benchmark and addressed in the following section. Table 3: Baseline energy model lighting parameters. Lighting Category Electricity (kwh/yr) Interior hard-wired 1305 Interior plug-in 326 Exterior Schedule Parameters Many of an energy model s components operate according to a schedule. Energy model schedules are generally specified for a 24-hour period. Each hour, the component uses a certain fraction or percentage of, for example, its total daily energy use. This results in a schedule such as the one in Figure 8, showing the schedule for a cooking range. Note that the peaks of the graphed line correspond to 22
26 the times of the day when the range would most likely be used (e.g. during dinner time). Schedules can be specified differently based on whether the day is during the week, weekend, or holiday. For this study, however, schedules are assumed to be the same for every day of the year. Figure 8: Daily energy usage profile for a cooking range. 23
27 CHAPTER 4: INSTRUCTIONAL MODULE CONTENT 4.1 Summary In Module 1, the process of creating a building information model is covered. The process starts with a simple 2D sketch and ends with a 3D model. The sketch is drawn on a tablet PC using an existing floor plan for guidance. Using the sketch, 2D blocks are drawn in a building information modeling program and extruded to create a 3D massing model. Some building elements are applied by adding them directly to the mass surfaces, and others are defined independently of the massing model. A camera is placed in a 3D model view to generate a rendered image of the final building model. In Module 2, building information model data is prepared for export. Thermal zones are defined in the building s spaces, and zone boundaries are checked in all three dimensions to ensure proper export. Export options are addressed, and a gbxml file of the building is generated. The gbxml data is imported into two programs Ecotect, an early design analysis tool, and DesignBuilder, a detailed, subhourly simulation program. The import process for both programs is discussed, as well as data quality issues that may be encountered in the process. Analysis model parameters are defined using the Building America Research Benchmark for guidance. In Module 3, Ecotect and DesignBuilder models are used to conduct energy analyses and simulations. First, early design studies are performed in Ecotect to indicate the relative impact of design factors on energy performance. A weather tool is used to investigate the type of environment in which the building exists. Heating and cooling load calculations are used to provide a relative comparison of the building s heating and cooling requirements. Heat gains and losses are graphed to indicate which factors contribute the most to HVAC energy use. Second, Ecotect and DesignBuilder are used in conjunction for solar orientation and passive solar design studies. Ecotect is used to visualize levels of solar radiation and solar ray penetration for varying building orientations and passive solar design strategies. DesignBuilder is used to quantify these design decisions by performing detailed annual simulations of each scenario. The individual and collective impact of passive design elements are explored. Lastly, DesignBuilder is 24
28 used to simulate the effect of adding various energy conservation measures (ECMs) to the baseline design, including increased envelope insulation, higher performance glazing, and higher efficiency lighting, appliances, and mechanical systems. An economic analysis is included to provide an insight into cost-effective design solutions. 4.2 Module 1: Building Model Creation Digital Sketching A floor plan of the Jacobs House, shown in Figure 9, was found online. The floor plan indicates the location of walls, windows, and doors, as well as the placement of rooms and the extent of roof overhangs. Photographs of the building reveal three distinct roofline elevations. As a result, the building s external walls are not a constant height. In order to visualize the location of the different wall heights, a tablet PC was used to bring the floor plan into a digital sketching program. Setting the floor plan to a background sketching layer, a second sketching layer was added on top of the original sketch to visualize the grouping of similar walls. The result is shown in Figure 10. The red outline indicates walls connecting to the building s lowest roof. These walls, at a height of 7½, are used in the private space of the building composed of the bedroom and study. The blue outline indicates the next level of walls, at 9½, which are found in the building s main public space, or living area. Finally, the kitchen and bathroom space, outlined in green, has the highest walls (11½ ) in the building. A third sketching layer is added to the floor plan, consisting of the building s major dimensions, shown in Figure 11. These dimensions, listed in feet, will be used to create the building information model. To complete the digital concept sketch the floor plan background layer is hidden from view, leaving only the color-coded building blocks and block dimensions (Figure 12). 25
, blue (B), and green (G) lines layered on top of the original floor plan to denote the")
29 Figure 9: Floor plan of the Jacobs House. R B G Figure 10: Red (R), blue (B), and green (G) lines layered on top of the original floor plan to denote the location of the lowest, middle, and highest rooflines, respectively. 26

30 Figure 11: A third dimension layer is added to the floor plan to assist in the creation of the building information model. Figure 12: The background floor plan layer is hidden from view, showing the final concept sketch to be used in creating the building information model. 27

31 4.2.2 Creation of the Building Information Model The building s natural separation into three major blocks suggested that a top-down approach (Figure 4) would be ideal. The blocks can be created using conceptual mass elements within Revit Architecture. First, the three blocks can be sketched separately in a two-dimensional view. After each two-dimensional shape is created, the shape can be extruded to a given height, resulting in a threedimensional volume. In this way, the bedroom, living area, and kitchen/bath sketches can be extruded to heights of 7½, 9½, and 11½, respectively. Once the three individual masses are defined, they can be joined to create a single conceptual mass. The mass surfaces can be edited to create additional details associated with the building s geometry. The finished massing model is shown in Figure 13. Red, blue, and green lines have been superimposed on the figure to show how the three-dimensional masses correspond to the original 2D concept sketch. B G R Figure 13: The three Revit massing objects with red (R), blue (B), and green (G) outlines superimposed. Revit allows the addition of building elements such as floors, walls, and roofs directly to mass faces. In this example, the walls and floors are added to the building information model in this way. Figure 14 shows the massing model with the addition of brick and wooden walls to some of the mass faces. Although roof elements also can be added to mass faces as well, due to its large overhangs and atypical geometry the roof was easier to implement using a separate sketch feature. After the main envelope elements of the building are defined, additional elements such as windows, doors, and internal 28
32 walls can be added to the model. Figure 15 illustrates a progression of the build process. For a more detailed, step by step description of the build process, see Appendix A. Figure 14: The Revit massing model is shown with external walls that have been added to mass faces. When building elements are added to the model they are purposely left as generic. This means that the elements contain no material construction information. This is acceptable, because these properties will be varied as part of the energy simulation process later. 29

33 Figure 15: Progression of the build process. 30

34 In order to visualize how the building model would look in reality, a photo-realistic image can be rendered. Building surfaces can be edited to look like wood, brick, or any other material that can be created. A topography can be added to the building model, as well as site elements such as trees and shrubs. The rendering is created by placing a camera in one of the building model views. The camera takes a snapshot of the view, capturing a realistic, perspective view of the building. Figure 16 shows a rendered image of the building s completed geometry. Figure 16: Rendered image of the building model. 4.3 Module 2: Data Exchange and Energy Model Preparation Definition of Thermal Zones Before the building information model can be leveraged for energy analysis downstream, it must first be separated into thermal zones. A thermal zone is a three dimensional conditioned space in a building, referring to a space that is heated and cooled by the building s HVAC system. Not all space in a building is necessarily conditioned, thus some parts of the building model may not be included in the thermal zone(s). It is possible to export unconditioned spaces as well. This can be useful if an unconditioned space shades part of a conditioned space. 31
35 In Revit, thermal zones are defined using Room objects. Although this may imply that every room is a separate thermal zone, this is not necessarily true. Since a thermal zone is a three-dimensional space, it must be ensured that not only the area of thermal zones is stored in the building information model, but volume data as well. In Revit, this is accomplished by making sure that Areas and Volumes is selected for the room computation method in the Rooms and Areas tab on the home menu. Thermal zone volumes can be computed at a wall finish or at a wall center. To avoid any gaps between zones in the export process, the volumes should be computed at the wall center. One way of dividing a building into thermal zones is by room(s). In Revit, if a room is bounded by building elements on all sides for example, a floor on the bottom, walls on all sides, and a ceiling or roof on top then by default it is considered its own thermal zone. However, it is not necessary for all building elements to be thermally bounding, and in addition, it is not necessary to have a building element present in order to bound a thermal zone. In the former case, building elements can be defined as nonroom bounding, and in the latter case, room separation lines can be used to bound a thermal zone in the absence of a physical bounding element. Figure 17 is provided to illustrate the possibilities for thermal zone placement. Each thermal zone is denoted by an X. The two bedroom zones are fully enclosed spaces, and thus require no additional constraints for thermal zone definition. However, the three remaining zones, composed of the living area, kitchen/bath, and hallway/laundry space, do require some additional constraints. Since there are no physical building elements to bound the hallway/laundry space from the living area space, a room separation line is used to bound the two spaces. The same technique is used to separate the kitchen from the living area. Because the kitchen and bathroom are relatively small spaces and both share the same vaulted ceiling, the wall separating the two is defined as non-room bounding to combine the two spaces into the same zone. 32

36 Room separation line Room separation line Non-room bounding wall Figure 17: Floor plan view shown with five thermal zones defined. It may be possible to simplify thermal zones even further. Figure 18 shows a scenario in which the building has been separated into two zones. The first zone encapsulates the private spaces of the building, including the bedrooms and a utility room. The second zone defines the public space: living area, kitchen and bathroom. There are a couple of reasons why further simplification of the building model s thermal zones may be beneficial at this time. First, simulation results for the two-zone and fivezone models may show that the additional zoning provides no additional accuracy. In this case, the twozone model will save computation time. Second, the simplified two-zone model may prove more reliable when imported into an external analysis tool. Thus, when defining the thermal zones for a building information model that will be used for the purpose of energy modeling, there exists a trade-off among simulation accuracy, computation time, and import reliability. 33
37 Figure 18: Definition of thermal zones for the example building. Since thermal zones are volumes, boundaries must be checked in all three dimensions. Figure 19 shows a section view of the building and the extent of the thermal zone boundaries. In the image on the left, the cantilevered section of the living area space is not being captured correctly by the current zone. This is due to the fact that Revit calculates room volumes at a specified height, and currently the calculation height is below the cantilever. In the image on the right, the calculation height is raised above the cantilever, resulting in a more accurate model. In addition, the zone on the left does not fully extend to the highest roof. This has been corrected in the zone on the right by properly defining the upper bound of the zone. Depending on the BIM program, other information may be imparted to the model before export. Types of information may include building location or building type. Building location information could be used by an external analysis program to define a specific weather file for simulation. Building type information could be used to select default equipment and scheduling for a building given that it is a school, hospital, shopping mall, or single family home. 34
 file format.")
38 Figure 19: Section view of an incorrect thermal zone boundary (left) and a correct boundary (right) Data Export The building information model can be exported as a thermal analysis model using the Green Building Xtensible Markup Language (gbxml) file format. A gbxml file provides a number of options for export complexity. For example, one can choose whether or not to include features such as shading surfaces and window mullions. Since the roof of the example building has substantial overhangs, the decision is made to export the model as complex, with shading surfaces. Upon export, Revit provides a dialog box with a preview of the export model. At this point, one can check if thermal zones are correctly defined, and if applicable, shading surfaces as well. Figure 20 shows the export preview for the example building. 35

39 Figure 20: gbxml dialog box within Revit provides export settings and a preview of the analysis model Data Import Both Ecotect and DesignBuilder allow the import of gbxml data, which make them ideal for this study. The import process for the two programs is different, so each is treated here separately Import Process for Ecotect Ecotect allows the import of many types of building data from simple geometric models to fully detailed models for thermal analysis. In this example, the building is imported as Model/Analysis Data, to which gbxml data belongs. After selecting the analysis file, the dialog box of Figure 21 is displayed. This dialog box is used to manage the proper mapping of gbxml data elements to Ecotect model elements. As the Model Element column in Figure 21 displays, most of the gbxml data elements are correctly identified. For example, the Basic Wall: Generic Wood data element is correctly identified as a wall model element. However, for other gbxml data elements, Ecotect is forced to guess as to which model elements they should represent. This is the case for a few of the data elements of the example building. In Revit, single-flush elements are door elements and casement elements are window elements. As Figure 21 shows, the single-flush element is not correctly identified as a door in Ecotect, and the casement element is not correctly identified as a window. These discrepancies can be resolved, however, 36


40 by changing the model element from guess to door or window, depending on the proper coversion. In this way, all elements should be checked for proper conversion before model import. Figure 21: Ecotect dialog box for gbxml import. Figure 22: A screenshot of the Ecotect analysis model just after gbxml import. The imported gbxml model is shown in Figure 22. This is a view of the building shown in Ecotect s 3D Editor environment. As the name suggests, building geometry and properties can be edited in this environment. The building model geometry can also be represented with a rendered view, shown in Figure 23; however, building elements cannot be edited here. The different colors in Figure 22 are 37

41 used to identify different zones and shading surfaces in Ecotect. It can be seen that the five Ecotect zones correspond to the five thermal zones defined in Revit. The figure also indicates that the roof overhangs have been imported as shading surfaces. Figure 23: Rendered view of Ecotect model just after import. Although the imported building data looks generally complete and correct, the integrity of all model surfaces (both zone and shading surfaces) should still be confirmed. Errors in the building information model or the export/import process can result in analysis model inaccuracies. Such inaccuracies could include unintended voids or additional surfaces. Voids could cause thermal zones to be unenclosed, which is not permitted for thermal analysis. Additional surfaces could create a number of issues, including unwanted shading or overlapping building elements. A close inspection of the Ecotect model reveals several gaps and additional surfaces in the building s geometry. One such inaccuracy is indicated in Figure 24, showing several unconnected surfaces located at the building s cantilevered wall. The source of this inaccuracy is unclear; however, it can be fixed in the 3D Editor environment. Building elements in the 3D Editor are defined by lines and nodes. A collection of lines and nodes can be used to create a surface, and a surface can then be defined as a wall, door, or any other applicable modeling element. For example, a standard window element would consist of four lines with 38

42 four nodes at each corner. These lines and nodes can be manipulated in order to fix any model inaccuracies. Figure 25 shows a close-up view of the cantilevered wall in the 3D Editor. The surfaces and surface nodes associated with the inaccurate geometry are highlighted. A node can be moved by first selecting it (turning the node black), then left-clicking its current location, and finally left-clicking its desired location. Multiple nodes can be moved at once. The gap shown in Figure 25 is made up of four coplanar nodes. If all four nodes are selected, using the Shift key, and one of the nodes is moved, the remaining three nodes will follow. Figure 24: A gap in the imported Ecotect geometry is indicated near the cantilevered section of the building. 39
43 Figure 25: The gap is shown in the 3D Editor environment with the appropriate nodes and surfaces highlighted Import Process for DesignBuilder Like Ecotect, DesignBuilder allows the import of 3D building model data using the gbxml file format. Upon import, the user is given a preview of the imported geometry. Figure 26 shows the dialog box for inputting a gbxml file, as well as the preview box showing the import model. The preview box contains three options: import as building blocks, import shade surfaces, and merge coplanar surfaces. DesignBuilder uses building blocks as a way to organize different levels and/or sections of a building. Each building block is made up of a thermal zone or zones, and building elements, such as walls and windows, are assigned to each zone surface. This creates a data hierarchy in which modifications can be made at the building, block, zone, or element level. For example, if the material construction of walls is changed at the building level, then all walls in all building blocks will be changed to that material construction. However, if changes are applied at the block level, only walls in that block will be affected. If import as building blocks is selected, then DesignBuilder will automatically divide the imported 3D model into building blocks. Import shading surfaces allows shading surface data to be imported in addition to surfaces associated with thermal zones. The last option, merge coplanar surfaces, allows 40


44 multiple surfaces to be simplified to one surface as long as they reside in the same plane. For this example, all three options are selected. Figure 26: On left, the screen for selecting a gbxml file. On the right, a preview of the imported building geometry. As with Ecotect, the integrity of all imported data must be confirmed. The first attempt at importing BIM data into DesignBuilder is unsuccessful. Figure 27 shows a rendered view of the imported building model. From the figure, it is clear that the main living area of the building is not correctly imported into the analysis program. All other building data, however, appears to be generally correct. Since the DesignBuilder building blocks are generated from the BIM thermal zones, it is hypothesized that a simplified thermal zone configuration in the building information model may improve import results. If additional zone detail is required, these zones can be added to the DesignBuilder model after import. 41

.")
45 Figure 27: First attempt at importing BIM data into DesignBuilder. The simplified two-zone Revit model in Figure 18 is imported instead of the five-zone model of Figure 17. The resulting DesignBuilder import model, shown in Figure 28, is significantly improved compared to the first attempt. The large living area space is now included as a model building block. The import model data is not completely error free. Close inspection of the analysis model reveals a few extraneous shading surfaces (Figure 29). Like Ecotect, these geometric discrepancies can be resolved in the 3D editor environment by highlighting the extra surfaces and choosing Delete selected object(s). Figure 28: A view of the example building within DesignBuilder's rendering environment. 42

46 extraneous shading surfaces Figure 29: Extraneous shading surfaces in the DesignBuilder import model Energy Model Preparation Once the imported model geometries are corrected, analysis model parameters can be defined. Using the Research Benchmark for guidance, baseline energy models can be created in both Ecotect and DesignBuilder. As with the data import process, the methods of defining model parameters differ across platforms. For that reason, they are treated separately in the sections below Ecotect Parameters Ecotect s parameters can be managed under the Model heading on the main menu. Under the Model heading, Zone Management can be used to define model parameters such as occupancy levels, internal gain amounts, infiltration rate, and HVAC service type. As Figure 30 illustrates, these parameters can be entered on a zone-by-zone basis. Material constructions can be edited under Model, Element Library. Here, new constructions can be made either by specifying a construction layer-by-layer, or by specifying an overall R-value. Since Ecotect is used in this study as an early design tool for general 43

47 guidance, the overall R-value method is chosen. The new constructions can be applied to model elements in the 3D Editor by selecting an element and changing its properties in the Material Assignments box on the right-hand side of the screen. Benchmark schedules can be entered using the Schedule Library found under the same Model heading. Figure 30: The Zone Management dialog box in Ecotect DesignBuilder Parameters DesignBuilder s parameters are organized in a tab structure. The Construction tab is shown in Figure 31. On this tab, material constructions are imparted on the building s wall, roof, and floor elements. Like Ecotect, a construction can be given an overall R-value or materials can be added layerby-layer. If materials are added layer-by-layer, DesignBuilder calculates the construction s overall R- value. The decision is made to define the DesignBuilder constructions layer-by-layer. Using the external walls as an example, layers can be defined such that the overall R-value achieves that specified by the Research Benchmark. 44


48 Figure 31: Example of DesignBuilder energy model parameters. After all baseline model parameters have been entered, the models are ready for analysis. The final Ecotect and DesignBuilder models are shown in Figure 32 and Figure 33, respectively. Figure 32: A view of the final Ecotect analysis model. 45

49 Figure 33: A view of the final DesignBuilder analysis model. 4.4 Module 3: Simulation and Data Analysis Ecotect s analysis tools are accessed under the Calculate and Tools heading in the program s main menu. The Calculate drop-down menu provides a number of different analysis tools focused on lighting, shading, solar access, acoustics, and thermal effects. The Tools menu includes weather and solar analysis tools which provide detailed site information for a given weather file Weather Analysis The Weather Tool is used first to understand the environmental elements in which the building is placed. In order to run the Weather Tool, a valid weather file is required. Although Ecotect provides a library of weather files, Madison, Wisconsin is not one of the default choices. However, Ecotect has the ability to convert some other types of weather files into an Ecotect weather file. One of the valid file types is the EnergyPlus weather file, denoted by the.epw extension. The U.S. Department of Energy s Building Technologies program provides EnergyPlus weather data for over 2100 locations worldwide. Data for Madison, WI is downloaded and converted into a valid Ecotect weather file. 46

50 Figure 34: Ecotect weather tool analysis for Madison, WI. Figure 34 shows a visual representation of monthly weather data for Madison, WI. The wind rose charts show wind frequencies at 9 am and 3pm. The roses indicate that the majority of wind is experienced from the south and west. This is valuable information in the event that natural ventilation strategies are used. In the bottom of Figure 34, heating and cooling degree hours are shown in red and blue respectively. Degree hours are equal to the summation of differences between the average hourly temperature and a base temperature (65 F for heating, 79 F for cooling) (35). Qualitatively, the figure indicates the dominance of heating degree hours to cooling degree hours for the majority of the year Heating and Cooling Loads Heating and cooling loads are calculated in Ecotect using Calculate, Thermal Analysis. A builtin wizard can be used to assist in defining analysis parameters. Given the weather results from the previous section and the fact that the building studied here is a residential structure, the general trend 47

51 shown in Figure 35 is expected. An analysis of the building s heat gains and losses can help to explain what factors drive the loads shown in the figure. This analysis is included in the next section. Figure 35: Annual heating and cooling load analysis performed in Ecotect Heat Gains and Losses Figure 36: Annual heat gain/loss analysis performed in Ecotect. 48
52 Figure 36 shows heat gains and losses over the course of the year in Ecotect. This analysis can also be found in the wizard associated with Calculate, Thermal Analysis. The figure shows heat gains in the chart area above the horizontal axis, and heat losses below. The first trend observed is that the magnitude of losses is greater than the gains for most months of the year, except for a few summer months. The second trend observed is that most heat is lost due to infiltration (air leakage) and conduction associated with the building envelope. These heat losses are shown in green and red, respectively. There are internal heat gains from lighting and equipment all year round, shown in blue, and also some direct solar gains (yellow), especially in the summer Solar Orientation A solar orientation study is performed using a combination of Ecotect and DesignBuilder. Ecotect is used first to visualize amounts of solar radiation falling on building surfaces. For Madison s heating-dominated climate, it is hypothesized that the best orientation will maximize solar radiation falling on the the building s glazed regions so long as adequate shading is provided in the cooling months. The orientation which meets this criteria is treated as an estimate of the building s optimal orientation. DesignBuilder is then used to test the hypothesis by generating annual energy use figures for each building orientation. Figure 37 shows the setup for the solar radiation study. The solar radiation tool can be accessed as part of the Solar Access Analysis under the Calculate heading of Ecotect s main menu. The figure shows the building s surfaces color-coded, based on the surface s average daily solar radiation. Surfaces receiving the highest radiation are lighter in color (shown in yellow) while surfaces receiving the lowest are darker (shown in blue). 49


53 Figure 37: Incident solar radiation analysis performed in Ecotect. The building s initial orientation is shown on the left-hand side of Figure 38. For this orientation, the direction of north is defined to have an offset of 0 degrees with respect to the building. Once the radiation data is captured for the 0 degree offset, the direction of north is offset every 30 degrees (shown on the right of Figure 38) from 0 to 360. This simulates the effect of changing the building s orientation toward the sun. After solar radiation data is captured for all orientations, the best orientation estimate can be found. Figure 38: On the left, the initial building orientation. On the right, the direction of north is offset by 30 degrees. 50

54 Ecotect Results The solar radiation results for the 0 degree offset are shown in Figure 39. The figure provides two views of the building model. On the left, the region of the building with the most glazing is shown. On the right, the opposite view of the building is shown, in which there is significantly less window area. The figure shows that, for the 0 degree orientation, the building s non-glazed surfaces receive greater degrees of solar radiation than the building s glazed surfaces. This general trend is also observed for numerous other orientations, including 30, 60, 270, 300, and 330 degrees. According to the stated hypothesis, these orientations will not provide an estimate for the building s best solar orientation. Figure 39: Solar radiation analysis of the building at the initial orientation (0 degrees). The surface radiation values for the remaining orientations are compared. Figure 40 shows the orientations receiving the greatest amounts of solar radiation on the building s glazed regions, which are the 120, 150, and 180 degree orientations shown from top to bottom. The 120 degree orientation is shown to have greater amounts of radiation on the private space glazing as compared to the 150 and 180 degree orientations, but less radiation than both on the public space glazing. Conversely, the 180 degree orientation provides the greatest radiation on the public space glass, but the lowest radiation of the three on the private space glass. The 150 degree orientation is shown to provide benefits of both the 120 and 180 degree orientations, and thus is chosen as the estimate for the best orientation. 51

55 Figure 40: Solar radiation analysis results for the 120, 150, and 180 degree orientations shown at the top, middle, and bottom, respectively DesignBuilder Results The orientation study is carried out in DesignBuilder using the same intervals used in Ecotect and the baseline energy model parameters outlined in Chapter 3. The annual heating and cooling energy required for each orientation from 0 to 330 degrees is shown in Figure 41. The heating data points appear to achieve a minimum value near the degree orientation range indicated by Ecotect. The maximum heating energy is shown to occur at the 300 degree orientation, where the building receives the majority of solar radiation on its non-glazed surfaces. The absence of passive solar gains force the building s HVAC system to make up the internal temperature difference instead. 52
56 Figure 41: Annual heating and cooling energy consumption for solar orientation study. Heating and cooling data points are separated in Figure 42 and Figure 43, respectively. The y- axis intervals have been reduced to provide a clearer indication of the minimum and maximum energy usage scenarios. For heating energy, Figure 42 shows that the 120 and 150 degree orientations provide nearly the same energy performance, with the 150 degree orientation being the lowest overall. For cooling energy, Figure 43 indicates that a 90 degree orientation results in the greatest cooling energy use. This orientation corresponds to the largest glazed region (located in the living area) facing due east. The lowest cooling energy is used at the 300 degree orientation. This is also the orientation associated with the largest heating energy usage. However, the orientation with the smallest heating energy does not correspond to the orientation with the largest cooling energy. Figure 43 shows that the cooling energy at the 150 degree orientation lies somewhere between the minimum and maximum points. 53
57 Figure 42: Annual heating energy consumption for solar orientation study. Figure 43: Annual cooling energy consumption for solar orientation study. Heating and cooling energy are combined in Figure 44 to show the total impact of solar orientation. Here, it is clear that the 150 degree orientation results in the lowest annual heating and cooling energy. This is the same result suggested by the Ecotect radiation study. 54
58 Figure 44: Annual combined heating and cooling energy consumption for solar orientation study Elements of Passive Solar Design A second orientation study is used to explore the impact of the building s passive solar design features. Several design elements work together to effectively use the sun s own energy as a source of heat. These design elements include large areas of glazing to allow solar gains, thermal mass to capture and release heat in the winter, and overhangs to provide shading in the summer. Ecotect and DesignBuilder are used to study the individual and collective effect of passive solar design features. First, a solar ray analysis is performed in Ecotect to visualize the effect of passive solar elements in the winter and summer months. Roof overhangs are turned on and off to compare the amount of solar rays allowed into the building. DesignBuilder is then used to perform annual simulations for four different configurations: the building with overhangs and thermal mass (in other words, the building as it was designed), no overhangs with no thermal mass, no overhangs with thermal mass, and overhangs with no thermal mass. Here, the thermal mass refers to the large fireplace that sits in the building s public space. The fireplace is modeled in DesignBuilder as a brick partition wall. All four scenarios are simulated for 55

59 every 30 degree increment between 0 and 330 degrees. The 48 scenarios are compared to see if the building s passive solar elements collectively result in the best design strategy Ecotect Results Because the sun s position in the sky is changing constantly, the amount of solar rays entering a building s spaces changes throughout the year. Figure 45 shows the sun s position on December 28 th at 12:00pm on the left and on July 28 th at 12:00pm on the right. In the winter months, the sun s relatively low angle in the sky allows solar rays to penetrate the building, either with or without roof overhangs (shown on the left of Figure 46 and Figure 47). In the summer months, the scenarios are far more different. On the right side of Figure 46 and Figure 47, solar rays are shown for scenarios with and without roof overhangs for July 28 th at 12:00pm. With overhangs, the building is able to block the majority of solar heat from entering the living area space. Without overhangs, solar rays are allowed directly into the living space, heating the space during the cooling months of the year. Figure 45: The sun's position at 12:00pm on December 28th (left) and July 28th (right). 56
 and July 28th (right).")
60 Figure 46: Building shown with overhangs at 12:00 pm on December 28th (left) and July 28th (right). Figure 47: Building shown without overhangs at 12:00pm on December 28th (left) and July 28th (right). An interior view of the building, shown in Figure 48, illustrates the thermal mass s ability to collect both direct and indirect sunlight in the winter months. 57

61 Figure 48: Interior view of thermal mass and solar rays DesignBuilder Results Like the previous orientation study, annual heating and cooling energy usages are plotted for the four design scenarios at each orientation. Heating energy consumption is shown in Figure 49. The four data sets exhibit the same general pattern, and all obtain their minimum at the same 150 degree orientation. The lowest heating energy consumption is achieved by the design with thermal mass, but no overhangs. In this scenario, the absence of overhangs allows additional solar heat, and the inclusion of the thermal mass allows the additional heat to be stored and released in the building. The highest heating energy corresponds to the design scenario with overhangs included, but no thermal mass. Here, the inclusion of overhangs blocks some solar gains as compared to the scenario without overhangs (increasing the heating load) and the absence of thermal mass means less solar energy can be stored and released as heat. As the figure shows, the scenario with overhangs and thermal mass, or the as designed scenario, has the second highest heating energy of the group. 58
62 Figure 49: Annual heating energy for the passive solar design study. Annual cooling energy consumption for the four scenarios is given in Figure 50. The figure illustrates the trade-off associated with building overhangs. The two design scenarios with overhangs use less cooling energy than the scenarios without. The figure shows that the overhang design element creates a greater separation of the data than the thermal mass. Moreover, the separation between the overhang/no-overhang scenarios increases as the building s glazed areas are oriented toward the sun (in the range of 120 to 210 degrees). The mass s influence is less significant due to the sun s position in the sky during the cooling months of the year. This dampens the heating effect of the mass. The mass s influence could become more significant if natural ventilation or night cooling strategies were employed, creating a mass cooling effect. However, these methods are not explored at this time. 59
63 Figure 50: Annual cooling energy for the passive solar design study. Heating and cooling energy consumption data are combined in Figure 51. Here, the overall effect of the passive solar design features is realized. The figure shows that there is a 15% difference between the best case (lowest energy use) and worst case (highest energy use) design scenarios. Although the as designed scenario is not the best choice at all possible orientations, it is shown to be the best design when all possible designs reach their minimum values. Hence, the inclusion of the overhangs and mass provide the best overall design. 60
64 Figure 51: Annual combined heating and cooling energy for the passive solar design study ECM Analysis The last study using imported model data concerns the addition of multiple energy conservation measures (ECMs) to the baseline energy model. A sample of ECMs are investigated, including additional wall and roof insulation, higher performance glazing, and higher efficiency lighting, appliances, and mechanical systems. A parametric analysis of ECMs can provide insights into energy saving design alternatives. Since energy savings are not the only factor for design decisions, economic factors are addressed as well ECMs Envelope Insulation The baseline wall insulation, 6 R-19 fiberglass batting, is upgraded to include various levels of rigid foam sheathing. Since the baseline building s fiberglass insulation fills the entire 2x6 stud depth, the choices for increasing the external wall thermal resistivity are limited without changing the building s fundamental method of framing (e.g., structurally insulated panels, or SIP construction). Both expanded 61
65 polystyrene (EPS) and extruded polystyrene (XPS) rigid foam insulation are applied to the baseline wall insulation. The building s roof poses similar practical constraints for upgrade. The baseline minimum insulation also fills the entire framing void, this time an assumed 2x12 roof joist. The building s flat roof, a major design aesthetic, poses an additional constraint in preventing the use of common insulation types such as blown-in insulation. For these reasons, exterior rigid foam is also used to increase roof R-value Glazing Although the original Jacobs House had single-pane windows, the Research Benchmark imposes a higher standard. According to specifications in the DesignBuilder window library, the thermal performance required by the Benchmark is consistent with a double-pane window with a low-emissivity, or low-e, coating. Low-E coatings are used to reflect radiant infrared energy. This baseline window is compared to a double pane-window with argon gas fill Electric Loads All baseline appliance data is taken from the Research Benchmark except for the refrigerator, clothes washer, and dishwasher. Since these appliances are able to qualify for the Energy Star label, energy and water usage data is taken from the Energy Star website. Energy Star appliances are then compared to the conventional baseline units. High efficiency lighting scenarios are also compared with the baseline. The baseline lighting, as stipulated by the Research Benchmark, is comprised of 86% incandescent fixtures and 14% compact fluorescents (CFLs). This baseline scenario is compared to two other configurations: 50% incandescent, 50% CFL and 100% CFL. 62
66 HVAC and Hot Water Equipment The baseline efficiencies for HVAC and hot water equipment are increased to meet higher standards, such as Energy Star. The furnace efficiency is increased from a baseline 78% Annual Fuel Utilization Efficiency (AFUE) to 90%. The air conditioner unit is upgraded from a Seasonal Energy Efficiency Ratio (SEER) of 10 to 13, and ultimately to an Energy Star qualifying 14.5 SEER. Finally, the electric tank hot water heater is upgraded from a baseline Energy Factor of 0.89 to an Energy Factor of ECM Economics The cost premiums of ECMs are considered as part of the analysis. Cost premium data is taken from sources that include the 2010 RS Means Construction Data Book (37) and Energy Star (38). A table with all detailed cost premium data is included in Appendix B. The cost effectiveness of ECMs is judged using net present value for a given time horizon. The cost premium of the ECM is assumed to occur in year 0, and cash flows resulting from lower energy bills occur in years 1 through the horizon s end. Forecasted energy rates (in 2008 dollars) for electricity and natural gas are taken from the U.S. Energy Information Administration and used for the purpose of yearly energy savings calculations (39). A real discount rate of 3% is assumed for all calculations ECM Analysis Results The simulation results for the ECMs are shown in Table 4. On an individual basis, the greatest energy savings are achieved by the high efficiency furnace and the additional 3 of XPS wall insulation. Both ECMs result in a 13% decrease in annual gas consumption or a 7% decrease in overall energy consumption. Economic factors are included in the results of Table 5. The cost effectiveness for individual measures is shown as well as for Combined measures. Here it is assumed that a building owner wants to implement a combination of ECMs that are cost effective for a ten-year time horizon. The combined 63
67 measures which include additional wall insulation (2 EPS), double-pane argon windows, upgraded HVAC and hot water, and all CFL lighting meet the given criteria, and result in a 21% energy savings. Table 4: Simulation results for various ECMs. ECM Room Electricity (kwh) Lighting (kwh) HVAC Misc. (kwh) Heating (kwh) Cooling (kwh) Domestic Hot Water (kwh) Exterior Lighting (kwh) Total Electric (kwh) Total Gas (kwh) Baseline " EPS insulation " EPS insulation " EPS insulation " XPS insulation " XPS insulation " XPS insulation R-2.89 roof sheathing R-5 roof sheathing % AFUE furnace SEER A/C SEER A/C EnergyStar dishwasher EnergyStar refrigerator EnergyStar clothes washer All EnergyStar appliances % incandescent, 50% CFL % CFL High efficiency water heater Argon windows Combined measures Table 5: Economic analysis for ECMs. ECM Incremental Cost ($) Total Electric (kwh) Total Gas (Therm) Electric Savings (kwh) Gas Savings (Therm) Net Present Value for Various Time Horizons 1 yr. ($) 5 yr. ($) 10 yr. ($) 15 yr. ($) 20 yr. ($) 25 yr. ($) 30 yr. ($) Baseline " EPS insulation " EPS insulation " EPS insulation " XPS insulation " XPS insulation " XPS insulation R-2.89 roof sheathing Argon windows % AFUE furnace SEER A/C SEER A/C EnergyStar dishwasher EnergyStar refrigerator EnergyStar clothes washer All EnergyStar appliances High eff. water heater % incandescent, 50% CFL % CFL Combined measures
68 CHAPTER 5: CONCLUSIONS AND RECOMMENDATIONS 5.1 Conclusions A building energy analysis workflow that leverages existing data from a building information model is successfully implemented. Although some data quality issues are experienced during export and import, all issues are able to be resolved. The features of the BIM workflow found to add the most value and save the most time were the ability to export building geometry and thermal zone information and the ability to use material take-offs for cost estimation. A desirable feature of the workflow would be the ability to impart material constructions and operational schedules to the BIM. In the author s point of view, this is the next logical place to save time and add value to the process. The BIM data was able to be used in two separate external energy analysis tools for the purpose of evaluating different design alternatives. Solar orientation and passive solar design studies were performed using both analysis programs. Simulation results showed a 15% difference in heating and cooling energy between the best case and worst case passive solar design strategies. A parametric study of ECMs was performed to indicate cost effective design alternatives. Results indicate a 21% energy savings compared to the baseline design for a 10-year time horizon. 5.2 Recommendations The intention for these instructional modules is not to provide the fundamental skills associated with CAD, parametric solid modeling, BIM, or the particular software tools used in this paper. Rather, the modules are intended for users who have a general knowledge of these individual tools and concepts. For example, before completing Module 1, it is recommended that users are exposed to the concepts of parametric solid modeling and BIM. Before completing Modules 2 and 3, users should be exposed to general concepts of building energy and building energy simulation. The modules are then intended to build a bridge between the understanding of individual components and the understanding of the components integrated together in a multi-disciplinary workflow. 65
69 The presentation slides in Appendix A can be used as a detailed, step-by-step guide through each module. The slides have been designed to demonstrate all of the major steps required for a BIM-based building energy analysis. Italics and boldface are used in the slides to denote keywords from the BIM and energy analysis programs, and screen captures have been included to indicate which tools are used for each step of the process. In the future, videos of this process could be created to provide a further level of detail. 66
70 REFERENCES 1. Building's Share of U.S. Primary Energy Consumption. Buildings Energy Data Book. [Online] U.S. Department of Energy Building's Share of U.S. Electricity Consumption. Buildings Energy Data Book. [Online] U.S. Department of Energy Carbon Dioxide Emissions for U.S. Buildings, by Year. Buildings Energy Data Book. [Online] U.S. Department of Energy EPA Emissions Summary Table for U.S. Buildings Energy Consumption. Buildings Energy Data Book. [Online] U.S. Department of Energy Building America. Energy Efficiency and Renewable Energy. [Online] U.S. Department of Energy Commercial Building Initiative. Energy Efficiency and Renewable Energy. [Online] U.S. Department of Energy X-PRIZE Foundation. [Online] 8. A marketable all-electric solar house: A report of a Solar Decathlon project. Wang, Na, et al. 2009, Renewable Energy, pp Residential Sector. Buildings Energy Data Book. [Online] U.S. Department of Energy Commercial Sector. Buildings Energy Data Book. [Online] U.S. Department of Energy Givoni, B. Climate Considerations in Buildings and Urban Design. New York : Van Nostrand Reinhold, Two design patterns for facilitating Building Information Model-based synchronous collaboration. Isikdag, Umit and Underwood, Jason. 2010, Automation in Construction, Vol Eastman, C. Building Product Models: Computer Environments Supporting Design and Construction. Boca Raton : CRC Press, Value proposition on interoperability of BIM and collaborative working environments. Grilo, Antonio and Jardim-Goncalves, Ricardo. 2010, Automation in Construction, Vol Autodesk, Inc. Revit Building Information Modeling. Parametric Building Modeling: BIM's Foundation. [Online]
71 16. Building information model based energy/exergy performance assessment in early design stages. Schlueter, Arno and Thesseling, Frank. 2009, Automation in Construction, Vol Khemlani, L. Top Criteria for BIM Solutions: AECbytes Survey Results. AECbytes. [Online] Autodesk Design Academy Quick Start for Revit Architecture. San Rafael : Autodesk, Inc., Roth, Stephen. Open Green Building XML Schema. gbxml. [Online] Building Information Modeling (BIM): Benefits, Risks, and Challenges. Azhar, Salman, Hein, Michael and Sketo, Blake International Proceedings of the 44th Associated Schools of Construction Annual Conference. 21. Center for Integrated Facility Engineering. CIFE Publications List. [Online] Building Information Modeling in Architecture, Engineering, and Construction: Emerging Research Directions and Trends. Becerik-Gerber, Burcin and Kensek, Karen. 2010, Journal of Professional Issues in Engineering Education and Practice. 23. Teaching Building Information Modeling as an Integral Part of Freshman Year Civil Engineering Education. Sacks, R. and Barak, R. January 2010, Journal of Professional Issues in Engineering Education and Practice, pp Building simulation: an overview of developments and information sources. Hong, Tianzhen, Chou, S.K. and Bong, T.Y. 2000, Building and Environment, Vol. 35, pp Contrasting the capabilities of building energy performance simulation programs. Crawley, Drury, et al. 2008, Building and Environment, Vol. 43, pp Design and Optimization of Net Zero Energy Solar Homes. Charron, Remi and Athienitis, Andreas. 2006, ASHRAE Transactions, Vol. 112, pp DOE-2 web site. [Online] James J. Hirsch & Associates The Simulation Research Group. DOE-2. [Online] Lawrence Berkeley National Laboratory Building Energy Software Tools Directory. Building Technologies Program. [Online] U.S. Department of Energy EnergyPlus: creating a new-generation building energy simulation program. Crawley, Drury B, et al. 2001, Energy and Buildings, Vol. 33, pp Autodesk Ecotect Analysis. [Online] Autodesk, Inc DesignBuilder web site. [Online] DesignBuilder Software Ltd. 68
72 33. Autodesk Green Building Studio. [Online] Autodesk, Inc Hendron, Robert and Engebrecht, Cheryn. Building America Research Benchmark Definition. National Renewable Energy Laboratory National Weather Service. Degree Days Explanation. National Weather Service Climate Prediction Center. [Online] Sleeth, Don. Residential Heat Loss and Heat Gain. HVAC Computer Systems Ltd. [Online] Waier, Philip, [ed.]. RSMeans Building Construction Cost Data Kingston : R.S. Means Company, Energy Star web site. [Online] U.S. Environmental Protection Agency Forecasts and Analysis. U.S. Energy Information Administration. [Online] Department of Energy Walker, I.S., et al. Feasibility of Achieving Net-Zero-Energy Net-Zero-Cost Homes. Lawrence Berkeley National Laboratory. [Online] September Water Heating. American Council for an Energy-Efficient Economy. [Online] Light Bulbs Etc, Inc. web site. [Online] 69


73 APPENDIX A Instructional Module Slides (slides advance from left to right): 70


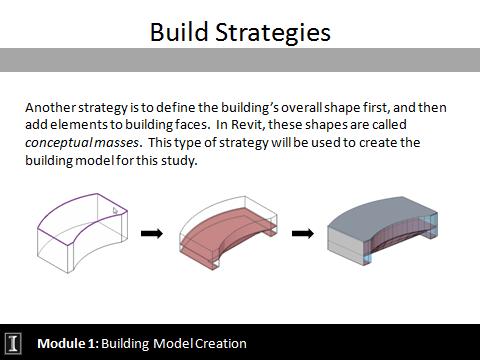


74 71


75 72
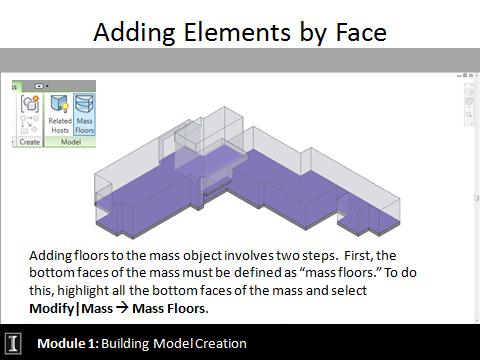
76 73


77 74

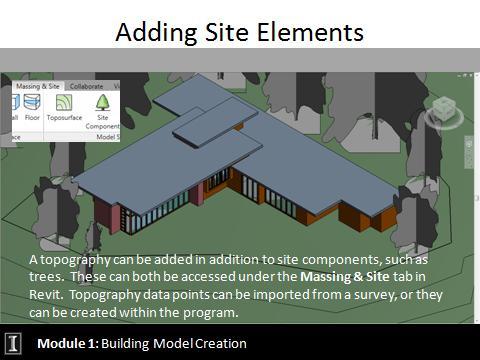


78 75

79 76

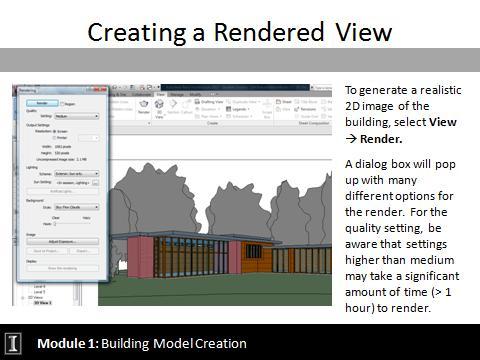

80 77


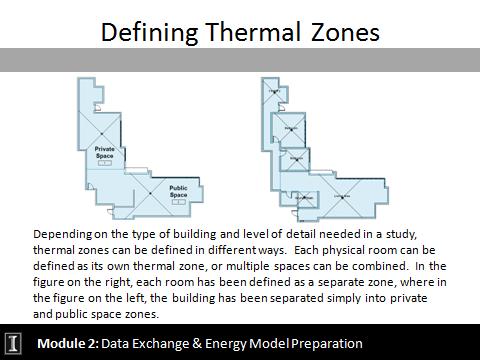


81 78

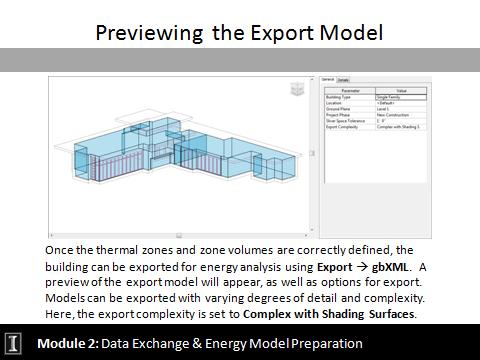


82 79


83 80


84 81

85 82

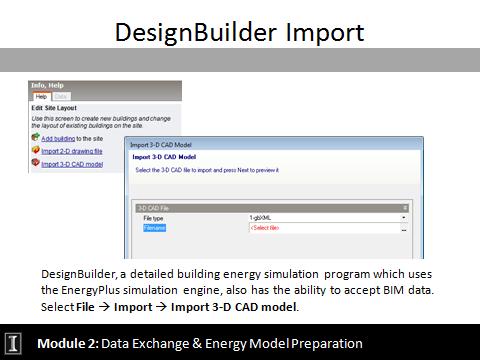

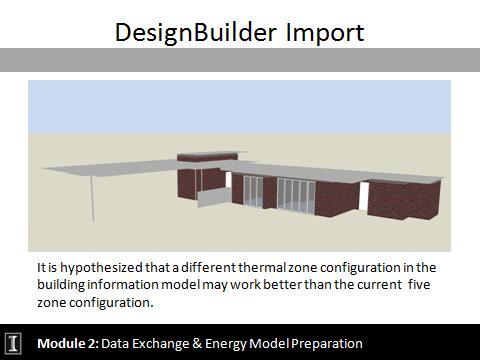

86 83
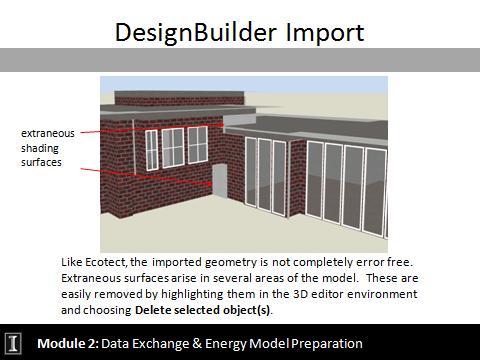
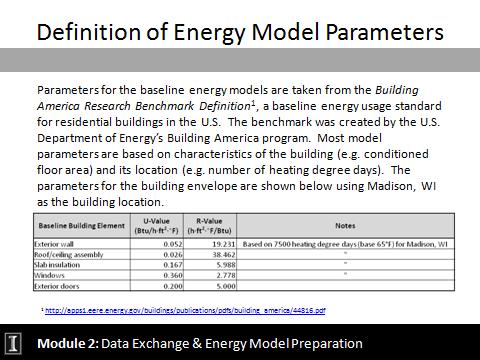


87 84

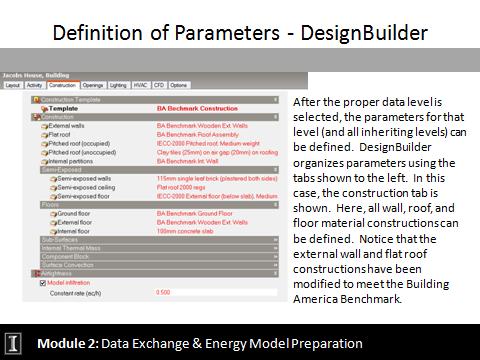
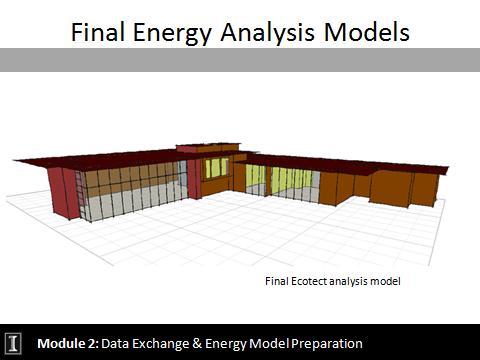

88 85


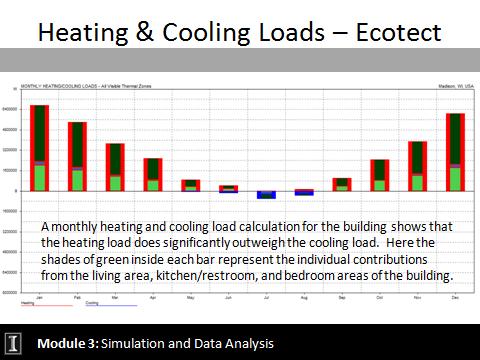
89 86

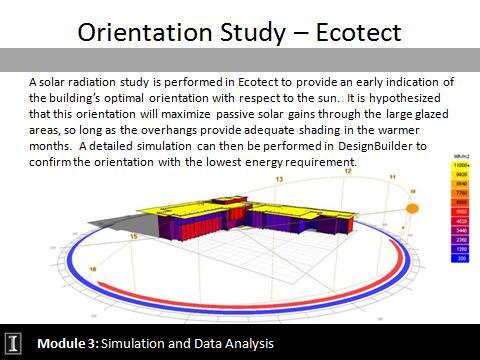

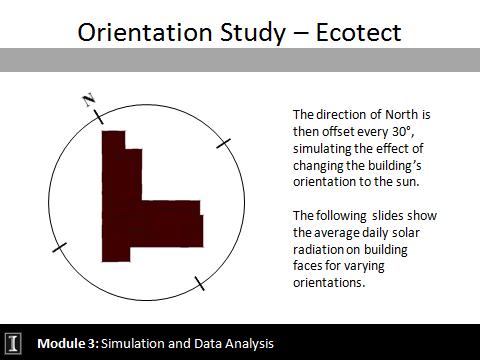

90 87
91 88

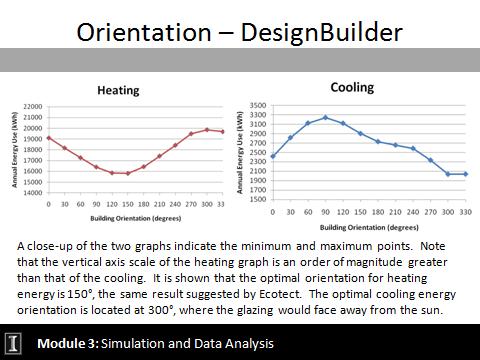
92 89


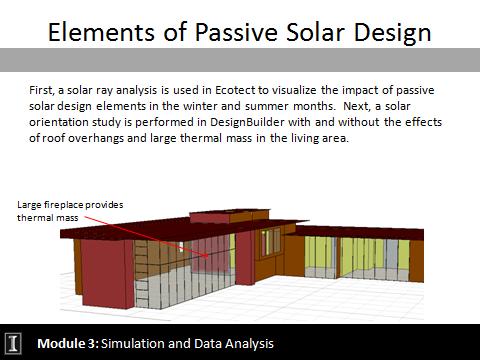
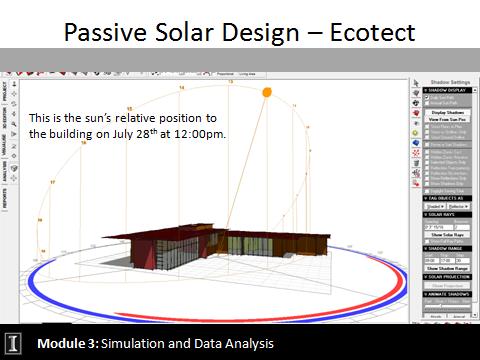
93 90


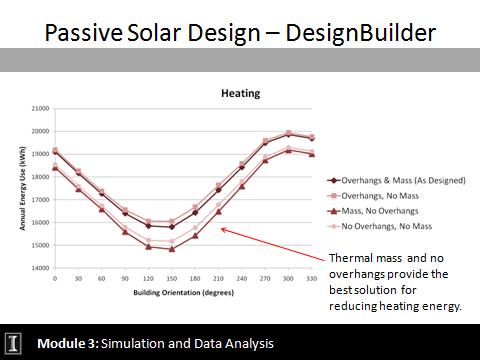

94 91


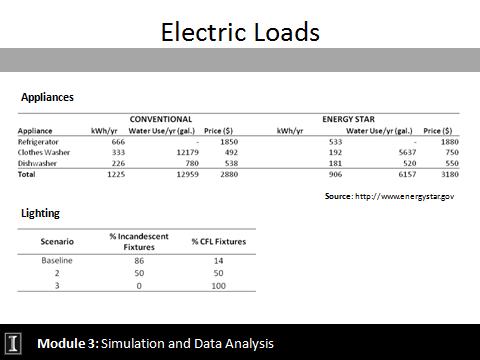

95 92


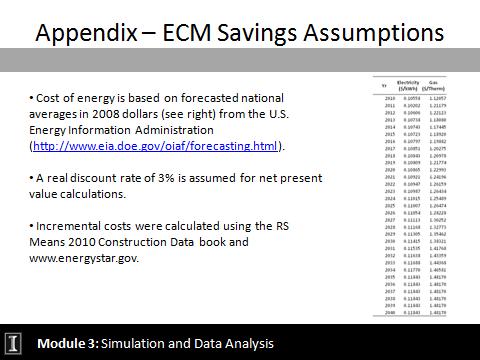
96 93
AC : ENERGY EFFICIENT DESIGN USING BUILDING INFOR- MATION MODELING AND ENERGY SIMULATION
 AC 2011-1207: ENERGY EFFICIENT DESIGN USING BUILDING INFOR- MATION MODELING AND ENERGY SIMULATION Christian Daniel Douglass, University Of Illinois at Urbana-Champaign Christian received his bachelor s
Module 3: Simulation and Data Analysis
 INSTRUCTIONAL MODULES DEMONSTRATING BUILDING ENERGY ANALYSIS USING A BUILDING INFORMATION MODEL Christian Daniel Douglass Industrial and Enterprise Systems Engineering December 1, 2010 Module Summary In
Energy Simulation And Optimized Retrofit Practices Applied To A Real Dwelling
 Purdue University Purdue e-pubs International High Performance Buildings Conference School of Mechanical Engineering 2014 Energy Simulation And Optimized Retrofit Practices Applied To A Real Dwelling Giulia
IESVE Compliance for ASHRAE IES Virtual Environment
 IESVE Compliance for ASHRAE 90.1 - IES Virtual Environment July 2018 IES Virtual Environment and Compliance with ASHRAE 90.1-2004, 2007, 2010 & 2013; Appendix G, Performance Rating Method and Chapter 11,
CHAPTER 7 Building Information Modeling
 CHAPTER 7 Building Information Modeling Dr Nabil Elsawalhi Associate Professor of Construction Management 1 Information and Communication Technology/ Building Information Modeling New approaches to construction
Journal of Chemical and Pharmaceutical Research, 2014, 6(3): Research Article. Comparison of software for building energy simulation
: Research Article. Comparison of software for building energy simulation") Available online www.jocpr.com Journal of Chemical and Pharmaceutical Research, 2014, 6(3):467-471 Research Article ISSN : 0975-7384 CODEN(USA) : JCPRC5 Comparison of software for building energy simulation
Available online www.jocpr.com Journal of Chemical and Pharmaceutical Research, 2014, 6(3):467-471 Research Article ISSN : 0975-7384 CODEN(USA) : JCPRC5 Comparison of software for building energy simulation
Autodesk MEP Engineering Solutions. Engineer for energy efficiency.
 Autodesk MEP Engineering Solutions Engineer for energy efficiency. Deliver Sustainable Building Systems More Quickly and Economically Autodesk MEP Engineering Solutions help MEP engineers, designers, and
Energy & Cost Savings Analysis of 2009 IECC Efficiency Improvements
 Energy & Cost Savings Analysis of 2009 IECC Efficiency Improvements As Adopted by the ICC September 22, 2008 www.thirtypercentsolution.org An Analysis Prepared for the Energy Efficient Codes Coalition
FAST EVALUATION OF SUSTAINABLE HEATING AND COOLING STRATEGIES FOR SOLAR HOMES WITH INTEGRATED ENERGY AND CFD MODELING
 FAST EVALUATION OF SUSTAINABLE HEATING AND COOLING STRATEGIES FOR SOLAR HOMES WITH INTEGRATED ENERGY AND CFD MODELING Justin Spencer 1 and Zhiqiang Zhai 1, * 1 Department of Civil, Environmental, and Architectural
BUILDING SERVICE ENGINEERING 2 BUILDING MODELING AND DYNAMIC SIMULATION
 BUILDING SERVICE ENGINEERING 2 BUILDING MODELING AND DYNAMIC SIMULATION Asst. Prof. Dr. Norbert Harmathy Budapest University of Technology and Economics OUTLINE Integrated design process Building model
ENERGY STAR Qualified Homes National Program Requirements, Version 3.0
 Qualifying Homes The following homes are eligible to earn the ENERGY STAR: Single-family homes; Units in multi-family buildings that are three stories or less; Units in multi-family buildings that are
COMFEN A COMMERCIAL FENESTRATION/FAÇADE DESIGN TOOL
 COMFEN A COMMERCIAL FENESTRATION/FAÇADE DESIGN TOOL Robert J. Hitchcock 1, Robin Mitchell 1, Mehry Yazdanian 1, Eleanor Lee 1 and Charlie Huizenga 2 1 Lawrence Berkeley National Laboratory, Building Technologies
Simulation Before Design? A New Software Program for Introductory Design Studios
 SIMULATION BEFORE DESIGN? 1 Simulation Before Design? A New Software Program for Introductory Design Studios TROY NOLAN PETERS California Polytechnic State University INTRODUCTION The 2010 Imperative states:
Tools for sustainable development: a comparison of building performance simulation packages
 Management of Natural Resources, Sustainable Development and Ecological Hazards II 53 Tools for sustainable development: a comparison of building performance simulation packages S. Hoque 1 & A. Sharma
Dynamic simulation of buildings: Problems and solutions Università degli Studi di Trento
 Dynamic simulation of buildings: Problems and solutions Università degli Studi di Trento Paolo BAGGIO The basic problem To design (and operate) energy efficient buildings, accurate modeling tools are needed.
Guidelines for Using Building Information Modeling for Energy Analysis of Buildings
 Buildings 2015, 5, 1361-1388; doi:10.3390/buildings5041361 Article OPEN ACCESS buildings ISSN 2075-5309 www.mdpi.com/journal/buildings/ Guidelines for Using Building Information Modeling for Energy Analysis
BIM and sustainable design
 SBS5322 Basics of Building Information Modelling http://ibse.hk/sbs5322/ BIM and sustainable design Ir. Dr. Sam C. M. Hui Faculty of Science and Technology E-mail: cmhui@vtc.edu.hk Jan 2018 Contents Environmental
What is Simulation. Merriam-Webster Dictionary On-line. Computer Simulation. Intent/purpose of simulation
 Today What is simulation Types of simulation models Energy performance simulation EnergyPlus model architecture How to get EnergyPlus software BEP simulation components Semi-automated BEP simulation Example:
FIVE WAYS YOUR MOVE TO A BIM WORKFLOW PAYS OFF
 ARCHITECTURE & BUILDING ENGINEERING AEC COLLECTION EBOOK FIVE WAYS YOUR MOVE TO A BIM WORKFLOW PAYS OFF Get started > 01 02 03 04 05 DELIVER HIGHER- QUALITY WORK OPERATE MORE EFFICIENTLY EXPAND YOUR BILLABLE
The Top Five Ways an Architect Can Drive Sustainability. Early-stage design decisions that can have a significant impact on building performance
 The Top Five Ways an Architect Can Drive Sustainability Early-stage design decisions that can have a significant impact on building performance Architects are responsible for a large number of fundamental
Comprehensive Certificate Course for BEAM Plus on Energy Use (EU) 2016
 2016") Comprehensive Certificate Course for BEAM Plus on Energy Use (EU) 2016 Session 2 Energy Simulation & Modelling Honorable Speaker Mr Antony Ho ARUP Methodology and data analysis of building energy simulation
Comprehensive Certificate Course for BEAM Plus on Energy Use (EU) 2016 Session 2 Energy Simulation & Modelling Honorable Speaker Mr Antony Ho ARUP Methodology and data analysis of building energy simulation
A SIMPLE USER INTERFACE FOR ENERGY RATING OF BUILDINGS
 Proceedings of Building Simulation 2011: 1 2 3 4 5 6 7 8 9 10 A SIMPLE USER INTERFACE FOR ENERGY RATING OF BUILDINGS Abraham Yezioro 1, Oren Shapir 1, and Guedi Capeluto 1 1 Faculty of Architecture and
White Paper ENVELOPE-FIRST APPROACH TO NET-ZERO ENERGY BUILDINGS
 BOULDER CHICAGO NASHVILLE SALT LAKE CITY SAN FRANCISCO SPRINGFIELD, MO WASHINGTON, DC 2540 Frontier Avenue, Suite 100 Boulder, Colorado 80301 303.444.4149 White Paper ENVELOPE-FIRST APPROACH TO NET-ZERO
A Real-time Building HVAC Model Implemented as a Plug-in for Trimble SketchUp Zaker A. Syed 1 and Thomas H. Bradley 2
 A Real-time Building HVAC Model Implemented as a Plug-in for Trimble SketchUp Zaker A. Syed 1 and Thomas H. Bradley 2 1 Graduate Research Assistant, Department of Mechanical Engineering, Colorado State
Great Ocean Rd Ice Creamery
 Great Ocean Rd Ice Creamery BCA Section J - JV3 Compliance Report Revision: 01 Job No: 2171 Date: 7 July 2015 ADP Consulting Pty Ltd Level 10, 10 Queens Rd, Melbourne Vic 3004 www.adpconsulting.com.au
Assessing the energy performance of modern glass facade systems
 Assessing the energy performance of modern glass facade systems Abdelsalam Aldawoud * Architectural Engineering Department, University of Sharjah Sharjah, United Arab Emirates Abstract. The design and
and LEED Energy and Atmosphere Credits Jean Ascoli, LEED AP BD+C Architect, Energy Specialist
 ASHRAE University of Illinois Student Chapter April 20, 2011 Building Energy Efficiency and LEED Energy and Atmosphere Credits Jean Ascoli, LEED AP BD+C Architect, Energy Specialist Building Research Council,
Thermal Thermal Applications Category Version 6.4. Integrated Environmental Solutions
 Thermal Thermal Applications Category Version 6.4 Integrated Environmental Solutions Contents 1. What is the Thermal Applications Category?... 4 1.1. Compliance View... 4 1.2. Apache
Senior Design Project for UNO. Design of the International Studies Building: An Environmental Analysis
 Senior Design Project for UNO Design of the International Studies Building: An Environmental Analysis Design Intent Implement Passive & Active design strategies in order to make the building: More Energy
OPEN COMPETITION Energy Design of High Performance Buildings Organised by EC-JRC and ESRU
 OPEN COMPETITION Energy Design of High Performance Buildings Organised by EC-JRC and ESRU Target group: under-graduate, postdoc, PhD students and researchers level SUMMARY The objective is to assess for
COMMERCIAL LOAD ESTIMATING. Load Estimating Level 3: Block and Zone Loads. Technical Development Program
 COMMERCIAL LOAD ESTIMATING Load Estimating Level 3: Block and Zone Loads Technical Development Program Technical Development Programs (TDP) are modules of technical training on HVAC theory, system design,
Thule Prototype BIM Manual for Dormitories. February 5, 2010
 Thule Prototype BIM Manual for Dormitories February 5, 2010 TABLE OF CONTENTS INTRODUCTION Executive Summary 2 Goals 2 Scope and Use 2-4 Program Assumptions Kit of Parts GUIDELINE INTEGRATION Site Design
ECON OPPORTUNITIES, INC. 230 NORTH 5 TH STREET, Suite 300 READING, PA I hereby submit the results of my review of the new software program
 ECON OPPORTUNITIES, INC. 230 NORTH 5 TH STREET, Suite 300 READING, PA 19606 To: Whom It May concern August 31, 2010 RE: Findings Review of New HVAC Software Program Dear Mr. Vice President: I hereby submit
Session 7 Part A Revit for Urban Design
 Session 7 Part A Revit for Urban Design Class Description Revit for Urban Design will present a methodology that can enable project teams to quickly become efficient in a coordinated spatial environment
Impact of Envelope Design on Energy Consumption in Buildings
 Impact of Envelope Design on Energy Consumption in Buildings Mr. M. A. Qhuddus Khan Atif, B.E.(Mech), M.Tech Student, Department of EEE, JB Institute of Engineering & Technology (UGC Autonomous), Moinabad,
BUILDING ENVELOPE HEAT FLOW. Building Envelope
 BUILDING ENVELOPE HEAT FLOW stuff lots of stuff happens when a building meets a climate Ball State Architecture ENVIRONMENTAL SYSTEMS 1 Grondzik 1 Building Envelope A general term that describes the various
Energy Star Qualified - New Homes
 PDHonline Course G226 (6 PDH) Energy Star Qualified - New Homes Instructor: Jeffrey Havelin, PE 2012 PDH Online PDH Center 5272 Meadow Estates Drive Fairfax, VA 22030-6658 Phone & Fax: 703-988-0088 www.pdhonline.org
THERMAL MASS IMPACT ON ENERGY PERFORMANCE OF A LOW, MEDIUM, AND HEAVY MASS BUILDING IN BELGRADE
 S447 THERMAL MASS IMPACT ON ENERGY PERFORMANCE OF A LOW, MEDIUM, AND HEAVY MASS BUILDING IN BELGRADE by Bojan V. ANDJELKOVIĆ *,a, Branislav V. STOJANOVIĆ b, Mladen M. STOJILJKOVIĆ b, Jelena N. JANEVSKI
DYNAMIC PROTOTYPE BIM MANUAL FOR A FITNESS CENTER V1.0 November 21, 2011
 DYNAMIC PROTOTYPE BIM MANUAL FOR A FITNESS CENTER V1.0 November 21, 2011 Developed by: Air Force Center for Engineering and the Environment Ralph Rick Sinkfield, YD-03, DAF Project Manager Email: ralph.sinkfield@us.af.mil
Thermal Performance of Toplighting Systems in a Hot and Humid Climate: Thailand
 Thermal Performance of Toplighting Systems in a Hot and Humid Climate: Thailand S. Harntaweewongsa, L.O. Beltrán, Ph.D., Texas A&M University Keywords: Abstract: Toplighting, architecture, sustainability,
THERMAL MASS IMPACT ON ENERGY PERFORMANCE OF A LOW, MEDIUM AND HEAVY MASS BUILDING IN BELGRADE
 Andjelković, V., B.et. al.: Thermal Mass Impact on Energy Performance of A Low, Medium and Heavy S507 THERMAL MASS IMPACT ON ENERGY PERFORMANCE OF A LOW, MEDIUM AND HEAVY MASS BUILDING IN BELGRADE by Bojan
Modelling to Drive Design
 Ed May Modelling to Drive Design Honing the SU+RE House through Performance Simulations 72 Stevens Institute of Technology, Temperature and relative humidity percentage monitoring results, SU+RE House,
IES <Virtual Environment> Live e-training. Trainee notes. VE-Gaia. SI Units. Version 6.4
 IES Live e-training Trainee notes VE-Gaia SI Units Version 6.4 Introduction These training notes are to be used in conjunction with your VE-Gaia training. In this training session
Duluth Energy Future Chapter 2: Investigating Zero-Energy Potential
 2016 Duluth Energy Future Chapter 2: Investigating Zero-Energy Potential August 2016 August 2016 0 Duluth Energy Transition, Chapter 2: Investigating Zero- Energy Potential Authors: Jacob Cherry, Graduate
GUIDELINES FOR USING BUILDING INFORMATION MODELING (BIM) FOR ENVIRONMENTAL ANALYSIS OF BUILDINGS
 FOR ENVIRONMENTAL ANALYSIS OF BUILDINGS") GUIDELINES FOR USING BUILDING INFORMATION MODELING (BIM) FOR ENVIRONMENTAL ANALYSIS OF BUILDINGS By THOMAS J. REEVES A THESIS PRESENTED TO THE GRADUATE SCHOOL OF THE UNIVERSITY OF FLORIDA IN PARTIAL FULFILLMENT
GUIDELINES FOR USING BUILDING INFORMATION MODELING (BIM) FOR ENVIRONMENTAL ANALYSIS OF BUILDINGS By THOMAS J. REEVES A THESIS PRESENTED TO THE GRADUATE SCHOOL OF THE UNIVERSITY OF FLORIDA IN PARTIAL FULFILLMENT
Net Zero Construction with Sean Moran of Skender Getting to Net Zero with Solar Energy
 Net Zero Construction with Sean Moran of Skender Getting to Net Zero with Solar Energy Tim Montague, M.S. Sean Moran, LEED AP Solar Works for Illinois! Free monthly solar energy webinar brought to you
CHAPTER 1: OVERVIEW OF ENERGY EFFICIENT CONSTRUCTION
 Chapter 1: Overview of Energy Efficient Construction 1 CHAPTER 1: OVERVIEW OF ENERGY EFFICIENT CONSTRUCTION Chapter 1 is a quick reference guide that discusses the key components and features of energy
Applying Energy Code to Existing Buildings
 Applying Energy Code to Existing Buildings Massachusetts Energy Code Technical Support Program 1 Who Is Mass Save? Mass Save is an initiative sponsored by Massachusetts gas and electric utilities and energy
Energy and Sustainable Cities Conference Architecture as Pedagogy: Design and Applied NUS
 Energy and Sustainable Cities Conference Architecture as Pedagogy: Design and Applied Research @ NUS Asst. Professor HUANG Yi Chun NUS, Department of Architecture 2012 OPTIMISM 0 What is the problem? Can
Section 8 Energy and Energy Conservation
 Section 8 Energy and Energy Conservation Energy powers our way of life. It heats our homes, cooks our food, allows us to travel and drives our economy. Where available in sufficient amounts, it allows
Lead Organizations. Kerry Haglund Center for Sustainable Building Research University of Minnesota
 Efficient Windows Collaborative Design and Simulation Tools for Window System Energy Performance The Efficient Windows Collaborative is a coalition of window, door, skylight, and component manufacturers,
Practitioner Modeling Competition
 Practitioner Modeling Competition Design and Simulation of a Laboratory Building Building Simulation 2017 Briefing Document IBPSA-USA San Francisco Bay Area Chapter http://www.ibpsa.us/chapter/san-francisco
INTRODUCTION TO WUFI PASSIVE & PHIUS+ 2015
 INTRODUCTION TO WUFI PASSIVE & PHIUS+ 2015 Lisa White: lisa@passivehouse.us 2017 Passive House Institute US PHIUS 1 PASSIVE BUILDING PRINCIPLES 2016 PHIUS 2017 Passive House Institute US PHIUS 2 PHIUS+
FOR ADDITIONS and REMODELS Before filling out this application, read Green Building & Green Points Guideline Booklet for more in-depth information.
 City of Boulder Residential Building Guide Green Building & Green Application Resource Conservation Ordinance 7565 www.bouldergeenpoints.com FOR ADDITIONS and REMODELS Before filling out this application,
Complying with the Minimum Energy Efficiency Standards (MEES)
") Complying with the Minimum Energy Efficiency Standards (MEES) Advantages of using DSM software to calculate the EPC Rating Introduction The Minimum Energy Efficiency Standards (MEES) for commercially rented
Complying with the Minimum Energy Efficiency Standards (MEES) Advantages of using DSM software to calculate the EPC Rating Introduction The Minimum Energy Efficiency Standards (MEES) for commercially rented
Seminar 29. Urban Scale Building Energy Modeling, Part 5
 Seminar 29 Yixing Chen, ASHRAE Member Lawrence Berkeley National Laboratory yixingchen@lbl.gov Urban Scale Building Energy Modeling, Part 5 Retrofitting District Scale Buildings to Cut Energy Use By 50%:
Precedent Analysis arc 572 UT Solar Decathlon 2009 Morning Star Penn State I 2007
 Design Intent Affordability Transportability Constructability Adaptability Durability Sustainability 01 Home Prefab + Site-Built = MorningStar Concept: The Future of the Solar-Powered Home 01 Conceptual
A comparison between four dynamic energy modeling tools for simulation of space heating demand of buildings
 A comparison between four dynamic energy modeling tools for simulation of space heating demand of buildings Amir Vadiee * [0000-0001-9426-4792], Ambrose Dodoo [0000-0002-5220-3454] and Leif Gustavsson
Practitioner Modeling Competition
 Practitioner Modeling Competition Design and Simulation of a Laboratory Building Building Simulation 2017 Briefing Document Updated: Feb. 04, 2017 IBPSA-USA San Francisco Bay Area Chapter http://www.ibpsa.us/chapter/san-francisco
Franklin & Marshall College Row Lancaster, PA Franklin & Marshall College Row Lancaster, PA Aimee Bashore Senior Thesis 2007 Construction Management
 Elkus Manfredi Architects Outline of Presentation Topics 1. Project Overview 2. Analysis 1 Building Information Modeling (BIM) Utilization 3. Analysis 2 Composite Metal Deck v. Precast Concrete Plank Flooring
Pinoleville Pomo Nation Sustainable Home: A case study of energy modeling on sustainable design
 Pinoleville Pomo Nation Sustainable Home: A case study of energy modeling on sustainable design By Jeffrey Lee BS (Georgia Institute of Technology) 2013 A report submitted in partial satisfaction of the
CAE 331/513 Building Science Fall 2016
 CAE 331/513 Building Science Fall 2016 Week 15: December 1, 2016 Standards and guidelines for energy efficiency Advancing energy, environmental, and sustainability research within the built environment
Passive Design Solutions. Passive House The Road to Net-Zero
 Passive House The Road to Net-Zero Net-Zero into the Future Net-Zero defined as producing as much energy onsite as the building uses annually. Using net-metering with the grid, so grid is acting as 100%
BIM EXECUTION PLAN PROJECT INFORMATION PROJECT NUMBER
 PROJECT NAME BIM EXECUTION PLAN PROJECT INFORMATION CLIENT PROJECT NAME PROJECT NUMBER XX XXXXX XX XXXXX XXXXXXXXXXXXXXXXXXXXXXXXX DATE XXXXXXXX 2016 PROJECT LOCATION & ADDRESS XXXXX, XXXXX. INTRODUCTION...
National Grid USA Service Company. Impact Evaluation Of 2006 Design2000plus Custom Comprehensive Projects. Final Report
 National Grid USA Service Company Impact Evaluation Of 2006 Design2000plus Custom Comprehensive Projects Final Report July 11, 2010 Submitted to: National Grid USA Service Corporation Waltham, MA Submitted
Energy Efficiency: Designing Wood-Frame Buildings for Occupant Comfort
 Please add relevant logo here Energy Efficiency: Designing Wood-Frame Buildings for Occupant Comfort Presented by: Peter J. Arsenault, FAIA, NCARB, LEED-AP Disclaimer: This presentation was developed by
ENERGYPLUS TRAINING MODULES FOR BUILDING PHYSICS: DAYLIGHTING, INFILTRATION, INSULATION, INTERNAL GAINS, AND THERMAL MASS
 115 South Wilke Road, Suite 105, Arlington Heights, IL 60005 GARD Project No. ASE373 ENERGYPLUS TRAINING MODULES FOR BUILDING PHYSICS: DAYLIGHTING, INFILTRATION, INSULATION, INTERNAL GAINS, AND THERMAL
Multifamily Net Zero Retrofit Market: Technical and Cost Benchmarks for San Francisco
 Multifamily Net Zero Retrofit Market: Technical and Cost Benchmarks for San Francisco 1 Table of Contents Acronym Key Analysis Process Retrofit Economics Technical Analysis Details 6 Unit Building Analysis
Truing-Up to Billing Data
 Truing-Up to Billing Data The Imperative for Accurate Software Estimations Dave Beaulieu- CSG Ethan MacCormick- PSD Presenters Ethan MacCormick Dave Beaulieu Description: This session will provide concrete
WEB BASED BIM FOR MODULAR HOUSE DEVELOPMENT. Query Approach in Consumer Participatory Design
 WEB BASED BIM FOR MODULAR HOUSE DEVELOPMENT Query Approach in Consumer Participatory Design CHUEN-HUEI (JOSEPH) HUANG AND ROBERT J. KRAWCZYK Illinois Institute of Technology, College of Architecture, USA
Saurabh Gangwar 2018 Project Management Symposium
 Name UMD Project Management Symposium May 10-11, 2018 Slide 1 FROM PEOPLE MANAGEMENT TO INFORMATION MANAGEMENT Impact of technology on project management in the design and construction industry Saurabh
Public Sector New Construction Overview Calendar Year 2018
 Public Sector New Construction Overview Calendar Year 2018 Presented by: Jean Ascoli and Cassie Carroll C O N F I D E N T I A L ComEd Energy Efficiency Program Public Sector New Construction INTRODUCTION
Catalogue of Learning Targets. Certified PHPP Expert
 Catalogue of Learning Targets Certified Expert Draft - valid as of 01.December 2018 The Passive House Institute (PHI) has extended the existing training and certification system for designers and tradespeople
Pandya Paragkumar U Civil Engineering Graduate Student Lamar University
 BUILDING INFORMATION MODELING AND SUSTAINABILITY Pandya Paragkumar U Civil Engineering Graduate Student Lamar University Dr.Enno Ed Koehn, P.E., F.ASCE Professor, Civil Engineering Department Lamar University
Modeling Energy Consumption Effects of Glazing
 Modeling Energy Consumption Effects of Glazing Daniel Lu 12/7/2012 Table of Contents Introduction... 3 Design Options... 5 Option 1... 5 Option 2... 5 Preliminary Energy Simulation... 7 Objectives... 7
CAE 331/513 Building Science Fall 2017
 CAE 331/513 Building Science Fall 2017 November 14, 2017 Heating load calculations Advancing energy, environmental, and sustainability research within the built environment www.built-envi.com Twitter:
HOURLY ANALYSIS PROGRAM QUICK REFERENCE GUIDE
 HOURLY ANALYSIS PROGRAM QUICK REFERENCE GUIDE COPYRIGHT 1998-2016 CARRIER CORPORATION [This page has been left blank intentionally] HAP Quick Reference Guide Software Systems Network Carrier Corporation
Demonstration of modeling of radiant cooling system in design builder. Prashant Bhanware & Bharath Reddy
 Demonstration of modeling of radiant cooling system in design builder Prashant Bhanware & Bharath Reddy CONTENTS Introduction to Design Builder Building Energy Simulation Modeling procedure Making a model
ENERGY PERFORMANCE OF DIFFERENT TYPES OF DOUBLE SKIN FACADES IN VARIOUS CLIMATES
 ENERGY PERFORMANCE OF DIFFERENT TYPES OF DOUBLE SKIN FACADES IN VARIOUS CLIMATES Ajla Aksamija, PhD, LEED AP BD+C, CDT1 1Department of Architecture, University Of Massachusetts Amherst, Amherst, Massachusetts
Building Energy Asset Score
 Building Energy Asset Score An opportunity to participate with pioneering programs guided by the Consortium for Building Energy Innovation (CBEI) 15 th October, 2015 2 Consortium for Building Energy Innovation
Available online at ScienceDirect. Procedia Engineering 118 (2015 )
") Available online at www.sciencedirect.com ScienceDirect Procedia Engineering 118 (2015 ) 774 780 International Conference on Sustainable Design, Engineering and Construction Evaluation of performance modelling:
Available online at www.sciencedirect.com ScienceDirect Procedia Engineering 118 (2015 ) 774 780 International Conference on Sustainable Design, Engineering and Construction Evaluation of performance modelling:
Displaying the Benefits of a Zero Energy Home A Monitoring Case Study By Craig R. Clark, Alfred State College; and Dave Kostick, IMT Solar
 SOLAR 2013 Conference Abstract Submission #328: Displaying the Benefits of a Zero Energy Home A Monitoring Case Study By Craig R. Clark, Alfred State College; and Dave Kostick, IMT Solar Alfred State College
Chapter 4. Analysis of Building Energy Performance
 Chapter 4 Analysis of Building Energy Performance 128 4.1 Introduction This chapter deals with energy modeling and simulation of the baseline models for the buildings to assess energy performance of the
A Comparative Study of the Thermal Comfort of Different Building Materials in Sana a
 American Journal of Engineering and Applied Sciences, 6 (1): 20-24, 2013 ISSN: 1941-7020 2014 Alhaddad and Jun, This open access article is distributed under a Creative Commons Attribution (CC-BY) 3.0
An Evaluation of the Total Energy Consumption of Educational Buildings: Prototype Case Studies in Saudi Arabia
 An Evaluation of the Total Energy Consumption of Educational Buildings: Prototype Case Studies in Saudi Arabia H. Altan 1,* and H.F. Alshareef 1 1 Building Environments Analysis Unit (BEAU), School of
Using EnergyPlus for Compliance
 EnergyPlus Version 8.5 Documentation Using EnergyPlus for Compliance U.S. Department of Energy March 31, 2016 COPYRIGHT (c) 1996-2016 THE BOARD OF TRUSTEES OF THE UNIVERSITY OF ILLI- NOIS AND THE REGENTS
Proceedings of the 2011 Winter Simulation Conference S. Jain, R.R. Creasey, J. Himmelspach, K.P. White, and M. Fu, eds.
 Proceedings of the 211 Winter Simulation Conference S. Jain, R.R. Creasey, J. Himmelspach, K.P. White, and M. Fu, eds. ANALYSIS OF THE DIFFERENCES IN ENERGY SIMULATION RESULTS BETWEEN BUILDING INFORMATION
COMPARISON OF ENERGY USE INDICATORS OF A NON-RESIDENTIAL PASSIVE HOUSE WITH ASHRAE 90.1 BUDGET BUILDING
 COMPARISON OF ENERGY USE INDICATORS OF A NON-RESIDENTIAL PASSIVE HOUSE WITH ASHRAE 90.1 BUDGET BUILDING ABSTRACT F. Bagheri 1, M. Fakoor 1, B. Young 1, C. Cranswick 1 1 BC Building Science Ltd. 611 Bent
Meeting AB 32 Cost-Effective Green House Gas Reductions in the Residential Sector
 Meeting AB 32 Cost-Effective Green House Gas Reductions in the Residential Sector Prepared for: California Homebuilding Foundation Date published: August, 2008 Abstract: In September of 2006, California
Heating, Cooling, Lighting: Sustainable Design Methods for Architects
 Heating, Cooling, Lighting: Sustainable Design Methods for Architects Lechner, Norbert ISBN-13: 9780470048092 Table of Contents Foreword to the First Edition. Foreword to the Third Edition. Preface. Acknowledgments.
Least Cost Path to Achieving 50% Reduction in Residential Energy Use (in Heating Climates)
") Least Cost Path to Achieving 50% Reduction in Residential Energy Use (in Heating Climates) Jan Harris, X Prize Foundation Michael Blasnik, Blasnik and Associates ABSTRACT This paper describes the findings
Least Cost Path to Achieving 50% Reduction in Residential Energy Use (in Heating Climates) Jan Harris, X Prize Foundation Michael Blasnik, Blasnik and Associates ABSTRACT This paper describes the findings
Chapter Four: Green Remodeling Illustrations
 Chapter Four: Green Remodeling Illustrations We believe that homeowners deserve a home that is not only beautiful, but one that is more energy-efficient, comfortable and healthier for the family. Fred
BIM-based Sustainability Analysis: An Evaluation of Building Performance Analysis Software
 BIM-based Sustainability Analysis: An Evaluation of Building Performance Analysis Software Salman Azhar and Justin Brown Auburn University Auburn, Alabama Rizwan Farooqui Florida International University
GA2016 XIX Generative Art Conference
 THE INTRODUCTION OF BIM METHODOLOGY IN EDUCATION (Paper) Topic: Architecture, Advanced Teaching Author(s): Alcinia Zita Sampaio Portugal, University of Lisbon, Department of Civil Engineering and Architecture
KAROLINA KOWAL. Warsaw University of Technology Student. Warsaw University of Technology Student
 Project of HVAC systems for the meteorological station DAGMARA ĆWIEK Technology Student, dagmaracwiek@gmail.com TOMASZ KOLSICKI Technology Student KAROLINA KOWAL Technology Student BARTŁOMIEJ TOKARZEWSKI
University of Minnesota Duluth Civil Engineering Building
 Energy Data Attachment University of Minnesota Duluth Civil Engineering Building LEED Energy Modeling The energy modeling for LEED NC 2.2 was performed against ASHRAE 9.1-24 Appendix using equest version
Monitoring of Advanced Facades and Environmental Systems
 Paper presented at The whole-life performance of facades University of Bath, CWCT, 18/19 April 2001, Bath, UK Monitoring of Advanced Facades and Environmental Systems Mikkel Kragh, PhD Permasteelisa Architectural
The Effects of Set-Points and Dead-Bands of the HVAC System on the Energy Consumption and Occupant Thermal Comfort
 The Effects of Set-Points and Dead-Bands of the HVAC System on the Energy Consumption and Occupant Thermal Comfort Ongun Berk Kazanci, Bjarne W. Olesen 1 1 International Center for Indoor Environment and
Be Aggressive About the Passive Solutions
 Be Aggressive About the Passive Solutions Integrating Building Envelope Design in Whole Building Energy Goals Daniel Luddy, PE BEMP CPHC LEEP AP Senior Energy Engineer 2015 Building Envelope Forum AIA