INVENTORY OF YOUNG GROWTH TIMBER TONGASS NATIONAL FOREST IN SOUTHEAST ALASKA
|
|
|
- Brent Harmon
- 5 years ago
- Views:
Transcription

1 INVENTORY OF YOUNG GROWTH TIMBER TONGASS NATIONAL FOREST IN SOUTHEAST ALASKA PREPARED FOR: SOUTHEAST CONFERENCE January, 2011 Forest Consultants/Industrial Appraisers P.O. Box 423 Wilsonville, Oregon
2 COVER PHOTO Logs harvested from Unit 4 of the inventory layout prior to field work. The timber stand has a year of origin on 1945, age 66, non thinned, and an average diameter at breast height (DBH) of ±14.2 inches with an estimated net volume per acre of ± 40 MBF based upon nearby inventoried stands. Photo: Owen Graham, Alaska Forest Association. is a diversified organization combining traditional forestry services with a wide variety of industrial appraisal capabilities. Incorporated in 1977, Cascade Appraisal as a company has provided services to clients over the past 34 years. Clients include numerous major forest products companies, law firms, public agencies, accountants, private landowners, and investors. The company principal, Ray E. Granvall Jr., has 42 years of forest products experience both in timber and timber land projects and industrial forest product plants nationwide and an additional 7 years in logging operations. has its own computer network, library, mapping, photogrammetric, and drafting facilities.
3 EXECUTIVE SUMMARY This project was designed to prepare a report that would help substantiate the inventory of young growth timber and conditions necessary for reconstituting a viable timber industry in SE Alaska. The final work product is a report correlating data from different parties with the results of a field inventory. Inventory plot locations were mapped in Geographic Information System (GIS) format with latitude and longitude coordinates calculated for each individual plot in the North America Data 1983 coordinate system. The inventory design prescribed for the project in its entirety can be applied to specific areas such as Prince of Wales Island or a single drainage within that area. The data collected for this study is considered to be accurate in the initial review for the purposes it was intended. The standard error at a 95% confidence level (2 Standard Deviations T2) is 3.7% for the entire inventory. The data was used to develop volume estimates in varying age classes over 40 years in age. Inventory plots were placed in timber equal too or greater than 40 years of age. Approximately 98% of this category is found in timber years of age. Timber over 40 years old is significant in that its contribution to industry annual harvest would be targeted first. These stands are thinned but lightly stocked with a basal area of less than 92 square feet. The average diameter is 12.2 DBH and the merchantable bole length is 32 feet. Stands in the year old age classes show an average net volume per acre of less the 6 MBF in the lower ages increasing with age to 9.5 MBF per acre for the older ages. Average site index for Sitka spruce is calculated at ± 93 (92.9) and for western hemlock ± 87 (86.8) on the FARR 50 year site indices. Final inventory volume extensions have been compared to estimated volumes projected by the Tongass National Forest (TNF). Selected TNF inventory areas or polygons were taken from the GIS mapping and the volume extensions used the respective acreage for each polygon. The final volume predictions from this study are 37.5% below those same figures for the national forest comparative estimates on an age class weighted basis. The volumes reported and discussed herein represent full utilization of a given stand. If the entire stand volume is not harvested, a proportionate reduction in volume is necessary. Harvesting timber prematurely as seen in the cover photo destroys the future potential and removes that acreage from the next rotation. The young growth resource at this age is not ready and will not be available in sufficient volume for several decades (35 40 years) into the future. 1
4 CONTENT EXECUTIVE SUMMARY... 1 GENERAL DATA... 3 Tongass National Forest Data... 3 Sample Area... 5 INVENTORY DATA... 9 Timber to be Inventoried... 9 Mapping and Plot Selection... 9 Inventory Extension Re Aggregation of Units Elevation Aspect Site SUMMARY ADDENDUM Unit 5 Inventory Extension Species, Sort, Grade BF Volumes Unit 5 Inventory Statistics LIST OF TABLES... 2 TABLE 1 Harvest Units Selected for Inventory TABLE 2 Inventory Results Compared to TNF Volume Projections TABLE 3 Example of GPS Coordinates in NAD TABLE 4 Unit Summary Date w/re Aggregated Analysis LIST OF GRAPHS, MAPS & PHOTOS... 2 GRAPH 1 Young Growth Acreage by Harvest Period... 4 MAP 1 Plot Selection 5 Units Red Alder Type MAP 2 Plot Selection 6 Unit Foot Elevation GRAPH 2 Western Hemlock Site Index Curves Compared GRAPH 3 FARR 50 year Site Index Curves GRAPH 4 Sitka Spruce Site Index 2010 Inventory GRAPH 5 Western Hemlock Site Index 2010 Inventory PHOTO 1 Harvested Unit 4...Front cover PHOTO 2 Plot Selection 1 Unit 2 and
5 GENERAL DATA TONGASS NATIONAL FOREST DATA USFS timber stand information is quite limited, especially from a GIS perspective, in that it is applied to broad areas on the TNF. GIS layers for Value Comparison Units (VCU), existing vegetation maps and timber stand for the entire TNF are available. The timber type maps for the TNF made available as part of 2008 Tongass Land and Resource Management Plan Amendment (TLMP) are one source that can be utilized in the location of young growth areas. The basic assumptions utilized within the TLMP are not in sufficient detail to provide any degree of confidence in the determination of alternatives. Broad volumes per acre are applied to GIS mapped stands or polygons to develop an estimate of timber volume per acre and gross volume per stand. Many attributes assigned to each mapped stand are derived from prior studies and historic harvesting records. The GIS mapping of the specific stands is created from aerial photography, both color and black/white, and orthorectified aerial photos, orthophotos. The per acre volume estimates are generally not field verified. The historic harvest record is also the basis for the decadal ages of young growth. A graphic presentation of the historic harvest record by age class is seen in Graph 1, page 4. This graph is based upon the TLMP mapping. The majority of the young timber, 254,823 acres out of the 351,000 base acres (See Graph 1, page 4) or ±75.6 % is less than 40 years of age. The SPECTRUM program used for analysis performed as part of TLMP shows (164) VCU areas containing ± 193,055 acres of positive value young growth. There are (51) VCU s lying north of Frederick Sound that the SPECTRUM program lists as positive with 24,507 acres of young growth timber. These lands are not economically viable under current industry standards and would be eliminated from further consideration. The balance of positive indicated acreage would then contain (103) VCU areas with an acreage estimate of positive young growth of ± 168,548 acres. The prior USFS inventory work included (33) of the positive VCU areas with 53,581 acres and an additional (3) non positive VCU s. 3
6 ACRES No n- 0/10 Stock TONGASS NATIONAL FORES YOUNG GROWTH ACRES BY HARVEST PERIOD SOURCE: SPECTRUM ANALYSIS 2008 TLMP GRAPH Merchantable Acres = 1,989 Reproduction Acre = 344,782 Non-stocked Acres = 4, TOTAL ACRES = 351, /20 21/ /40 41 /5 0 51/6 0 61/ 70 71/80 81/9 0 91/ / / YEAR INCREMENT 4
7 SAMPLE AREA This inventory was designed to sample a subset of the remaining (70) positive VCU s lying south of Frederick Sound. These areas contain an estimated 115,000 acres. These areas comprise the young growth timber area present on the TNF that are commercially available to industry. The inventory of young growth units commenced with a mapping of all young growth units provided by Mr. Eric Henderson the U. S. Forest Service Land Management Planner, Hiawatha National Forest Region 9 located in Michigan. Eric is the analyst for the TNF in regards to the SPECTRUM program. Criteria quantifying the volume found on each individual unit (polygon) were set forth in an accompanying document presented on pages 6 and 7 along with a set of descriptive points. Work undertaken in 2009 to modify the 2008 TLMP listing of stands created a comparison discrepancy between the sets of data. As such, communication with Mr. Henderson to alleviate the apparent differences resulted in a set of maps and areas considered to be suitable for the inventory selection process. One of the major variances was the inclusion versus exclusion of old growth reserve areas, scenic view sheds, experimental forest areas, and other non suitable areas. It was concluded that all young growth stands should be included as a starting point since the inventory was intended to determine the volume characteristics of the various stands. Mr. Henderson provided a GIS format map showing all of the known young growth stands in the TNF totaling some 862,091 acres. This map includes not only TNF acreage but all private and other non TNF acreage. TNF volumes per acre are presently estimated by entering the volume table shown on accompanying, page 6, and selecting the Productivity Group (Prod) and Volume code for each polygon. As an example, a stand that is a Thinned, 5 th decadal or years old stand (T5) located in the fastest growing or Prod1 polygon would have an estimated volume of 11,452 BF per acre. Each polygon stand with age and productivity calls has a volume estimate developed in this manner. So all TNF stands that have a similar T5 Prod1 attribute will have the same projected volume per acre. These are the volume estimates that this inventory compares to determine the accuracy of the projected TNF volumes by stand. There are approximately 5,716 units with volumes of second growth timber older than 40 years. This listing comes from the most recent USFS data provided by Eric Henderson. 5
8 Notes on quantifying standing young growth volume on Tongass National Forest Prepared by Eric Henderson, Analyst October 20, 2010 Key Attributes in the Young Growth File: PROD_GRP: Productivity Group. 1 = fastest growing 3= slowest YEAR_ORIGI: Year of Origin; used to determine age of the stand and volume YG: 2-digit code used by Spectrum model. Y stands have not been precommercially thinned. T stands have been thinned. The number corresponds with which decade of growth they are in; so for example a T5 stand will have been thinned and in its 5 th decade of growth (40-50 years old). VolumePerAcre: Per-acre board-foot volume of the stand Acres: Acre value of the polygon VolumePerPoly: Board-foot calculation for the polygon Volume Estimates (based on FVS output runs). MBF/acre Volume Code Prod1 BF/Acre Prod 2 BF/Acre Prod 3 BF/Acre Y1 Y2 Y T Y T Y T Y T Y Y Yellow cells represent values that were not explicitly calculated, but were implied 6
9 Analysis Process: Intersected SD7 and Prod Class layers (.1 Meter Cluster tolerance) Exported YG-only, based on code in the SD7 fields Unioned with Thinned layer (.1 m Cluster tolerance) Deleted slivers less than.1 acres (about 1700 polygons) VegCode is S1, Volume is Y2 (20-year old never been thinned stand) VegCode is S2, Volume is Y4 (40-year old never been thinned) VegCode is S3, Volume is Y8 (80-year old never been thinned) Without thin = Y1, with thin = T1, although T1 should not occur = Y = Y3 without thin, and T3 with thin = Y4 without thin, T4 with = Y5 without thin, T5 with = Y6 without thin, T6 with = Y7 without thin, T7 with (no T7 exists) < 1940 = Y8 There were a few polys that had a vegetation code of HS1 with no Year of Origin. These were assigned a value of Y2, based on most other HS1 polygons were coded Y in the YEAR_ORIGI column is, as you may have guessed, a bogus number and I don't know where it came from. It appears to show up in stands of "natural origin" (such as a blowdown), or no data. The relevant column to determine volume is "VEG_CODE", which has size information. YEAR_ORIGI combined with VEG_CODE is used to calculate the size class call in "SPEC_CODE". SPEC_CODE is consistent with how we modeled for the forest plan, and is as accurate as we can get at this time. 2. Volumes only appear for 1969 and earlier because volumes were not calculated for high site stands younger than 50. This was OK for forest planning since the first entry for commercial thinning was about years old with the first clearcut option at around on our best sites. 3. The latest YEAR_ORIGI in the data is 2006, so activities that have taken place since then are not reflected in this data. However, since activities probably did not occur in the young growth and sites regenerated since 2006 will not have any commercially viable volume, it should not affect your calculations. 4. Your 5.5 MBF/acre is, as calculated, accurate. It is so low because you are averaging young sites (less than 50) with 0 volume in with everything else. That is one way to portray the data. Another way is to calculate average volume per acre on sites with positive numbers, which is
10 MBF/acre (646,500 MBF on 36,500 acres). Again, though, this averages the very poor sites with the very best sites. Higher sites over 50 is 23.1 MBF/acre (622,500 MBF on 26,900 acres). If you want to get an estimate of volume on sites younger than 50 (whether it is commercial or not), let me know and I can maybe do some "backwards extrapolation" to fill in the gaps. Otherwise, I thought you wanted to focus on inventorying VCUs with the highest chance of harvest in the near future - which would be those that have significant acres of older stuff (?) SOURCE: Explanatory notes from Eric Henderson A great number of the units are not identified as to the year of origin. All though there is volume associated with the unidentified areas, selections on those units with an identified date of origin was not made. Only 1,899 of the units show a year of origin between 1750 and These units total 13,319.5 acres with an estimated MBF per acre. 8
11 INVENTORY DATA TIMBER TO BE INVENTORIED 1) Species inventoried included Sitka spruce, western redcedar, hemlock, Alaska yellow cedar, red alder and lodgepole pine. 2) One inch diameter breast high (DBH) classes 8 DBH (7.6 to 8.5 = 8 DBH class) were inventoried with a fixed Prism Factor sweep at DBH. Height in 32 foot (32'8") logs. Trees less than 24 DBH Merchantable height to a 6 top. Trees greater than or equal to 25 DBH Merchantable height to 50% diameter outside bark (DOB) at 16 feet, (±40% DBH). The sample points consist of variable sub plots on a ratio of one measure plot for each nine count plots for each stand selected. Sub plots are variable in size utilizing an appropriate basal area factor (BAF) prism that selected ± 5 6 trees per plot. Depending upon stand and resulting volume variability, some sub plots were combined and re calculated to give a higher degree of accuracy to better fit the specific units. Sub plots comprising each of the cruise plots were placed in a fixed grid pattern of 2 chains (132 feet) by 5 chains (330 feet) as seen in the example (See Addendum Sample Units 2 and 3, page 18). This resulted in ± 1 subplot per acre overall. MAPPING AND PLOT SELECTION GIS mapping of (28) candidate units totaling an estimated 2, acres containing 2,713 plots in these units (See Table 1, page 10) was developed. These units became the base for selection of those that were inventoried. In total, (16) of the units were selected and inventoried with an acreage estimate of 1, acres. The selected units are highlighted in yellow on Table 1. The field work done in early November, 2010 placed 1,408 plots within the selected units, essentially one plot per acre (See Table 4, Addendum page 29). One unit (Unit 4) had been harvested prior to our field work (PHOTO Front Cover). 9
12 TONGASS NATIONAL FOREST 2010 SECOND GROWTH VOLUME INVENTORY TABLE 1 HARVEST UNITS SELECTED FOR SAMPLING UNIT NO. USFS OBJECT ID THINNED PROD_ VEG_ GRP CODE ASPECT YEAR OF ORIGIN YG_Type Decade YG Volume Per ACRE (USFS Est.) Volume Per POLYGON (USFS Est.) ACRES HS3 WEST 1950 Y 6 Y6 18,092 1,629, HS3 WEST 1945 Y 7 Y7 29,003 1,399, HS3 WEST 1945 Y 7 Y7 29, , HS3 WEST 1945 Y 7 Y7 29,003 2,948, HS2 WEST 1969 T 5 T5 11,452 2,425, HS2 NORTH 1969 T 5 T5 11,452 1,620, HS2 EAST 1969 T 5 T5 11,452 1,262, HS2 WEST 1961 T 5 T5 11,452 1,715, HS2 WEST 1969 T 5 T5 11,452 2,406, HS2 WEST 1969 T 5 T5 11, , HS2 WEST 1968 T 5 T5 11, , HS2 WEST 1969 T 5 T5 11,452 1,916, HS2 SOUTH 1960 T 5 T5 11, , HS2 WEST 1960 T 5 T5 11, , HS2 WEST 1962 T 5 T5 11, , HS2 WEST 1961 T 5 T5 11, , HS2 SOUTH 1959 Y 6 Y6 18,092 2,691, HS2 WEST 1959 T 6 T6 24,845 5,394, HS3 EAST 1924 Y 8 Y8 40,304 2,216, HS3 NORTH 1924 Y 8 Y8 15,368 2,148, HS3 SOUTH 1927 Y 8 Y8 40, , HS3 SOUTH 1927 Y 8 Y8 40, , HS3 SOUTH 1922 Y 8 Y8 1,851 18, HS3 SOUTH 1922 Y 8 Y8 40,304 3,742, HS3 SOUTH 1919 Y 8 Y8 1,851 7, HS3 SOUTH 1919 Y 8 Y8 40,304 2,016, HS3 SOUTH 1935 Y 8 Y8 40,304 12,488, HS3 SOUTH 1935 Y 8 Y8 15,368 96, (13) Listed as thinned with (15) unthinned ,205, MBF per ACRE YELLOW HIGHLIGHTED UNITS WERE INVENTORIED ,232, MBF per ACRE 10
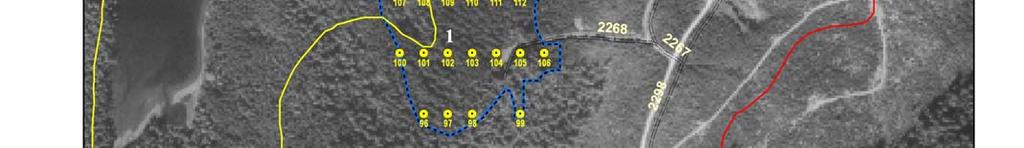
13 Plots were placed in units found on Betton Island, the Cleveland Peninsula, Hump Island, Prince of Wales Island, and Revillagigedo Island. Each selected unit was mapped with a black and white orthophoto background as illustrated for Units 2 and 3 of the inventory (See Addendum, page 25). Part of the GIS mapping process included determining the latitude and longitude for each uniquely numbered plot and presenting them in the North America Datum 1983 (NAD 83) coordinate system that is compatible with handheld Geographic Positioning System (GPS) units. An example of the GPS coordinates for those plots assigned to Units 2 and 3 are shown in the Addendum at page 26. Units selected for inventory included timber harvested as early as 1919 that is now over 90 years old. Units selected included thinned and un thinned timber, changes in elevation from sea level to above 1,000, various aspect orientation, and varying age classes. Other units such as 19, 20 and were selected because of their year of origin placing them in some of the older age classes. INVENTORY EXTENSION The individual plot cards were entered into an extension program to calculate the volume estimate per unit. An example of the calculation printout for Unit 5 is shown in the Addendum at pages 27 and 28. These (2) pages show the type of information created from the field data in regards to tree size, log sizes, basal area, standard error, etc. The extension of the inventory data was done on a unit by unit basis (See Table 4 Addendum, pages 29 31). The results were reviewed and in some instance a re aggregation of the data was done to develop better information. RE AGGREGATION OF UNITS Units 2 and 3 were combined to better reflect volume found on both units. Since Unit 3 was small in overall size (14.69 acres) certain tree species did not appear in the initial volume extension. Units 5, 6 and 7 were also combined to develop a broader sample of this timber 42 year old age class. As indicated in the discussion at pages 3 5, it is this age class that represents the largest acreage component that has the earliest potential to become available for harvest in future decades. 11

14 Units were combined into (2) units by taking Unit 23 and 24 as a separate re aggregation along with Unit 25 and 26 also is combined into a single unit. This was done to adjust for MAP 1 the presence of large areas of Pacific red alder that have little industry value. This can be seen in the accompanying diagram to the right. The pale yellow areas are predominantly very poor quality Pacific red alder stands with some Sitka spruce and western hemlock trees growing up through the canopy. The situation precludes the harvest of the conifer species in these units that are found within the delineated hardwood stands. The result is a reduction in the overall area available for second growth harvest. These particular units are in the Helm Bay area on the north shore of the bay. The stands are some of the older ones inventoried. The Unit 23 and 24 timber was harvested in The Unit 25 and 26 timber was originally cut in ELEVATION Unit 27 is located in Traitors Cove north of Ketchikan on Revillagigedo Island. The unit was harvested in 1935 and is a rather large unit of acres, excluding the slide area to the center east of the unit that has 6.26 acres. The unit was harvested from the cove with full utilization in the lower 12
15 !.!.!.!.!.!.!.!.!.!.!.!.!.!.!.!.!.!.!.!.!.!.!.!.!.!.!.!.!.!.!.!.!.!.!.!.!.!.!.!.!.!.!.!.!.!.!.!.!.!.!.!.!.!.!.!.!.!.!.!.!.!.!.!.!.!.!.!.!.!.!.!.!.!.!.!.!.!.!.!.!.!.!.!.!.!.!.!.!.!.!.!.!.!.!.!.!.!.!.!.!.!.!.!.!.!.!.!.!.!.!.!.!.!.!.!.!.!.!.!.!.!.!.!.!.!.!.!.!.!.!.!.!.!.!.!.!.!.!.!.!.!.!.!.!.!.!.!.!.!.!.!.!.!.!.!.!.!.!.!.!.!.!.!.!.!.!.!.!.!.!.!.!.!.!.!.!.!.!.!.!.!.!.!.!.!.!.!.!.!.!.!.!.!.!.!.!.!.!.!.!.!.!.!.!.!.!.!.!.!.!.!.!.!.!.!.!.!.!.!.!.!.!.!.!.!.!.!.!.!.!.!.!.!.!.!.!.!.!.!.!.!.!.!.!.!.!.!.!.!.!.!.!.!.!.!.!.!.!.!.!.!.!.!.!.!.!.!.!.!.!.!.!.!.!.!.!.!.!.!.!.!.!.!.!.!.!.!.!.!.!.!.!.!.!.!.!.!.!.!.!.!.!.!.!.!.!.!.!.!.!.!.!.!.!.!.!.!.!.!. portion of the unit below 500 elevation. Above the 500 elevation line the unit was partially cut with a series of vertical stringers or strips left with mature timber. MAP 2 500' TRAITORS COVE UNIT ' ELEVATION BREAK TRAITORS COVE µ ,050 1,400 Feet Plots taken above the 500 elevation were determined by GIS mapping of that specific elevation as seen here on the simplistic map to the left. The shape of the unit created (2) separate sub types above the 500 mark. The plots for each of these sub types were extended to derive the volume for that individual type. Additionally, the portion of the original unit was re calculated to reflect those plots left under 500. The volumes were compared along with other characteristics including species composition. That timber found above 500 is ±7% less in volume per acre and contains a 7% higher western hemlock component. The original harvesting of this unit, as discussed on the preceding page, creates a bias to the higher elevation because of strips of mature timber. Additional work would be required to confirm the variance. ASPECT Younger second growth found at the head of Staney Creek and harvested in 1969 was inventoried in Units 5, 6 and 7. As an example, Units 5, 6 & 7 were selected because they were all cut in the same year, they adjoin each other, have the same elevation, all have been thinned, but each has a different aspect. This keeps the majority of the variables constant with only the aspect changing and should provide a good indicator for that particular feature. Unit 5 has a west exposure and an inventoried gross volume of 6,701 BF/acre. Unit 6 exhibits a northern exposure and has an inventoried gross volume of 6,717 BF/acre. Unit 7 has an easterly aspect with an inventoried gross volume of 4,457 BF/acre. The easterly exposure has only ± 66% of the volume found on the northern and western slopes. The final calculation of volumes for the inventoried units was then directly compared to those projected by the TNF. Table 2, page 21, in the summary section provides the analysis of that comparison. 13
16 SITE Forestlands are typically classified by their relative productivity or site quality. The site index system has been developed as a practical, indirect method of estimating this timber growing potential. For a given species, site index is defined as the total height in feet of trees that have consistently been in a dominant or co dominant position in well stocked stands at a specified index age. Commonly used site indicators are at ages of 50 or 100 years. Using the site index, forest sites are typically classified into five site classes (I, II, III, IV, and V) with I being the most productive and V the least productive. In general terms, site class I is the best, site class II is good, site class III is average, and site class IV or below is poor. Under some analyses, this site class system is further broken down so that finer distinctions may be made. One index was developed by Walter H. Meyer (USDA Technical Bulletin 544) in 1937 (MEYER) and is based upon the total height in feet of Sitka spruce and western hemlock trees at a total age of 100 years. MEYER plots totaled 658 with 294 in Oregon Washington, 64 in British Columbia, and 300 in Alaska. The plot analysis concluded an average 100 year site index of 159 for Oregon and Washington, 127 for British Columbia, and 106 for the Alaska plots, decreasing with increase in latitude. A second study by George H. Barnes (USDA Technical Bulletin 1273) in 1962 (BARNES) is also based upon total age at 100 years for western hemlock. The BARNES study was an attempt to correct discrepancies found in the MEYER study. BARNES used a total of 549 plots located in Oregon Washington, British Columbia and Alaska. Oregon Washington provided 252 plots, British Columbia 71 plots and Alaska 226 plots. BARNES concluded from his work that Alaska was predominately site class IV with 96% of the plots in classes IV VI. Both the MEYER and the BARNES indices were used generally for old growth timber. Young growth indices are most often based upon a breast height age (BH) at 50 years. The study by Wilbur A. Farr (USDA PNW 326) completed in 1984 (FARR) was entirely done in southeast Alaska with 31 plots taken in and 60 plots in All plots were located at elevations below 500 feet and most were adjacent to the shoreline. The plots were at a BH age of 110 to 180. The 1977 plots were mostly in stands 45 to 60 years old at BH. Several of the 91 plots were later eliminated because they did not have suitable hemlock and spruce trees. Suitable hemlock site trees were found on 57 of the plots and spruce on 71 of the plots. The Kenneth N. Wiley study Site index tables for western hemlock in the Pacific Northwest (Weyerhaeuser Forestry Paper No. 17) in 1978 (WILEY) reported the results found on 109 sample plots in Washington, Oregon, and British Columbia. Site index samples consisted of the 10 trees of the largest DBH from a 14
17 group of 50 (all being hemlock). He based site index on BH age and total height at an index age of 50 years. The site index studies done by FARR and that of WILEY for young growth western hemlock and Sitka spruce are all presented on a 50 year basis. Both indices are widely accepted by the industry and the one by FARR is used in Alaska by the USFS. Graph 2, page 16, presents a visual representation of the site index curves for each of the 4 studies for western hemlock. The graph depicts total height in feet as it relates to site and age. NOTE that the site index curves on a 50 year basis are for site index 100 and on a 100 year basis for site index 140. This is necessary to compare indices that have different age basis. The 100 year indices are to a total age where the 50 year is to a BH. BARNES in his work added 7 years to the BH age for trees in Oregon and Washington; in British Columbia and Alaska, 8 years were added. The independent studies are very close in form and value even though they are from diverse areas. The BARNES study is the only one that compiles all of the data into a single table and then breaks Alaska out on a separate table. The apparent variance seen for the Alaska only curve may be a function of the site index selected for BARNES. It is interesting to note the all of these prior studies rely upon on much fewer sample plots than the 2010 inventory conducted on the Tongass. In much of the prior work (MEYER, BARNES & others) the sample trees were felled and bucked. The FARR study fell trees on 1/5 acre plots and bucked them into sections at stump height, at breast height, at 10 feet, and succeeding 10 intervals up the tree. The FARR study was selected for further review because of the close relationship to the WILEY study at the same index age and the fact that the USFS work generally uses FARR. Graph 3, page 17, compares the work accomplished by FARR for both western hemlock and Sitka spruce independently. The data graphed is based upon the formulae presented in the FARR study for each species. We have compared the two species for site index 80, site index 85, and site index 90. There is virtually no variance between the species up to BH age of 100 when hemlock starts to gain a height advantage. This indicates that the species can be viewed on a combined basis when examining the 2010 inventory data. 15
18 WESTERN HEMLOCK Site Index Curves FARR & WILEY 50 Year Base Index - Site 100 BARNES & MEYER 100 Year Base Index - Site 140 GRAPH Index Age Barnes ALL Wiley Total Height (Feet) Farr Meyer Barnes Alaska Site III to III Breast Height Age (Years) Barnes, George H. Yield of EVEN-AGED STANDS OF WESTERN HEMLOCK. Technical Bulletin No U. S. Department of Agriculture - Forest Srvice. Portland, Oregon September, p. Farr, Wilbur A. Site index and height growth curves for unmanaged even-aged stands of western hemlock and Sitka Spruce in southeast Alaska. Re. Pap. PNW-326. Portland, OR: U.S. Department of Agriculture, Forest Service, PNW Research Station: p Meyer, Walter H. YIELD OF EVEN-AGED STANDS OF STIKA SPRUCE AND WESTERN HEMLOCK. Technical Bulletin No United States department of Agriculture, Washington, D. C. March, p Wiley, Kenneth N Site Index curves for western hemlock in the Pacific Northwest. Weyerhaeuser Forestry Paper No. 17. Centralia, WA: Weyerhaeuser Forestry Research Center. Graph and tables actually generated using the published formulae. 16
19 50 Year Base Site Index Curves WESTERN HEMLOCK and SITKA SPRUCE FARR Site 80 - Site 90 - Site 100 GRAPH Index Age 50 SITE 100 SITE SITE Total Height (Feet) Site III- to IV HEMLOCK Site 100 SPRUCE Site 100 HEMLOCK Site 90 SPRUCE Site 90 HEMLOCK Site 80 SPRUCE Site Breast Height Age (Years) Farr, Wilbur A. Site index and height growth curves for unmanaged even-aged stands of western hemlock and Sitka Spruce in southeast Alaska. Re. Pap. PNW-326. Portland, OR: U.S. Department of Agriculture, Forest Service, PNW Research Station: p. Graph and tables actually generated using the published formulae. 17
20 Total height was measured on (143) Sitka spruce trees and (164) western hemlock trees. A total of (20) trees from each species were rejected as either being a residual tree from the initial harvest or a suppressed tree not exhibiting dominant and/or co dominant features. To develop an indication of site index, the individual trees were entered into the FARR formulae according to species. SITKA SPRUCE X 5 = *LN(AA6) *(LN(AA6))^ *(LN(AA6))^ E 23*(LN(AA6))^30 X 6 = *LN(AA6) *(LN(AA6))^ *(LN(AA6))^ *(LN(AA6))^ E 27*(LN(AA6))^36 HT = 4.5+EXP(AC6) EXP(AD6)*86.43+EXP(AD6)*(SiteIndex 4.5) WESTERN HEMLOCK X 2 = *LN(AA6) *(LN(AA6))^ *(LN(AA6))^ E 16*(LN(AA6))^ E 22*(LN(AA6))^30 X 3 = *LN(AA6) *(LN(AA6))^ *(LN(AA6))^ *(LN(AA6))^ E 20*(LN(AA6))^ E 26*(LN(AA6))^36 HT = 4.5+EXP(AC6) EXP(AD6)*83.2+EXP(AD6)*(SiteIndex 4.5) A program was developed in Microsoft Excel format as an aid in calculating the site index. The BH age of a single tree or a series of trees is entered along with the respective total height(s) and the site index is calculated. The given site index or an average of site tree indices can be entered into the graph portion of the program and the corresponding FARR site index curve is plotted listing BH age and height from 5 year old to 104 year old a 100 year span. The average site index for Sitka spruce was calculated at 92.9 or 93. The site index for western hemlock averaged 86.8 or 87. The FARR site index curve for Sitka spruce is shown on Graph 4, page 19. The western hemlock site index curve is shown on Graph 5, page
21 Site Index 92.9 Site Index and Height Growth Curves For SITKA SPRUCE In Southeast Alaska FARR - Unmanaged Even-Aged (Fifty Year Base Index) GRAPH Source: BH Age Height BH Age Height BH Age Height BH Age Height Farr, Wilbur A. Site index and height growth curves for unmanaged even-aged stands of western hemlock and Sitka Spruce in southeast Alaska. Re. Pap. PNW-326. Portland, OR: U.S. Department of Agriculture, Forest Service, PNW Research Station: p. 19
22 Site Index 86.8 Site Index and Height Growth Curves For WESTERN HEMLOCK In Southeast Alaska FARR - Unmanaged Even-Aged (Fifty Year Base Index) GRAPH BH Age Height BH Age Height BH Age Height BH Age Height Source: Farr, Wilbur A. Site index and height growth curves for unmanaged even-aged stands of western hemlock. and Sitka Spruce in southeast Alaska. Re. Pap. PNW-326. Portland, OR: U.S. Department of Agriculture, Forest Service, PNW Research Station: p 20
23 SUMMARY The overall volume is ± 10% below the TNF estimate in the combined aggregate using the direct extension volumes by unit. There is a ± 14% total volume reduction in TNF volume when re aggregated results are viewed. The initial field work extension shows no consistent correlation in one direction for all units. The direction of movement, up and/or down, in comparison to the base TNF projected volume varies by age class. TONGASS NATIONAL FOREST 2010 SECOND GROWTH VOLUME INVENTORY COMPARATIVE RESULTS TO TNF VOLUME PROJECTIONS TABLE 2 UNIT NO. THIN. PROD_G RP YEAR OF ORIGIN Age ACRES Volume Per ACRE TNF (BF) Volume Per POLYGON TNF (MBF) Vol per acre diff. INVENTORIED TOTAL NET VOLUME PER ACRE VOLUME (MBF) (BF) VARIANCE ON TOTAL NET VOLUME 25 NO , , NO ,304 2,016 15,617 24,687 1, NO , (14,177) 16, NO ,304 3, ,550 3, NO ,304 2,216 3,741 36,563 2, NO ,368 2,148 (26,353) 41,721 5, ,873 10,148 (7,869) 36,741 12, % 0 27 NO ,304 12,488 31,465 8,839 8, NO , ,049 9, NO ,003 1,400 (12,538) 41,541 2,005 3 NO , ,839 18, ,015 14,411 8,551 29,464 11, % 0 13 YES , ,040 8, YES , ,782 5, YES , (5,645) 17, ,452 2,364 1,933 9,519 1, % 0 5 YES ,452 2,426 5,250 6,202 1,314 6 YES ,452 1,620 4,735 6, YES ,452 1,263 7,189 4, ,452 5,309 5,557 5,895 2, % ,232 28, % ACRES MBF MBF RE AGGREGATED UNIT VOLUME COMPARISON 27, % MBF The year old units (5 6 and 13 15) show more consistency than the others. The volume in this age class is only ± 61% of the TNF estimate with the exception of Unit 15. Unit 15 exhibits a positive increase over the TNF. When removed from the unit selection it would drop the comparison to about 54% of the TNF estimate. All of these units were cut in the 60 s and have been thinned. There are (5) more units in the Staney Creek drainage (Units 8 12) that fall into the same 21
24 category as to thinning and age. These units were mapped but no field data was taken due to time constraints during the field work segment. Units inventoried in the year old class exhibit 22.5% less volume when compared to the TNF estimates for the same areas. These units were harvested in 1935 and These are un thinned stands that again show one unit increasing in volume comparison. Stands over 80 years in age show a positive increase of 27.26% that can be attributable to the single unit on Betton Island. This particular unit carries a Prod_Grp 2 classification that drops the volume from Prod_Grp 1 of 40,304 BF down to 15,368 BF. Referencing Graph 1, page 4, the contributory percentages for timber by age class in the 41 year and older categories we see the following percentage distribution: AGE ,469.2 acres 97.94% AGE ,577.6 acres 1.63% AGE acres.43% The volume variance as directly calculated in this inventory study and weighted by contributing acreage of earliest available young growth stands indicates that the TNF volume may be overestimated by 37.5%. Note that the volumes reported and discussed herein represent full utilization of a given stand. If the entire stand volume is not harvested, a proportionate reduction in volume is necessary. The age classes of greatest significance, AGE 41 60, show the greatest variance in volume reduction. These stands are thinned but lightly stocked with a basal area of less than 92 square feet. The average diameter is 12.2 DBH and the bole length is 32 feet. Harvesting timber prematurely as seen in the cover photo destroys the future potential and removes that acreage from the next rotation. The young growth resource at this age is not ready and will not be available in sufficient volume for decades into the future. Since the sample is designed as a random selection with a traceable methodology, it is also possible to add to the sample at any time to correct specific deficiencies that may develop or target certain areas. An example would be the estimation of volume found within a specified distance and/or multiples of various distances from roads or stream courses. Another may be the volume surrounding eagles nesting trees. Additional sampling capability only needs to be designed into the model by making these areas distinct polygons (stand types) when pre mapping additional 22
25 project work. If they are distinct stands, they would be sampled in the overall update. These areas can also be more intensely sampled by making them the general population and excluding all other stand types. 23
26 ADDENDUM 24


27 25
28 PLOT Timber Decimal Degrees Decimal Degrees Degrees Minutes Degrees Minutes YEAR ID Type ELEV. Stand Longitude NAD83 Latitude NAD83 Longitude NAD83 Latitude NAD HS3 100'-500' ' HS3 100'-500' ' HS3 100'-500' ' HS3 100'-500' ' HS3 100'-500' ' HS3 100'-500' ' HS3 100'-500' ' HS3 100'-500' ' HS3 100'-500' ' HS3 100'-500' ' HS3 100'-500' ' HS3 100' ' HS3 100' ' HS3 100'-500' ' HS3 100'-500' ' HS3 100'-500' ' HS3 100'-500' ' HS3 100' ' HS3 100' ' HS3 100'-500' ' HS3 100'-500' ' HS3 100'-500' ' HS3 100'-500' ' HS3 100'-500' ' HS3 100' ' HS3 100' ' HS3 100' ' HS3 100'-500' ' HS3 100'-500' ' HS3 100'-500' ' HS3 100'-500' ' HS3 100' ' HS3 100' ' HS3 100' ' HS3 100'-500' ' HS3 100'-500' ' HS3 100'-500' ' HS3 100'-500' ' HS3 100'-500' ' HS3 100'-500' ' HS3 100'-500' ' HS3 100'-500' ' HS3 100'-500' ' HS3 100'-500' ' HS3 100'-500' ' HS3 100'-500' ' HS3 100' ' HS3 100' ' HS3 100'-500' ' HS3 100'-500' ' HS3 100' ' HS3 100' ' HS3 100' ' HS3 100' ' HS3 100'-500' ' HS3 100'-500' ' HS3 100'-500' ' HS3 100'-500' ' HS3 100'-500' ' HS3 100'-500' ' HS3 100'-500' ' HS3 100'-500' ' HS3 500' ' HS3 500' ' HS3 500' ' HS3 500' ' HS3 500' ' HS3 500' ' HS3 100' ' HS3 100' ' HS3 100' ' HS3 100' ' HS3 100' ' HS3 100'-500' ' HS3 100'-500' ' TNF SECOND GROWTH INVENTROY PLOT LIST LATITUDE/LONGITUDE UNITS 2 AND 3 TABLE 3 26
29 27
30 28
31 TABLE 4 TONGASS NATIONAL FOREST 2010 SECOND GROWTH VOLUME INVENTORY UNIT SUMMARY DATA W/RE AGGREGATED ANALYSIS TONGASS NATIONAL FOREST DATA TWP RGE SEC UNIT NO. TRACT AREA ACRES COPPER RIVER MERIDIAN YEAR OF ORIGIN AGE THINNED 2 70S 80E WINTER HARBOR NO 3 70S 80E WINTER HARBOR NO COMBINED 70S 80E WINTER HARBOR NO 5 71S 81E 8, 9, 16, & 17 STANEY CR YES 6 71S 81E 4, 8, & 9 STANEY CR YES 7 71S 81E 9 STANEY CR YES COMBINED 71S 81E 4, 8, 9, 16, & 17 STANEY CR S 83E 20 HYDABURG RD YES 14 74S 83E 20 HYDABURG RD YES 15 74S 83E 9 HOLLIS/CRAIG HWY YES 19 73S 90E 20,21, & 29 HUMP ISL NO 20 73S 90E BETTON ISL NO 23 72S 88E 6 HELM BAY NO 24 71S/72S 88E 31/6 HELM BAY NO COMBINED 71S/72S 88E 31/6 HELM BAY HARDWOOD TYPE CONIFER TYPE S 87E 36 HELM BAY NO 26 71S 87E/88E 36/31 HELM BAY NO COMBINED 71S 87E/88E 36/31 HELM BAY HARDWOOD TYPE CONIFER TYPE S 90E 3 5, 8, & 9 TRAITORS COVE NO ELEVATION 71S 90E 3 5, 8, & 9 TRAITORS COVE HIGH ELEVATION LOW ELEVATION S 90E 4 TRAITORS COVE NO TOTAL ACRES 29
Timber Sale Appraisal Sunday Passage Sale FG
 Timber Sale Appraisal Sunday Passage Sale FG-341-2018-024- District: Forest Grove Date: August 23, 2017 Cost Summary Conifer Hardwood Total Gross Timber Sale Value $3,295,699.11 $68,708.64 $3,364,407.75
Consolidated Young Growth Forest Land Base Analysis for All Land Ownership in Southeast Alaska and Recommendations for Federal Land Managers
 Consolidated Young Growth Forest Land Base Analysis for All Land Ownership in Southeast Alaska and Recommendations for Federal Land Managers August 30th, 2013 (report version 3) Prepared at the request
Productivity of red alder in western Oregon and Washington
 From Biology of Alder Proceedings of Northwest Scientific Association Annual Meeting April 14-15, 1967 Published 1966 Productivity of red alder in western Oregon and Washington Red alder in western Oregon
Timber Sale Appraisal Toucan Two Sale cost summary. Conifer Hardwood Total. Gross Timber Sale Value $2,551, $4, $2,556,620.
 Timber Sale Appraisal Toucan Two Sale 341-15-28 District: Forest Grove Date: August 25, 2014 cost summary Conifer Hardwood Total Gross Timber Sale Value $2,551,727.25 $4,893.64 $2,556,620.89 Project Work:
Matanuska-Susitna Borough Timber Inventory 2006
 Matanuska-Susitna Borough Timber Inventory 2006 1989 MSB Forest Management Plan 17 Forest Management Units (FMU) 138,000 acres classified forest land Approximately 84,700 acres Commercial Timber Land
Applicability of Four Regional Volume Tables for Estimating Growth Response to Thinning in Douglas-Fir
 United States Department of Agriculture Forest Service Pacific Northwest Forest and Range Experiment Station Research Paper PNW-295 May 1982 Applicability of Four Regional Volume Tables for Estimating
Regeneration / Young Stand Models
 Many of the standard growth and yield models that are currently in use start with stands that have passed the regeneration phase of development (i.e., they start with stands with ages of 15 or 20 years
TIMBER SALE SUMMARY Rusty Rope Contract No Location: Portions of Sections 22, 26, 27 and 35, W.M., Clatsop County, Oregon.
 TIMBER SALE SUMMARY Rusty Rope Contract No. 341-16-52 1. Location: Portions of Sections 22, 26, 27 and 35, W.M., Clatsop County, Oregon. 2. Type of Sale: This timber sale is a 141 acre Modified Clearcut.
Taper rule for butt log of lodgepole pine
 Taper rule for butt log of lodgepole pine 17 - LOG MEASUREMENTS 17.4 Taper in Long Logs 17.43 - Taper in Butt Logs The taper in long logs which have the butt cut at one end of the log will be determined
Timber Sale Appraisal Shepherds Pie Sale cost summary. Conifer Hardwood Total. Gross Timber Sale Value $2,013, $13,263.
 Timber Sale Appraisal Shepherds Pie Sale 341-14-23 District: N Cascade Date: January 14, 2014 cost summary Conifer Hardwood Total Gross Timber Sale Value $2,013,923.22 $13,263.00 $2,027,186.22 Project
The Washington Hardwoods Commission. Presents: A Hardwood Resource Assessment for Western Washington
 The Washington Hardwoods Commission Presents: A Hardwood Resource Assessment for Western Washington June, 2002 Abstract This project used Landsat TM images for mapping current forest distribution across
 Greasy Alder TIMBER CRUISE REPORT FY 2010 1. Sale Area Location: Areas 1 and 2 are located in Portions of Sections 33 and 34, T7N, R6W, W.M., Clatsop County, Oregon. 2. Fund Distribution: BOF 100% Tax
2 Cruise Design. April 15, 2015 Amendment No
 Timber Pricing Branch Quality Assurance 2 Cruise Design April 15, 2015 Amendment No. 3 2-1 Cruising Manual Ministry of Forests, Lands and NRO 2.1 Cruise Objective The objective of the timber cruise is
& What to Look for in a Timber Cruise/Inventory Program
 & What to Look for in a Timber Cruise/Inventory Program CV Paul Wagner ACI Instructor University of Washington: BA, Forest Management, 1980; MBA,1988. Project Manager, employed by Atterbury Consultants
Contents. 1 Introduction. 2 Data. 3 Analysis. 4 Equations for Height Growth. 8 Equations for Site Index. 14 Discussion
 United States Department of Agriculture Forest Service Pacific Northwest Research Station Research Paper PNW-RP-378 Estimates of Site Index and Height Growth for Douglas-Fir in High- Elevation Forests
FINAL TIMBER REMOVAL and MANAGEMENT PLAN BLUE LAKE HYDROELECTRIC PROJECT (FERC NO. 2230) EXPANSION. Prepared By: Dean Orbison
 EXPANSION. Prepared By: Dean Orbison") FINAL TIMBER REMOVAL and MANAGEMENT PLAN BLUE LAKE HYDROELECTRIC PROJECT (FERC NO. 2230) EXPANSION Prepared By: Dean Orbison For the City and Borough of Sitka Electric Department December, 2010 INTRODUCTION
FINAL TIMBER REMOVAL and MANAGEMENT PLAN BLUE LAKE HYDROELECTRIC PROJECT (FERC NO. 2230) EXPANSION Prepared By: Dean Orbison For the City and Borough of Sitka Electric Department December, 2010 INTRODUCTION
Abstract. Research Summary
 United States Department of Agriculture Forest Service Pacific Northwest Forest and Range Experiment Station Research Paper PNW-326 October 1984 8 A EDITOR'S.,.,. FILE COP.Y. Site Inaex anahe,ght Growth
TIMBER SALE PRESCRIPTION
 Michigan Department of Natural Resources - Forest, Mineral and Fire Management GENERAL Date TIMBER SALE PRESCRIPTION 01/17/11 Timber Sale Number (if applicable) 720041201 LOCAL CONTACT Name Tom Barnes
Updated Scoping Information. Proposed Vallenar Young-growth Project
 Updated Scoping Information Proposed Vallenar Young-growth Project What is the Forest Service proposing? The Forest Service is proposing to harvest young-growth forests to provide timber for the Tongass
Foresters utilize a variety of specialized tools to accomplish the following tasks:
 Forestry Tools Foresters utilize a variety of specialized tools to accomplish the following tasks: Measure trees Conduct forest inventory Mark trees Measure logs Plant trees Navigation and orientation
8) Which of the following species is best adapted to poorly drained sites? a) Bur oak b) Eastern red cedar c) Black ash d) Yellow birch
 Which of the following species is best adapted to poorly drained sites? a) Bur oak b) Eastern red cedar c) Black ash d) Yellow birch") School Score Wisconsin Envirothon 2004 Forestry Exam Answer the following questions based on the species description and graphic to the right. 1) This tree is the state tree of Wisconsin and is prized
School Score Wisconsin Envirothon 2004 Forestry Exam Answer the following questions based on the species description and graphic to the right. 1) This tree is the state tree of Wisconsin and is prized
Forestry in the Last Frontier:
 Forestry in the Last Frontier: A Forest Products Industry Perspective in Alaska Kate C. Marcille Bureau of Business and Economic Research (BBER) University of Montana Albuquerque, New Mexico November 18,
6 Stump Cruising. April 1,
 Timber Pricing Branch Stump Cruising 6 Stump Cruising April 1, 2017 6-1 Cruising Manual Ministry of Forests, Lands and NRO 6.1 Introduction The methods described in this chapter are prioritised by safety
SILVICULTURE SILVICULTURE 10/8/2018. Ecological forestry (Ecosystem management)
") SILVICULTURE SILVICULTURE Dave Peterson University of Washington School of Environmental and Forest Sciences Thanks to Kristi McClelland, Boyd Evison, and Greg Ettl Silviculture The science and art of
SILVICULTURE SILVICULTURE Dave Peterson University of Washington School of Environmental and Forest Sciences Thanks to Kristi McClelland, Boyd Evison, and Greg Ettl Silviculture The science and art of
Timber Measurements Society Portland, 2017 Logging Utilization in Oregon and Washington Eric Simmons
 Timber Measurements Society Portland, 2017 Logging Utilization in Oregon and Washington 2011 2015 Eric Simmons State Level Logging Utilization Objectives The goal was to update logging residue data for
Attempt any FOUR questions. All questions are of equal marks.
 Attempt any FOUR questions. All questions are of equal marks. Regular 2069 Magh/Falgun 1. (a) A forester standing 30m away from the base of a 5 inward leaned Oak tree on regular slope observed with Abney
Sim 11DmriBIIIm IIBirll IGIBI 11111!11&-IIDJIII NIB'IDIB
 . t ' Sim 11DmriBIIIm IIBirll IGIBI 11111!11&-IIDJIII NIB'IDIB ' PNW-97 May 1977 ESTIMATING D.B.H. FROM STUMP DIAMETERS IN SECOND-GROWTH DO UGLAS-FIR by Robert 0. Curtis, Principal Mensurationist and James
Timber Sale Appraisal Iron Nelson Sale WL W
 Cost Summary Conifer Hardwood Total Gross Timber Sale Value $2,038,184.46 $1,194.48 $2,039,378.94 Project Work: $0.00 Advertised Value: $2,039,378.94 9/26/18 1 Timber Description Location: Portions of
Cooperative Management of the Bald Eagle in South Coastal Alaska Fred B. Samson U.S Forest Service, Missoula, MT
 Cooperative Management of the Bald Eagle in South Coastal Alaska Fred B. Samson U.S Forest Service, Missoula, MT Wildlife is abundant in the south coastal forests of Alaska and the Bald Eagle (Haliaeetus
Forest Assessments with LiDAR: from Research to Operational Programs
 Forest Assessments with LiDAR: from Research to Operational Programs David L. Evans Department of Forestry Forest and Wildlife Research Center Mississippi State University Forest Remote Sensing: Then and
Timber Sale Appraisal Appairently Not Sale WO W
 Timber Sale Appraisal Appairently Not Sale WO-341-2019-W00227-01 District: West Oregon Date: August 27, 2018 Cost Summary Conifer Hardwood Total Gross Timber Sale Value $574,942.80 $0.00 $574,942.80 Project
Timber Sale Appraisal Bad Ham Sale KL
 Timber Sale Appraisal Bad Ham Sale KL-341-2017-054- District: Klamath/Lake Date: October 06, 2016 Cost Summary Conifer Hardwood Total Gross Timber Sale Value $351,028.84 $0.00 $351,028.84 Project Work:
The Science Behind Forest Riparian Protection in the Pacific Northwest States By George Ice, Summer 2004
 The Science Behind Forest Riparian Protection in the Pacific Northwest States By George Ice, Summer 2004 Riparian buffers, streamside management zones, and similar measures are essential parts of forest
thinning growth of western hemlock stands after precommercial J. R. Dilworth FORE/ I REI'EARCH la6 i bulletin 33 COMPACT
 i bulletin 33 COMPACT L. growth of western hemlock stands after precommercial thinning J. R. Dilworth FORE/ I REI'EARCH la6 O5'egon State U niversity :.... g ao l.' Of Forestry Oregon G Since 1941, the
Timber Sale Appraisal Knob Point Combination. Sale AT Cost Summary. Conifer Hardwood Total. District: Astoria Date: April 20, 2015
 Timber Sale Appraisal Knob Point Combination Sale AT-341-2015-54- District: Astoria Date: April 20, 2015 Cost Summary Conifer Hardwood Total Gross Timber Sale Value $1,321,653.69 $34,121.84 $1,355,775.53
Visual Management System and Timber Management Application 1
 Visual Management System and Timber Management Application 1 2 Warren R. Bacon and Asa D. (Bud) Twombly / Abstract: This paper includes an illustration of a planning process to guide vegetation management
Timber Valuation Opinion
 Timber Valuation Opinion 11/02/2012 Tract PIN: 9723-23-7992-00000 Location: 77 CAMBY DR, Buncombe County, NC The subject property timber was cruised on 10/23/2012, and the merchantable hardwood sawtimber
TREPASSEY S SITKA SPRUCE
 TREPASSEY S SITKA SPRUCE The growth of Sitka spruce in three small plantations near Daniel s Point, Trepassey, can be described in a single word. Phenomenal! Inland from Daniel s Point, Trepassey, there
TIMBER SALE PRESCRIPTION
 Michigan Department of Natural Resources - Forest, Mineral and Fire Management GENERAL Date TIMBER SALE PRESCRIPTION 10/05/12 Timber Sale Number (if applicable) 720051201 LOCAL CONTACT Name Tom Barnes
Forecasting Timber, Biomass, and Tree Carbon Pools with the Output of State and Transition Models
 Proceedings of the First Landscape State-and-Transition Simulation Modeling Conference, June 14 16, 2011 Forecasting Timber, Biomass, and Tree Carbon Pools with the Output of State and Transition Models
Variable Method Source
 Appendix S1 Appendix S1: Table S1 Plot variables Variable Method Source COVERS % shrub cover ocular estimate of shrub cover % forb cover ocular estimate of forbs % coarse woody debris % live overhead canopy
Nova Scotia Forest Inventory
 Nova Scotia Forest Inventory Based on Forest Inventory Permanent Sample Plots Measured between 1994 and 1998 Report FOR 2000-1 TABLE OF CONTENTS 1.0 INTRODUCTION 1 1.1 Background 1 2.0 METHODS 2 3.0 RESULTS
Timber Sale Appraisal East Dean Sale CS
 Timber Sale Appraisal Sale CS-341-2017-68- District: Coos Date: December 13, 2016 Cost Summary Conifer Hardwood Total Gross Timber Sale Value $395,372.12 $4,466.90 $399,839.02 Project Work: $0.00 Advertised
Timber Sale Appraisal Buck Ridge. Sale GP Cost Summary. Conifer Hardwood Total. District: Southwest Date: April 23, 2015
 Timber Sale Appraisal Buck Ridge Sale GP-31-2015-88- District: Southwest Date: April 23, 2015 Cost Summary Conifer Hardwood Total Gross Timber Sale Value $68,0.32 $7,950.00 $76,35.32 Project Work: ($19,580.00)
Timber Sale Appraisal Clatstastic Sale FG
 Timber Sale Appraisal Clatstastic Sale FG-341-2018-15- District: Forest Grove Date: February 20, 2018 Cost Summary Conifer Hardwood Total Gross Timber Sale Value $3,443,295.15 $56,673.24 $3,499,968.39
Application of Uneven- aged Management. What is Uneven-age??? Age Classes. Important Terminology, Concepts & Methodology. defining
 Application of Uneven- aged Management Important Terminology, Concepts & Methodology What is Uneven-age??? Age Classes Uneven-aged This Stand is the defining How many age characteristic classes must an
2.4 MANAGING FOR HIGH-VALUE TREES
 2.4 MANAGING FOR HIGH-VALUE TREES BACKGROUND Quality timber trees are important to the region s wood products industry. Quality is determined by tree size and the amount of clear, knot-free lumber the
EVALUATION OF A MOUNTAIN PINE BEETLE INFESTATION IN SECOND-GROWTH PONDEROSA PINE ON THE CROW INDIAN RESERVATION, MONTANA, 1979 ABSTRACT
 EVALUATION OF A MOUNTAIN PINE BEETLE INFESTATION IN SECOND-GROWTH PONDEROSA PINE ON THE CROW INDIAN RESERVATION, MONTANA, 1979 by K. E. Gibson, M. D. McGregor, and J. E. Dewey 1/ ABSTRACT The mountain
MOUNTAIN PINE BEETLE STATUS AND POTENTIAL, PLAINS/THOMPSON FALLS RANGER DISTRICT, LOLO NATIONAL FOREST. Ken Gibson ABSTRACT INTRODUCTION
 SD N H m A3 Y1" 3 Forest Pest Management Report 89-3 3450 December 1988 MOUNTAIN PINE BEETLE STATUS AND POTENTIAL, PLAINS/THOMPSON FALLS RANGER DISTRICT, LOLO NATIONAL FOREST 1988 Ken Gibson ABSTRACT The
NOTICE OF TIMBER SALE
 NOTICE OF TIMBER SALE SALE NAME/NO.: AUCTION DATE/TIME: AUCTION LOCATION: DISTRICT/UNIT OFFICE (MAILING ADDRESS FOR BIDS): HARVEST TYPE: Blastoria Salvage 341-08-93 June 30, 2008 starting at 2:00 p.m.
Wood Biomass Energy Status. Alaska
 Ensuring Forest Sustainability in the Development of Wood Biofuels and Bioenergy in the Pacific Coast Region Wood Biomass Energy Status and Options for Southeast Alaska Sealaska Corporation February 25,
FOR 347: Silviculture. Thinning & Silviculture. Group Exercise 4/10/2019. Instructor: Dr. Jeremy Stovall Lecture 19: Thinning Methods
 FOR 347: Silviculture Instructor: Dr. Jeremy Stovall Lecture 19: 04.09.2019 Thinning Methods Thinning & Silviculture Regeneration Treatments Stand Establishment Intermediate Treatments 2 Group Exercise
Fundamentals and Best Practices for Forest Inventories Building the Best Inventory for any Silvicultural System in any Geographic Area
 Best Practices for Forest Inventories Building the Best Inventory for any Silvicultural System in any Geographic Area Best Practices for Forest Inventories Impact of Silvicultural Systems Clearcut, Seed-Tree,
Timber Sale Appraisal Steep Puppy Sale KL
 Timber Sale Appraisal Steep Puppy Sale KL-341-2018-33- District: Klamath/Lake Date: August 24, 2017 Cost Summary Conifer Hardwood Total Gross Timber Sale Value $821,529.46 $0.00 $821,529.46 Project Work:
Appendix A: Vegetation Treatment Descriptions and Unit Specific Design Criteria
 Appendix A: Vegetation Treatment Descriptions and Unit Specific Design Criteria The table below describes the Kabetogama Project proposed vegetation treatments associated with Alternative 2. The treatment
Fundamentals and Best Practices for Forest Inventories Building the Best Inventory for any Silvicultural System in any Geographic Area
 Fundamentals and Best Practices for Forest Inventories Building the Best Inventory for any Silvicultural System in any Geographic Area Fundamentals and Best Practices for Forest Inventories Impact of Silvicultural
FOREST COMPOSITION AND STRUCTURE
 FOREST COMPOSITION AND STRUCTURE Core Assessment Products 1. A map of the GAP classification cover types on all ownerships in the subsection(s) 2. A table summarizing the area in each of the GAP classifications.
Before You Sell Your Timber
 Woodland Owner Notes Before You Sell Your Timber Years of growth are accumulated in a mature timber stand. The annual income from all those years is frequently marketed in a single transaction. Too much
ECOLOGICAL FOREST MANAGEMENT
 ECOLOGICAL FOREST MANAGEMENT Northwest Natural Resources Group Rolf Gersonde, 6/11/2016 RolfGersonde@gmail.com Ecological Forestry in 60 Seconds The Element of Ecological Forestry Using site Adapted Species
Project Brief: Small Forestland Owner Parcel Identification and County GIS Data Compilation for Washington State WRIAs 23 & 49
 Project Brief: Small Forestland Owner Parcel Identification and County GIS Data Compilation for Washington State WRIAs 23 & 49 Prepared For: Mary McDonald Program Director Small Forest Landowner Office
Management Strategies to Increase Structural Complexity and Enhance Biodiversity in Mixed Forests of Alaska, Japan, and central Europe
 Management Strategies to Increase Structural Complexity and Enhance Biodiversity in Mixed Forests of Alaska, Japan, and central Europe Robert Deal, USFS, PNW Research Station, Portland, OR USA T. Yoshida,
NTRALHARDWOOD NOTES. Estimating Oak Growth and Yield. Managed Stand Yield. Individual Tree Growth and Yield Models
 North Central Forest Experiment Station 5.03 NTRALHARDWOOD NOTES Estimating Oak Growth and Yield Yields from upland oak stands vary widely from stand to stand due to differences in age, site quality, species
Users Guide for Noble Fir Bough Cruiser
 United States Department of Agriculture Forest Service Pacific Northwest Research Station General Technical Report PNW-GTR-644 July 2005 Users Guide for Noble Fir Bough Cruiser Roger D. Fight, Keith A.
A Comparison of Two Estimates of Standard Error for a Ratio-of-Means Estimator for a Mapped-Plot Sample Design in Southeast Alaska
 United States Department of Agriculture Forest Service Pacific Northwest Research Station Research Note PNW-RN-532 June 2002 A Comparison of Two Estimates of Standard Error for a Ratio-of-Means Estimator
Appraisal Summaries 14
 Appraisal Summaries 14 The Appraisal Summary Reports combine appraisal information from the Volume summaries (Chapter 12) and the Harvesting Method summaries (Chapter 13). There are separate reports for
Upper Canopy module Fixed Area Plot Summary and beyond!
 Upper Canopy module Fixed Area Plot Summary and beyond! Eight standard steps to process live upper canopy (tree) inventory data: 0. Complete your data by calculating heights for trees w/ height data 1.
Evaluation of proposed ski lease area expansion on Mt. Sunapee 11/23/2004
 New Hampshire Natural Heritage Bureau DRED Division of Forests & Lands PO Box 1856 172 Pembroke Road, Concord, NH 03302-1856 (603) 271-3623 visit our web site at www.dred.state.nh.us/forlands/formgt/nhiweb
Operational Research Highlights
 Operational Research Highlights Timothy B. Harrington, PNW Research Station, USDA Forest Service, Olympia, WA 1. Douglas-fir thinning and fertilizer responses on a droughty site Reference: Miller et al.
Assessment of Woody Biomass Energy Resources in the Cordova Area
 2012 Assessment of Woody Biomass Energy Resources in the Cordova Area Douglas Hanson Department of Natural Resources Division of Forestry 12/21/2012 TABLE OF CONTENTS I. Executive Summary... 1 II. Objectives...
Harvesting of Young Stands in BC
 Harvesting of Young Stands in BC SPECIAL INVESTIGATION MAY 2018 FPB/SIR/48 TABLE OF CONTENTS GLOSSARY OF TERMS i EXECUTIVE SUMMARY 1 INTRODUCTION 3 BACKGROUND 4 How are minimum harvest criteria determined?...
Model Lesson: Tree Identification and Growth Study at Outdoor School
 Model Lesson: Tree Identification and Growth Study at Outdoor School Joan Swafford Overview: Students will identify tree species, collect and analyze tree growth data from two different sites, discuss
Lake County Forestry 601 3rd Avenue Two Harbors, MN Website:
 Lake County Forestry 601 3rd Avenue Two Harbors, MN 55616 218-834-8340 Website: www.co.lake.mn.us/forestry Tract Number: 12 ROCKET SPRUCE SALE (Note: Tract Number subject to change) Sale Type: REGULAR
AVERAGE HEIGHT WEIGHTED BY VOLUME IN AIR PHOTO INTERPRETATION
 CANADA Department of Northern Affairs and National Resources FORESTRY BRANCH AVERAGE HEIGHT WEIGHTED BY VOLUME IN AIR PHOTO INTERPRETATION BY F. D. MacAndrews Forest Research Division Technical Note No.
SUSTAINABLE HARVEST CALCULATIONS
 SUSTAINABLE HARVEST CALCULATIONS PROCESS USED TO DEFINE SUSTAINABLE HARVEST LEVELS Sustainable harvest calculations are determined by considering several long-term desired conditions (i.e. age class imbalance,
An Examination of Red Alder and Western Red Cedar as Alternative Plantation Choices to Douglas-fir
 An Examination of Red Alder and Western Red Cedar as Alternative Plantation Choices to Douglas-fir Washington Farm Forestry Association April 4, 2003 The Pacific Northwest has always been the Douglas fir
RESPONSE TO UREA AND AMMONIUM NITRATE FERTILIZATION IN AN 80-YEAR-OLD DOUGLAS-FIR STAND. by Richard E. Miller. Principal Soil Scientist
 I PNW-330 March 1979 RESPONSE TO UREA AND AMMONIUM NITRATE FERTILIZATION IN AN 80-YEAR-OLD DOUGLAS-FIR STAND by Richard E. Miller. Principal Soil Scientist and Constance A. Harrington. Research Forester
COLE 1605(b) Report for Washington
 Report for Washington") COLE 1605(b) Report for Washington COLE Development Group January 4, 2019 1 Abstract This is a standard report produced by COLE, The Carbon Online Estimator. COLE is an online package that was developed
COLE 1605(b) Report for Washington COLE Development Group January 4, 2019 1 Abstract This is a standard report produced by COLE, The Carbon Online Estimator. COLE is an online package that was developed
Timber Sale Appraisal Likely Storey Sale FG W
 Timber Sale Appraisal Likely Storey Sale FG-341-2019-W00543-02 District: Forest Grove Date: August 28, 2018 Cost Summary Conifer Hardwood Total Gross Timber Sale Value $1,546,409.96 $0.00 $1,546,409.96
Density Management in Pacific Northwest forests
 Density Management in Pacific Northwest forests Should I thin? Is there an immediate cash flow or timber supply need? Do current and anticipated future stands meet management objectives (economic, wildlife,
Shelterwood Method Characteristics
 Shelterwood Method Characteristics Form Appearance --- Removal of mature crop in a series of partial cuttings which (1) culture seed production, (2) prepare the site and (3) make room for regeneration
TIMBER SALE PRESCRIPTION
 Michigan Department of Natural Resources - Forest, Mineral and Fire Management TIMBER SALE PRESCRIPTION Date 01/13/09 Timber Sale Number (if applicable) Name Scott Lint Email Address LintS@michigan.gov
UNEVEN-AGED MANAGEMENT NORTHWEST CERTIFIED FORESTRY
 UNEVEN-AGED MANAGEMENT NORTHWEST CERTIFIED FORESTRY Rolf Gersonde, 6/6/2015 Uneven-aged Management in 90 Minutes 2 Silviculture Background Forest Ecology Management Tools and Stocking Control Multi-aged
Timber Appraisal Report
 Tuesday, 12 February 2013 Timber Appraisal Report [Address] Lot xx, DPxxxxxx Table of Contents Name and address of consultant... 2 Qualifications... 2 Relevant experience... 2 Scope of report... 2 Instructions...
Impacts of Inaccurate Area Estimation on Harvest Scheduling Using Different Image Resolutions
 Impacts of Inaccurate Area Estimation on Harvest Scheduling Using Different Image Resolutions Nathan J. Renick 1, Donald L. Grebner 2, David L. Evans, Ian A. Munn, Keith L. Belli, and Stephen C. Grado
Vegetation Resources Inventory
 Vegetation Resources Inventory Ground Sampling Quality Assurance Procedures Prepared by Ministry of Forests Resources Inventory Branch for the Terrestrial Ecosystem Task Force Resources Inventory Committee
Timber Sale Appraisal Boxcar Willie Sale FG
 Timber Sale Appraisal Boxcar Willie Sale FG-341-2018-28- District: Forest Grove Date: July 11, 2017 Cost Summary Conifer Hardwood Total Gross Timber Sale Value $1,654,942.01 $50,453.52 $1,705,395.53 Project
Instructions for New Applicants to the Qualified Forest Program
 Instructions for New Applicants to the Qualified Forest Program Eligibility Requirements: Each Parcel (identified by a unique Tax Parcel ID #) in your application must be 20 acres or more in size. Parcels
Cruise Compilation Manual
 TIMBER PRICING BRANCH Cruise Compilation Manual July 1, 2014 Includes Amendments Effective Date Amendment No.4 July 1, 2017 Amendment No. 3 January 13, 2017 Amendment No. 2 July 1, 2016 Amendment No. 1
CRUISE DESIGN AND LAYOUT
 CRUISE DESIGN AND LAYOUT FOR 05: Forest Biometrics Lecture Notes Fall 015 Dr. Dean Coble Arthur Temple College of Forestry and Agriculture Stephen F. Austin State University CRUISE DESIGN AND LAYOUT Sample
FOR 274 Forest Measurements and Inventory. Written Take Home Exam
 FOR 274 Forest Measurements and Inventory Written Take Home Exam Instructions: This exam is comprehensive of the material covered within the Forest Resources 274 class curriculum. The first question is
FINAL WILDLIFE and VEGETATION RESOURCES STUDY PLAN. Blue Lake Hydroelectric Project FERC No Expansion. Prepared by:
 FINAL WILDLIFE and VEGETATION RESOURCES STUDY PLAN Blue Lake Hydroelectric Project FERC No. 2230 Expansion Prepared by: City and Borough of Sitka, Electric Department 105 Jarvis Street Sitka, Alaska 99835
2015 Wisconsin Envirothon KEY Forestry Exam
 2015 Wisconsin Envirothon KEY Forestry Exam Answers that are correct but differ strongly from answer key must be initialized by Station Captain as an approved answer prior to delivery to score stewards.
Estimating Sawmill Processing Capacity DRAFT. for Tongass Timber: 2003 and Allen M. Brackley, Daniel J. Parrent, and Thomas D.
 Estimating Sawmill Processing Capacity for Tongass Timber: 2003 and 2004 Update Allen M. Brackley, Daniel J. Parrent, and Thomas D. Rojas 1 1 Allen M. Brackley is a research forester and Thomas D. Rojas
Change in Area and Ownership of Private Timberland in Western Oregon Between and
 ed States artment of culture Forest Service Pacific Northwest Forest and Range Experiment Station Resource Bulletin PNW-92 May 1981 Change in Area and Ownership of Private Timberland in Western Oregon
Logging Utilization in New Mexico
 Sacramento Mountain Wood Industry Summit March 2016 Logging Utilization in New Mexico Eric Simmons Steve Hayes State Level Logging Utilization Objectives The goal is to update logging residue data for
Forest Resources of the Black Hills National Forest
 United States Department of Agriculture Forest Service Rocky Mountain Research Station August 22 Forest Resources of the Black Hills National Forest Larry T. DeBlander About the author Larry T. DeBlander
Timber Sale Appraisal Annie Hound Sale KL
 Timber Sale Appraisal Annie Hound Sale KL-341-2018-32- District: Klamath/Lake Date: September 26, 2017 Cost Summary Conifer Hardwood Total Gross Timber Sale Value $376,747.18 $0.00 $376,747.18 Project
Timber Sale Appraisal Double Bypass Sale TL
 Timber Sale Appraisal Double Bypass Sale TL-341-2019-037- District: Tillamook Date: April 11, 2018 Cost Summary Conifer Hardwood Total Gross Timber Sale Value $1,037,971.60 $85,958.40 $1,123,930.00 Project
Figure 15 Periodic annual increment (PAI) and gross mean annual increment (MAI) in basal area per acre by treatments for (A) Skykomish treatments 1,
 and gross mean annual increment (MAI) in basal area per acre by treatments for (A) Skykomish treatments 1,") Figure 15 Periodic annual increment () and gross mean annual increment () in basal area per acre by treatments for (A) Skykomish treatments 1, 2, 4, and 7; (B) Skykomish treatments 3, 5, 6, and 8. Each
Figure 15 Periodic annual increment () and gross mean annual increment () in basal area per acre by treatments for (A) Skykomish treatments 1, 2, 4, and 7; (B) Skykomish treatments 3, 5, 6, and 8. Each