(d) (c) Figure 26. Land-cover maps of Batang Toru: (a) 1994; (b) 2001; (c) 2006; (d) 2009
|
|
|
- Clyde Green
- 6 years ago
- Views:
Transcription

 2009 Figure 26 shows")


1 늠 (a) (b) (c) (d) Figure 26. Land-cover maps of Batang Toru: (a) 1994; (b) 2001; (c) 2006; (d) 2009 Figure 26 shows the time-series land-cover maps of Batang Toru study area. The accuracy assessment was conducted by utilizing 173 groundtruth points on the 2009 map and the result indicates the accuracy level of 85.5% with the Khat statistics of 82% (at p= )
2 Forest-cover and land-cover dynamics in Batang Toru orangutan habitat Within the orangutan habitat boundaries, forest unquestionably dominates, with a stable area of approximately ha throughout , covering 94 95% of the total habitat area. Degradation occurred slightly in the forest area, amounting to 8000 ha and 9000 ha in 2005 and 2009 respectively. Anthropogenic land uses were observed in very small areas. Rubber agroforest appeared in relatively larger areas compared to other land uses of mixed gardens, plantations, coffee agroforest and crops. The areas of rubber agroforest were slightly decreasing throughout the periods of observation, that is, 4400 ha in 1994 to 3500 ha in Most of the agricultural and agroforest activities existed since the beginning of observation period (1994 map) (see also section 0) Land-cover dynamics in the vicinity of orangutan habitat For the entire study area, which included the 5-km-wide buffer around the orangutan habitat, forest still dominated, covering ha (61%) of the entire area in Since 1994, the decrease of forest area was observed to be approximately ha throughout the study period (from ha in 1994 to ha in 2009). Within the forested area, signs of degradation started to appear substantially on the 2006 map, similar to the trend in the core habitat area, with degraded forest areas increasing from ha in 2005 to ha in 2009 (see Table 29). Table 29. Land-cover changes in Batang Toru study area, (with the grouping for some minor classes) Land-cover type Area 1994 (ha) Area 2001 (ha) Area 2005 (ha) Area 2009 (ha) Undisturbed forest Disturbed forest Rubber agroforest Mixed gardens Other crops Plantation Other Anthropogenic land uses have been observed since the beginning of the observation period (1994), dominated by rubber agroforest and mixed gardens (Table 29 and Figure 27(b); the red circles showing the emerging land-cover types). Mixed gardens in Batang Toru area were dominated by kemenyan and fruit-tree gardens (see section 0.3). Kemenyan gardens were normally located near forest while fruit-tree gardens were closer to settlement areas (Mulyoutami et al., this report). As for rubber, both agroforest systems and monoculture plantations existed (see also section 0.3.7). The areas of rubber agroforest decreased slightly from 2001 to 2009, that is, ha to ha, while mixed gardens increased from ha in 1994 to ha in 2005, before decreasing slightly to ha in For tree-based agriculture agroforest systems of rubber, coffee, mixed gardens (mainly kemenyan and durian) and plantations, the figures show variation between ha and ha during the observation periods. Oil palm
3 plantations showed to appear into substantially larger areas only in 2009 observation (data not shown in the figures or tables). (a) (b) Figure 27. Land cover and changes from 1994 to 2009 in Batang Toru: (a) within orangutan habitat; and (b) in the entire study area. (Legend: UF=Undisturbed Forest, DF=Disturbed Forest, RAF=Rubber Agroforest, Oth-cr= other crops, incl. oil palm, coffee gardens, MG=Mixed Gardens, Est=Estate/Plantation, Other= other land-cover types, incl. shrubs, cleared land, settlement) Aboveground carbon-stock (AGCS) and emissions for Batang Toru The AGC density for both the entire study area and orangutan habitat alone are presented in Figure 28 and the maps in Figure 30. The AGC density in the orangutan habitat decreased from 235 t/ha in 1994 to 225 t/ha in 2009, while for the study area it decreased from 185 t/ha in 1994 to 174 t/ha. Throughout all observation periods, AGC density was always higher in orangutan habitat than that in the entire study area by approximately t/ha. The annual rate of AGC decreases were less than 1% for both the core habitat and the entire study area


 1994; (b) 2001;")
4 Figure 28. AGC density in Batang Toru (a) (b) (c) (d) Figure 29. Maps of aboveground carbon-stocks in Batang Toru: (a) 1994; (b) 2001; (c) 2006; (d)
5 For the entire Batang Toru area, there was an increase in total emissions ranging from 1.3 MtCO 2e/yr to 1.8 MtCO 2e/yr from 1994 to 2009, while for the core orangutan habitat emission rates ranged from tco 2e/yr to tco 2e/yr, with the highest in The figures of emissions and sequestrations for each time series are presented in Table 30. Table 30. Emissions, sequestrations and net emissions from 1990 to 2009, based on aboveground carbonstock changes in Batang Toru study area Emission - study area Batang Toru Study area Total emission (ton CO2 eq. ) 9,341,649 7,234,623 5,485,337 Annual emisssion (ton CO2 eq./yr) 1,334,521 1,446,925 1,828,446 Ave. ann. emission (ton CO2 eq./ha/yr) Sequestration Total sequestration (ton CO2 eq. ) 7,845,025 1,195,675 3,518,180 Annual sequestration (ton CO2 eq./yr) 1,120, ,135 1,172,727 Ave. ann. sequestration (ton CO2 eq./ha/yr) Net emission- study area Total net emission (ton CO2 eq.) 1,496,624 6,038,948 1,967,157 Annual net emission (ton CO2 eq./yr) 213,803 1,207, ,719 Ave. ann. net emission (ton CO2 eq./ha/yr) Emission - OU habitat OU Habitat Total emission (ton CO2 eq. ) 1,410,112 2,731, ,361 Annual emisssion (ton CO2 eq./yr) 201, , ,454 Ave. ann. emission (ton CO2 eq./ha/yr) Sequestration Total sequestration (ton CO2 eq. ) 1,065,493 75,622 84,369 Annual sequestration (ton CO2 eq./yr) 152,213 15,124 28,123 Ave. ann. sequestration (ton CO2 eq./ha/yr) Net emission - OU habitat Total net emission (ton CO2 eq.) 344,618 2,655, ,991 Annual net emission (ton CO2 eq./yr) 49, , ,330 Ave. ann. net emission (ton CO2 eq./ha/yr) Emission factors from aboveground biomass changes in the orangutan habitat were highest during (4.95 tco 2e/ha/yr). which is attributed to the degradation in some areas of the forest edges (see Figure 26 (c) and (d)). Sequestration in orangutan habitats was small ranging between tco 2e/ha/yr. The highest sequestration (1.38 tco 2e/ha/yr) took place in , during which the emission is the smallest (1.82 tco 2e/ha/yr ) resulting in the lowest net emission factor for that period (0.45 tco 2e/ha/yr). For the entire study area, the trends of emission factors show slight but persistent increase throughout (5.4 to 7.4 tco 2e/ha/yr). However, by taking into account the sequestration, the pattern changes: net emission factor
6 peaked during (4.9 tco 2e/ha/yr) and were low during and (see Figure 30). Figure 30. Emission factor and net emission factor based on aboveground biomass for Batang Toru study area and orangutan habitat Tripa The entire study area for Tripa covers an area of ha. In Tripa, the land cover is categorised into 1) undisturbed forest; 2) disturbed forest; 3) agroforest/vegetation mosaics; 4) oil palm; 5) crops (including rice fields); 6) shrubs and grass; 7) rural settlement; 8) cleared land; 9) water body; and 10) no data (cloud and shadow). The characteristics of the major land-cover types observed in the field can be seen in Annex 2. Time-series land-cover maps produced in this study can be seen in Error! Reference source not found.. The accuracy assessment was conducted by utilizing 62 groundtruth points on the 2009 map and the result indicates an accuracy level of 80.6% with the Khat statistics of 76.7% (at p= ) Land-cover types and the dynamics Land cover in Tripa in the beginning year of observation (1990) was dominated by forest. Since more than 70% of the forest is on peat soil and/or peat swamp, for the remaining discussion in this report, forest in Tripa mostly refers to these forest types. Forest covered ha (65% of the area) in 1990 and decreased to ha (18% of the total area) by The highest rate of forest conversion occurred with almost 4000 ha of forest being lost annually to other uses. The observed annual rate of forest loss during the four periods of observation are 2-14 % per year 14, with the highest (14 %) taking place during the period It applied the calculation of annual rate of deforestation by FAO (FAO, 1995)
.")
 was approximately 1770 ha per year.")

7 Other land uses, reflecting human activities (that is, agriculture and agroforestry) are growing in many parts of the study area. The largest and most intensive development is that of oil palm plantations which started to appear substantially in 1995 (5884 ha). From 2005 to 2009, plantation areas doubled from ha to ha, showing the highest annual rate of 4900 ha per year, which is the highest compared to rates in the other observation periods. The conversion from forest to oil palm in that period ( ) was approximately 1770 ha per year. Other anthropogenic land uses are growing in less expansive fashion, comprising seasonal crops such as paddy rice and agroforest, which are located in the northern and eastern fringes of the study area. The complete areas of changes of all the land-cover types in the Tripa study area are shown in table 31 Table 31Figure 32 (the ellipses) show those with largest changes during the observation periods. (a) (b) (c) (d) (e)
8 Figure 31. Land-cover maps of Tripa study area: (a) 1990; (b) 1995; (c) 2001; (d) 2005; (e) 2009 Table 31. Land-cover changes in Tripa study area, Land-cover type Area 1990 (ha) Area 1995 (ha) Area 2001 (ha) Area 2005 (ha) Area 2009 (ha) Undisturbed forest Disturbed forest Agroforest/vegetation mosaics Oil palm Crops Shrubs and grass Cleared land Others (settlement, water, no data) Figure 32. Changes in land cover in Tripa study area, (Legend: UF=Undisturbed Forest, DF=Disturbed Forest, AF-VM=Agroforest/Vegetation mosaics, OP=Oil Palm, Cr=Crops (incl. rice), Clr=Cleared land, Oth = others (settlement, water, no data)) Forest conversion in Tripa Leuser Ecosystem Zone Tripa Leuser Ecosystem Zone (Tripa KEL) map and Tripa HGU maps (YEL, pers. comm.) show an area of ha and ha respectively (see Figure 22(b)). The percentages of land-cover types within Tripa KEL for 1995 (prior to KEL establishment), 2001 (immediately after KEL establishment) and 2009 (most current situation) can be seen in Figure
9 Figure 33. Percentages of land-cover types in Tripa KEL for 1995, 2001 and 2009 In the mid-1990s, when most of the HGU concessions were issued (Minnimeyer, 2009), Tripa KEL was dominated by undisturbed forest (54%), followed by low density/disturbed forest (13%), while oil palm covered 4% of the area. Three years after KEL establishment, as shown by the 2001 landcover map, oil palm had expanded to ha (21% of Tripa KEL). By 2009, it grew to ha (39% of Tripa KEL), 6800 ha of which (9% of Tripa KEL) was conversion from previously undisturbed forest, despite the designation as Leseur Ecosystem Zone (KEL) (Figure 33 and Table 32)
10 Table 32. Matrix of land-cover trajectory in Tripa KEL in Tripa, Forest (ha) Agroforest/ mosaics (ha) Oil palm (ha) Crops (ha) Shrubs (ha) Cleared land (ha) Others (ha) Total 2001 Forest Agroforest/ mosaics Oil palm Crops Shrubs Cleared land Others Total By 2009, ha of forest (28% of the area) was left intact in Tripa KEL. Overall, the average rate of oil palm expansion since most HGU concessions were issued in the mid-1990s (1995 observation) to date (2009 observation) reached 1500 ha per year. By observing the period after KEL was established, that is, observation, oil palm expansion within Tripa KEL is only slightly lower: 1348 ha/yr. Specifically, conversion from forest to oil palm plantations involved 852 ha/yr in the period (see Table 32). The last period of observation ( ) showed the highest forest loss rate to oil palm plantations, 3300 ha/yr, as it covers the postconflict era Aboveground carbon-stock (AGCS) and emissions for Tripa The aboveground carbon reference for Tripa is listed in Table 28 (see also Component B of this report). The average carbon-stock density in Tripa decreased from 125 t/ha in 1990 to 52 t/ha in 2009 while for Tripa KEL, carbon density decreased from 158 t/ha in 1990 to 67 t/ha in 2009 (See Figure 34 and Figure 35). Figure 34. Carbon-stock density of Tripa study area and Tripa KEL (written as Tripa-LEZ in this figure)
 1990; (b) 1995; (c) 2001; (d)")


11 (a) (b) (c) (d) (e) Figure 35. Maps of aboveground carbon-stock in Tripa study area: (a) 1990; (b) 1995; (c) 2001; (d) 2005; (e) 2009 Throughout the periods of observation, annual emission rates owing to land-use conversion in the study area ranged between tco 2e/yr and 2.2 MtCO 2e/yr, with the highest (2.2 MtCO 2e/yr) being in the period By considering the aboveground carbon sequestration through land-use changes, the highest net emission rate was 2 MtCO 2e/yr, which occurred during For Tripa KEL, the annual emission was highest in , 1.43 MtCO 2 e/yr, and the lowest in ( tco 2 e/yr). And by taking into account the sequestration, the pattern is similar,
12 in which annual net emission rate was highest in (1.40 MtCO 2 e/yr) and the lowest in ( tco 2 e/yr). The complete list showing the portfolio of aboveground carbon emissions and sequestrations in Tripa is shown in Table 33. Table 33. Emission, sequestration and net emission from 1990 to 2009, based on aboveground carbon-stock changes in Tripa Emission: Study area Tripa study area Total emission (tco 2 e) Annual emission (tco 2 e /yr) Ave. ann. emission (tco 2 e/ha/yr) Sequestration Total sequestration (tco 2 e) Annual sequestration (tco 2 e /yr) Ave. ann. sequestration (tco 2 e/ha/yr) Net emission: Study area Total net emission (tco 2 e) Annual net emission (tco 2 e/yr) Ave. ann. net emission (tco 2 e/ha/yr) Emission Tripa KEL Total emission (tco 2 e) Annual emission (tco 2 e/yr) Ave. ann. emission (tco 2 e/ha/yr) Sequestration Total sequestration (tco 2 e) Annual sequestration (tco 2 e/yr) Ave. ann. sequestration (tco 2 e/ha/yr) Net emission Total net emission (tco 2 e) Annual net emission (tco 2 e/yr) Ave. ann. net emission (tco 2 e/ha/yr) The emission factor from aboveground biomass obtained from the average annual emissions for Tripa study area ranged between 9.2 and 21.6 tco 2e/ha/yr, while those for Tripa KEL ranged between 9.8 and 23.8 tco 2e/ha/yr. By taking into account the sequestration factor, the average annual net emissions, or net emission factor, for the entire study area were tco 2e/ha/yr, while for Tripa KEL they were tco 2e/ha/yr (see Table 33 and Figure 36). Comparing average annual emissions and average annual net emissions for both levels or analyses, the trends show no major discrepancy, that is, the lowest in (see Figure 36)
13 Figure 36. Emission factors and net emission factors for Tripa study area and Tripa KEL (called LEZ in this figure) (For dashed-circle, see discussion in section 4.4.1) 4.4 Discussion and conclusions Analyses of land-use and land-cover change in the vicinity of two habitats of Sumatran orangutan, Tripa and Batang Toru, showed dynamics of anthropogenic influences, albeit with different magnitudes and trends. Anthropogenic disturbances included massive forest land conversions in Tripa, while those in Batang Toru appeared to be mostly forest degradation, aside from the nonforest land-use dynamics in the surrounding areas. The sections below present summaries of the findings and associated discussions Batang Toru case study Unlike in Tripa, where pressure of forest conversion was on the core part of the study area, at the Batang Toru study site anthropogenic pressure was on the forest edges and buffer area around the forest. When focusing only on the core habitat area, forest cover was stable and small patches of anthropogenic land use (rubber agroforest), which had already appeared on the 1994 map, did not show any significant increase throughout the period of observation. Within the habitat areas, forest degradation had occurred as a result of logging activities, forest encroachment and dwelling settlement by migrants (YEL/SOCP, 2010 ; Roshetko et al., 2007a; Roshetko et al., 2007b). By including the 5-km-wide buffer area, as well as the strip of land-use mosaics between the habitats, the dynamics of anthropogenic land uses were observed in more obvious patterns. Forest degradation was larger and disturbed forest covered approximately 2 11% of the total forest area. For other land uses, rubber agroforest areas decreased slightly from 2000 to 2009, while mixed gardens increased slightly. From the overall dynamics of tree-based agroforest and mixed systems in the buffer area, there were no significant changes during the period of observation. When comparing emission factors for the two levels of analysis (entire study area and orangutan habitat), obvious differences appeared (Figure 30). For the study area, the sequestration factor was high in the last period of observation, resulting in a decreasing net emission factor. Such a trend did not occur for the orangutan habitats. With the low sequestration, the net emission is rather
14 similar to emission. The sequestration trend was captured through the land-cover changes occurring in the buffer area, implying increased carbon density outside core habitat areas through increased plantations and mixed gardens/complex agroforest converted from patches of shrubs and/or low density agroforest. The absence of a promising trend in the orangutan habitats, because of the low sequestration factor, should be carefully noted as being a limitation of the methodology applied. RaCSA applied stock difference methods, which only takes into account differences owing to land-use and landcover changes and does not take into account carbon sequestration or CO 2 removal through vegetation growth. The gain-loss method as described in IPCC (2006) is the appropriate method for the latter subject. Many mixed gardens, mostly identified as kemenyan gardens on the ground, owing to the very high canopy cover and the multi-strata vegetation, resembled forest cover canopy cover. Therefore, in some parts of the study area this land-cover type may be classified as forest. Such confusion could also occur between mixed gardens, rubber agroforest and plantations. A likelihood of mixed classification during image processing in the subset areas of mixed tree-based systems is quite high owing to the similarity in vegetation complexity and canopy covers (for example, Ekadinata et al., 2004). Even after including the more dynamic land cover in the buffer area, overall, the threat of forest conversion in Batang Toru area may be categorised as low. The stable carbon-stock density throughout the period of observation and the low emission factor from aboveground biomass confirm that conclusion. In comparison to the other orangutan habitat (Tripa), the aboveground carbon emission in Batang Toru was substantially lower. The stable agroforest and complex treebased systems within the buffer area may suggest an effective buffer function which, together with the topography, prevents the core area being converted from forest into intensive land uses Tripa case study For Tripa, the threat was clearly to the core of the study area where peat and peat swamp forests were threatened by, and converted to, oil palm plantations. Prior to the establishment of Leuser Ecosystem Zone (Kawasan Ekosistem Leuser or KEL) in 1998, the study area belonged to other land use (Area Penggunaan Lain) forest status. Even after KEL was established, oil palm plantations continued to expand, based on concession rights. Between 2001 and 2005, activity slowed presumably due to conflicts as shown in Table 14, but during the period 2005 to 2009, large expansion of oil palm plantations once again took place. Rapid economic development, following both post-tsunami reconstruction and post-peace agreement, that lead to the reactivation of forest clearance may be the reasons (PanEco, 2010). By observing land-cover changes in the entire Tripa study area and those in the core area (Tripa KEL and HGU areas), the pressure in the core area suggests an alarming magnitude and trend, especially with regards to forest conversion. The inclusion of Tripa into KEL did not seem to slow down the rate of expansion. The forest cover in the Tripa study area (2009 observation) was ha or 18% of the total area, ha of which is located within the Tripa KEL area. By applying the most recent rate of forest conversion to oil palm in Tripa KEL (3300 ha/yr; see section ) and assuming that oil palm expansion cannot be stopped through a protected area approach, the ha of forest left will likely be lost in the next 6 7 years, that is, by 2015/16. If
15 this happens, upon the issuance of further oil palm concessions rights or HGU, it is likely that in approximately 26 years ( ) peat and peat swamp forest in Tripa will have been completely wiped out. The period when carbon emissions were highest was , while the lowest was during The highest emission rate is attributed to the beginning of forest conversion to oil palm plantations. The lowest rate, during , confirms the slowing down of activities, as mentioned previously. Average annual net emission rate, or net emission factor, during showed a slight reduction for the entire study area compared to the trend for Tripa KEL (Figure 36). This rather positive trend for the Tripa study area as compared to Tripa KEL might be attributed to the fact that in the northern part (residual area outside Tripa KEL), oil palm expanded as non-forest conversion, mostly from other crops and low-density agroforestry systems. And owing to there being less carbon stored in those land uses, oil palm establishment implied a sequestration trend. This, nonetheles, inevitably means there was earlier forest conversion in that area prior to this project s observation. A future scenario that will keep the existing forest cover intact ( ha), if at all possible, will create a less bleak future for both carbon storage and orangutan habitat in Tripa. During the period of this project, anecdotal information revealed that approximately 6000 ha of peat forest in the south of the study area (see Figure 31) would be kept intact, as commited by the concession holder. However, in contrast to that, HGU concessions were still issued elsewhere during the past few years and land clearing for oil palm plantation was observed (YEL, pers.comm.; field observation, 2010). The distinction between oil palm expansion from forest and that from lower density vegetation cover is important to note for understanding carbon-stock loss as well as the loss of orangutan habitat. From a carbon-stock perspective, conversion from forest results in a carbon debt committed by a plantation s establishment, while conversion from lower density vegetation implies a sequestration trend. Assessments of the trajectory of land-use change for oil palm establishment are crucial because there is room to avoid carbon debt (ICRAF Southeast Asia Program, 2009). Nevertheless, while the latter notion is time-bound, relevant only for aboveground carbon stock and for oil palm establishment on mineral soils, it is more complicated in the Tripa case owing to the belowground carbon content in Tripa s peat soil and peat swamp ecosystem. Most of the land conversion in Tripa occurs on peat, which stores much higher carbon than what is stored in vegetation. Secondary sources show estimates of belowground carbon stock in Tripa peat to be as high as 2200 t/ha (Agus and Wahdini, 2008) and an average density of 1100 t/ha for Tripa KEL and 800 t/ha for the Tripa study area (Atlas). Although this report does not calculate loss of belowground carbon during the period of observation, reported clearances, peat fires and drainage of peat swamp forests (PanEco, 2010; PanEco, 2008) inevitably emit carbon from belowground in a much higher amount than from aboveground. However, the magnitude of the loss is still unknown. For peat in a different area (Meulaboh, Aceh), Handayani (2009) concluded that when opened and drained, thicker peat tends to emit lower CO 2 owing to lower fertility resulting in lower decomposition rate
16 5. Component D: Opportunity costs of emission reduction Meine van Noordwijk, Hesti L. Tata, Andree Ekadinata, Atiek Widayati, Elok Mulyoutami 5.1 Introduction Global concerns over the rate of climate change and the role of emissions from land-use change, in addition to those from the use of fossil fuels, have lead to international interest in, and support for, measures to reduce emissions from deforestation and degradation (REDD+). Being the country that over the past decade has the most emissions from land-use change, Indonesia is among the main targets for such policies. It has shown international leadership in articulating its national commitment to use local plus foreign investment to control and reduce emissions. In 2010, Indonesia signed a letter of intent with Norway to reduce emissions from both forest and peat lands, and appropriate institutional arrangements are currently being discussed. In deciding on priorities for investment, considerations of efficiency suggest that priority should be given to cases where potential emission reduction is high relative to funds invested. Costs of emission reduction can be grouped into three categories: 1) transaction and negotiation costs; 2) opportunity costs for foregone economic benefits that would have been associated with a business as usual pattern of land-use change; and 3) implementation costs. Of these cost categories, the opportunity costs are the most open to empirical analysis at this time; they are also likely to vary substantially between different types of land-use change. Our current analysis is therefore focused on such opportunity costs, without claiming that they will always be the dominant cost category; in fact, where opportunity costs are low the other cost types probably dominate and should be subject to further analysis; situations where the opportunity costs are high, however, can generally be excluded from the list as they are out of reach of economic instruments. Opportunity costs of avoided emissions (or abatement costs ) are estimated from the increase in profitability of land use that was achieved in a certain landscape over a certain time period, expressed per unit of emission of carbon dioxide (or its equivalent in the form of other greenhouse gasses). Every spatial unit ( pixel ) of land that undergoes land-use change contributes to a change in profitability (NPV after NPV before) which yields a cost (USD/ha) and a change in carbon stock (Cstock after Cstock before) which, after appropriate unit conversion, can be expressed as an emission (tonnes of carbon-dioxide equivalent per hectare or tco 2e/ha). The ratio of these two properties is expressed as US dollars per tonne of carbon-dioxide equivalent or USD/tCO 2e and is called the opportunity cost. If we do this for many units of land-use change we can obtain a frequency distribution of opportunity costs, each with an associated contribution to the total emissions from a landscape over a period of time. A cumulative representation of these ratios then becomes an opportunity cost curve. The method has been applied to analysis of landuse change in tropical forest margins in a number of countries (van Noordwijk et al., 2007a-d; Swallow and van Noordwijk, 2007; Swallow et al., 2007). There are several steps needed to do this analysis (Figure 37). a) Establish an appropriate land-use classification system that balances the limitations of empirical data (that tend to be coarse) and the relevance of distinctions between
 Estimate typical carbon stocks for each land-use type (Chapter 3 provides the basis for this).")
17 categories, either because they differ in profitability or they differ in carbon stocks (Chapter 2 provides the basis for this). b) Estimate typical carbon stocks for each land-use type (Chapter 3 provides the basis for this). c) Estimate net present values for each land-use type (Chapter 4 provides the basis for this): the ratio of costs and carbon stocks provides the opportunity cost intensity of every possible type of land-use change. d) Create a land-use change matrix (Chapter 4 provides the basis for this) to determine how much emission associated with each different opportunity cost actually occurred. Figure 37. Steps in deriving an opportunity cost (OpCost) curve that relates the changes in economic profitability (net present value) and typical carbon stocks of land-use (LU) systems, to a land-use change matrix that describes the changes that have occurred (for a retrospective OpCost curve) or might occur (for a scenario OpCost curve) A further step in the analysis provides a link to the current international policy debate on REDD+. The rules that have so far been negotiated for REDD+ (but at the time of writing there is no formal international agreement yet on the package as a whole) imply that only deforestation and forest degradation are to be included as emissions, with the plus (+) indicating potential carbon sequestration by increase of carbon stocks within the forest. To relate our landscapes of study to these emerging international rules and policies, we may need to know how much of the emissions refer to the various parts of the package, and how much would fall outside of the rules. A critical issue in this regard is the definition of forest : in international agreements, in Indonesian policies
18 and institutions, and in common parlance and understanding. As analysed by van Noordwijk and Minang (2009), there are considerable differences between these various concepts of forest. As well as forests with trees and non-forests without trees, there is land that belongs to the classes forests without trees and non-forests with trees. Such lands include mixed and multi-strata agroforestry (intermediate land uses) which can store significant quantities of carbon, but are outside of the institutional mandate of Indonesian forest authorities. Significantly, they are, or can be, within the internationally agreed forest concept (Ekadinata et al., 2010). Emissions from peat land that has lost its forest status are likely to be outside of the scope of REDD+, but they can be included in the Indonesia Norway bilateral agreements to reduce emissions from forest and peat. Internationally, there is discussion on the relevance and desirability of whole landscape carbon accounting that would use existing AFOLU (agriculture, forestry and other land use) reporting rules. In our current analysis we therefore start from all land-use change, without prejudice to the forest concept or concepts used in policy analysis, with opportunities for later selection of a subset of the land-use changes (and their emissions) for specific policy applications. The opportunity-cost analysis draws out several points. What volume of emission reduction could be possible at what cost (apart from transaction and implementation costs as discussed above). The easy wins and threshold cases depending on investment in emission reduction; helping a country or local government to integrate its economic growth with land-use changes and other local, national and global needs. It can provide a basis for negotiating fair compensation, that includes real benefits foregone and transaction costs. As presented here, the opportunity costs are only one of the cost component of overall design of emission reduction programs (or projects), and may be complemented by low-cost shifts in tenurial security (Gregersen et al., 2010; Akiefnawati et al., 2010). 5.2 Methods The opportunity-cost analysis was conducted in five steps (Figure 37). 1) Clarification and description of major land uses. 2) Calculation of time-averaged carbon stocks for the major land uses. 3) Calculation of the private and social profitability of the land uses in terms of discounted net present value. 4) Land-use characterization and land-use change analysis. 5) Processing the information into a two-dimensional graph charting the opportunity costs of avoiding deforesting land-use changes against volume of carbon-dioxide equivalent emissions
19 . For each change in time-averaged carbon stock, economic value per unit emission (USD/tCO 2e) was calculated. First, the change in net present value was calculated, with positive numbers representing increases in net present value. Second, the units of carbon were translated into units of CO 2, hence CO 2e (CO 2 equivalent). Third, the change in the number of units of time-averaged CO 2e was calculated, with positive numbers representing emissions of CO 2e. Finally, the economic value per unit emission of CO 2e was calculated as the change in net present value divided by the reduction in carbon stock measured in CO 2e. The curve that is generated by this analysis provides estimates of the average and marginal opportunity costs of emission reduction through avoided change. For comparison with sites of different sizes, the horizontal axis was transformed from cumulative CO 2e for the entire area to CO 2e per unit area by dividing the horizontal axis value by the size of the site. Software developed by World Agroforestry Centre (2009) 15, REDD Abacus, was used to generate the abatement cost curve. Some assumptions and limitations owing to lack of data were private net present value only; the establishment cost for land conversion was assumed to be similar for each pair; and the incentive for emission reduction/carbon price at farmgate was assumed to be USD 5/tCO 2e, leaving some space for transaction and implementation costs (Stern, 2007; Swallow et al., 2007). Metadata used for abatement cost analysis of land-use change in Tripa and Batang Toru ecosystem is shown in Table
20 Table 34. Land-use metadata, carbon stock and profitability No Land-cover/- use system Undisturbed forest Logged-over forest Rubber agroforest Carbonstock (t/ha) Min* Peat Mixed garden Industrial timber estate/ plantation Oil palm (estate) Oil palm (smallholder) Simple agroforestry (coffee, cacao) 93 Carbon Note Batang Toru measurement (mineral=min) and Tripa (peat swamp forest) Batang Toru measurement (min) and Tripa (peat swamp forest) Measurement conducted in Jambi Measurement conducted in salak agroforest in Batang Toru Measurement conducted in pine plots in Batang Toru Private-NPV (USD/ha) Min* Peat Measurement conducted in 7832 Riau and Central Kalimantan Settlement Cacao and coconut agroforest measurement in Tripa; coffee data from Lampung Averaged form measurements conducted in Lampung, Jambi and Kalimantan Livelihood Assumption Primary forest without any activity; private NPV is assumed to be 0 Logging activity under sustainable yield regime: result from Berau study Profitability analysis of rubber agroforest in Batang Toru Profitability analysis of kemenyan agroforest in Batang Toru Assumed to be the same as acacia plantation; value taken from Berau study Assumed to be same as for smallholder systems Profitability analysis of smallholder oil palm in Tripa Profitability analysis of cacao agroforest in Tripa; coffee agroforest in Batang Toru Assumed to be the same as cost of developing transmigration settlement; value taken from Berau study 10 Paddy rice 2 2 Derived from measurement conducted in Lampung Profitability analysis Batang Toru (Table 12) 11 Cleared land 1.5 Assumed to be equivalent with grass 0 Assumed as an intermediate system, future land use can be various 12 Shrubs and grass 22 Averaged form measurements conducted in Lampung, Jambi and Kalimantan 0 Assumed as an intermediate system, future land use is unclear 13 Secondary forest Measurements in Tripa 0 Forest recovery stage after fallow abandonment *: mineral soil Especially for Tripa, it was necessary to observe the magnitude of emission, hence opportunity cost incurred, if belowground emissions from peat areas were taken into account. For each of the land-use transitions, the peat emission was approximated from three major types of land-use conversion in peat soils (listed in Table 35) and deducted from the aboveground carbon-stock data
21 Table 35. Estimates of peat emissions in Tripa No Conversion type Peat emission estimate (tco 2e/ ha/yr) 1 Opening into oil palm plantation 30 2 Conversion into seasonal and perennial crops 5 3 Natural degradation into less dense vegetation and/or shrubs Results Trade-off curves The time-averaged carbon-stock data of the land-use systems can be compared with the profitability data as reflected in net present value. Figure 38 shows that there are broadly four clusters of points: 1) high carbon stock and low profitability; 2) medium carbon stock and medium profitability; 3) low carbon stock and high profitability; and 4) low carbon stock and low-to-medium profitability. The first three groups together determine a classical trade-off curve, where increases in profitability are directly associated with decreases in carbon stock. The presence of the fourth group, however, shows that there are opportunities to enhance profitability without incurring further loss of carbon at landscape scale (by conversion from group 4 to groups 2 or 3). Figure 38. Trade-off between profitability (net present value = NPV) and typical carbon stock of the land-use systems encountered in Tripa and Batang Toru (details in Table 34 )
 and the oil palm (group 3) the slope of the line represents an opportunity cost of slightly over 10 USD/ tco 2e.")
22 The negatively sloping line in Figure 38 can be expressed as an opportunity cost (USD/tCO 2e). Between the natural forest (in group 1) and the oil palm (group 3) the slope of the line represents an opportunity cost of slightly over 10 USD/ tco 2e. Only a few conversions (lines connecting points in the graph) will have a steeper slope, implying a higher opportunity cost. The land-use change pattern expressed in these four groups differs strongly between the Batang Toru landscape and Tripa. Batang Toru is characterised by relatively slow change, a small but declining fraction in the medium carbon and medium profitability class and a small, but slowly increasing, fraction of high-profitability and low-carbon land uses. Tripa shows a rapid shift from high-carbon and low-profitability to low-carbon and high-profitability land use, with approximately steady fractions of the two intermediate categories (Figure 39). Figure 39. Land-use change patterns with time in Batang Toru and Tripa in the four groups of land uses, classified by carbon stock and profitability as in Figure Land-use change matrices The land-use change data of this section can now be summarised in a four-group format (Figure 40). The main diagonal represents the no-change fractions of the land use, showing that in Batang Toru 47.6% stayed in the high carbon and low profitability state over the period and 30.9% in low carbon and low-to-medium profitability. For Tripa, these percentages are only 13.8 and 6.4, respectively. The cells above the main diagonal represent changes towards higher profitability and lower carbon stock: a total of 20.7% in Batang Toru and 65.4% in Tripa. Cells below the main diagonal represent the opposite trend, which is rare in both landscapes (0.5 and 2.6%, respectively, and potentially due to errors of classification). Combining the opportunity cost intensity data and the emission totals for the two landscapes, we can now derive the OpCost curves
) and 7.")
23 Figure 40. Land-use transition matrices from 1994 (row) to 2009 (column) for the four classes of land use in the Batang Toru and Tripa landscapes OpCost curves for Batang Toru The total aboveground carbon emissions from the Batang Toru landscape were calculated to range from 5.2 tco 2e/ha/yr during (Figure ʑ 41(a)) and 7.4 tco 2e/ha/yr during period (Figure 41(c)). The dominant change, and the higest emission contributor, has been the change from undisturbed forest to disturbed forest, which reflects logging and other timber extraction activities in parts of the forest. Logging, however, is calculated to have an opportunity costs of 8.3 USD/tCO 2e, above the threshold price. On average, about half of the emissions in Batang Toru occurred at an opportunity cost below this threshold, with the highest proportion, 79.7%, in the period


 2001 2006; c)")
24 (a) (b) Figure 41. Abatement-cost curves for CO 2 emissions in Batang Toru: a) ; b) ; c)
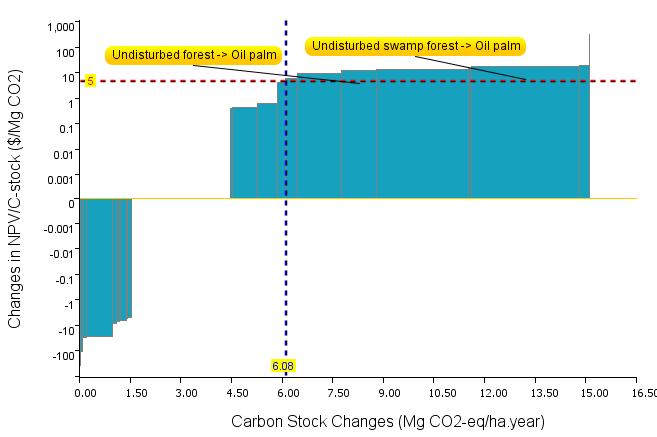
25 5.3.4 OpCost curves for Tripa Total aboveground emissions in Tripa (Figure 42) were substantially higher than those in Batang Toru, ranging from 9.0 tco 2e/ha/yr, in the period of (Figure 42(c)), to 21.5 tco 2e/ha/yr in the period (Figure 42(a)). In all periods of analysis, forest conversion to oil palm plantation produces the largest component of emissions. The pattern of land-use change in Tripa was dominated by conversion of undisturbed forest, including peat swamp forest, to oil palm plantations and smallholder oil palm. Forest opening and conversion for agricultural purposes and settlements were mostly associated with transmigration, which brought in the labour that allowed the concessions to operate. The opportunity cost of conversion of natural forest and natural swamp forest conversion to oil palm plantations ranged from USD 10.5/tCO 2e to USD 17/tCO 2e. Using the threshold of 5 USD/tCO 2e, the emissions from land-use conversion that could have been avoided range between 6 tco 2e to 14.6 tco 2e in the periods of studied. The highest proportion of emissions that could have been avoided occurred in the period (67.7%, totaling 14.6 tco 2e), while the lowest was during (40%, totaling 6.1 tco 2e). If data for belowground emissions were to be added, a much larger fraction of all emissions would fall below the USD 5/tCO 2e threshold, given the frequency of peat soils in this landscape
 - 79")

26 (a) (b) (c)
, the average annual emission from Tripa (5.")
27 (d) Figure 42. Abatement-cost curves for CO 2 emissions in Tripa: a) ; b) ; c) ; d) Discussion Comparing the cumulative emissions in Batang Toru and Tripa for all of the periods of observation (Figure 43), the average annual emission from Tripa (5.7 tco 2e) was higher than that of Batang Toru (4.2 tco 2e). Dominant conversion due to oil palm development in Tripa, while in Batang Toru with logging dominating carbon loss but also conversion to low-to-medium profitability land uses. Venter et al. (2009) suggested that the cost of avoiding forest conversion is between USD 10 USD 33/tCO 2 based on oil palm plantation establishment cases in Kalimantan. Compared to that, the opportunity costs for similar conversions in Tripa and Batang Toru are considerably lower


28 (a) (b) Figure 43. Abatement-cost curves for CO 2 emissions throughout the entire period of analysis ( ): a) Batang Toru; and b) Tripa For Tripa, the abatement-cost curve, with peat emission taken into account, for the entire observation period ( ) is shown below (Figure 44)
 in Tripa Average emission was 20 tco 2e/ha/yr, 28.")
29 Mineral soils Peat soils Figure 44. Abatement-cost curves for CO 2 emissions of peat and mineral soil throughout the entire period of analysis ( ) in Tripa Average emission was 20 tco 2e/ha/yr, 28.5% higher than the figure when only aboveground emission was taken into account and five times higher than in Batang Toru. The amount of aboveground plus peat that could be compensated (7.02 tco 2e/ha/yr) is higher compared to aboveground emission only (3.7 tco 2e/ha/yr). As a fraction of the total emission, it is smaller (only 35% of 20 tco 2/ha/yr) compared to aboveground only (65% of 5.7 tco 2/ha/yr). In conclusion, threats from forest conversion and degradation in two Sumatran orangutan habitats, Tripa and Batang Toru, show different magnitudes and patterns, which implies different levels of opportunity cost of avoiding forest conversion in the two landscapes. The opportunity cost for the dominant forest conversion/disturbance pattern in Tripa (oil palm establishment) is similar to that for logging as the major cause of carbon loss in Batang Toru, but in the Batang Toru landscape avoiding conversion of land use of relatively low profitability will incur a lower opportunity cost. When peat emission was taken into account for Tripa, in comparison with Batang Toru the pattern remained the same, although clearly the magnitude of emission was higher and the emission fraction that could have been avoided with the assumed carbon price was thus lower. It may appear, however, that transaction and implementation costs for avoiding logging or oil palm conversion, which are dependent on permits issued by local governments, may be lower than those for the smallholder-(and migrant-)lead conversions that have a lower opportunity cost. Differences in total REDD+ costs may be smaller than the current graphs show. Conserving the habitat of orangutan where forest can be converted into profitable land uses such as oil palm plantation entails a relatively high opportunity cost. In a carbon market that is purely driven by efficiency, there may be other, lower cost opportunities. Orangutan conservation is unlikely to emerge as a co-benefit from interventions that are primarily aimed at low-cost emission reduction. If, however, orangutan conservation is a primary rationale for external investment in the two landscapes under consideration, there will be emission reductions as a cobenefit
30 6. Component E: Scenario analysis of land-use change: baselines and expected project impacts at landscape level Rachmat Mulia, Andree Ekadinata, Zuraidah Said, Yuliana C Wulan, Elok P Mulyoutami, Betha Lusiana and Meine van Noordwijk 6.1 Introduction Land-use change is the end result of complex decision making at multiple scales. Land-use planning tries to influence these decisions to achieve landscape change that is aligned with some overall goals. However, successful land use planning can only occur if the decision makers of a business as usual trajectory pay attention to the recommendations and subsequently adjust their decisions either spatially (redirecting investment to areas that better match overall goals) or sectorally (switching to other types of activities). A good understanding of how current decisions are made and the type of factors that will actually influence the behavior of decision makers is thus needed to make land-use planning more effective, beyond producing beautiful e colourfulpieces of paper on the walls of planners offices. One approach to achieve this is to make land-use planning more participatory, to encourage sense of ownership and responsibility among stakeholders involved in the planning during implementation phase. However, with the large number of stakeholders and possibility of conflicting interests among stakeholders, participatory land-use planning is not an easy process. Commitment to the final outcome may remain uncertain. Another, potentially complementary, approach is the use of multi-agent models that apply and include the logic that decision makers use during the many small-step decisions that jointly cause land-use change. As reviewed by Villamor et al. (2010), most of the currently available multi-agent models assume a basic economic logic of maximising expected utility at interaction level, within the agent-specific constraints of opportunity. The FALLOW model (van Noordwijk, 2002; Suyamto et al., 2009), as a hybrid between system-dynamic and agent-based models, is explicitly considering knowledge of agents as a constraint and as a dynamic property in learning landscapes. Among the various models available, it may be most suited for exploration of land-use change in complex landscape mosaics without requiring a huge investment in prior data collection and parameterization. In large parts of Indonesia the drivers of land-use change often involve (a) smallholders linked to local communities (either with an historical link to the land or more recently initiated, as in transmigration projects); (b) spontaneous migrants originating in other landscapes but seeking opportunities to make a living, either by opportunistic extractive activities or by setting up new farms; (c) government-sanctioned large-scale plantations, often reliant on external labour sources that are brought to the landscape for the duration of a contract; d) forest authorities who legitimise extractive activities (logging) and/or impose conservation of watersheds and/or biodiversity; (e) development of physical infrastructure that influences access to markets and/or
31 processing plants for products derived from forests, agriculture or intermediate forms of agroforestry. If left to its own course, the change brought by driver (a) alone will be gradual, but interaction with drivers (c) and (d) can accelerate change. Change can further accelerate if combined with opening up the area for (b) and (e) through erosion of traditional rights and community control. For a complex system where many components and interactions between them influence the output, a simulation model is particularly useful to gather all information and knowledge related to the system, and provides outputs for the basis of prospection. Although all hypotheses can be tested by directly establishing experiments and making observations in the field, this certainly requires a lot of resources, time and energy. The world may have moved on before results are available. At the very initial stage, an experiment should be based on a sound and sensible hypothesis that reflects current understanding of processes and local context. Statistical methods for testing hypothesis are widely available and a simulation model can help to shape sensible hypothesis by testing their quantitative outputs resulting from a prospective study. Based on the model s outputs, a new, more reasonable hypothesis might be formulated for implementation. A dynamic land-use model must try to incorporate key features of all five agents mentioned above (local smallholders, spontaneous migrants, government-sanctioned large-scale plantations, forest authorities and development of physical and economic access to markets) and their basic interactions. The FALLOW model does allow a step-wise increase in complexity of the systems considered, building up from local land-use agents. Large-scale plantations have permits that specify the agricultural products in which they invest and their decision frame is a long term one. Farmers who manage relatively small plots can change more dynamically, but will have individual variation in the way decisions are made. Conservative farmers might be reluctant to change their farming system and products because they follow a tradition inherited within their family, but many farmers are sensitive to current profit information and may be inclined to shift their farming system. The experience provided by both large-scale plantations and farmer-innovators will lead to a knowledge base that influences the future landscape mosaic. The central or local government can surely influence the orientation of farmers decisions through policy around prices, subsidies and/or extension availability. The final decision, however, is still in the farmers hands related to which land-use option they would like to exert in current and subsequent years. As part of a study of land-use change in two areas in northern Sumatra that serve both as orangutan habitat and as source of human livelihoods, the Tripa swamps along the western coast of Aceh and the Batang Toru watershed forests in North Sumatra, we developed two applications of the FALLOW model to 1) check our current understanding of land-use change in the areas; 2) extrapolate current trends to a business as usual scenario; and 3) explore future change options based on various scenarios that include availability of knowledge, prices and price differentials, land-use rules that are enforced, changes in behavior of large-scale actors and constraints on immigration
 to simulate land-cover change at landscape level driven by farmers decisions on labour and land allocation.")
32 6.2 Materials and method FALLOW model The FALLOW (Forest, Agroforest, Low-value Lands Or Waste?) model was designed (van Noordwijk, 2001, 2002; Suyamto et al., 2009) to simulate land-cover change at landscape level driven by farmers decisions on labour and land allocation. Initially constructed for simulation of a simple 10x10 cell landscape, the model can now handle input maps obtained from Landsat satellite images. The default plot size is 1 ha with possible modification depending on the objective of the study and adjustments to input parameters. The current model version (Figure 45, Figure 46) is integrated with the pc-raster simulation language and a visual basic model for a user-friendly interface. The model has been used for prospecting future landscape mosaic in different regions in Indonesia, for example, Lamandau (Central Kalimantan) and Arongan Lambalek (West Aceh). Basically, FALLOW considers various external drivers that can influence farmers to make decisions related to their current and future livelihood options. These include both biophysical and social economic aspects for example: i) market mechanisms and relevant regulation interventions articulated through, for example, commodity prices, costs and harvesting labour productivities; ii) development programs, articulated through extension, subsidies, infrastructures (settlements, road, market, processing factories) and land-use productivities; and iii) conservation programs, articulated through forest reserves as prohibited zones for farmers. Farmers consider all these factors to make decisions on labour and land allocation and their impacts on both the economic and ecological prosperity of people living in the landscape area are measured. A detailed description of the model is given by van Noordwijk (2001, 2002) and Suyamto et al. (2009). Figure 45. Design of the FALLOW model with an outer ring of external driving factors of local change and four core modules (see Figure 46) that relate farmers decision-making to a spatial pattern of land-use change with consequences for productivity and households
 in")
33 Figure 46. The four core modules that represent the primary interactions within FALLOW Development strategies or decisions by farmers can be compared with current trend (Business As Usual condition or BAU) in terms of both economic and ecological performance (Figure 47): four possible directions can be tentatively labeled Conservation and Red development which bring improvement in only ecological and economical aspect, respectively, Green development which achieves both and Collapse which implies decline in both dimensions
Who? How, what? Why? Where, when? Who cares? So what? Negotiation-support toolkit for learning landscapes WORLD AGROFORESTRY CENTRE
 Who? Why? How, what? Who cares? So what? Where, when? Negotiation-support toolkit for learning landscapes WORLD AGROFORESTRY CENTRE Southeast Asia Regional Program Mulia R, Lusiana B and van Noordwijk
Landscape-level analysis of
 1. ICRAF Landscape-level analysis of 2 CIFOR 3. AARD 4. Brawijaya abatement costs in three provinces of Indonesia Meine van Noordwijk 1, Sonya Dewi 1, Daniel Murdiyarso 2, Suseno Budidarsono 1, Andree
1.2 If we cannot define it, we cannot save it
 1.2 If we cannot define it, we cannot save it Meine van Noordwijk and Peter Akon Minang Introduction In the discussions on reducing emissions from forests and other aspects of land use, the negotiators
ALLREDDI. Institutionalising emissions reduction as part of sustainable development planning at national and sub-national levels in Indonesia
 Brief 04 ALLREDDI ALLREDDI Accountability and Local Level Initiative to Reduce Emission from Deforestation and Degradation in Indonesia Institutionalising emissions reduction as part of sustainable development
Data availability for landscape level REL: Reflections
 Data availability for landscape level REL: Reflections Peter A Minang World Agroforestry Centre (ICRAF) & ASB Partnership For the Tropical Forest Margins World Bank, Washington DC, January 26 2015 What
Reduce Emission from All Land Uses - REALU
 Opportunity Cost Analysis as a negotiation tool for REDD ------------- Opportunity and Challenges in Vietnam Hoang Minh Ha and Do Trong Hoan, ICRAF Vietnam with data inputs from Forestry and GDLA/MONRE
An Economic Framework for Analyzing Forest Landscape Restoration Decisions
 1. Introduction An Economic Framework for Analyzing Forest Landscape Restoration Decisions Landscape restoration is an opportunity for communities to restore the ecosystem goods and services once provided
A Framework for Analyzing Forest Landscape Restoration Decisions. CBD Training
 A Framework for Analyzing Forest Landscape Restoration Decisions CBD Training 1 1. Introduction Landscape restoration is an opportunity for communities to restore the ecosystem goods and services once
Village level analyses of poverty and land use/cover in West Aceh Sonya Dewi, Andree Ekadinata, Danan Prasetyo Hadi
 Village level analyses of poverty and land use/cover in West Aceh Sonya Dewi, Andree Ekadinata, Danan Prasetyo Hadi I. Background How people use land is always an integral question to ask in order to understand
25 th ACRS 2004 Chiang Mai, Thailand 551
 25 th ACRS 2004 Chiang Mai, Thailand 551 RUBBER AGROFOREST IDENTIFICATION USING OBJECT-BASED CLASSIFICATION IN BUNGO DISTRICT, JAMBI, INDONESIA Andree Ekadinata, Atiek Widayati and Grégoire Vincent World
Sparing vs. Sharing: Addressing drivers of df deforestation tti and forest tdegradationd 8 June 2011, Bonn
 Sparing vs. Sharing: Addressing drivers of df deforestation tti and forest tdegradationd 8 June 2011, Bonn Reflections on current evidence on the sharing hypothesis, global (e.g. wildlife farming) and
Indonesia has made a serious
 BRIEF No. 35 Local Mitigation Actions Supporting the Low Emission Development Plan in Kutai Barat District, Indonesia Initial Process Indonesia has made a serious commitment to reduce emissions in order
Indonesia's land-use and land-cover changes and their trajectories (1990, 2000 and 2005) Photo: Jusupta Tarigan
 Photo: Jusupta Tarigan") Brief 01 ALLREDDI ALLREDDI Accountability and Local Level Initiative to Reduce Emission from Deation and Degradation in Indonesia Indonesia's -use and -cover changes and their trajectories (1990, 2000
Brief 01 ALLREDDI ALLREDDI Accountability and Local Level Initiative to Reduce Emission from Deation and Degradation in Indonesia Indonesia's -use and -cover changes and their trajectories (1990, 2000
1.2 Deforestation-free claims: scams or substance?
 1.2 Deforestation-free claims: scams or substance? MEINE VAN NOORDWIJK, SONYA DEWI, PETER MINANG and TONY SIMONS Introduction Zero deforestation, deforestation free, carbon neutral, climate smart there
REDUCING EMISSIONS FROM PEATLAND DEFORESTATION AND DEGRADATION: CARBON EMISSION AND OPPORTUNITY COSTS
 REDUCING EMISSIONS FROM PEATLAND DEFORESTATION AND DEGRADATION: CARBON EMISSION AND OPPORTUNITY COSTS Fahmuddin Agus 1), Suyanto 2), Wahyunto 3) and Meine van Noordwijk 2) Fahmuddin Agus n Soil Research
WHY INDONESIA'S FORESTRY SECTOR IS NOT SUSTAINABLE July 25 th 2014 CONFERENCE PRESENTATION
 WHY INDONESIA'S FORESTRY SECTOR IS NOT SUSTAINABLE July 25 th 2014 CONFERENCE PRESENTATION CONTENTS State of Indonesian Forests Challenges Opportunities and key enablers STATE OF INDONESIAN FOREST INDONESIA
Indonesia. Landscape Factsheet
 Indonesia Landscape Factsheet In Indonesia, through an integrated approach, we drive sustainable commodity production, livelihood improvement and forest conservation in several landscapes. In Aceh, our
Fahmuddin Agus Indonesian Soil Research Institute Jl. Tentara Pelajar, No. 12, Cimanggu, Bogor 16114, Indonesia
 Fahmuddin Agus Indonesian Soil Research Institute Jl. Tentara Pelajar, No. 12, Cimanggu, Bogor 16114, Indonesia f_agus@litbang.pertanian.go.id MARCO Symposium 2015 Tsukuba International Congress Center,
Biodiversity of landscape mosaics (Jean-Laurent Pfund)
") Biodiversity of landscape mosaics (Jean-Laurent Pfund) Rapid agrobiodiversity appraisal in the context of environmental service rewards RABA (Susilo Ady Kuncoro) Birds in a coffee agroforestry landscape
Biodiversity of landscape mosaics (Jean-Laurent Pfund) Rapid agrobiodiversity appraisal in the context of environmental service rewards RABA (Susilo Ady Kuncoro) Birds in a coffee agroforestry landscape
(R)EDD monitoring by WWF Indonesia WWF data contained in this presentation is not yet published, Please keep this for your eyes only.
EDD monitoring by WWF Indonesia WWF data contained in this presentation is not yet published, Please keep this for your eyes only.") (R)EDD monitoring by WWF Indonesia WWF data contained in this presentation is not yet published, Please keep this for your eyes only. ALOS K&C9 meeting, 24 January 2008 Yumiko Uryu Consultant to WWF yumuryu@yahoo.com
(R)EDD monitoring by WWF Indonesia WWF data contained in this presentation is not yet published, Please keep this for your eyes only. ALOS K&C9 meeting, 24 January 2008 Yumiko Uryu Consultant to WWF yumuryu@yahoo.com
Submission by the International Centre for Research in Agroforestry (ICRAF) To the UNFCCC
 To the UNFCCC") Submission by the International Centre for Research in Agroforestry (ICRAF) To the UNFCCC Issues relating to reducing emissions from deforestation in developing countries In accordance with the invitation
Submission by the International Centre for Research in Agroforestry (ICRAF) To the UNFCCC Issues relating to reducing emissions from deforestation in developing countries In accordance with the invitation
Way Tenong and Sidrap: Tree Planting and Poverty Alleviation, Indonesia
 Case Study 10 Way Tenong and Sidrap: Tree Planting and Poverty Alleviation, Indonesia Desi Ariyadhi Suyamto, Meine van Noordwijk, Betha Lusiana, Andree Ekadinata World Agroforestry Centre, Southeast Asia
Economic Analysis of Improved Smallholder Rubber Agroforestry Systems in West Kalimantan, Indonesia - Implications for Rubber Development
 Economic Analysis of Improved Smallholder Rubber Agroforestry Systems in West Kalimantan, Indonesia - Implications for Rubber Development Yuliana Cahya Wulan Suseno Budidarsono Laxman Joshi SSLWM: Linking
Integrative, Inclusive and Informed Planning for Green Growth. Sonya Dewi
 Integrative, Inclusive and Informed Planning for Green Growth Sonya Dewi International Conference and Congress of The Indonesian Society of Agricultural Economics ICC-ISAE New Social Economics of Sustainable
Policybrief. Land-use planning for low-emission development strategies (LUWES)
") Policybrief 35 Land-use planning for low-emission development strategies (LUWES) Land-based, climate-change mitigation actions that are pro-poor and oriented towards green development need spatially explicit
Policybrief 35 Land-use planning for low-emission development strategies (LUWES) Land-based, climate-change mitigation actions that are pro-poor and oriented towards green development need spatially explicit
ASSESSING THE PROSPECTS FOR CARBON SEQUESTRATION IN THE MANUPALI WATERSHED, PHILIPPINES
 RESEARCH BRIEF Sustainable Agriculture & Natural Resource Management Collaborative Research Support Program 2003 No. 13 ABOUT SANREM S mission is to assist in the analysis, creation and successful application
Emission Reduction Program in Indonesia: A District-wide Approach to REDD+
 Emission Reduction Program in Indonesia: A District-wide Approach to REDD+ Agus Sari Chair, Working Group on Funding Instruments Presidential Task Force on REDD+ Paris,France, June 23, 2013 WWF-Indonesia
ESTIMATION OF ABOVE GROUND CARBON STOCKS AT LAND-USE SYSTEM IN KUNINGAN REGENCY
 Journal of Forestry and Environment 01 (2018) 7-11 Journal Homepage: https://journal.uniku.ac.id/index.php/forestry-and-environment ESTIMATION OF ABOVE GROUND CARBON STOCKS AT LAND-USE SYSTEM IN KUNINGAN
REDD+ Pilots and Landscape Approach. Herry Purnomo Scientist at CIFOR Professor at Bogor Agricultural University
 REDD+ Pilots and Landscape Approach Herry Purnomo Scientist at CIFOR Professor at Bogor Agricultural University Forest Carbon Partnership Facility & Indonesia Ministry of Forestry June 2-4, 2014 Jakarta,
Narration: In this presentation you will learn about the basic concepts of carbon accounting and the
 1 Narration: In this presentation you will learn about the basic concepts of carbon accounting and the different methods used in it. You will learn the general concepts, elements and approaches of carbon
Community Forest Management in the Heart of Borneo
 Community Forest Management in the Heart of Borneo Briefing Note 2: Reducing Emissions from Deforestation and Forest Degradation Community forest management can play an important role in Indonesia s efforts
Project Report. Carbon Emissions from Land Use, Land Use Change and Forestry (LULUCF) in Berau District East Kalimantan, Indonesia
 in Berau District East Kalimantan, Indonesia") Carbon Emissions from Land Use, Land Use Change and Forestry (LULUCF) in Berau District East Kalimantan, Indonesia Project Report Are conditional and realistic REDD mechanisms feasible in Berau district,
Carbon Emissions from Land Use, Land Use Change and Forestry (LULUCF) in Berau District East Kalimantan, Indonesia Project Report Are conditional and realistic REDD mechanisms feasible in Berau district,
Forestry and Climate Change Fund
 Forestry and Climate Change Fund Forestry and Climate Change Fund Our founding shareholders: In partnership with: forestry and land use Value Creation From the Ground up Tropical forests are vitally important
Integrated landscape approach
 Integrated landscape approach Terry Sunderland Ani Adiwinata Nawir Capacity-building workshop for South East Asia on ecosystem conservation and restoration to support achievement of the Aichi Biodiversity
PROJECT INFORMATION DOCUMENT (PID) IDENTIFICATION/CONCEPT STAGE Report No.: PIDC103763
 IDENTIFICATION/CONCEPT STAGE Report No.: PIDC103763") PROJECT INFORMA DOCUMENT (PID) IDENTIFICA/CONCEPT STAGE Report No: PIDC103763 Project Name Region Country Financing Instrument Project ID Borrower Name Implementing Agency Environmental Category Date PID
PROJECT INFORMA DOCUMENT (PID) IDENTIFICA/CONCEPT STAGE Report No: PIDC103763 Project Name Region Country Financing Instrument Project ID Borrower Name Implementing Agency Environmental Category Date PID
What works in Climate Change? Greening REDD
 What works in Climate Change? Greening REDD Thomas C. Heller Climate Policy Initiative October 2011 BEIJING BERLIN RIO DE JANEIRO SAN FRANCISCO VENICE +1 415 230 0790 235 Montgomery St. 13th Floor San
Berau Forest Carbon Program / BFCP
 A Hope we can believe in REDD+ Implementation in Berau, Indonesia Berau Forest Carbon Program / BFCP Lessons Learned from the Field Dicky Simorangkir TNC Indonesia TNC Indonesia Forest - Program global
REDD Methodological Module. Estimation of the baseline rate of unplanned deforestation
 REDD Methodological Module Estimation of the baseline rate of unplanned deforestation Version 1.0 April 2009 I. SCOPE, APPLICABILITY, DATA REQUIREMENT AND OUTPUT PARAMETERS Scope This module provides methods
REDD+: Is it sufficient for Forest Solution? Zulfira Warta (WWF 156 Indonesia)
") REDD+: Is it sufficient for Forest Solution? Zulfira Warta (WWF 156 Indonesia) The presentations before already talked a lot about the national mechanism, MRV and the work that has been done. My presentation
REDD+: Is it sufficient for Forest Solution? Zulfira Warta (WWF 156 Indonesia) The presentations before already talked a lot about the national mechanism, MRV and the work that has been done. My presentation
Peatland degradation fuels climate change
 Peatland degradation fuels climate change Peatland degradation fuels climate change An unrecognised and alarming source of greenhouse gases November 2006. Government representatives from almost all countries
Reduced deforestation in developing countries as a means for combating global climate change
 Reduced deforestation in developing countries as a means for combating global climate change Brent Swallow Global Coordinator, ASB Partnership for the Tropical Forest Margins World Agroforestry Centre
Enhancing the Future of Indonesia Palm Oil With Sustainable Landscape Project
 Enhancing the Future of Indonesia Palm Oil With Sustainable Landscape Project Lim Sian Choo Bumitama Palm Oil: Indonesia s Biggest Export $17.8 B Export Value in 2016 12.3% from total export value $16.5
Standard Methods for Estimating Greenhouse Gas Emissions from Forests and Peatlands in Indonesia
 Standard Methods for Estimating Greenhouse Gas Emissions from Forests and Peatlands in Indonesia (Version 2) Chapter 4: Standard Method Forest Management Events and Regimes MINISTRY OF ENVIRONMENT AND
CHAPTER SIX SOCIO-CULTURAL IMPACTS OF OIL PALM PLANTATIONS
 CHAPTER SIX SOCIO-CULTURAL IMPACTS OF OIL PALM PLANTATIONS Government programs that do not incorporate the interests of local people as in the oil palm and transmigration programs have accumulated resentments
Greenhouse Gas (GHG) Status on Land Use Change and Forestry Sector in Myanmar
 Status on Land Use Change and Forestry Sector in Myanmar") Greenhouse Gas (GHG) Status on Land Use Change and Forestry Sector in Myanmar CHO CHO WIN ASSISTANT RESEARCH OFFICER FOREST RESEARCH INSTITUTE YEZIN, MYANMAR International Workshop on Air Quality in Asia-Impacts
Greenhouse Gas (GHG) Status on Land Use Change and Forestry Sector in Myanmar CHO CHO WIN ASSISTANT RESEARCH OFFICER FOREST RESEARCH INSTITUTE YEZIN, MYANMAR International Workshop on Air Quality in Asia-Impacts
ROADMAP FROM REL TO MRV IN BERAU: LESSONS FOR REDD+ ESTABLISHMENT ALFAN SUBEKTI THE NATURE CONSERVANCY
 ROADMAP FROM REL TO MRV IN BERAU: LESSONS FOR REDD+ ESTABLISHMENT ALFAN SUBEKTI THE NATURE CONSERVANCY WORKSHOP ON METHODS FOR BIOMASS ESTIMATION AND FOREST COVER MAPPING IN THE TROPICS Samarinda, November
Socio-ecological production landscapes, Agroforestry and the Satoyama Initiative
 Socio-ecological production landscapes, Agroforestry and the Satoyama Initiative Dennis Garrity, Director General Roberto Porro, Latin America Regional Coordinator World Agroforestry Centre (ICRAF) World
2014REDD302_41_JCM_PM_ver01
 Joint Crediting Mechanism Proposed Methodology Form Cover sheet of the Proposed Methodology Form Form for submitting the proposed methodology Host Country Indonesia Name of the methodology proponents Mitsubishi
Forests in a changing world challenges and opportunities. Prof. Markku Kanninen University of Helsinki
 Forests in a changing world challenges and opportunities Prof. Markku Kanninen University of Helsinki 1 Trends in forests During the last 40 years Deforestation: 500 M Ha Consumption of forest products:
PROCEEDINGS THE 2 ND INTERNATIONAL SYMPOSIUM OF INDONESIAN WOOD RESEARCH SOCIETY
 ISBN : 978-979-96348-8-7 PROCEEDINGS THE 2 ND INTERNATIONAL SYMPOSIUM OF INDONESIAN WOOD RESEARCH SOCIETY Developing Wood Science and Technology to Support the Implementation of Climate Change Program
Agroforestry: a productivity and resilience booster
 Agroforestry: a productivity and resilience booster Who are we? One of the 15 CGIAR research centres employing about 500 scientists and other staff. We generate knowledge about the diverse roles that trees
BASELINES, PERMANENCE AND LEAKAGE IN REDD
 BASELINES, PERMANENCE AND LEAKAGE IN REDD Willy R. Makundi Consultant / Scientist Environmental Management Consultants Moshi, Tanzania / Environmental Energy Technologies Division, Lawrence Berkeley National
The Indonesian-Norway cooperation on REDD+ (Slow, Halt & Reverse deforestation) World Bank, Washington DC, January 19, 2011 Fred Stolle People and
 World Bank, Washington DC, January 19, 2011 Fred Stolle People and") The Indonesian-Norway cooperation on REDD+ (Slow, Halt & Reverse deforestation) World Bank, Washington DC, January 19, 2011 Fred Stolle People and Ecosystem Program WRI Main Messages Future of Indonesian
The Indonesian-Norway cooperation on REDD+ (Slow, Halt & Reverse deforestation) World Bank, Washington DC, January 19, 2011 Fred Stolle People and Ecosystem Program WRI Main Messages Future of Indonesian
Securing Soil Carbon Benefits. UNEP Year Book 2014 emerging issues update
 2012 emerging environmental issue The benefits of soil carbon: managing soils for multiple economic, societal and environmental benefits UNEP Year Book 2014 emerging issues update Securing Soil Carbon
EX-ACT Case Study. Sri Lanka Post-Tsunami Programme DRAFT
 EX-ACT Case Study Sri Lanka Post-Tsunami Programme DRAFT June 2016, GHG appraisal, Asia Region, IFAD Project Photograph: Sudeesa/Seacology Summarized Results The Sri Lanka Post-tsunami Programme aimed
Integrating business and conservation. The way forward or a slide into greenwashed oblivion?
 See discussions, stats, and author profiles for this publication at: https://www.researchgate.net/publication/304655344 Integrating business and conservation. The way forward or a slide into greenwashed
UPDATE ON REMEDIATION AND COMPENSATION PROCEDURES
 UPDATE ON REMEDIATION AND COMPENSATION PROCEDURES Compensation Task Force (CTF) Objectives: To develop guidance for remediation and compensation for the potential loss of HCVs due to land clearing without
LANDSCAPE APPROACH MANAGEMENT. De-coupling Environmental Degradation from Sustainable Growth
 LANDSCAPE APPROACH MANAGEMENT De-coupling Environmental Degradation from Sustainable Growth 1 APP SUSTAINABILITY ROADMAP The Sustainability Roadmap Vision 2020, launched in 2012, is our strategy to place
Tools Development and Outcomes. Dave Skole Michigan State University
 Tools Development and Outcomes Dave Skole Michigan State University Background Carbon2Markets Carbon Climate Livelihoods Focus of our work is on a range of issues in Carbon Measurement Forests, woodlands,
REDUCING EMISSIONS FROM DEFORESTATION IN DEVELOPING COUNTRIES (REDD) Submitted by: Indonesia
 Submitted by: Indonesia") REDUCING EMISSIONS FROM DEFORESTATION IN DEVELOPING COUNTRIES (REDD) Submitted by: Indonesia A. INTRODUCTION Forest resources in many developing countries play important roles in national economic development
REDUCING EMISSIONS FROM DEFORESTATION IN DEVELOPING COUNTRIES (REDD) Submitted by: Indonesia A. INTRODUCTION Forest resources in many developing countries play important roles in national economic development
AVOIDED DEFORESTATION WITH SUSTAINABLE BENEFITS: CHALLENGES FOR TANZANIA (and elsewhere!)
") AVOIDED DEFORESTATION WITH SUSTAINABLE BENEFITS: CHALLENGES FOR TANZANIA (and elsewhere!) Brent Swallow, Peter Akong Minang, Aichi Kitalyi ASB Partnership for the Tropical Forest Margins Propoor Rewards
AVOIDED DEFORESTATION WITH SUSTAINABLE BENEFITS: CHALLENGES FOR TANZANIA (and elsewhere!) Brent Swallow, Peter Akong Minang, Aichi Kitalyi ASB Partnership for the Tropical Forest Margins Propoor Rewards
Scientific Facts on. Forests
 page 1/9 Scientific Facts on Forests Source document: FAO (2006) Summary & Details: GreenFacts Context - Forests cover a third of our planet's land. They provide raw materials, maintain biodiversity, protect
Ecological Economics
 Ecological Economics 87 (2013) 75 83 Contents lists available at SciVerse ScienceDirect Ecological Economics journal homepage: www.elsevier.com/locate/ecolecon Analysis Stakeholders' incentives for land-use
Cost-Benefit Analysis of REDD+ Strategy Options
 Cost-Benefit Analysis of REDD+ Strategy Options Technical Annex E Final Report Consulting Services Contract For the Development of A National REDD+ Strategy for Liberia November 2016 Technical Annex A
IDH landscape program:
 IDH landscape program IDH landscape program: An integrated approach to Production, Protection and Inclusion 1 The IDH landscape program uses an innovative, integrated approach to sustainable natural management.
Indonesian Rainforest and the threat of the pulp and paper industry. Presentation by Jens Wieting, Robin Wood, Germany
 Indonesian Rainforest and the threat of the pulp and paper industry Presentation by Jens Wieting, Robin Wood, Germany Program: Importance and state of tropical forests Indonesia: Country Information Indonesia
Palm Oil TEEB FOR AGRICULTURE AND FOOD
 Palm Oil TEEB FOR AGRICULTURE AND FOOD Overview Palm Oil Countries in this study are responsible for 96% of global palm oil production - Africa Palm oil consumption set to double in 40-years Aim Support
CHAPTER FOUR DEVELOPMENT OF OIL PALM PLANTATIONS IN JAMBI PROVINCE
 CHAPTER FOUR DEVELOPMENT OF OIL PALM PLANTATIONS IN JAMBI PROVINCE The development of oil palm plantations in Jambi province is fully supported by the local government because they believed it would increase
SINKS IN THE CDM? IMPLICATIONS AND LOOPHOLES
 SINKS IN THE CDM? IMPLICATIONS AND LOOPHOLES 1. INTRODUCTION One of WWF s global priorities is the reversal of disastrous tropical deforestation, the conservation of primary forests and sustainable use
Reducing Emissions from Deforestation in Developing Countries (RED)
") Reducing Emissions from Deforestation in Developing Countries (RED) World Bank 27 th May 2008 Bernardo B.N. Strassburg b.strassburg@uea.ac.uk Centre for Social and Economic Research on the Global Environment
Reducing Emissions from Deforestation in Developing Countries (RED) World Bank 27 th May 2008 Bernardo B.N. Strassburg b.strassburg@uea.ac.uk Centre for Social and Economic Research on the Global Environment
Chapter 6 Oil-palm estate development in Southeast Asia: consequences for peat swamp forests and livelihoods in Indonesia
 81 Chapter 6 Oil-palm estate development in Southeast Asia: consequences for peat swamp forests and livelihoods in Indonesia In this chapter, the DPSIR analysis is applied to oil-palm development in the
REDD+ in Cambodia: A Case Study of Deforestation and Opportunity Costs in Koh Kong Province
 REDD+ in Cambodia: A Case Study of Deforestation and Opportunity Costs in Koh Kong Province Matthew Ogonowski Manager, Forestry and Climate Change Program Center for Clean Air Policy (CCAP) ********* World
Supporting Green Growth in Democratic Republic of the Congo
 Supporting Green Growth in Democratic Republic of the Congo Green Growth Knowledge Platform 2 & 3 April 2014 Early Lessons from REDD+ Livelihood benefits needs to be a more central objective; no regrets
Reference Emission Levels (REL) in the context of REDD and land based NAMAs: forest transition stages can inform nested negotiations
 in the context of REDD and land based NAMAs: forest transition stages can inform nested negotiations") Reference Emission Levels (REL) in the context of REDD and land based NAMAs: forest transition stages can inform nested negotiations Submission to SBBSTA UNFCCC, February 28 2012 Key points: ICRAF 1 Action
Reference Emission Levels (REL) in the context of REDD and land based NAMAs: forest transition stages can inform nested negotiations Submission to SBBSTA UNFCCC, February 28 2012 Key points: ICRAF 1 Action
New Training Manual and Workshops. Estimating the Opportunity Costs of REDD. redd_brochure.indd 1 6/18/10 16:50
 New Training Manual and Workshops Estimating the Opportunity Costs of REDD redd_brochure.indd 1 6/18/10 16:50 New Training Manual and Workshops Estimating the Opportunity Costs of REDD Analytical methods
AGRARIAN TRANSITION AND FARMING SYSTEM DYNAMICS IN THE
 KEYNOTE SESSION 1 AGRARIAN TRANSITION AND FARMING SYSTEM DYNAMICS IN THE UPLANDS OF SOUTHEAST ASIA Jean-Christophe Castella Institut de Recherche pour le Développement (IRD) Vientiane, Lao PDR Conservation
TREE PLANTING BY COCOA FARMERS ON FARMS (A GHANA COCOA- AGROFORESTRY REDD+ MODEL)
") TREE PLANTING BY COCOA FARMERS ON FARMS (A GHANA COCOA- AGROFORESTRY REDD+ MODEL) By Gene Birikorang (Hamilton Resources and Consulting Presentation at UNFCCC COP-18, Doha; Nov 29,2012 FOCUS OF GHANA S
TREE PLANTING BY COCOA FARMERS ON FARMS (A GHANA COCOA- AGROFORESTRY REDD+ MODEL) By Gene Birikorang (Hamilton Resources and Consulting Presentation at UNFCCC COP-18, Doha; Nov 29,2012 FOCUS OF GHANA S
THE CHARCOAL TRANSITION
 THE CHARCOAL TRANSITION Greening the charcoal value chain to mitigate climate change and improve local livelihoods Executive summary 2 The charcoal transition KEY POINTS About half the wood extracted worldwide
WRM contribution to the Convention on Climate Change November 2008
 From REDD to HEDD WRM contribution to the Convention on Climate Change November 2008 Forests, everyone knows, are good for the climate which makes it all the more important that governments and international
The Cost of Avoiding Deforestation
 The Cost of Avoiding Deforestation Maryanne Grieg-Gran maryanne@iied.org International Regime,Avoided Deforestation and the Evolution of Public and Private Forest Policies in the South Paris 21-23 November
Reducing emissions from deforestation and forest degradation (REDD) in developing countries
 in developing countries") POSITION PAPER Reducing emissions from deforestation and forest degradation (REDD) in developing countries UNFCCC Climate Change Talks, 28 th Sept 9 th October 2009, Bangkok, Thailand OBJECTIVES, SCOPE
POSITION PAPER Reducing emissions from deforestation and forest degradation (REDD) in developing countries UNFCCC Climate Change Talks, 28 th Sept 9 th October 2009, Bangkok, Thailand OBJECTIVES, SCOPE
Table of Contents 1. Background Introduction to the BioCF ISFL Workshop summary Concepts and scope for comprehensive
 ISFL Methodology Workshop Summary January 26-27, 2016 Table of Contents 1. Background... 1 2. Introduction to the BioCF ISFL... 1 3. Workshop summary... 2 3.1 Concepts and scope for comprehensive landscape
H. L. Tata Forest Research and Development Agency (FORDA), Bogor, Indonesia
, Bogor, Indonesia") DOI 10.1007/s11027-013-9524-5 ORIGINAL ARTICLE Will funding to Reduce Emissions from Deforestation and (forest) Degradation (REDD+) stop conversion of peat swamps to oil palm in orangutan habitat in Tripa
DOI 10.1007/s11027-013-9524-5 ORIGINAL ARTICLE Will funding to Reduce Emissions from Deforestation and (forest) Degradation (REDD+) stop conversion of peat swamps to oil palm in orangutan habitat in Tripa
Chapter 9: Other Land CHAPTER 9 OTHER LAND IPCC Guidelines for National Greenhouse Gas Inventories 9.1
 CHAPTER 9 OTHER LAND 2006 IPCC Guidelines for National Greenhouse Gas Inventories 9.1 Volume 4: Agriculture, Forestry and Other Land Use Authors Jennifer C. Jenkins (USA), Hector D. Ginzo (Argentina),
FSC S CONTRIBUTION TO FOREST RESTORATION. Forest Restoration FSC is on board!
 Forest Stewardship Council FSC International December 2017 FSC S CONTRIBUTION TO FOREST RESTORATION Forest Restoration FSC is on board! Although the Forest Stewardship Council (FSC) is well known for promoting
Estimation of REDD+ cost elements
 Manual Estimation of REDD+ cost elements User Manual for the REDD+ cost elements assessment tool Version 1.2. - March 2016 The World Bank, 1818 H Street, NW Washington, DC 20433 USA The findings, interpretations
IV. RESULT AND DISCUSSION
 IV. RESULT AND DISCUSSION The result of forest cover change simulation during 4 years was described. This process is done by using the information of land cover condition obtained from satellite imagery
Central Kalimantan s Oil Palm Value Chain: Opportunities for Productivity, Profitability & Sustainability Gains
 Central Kalimantan s Oil Palm Value Chain: Opportunities for Productivity, Profitability & Sustainability Gains (version November 2015) BRAZIL CHINA EUROPE INDIA INDONESIA UNITED STATES 1 Oil palm is a
FOREST-BASED CARBON CREDITS & BIODIVERSITY OFFSETS
 FOREST-BASED CARBON CREDITS & BIODIVERSITY OFFSETS REDD+ Our certification. Five principles we live by. Carbon neutral and sustainability are simply not enough. The future generations of this planet deserve
Additional Data File 2.
 Additional Data File 2. Summary of projects, programs and policy initiatives under the Reducing Emissions from Deforestation and forest Degradation (REDD) framework taking place in (or with a policy focus
REDD: Reduced Emissions from Deforestation in Developing Countries. $$ and people. Media. Meeting of the ASB Global Steering Group
 REDD: Reduced Emissions from Deforestation in Developing Countries Meeting of the ASB Global Steering Group Media Indonesia Forest Climate Alliance $$ and people Background on deforestation and climate
Session 1 implementation. We construct our national FREL with the following principles: transparency, accuracy, completeness, consistency, and compara
 FREL and REDD+ in Indonesia Novia Widyaningtyas (Ministry of Environment and Forestry, Indonesia) Session 1 FREL and REDD+ in Indonesia Novia Widyaningtyas (Ministry of Environment and Forestry, Indonesia)
Tree establishment and growth in agroforests (Laxman Joshi)
") Tree establishment and growth in agroforests (Laxman Joshi) The SEXI-FS Spatially explicit individual-tree-based agroforest simulator applied to rubber agroforests (Degi Harja) Forest tree regeneration
Tree establishment and growth in agroforests (Laxman Joshi) The SEXI-FS Spatially explicit individual-tree-based agroforest simulator applied to rubber agroforests (Degi Harja) Forest tree regeneration
Learning from and Fixing LULUCF for a Better REDD Plus. Florence Daviet November 2009 World Resources Institute
 Learning from and Fixing LULUCF for a Better REDD Plus Florence Daviet November 2009 World Resources Institute Mandatory or Not? What rules? At the heart of it - Scope LULUCF REDD Plus Why Deforestation
Sara J. Scherr, EcoAgriculture Partners Navigating the Global Food System in a New Era IAMA, Boston, June 21, 2010
 Agricultural Productivity and Ecosystem Sustainability: Solutions from Farm to Landscape Scale "Feeding 9 Billion with the Challenges of Climate Change: Towards Diversified Ecoagriculture Landscapes" Sara
INTEGRATED LIVELIHOOD AND NATURAL RESOURCE MANAGEMENT THROUGH REWARDS FOR ENVIRONMENTAL SERVICES IN SINGKARAK, WEST SUMATRA
 INTEGRATED LIVELIHOOD AND NATURAL RESOURCE MANAGEMENT THROUGH REWARDS FOR ENVIRONMENTAL SERVICES IN SINGKARAK, WEST SUMATRA Beria Leimona, Rachman Pasha, Meine van Noordwijk ICRAF SEA RUPES WORD BANK EXCHANGE
Sustainable Cacao-based Agroforestry Development to Support Green Growth in Gorontalo
 Sustainable Cacao-based Agroforestry Development to Support Green Growth in Gorontalo COP24 Gorontalo District, INDONESIA Gobel DKM Kanematsu Corporation Dec, 2018 Supported by 2 Preserving Limboto Lake
Atelier COMIFAC March, 2008, Paris (France)
") Atelier COMIFAC 10-11 March, 2008, Paris (France) Global Change Group draft REDD Methodology Lucio Pedroni lpedroni@catie.ac.cr; lpedroni@worldbank.org Deforestation, DEFINITIONS Degradation, Regeneration,
Atelier COMIFAC 10-11 March, 2008, Paris (France) Global Change Group draft REDD Methodology Lucio Pedroni lpedroni@catie.ac.cr; lpedroni@worldbank.org Deforestation, DEFINITIONS Degradation, Regeneration,
World Bank Forestry Mitigation Strategy and Actions
 World Bank Forestry Mitigation Strategy and Actions Forests and Climate Change Reducing emissions from deforestation and forest degradation in developing countries REDD National REDD Readiness Forest Carbon
Forest Land Use and Climate Change in North Sulawesi (FLUCC) in the Poigar Forest
 in the Poigar Forest") Source(s): Forest Land Use and Climate Change in North Sulawesi (FLUCC) in the Poigar Forest ONF International: REDD in North Sulawesi KPH Poigar Project ONF International (2009): Forest land use and climate
Source(s): Forest Land Use and Climate Change in North Sulawesi (FLUCC) in the Poigar Forest ONF International: REDD in North Sulawesi KPH Poigar Project ONF International (2009): Forest land use and climate