CITIZEN MONITORING AS WATERSHED MANAGEMENT TOOL. Reesa Evans Lake Specialist Certified Lake Manager Adams County LWCD
|
|
|
- Lindsey Stokes
- 6 years ago
- Views:
Transcription
1 CITIZEN MONITORING AS WATERSHED MANAGEMENT TOOL Reesa Evans Lake Specialist Certified Lake Manager Adams County LWCD

2 Setting Up Monitoring When looking at setting up a monitoring program, the first step is to decide the purpose of the monitoring. The purpose will determine what types of data will be needed. It can also usually determine the length of time data collection needs to occur. It may also help determine where data collection should occur. In many instances, there are citizen monitoring programs available that will help a watershed group obtain needed data for a watershed plan with little financial investment. The next column shows just some of the citizen monitoring programs that can collect useful data that I can t cover in this presentation. Most are always looking for citizen volunteers. Bats/Owls Bumble Bees Bird Counts/Breeding Carnivores & Mammals Clean Boats, Clean Waters Fish Catch/Spawning Frogs/Toads/Turtles/Salamanders Furbearers/Forest Wildlife Habitat Assessment Loon Watch Native Mussels & Sponges Project Budburst (leafing/flowering/fruiting) Rare Plants Snapshot Wisconsin Wetlands
 To establish baseline data; (2) To track trends or changes in the water quality; (3) To document chronic or episodic events; (4) To")
3 WHY MONITOR WATER QUALITY? Here are some reasons to regularly monitor water quality: (1) To establish baseline data; (2) To track trends or changes in the water quality; (3) To document chronic or episodic events; (4) To provide information for resource management; (5) To determine success (or lack of) of management actions; (6) To identify specific existing or emerging water quality problems; (7) To gather information for prevention or remediation steps; (8) To respond to emergencies; (9) To educate the public about water quality.

4 CITIZEN LAKE MONITORING Over 1000 Citizen Lake Monitoring (CLMN) volunteers currently measure water clarity, using the Secchi Disk method, as an indicator of water quality. Many also collect chemistry, temperature, and dissolved oxygen data, as well as identify and map plants or watch for the any new sites of aquatic invasives in their waterbodies, esp. near boat landings. The Big Three actions for lake monitoring water quality are: 1. Measuring water clarity by using a Secchi disk; 2. Taking a water sample of the water column to be tested for total phosphorus; 3. Taking a water sample of the water column to be tested for chlorophyll-a.
5 CLMN The Wisconsin Department of Natural Resources provides training and the equipment for taking water clarity and temperature readings free of charge. It also pays for 4 lab samples per year that cover costs for testing for total phosphorus and chlorophyll-a in samples taken in the deep hole of a lake. This means that if a lake has one or two volunteers to do this sampling, important data can be gained for the lake free of any financial charge and with little time spent (less than an hour each time). The data is stored in the Surface Water Integrated Monitoring System (SWIMS). Volunteers can be authorized to enter their own data in some instances. The State Hygiene Lab also automatically enters testing results for total phosphorus and chlorophyll-a in SWIMS. Annual reports and graphs for each sample site are also available on this website. Anyone can view the data on the website, but not everyone can enter data.

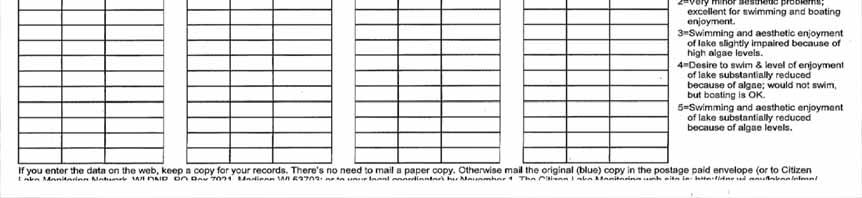
6 CLMN Field Documentation Sheet
7 Sample Lake Annual Report Wolf Lake - Deep Hole 2016 Results Wolf Lake - Deep Hole was sampled 8 different days during the 2016 season. Parameters sampled included: Water Clarity Temperature Total Phosphorus Chlorophyll-a The average summer (July-Aug) secchi disk reading for the Wolf Lake Deep Hole was 14.0 feet. The average for the Central Georegion was 9.1 feet. Typically the summer (July-Aug) water was reported as CLEAR and BLUE. Chemistry data was collected on Wolf Lake Deep Hole. The average summer Chlorophyll-a was 2.0 µg/l (compared to a Central Georegion summer average of 12.8 µg/l). The summer Total Phosphorus average was 12.8 µg/l. Natural lakes that have more than 20 µg/l and impoundments that have more than 30 µg/l of total phosphorus may experience noticeable algae blooms and nuisance aquatic plant growth.
 suspended sediment & other solids in the water; (2) wind speed & direction; (3) sun or clouds in sky; (4) algae density; (5) water color; (6) recent")
8 Secchi Disk Use in Monitoring To test water quality by evaluating a lake s clarity, a Secchi disk is used. This is an 8-inch weighted disk marked with black and white triangles. Secchi readings can be affected by things like(1) suspended sediment & other solids in the water; (2) wind speed & direction; (3) sun or clouds in sky; (4) algae density; (5) water color; (6) recent disturbance of the bottom; (7) presence of aquatic plants. There are many purposes for which a reading might be useful, such as after a storm event or after a busy holiday weekend.


9 Secchi Disk--2 Secchi disk measurements also indicate the depth at which a lake has enough oxygen to support fish and plant life. The general rule is that sunlight can penetrate the water about 1.7 times the depth of a Secchi disk reading. Thus, if the Secchi reading is 10 feet, the sunlight can penetrate the water to about 17 feet deep. Secchi disks also keep track of any changes in water color or clarity. Some lakes may look brown due to tannic acid. There are also often seasonal changes due to algae blooms that can cause lake water to turn very green, brown, orange, or even purple. Disturbances can also cause a color change. Keeping track of these color changes and of variations in Secchi depth allows for a better understanding of a lake.


10 Phosphorus The CLMN also may use testing for total phosphorus. In Wisconsin, most lakes are phosphorus-limited: this means that it is the element in the lowest supply vs. the demand for it. So changes in the phosphorus levels are likely to have significant effect on the water quality of the lake. Under some conditions, excess phosphorus can cause algae to bloom, i.e. grow out of control. The phosphorus level in a lake also greatly affects the occurrence & growth density of aquatic plants.

11 Phosphorus--2 Lakes have both dissolved and particulate forms of phosphorus. Dissolved phosphorus is biologically available to plants & algae for growth. Particulate phosphorus is bound up chemically and isn t immediately available to plants & algae. However, changes in conditions can cause this phosphorus to be released, when it can then be used by aquatic plants & algae. Lake phosphorus can come from agricultural runoff, lawn runoff, human & animal waste, erosion, impervious surface runoff, internal loading, etc.

12 Chlorophyll-a The third criteria tested is chlorophyll-a. This pigment is found in all green plants & algae, causing their green color. Studies have shown the level of chlorophyll-a present correlates well to the amount of algae a lake has. This type of testing does not determine what kind of algae is present; instead, it gives an amount of total algae present. The amount of water filtered for this testing is proportional to the Secchi disk reading of that day. If the Secchi reading for that day is under 1 foot, only filter 50 ml of water. If it is 1 foot to 1.5 feet, filter 100 ml. For anything over 1.5 feet, filter 200 ml.

13 Water Temperature Water temperature is measured at various levels by using a digital probe, a measured cable and a small digital meter that records temperature. The cable has depth marks for convenience. Temperature exerts a major influence on biological activity and growth in lake water. It determines the kinds of organisms that can live in the water. Fish, insects, zooplankton, phytoplankton, and other aquatic species all have a preferred temperature range. As temperatures get too far above or below this preferred range, the number of individuals of the species decreases until finally there are none.
14 Water Temperature--2 Temperature also influences water chemistry. The rate of chemical reactions generally increases at higher temperatures. At higher temperatures, water, especially groundwater, can dissolve more minerals from the rocks it is in and will therefore have a higher electrical conductivity. The opposite reaction occurs when considering a gas like oxygen dissolved in the water. Cold water can hold more of the oxygen than the warm water. Since warm water holds less oxygen than cold water, some aquatic life can t survive as well in warm water as in cold water. Also, due to chemical reactions, some chemical compounds are more toxic to aquatic life at higher temperatures. All of this data (Secchi depth, TP, Chl-a, temp) is stored in the WDNR s Surface Water Integrated Monitoring System (SWIMS), so it is accessible to anyone who wants to examine it.
15 Using Sample Results Trophic State Quality Index Phosphorus Chlorophyll-a Sechhi Disk (ug/l) (ug/l) (ft) Oligotrophic Excellent Less than 1 Less than 1 Over 19 Very Good 1 to 10 1 to 5 8 to 19 Mesotrophic Good 10 to 30 5 to 10 6 to 8 Fair 30 to to 15 5 to 6 Eutrophic Poor 50 to to 30 3 to 4 Hypereutrophic Very Poor over 150 Over 30 Less than 3
16 Trophic States Secchi disk readings, total phosphorus levels, and chlorophyll-a levels are used to determine a lake s trophic status. This is a measure of a lake s nutrient enrichment, on a scale of 0 to 100, with 100 being the most nutrient rich lake possible. There are three main categories of nutrient enrichment: Oligotrophic; Mesotrophic; Eutrophic. Good: Oligotrophic lakes have clear, deep water with few algal blooms. Larger game fish are often found in such lakes. Fair: Mesotrophic lakes have more aquatic plant and algae production, with occasional algal blooms and a good fishery. The water is usually not as clear as that of oligotrophic lakes. Poor: Eutrophic lakes are very productive, with lots of aquatic plants and algae. Algal blooms are often frequent in these lakes. They may have a diverse fishery, but rough fish (such as carp) are also common. Water is often cloudy or murky. Small shallow lakes are more likely to be eutrophic.


17 Stream Monitoring Wisconsin also has a citizen-based stream monitoring program called Water Action Volunteer Program (WAVE). This program has three levels of participation for citizen scientists: Level 1; Level 2; and Level 3. Volunteers collect data to increase public understanding of watersheds, to help educate about the impact of humans on stream quality, and to build a baseline of water quality information in the state s wadeable streams. Equipment and lab fees are covered by the WDNR, as is training for all levels.


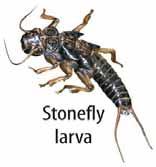
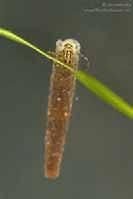
18 Stream Monitoring--2 Level 1 water quality indicators monitored monthly by volunteers in streams of Wisconsin include dissolved oxygen, ph, temperature, transparency, stream flow, habitat, macroinvertebrates, specific conductance, chloride, total phosphorus, and E. coli. Macroinvertebrates are monitored in spring and fall, and habitat is assessed once per year in summer. In Status and Trends Monitoring (Level 2), dissolved oxygen, ph and transparency are monitored monthly between April (or May) and October on predetermined dates. In some instances, testing for total phosphorus is added. Level 3 monitoring is connected to Special Projects. The data is stored in SWIMS. Volunteers can be authorized to enter their own data in some instances. The State Hygiene Lab also automatically enters testing results for total phosphorus in SWIMS from stream testing.
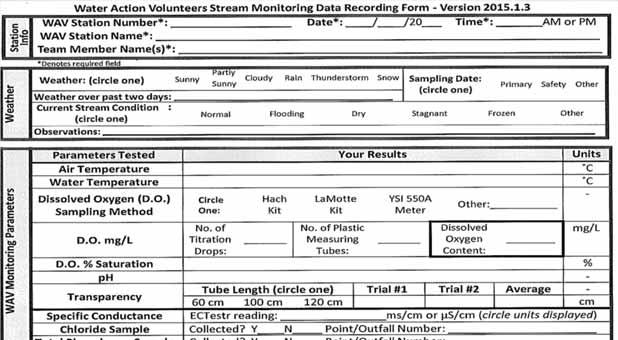
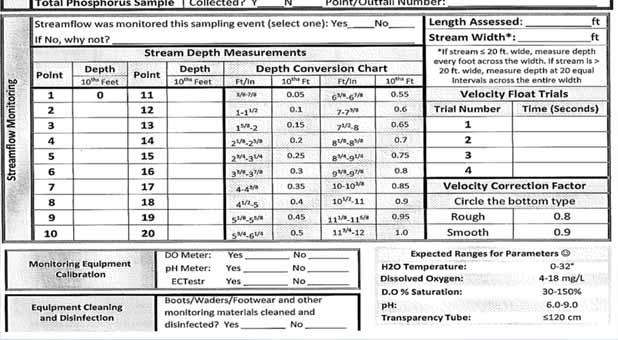
19 WAVE Documentation Sheet


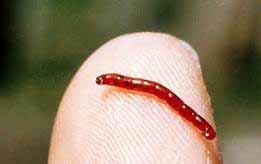
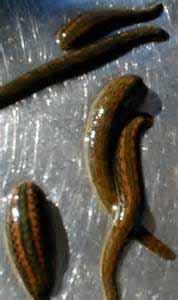
20 Caddisfly Larvae Red Midge Worm Leech
21 Stream Monitoring--Report Typical Stream Site Report Fieldwork Start09/15/ :25 AM Fieldwork End09/15/ :50 AM Project(s)Carter Creek at CTH G Data CollectorsMichelle Harrison Fieldwork Event StatusCOMPLETE Field Sample ID Station Org.21WIS Station ID Station NameCarter Creek (Cc-2 DS of CTH G) Station TypeRIVER/STREAM Station WBIC Station Waterbody NameCarter Creek Field Description Report To Report To DNR User ID Report to EPA?Y Commentsvery high all year - no flow
 120 CM Water Temperature 17.")
22 AMBIENT AIR TEMPERATURE FIELD 26.2 C DISSOLVED OXYGEN FIELD 2.27 MG/L OXYGEN, DISSOLVED, PERCENT OF SATURATION % 23.40% Additional Comments no flow but water level is high Transparency tube length (cm) 120 CM Water Temperature 17.3 C Transparency Tube Measurement cm Transparency Tube Measurement cm Average Transparency 120 cm Dissolved Oxygen Sampling Method? YSI 550A Meter Number of Group 1 animals circled: 0 Number of Group 2 animals circled: 0 Number of Group 3 animals circled: Number of Group 4 animals circled: 0 Total Animals 1 Group 1 Value 0 Group 2 Value 0 Group 3 Value 2 Group 4 Value 0 Total Value 2 Macroinvertebrate Index Score 2 Snails (Orb or gilled right side opening) present Weather Over the Past 2 Days sunny & warm 1
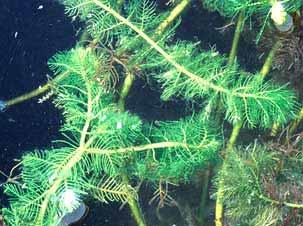
23 AIS MONITORING It is also important to monitor each water body for aquatic invasive species. Invasive species are known to cause both environmental and economic damages of various types. Environmental damages are difficult to quantify, but those verified include: Loss of habitat for native species Decrease/extinction of native species Displacement of native species Alteration of ecosystem processes like energy, nutrient & water cycling, changes in the food web, changes in community structure Hosting of diseases harmful to native species and/or humans Reduction of plant health & productivity, including changes in biodiversity that decrease system s ability to withstand further invasions
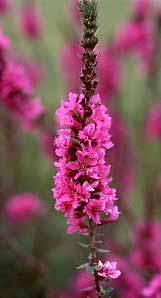
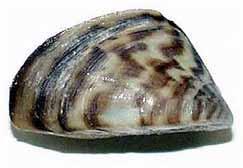
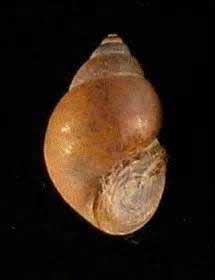
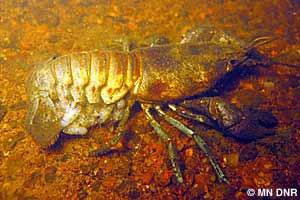
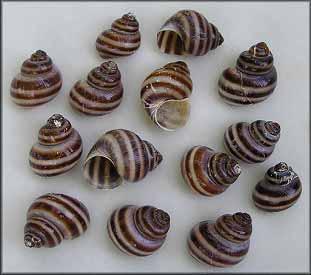

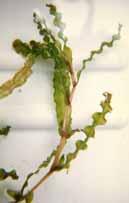
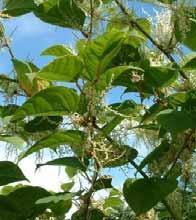
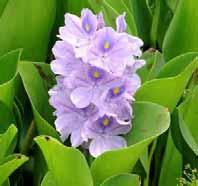
24 AIS MONITORING--2
25 AIS MONITORING--3 More easily quantified is the economic cost of invasive species. Economic costs include cost of water treatment (chemical, harvesting, etc.), interference with power generation, damage to commercial and/or sport fishing, damages to industrial facilities, damage/interference with recreational activities, and decline in waterfront property values. Economic costs estimates vary widely. A publication in 2008 estimated cost of over $200 million/year just in the Great Lakes. One of the most widely-quoted studies is a 2005 paper from Cornell University estimating a cost of over $130 Billion per year for dealing with invasive species in the U.S. An article in 2012 estimated the cost in Wisconsin at over $100 Million in the Great Lakes States. Dealing with spiny water fleas in Lake Mendota resulted in costs of $80-$163 Million in damages. A report from the US Fish and Wildlife Service estimated that invasion of Eurasian Watermilfoil reduced waterfront property values by 16% in Vermont & 13% in Wisconsin.

26 As noted, water quality monitoring can evaluate the physical, chemical, and biological characteristics of a waterbody in relation to human health, ecological conditions, and designated water uses. Watershed monitoring is wider and more comprehensive approach to data collection that incorporates water quality as well as watershed conditions. It provides data for the evaluation of the water resource(s) while also resulting in information to help establish cause-and-effect relationships. While baseline data can be used to quantify water quality and describe ecological characteristics or processes within the water body or watershed, longer term, repeated sampling helps to evaluate past and present protection measures and target areas for improvement.
27 Regular Long-Term Water Quality Monitoring Regular long-term water quality monitoring can therefore be useful in watershed management for: Documenting watershed condition and water quality trends over time Screening for potential water quality problems Determining whether water bodies meet regulatory standards and/or support designated uses (safe for swimming, drinking, fishing, etc.) Providing data for scientifically-based watershed management decisions Determining the impacts of discharges (sewage treatment plants or industries) to support appropriate effluent limits Determining the impacts of land use activities (farming, forestry, or urban development) Supporting management of water quality-limited waters, including assessment of Total Maximum Daily Loads (TMDLS) Educating the watershed s citizens, leaders or users

28 Questions? To Contact Me Reesa Evans Certified Lake Manager Lake Specialist Adams County Land & Water Conservation Department Mailing: P.O. Box 287 Street: 402 Main Street Friendship, WI Friendship, WI Main office: Direct Line: Website:


29 Resources You Might Use Barden, E. No date. Why citizen science for water quality. Borman, S., R. Korth & J. Temtle. Through the looking glass: a field guide to aquatic plants. UW-Extension. Shaw, B., C. Mechenich & L. Klessig Understanding lake data. UW-Extension. Skawinski, P. Aquatic plants of the Midwest. Self-published. Aquatic Plant Identification Websites: aquaplant.tamu.edu/database/index.htm aquat1.ifas.uf.edu/node/ EPA A quick guide to developing watershed plants to restore & protect. EPA. No date. Surf your watershed. EPA. No date. Volunteers.
30 Resources for this Presentation EPA. No date. EPA Watershed Academy. USGS. M.L. Erwin & P.A. Hamilton Monitoring our rivers and streams. USGS Water Science School. Charles, H. & J.S. Dukes impacts of invasive species on ecosystem services. Ecological Studies, Vol Cost of invasive species. No date. U.S. Fish & Wildlife. Hinterheur, A UW scientists say invasive species inpacts much worse than thought. University of Wisconsin release. Lodge, D. & D. Finnoff Annual losses to Great Lakes Region by ship-borne invasive species. Center for Aquatic Conservation. Pimental, D., R. Zuniga, & D. Morrison Update on environmental and economic costs associated with alien invasions to the United States. USDA. Rosaen, A.L., E.A. Grover & C.W. Spencer The costs of aquatic invasive species to the Great Lakes states. Nature Conservancy.
Lake Washington. Water Quality Assessment Report. Copyright 2012 PLM Lake & Land Management Corp.
 Lake Washington 2012 Water Quality Assessment Report Copyright 2012 PLM Lake & Land Management Corp. Water Quality Report On May 22nd, June 18th, July 30th, August 29th, and September 27 th, 2012, PLM
CLMP+ Report on Grass Lake (Anoka County) Lake ID# CLMP+ Data Summary
 Lake ID# CLMP+ Data Summary") CLMP+ Report on Grass Lake (Anoka County) Lake ID# 02-0113-00 2012-2013 CLMP+ Data Summary October 2014 Authors Shannon Martin, MPCA Editing and graphic design Public Information Office Staff The (MPCA)
CLMP+ Report on Grass Lake (Anoka County) Lake ID# 02-0113-00 2012-2013 CLMP+ Data Summary October 2014 Authors Shannon Martin, MPCA Editing and graphic design Public Information Office Staff The (MPCA)
Portage Lake CASS COUNTY
 Portage Lake 11-0204-00 CASS COUNTY Summary Portage Lake is located near Bena, MN in Cass County. It covers 1,539 acres, which places it in the upper 10% of lakes in Minnesota in terms of size. Portage
CLMP+ Report on Fleming Lake (Aitkin County)
") CLMP+ Report on Fleming Lake (Aitkin County) Lake ID# -5-5-6 CLMP+ Data Summary July 7 Authors Shannon Martin Contributors/acknowledgements Terry Dahlberg Sandy Dahlberg Pam Anderson For questions regarding
CLMP+ Report on Fleming Lake (Aitkin County) Lake ID# -5-5-6 CLMP+ Data Summary July 7 Authors Shannon Martin Contributors/acknowledgements Terry Dahlberg Sandy Dahlberg Pam Anderson For questions regarding
2017 Data Report for Loon Lake, Iosco County
 Michigan Lakes Ours to Protect 2017 Data Report for Loon Lake, Iosco County Site ID: 350078 The CLMP is brought to you by: 1 About this report: This report is a summary of the data that have been collected
Impacts to Aquatic Habitats from Land-Use or Is It Polluted?
 Impacts to Aquatic Habitats from Land-Use or Is It Polluted? Water Pollution is: The addition of excessive carbon to a system The addition of large amounts of materials to water that causes adverse changes
Boy Lake CASS COUNTY
 Boy Lake 11-143- CASS COUNTY Summary Boy Lake is located near Remer, MN in Cass County. It covers 3,452 acres, which places it in the upper 1% of lakes in Minnesota in terms of size. Boy Lake has two main
2017 Data Report for Portage Lake, Washtenaw County
 Michigan Lakes Ours to Protect 2017 Data Report for Portage Lake, Washtenaw County Site ID: 810248 42.420559 N, 83.921392 W The CLMP is brought to you by: 1 About this report: This report is a summary
Ploof s Creek South. Johannes Creek. Grand Lake, Ploof s Creek South, Johannes Creek. Introduction
 524 4th Street South Sauk Centre, MN 56378 320.352.2231 Grand Lake, Ploof s Creek South, Johannes Creek Introduction Since the 2012 monitoring season, the Grand Lake Improvement District (Grand LID) and
2017 Data Report for Big Maggie Lake, Iron County
 Michigan Lakes Ours to Protect 2017 Data Report for Big Maggie Lake, Iron County Site ID: 360173 46.01 N, 88.4626 W The CLMP is brought to you by: 1 About this report: This report is a summary of the data
2017 Data Report for Fern Lake, Grand Traverse County
 Michigan Lakes Ours to Protect 2017 Data Report for Site ID: 280438 44.73475 N, 85.73409 W The CLMP is brought to you by: 1 About this report: This report is a summary of the data that have been collected
2017 Data Report for Silver Lake, Van Buren County
 Michigan Lakes Ours to Protect 2017 Data Report for Silver Lake, Van Buren County Site ID: 800534 42.3891 N, 86.0599 W The CLMP is brought to you by: 1 About this report: This report is a summary of the
Interpreting Lake Data
 Interpreting Lake Data Indiana Clean Lakes Program The Indiana Clean Lakes Program was created in 1989 as a program within the Indiana Department of Environmental Management's (IDEM) Office of Water Management.
2018 Data Report for Pickerel Lake, Kalkaska County
 Michigan Lakes Ours to Protect 2018 Data Report for Pickerel Lake, Kalkaska County Site ID: 400035 44.800559 N, 84.97667 W The CLMP is brought to you by: 1 About this report: This report is a summary of
2016 Summit Lake Water Quality Report Prepared by Thurston County Environmental Health Division
 ! 216 Summit Lake Water Quality Report Prepared by Thurston County Environmental Health Division PART OF TOTTEN INLET WATERSHED LENGTH OF LAKE: 2.2 miles SHORELINE LENGTH: 5.6 miles LAKE SIZE: 53 acres
2017 Data Report for Little Paw Paw Lake, Berrien County
 Michigan Lakes Ours to Protect 2017 Data Report for Site ID: 110765 42.21899 N, 86.29072 W The CLMP is brought to you by: 1 About this report: This report is a summary of the data that have been collected
2017 Data Report for Rogers Pond, Mecosta County
 Michigan Lakes Ours to Protect 2017 Data Report for 43.6175478 N, 85.4718313 W The CLMP is brought to you by: 1 About this report: This report is a summary of the data that have been collected through
2017 Data Report for Arbutus Lake, Grand Traverse County
 Michigan Lakes Ours to Protect 217 Data Report for Arbutus Lake, Grand Traverse County Site ID: 2819 44.65917 N, 85.519726 W The CLMP is brought to you by: 1 About this report: This report is a summary
2017 Data Report for Deer Lake, Alger County
 Michigan Lakes Ours to Protect 2017 Data Report for Deer Lake, Alger County Site ID: 020127 46.48016 N, 86.98277 W The CLMP is brought to you by: 1 About this report: This report is a summary of the data
2017 Data Report for Hoags Lake, Mason County
 Michigan Lakes Ours to Protect 17 Data Report for Hoags Lake, Mason County.171 N,.19575 W The CLMP is brought to you by: 1 About this report: This report is a summary of the data that have been collected
2017 Data Report for Shingle Lake, Clare County
 Michigan Lakes Ours to Protect 217 Data Report for Shingle Lake, Clare County Site ID: 1818 43.96359 N, 84.95282 W The CLMP is brought to you by: 1 About this report: This report is a summary of the data
Portage Lake Hubbard County
 Prepared in cooperation with the Minnesota Department of Natural Resources Minnesota Lake ID: 9- Area: acres Watershed Area: 6,7 acres Ecoregion: Northern Lakes and Forests (NLF) Portage Lake Hubbard County
2017 Data Report for Pleasant Lake, Wexford County
 Michigan Lakes Ours to Protect 2017 Data Report for Pleasant Lake, Wexford County Site ID: 830183 44.3 N, 85.4775 W The CLMP is brought to you by: 1 About this report: This report is a summary of the data
2017 Data Report for Oxbow Lake, Oakland County
 Michigan Lakes Ours to Protect 2017 Data Report for Oxbow Lake, Oakland County Site ID: 630666 42.64167 N, 83.477226 W The CLMP is brought to you by: 1 About this report: This report is a summary of the
2017 Data Report for Lake Tahoe, Oceana County
 Michigan Lakes Ours to Protect 17 Data Report for Lake Tahoe, Oceana County Site ID: 33 3.1 N,.3 W The CLMP is brought to you by: 1 About this report: This report is a summary of the data that have been
2017 Data Report for Earl Lake, Livingston County
 Michigan Lakes Ours to Protect 217 Data Report for Earl Lake, Livingston County Site ID: 755 2.191 N, 3.95 W The CLMP is brought to you by: 1 About this report: This report is a summary of the data that
2017 Data Report for Painter Lake, Cass County
 Michigan Lakes Ours to Protect 217 Data Report for Painter Lake, Cass County Site ID: 1418 41.81667 N, 85.99194 W The CLMP is brought to you by: 1 About this report: This report is a summary of the data
2018 Data Report for. Crystal Lake, Montcalm County
 Michigan Lakes Ours to Protect 218 Data Report for Crystal Lake, Montcalm County Site ID: 5915 43.25584 N, 84.93362 W The CLMP is brought to you by: 1 About this report: This report is a summary of the
2017 Data Report for Ottawa Lake, Iron County
 Michigan Lakes Ours to Protect 2017 Data Report for Site ID: 360033 46.08484 N, 88.76419 W The CLMP is brought to you by: 1 About this report: This report is a summary of the data that have been collected
Interpreting Lake Data
 Interpreting Lake Data Indiana Clean Lakes Program The Indiana Clean Lakes Program was created in 1989 as a program within the Indiana Department of Environmental Management's (IDEM) Office of Water Management.
2017 Data Report for Duck Lake, Muskegon County
 Michigan Lakes Ours to Protect 217 Data Report for Duck Lake, Muskegon County Site ID: 61778 43.33785 N, 86.39258 W The CLMP is brought to you by: 1 About this report: This report is a summary of the data
White Lake 2017 Water Quality Report
 Introduction Watersheds Canada believes that every person has the right to access clean and healthy lakes and rivers in Canada. We work to keep these precious places naturally clean and healthy for people
2017 Data Report for Perch Lake, Iron County
 Michigan Lakes Ours to Protect 217 Data Report for Perch Lake, Iron County Site ID: 3646 46.361392 N, 88.658338 W The CLMP is brought to you by: 1 About this report: This report is a summary of the data
2017 Data Report for Lake Independence, Marquette County
 Michigan Lakes Ours to Protect 217 Data Report for Lake Independence, Marquette County Site ID: 2149 46.88337 N, 87.711393 W The CLMP is brought to you by: 1 About this report: This report is a summary
2015 Data Report for South Torch Lake, Antrim County
 Michigan Lakes Ours to Protect 2015 Data Report for South Torch Lake, Antrim County Site ID: 050240 44.91590 N, 85.30280 W The CLMP is brought to you by: About this report: This report is a summary of
2016 Data Report for Barlow Lake, Barry County
 Michigan Lakes Ours to Protect 216 Data Report for Barlow Lake, Barry County Site ID: 8176 42.67559 N, 85.5242 W The CLMP is brought to you by: 1 About this report: This report is a summary of the data
2017 Data Report for Klinger Lake, St. Joseph County
 Michigan Lakes Ours to Protect 217 Data Report for Klinger Lake, St. Joseph County Site ID: 75136 41.82781 N, 85.543893 W The CLMP is brought to you by: 1 About this report: This report is a summary of
Lake & Watershed Resource Management Associates P O Box 65; Turner, ME
 Lake & Watershed Resource Management Associates P O Box 65; Turner, ME 207-336-2980 LWRMA@megalink.net 2008 Baseline Water Quality Monitoring and Assessment of Pemaquid and Biscay Ponds At the request
Lake & Watershed Resource Management Associates P O Box 65; Turner, ME
 Lake & Watershed Resource Management Associates P O Box 65; Turner, ME 207-336-2980 LWRMA @megalink.net 2009 Baseline Water Quality Monitoring and Assessment of McCurdy Pond At the request of the Pemaquid
2016 Data Report for Iron Lake, Iron County
 Michigan Lakes Ours to Protect Data Report for Iron Lake, Iron County.1397 N,.533 W The CLMP is brought to you by: 1 About this report: This report is a summary of the data that have been collected through
Suspended Sediments. A lgae. Factors that Affect Water Clarity
 Factors that Affect Water Clarity Water clarity is a measure of the amount of particles in the water, or the extent to which light can travel through the water. There are many ways to express water clarity,
Red Rock Lake: A Path Forward
 University of Minnesota Morris Digital Well University of Minnesota Morris Digital Well Center for Small Towns 6-2016 Red Rock Lake: A Path Forward Colette Millard Student - University of Minnesota, Morris
State of the Lake Environment Report December Clayton Lake
 State of the Lake Environment Report December 2002 Clayton Lake Clayton Lake Clayton Lake is situated in the Townships of Lanark Highlands and Mississippi Mills in Lanark County. Clayton Lake is at an
Hadlock Pond, Washington Co., Lake Hadlock Association, Inc.
 Hadlock Pond, Washington Co., Lake Hadlock Association, Inc. Lake Characteristics Watershed Characteristics Surface Area (ac/ha) Max Depth (ft/m) Mean Depth (ft/m) Retention Time (years) Water Class Dam
Understanding Lake Data
 Understanding Lake Data Moriya Rufer Environmental Services Director moriya.rufer@rmbel.info Ellie Kriese Lakes Program Coordinator ellie.kriese@rmbel.info Why We re Here Take Homes Learn how to access
2017 Data Report for Spider Lake, Grand Traverse County
 Michigan Lakes Ours to Protect 217 Data Report for Spider Lake, Grand Traverse County Site ID: 28395 44.675987 N, 85.49947 W The CLMP is brought to you by: 1 About this report: This report is a summary
2016 Data Report for Magician Lake, Cass County
 Michigan Lakes Ours to Protect 216 Data Report for Magician Lake, Cass County Site ID: 1465 42.649 N, 86.179 W The CLMP is brought to you by: 1 About this report: This report is a summary of the data that
Gull Lake CASS & CROW WING COUNTIES
 Gull Lake 11-0305-00 CASS & CROW WING COUNTIES Summary Gull Lake is located just northwest of Brainerd, Minnesota, on the border of Cass and Crow Wing Counties. It covers 9,947 acres, which places it in
2016 Data Report for Bruin Lake, Washtenaw County
 Michigan Lakes Ours to Protect 1 Data Report for Bruin Lake, Washtenaw County Site ID: 8575.189788 N, 8.39387 W The CLMP is brought to you by: 1 About this report: This report is a summary of the data
Water Quality in Mayflower Lake. N. Turyk Water Resource Scientist UW-Stevens Point
 Water Quality in Mayflower Lake N. Turyk Water Resource Scientist UW-Stevens Point Tonight s discussion Water movement Water quality Zoning/Build-outs in the Watersheds Recommendations and Considerations
EUTROPHICATION. Student Lab Workbook
 EUTROPHICATION Student Lab Workbook THE SCIENTIFIC METHOD 1. Research Background literature research about a topic of interest 2. Identification of a problem Determine a problem (with regards to the topic)
State of the Lake Environment Report December Mackavoy Lake
 State of the Lake Environment Report December 2003 Mackavoy Lake Mackavoy Lake Mackavoy Lake is located in the Township of Addington Highlands. Mackavoy Lake is a headwater lake of the Mississippi River
2018 Data Report for. Lotus Lake, Oakland County
 Michigan Lakes Ours to Protect 218 Data Report for Lotus Lake, Oakland County 42.6941 N, 83.4244 W The CLMP is brought to you by: 1 About this report: This report is a summary of the data that have been
2016 Data Report for Klinger Lake, St. Joseph County
 Michigan Lakes Ours to Protect 216 Data Report for Klinger Lake, St. Joseph County Site ID: 75136 41.82781 N, 85.543893 W The CLMP is brought to you by: 1 About this report: This report is a summary of
Wakefield Lake TMDL Public Meeting 3/17/2014. Jen Koehler, PE Barr Engineering
 Wakefield Lake TMDL Public Meeting 3/17/2014 Jen Koehler, PE Barr Engineering Outline Project Contacts Introduction to Wakefield Lake Thoughts/Questions/Concerns About TMDL Studies Lake Water Quality and
Long-Term Volunteer Lake Monitoring in the Upper Woonasquatucket Watershed
 Long-Term Volunteer Lake Monitoring in the Upper Woonasquatucket Watershed Linda Green URI Watershed Watch 1-87-95, lgreen@uri.edu WATER QUALITY IS A REFLECTION OF THE ACTIVITIES IN THE LANDS AND WATERS
2014 Data Report for Lake Chemung, Livingston County
 2014 Data Report for Lake Chemung, Livingston County Michigan Lakes Ours to Protect The CLMP is brought to you by: About this report: This report is a summary of the data that have been collected through
Torch Lake (South), Antrim County
, Antrim County") 2014 Data Report for Torch Lake (South), Antrim County Michigan Lakes Ours to Protect The CLMP is brought to you by: About this report: This report is a summary of the data that have been collected through
2014 Data Report for Torch Lake (South), Antrim County Michigan Lakes Ours to Protect The CLMP is brought to you by: About this report: This report is a summary of the data that have been collected through
Water Quality in Rice and Pike Lakes. Ryan Haney Water Resource Specialist Center for Watershed Science and Education UW Stevens Point
 Water Quality in Rice and Pike Lakes Ryan Haney Water Resource Specialist Center for Watershed Science and Education UW Stevens Point Tonight s discussion How do we measure water quality? How is the water
State of the Lake Environment Report December Big Gull Lake
 State of the Lake Environment Report December 2004 Big Gull Lake Big Gull Lake Big Gull Lake is located in the Townships of Central and North Frontenac. Big Gull Lake is at an elevation of 253 metres above
2014 Data Report for Clark Lake, Jackson County
 2014 Data Report for Clark Lake, Jackson County Michigan Lakes Ours to Protect The CLMP is brought to you by: About this report: This report is a summary of the data that have been collected through the
U.S. Geological Survey s Update on the Water Quality of Delavan Lake
 Memo to: Town of Delavan Lake Committee Date: February 2, 2013 From: Ryan Simons, Town of Delavan Lake Committee Chairman Subject: U.S. Geological Survey s Update on the Water Quality of Delavan Lake On
STATE OF THE LAKE Environment Report 2013 KASHWAKAMAK LAKE
 STATE OF THE LAKE Environment Report 2013 KASHWAKAMAK LAKE KASHWAKAMAK LAKE WHY WATERSHED WATCH? A lake monitoring program of the Mississippi Valley Conservation Authority Mississippi Valley Conservation
Evaluation of Water Quality in. Sylvia Heaton Water Bureau, MDNRE
 Evaluation of Water Quality in Ford and Belleville Lakes Sylvia Heaton Water Bureau, MDNRE Objectives of 2010 TMDL Reevaluation Evaluate nutrient (total phosphorus) levels in Ford and Belleville Lakes
2014 Data Report for Higgins Lake, Roscommon County North Basin
 214 Data Report for Higgins Lake, Roscommon County North Basin Michigan Lakes Ours to Protect The CLMP is brought to you by: About this report: This report is a summary of the data that have been collected
2014 Data Report for Freska Lake, Kent County
 214 Data Report for Freska Lake, Kent County Michigan Lakes Ours to Protect The CLMP is brought to you by: About this report: This report is a summary of the data that have been collected through the Cooperative
Little Bay Water Quality Report Card Spring 2014
 Little Bay Water Quality Report Card Spring 2014 Little Bay is a small, semi-enclosed estuary located in the heart of Rockport, Texas. Estuaries, where freshwater from rivers and streams mixes with salt
The Lake Partner Program
 The Lake Partner Program Anna DeSellas Scientist, Inland Lakes Monitoring & Lake Partner Program Coordinator Dorset Environmental Science Centre 1 Phosphorus and water quality Phosphorus: A nutrient that
Status and Trends of Water Quality in Wisconsin s Lakes, Streams, and Rivers
 Status and Trends of Water Quality in Wisconsin s Lakes, Streams, and Rivers Tim Asplund, Matt Diebel, Katie Hein, and Mike Shupryt Water Resources Program, WDNR AWRA Wisconsin Section Annual Meeting March
Phosphorus Goal Setting Process Questions and Answers 2010
 Lake Winnipesaukee Watershed Management Plan Phase I: Meredith, Paugus, Saunders Bays 1. What is phosphorus? Phosphorus (P) is a naturally occurring element and a major nutrient required for biological
2012 Range Ponds Water Quality Report
 2012 Range Ponds Water Quality Report Prepared by Scott Williams, Aquatic Biologist Lake & Watershed Resource Management Associates The Range Ponds Environmental Association continued to monitor the health
Welcome. Thank you for joining us! Lower Mississippi River Watershed Management Organization
 Welcome. Thank you for joining us! Lower Mississippi River Watershed Management Organization Lower Mississippi River Watershed Management Organization Watershed Restoration and Protection (WRAP) Study
State of the Lake Environment Report Black Lake
 State of the Lake Environment Report 2011 Black Lake Black Lake Why Watershed Watch? The Ribbon of Life is the shallow waters and first 10 metres of shore land around our lakes where the land meets the
Lake Types. Understanding Your Data. Seepage Lake
 Figures 2-5. Lake Types. Major water inputs and outflows of different lake types. Large arrows indicate heavy water flow. (Taken from Shaw et al 2000 Understanding Lake Data ) Seepage Lake Figure 2 Groundwater
Envirothon Aquatics. Mike Archer, NE Dept. of Environmental Quality. Katie Pekarek, Nebraska Extension Jeff Blaser, Nebraska Game and Parks
 Envirothon Aquatics Mike Archer, NE Dept. of Environmental Quality Katie Pekarek, Nebraska Extension Jeff Blaser, Nebraska Game and Parks Lake Watersheds Watershed = area contributing water to pond Surface
STATE OF THE LAKE Environment Report 2012 CLAYTON LAKE
 STATE OF THE LAKE Environment Report 2012 CLAYTON LAKE CLAYTON LAKE WHY WATERSHED WATCH? A lake monitoring program of the Mississippi Valley Conservation Authority Mississippi Valley Conservation Authority
Long-term Water Quality Trend Analysis on Black Lake Thanks to Volunteer Monitoring Efforts
 Long-term Water Quality Trend Analysis on Black Lake Thanks to Volunteer Monitoring Efforts The Tip of the Mitt Watershed Council has been involved with water quality monitoring since our inception in
STATE OF THE LAKE Environment Report 2012 JOES LAKE
 STATE OF THE LAKE Environment Report 2012 JOES LAKE JOES LAKE WHY WATERSHED WATCH? A lake monitoring program of the Mississippi Valley Conservation Authority Mississippi Valley Conservation Authority (MVCA)
STATE OF THE LAKE Environment Report 2012 MISSISSIPPI LAKE
 STATE OF THE LAKE Environment Report 2012 MISSISSIPPI LAKE MISSISSIPPI LAKE WHY WATERSHED WATCH? A lake monitoring program of the Mississippi Valley Conservation Authority Mississippi Valley Conservation
Lake Voorheis, Oakland County
 214 Data Report for Lake Voorheis, Oakland County Michigan Lakes Ours to Protect The CLMP is brought to you by: About this report: This report is a summary of the data that have been collected through
Reporting Period: 01/01/2010 to 12/31/2010. Understanding the Level 2 Stream Monitoring Data Report
 Squaw Creek, 10030147 Squaw Creek Latitude: 45.32639, Longitude: -88.945564 Jim Waters, Wolf River Trout Unlimited Andy Killoren, Wolf River Trout Unlimited Reporting Period: 01/01/2010 to 12/31/2010 Understanding
Lime Lake Lime Lake District Town of Cuba Cattaraugus County
 Lime Lake Lime Lake District Town of Cuba Cattaraugus County Lake Characteristics Watershed Characteristics Surface area (ac/ha) 14 / 2 Max depth (ft/m) 3 / 11 Mean depth (ft/m) 18 / Retention time (years)
BACKGROUND: The following is adapted from the Watershed Cruzin Guide:
 GOALS: To introduce students to the Watsonville Wetlands water system To help students identify sources of water pollution and learn how they can avoid polluting the environment To discuss the importance
Lake Mitchell. Citizen Volunteer Water Monitoring on. Lake Facts and Figures
 Citizen Volunteer Water Monitoring on Lake Mitchell Lake Facts and Figures Lake Mitchell is located in east-central Alabama between Coosa and Chilton counties, and is one of several reservoirs on the Coosa
2015 Range Ponds Water Quality Report
 2015 Range Ponds Water Quality Report Prepared by Scott Williams, Aquatic Biologist Lake & Watershed Resource Management Associates PO Box 65; Turner, ME 04282 207-576-7839 The Range Ponds Environmental
STATE OF THE LAKE Environment Report 2013 MACKAVOY LAKE
 STATE OF THE LAKE Environment Report 2013 MACKAVOY LAKE MACKAVOY LAKE WHY WATERSHED WATCH? A lake monitoring program of the Mississippi Valley Conservation Authority Mississippi Valley Conservation Authority
ONEIDA COUNTY LAND AND WATER CONSERVATION DEPARTMENT. Lake George. AIS Monitoring and Water Clarity Report of June 29, 2016
 ONEIDA COUNTY LAND AND WATER CONSERVATION DEPARTMENT Lake George Page 1: AIS Monitoring and Water Clarity Report of June 29, 2016 Michele Sadauskas, County Conservationist Stephanie Boismenue, AIS Coordinator
STATE OF THE LAKE Environment Report 2009 BUCKSHOT LAKE
 STATE OF THE LAKE Environment Report 2009 BUCKSHOT LAKE WHY WATERSHED WATCH? A lake monitoring program of the Mississippi Valley Conservation Authority Mississippi Valley Conservation Authority (MVCA)
Putnam Lake Putnam Lake Park District Town of Patterson Putnam County
 Putnam Lake Putnam Lake Park District Town of Patterson Putnam County Lake Characteristics Watershed Characteristics Surface area (ac/ha) 226 / 92 Max depth (ft/m) 18 / 5 Mean depth (ft/m) 11 / 3 Retention
Results from the 2017 Water Quality Monitoring Program
 Results from the 217 Water Quality Monitoring Program As part of a larger project, this summer the BWC conducted water sampling throughout the Belleisle Bay to get a baseline of data and determine the
Otter Lake Otter Lake Association Town of Forestport Oneida County
 Otter Lake Otter Lake Association Town of Forestport Oneida County Lake Characteristics Watershed Characteristics Surface area (ac/ha) 282 / 114 Max depth (ft/m) / 3 Mean depth (ft/m) 5 / 1 Retention time
B ig E ast R iver. Stewardship Works! S ubwatershed. Grades. Land Water Wetlands Biodiversity. Not Stressed Not Stressed Not Stressed Vulnerable
 s B ig E ast R iver Land Water Wetlands Biodiversity S ubwatershed T he Big East River Subwatershed is 64,699 hectares in area. Major lakes in the subwatershed include Bella Lake (3.45 km2) and Rebecca
LAKE PARTNER PROGRAM. Report Card 2015
 LAKE PARTNER PROGRAM Report Card 2015 Contents 1 What This Report Tells You 2 Ontario s Lakes 3 What is the Lake Partner Program? 5 Total Phosphorus 8 Calcium 10 Water Clarity 12 Moving Forward What You
NC Ambient Lake Assessment Program Overview including Coastal Lakes
 NC Ambient Lake Assessment Program Overview including Coastal Lakes Danielle Mir NC Division of Water Quality Environmental Sciences Section, Intensive Survey Unit Intensive Survey Unit Within the Environmental
Ponds: Careful of the Fish!
 Ponds: Careful of the Fish! Dr. Chuck Cichra Extension Fisheries Specialist University of Florida / IFAS SFRC - Program of Fisheries & Aquatic Sciences All Plants Need Water, Light, and Nutrients Aquatic
Reporting Period: 01/01/2008 to 12/31/2008. Understanding the Level 2 Stream Monitoring Data Report
 Panther Creek, 10010222 Panther Creek Latitude: 44.6216, Longitude: -90.568054 Carol Vedra, Beaver Creek Science Center Steven Hemersbach, Beaver Creek Citizen Science Center Reporting Period: 01/01/2008
H ollow R iver. Stewardship Works! S ubwatershed. Grades. Land Water Wetlands Biodiversity. Not Stressed Not Stressed Not Stressed Vulnerable
 s H ollow R iver Land Water Wetlands Biodiversity S ubwatershed T he Hollow River Subwatershed is 40,863 hectares in size and lies predominantly in the Township of Algonquin Highlands in Haliburton County.
Water Monitoring in Spa Creek: A Summary
 Water Monitoring in Spa Creek: A Summary Written by: Alexis Jones & Blake Harden Edited by: Hannah Krauss Water monitoring is very important in order to determine the health of the Chesapeake Bay and its
Water Quality: The Basics
 Water Quality: The Basics Environmental Science Why is Water Quality Important? Effects all humans Safe drinking water Allows for food productions and SAFE food products Effects Wildlife Health domestic
Water Quality Standards What s coming up for lakes? Kristi Minahan, WI DNR WI Lakes Convention April 7, 2017
 Water Quality Standards What s coming up for lakes? Kristi Minahan, WI DNR WI Lakes Convention April 7, 2017 Water Quality Standards Water Quality Standards 1. Designated Uses 2. Water Quality Criteria